Initial Impressions: Trademark Protection for Abbreviations of
Do first impressions last? The impact of initial assessments and subsequent performance on promotion decisions
Dirk Black Tuck School of Business
Dartmouth College [email protected]
Marshall Vance Leventhal School of Accounting
Marshall School of Business University of Southern California
March 2016
*We acknowledge helpful comments on an earlier version of this paper from Eric Allen, Shane Dikolli, Ken Merchant, Bill Tayler, and participants at the BYU Accounting Research Symposium. Dirk Black acknowledges the support of the Tuck School of Business at Dartmouth College. Marshall Vance acknowledges the support of the Leventhal School of Accounting at the Marshall School of Business at USC. All errors are our own.
Do first impressions last? The impact of initial assessments and subsequent performance on promotion decisions
ABSTRACT This paper examines supervisors’ use of performance measures to update initial beliefs about employee ability over time. Using archival performance and job assignment data, we examine the weighting for promotion decisions of assessments made before employees begin working, and objective performance data collected over time. We find strong evidence that employers’ initial assessments about employee ability predict workers’ future career attainment. While we find evidence consistent with employers using objective performance measures to update expectations about employee ability and sort employees into appropriate job roles, we also find that, controlling for current and prior objective performance measures, managers continue to rely on initial assessments for promotion decisions up to six years later. Managers’ weighting of objective performance measures in promotion decisions appears justified in our setting based on a strong association between current (and past) performance and future performance. However, after the first year, initial assessments of ability have no predictive value for future performance. Thus, it appears managers in our setting over rely on initial impressions, long after they are useful for sorting employees on ability. We also document that supervisors differentially weight objective performance measures based on whether realized performance is consistent with or contrary to initial assessments of ability. Prior research has documented career “fast tracks,” whereby firms identify high-quality employees early and promote these workers quickly. Our findings suggest that workers may be placed on fast tracks even before they start working and are promoted more quickly, at least in part, due to biased performance evaluations and not on merit alone. JEL Classifications: G30; M41; M51; M54 Keywords: Promotions; performance evaluation; employer learning; dynamic; ability
1
1. Introduction
Promotion and job assignment policies are fundamental control mechanisms to ensure
employees are able to perform the necessary functions to help organizations succeed (Merchant
and Van der Stede 2012). While promotion schemes can be used to provide effort incentives
(Prendergast 1999), recent literature suggests that the primary importance of promotions is to
sort employees to the job/level that will result in the highest return on an employee’s ability and
skills (Gibbons and Waldman 1999; Grabner and Moers 2013). The process of matching
employees through promotions to jobs for which they are best suited occurs over time as firms
learn about employees’ ability and human capital acquisition (Baker et al. 1988). Employers
form initial expectations about workers’ ability based on the limited information available when
workers enter the labor market. Initial expectations about ability may be formed based on
education, interviews, test scores, etc. Over time, employers update these expectations as
workers gain experience in the labor market through observing successive on-the-job
performance, and promote employees accordingly (e.g., Murphy 1986; Gibbons and Waldman
1999). In this paper we examine two primary questions: First, how do managers weight initial
assessments of employee ability versus subsequent objective performance when making
promotion decisions? Second, how do these relative weights change over time as firms
accumulate information about employee ability?
While the theoretical literature has long recognized that the performance evaluation
underpinning employer learning and employee promotion is fundamentally a dynamic process
(Holmstrom 1999), there is little empirical research to show how managers use performance
measures over time to update expectations about employee ability. Prior research on employer
learning generally assumes beliefs about worker ability are revised through a Bayesian updating
2
process, which implies that managers rationally incorporate new information and weight it
against prior signals based on the relative informativeness of each (Farber and Gibbons 1996;
Altonji and Pierret 2001; Lange 2007; Grabner and Moers 2013; Kahn and Lange 2014). In
contrast, research in judgement and decision making documents cognitive limitations and biases
that influence the way individuals update beliefs to reflect new information (Bonner 2008). To
our knowledge, prior research does not examine the impact of these behavioral factors on firms’
ability to learn about employee quality or their effect on promotion decisions.
Several prior studies examine supervisors’ use of discretion for rewarding employees,
and document evidence consistent with cognitive limitations or bias influencing subjective
evaluations (Bailey et al. 2011; Bol 2011; Bol and Smith 2011; Woods 2012; Anderson et al.
2014). Our study differs from prior research in this area in important ways. Prior research
examines discretionary performance evaluation in the context of bonuses, while we study
promotion decisions. For bonuses, the purpose of evaluation is to infer effort, whereas for
promotions the purpose is to infer ability (Moers 2005; Gibbs 2008). This suggests a short-term
focus for bonus decisions, but a long-term focus, and perhaps a dynamic element for promotion
decisions. Thus, whereas previous studies focus on the static effect of a performance measure on
subjective evaluation on an unrelated task, we investigate how objective performance measures
are used to update beliefs about worker ability as a whole, and how their use changes as firms
accumulate experience with workers.1
1Anderson et al. (2014) also examine how supervisors’ use of performance measures changes over time, but their focus is on supervisors’ experience with the rating task over a relatively short window (five quarters), while we focus on supervisors’ experience with the worker over a relatively long time period (up to six years). Anderson et al. (2014) explicitly assume limited if any changes in supervisors’ impressions of worker ability over their study period, whereas examining how firms update beliefs about worker ability is a primary focus of our paper.
3
We examine our research questions using extensive performance and promotion data
from Minor League Baseball (MiLB). In doing so, we follow recent research in business and
economics that makes use of sports settings to answer important economic questions (Chapman
and Southwick 1991; Spurr and Barber 1994; Edmans et al. 2007; Berger and Pope 2011; Pope
and Schweitzer 2011; Cadman and Cassar 2013; Allen et al. forthcoming). Our research setting
offers several unique advantages. First, promotions in our setting are relatively frequent, and
follow a well-defined hierarchical path, which increases the power of our tests due to reduced
measurement error in our dependent variable (promotion events). Second, we are able to observe
detailed objective measures of individual employee output over time. Third, for each employee
in our sample, we obtain assessments of worker ability prior to the employee’s entering the labor
market. This is possible because in our setting workers enter the labor market through a formal
draft; workers deemed to have greater ability are selected earlier, and we can observe each
worker’s draft position. This unique setting therefore allows us to map our empirical work
closely to established theoretical models in which employers form initial expectations of
employee ability and update their priors over time based on observed performance (e.g., Gibbons
and Waldman 1999). Fourth, we are able to hold constant the basic nature of the work task for all
employees across each hierarchical level.
We obtain promotion and performance data for over twelve thousand unique employees
(over forty thousand employee-year observations) in approximately thirty different organizations
over the period 1987-2014. We find strong evidence that employers’ initial assessments about
employee ability predict promotion decisions, even after several years on the job. Across every
hierarchical level, unconditional promotion rates for employees with initial assessed ability in the
top quartile are significantly higher than for employees in the bottom quartile, with differences
4
ranging from 25-67%. These differences in promotion rates lead to dramatic differences in career
attainment: Employees initially assessed to be in the top quartile of their cohort are nearly 8.5
times more likely to reach the highest job assignment level within five years following entering
the labor market.
We find that both initial subjective assessments and subsequent objective performance
measures are associated with promotion decisions, but the relative weight on each changes over
time as employers have successive opportunities to observe on-the-job performance. We find
that the weight placed on initial ability assessments is larger than for on-the-job performance
following a worker’s first year on the job by about 12%. In subsequent years, the weight on
objective performance increases, while the weight on the initial assessment decreases, so that
objective performance receives almost twice as much weight in promotion decisions as initial
assessments following a second year of employment, and over 3.7 times as much weight after
five years of performance data have been observed. While the relative weight placed on
objective performance increases over time, initial assessments of ability remain significant
predictors of promotion decisions up to six years later, and persist even after controlling for
current as well as past objective performance. We also find that initial assessments influence
promotion decisions by affecting the sensitivity of promotions to current objective performance
measures. We observe greater weight on performance when it is consistent with expectations
implied by initial assessments; for workers who were initially assessed in the top quartile of their
cohort, above-average performance receives relatively greater weight, and below-average
performance receives relatively lesser weight. For workers initially assessed in the bottom
quartile, this pattern is flipped.
5
That employers still rely on their initial assessments for promotion decisions after several
years is perhaps surprising given that in our setting performance is readily observable by
managers, and worker production is easily captured by the performance measurement system.
We therefore examine whether the relative weights placed on initial assessments and objective
performance are justified by their respective ability to predict future performance. We find that
current performance is significantly associated with future performance in each of a worker’s
first six years on the job. Moreover, controlling for current performance, prior performance (up
to two years prior) is also associated with future performance. Thus, objective performance
measures appear to be useful inputs for promotion decisions in our setting. We also find that
initially assessed ability predicts future performance prior to the first year on the job. However,
once a worker has at least a year of on-the-job experience, we find no association between initial
assessments and future performance, even though initial assessments are related to promotion
decisions in each year.
This paper makes several contributions to the literature. We contribute to the literature on
the use of performance measures for promotion decisions (e.g., Gibbs 1995; Campbell 2008;
Cichello et al. 2009; Grabner and Moers 2013; Chan 2015). We extend these prior studies by
examining the use of performance measures over time, recognizing that employer learning is a
dynamic process. We find that the effect of objective performance on promotions follows an
inverted U-shaped pattern; the weight on objective performance increases over the first few years
on the job and then declines thereafter. This pattern is consistent with employers using observed
performance to learn about worker ability; but after a point, employers’ “make up their minds”
about worker ability, and beliefs are less susceptible to revision. How readily employers revise
their initial beliefs about worker ability after observing performance is critical for the provision
6
of incentives within firms; if employers quickly incorporate performance measures into
expectations about worker ability, which in turn impact job assignment and salary decisions, the
payoffs for effort are relatively high. Conversely, if employers are slow to update their beliefs
and continue to hold onto initial impressions about workers, incentives to work hard are muted.2
We also add to the literature on supervisors’ discretionary use of performance measures
for rewarding employees (Ittner et al. 2003; Gibbs et al. 2004), and particularly the growing
number of studies documenting the impact of managers’ cognitive biases on the performance
evaluation process. All but a few studies in this area examine discretion in determining bonus
payments as opposed to making promotion decisions. However, promotion decisions are a
particularly interesting outcome for studying the weighting of performance measures because
promotion decisions are especially likely to involve discretion (Bol 2008; Campbell 2008), and
the long-term compensation (and therefore, incentive) implications of promotions are large
relative to bonuses (e.g., Baker et al. 1994).3 Thus, empirical examination of how managers
translate performance measures and other information into promotion decisions is particularly
important for understanding explicit and implicit contracting arrangements within firms
(Pendergrast 1999).
Moreover, prior studies on cognitive biases in performance evaluation (and the large
literature on confirmation bias more generally) generally use lab experiments (Bonner 2008). In
contrast, we document evidence consistent with confirmation bias using archival data on
performance and job assignments. Prior research investigates the moderating effect of incentives
2 The speed of employer learning also has important implications for a number of other issues in labor economics, such as the signaling role of education (e.g., Spence 1973) and the returns to investing in human capital (Lange 2007; Kahn and Lange 2014). 3 Bonus calculations commonly rely at least in part on explicit formulas to determine the relation between performance measures and bonuses. To our knowledge, explicit formulas are rarely used for promotion decisions.
7
for rating accuracy as well as the persistence of biases over time. In lab settings, it is difficult to
manipulate these dimensions sufficiently to approximate conditions found in the field.4 In our
setting, promoting the best players through the minor league system and up to the major leagues
is critical to the success of the organizations we study, and extensive attention and resources are
devoted to performance evaluation and job assignment decisions. Moreover, we observe workers
and promotion decisions over multi-year periods. Our use of archival data from a setting
characterized by strong incentives to accurately assess worker ability and multiple years
observing employees makes our findings especially notable relative to the prior literature.
We extend the literature in labor economics on employer learning and careers within
organizations by providing evidence on how readily supervisors “change their minds” about
worker ability after forming an initial opinion. Our findings have implications for the
interpretation of serial correlation in promotion rates (i.e., “fast tracks”) documented in prior
research (Baker et al. 1994). In our setting, fast tracks appear to be established before employees
start working, and some employees may stay on the fast track despite, not because of, their
performance.
2. Background and Hypothesis Development
2.1 Employer learning about worker ability
A fundamental role of job assignments within organizations is to sort employees into
positions for which they are best suited to achieve organizational objectives. That is, skill levels
vary across employees, and jobs vary in the skills required for success. A common perspective
with which to view hierarchies within firms is that jobs at higher levels place greater demands on
4 More generally, there are important tradeoffs and relative advantages and disadvantages for both lab experiments and field studies (Falk and Fehr 2003; Bonner 2008; Charness and Kuhn 2011). We view these alternative research methods as complimentary.
8
employees’ skills, and thus promotions are a means of matching higher-skilled employees to jobs
where their skills yield a greater return to the firm (e.g., Gibbons and Waldman 1999). While
early theoretical work on job assignments focuses on static models (e.g., Rosen 1982; Waldman
1984), more recent literature in labor economics examines firms’ learning about employee ability
as a dynamic process. When an employee first enters the labor market, firms are uncertain about
the worker’s ability, but form initial expectations about ability based on observed signals such as
education, test scores, or interviews. Over time, firms update expectations about worker ability
through observing measures of employee output. In a seminal empirical study, Baker et al.
(1994, p. 903) examine the internal labor market within a large firm, and conclude that “career
dynamics are driven by the firm’s learning about and selecting on ability.”
Several studies provide evidence of employers learning about workers’ ability over time,
although typically in the context of wage distribution. Farber and Gibbons (1996) and Altonji
and Pierret (2001) use responses from the National Longitudinal Survey of Youth to examine the
determinants of wages. They find evidence consistent with hypotheses that firms have limited
information about employee quality at initial stages of careers, and therefore distinguish among
workers on the basis of observable variables that are correlated with productivity (such as
education). Over time, however, wages become increasingly correlated with scores for cognitive
aptitude (which employers are assumed not to observe), suggesting that firms learn about
employee quality as workers gain experience in the labor market. Performance measurement
systems can facilitate the process of employer learning. For example, prior research in
accounting finds that promotion likelihood is positively associated with observable measures of
performance (Campbell 2008; Cichello et al. 2009; Grabner and Moers 2013). In general,
however, observed performance measures reflect both worker ability and noise, so firms are
9
expected to update beliefs about employee ability imperfectly. Moreover, worker ability is
expected to change over time, due for example to human capital acquisition (Becker 1965). In a
recent study on employer learning and its implications for wage dynamics, Kahn and Lange
(2014, p. 1577) conclude that employers learn about worker ability over time, but they “make
substantial errors in wage setting” as they try to hit a moving target of worker ability.
The prevailing assumption in much of the prior literature is that managers incorporate
available information in a manner consistent with Bayes Rule. Under a Bayesian updating
framework, employers form a prior distribution (or, informally, a “prior”) for worker ability
based on whatever signals are initially available when the worker enters the labor market. Each
subsequently observed performance measure provides a basis for employers to update beliefs
about the distribution of worker quality. Both the initial information and subsequent performance
measures are noisy signals for worker ability; how quickly employers update their beliefs
depends on the relative informativeness of each.That is, after n performance periods, a firm’s revised
beliefs about worker ability are formed based on a weighted average of the prior distribution and n
performance assessments, with weights determined based on informativeness.
Consistent with Bayesian updating, we expect promotion likelihood to be positively
associated with current objective performance measures to the extent these measures are
informative about future ability. Similarly, we also expect managers to weight past objective
measures in promotion decisions. When the primary purpose of promotions is to sort employees
by their level of ability, previous performance may be useful because expanding the performance
window is likely to better reflect employee ability than using only a single year (Gibbs 2008).
However, to the extent workers’ effective ability evolves over time, prior measures become
outdated. We therefore expect current performance to be more informative about effective
ability, and thus more heavily weighted, compared to each prior measure individually. However,
10
the collective information contained in prior measures may outweigh current performance and
receive weight in promotion decisions accordingly.
We also expect firms’ initial assessments about employees’ ability to be positively associated
with promotion decisions, at least in the early years of workers’ careers. However, on-the-job
performance is likely to be more informative about worker ability than initial assessments for at
least two reasons. First, as workers’ effective ability develops (or in some cases, declines) over
time, initial assessments become outdated and therefore less informative about future ability.
Second, initial assessments are based on performance environments further removed from the
job assignment for which the worker is being considered.5 Under a Bayesian framework, in
settings where performance measures are informative about worker ability, employers can be
expected to quickly revise noisy and outdated first impressions, so that after relatively few
periods, promotion decisions are based on realized on-the-job performance and not initial
assessments. While it is not clear ex ante how long initial assessments will remain informative
about worker ability, we expect each successive measure of on-the-job performance will be
strictly more informative than an initial assessment, and therefore will receive greater weight in
promotion decisions.
The strength of the signals upon which initial assessments are made is likely to differ
depending on the channel through which workers enter the labor market. Assessments for
workers who attended college are likely to be more informative because less projection is
required for older players, and the performance environment and skill required for college play is
more similar to the professional level than is high school. As well, having already attended high
5 In our setting, initial assessments are primarily based on observing performance on a similar task but against much weaker competition and less frequently. It is difficult to assess a player’s ability when they are playing against competition that does not have professional-level potential. Also, amateur playing seasons are much shorter (fewer games), and it is difficult to project how a given player will respond to the physical demands of a longer season.
11
school, college players are likely to have been observed by potential employers for longer.
Therefore, we expect initial assessments for former college players to receive greater weight in
promotion decisions than for their high-school counterparts.
In contrast to the Bayesian updating perspective, psychological research suggests people
may weight signals based on the order in which they are received, and not just on the properties
of the signals per se. A number of studies provide evidence for “confirmation bias,” a cognitive
bias which occurs when individuals anchor on the information they receive first, so that
subsequent information gathering and processing are biased to support initially formed beliefs.6
In the context of Bayesian updating, such anchoring suggests that initial signals may lead to
irrationally strong prior beliefs (i.e., overestimating the informativeness of initial signals),
causing managers to revise expectations of employee ability too slowly after observing on-the-
job performance. In contrast to rational Bayesian updating, if managers are susceptible to a
“primacy effect”, the importance of initial assessments for promotion decisions will decline
slowly if at all. Moreover, managers may place increased weight on past measures of
performance relative to current measures.
Confirmation bias also manifests when individuals differentially weight signals that are
supportive of a previously held belief compared to signals that go against those beliefs (e.g.,
Bamber et al. 1997). This suggests that managers may place different weight on observed
performance measures depending on how these measures compare to managers’ initial
assessments about players’ ability.
In summary, economic theory predicts that if the purpose of promotions is to sort
employees by expected ability, the importance (or weighting) of different signals for promotion
6 See Nickerson (1998) and Rabin and Schrag (1999) for reviews of laboratory evidence of confirmation bias.

12
decisions should reflect the relative informativeness of the signals about worker ability. While
the relative informativeness of initial assessments versus on-the-job performance measures may
change over time as employee ability develops, after controlling for informativeness, the relative
order in which the signals are received should not influence their use in promotion decisions (or
their use in updating beliefs about worker ability more generally).
In contrast, psychology theory predicts that temporal order may matter for how signals
are used for belief updating. If supervisors anchor on initial assessments of worker quality, over
time promotion decisions may continue to reflect greater weight on initial assessments than is
warranted based on informativeness, and the weighting of on-the-job performance measures may
depend on their perceived consistency with the initial assessment. In our empirical tests
described below, we examine the extent to which the implied weighting for promotion decisions
of initial assessments and on-the-job performance reflect their respective informativeness as
predicted by economic theory, or is consistent with order effects as suggested by the psychology
literature.
3. Research setting
To examine our research questions, we obtain performance and job assignment data for
professional baseball players employed in Minor League Baseball (MiLB), which is a
hierarchical system of developmental leagues below Major League Baseball (MLB). We
acknowledge that professional baseball is a departure from “typical” business environments of
more general interest to researchers. We also recognize that professional athletes may exhibit
personality and behavioral tendencies that differ from a more general population of workers.
However, we emphasize that we examine promotion decisions concerning professional athletes,
13
not the athletes’ performance or behavior per se. Thus, while the specific job task, and the
workers who perform it, may be unique to our setting, we expect the task of evaluating
performance and making job assignments accordingly to be much more general.
MiLB teams are typically independently owned, but each is affiliated with an MLB
franchise through a formal agreement called a Player Development Contract. This agreement
specifies that personnel decisions are made by the MLB franchise (i.e., “parent”). Thus, while
MiLB teams operate as businesses in their own right, from a personnel perspective the primary
purpose of these teams and leagues is to develop players and prepare them to play at the Major
League level.
Within MiLB there are seven levels, ranging from “Rookie” to “Triple-A,” with the
primary distinction across levels being the ability of the players assigned to teams in each level.
When players enter professional baseball, they are generally assigned to a team at the lower
levels of MiLB, but can work towards the major league level through a succession of
promotions. While the possibility of promotion provides very strong effort incentives for MiLB
players, the primary purpose of promotions from the parent organization’s perspective is a means
of developing players’ ability by matching them to job assignments for which they are best
suited.
Workers enter the labor market through a formal draft process, which occurs in June of
each year.7 The draft is organized into rounds, and within each round each team may select one
player. The draft continues for 40 rounds. Each MLB organization employs a scouting
department to evaluate potential draftees for ability and potential to succeed in professional
baseball. Thus, the draft order provides a ranking of expected ability (or potential future ability) 7 The draft process applies only to U.S. residents. International players may negotiate and sign a contract with any MLB organization.
14
based on assessments made prior to a player’s entering the labor market. Once a team selects a
player in the draft, the team obtains exclusive rights to sign the player. Before a contract is
signed, the player and team may negotiate a signing bonus.8 The employment contract itself is
collectively bargained, and stipulates that the parent organization retains exclusive rights to the
player for seven years (i.e., workers are not free to move from one organization to another) at
salaries determined by the level of job assignment. 9
We focus our analysis on MiLB pitchers, whose job entails preventing the opposing
hitters from scoring points, or “runs.” Performance evaluation in MiLB is ubiquitous. In addition
to direct observation by coaches and supervisors, nearly every conceivable outcome is recorded
(e.g., runs, hits, walks, strikeouts, etc.). While objective performance measures are readily
available, these measures capture effective ability with noise in that recorded outcomes do not
perfectly reflect ability. For example, a well-pitched ball may still be struck hard or away from a
fielder resulting in scoring, or a poorly pitched ball may be swung at and missed.
4. Sample Selection and Variable Measurement
We obtain draft position, performance, and job assignment data for all affiliated minor
league pitchers who began their careers between 1987 and 2013.10,11 A primary purpose of our
study is to investigate the role of initial assessments and on-the-job performance, and therefore
we focus our analyses on players in their early careers; we limit our sample to players who have
8 If the player chooses not to sign a contract with the team that selected him, he must wait until the following year’s draft to be selected by a different team before entering professional baseball. 9 At the lowest MiLB level, players are paid $1,100/month (for 5 months of the year); at the highest level, the salary is $2150/month. By comparison, the minimum annual salary for MLB players is approximately $500,000/year (source: http://www.providencejournal.com/article/20150221/Sports/150229787 accessed 3/15/2016). 10 We obtained our data through a licensing agreement with the Society for American Baseball Research (SABR). 11 We begin our sample in 1987 because this is the first year of the draft in its current basic format. Previously drafts were held twice each year, and each draft consisted of multiple phases, making it more difficult to compare draft position, or proxy for initial assessments of ability, across years. The last sample year is 2013 because we require future promotion and performance data from 2014, the last year of available data from SABR.
15
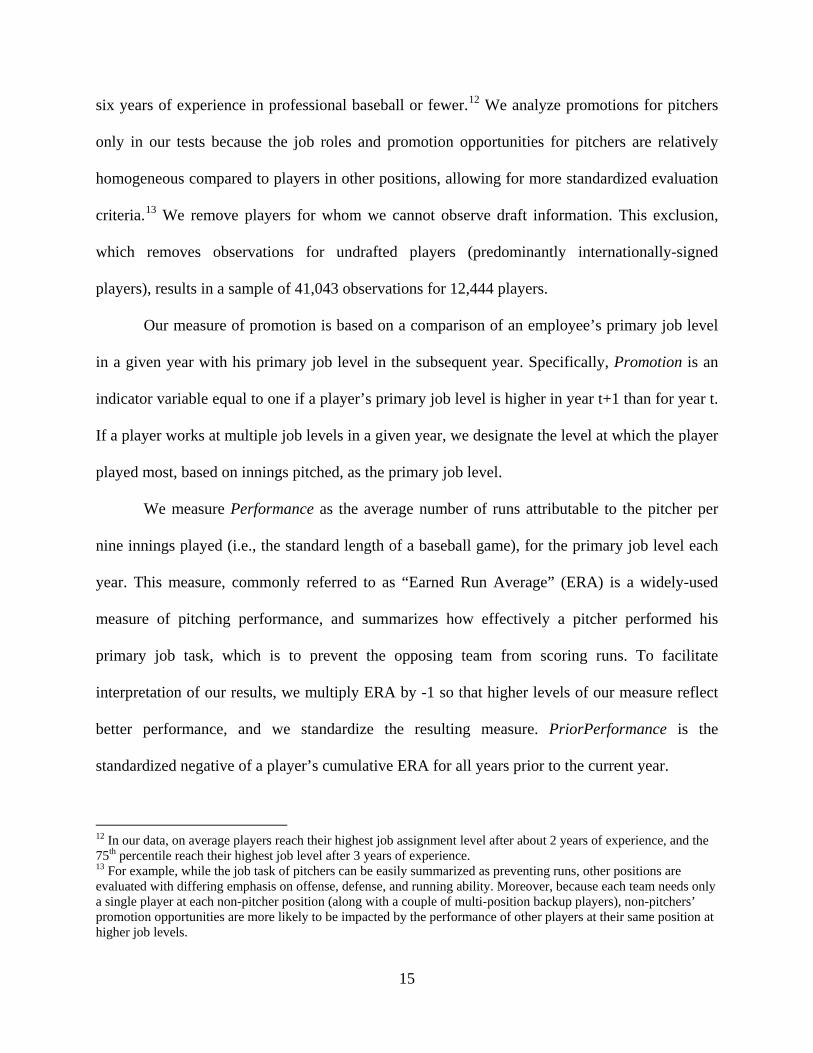
six years of experience in professional baseball or fewer.12 We analyze promotions for pitchers
only in our tests because the job roles and promotion opportunities for pitchers are relatively
homogeneous compared to players in other positions, allowing for more standardized evaluation
criteria.13 We remove players for whom we cannot observe draft information. This exclusion,
which removes observations for undrafted players (predominantly internationally-signed
players), results in a sample of 41,043 observations for 12,444 players.
Our measure of promotion is based on a comparison of an employee’s primary job level
in a given year with his primary job level in the subsequent year. Specifically, Promotion is an
indicator variable equal to one if a player’s primary job level is higher in year t+1 than for year t.
If a player works at multiple job levels in a given year, we designate the level at which the player
played most, based on innings pitched, as the primary job level.
We measure Performance as the average number of runs attributable to the pitcher per
nine innings played (i.e., the standard length of a baseball game), for the primary job level each
year. This measure, commonly referred to as “Earned Run Average” (ERA) is a widely-used
measure of pitching performance, and summarizes how effectively a pitcher performed his
primary job task, which is to prevent the opposing team from scoring runs. To facilitate
interpretation of our results, we multiply ERA by -1 so that higher levels of our measure reflect
better performance, and we standardize the resulting measure. PriorPerformance is the
standardized negative of a player’s cumulative ERA for all years prior to the current year.
12 In our data, on average players reach their highest job assignment level after about 2 years of experience, and the 75th percentile reach their highest job level after 3 years of experience. 13 For example, while the job task of pitchers can be easily summarized as preventing runs, other positions are evaluated with differing emphasis on offense, defense, and running ability. Moreover, because each team needs only a single player at each non-pitcher position (along with a couple of multi-position backup players), non-pitchers’ promotion opportunities are more likely to be impacted by the performance of other players at their same position at higher job levels.
16
While we base our measure of performance on ERA because of its wide usage and
straightforward interpretation relative to a team’s objective for winning games, in general pitcher
performance can be measured in a variety of ways, and it is likely teams consider many different
performance measures in making promotion decisions. Our dataset enables us to capture many of
these common measures (e.g., wins, strikeouts, walks, etc.). We focus on a single performance
measure because our objective is to study the relative use of initial assessments and objective
performance compared to a benchmark of their relative informativeness; we also study how the
use of these inputs changes over time. Thus, a single measure of performance is sufficient for our
purpose.14
Our proxy for teams’ InitialAssessment of player ability is the log of draft position. As
discussed above, draft position reflects the order in which players are selected by teams, and thus
lower numbers reflect players taken earlier, and having higher assessed ability. To aid
interpretation and comparability with Performance, we multiply by -1 and standardize this
measure.
We use several control variables we expect are related to job assignment decisions. We
control for Age (measured as the standardized log of a player’s age in years as of the midpoint in
the season) because younger players may be less developed and thus less likely to be prepared
for higher-level job assignments. Similarly, we use an indicator for whether a player was drafted
following playing baseball in college (College), as former college players are expected to be
more developed players, all else equal. We include LeaguePerformance, which is the
standardized negative of the overall ERA for the league in which a player competes. To the
extent teams use relative performance information when making promotion decisions (Chan 14 Because we do not observe all possible performance measures available to teams, we do not attempt to address how the weight on initial assessments compares to the combined weight on all objective performance measures.
17
2015), we expect LeaguePerformance to be negatively associated with promotion likelihood. We
measure Experience as the number of prior years of professional experience (i.e., Experience is
equal to 0 in a player’s first year). While players with low experience are likely to be less
developed, holding job level constant, players with more experience are more likely to have been
passed over previously, and thus have a lower likelihood of being promoted in the future. In tests
for which we partition our sample by years of Experience, we alternatively control for Repeat,
which is an indicator for whether a player’s primary job level in the current year is the same as
for the previous year.
5. Research Design and Results 5.1 Descriptive analysis
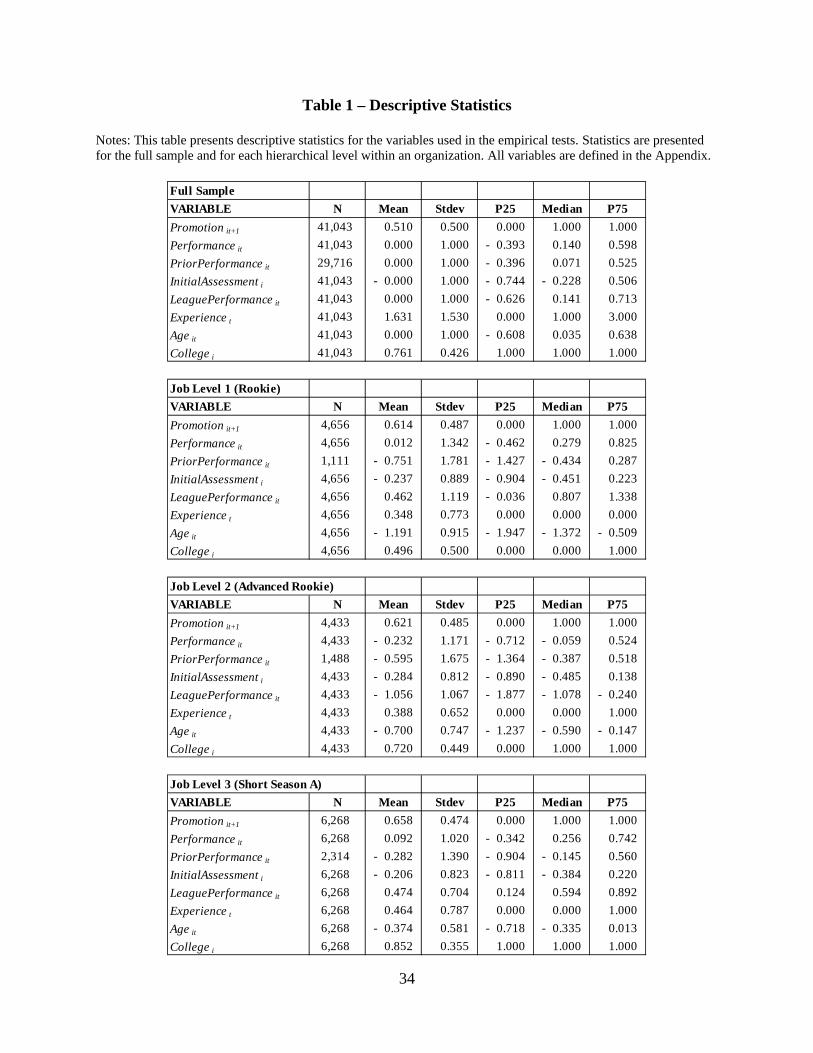
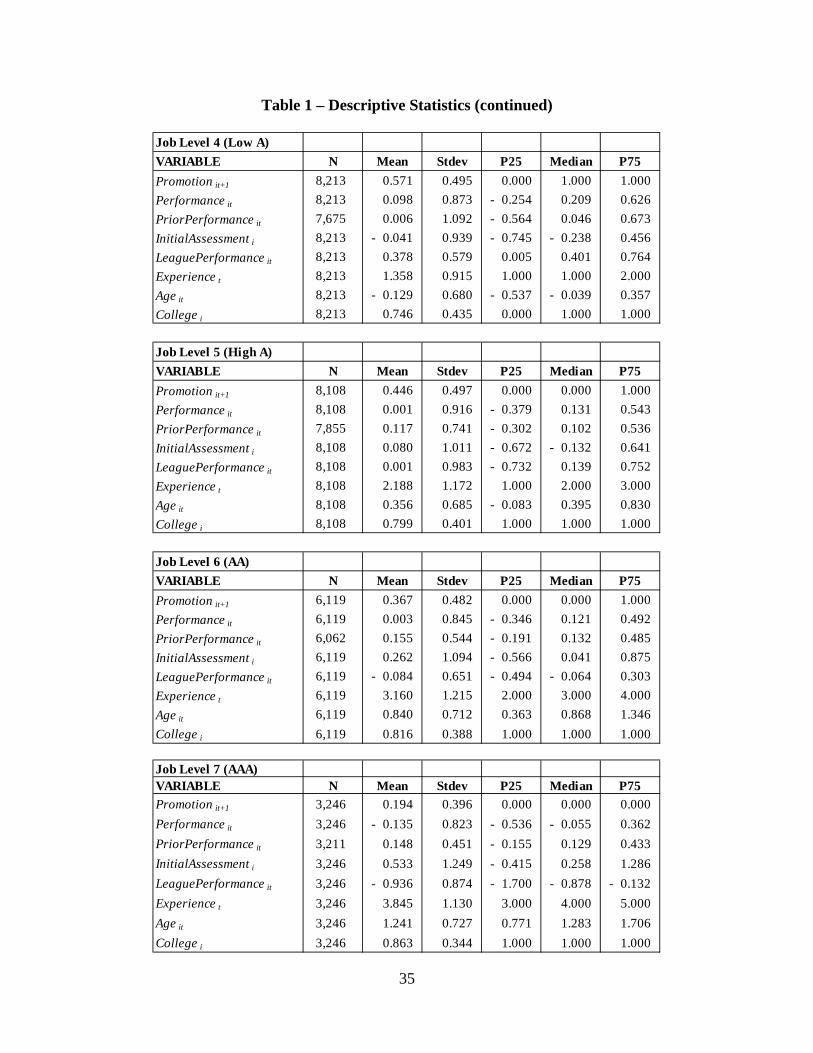
Table 1 presents descriptive statistics for the full sample and for each level within the
MiLB hierarchy for the regression variables used in the study.15 Level 7 (AAA) has the fewest
observations, while Level 4 (Low A) has the most. From the descriptive statistics we learn that
promotions are a regular occurrence: the overall probability of promotion across all levels is
51%. The highest probability of promotion exists in Level 3 (Short-season A) at 66%, while the
lowest probability of promotion exists in Level 7 (AAA) at 19%. These findings are roughly
consistent with achieving promotions becoming relatively more difficult as employees advance
within the organization. The average player in our sample is approximately 23 years old
(untabulated), and 76% of the players were drafted out of college.
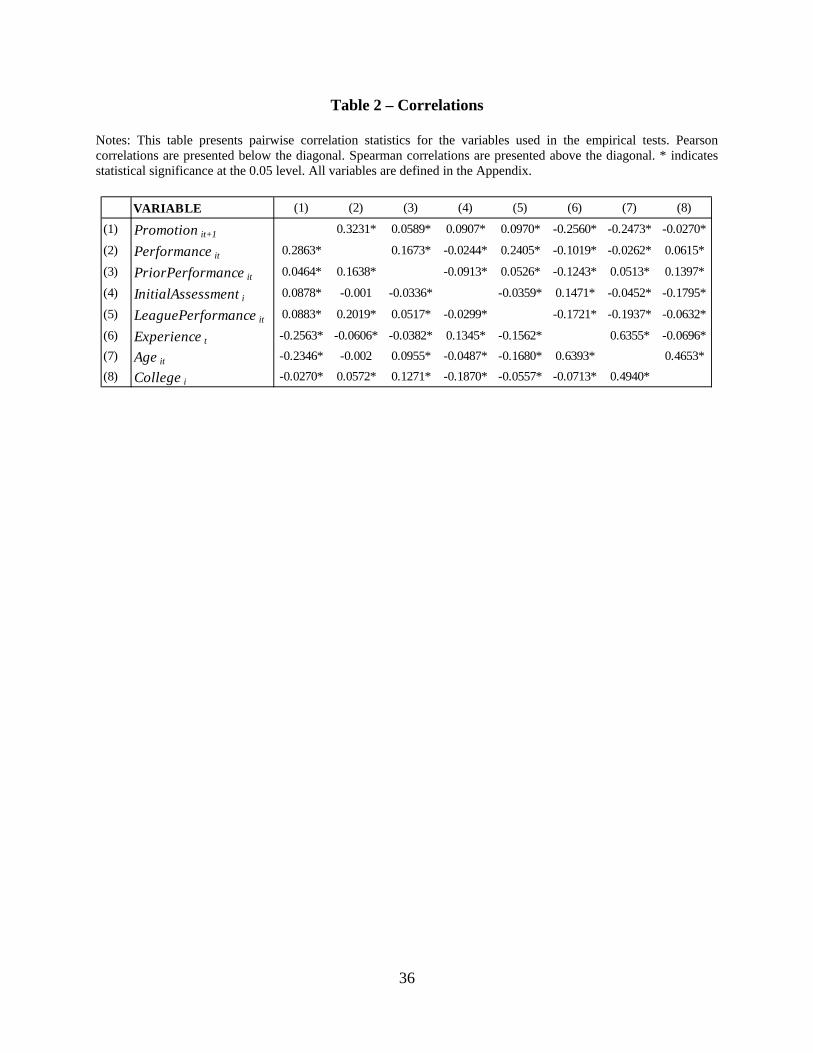
Table 2 presents correlation statistics (Pearson below, Spearman above) for the regression
variables used in the study. We find a positive pairwise relation between 𝑃𝑃𝑃𝑃𝑃𝑃𝑃𝑃𝑃𝑃𝑃𝑖𝑖 and
𝑃𝑃𝑃𝑃𝑃𝑃𝑃𝑃𝑃𝑖𝑖+1. In addition, we find that earlier drafted players (𝐼𝑃𝑃𝑃𝑃𝑃𝐼𝐼𝐼𝐼𝑃𝐼𝐼𝑃𝑃𝑃𝑃𝑖) are more 15 There are seven levels within MiLB’s hierarchy: Rookie, Advanced Rookie, Short-season A, Low A, High A, AA, and AAA.
18
likely to be promoted, but older (𝐼𝐴𝑃𝑖𝑖) and more experienced (𝐸𝐸𝐸𝑃𝑃𝑃𝑃𝑃𝑃𝑃𝑖𝑖) players are less
likely to be promoted. Players drafted out of college are less likely to be promoted (𝐶𝑃𝐼𝐼𝑃𝐴𝑃𝑖).
We examine relations between performance, initially-assessed worker quality, promotion
likelihood, and future performance in greater depth using multivariate regression techniques in
Tables 4-7.
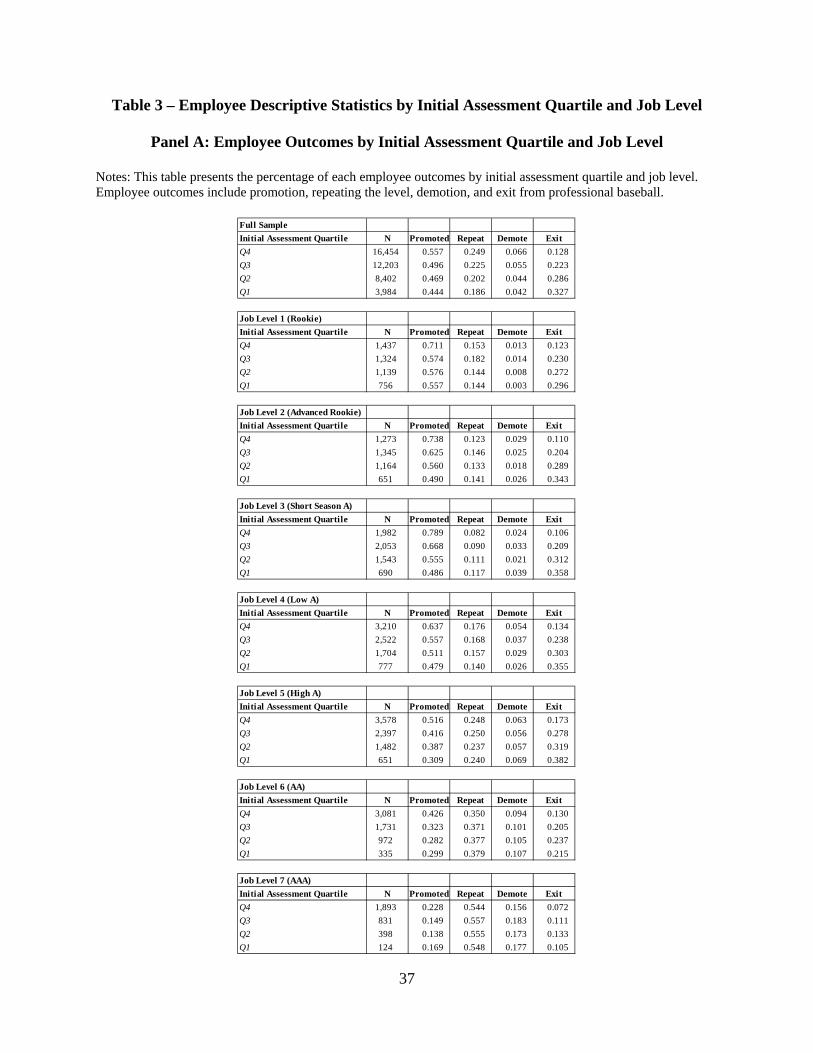
Table 3, Panel A presents employee outcomes by initial assessment quartile. We examine
four potential outcomes following each worker-year observation: workers may be promoted, stay
in their current job level, be demoted, or exit the labor market. We note that our sample is
predominantly composed of relatively highly assessed workers, due to the fact that lower
assessed workers are less likely to sign a contract and enter professional baseball and also have a
higher exit probability. Workers with the highest initial assessments relative to their cohort (i.e.,
players in the highest (earliest) initial assessment quartile—Q4), have the highest promotion
likelihood in the full sample, and in each level within the organizational hierarchy. For the full
sample, the promotion likelihood for workers assessed in Q4 compared to workers assessed in
Q1 is greater by approximately 25% ((.557/.444)-1). This pattern exists for each hierarchical
level. For the full sample, the likelihood of either repeating a level or being demoted is
increasing in initial assessment, while the likelihood of exiting the labor market is decreasing in
initial assessment, perhaps due to lower-assessed players, viewing their potential for future
promotion to be lower, opting to exit the labor market rather than to repeat a level or to be
demoted.
Table 3, Panel B presents the average percentage of workers eventually reaching each
organizational level. For workers who skip a level, we consider them to have reached the level
they passed over. Within each column, the percentage of workers to eventually reach a given
19
level is strictly increasing by quartile of initially assessed ability. Moreover, the gap in career
attainment from Q1 to Q4 is monotonically increasing at higher levels in the hierarchy. While all
workers who enter the labor market reach at least level 1, the gap from Q1 to Q4 in reaching at
least level 2 is nearly 11% ((97.08/87.47)-1). That gap increases monotonically with each level;
top-quartile-assessed players are 5.6 times (37.20/6.64) more likely to reach level 7, the highest
level of MiLB, and 8.43 times (15.59/1.85) more likely to reach MLB. Together, Panels A and B
of Table 3 provide striking descriptive evidence for initial assessments, made prior to workers
entering the labor market, having a dramatic impact on career attainment.
5.2 Promotion weight on initial assessments vs. on-the-job performance
The preceding analyses provide strong descriptive evidence for the importance of initial
assessments in determining worker career attainment in our setting. This association may result
because initial assessments are informative about ability throughout players’ MiLB careers.
However, even in this scenario supervisors need not directly rely on initial assessments for
promotion decisions; if initial assessments predict performance, and supervisors base promotions
on performance, we will similarly observe a relation between initial assessments and promotions.
Alternatively, supervisors may anchor on initial assessments, such that these prior beliefs about
ability influence promotion decisions even after initial assessments are no longer informative
about ability. To examine these alternatives, we estimate linear probability models (LPM) of
promotion with panel ordinary least squares regressions. Using an LPM allows us to include year
and organizational hierarchy level (Level) fixed effects and avoid the proliferation of parameters
problem for probit and logistic models with fixed effects identified in prior work (Greene 2004),
20
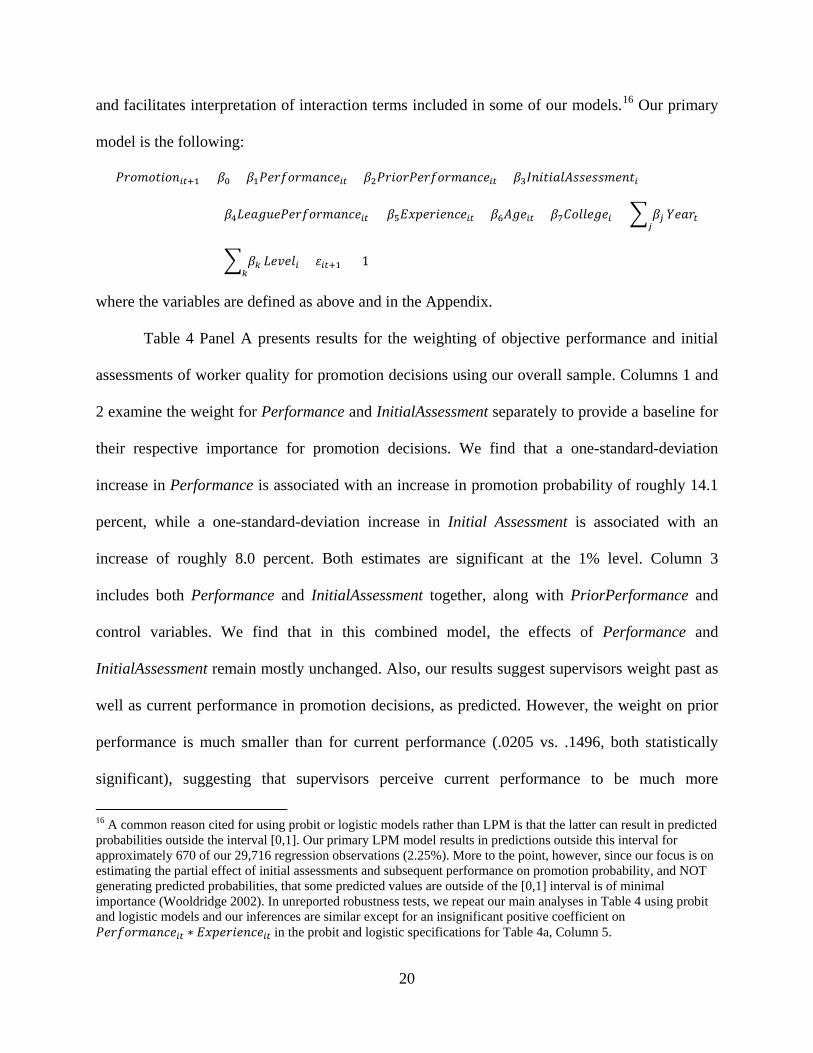
and facilitates interpretation of interaction terms included in some of our models.16 Our primary
model is the following:
𝑃𝑃𝑃𝑃𝑃𝑃𝑃𝑃𝑃𝑖𝑖+1 = 𝛽0 + 𝛽1𝑃𝑃𝑃𝑃𝑃𝑃𝑃𝑃𝑃𝑃𝑃𝑖𝑖 + 𝛽2𝑃𝑃𝑃𝑃𝑃𝑃𝑃𝑃𝑃𝑃𝑃𝑃𝑃𝑃𝑃𝑃𝑖𝑖 + 𝛽3𝐼𝑃𝑃𝑃𝑃𝑃𝐼𝐼𝐼𝐼𝑃𝐼𝐼𝑃𝑃𝑃𝑃𝑖
+ 𝛽4𝐿𝑃𝑃𝐴𝐿𝑃𝑃𝑃𝑃𝑃𝑃𝑃𝑃𝑃𝑃𝑃𝑃𝑖𝑖 + 𝛽5𝐸𝐸𝐸𝑃𝑃𝑃𝑃𝑃𝑃𝑃𝑖𝑖 + 𝛽6𝐼𝐴𝑃𝑖𝑖 + 𝛽7𝐶𝑃𝐼𝐼𝑃𝐴𝑃𝑖 + � 𝛽𝑗𝑗
𝑌𝑃𝑃𝑃𝑖
+ � 𝛽𝑘𝑘
𝐿𝑃𝐿𝑃𝐼𝑖 + 𝜀𝑖𝑖+1 (1)
where the variables are defined as above and in the Appendix.
Table 4 Panel A presents results for the weighting of objective performance and initial
assessments of worker quality for promotion decisions using our overall sample. Columns 1 and
2 examine the weight for Performance and InitialAssessment separately to provide a baseline for
their respective importance for promotion decisions. We find that a one-standard-deviation
increase in Performance is associated with an increase in promotion probability of roughly 14.1
percent, while a one-standard-deviation increase in Initial Assessment is associated with an
increase of roughly 8.0 percent. Both estimates are significant at the 1% level. Column 3
includes both Performance and InitialAssessment together, along with PriorPerformance and
control variables. We find that in this combined model, the effects of Performance and
InitialAssessment remain mostly unchanged. Also, our results suggest supervisors weight past as
well as current performance in promotion decisions, as predicted. However, the weight on prior
performance is much smaller than for current performance (.0205 vs. .1496, both statistically
significant), suggesting that supervisors perceive current performance to be much more
16 A common reason cited for using probit or logistic models rather than LPM is that the latter can result in predicted probabilities outside the interval [0,1]. Our primary LPM model results in predictions outside this interval for approximately 670 of our 29,716 regression observations (2.25%). More to the point, however, since our focus is on estimating the partial effect of initial assessments and subsequent performance on promotion probability, and NOT generating predicted probabilities, that some predicted values are outside of the [0,1] interval is of minimal importance (Wooldridge 2002). In unreported robustness tests, we repeat our main analyses in Table 4 using probit and logistic models and our inferences are similar except for an insignificant positive coefficient on 𝑃𝑃𝑃𝑃𝑃𝑃𝑃𝑃𝑃𝑃𝑃𝑖𝑖 ∗ 𝐸𝐸𝐸𝑃𝑃𝑃𝑃𝑃𝑃𝑃𝑖𝑖 in the probit and logistic specifications for Table 4a, Column 5.
21
informative than prior performance. For control variables, our results provide evidence that
managers use relative performance evaluation, as holding Performance constant, higher
LeaguePerformance is associated with a lower promotion probability. Experience is negatively
associated with promotion likelihood, though not significantly so, indicating that holding Level
fixed, promotion probability declines over time. We find that older players are less likely to be
promoted, all else equal, while College is associated with increased promotion likelihood.
In Column 4 of Panel A, we examine whether the importance of initial assessments is
greater for workers with college experience. Consistent with supervisors perceiving that for
college players the initial assessment is relatively more informative about worker quality, we
find a significant positive interaction between College and InitialAssessment.
In Column 5, we investigate how the weights for Performance, PriorPerformance, and
InitialAssessment vary over time by introducing interactions between these variables and
Experience. We find that the weight on Performance and InitialAssessment declines over time,
while the weight on PriorPerformance increases. This pattern is consistent with on-the-job
performance measures being useful for supervisors to learn about worker quality, and thus
supervisors shift weight from initial assessments to observed performance over time. That the
weight on Performance decreases and PriorPerformance increases is expected from a Bayesian
updating perspective if current performance is roughly equally informative about worker quality
each year, but supervisors have an increasing amount of informative prior performance signals to
include in promotion decisions as they gain experience with workers.
We next examine whether the weights observed in the preceding discussion are consistent
with economic theories that suggest that when making promotion decisions, supervisors weight
signals based on informativeness about worker ability. To proxy for informativeness, we
22
estimate similar models as in Table 4 Panel A, but we estimate future (next year’s) Performance
rather than promotion probabilities in Table 4 Panel B. This approach is similar to that used by
Ittner et al. (2003) in assessing whether supervisors’ weights of objective vs. subjective measures
are driven by informativeness for bonus decisions. For this analysis, we make a (perhaps strong)
assumption that supervisors should promote employees based on expected near-term future
performance. For these regressions, we additionally include fixed effects for future Level because
we expect future performance to be systematically related to the level at which an employee
performs. Overall, the idea behind the regressions in Table 4 Panel B is to provide a benchmark
for the general reasonableness of the relative promotion weights on Performance and
InitialAssessment that we observe in Table 4 Panel A, with the caveat that the models employed
in across these two panels employ different dependent variables.
In Panel B, we see that across each model the coefficient on Performance is roughly
similar to that in the respective models in Panel A, which is consistent with supervisors
weighting current objective performance measures according to their informativeness about
ability. For PriorPerformance, the coefficients are much larger than what we observe in the
promotion models, suggesting that supervisors under-weight prior performance in promotion
decisions relative to its ability to signal worker quality. Strikingly, for InitialAssessment, we
observe a negative association with future performance, in contrast to the relatively large positive
weight placed on this measure by supervisors in promotion decisions. A potential explanation for
this result is that supervisors over-rely on initial assessments so that all else equal, higher
assessed workers are promoted more than their current skillsets warrant; thus, these workers
underperform in the future. This large estimated difference in coefficients for the promotion
23
model vs. the future performance model is supportive of supervisors anchoring on initial
assessments, leading to biased promotion decisions.
In Table 5 Panel A, we test for the possibility that supervisors anchor on initial
assessments, which results in them giving differing importance to observed performance
depending on whether performance is consistent with prior beliefs. Specifically, we replace
Performance and InitialAssessment with separate measures of Performance for workers in each
quartile (by cohort) of initial assessment. We also include an indicator PerformanceGood, for
whether performance is greater than the average for peer workers in the same league/year and
interact PerformanceGood with each measure of Performance by quartile of InitialAssessment.
In Column 1, we find a large main effect of PerformanceGood, even after including continuous
measures of performance (PerformanceQ1-PerformanceQ4), suggesting that supervisors use
above-average performance as a heuristic for worker quality above and beyond performance per
se. The coefficients on PerformanceQ1 – PerformanceQ4 represent the weight on observed
below-average performance for each quartile. We find that the weight placed on “bad
performance” is decreasing for workers who were initially assessed as higher quality, suggesting
that supervisors discount bad performance if it runs counter to their expectations for the worker.
Moreover, the interaction terms, which represent the incremental weight placed on good
performance across quartiles, are negative and significant for Q1 and Q2 (below median
InitialAssessment), negative and insignificant for Q3, and significantly positive for Q4. This is
consistent with supervisors discounting good performance for workers for whom they have low
expectations and emphasizing good performance for workers who are expected to be the best. At
the same time, supervisors emphasize bad performance for workers for whom expectations are
low, and appear to discount bad performance for workers expected to be of higher quality. This

24
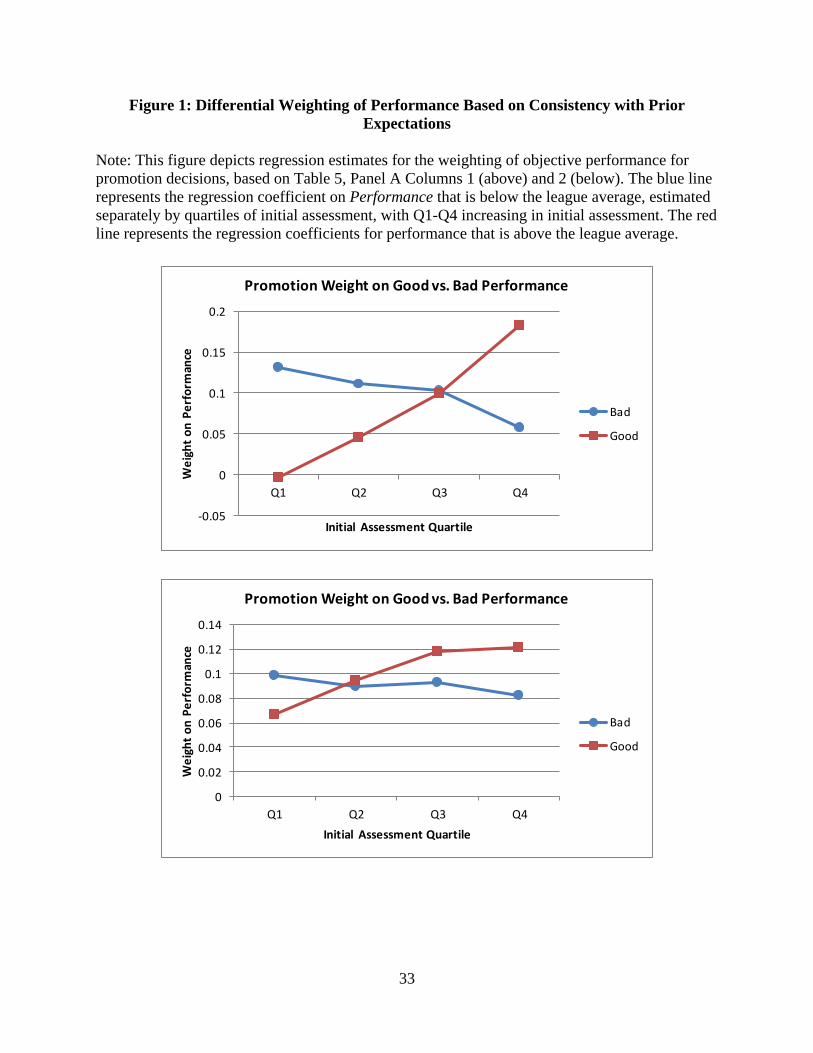
pattern, depicted in Figure 1, is consistent with supervisors’ anchoring on initial assessments
affecting their ability to use objective performance measures to update beliefs about worker
ability, and provides at least some explanation for the dramatic impact of initial assessments on
worker career outcomes documented in Table 3.
In Column 2, we include InitialAssessment to observe the main effect on promotions
separate from the effect due to differential weighting based on performance consistent with
expectations. While the pattern across quartiles is no longer monotonic (and in general the
weights on “bad performance” across quartiles are similar), a comparison of the difference in
weight on bad and good performance for Q1 vs. Q4 workers reveals the same pattern as in
Column 1. Specifically, for low-expected-quality employees, bad performance is weighted 47%
greater than good performance, while for high-expected-quality employees bad performance
receives roughly 32% less weight than good performance. Moreover, the difference in total
weight on good performance for Q4 vs. Q1 workers is economically large (82% greater) and
significant (p = .017).
In Table 5 Panel B, we perform similar analyses to Table 5 Panel A using future
performance as the dependent variable. As in Table 4 Panel B, Performance is positively related
to future performance, while InitialAssessment is negatively relative to future performance. We
find an inverted U-shaped pattern in the incremental weights on good performance, but find little
evidence of significantly different weighting of good versus bad performance in predicting future
performance. Comparing these results with the results in Table 5 Panel A again suggests the
possibility of managers’ exhibiting bias in promotion decisions relative to variables that predict
employees’ future performance.
5.3 Promotion weights by worker experience
25
In Table 6 Panel A, we repeat our model of promotion decisions after partitioning our
sample based on Experience to examine more directly how weights change over time using
seemingly unrelated regression. Notably, for employees in their first year of experience
(Experience=0), InitialAssessment receives greater weight in promotion decisions than
Performance (the difference is significant at the 5% level). However, the importance of
InitialAssessment declines sharply with Experience, while for Performance the coefficients
follow an inverted-U pattern over time. Thus, it appears supervisors at least partially recognize
the declining usefulness of initial assessments, and adjust their use of it accordingly. However,
across each column, we continue to find a significant association between InitialAssessment and
Promotion.
In Table 6 Panel B, we estimate models of future performance across partitions of
Experience. We find that InitialAssessment is significantly associated with Performance in a
worker’s first year on the job, validating the ability of teams’ scouting departments to identify
superior players and draft accordingly. However, following a worker’s first year on the job, and
continuing through four years of experience, InitialAssessment has no predictive value for future
performance, notwithstanding the positive weights on InitialAssessment in the promotion
models. Following an employee’s fifth year, initial assessments are negatively associated with
future performance. This negative association is again consistent with managers’ using measures
(InitialAssessment) for promotion decisions that seem inconsistent with future performance, and
may indicate bias.
5.4 Promotion weights by organizational level
In the preceding analyses, a possibility is that supervisors give workers with higher initial
assessments more difficult job assignments to stretch them, which may be optimal from a
26
developmental standpoint. While we control for level fixed effects in the above analysis, it may
be the case that the effect of InitialAssessment on promotions and future performance differs
across levels. To examine this possibility, we repeat our regressions after partitioning on Level.
The results, presented in Table 7 Panels A and B, are consistent with those of partitions on
Experience. For promotion decisions (Table 7 Panel A), we find larger coefficients on
InitialAssessment at the lower levels, although the effect persists even at the highest level of
MiLB. The importance of Performance for promotion decisions is generally increasing across
levels, although the coefficient declines sharply at the highest level. For future performance
(Table 7 Panel B), we again find that Performance is a significant predictor of future
performance, while InitialAssessment is generally not. We observe a significant negative
coefficient on InitialAssessment for the highest level of MiLB, consistent with Table 6 Panel B
and with managers’ making promotion decisions using inputs that are at best not predictive, and
at worst negatively predictive, of future employee success.
6. Conclusion
In this paper we bring together streams of research from labor economics on careers in
organizations and employer learning and from accounting on the use of performance measures.
The economics literature documents that firms learn about worker ability, which shapes workers’
career progression, but does not examine how firms learn. The accounting literature documents
that supervisors’ cognitive limitations and biases influence performance evaluation, but does not
examine how these limitations impact workers’ careers. By shedding light on how supervisors
use objective performance measures for promotion decisions, and their over-reliance on initial
impressions long after they are informative about worker ability, we make important
contributions to both literatures.
27
Prior research on employer learning has generally relied on either broad survey data to
answer high-level questions about career progression or has used detailed personnel records from
a single firm to descriptively examine promotion patterns within firms. A central feature of the
theoretical models in this field is that performance measurement is a dynamic process. One
implication from this research is that an important role of performance measurement systems is
to facilitate employer learning about employees’ ability over time. However, to this point the
empirical research in this area has not examined how supervisors weight performance signals
over time, or how these signals are used to update initial assessments of ability. By utilizing a
unique dataset that combines detailed promotion data across hierarchical levels with
corresponding performance measures over time, we are able to provide evidence on this
important topic.
Our study contributes to the judgement and decision making literature by using archival
data to document supervisors’ over-reliance on initial assessments even in the face of
informative objective performance measures. Moreover, we find this effect occurs in part due to
differential weighting of objective performance measures depending on whether or not realized
performance is consistent with initial expectations. The majority of evidence for supervisors’
biased performance evaluations is from experimental research generated in lab settings. In two
recent studies, Woods (2012) and Anderson et al. (2014) use field data to document that
supervisors allow ancillary performance measures to influence ratings on an unrelated
dimension, consistent with confirmation bias. Our study compliments and extends this prior
research. First, whereas Woods (2012) and Anderson et al. (2014) both examine performance
appraisal for bonus computations, our study examines promotion decisions. Also, both Woods
(2012) and Anderson et al. (2014) examine settings in which the ratings task was recently
28
introduced as part of an overhaul to an existing incentive system, and both studies posit that the
unfamiliarity with the task contributes to supervisors tendency to anchor on ancillary measures.
In our setting, the task of evaluating worker ability to determine job assignments is essentially
the same over a 27-year sample period, yet we find evidence of confirmation bias that persists
even after up to six years of on-the-job performance has been observed. Our results suggest that
supervisors are slow to revise beliefs about worker ability even when the evaluation task is
familiar and incentives to promote the best worker are strong. We leave it to future research to
explore alternative means of mitigating supervisors’ confirmation bias in promotion settings.
29
References Allen, E., Dechow, P., Pope, D., Wu, G., 2014. Reference-dependent preferences: Evidence from marathon runners. Management Science, Forthcoming. Altonji, J., Pierret, C., 2001. Employer learning and statistical discrimination. The Quarterly Journal of Economics 116, 313-350. Anderson, S., Dekker, H., Sedatole, K., Wiersma, E., 2014. Field evidence of bias in subjective ratings. Working paper. Bailey, W., Hecht, G., Towry, K., 2011. Dividing the pie: The influence of managerial discretion extent on bonus pool allocation. Contemporary Accounting Research 28, 1562-1584. Baker, G., Gibbs, M., Holmstrom, B., 1994. The internal economics of the firm: evidence from personnel data. The Quarterly Journal of Economics 109, 881-919. Baker, G., Jensen, M., Murphy, K., 1988. Compensation and incentives: practice vs. theory. Journal of Finance 43, 593-616. Bamber, E.M., Ramsay, R., Tubbs, R., 1997. An examination of the descriptive validity of the belief-adjustment model and alterative attitudes to evidence in auditing. Accounting, Organizations and Society 22, 249-268. Becker, G., 1965. A theory of the allocation of time. The Economic Journal 75, 493-517. Berger, J., and Pope, D., 2011. Can losing lead to winning. Management Science 57(5), 817-827. Bol, J., 2008. Subjectivity in compensation contracting. Journal of Accounting Literature 27, 1-24. Bol, J., 2011. The determinants and performance effects of managers performance evaluation biases. The Accounting Review 86, 1549-1575. Bol, J., Smith, S., 2011. Spillover effects in subjective performance evaluation: Bias and the asymmetric influence of controllability. The Accounting Review 86, 1213-1230. Bonner, S.E., 2008. Judgement and decision making in accounting. Upper Saddle River, NJ: Pearson Education, Inc. Cadman, B., Cassar, G., 2013. Explicit and implicit incentives: longitudinal evidence from NCAA football head coaches employment contracts. AAA 2014 Management Accounting Section (MAS) Meeting Paper. Available at SSRN: http://ssrn.com/abstract=2310164 or http://dx.doi.org/10.2139/ssrn.2310164.
30
Campbell, D., 2008. Nonfinancial performance measures and promotion-based incentives. Journal of Accounting Research 46, 297-332. Chan, E., 2015. Promotion, relative performance information, and the Peter Principle. Working paper. Chapman, K.S., and Southwick, L., 1991. Testing the matching hypothesis: The case of Major-League Baseball. The American Economic Review 81, 1352-1360. Charness, G., Kuhn, P., 2011. Chapter 3 – Lab labor: What can labor economists learn from the lab? Handbook of Labor Economics 4a, 229-330. Cichello, M., Fee, C. E., Hadlock, C., Sonti, R., 2009. Promotions, turnover, and performance evaluation: evidence from the careers of division managers. The Accounting Review 84, 1119-1143. Edmans, A., García, D., and Norli, Ø., 2007. Sports sentiment and stock returns. The Journal of Finance 62, 1967-1998. Falk, A., Fehr, E., 2003. Why labour market experiments? Labour Economics 10, 399-406. Farber, H., Gibbons, R., 1996. Learning and wage dynamics. The Quarterly Journal of Economics 111, 1007-1047. Gibbons, R., Waldman, M., 1999. A theory of wage and promotion dynamics inside firms. The Quarterly Journal of Economics 114, 1321-1358. Gibbs, M., 1995. Incentive compensation in a corporate hierarchy. Journal of Accounting and Economics 19, 247-277. Gibbs, M., 2008. Discussion of nonfinancial performance measures and promotion-based incentives. Journal of Accounting Research 46, 333-340. Gibbs, M., Merchant, K., Van der Stede, W., Vargus, M., 2004. Determinants and effects of subjectivity in incentives. The Accounting Review 79, 409-436. Grabner, I., Moers, F., 2013. Managers’ choices of performance measures in promotion decisions: An analysis of alternative job assignments. Journal of Accounting Research 51, 1187-1220. Greene, W., 2004. The behaviour of the maximum likelihood estimator of limited dependent variable models in the presence of fixed effects. Econometrics Journal 7, 98-119. Holmstrom, B., 1999. Managerial incentive problems: a dynamic perspective. Review of Economic Studies 66, 169-182.
31
Ittner, C., Larcker, D., Meyer, M., 2003. Subjectivity and the weighting of performance measures: evidence from a balanced scorecard. The Accounting Review 78, 725-758. Kahn, L., Lange, F., 2014. Employer learning, productivity, and the earnings distribution: evidence from performance measures. Review of Economic Studies 81, 1575-1613. Lange, F., 2007. The speed of employer learning. Journal of Labor Economics 25, 1-35. Merchant, K., Van der Stede, W., 2012. Management control systems: performance measurement, evaluation, and incentives. Prentice Hall, Third Edition, London. Moers, F., 2005. Discretion and bias in performance evaluation: The impact of diversity and subjectivity. Accounting, Organizations and Society 30, 67-80. Murphy, K.J., 1986. Incentives, learning, and compensation: A theoretical and empirical investigation of managerial labor contracts. The Rand Journal of Economics, 59-76. Nickerson, R., 1998. Confirmation bias: A ubiquitous phenomenon in many guises. Review of General Psychology 2, 175-220. Pope, D. and Schweitzer, M., 2011. Is Tiger Woods loss averse? Persistent bias in the face of experience, competition, and high stakes. American Economic Review 101(1), 129-157. Prendergast, C., 1999. The provision of incentives in firms. Journal of Economic Literature 37, 7-63. Rabin, M., Schrag, J., 1999. First impressions matter: A model of confirmatory bias. The Quarterly Journal of Economics 114, 37-82. Rosen, S., 1982. Authority, control, and the distribution of earnings. The Bell Journal of Economics 13, 311-323. Spence, M., 1973. Job market signaling. The Quarterly Journal of Economics 87, 355-374. Spurr, S., Barber, W., 1994. The effect of performance on a worker’s career: Evidence from minor league baseball. Industrial and Labor Relations Review 47, 692-708. Waldman, M., 1984. Job assignments, signaling, and efficiency. The RAND Journal of Economics 15, 255-267. Woods, A., 2012. Subjective adjustments to objective performance measures: The influence of prior performance. Accounting, Organizations and Society 37, 403-425. Wooldridge, J., 2002. Econometric analysis of cross section and panel data. Cambridge, MA: MIT Press.
32
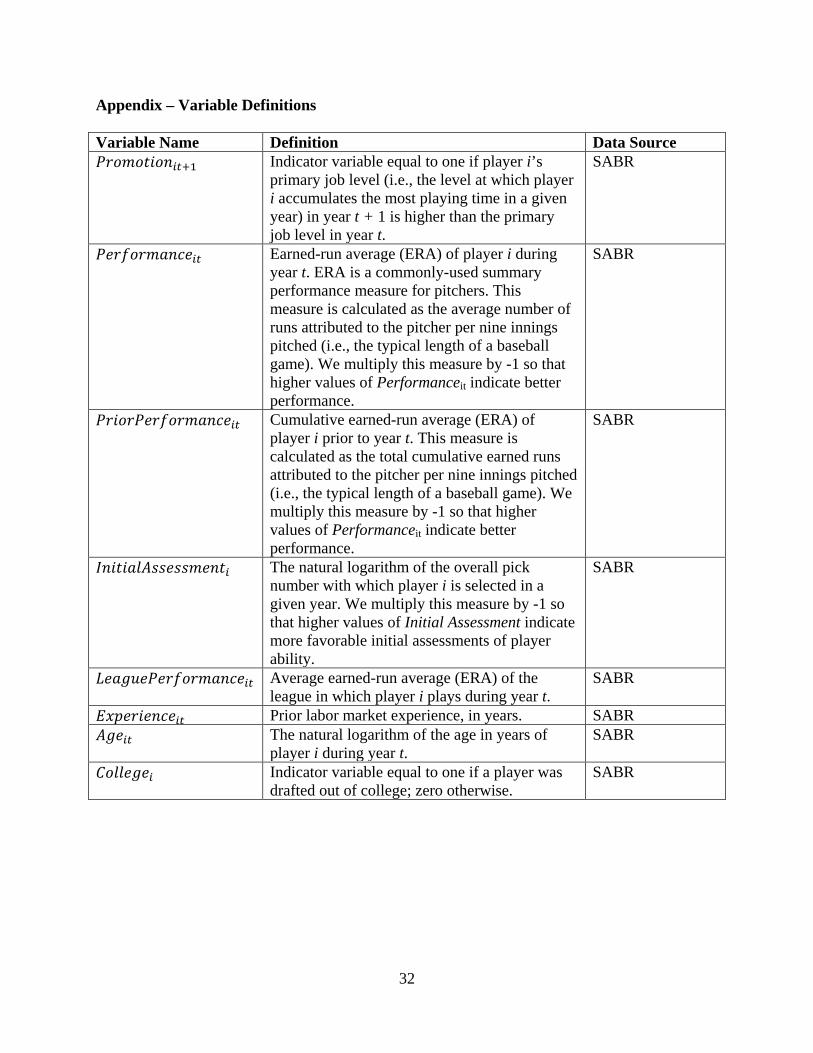
Appendix – Variable Definitions Variable Name Definition Data Source 𝑃𝑃𝑃𝑃𝑃𝑃𝑃𝑃𝑃𝑖𝑖+1 Indicator variable equal to one if player i’s
primary job level (i.e., the level at which player i accumulates the most playing time in a given year) in year t + 1 is higher than the primary job level in year t.
SABR
𝑃𝑃𝑃𝑃𝑃𝑃𝑃𝑃𝑃𝑃𝑃𝑖𝑖 Earned-run average (ERA) of player i during year t. ERA is a commonly-used summary performance measure for pitchers. This measure is calculated as the average number of runs attributed to the pitcher per nine innings pitched (i.e., the typical length of a baseball game). We multiply this measure by -1 so that higher values of Performanceit indicate better performance.
SABR
𝑃𝑃𝑃𝑃𝑃𝑃𝑃𝑃𝑃𝑃𝑃𝑃𝑃𝑃𝑃𝑃𝑖𝑖 Cumulative earned-run average (ERA) of player i prior to year t. This measure is calculated as the total cumulative earned runs attributed to the pitcher per nine innings pitched (i.e., the typical length of a baseball game). We multiply this measure by -1 so that higher values of Performanceit indicate better performance.
SABR
𝐼𝑃𝑃𝑃𝑃𝑃𝐼𝐼𝐼𝐼𝑃𝐼𝐼𝑃𝑃𝑃𝑃𝑖 The natural logarithm of the overall pick number with which player i is selected in a given year. We multiply this measure by -1 so that higher values of Initial Assessment indicate more favorable initial assessments of player ability.
SABR
𝐿𝑃𝑃𝐴𝐿𝑃𝑃𝑃𝑃𝑃𝑃𝑃𝑃𝑃𝑃𝑃𝑃𝑖𝑖 Average earned-run average (ERA) of the league in which player i plays during year t.
SABR
𝐸𝐸𝐸𝑃𝑃𝑃𝑃𝑃𝑃𝑃𝑖𝑖 Prior labor market experience, in years. SABR 𝐼𝐴𝑃𝑖𝑖 The natural logarithm of the age in years of
player i during year t. SABR
𝐶𝑃𝐼𝐼𝑃𝐴𝑃𝑖 Indicator variable equal to one if a player was drafted out of college; zero otherwise.
SABR
33
Figure 1: Differential Weighting of Performance Based on Consistency with Prior Expectations
Note: This figure depicts regression estimates for the weighting of objective performance for promotion decisions, based on Table 5, Panel A Columns 1 (above) and 2 (below). The blue line represents the regression coefficient on Performance that is below the league average, estimated separately by quartiles of initial assessment, with Q1-Q4 increasing in initial assessment. The red line represents the regression coefficients for performance that is above the league average.
-0.05
0
0.05
0.1
0.15
0.2
Q1 Q2 Q3 Q4
Wei
ght o
n Pe
rfor
man
ce
Initial Assessment Quartile
Promotion Weight on Good vs. Bad Performance
Bad
Good
0
0.02
0.04
0.06
0.08
0.1
0.12
0.14
Q1 Q2 Q3 Q4
Wei
ght o
n Pe
rfor
man
ce
Initial Assessment Quartile
Promotion Weight on Good vs. Bad Performance
Bad
Good
34
Table 1 – Descriptive Statistics
Notes: This table presents descriptive statistics for the variables used in the empirical tests. Statistics are presented for the full sample and for each hierarchical level within an organization. All variables are defined in the Appendix.
Full SampleVARIABLE N Mean Stdev P25 Median P75Promotion it+1 41,043 0.510 0.500 0.000 1.000 1.000Performance it 41,043 0.000 1.000 - 0.393 0.140 0.598PriorPerformance it 29,716 0.000 1.000 - 0.396 0.071 0.525InitialAssessment i 41,043 - 0.000 1.000 - 0.744 - 0.228 0.506LeaguePerformance it 41,043 0.000 1.000 - 0.626 0.141 0.713Experience t 41,043 1.631 1.530 0.000 1.000 3.000Age it 41,043 0.000 1.000 - 0.608 0.035 0.638College i 41,043 0.761 0.426 1.000 1.000 1.000
Job Level 1 (Rookie)VARIABLE N Mean Stdev P25 Median P75Promotion it+1 4,656 0.614 0.487 0.000 1.000 1.000Performance it 4,656 0.012 1.342 - 0.462 0.279 0.825PriorPerformance it 1,111 - 0.751 1.781 - 1.427 - 0.434 0.287InitialAssessment i 4,656 - 0.237 0.889 - 0.904 - 0.451 0.223LeaguePerformance it 4,656 0.462 1.119 - 0.036 0.807 1.338Experience t 4,656 0.348 0.773 0.000 0.000 0.000Age it 4,656 - 1.191 0.915 - 1.947 - 1.372 - 0.509College i 4,656 0.496 0.500 0.000 0.000 1.000
Job Level 2 (Advanced Rookie)VARIABLE N Mean Stdev P25 Median P75Promotion it+1 4,433 0.621 0.485 0.000 1.000 1.000Performance it 4,433 - 0.232 1.171 - 0.712 - 0.059 0.524PriorPerformance it 1,488 - 0.595 1.675 - 1.364 - 0.387 0.518InitialAssessment i 4,433 - 0.284 0.812 - 0.890 - 0.485 0.138LeaguePerformance it 4,433 - 1.056 1.067 - 1.877 - 1.078 - 0.240Experience t 4,433 0.388 0.652 0.000 0.000 1.000Age it 4,433 - 0.700 0.747 - 1.237 - 0.590 - 0.147College i 4,433 0.720 0.449 0.000 1.000 1.000
Job Level 3 (Short Season A)VARIABLE N Mean Stdev P25 Median P75Promotion it+1 6,268 0.658 0.474 0.000 1.000 1.000Performance it 6,268 0.092 1.020 - 0.342 0.256 0.742PriorPerformance it 2,314 - 0.282 1.390 - 0.904 - 0.145 0.560InitialAssessment i 6,268 - 0.206 0.823 - 0.811 - 0.384 0.220LeaguePerformance it 6,268 0.474 0.704 0.124 0.594 0.892Experience t 6,268 0.464 0.787 0.000 0.000 1.000Age it 6,268 - 0.374 0.581 - 0.718 - 0.335 0.013College i 6,268 0.852 0.355 1.000 1.000 1.000
35
Table 1 – Descriptive Statistics (continued)
Job Level 4 (Low A)VARIABLE N Mean Stdev P25 Median P75Promotion it+1 8,213 0.571 0.495 0.000 1.000 1.000Performance it 8,213 0.098 0.873 - 0.254 0.209 0.626PriorPerformance it 7,675 0.006 1.092 - 0.564 0.046 0.673InitialAssessment i 8,213 - 0.041 0.939 - 0.745 - 0.238 0.456LeaguePerformance it 8,213 0.378 0.579 0.005 0.401 0.764Experience t 8,213 1.358 0.915 1.000 1.000 2.000Age it 8,213 - 0.129 0.680 - 0.537 - 0.039 0.357College i 8,213 0.746 0.435 0.000 1.000 1.000
Job Level 5 (High A)VARIABLE N Mean Stdev P25 Median P75Promotion it+1 8,108 0.446 0.497 0.000 0.000 1.000Performance it 8,108 0.001 0.916 - 0.379 0.131 0.543PriorPerformance it 7,855 0.117 0.741 - 0.302 0.102 0.536InitialAssessment i 8,108 0.080 1.011 - 0.672 - 0.132 0.641LeaguePerformance it 8,108 0.001 0.983 - 0.732 0.139 0.752Experience t 8,108 2.188 1.172 1.000 2.000 3.000Age it 8,108 0.356 0.685 - 0.083 0.395 0.830College i 8,108 0.799 0.401 1.000 1.000 1.000
Job Level 6 (AA)VARIABLE N Mean Stdev P25 Median P75Promotion it+1 6,119 0.367 0.482 0.000 0.000 1.000Performance it 6,119 0.003 0.845 - 0.346 0.121 0.492PriorPerformance it 6,062 0.155 0.544 - 0.191 0.132 0.485InitialAssessment i 6,119 0.262 1.094 - 0.566 0.041 0.875LeaguePerformance it 6,119 - 0.084 0.651 - 0.494 - 0.064 0.303Experience t 6,119 3.160 1.215 2.000 3.000 4.000Age it 6,119 0.840 0.712 0.363 0.868 1.346College i 6,119 0.816 0.388 1.000 1.000 1.000
Job Level 7 (AAA)VARIABLE N Mean Stdev P25 Median P75Promotion it+1 3,246 0.194 0.396 0.000 0.000 0.000Performance it 3,246 - 0.135 0.823 - 0.536 - 0.055 0.362PriorPerformance it 3,211 0.148 0.451 - 0.155 0.129 0.433InitialAssessment i 3,246 0.533 1.249 - 0.415 0.258 1.286LeaguePerformance it 3,246 - 0.936 0.874 - 1.700 - 0.878 - 0.132Experience t 3,246 3.845 1.130 3.000 4.000 5.000Age it 3,246 1.241 0.727 0.771 1.283 1.706College i 3,246 0.863 0.344 1.000 1.000 1.000
36
Table 2 – Correlations Notes: This table presents pairwise correlation statistics for the variables used in the empirical tests. Pearson correlations are presented below the diagonal. Spearman correlations are presented above the diagonal. * indicates statistical significance at the 0.05 level. All variables are defined in the Appendix.
VARIABLE (1) (2) (3) (4) (5) (6) (7) (8)
(1) Promotion it+1 0.3231* 0.0589* 0.0907* 0.0970* -0.2560* -0.2473* -0.0270*
(2) Performance it 0.2863* 0.1673* -0.0244* 0.2405* -0.1019* -0.0262* 0.0615*
(3) PriorPerformance it 0.0464* 0.1638* -0.0913* 0.0526* -0.1243* 0.0513* 0.1397*
(4) InitialAssessment i 0.0878* -0.001 -0.0336* -0.0359* 0.1471* -0.0452* -0.1795*
(5) LeaguePerformance it 0.0883* 0.2019* 0.0517* -0.0299* -0.1721* -0.1937* -0.0632*
(6) Experience t -0.2563* -0.0606* -0.0382* 0.1345* -0.1562* 0.6355* -0.0696*(7) Age it -0.2346* -0.002 0.0955* -0.0487* -0.1680* 0.6393* 0.4653*(8) College i -0.0270* 0.0572* 0.1271* -0.1870* -0.0557* -0.0713* 0.4940*
37
Table 3 – Employee Descriptive Statistics by Initial Assessment Quartile and Job Level
Panel A: Employee Outcomes by Initial Assessment Quartile and Job Level Notes: This table presents the percentage of each employee outcomes by initial assessment quartile and job level. Employee outcomes include promotion, repeating the level, demotion, and exit from professional baseball.
Full SampleInitial Assessment Quartile N Promoted Repeat Demote ExitQ4 16,454 0.557 0.249 0.066 0.128Q3 12,203 0.496 0.225 0.055 0.223Q2 8,402 0.469 0.202 0.044 0.286Q1 3,984 0.444 0.186 0.042 0.327
Job Level 1 (Rookie)Initial Assessment Quartile N Promoted Repeat Demote ExitQ4 1,437 0.711 0.153 0.013 0.123Q3 1,324 0.574 0.182 0.014 0.230Q2 1,139 0.576 0.144 0.008 0.272Q1 756 0.557 0.144 0.003 0.296
Job Level 2 (Advanced Rookie)Initial Assessment Quartile N Promoted Repeat Demote ExitQ4 1,273 0.738 0.123 0.029 0.110Q3 1,345 0.625 0.146 0.025 0.204Q2 1,164 0.560 0.133 0.018 0.289Q1 651 0.490 0.141 0.026 0.343
Job Level 3 (Short Season A)Initial Assessment Quartile N Promoted Repeat Demote ExitQ4 1,982 0.789 0.082 0.024 0.106Q3 2,053 0.668 0.090 0.033 0.209Q2 1,543 0.555 0.111 0.021 0.312Q1 690 0.486 0.117 0.039 0.358
Job Level 4 (Low A)Initial Assessment Quartile N Promoted Repeat Demote ExitQ4 3,210 0.637 0.176 0.054 0.134Q3 2,522 0.557 0.168 0.037 0.238Q2 1,704 0.511 0.157 0.029 0.303Q1 777 0.479 0.140 0.026 0.355
Job Level 5 (High A)Initial Assessment Quartile N Promoted Repeat Demote ExitQ4 3,578 0.516 0.248 0.063 0.173Q3 2,397 0.416 0.250 0.056 0.278Q2 1,482 0.387 0.237 0.057 0.319Q1 651 0.309 0.240 0.069 0.382
Job Level 6 (AA)Initial Assessment Quartile N Promoted Repeat Demote ExitQ4 3,081 0.426 0.350 0.094 0.130Q3 1,731 0.323 0.371 0.101 0.205Q2 972 0.282 0.377 0.105 0.237Q1 335 0.299 0.379 0.107 0.215
Job Level 7 (AAA)Initial Assessment Quartile N Promoted Repeat Demote ExitQ4 1,893 0.228 0.544 0.156 0.072Q3 831 0.149 0.557 0.183 0.111Q2 398 0.138 0.555 0.173 0.133Q1 124 0.169 0.548 0.177 0.105
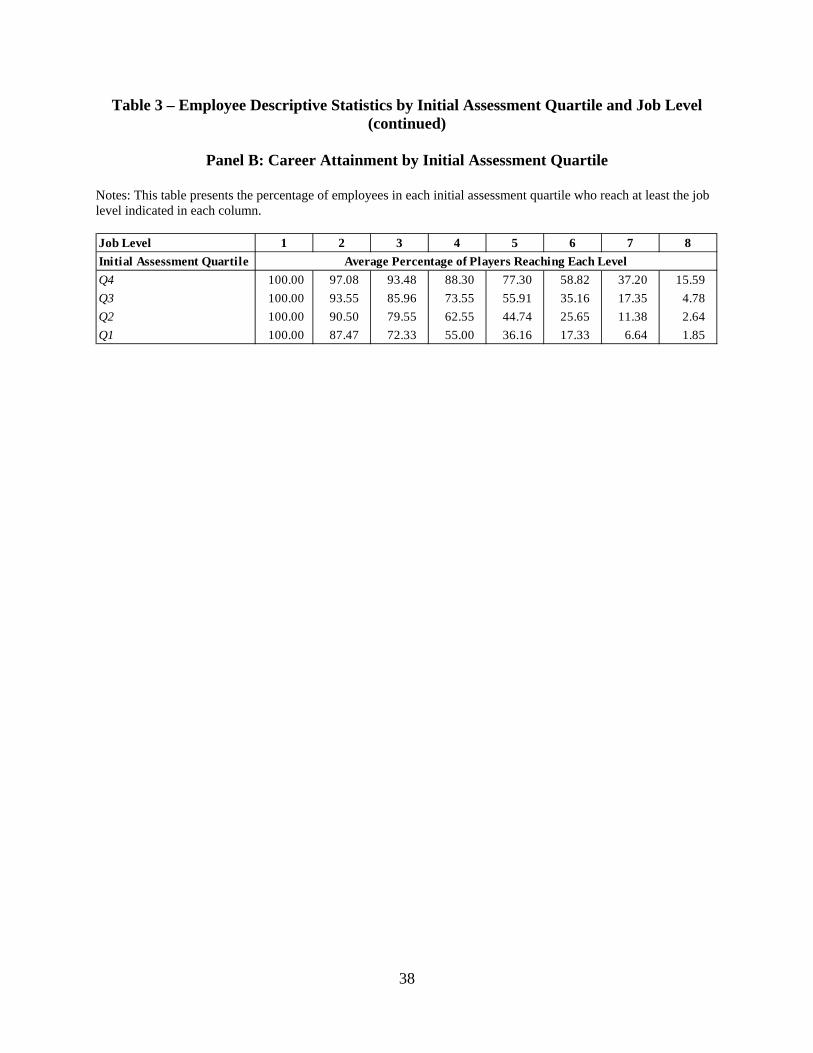
38
Table 3 – Employee Descriptive Statistics by Initial Assessment Quartile and Job Level (continued)
Panel B: Career Attainment by Initial Assessment Quartile
Notes: This table presents the percentage of employees in each initial assessment quartile who reach at least the job level indicated in each column.
Job Level 1 2 3 4 5 6 7 8Initial Assessment QuartileQ4 100.00 97.08 93.48 88.30 77.30 58.82 37.20 15.59Q3 100.00 93.55 85.96 73.55 55.91 35.16 17.35 4.78Q2 100.00 90.50 79.55 62.55 44.74 25.65 11.38 2.64Q1 100.00 87.47 72.33 55.00 36.16 17.33 6.64 1.85
Average Percentage of Players Reaching Each Level
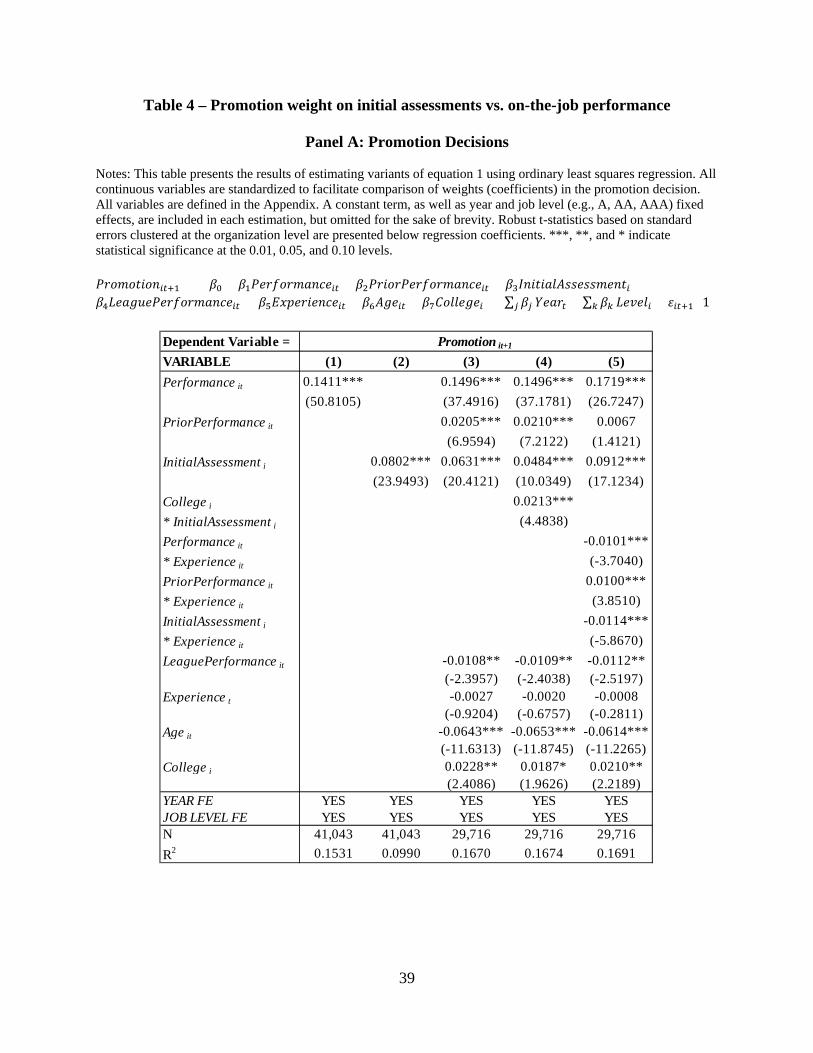
39
Table 4 – Promotion weight on initial assessments vs. on-the-job performance
Panel A: Promotion Decisions Notes: This table presents the results of estimating variants of equation 1 using ordinary least squares regression. All continuous variables are standardized to facilitate comparison of weights (coefficients) in the promotion decision. All variables are defined in the Appendix. A constant term, as well as year and job level (e.g., A, AA, AAA) fixed effects, are included in each estimation, but omitted for the sake of brevity. Robust t-statistics based on standard errors clustered at the organization level are presented below regression coefficients. ***, **, and * indicate statistical significance at the 0.01, 0.05, and 0.10 levels. 𝑃𝑃𝑃𝑃𝑃𝑃𝑃𝑃𝑃𝑖𝑖+1 = 𝛽0 + 𝛽1𝑃𝑃𝑃𝑃𝑃𝑃𝑃𝑃𝑃𝑃𝑃𝑖𝑖 + 𝛽2𝑃𝑃𝑃𝑃𝑃𝑃𝑃𝑃𝑃𝑃𝑃𝑃𝑃𝑃𝑃𝑃𝑖𝑖 + 𝛽3𝐼𝑃𝑃𝑃𝑃𝑃𝐼𝐼𝐼𝐼𝑃𝐼𝐼𝑃𝑃𝑃𝑃𝑖 +𝛽4𝐿𝑃𝑃𝐴𝐿𝑃𝑃𝑃𝑃𝑃𝑃𝑃𝑃𝑃𝑃𝑃𝑃𝑖𝑖 + 𝛽5𝐸𝐸𝐸𝑃𝑃𝑃𝑃𝑃𝑃𝑃𝑖𝑖 + 𝛽6𝐼𝐴𝑃𝑖𝑖 + 𝛽7𝐶𝑃𝐼𝐼𝑃𝐴𝑃𝑖 + ∑ 𝛽𝑗𝑗 𝑌𝑃𝑃𝑃𝑖 + ∑ 𝛽𝑘𝑘 𝐿𝑃𝐿𝑃𝐼𝑖 + 𝜀𝑖𝑖+1 (1)
Dependent Variable = VARIABLE (1) (2) (3) (4) (5)Performance it 0.1411*** 0.1496*** 0.1496*** 0.1719***
(50.8105) (37.4916) (37.1781) (26.7247)PriorPerformance it 0.0205*** 0.0210*** 0.0067
(6.9594) (7.2122) (1.4121)InitialAssessment i 0.0802*** 0.0631*** 0.0484*** 0.0912***
(23.9493) (20.4121) (10.0349) (17.1234)College i 0.0213**** InitialAssessment i (4.4838)Performance it -0.0101**** Experience it (-3.7040)PriorPerformance it 0.0100**** Experience it (3.8510)InitialAssessment i -0.0114**** Experience it (-5.8670)LeaguePerformance it -0.0108** -0.0109** -0.0112**
(-2.3957) (-2.4038) (-2.5197)Experience t -0.0027 -0.0020 -0.0008
(-0.9204) (-0.6757) (-0.2811)Age it -0.0643*** -0.0653*** -0.0614***
(-11.6313) (-11.8745) (-11.2265)College i 0.0228** 0.0187* 0.0210**
(2.4086) (1.9626) (2.2189)YEAR FE YES YES YES YES YESJOB LEVEL FE YES YES YES YES YESN 41,043 41,043 29,716 29,716 29,716R2 0.1531 0.0990 0.1670 0.1674 0.1691
Promotion it+1
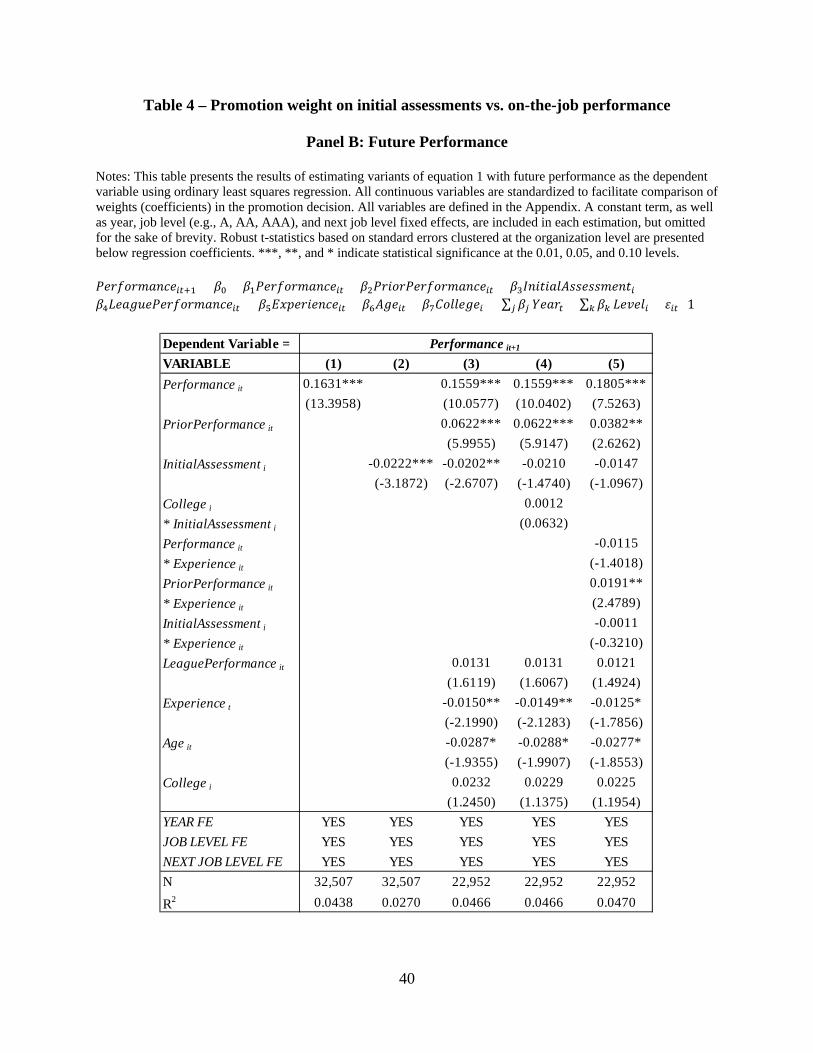
40
Table 4 – Promotion weight on initial assessments vs. on-the-job performance
Panel B: Future Performance
Notes: This table presents the results of estimating variants of equation 1 with future performance as the dependent variable using ordinary least squares regression. All continuous variables are standardized to facilitate comparison of weights (coefficients) in the promotion decision. All variables are defined in the Appendix. A constant term, as well as year, job level (e.g., A, AA, AAA), and next job level fixed effects, are included in each estimation, but omitted for the sake of brevity. Robust t-statistics based on standard errors clustered at the organization level are presented below regression coefficients. ***, **, and * indicate statistical significance at the 0.01, 0.05, and 0.10 levels.
𝑃𝑃𝑃𝑃𝑃𝑃𝑃𝑃𝑃𝑃𝑃𝑖𝑖+1 = 𝛽0 + 𝛽1𝑃𝑃𝑃𝑃𝑃𝑃𝑃𝑃𝑃𝑃𝑃𝑖𝑖 + 𝛽2𝑃𝑃𝑃𝑃𝑃𝑃𝑃𝑃𝑃𝑃𝑃𝑃𝑃𝑃𝑃𝑃𝑖𝑖 + 𝛽3𝐼𝑃𝑃𝑃𝑃𝑃𝐼𝐼𝐼𝐼𝑃𝐼𝐼𝑃𝑃𝑃𝑃𝑖 +𝛽4𝐿𝑃𝑃𝐴𝐿𝑃𝑃𝑃𝑃𝑃𝑃𝑃𝑃𝑃𝑃𝑃𝑃𝑖𝑖 + 𝛽5𝐸𝐸𝐸𝑃𝑃𝑃𝑃𝑃𝑃𝑃𝑖𝑖 + 𝛽6𝐼𝐴𝑃𝑖𝑖 + 𝛽7𝐶𝑃𝐼𝐼𝑃𝐴𝑃𝑖 + ∑ 𝛽𝑗𝑗 𝑌𝑃𝑃𝑃𝑖 + ∑ 𝛽𝑘𝑘 𝐿𝑃𝐿𝑃𝐼𝑖 + 𝜀𝑖𝑖 (1)
Dependent Variable = VARIABLE (1) (2) (3) (4) (5)Performance it 0.1631*** 0.1559*** 0.1559*** 0.1805***
(13.3958) (10.0577) (10.0402) (7.5263)PriorPerformance it 0.0622*** 0.0622*** 0.0382**
(5.9955) (5.9147) (2.6262)InitialAssessment i -0.0222*** -0.0202** -0.0210 -0.0147
(-3.1872) (-2.6707) (-1.4740) (-1.0967)College i 0.0012* InitialAssessment i (0.0632)Performance it -0.0115* Experience it (-1.4018)PriorPerformance it 0.0191*** Experience it (2.4789)InitialAssessment i -0.0011* Experience it (-0.3210)LeaguePerformance it 0.0131 0.0131 0.0121
(1.6119) (1.6067) (1.4924)Experience t -0.0150** -0.0149** -0.0125*
(-2.1990) (-2.1283) (-1.7856)Age it -0.0287* -0.0288* -0.0277*
(-1.9355) (-1.9907) (-1.8553)College i 0.0232 0.0229 0.0225
(1.2450) (1.1375) (1.1954)YEAR FE YES YES YES YES YESJOB LEVEL FE YES YES YES YES YESNEXT JOB LEVEL FE YES YES YES YES YESN 32,507 32,507 22,952 22,952 22,952
R2 0.0438 0.0270 0.0466 0.0466 0.0470
Performance it+1
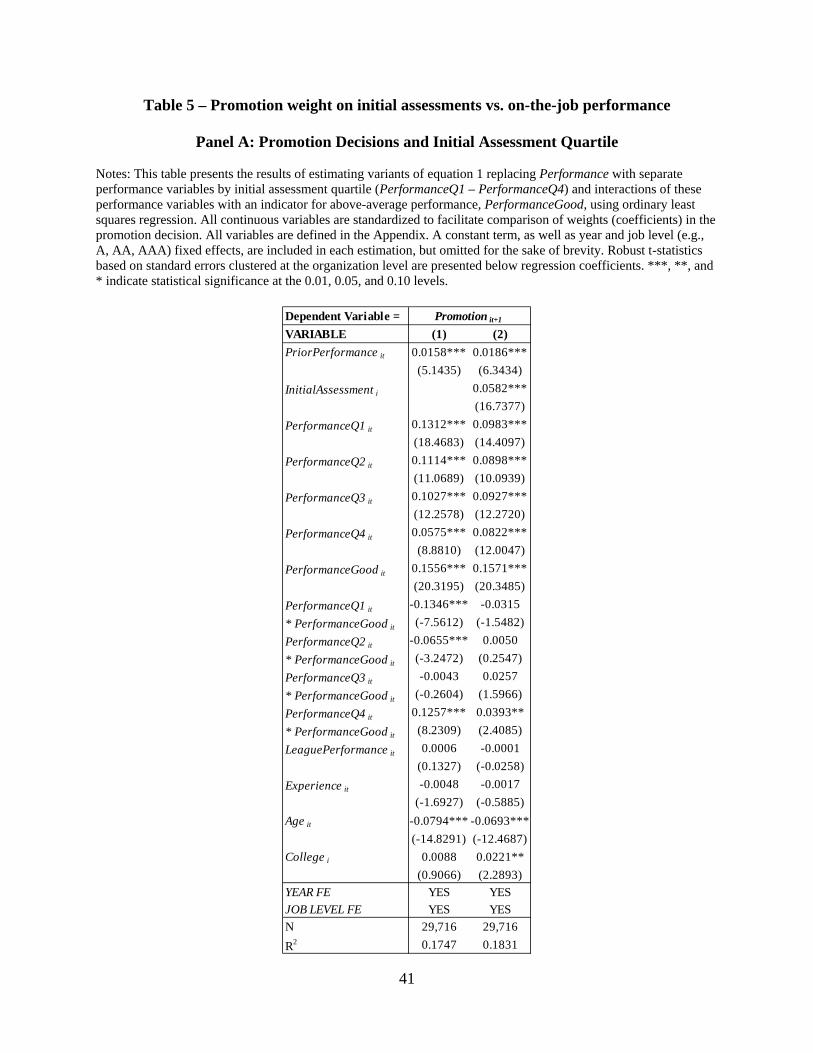
41
Table 5 – Promotion weight on initial assessments vs. on-the-job performance
Panel A: Promotion Decisions and Initial Assessment Quartile
Notes: This table presents the results of estimating variants of equation 1 replacing Performance with separate performance variables by initial assessment quartile (PerformanceQ1 – PerformanceQ4) and interactions of these performance variables with an indicator for above-average performance, PerformanceGood, using ordinary least squares regression. All continuous variables are standardized to facilitate comparison of weights (coefficients) in the promotion decision. All variables are defined in the Appendix. A constant term, as well as year and job level (e.g., A, AA, AAA) fixed effects, are included in each estimation, but omitted for the sake of brevity. Robust t-statistics based on standard errors clustered at the organization level are presented below regression coefficients. ***, **, and * indicate statistical significance at the 0.01, 0.05, and 0.10 levels.
Dependent Variable = VARIABLE (1) (2)PriorPerformance it 0.0158*** 0.0186***
(5.1435) (6.3434)InitialAssessment i 0.0582***
(16.7377)PerformanceQ1 it 0.1312*** 0.0983***
(18.4683) (14.4097)PerformanceQ2 it 0.1114*** 0.0898***
(11.0689) (10.0939)PerformanceQ3 it 0.1027*** 0.0927***
(12.2578) (12.2720)PerformanceQ4 it 0.0575*** 0.0822***
(8.8810) (12.0047)PerformanceGood it 0.1556*** 0.1571***
(20.3195) (20.3485)PerformanceQ1 it -0.1346*** -0.0315* PerformanceGood it (-7.5612) (-1.5482)PerformanceQ2 it -0.0655*** 0.0050* PerformanceGood it (-3.2472) (0.2547)PerformanceQ3 it -0.0043 0.0257* PerformanceGood it (-0.2604) (1.5966)PerformanceQ4 it 0.1257*** 0.0393*** PerformanceGood it (8.2309) (2.4085)LeaguePerformance it 0.0006 -0.0001
(0.1327) (-0.0258)Experience it -0.0048 -0.0017
(-1.6927) (-0.5885)Age it -0.0794*** -0.0693***
(-14.8291) (-12.4687)College i 0.0088 0.0221**
(0.9066) (2.2893)YEAR FE YES YESJOB LEVEL FE YES YESN 29,716 29,716R2 0.1747 0.1831
Promotion it+1
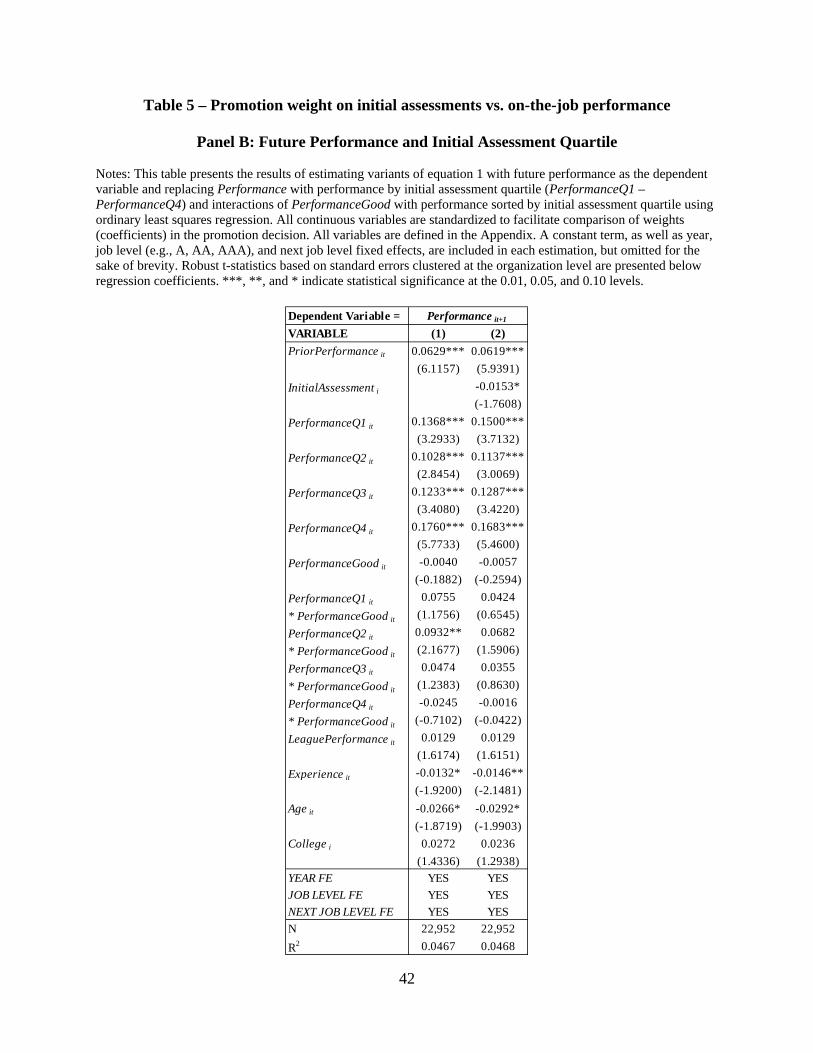
42
Table 5 – Promotion weight on initial assessments vs. on-the-job performance
Panel B: Future Performance and Initial Assessment Quartile Notes: This table presents the results of estimating variants of equation 1 with future performance as the dependent variable and replacing Performance with performance by initial assessment quartile (PerformanceQ1 – PerformanceQ4) and interactions of PerformanceGood with performance sorted by initial assessment quartile using ordinary least squares regression. All continuous variables are standardized to facilitate comparison of weights (coefficients) in the promotion decision. All variables are defined in the Appendix. A constant term, as well as year, job level (e.g., A, AA, AAA), and next job level fixed effects, are included in each estimation, but omitted for the sake of brevity. Robust t-statistics based on standard errors clustered at the organization level are presented below regression coefficients. ***, **, and * indicate statistical significance at the 0.01, 0.05, and 0.10 levels.
Dependent Variable = VARIABLE (1) (2)PriorPerformance it 0.0629*** 0.0619***
(6.1157) (5.9391)InitialAssessment i -0.0153*
(-1.7608)PerformanceQ1 it 0.1368*** 0.1500***
(3.2933) (3.7132)PerformanceQ2 it 0.1028*** 0.1137***
(2.8454) (3.0069)PerformanceQ3 it 0.1233*** 0.1287***
(3.4080) (3.4220)PerformanceQ4 it 0.1760*** 0.1683***
(5.7733) (5.4600)PerformanceGood it -0.0040 -0.0057
(-0.1882) (-0.2594)PerformanceQ1 it 0.0755 0.0424* PerformanceGood it (1.1756) (0.6545)PerformanceQ2 it 0.0932** 0.0682* PerformanceGood it (2.1677) (1.5906)PerformanceQ3 it 0.0474 0.0355* PerformanceGood it (1.2383) (0.8630)PerformanceQ4 it -0.0245 -0.0016* PerformanceGood it (-0.7102) (-0.0422)LeaguePerformance it 0.0129 0.0129
(1.6174) (1.6151)Experience it -0.0132* -0.0146**
(-1.9200) (-2.1481)Age it -0.0266* -0.0292*
(-1.8719) (-1.9903)College i 0.0272 0.0236
(1.4336) (1.2938)YEAR FE YES YESJOB LEVEL FE YES YESNEXT JOB LEVEL FE YES YESN 22,952 22,952R2 0.0467 0.0468
Performance it+1
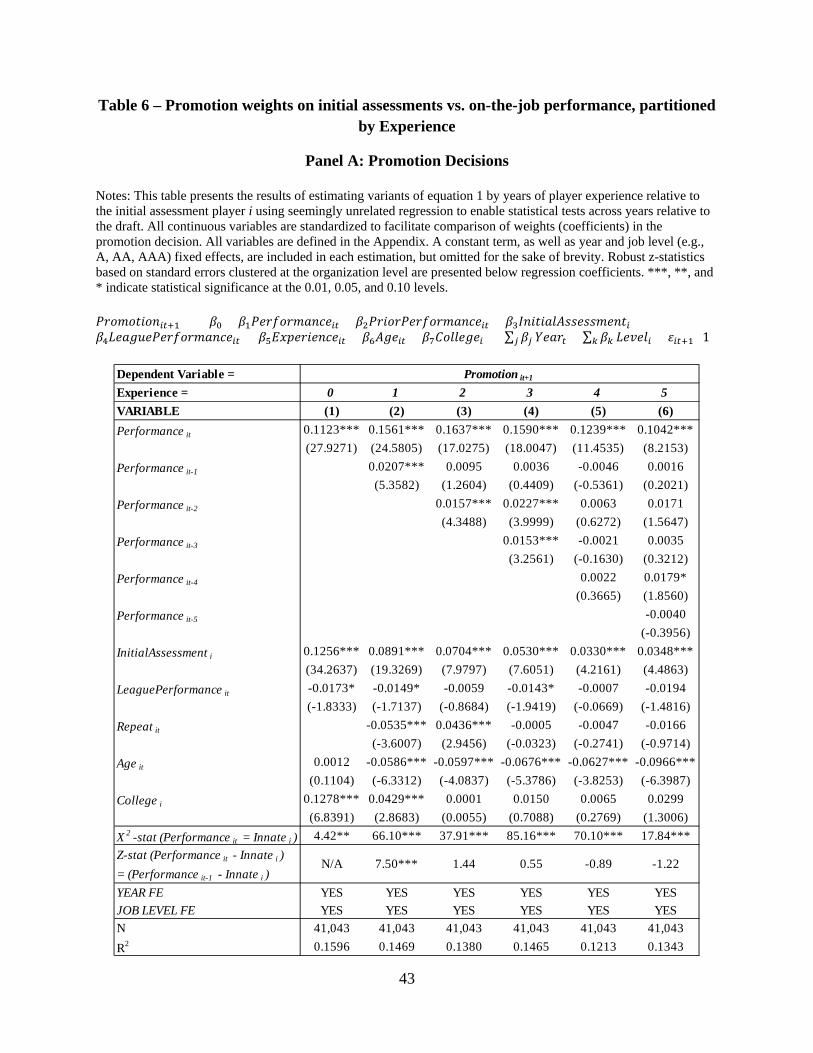
43
Table 6 – Promotion weights on initial assessments vs. on-the-job performance, partitioned by Experience
Panel A: Promotion Decisions
Notes: This table presents the results of estimating variants of equation 1 by years of player experience relative to the initial assessment player i using seemingly unrelated regression to enable statistical tests across years relative to the draft. All continuous variables are standardized to facilitate comparison of weights (coefficients) in the promotion decision. All variables are defined in the Appendix. A constant term, as well as year and job level (e.g., A, AA, AAA) fixed effects, are included in each estimation, but omitted for the sake of brevity. Robust z-statistics based on standard errors clustered at the organization level are presented below regression coefficients. ***, **, and * indicate statistical significance at the 0.01, 0.05, and 0.10 levels.
𝑃𝑃𝑃𝑃𝑃𝑃𝑃𝑃𝑃𝑖𝑖+1 = 𝛽0 + 𝛽1𝑃𝑃𝑃𝑃𝑃𝑃𝑃𝑃𝑃𝑃𝑃𝑖𝑖 + 𝛽2𝑃𝑃𝑃𝑃𝑃𝑃𝑃𝑃𝑃𝑃𝑃𝑃𝑃𝑃𝑃𝑃𝑖𝑖 + 𝛽3𝐼𝑃𝑃𝑃𝑃𝑃𝐼𝐼𝐼𝐼𝑃𝐼𝐼𝑃𝑃𝑃𝑃𝑖 +𝛽4𝐿𝑃𝑃𝐴𝐿𝑃𝑃𝑃𝑃𝑃𝑃𝑃𝑃𝑃𝑃𝑃𝑃𝑖𝑖 + 𝛽5𝐸𝐸𝐸𝑃𝑃𝑃𝑃𝑃𝑃𝑃𝑖𝑖 + 𝛽6𝐼𝐴𝑃𝑖𝑖 + 𝛽7𝐶𝑃𝐼𝐼𝑃𝐴𝑃𝑖 + ∑ 𝛽𝑗𝑗 𝑌𝑃𝑃𝑃𝑖 + ∑ 𝛽𝑘𝑘 𝐿𝑃𝐿𝑃𝐼𝑖 + 𝜀𝑖𝑖+1 (1)
Dependent Variable = Experience = 0 1 2 3 4 5VARIABLE (1) (2) (3) (4) (5) (6)Performance it 0.1123*** 0.1561*** 0.1637*** 0.1590*** 0.1239*** 0.1042***
(27.9271) (24.5805) (17.0275) (18.0047) (11.4535) (8.2153)Performance it-1 0.0207*** 0.0095 0.0036 -0.0046 0.0016
(5.3582) (1.2604) (0.4409) (-0.5361) (0.2021)Performance it-2 0.0157*** 0.0227*** 0.0063 0.0171
(4.3488) (3.9999) (0.6272) (1.5647)Performance it-3 0.0153*** -0.0021 0.0035
(3.2561) (-0.1630) (0.3212)Performance it-4 0.0022 0.0179*
(0.3665) (1.8560)Performance it-5 -0.0040
(-0.3956)InitialAssessment i 0.1256*** 0.0891*** 0.0704*** 0.0530*** 0.0330*** 0.0348***
(34.2637) (19.3269) (7.9797) (7.6051) (4.2161) (4.4863)LeaguePerformance it -0.0173* -0.0149* -0.0059 -0.0143* -0.0007 -0.0194
(-1.8333) (-1.7137) (-0.8684) (-1.9419) (-0.0669) (-1.4816)Repeat it -0.0535*** 0.0436*** -0.0005 -0.0047 -0.0166
(-3.6007) (2.9456) (-0.0323) (-0.2741) (-0.9714)Age it 0.0012 -0.0586*** -0.0597*** -0.0676*** -0.0627*** -0.0966***
(0.1104) (-6.3312) (-4.0837) (-5.3786) (-3.8253) (-6.3987)College i 0.1278*** 0.0429*** 0.0001 0.0150 0.0065 0.0299
(6.8391) (2.8683) (0.0055) (0.7088) (0.2769) (1.3006)X 2 -stat (Performance it = Innate i ) 4.42** 66.10*** 37.91*** 85.16*** 70.10*** 17.84***Z-stat (Performance it - Innate i ) = (Performance it-1 - Innate i )YEAR FE YES YES YES YES YES YESJOB LEVEL FE YES YES YES YES YES YESN 41,043 41,043 41,043 41,043 41,043 41,043R2 0.1596 0.1469 0.1380 0.1465 0.1213 0.1343
Promotion it+1
N/A 7.50*** 1.44 0.55 -1.22-0.89
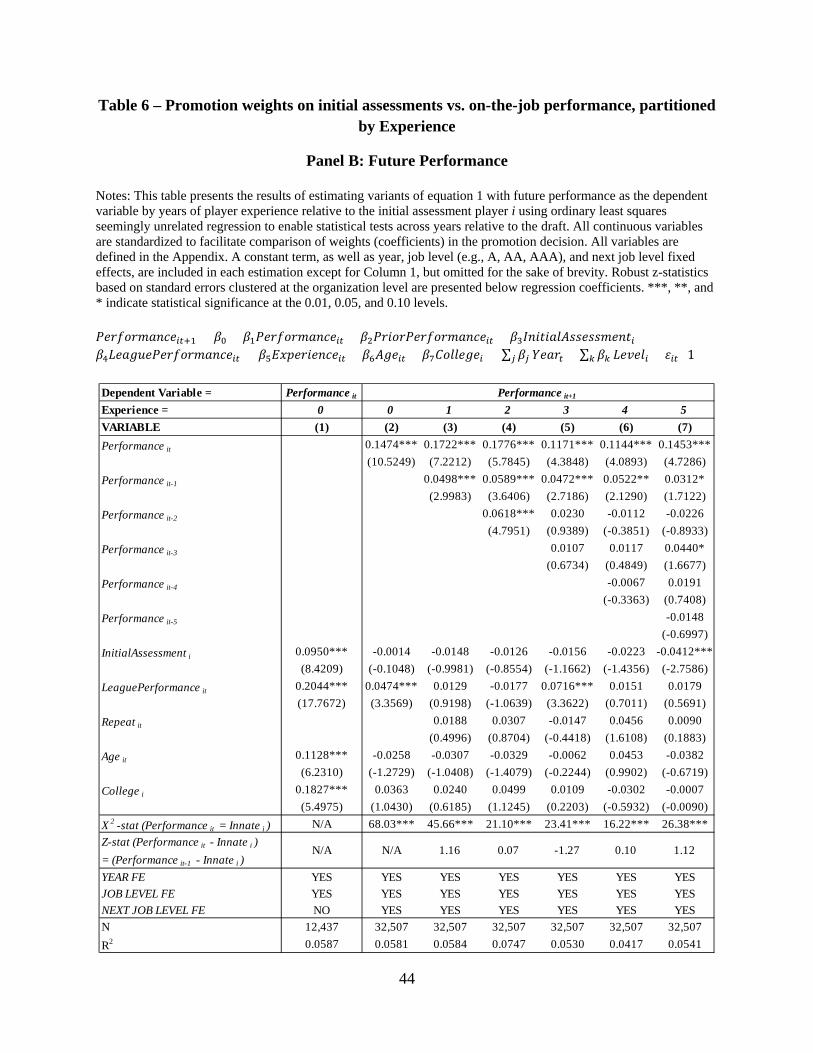
44
Table 6 – Promotion weights on initial assessments vs. on-the-job performance, partitioned by Experience
Panel B: Future Performance
Notes: This table presents the results of estimating variants of equation 1 with future performance as the dependent variable by years of player experience relative to the initial assessment player i using ordinary least squares seemingly unrelated regression to enable statistical tests across years relative to the draft. All continuous variables are standardized to facilitate comparison of weights (coefficients) in the promotion decision. All variables are defined in the Appendix. A constant term, as well as year, job level (e.g., A, AA, AAA), and next job level fixed effects, are included in each estimation except for Column 1, but omitted for the sake of brevity. Robust z-statistics based on standard errors clustered at the organization level are presented below regression coefficients. ***, **, and * indicate statistical significance at the 0.01, 0.05, and 0.10 levels.
𝑃𝑃𝑃𝑃𝑃𝑃𝑃𝑃𝑃𝑃𝑃𝑖𝑖+1 = 𝛽0 + 𝛽1𝑃𝑃𝑃𝑃𝑃𝑃𝑃𝑃𝑃𝑃𝑃𝑖𝑖 + 𝛽2𝑃𝑃𝑃𝑃𝑃𝑃𝑃𝑃𝑃𝑃𝑃𝑃𝑃𝑃𝑃𝑃𝑖𝑖 + 𝛽3𝐼𝑃𝑃𝑃𝑃𝑃𝐼𝐼𝐼𝐼𝑃𝐼𝐼𝑃𝑃𝑃𝑃𝑖 +𝛽4𝐿𝑃𝑃𝐴𝐿𝑃𝑃𝑃𝑃𝑃𝑃𝑃𝑃𝑃𝑃𝑃𝑃𝑖𝑖 + 𝛽5𝐸𝐸𝐸𝑃𝑃𝑃𝑃𝑃𝑃𝑃𝑖𝑖 + 𝛽6𝐼𝐴𝑃𝑖𝑖 + 𝛽7𝐶𝑃𝐼𝐼𝑃𝐴𝑃𝑖 + ∑ 𝛽𝑗𝑗 𝑌𝑃𝑃𝑃𝑖 + ∑ 𝛽𝑘𝑘 𝐿𝑃𝐿𝑃𝐼𝑖 + 𝜀𝑖𝑖 (1)
Dependent Variable = Performance it
Experience = 0 0 1 2 3 4 5VARIABLE (1) (2) (3) (4) (5) (6) (7)Performance it 0.1474*** 0.1722*** 0.1776*** 0.1171*** 0.1144*** 0.1453***
(10.5249) (7.2212) (5.7845) (4.3848) (4.0893) (4.7286)Performance it-1 0.0498*** 0.0589*** 0.0472*** 0.0522** 0.0312*
(2.9983) (3.6406) (2.7186) (2.1290) (1.7122)Performance it-2 0.0618*** 0.0230 -0.0112 -0.0226
(4.7951) (0.9389) (-0.3851) (-0.8933)Performance it-3 0.0107 0.0117 0.0440*
(0.6734) (0.4849) (1.6677)Performance it-4 -0.0067 0.0191
(-0.3363) (0.7408)Performance it-5 -0.0148
(-0.6997)InitialAssessment i 0.0950*** -0.0014 -0.0148 -0.0126 -0.0156 -0.0223 -0.0412***
(8.4209) (-0.1048) (-0.9981) (-0.8554) (-1.1662) (-1.4356) (-2.7586)LeaguePerformance it 0.2044*** 0.0474*** 0.0129 -0.0177 0.0716*** 0.0151 0.0179
(17.7672) (3.3569) (0.9198) (-1.0639) (3.3622) (0.7011) (0.5691)Repeat it 0.0188 0.0307 -0.0147 0.0456 0.0090
(0.4996) (0.8704) (-0.4418) (1.6108) (0.1883)Age it 0.1128*** -0.0258 -0.0307 -0.0329 -0.0062 0.0453 -0.0382
(6.2310) (-1.2729) (-1.0408) (-1.4079) (-0.2244) (0.9902) (-0.6719)College i 0.1827*** 0.0363 0.0240 0.0499 0.0109 -0.0302 -0.0007
(5.4975) (1.0430) (0.6185) (1.1245) (0.2203) (-0.5932) (-0.0090)X 2 -stat (Performance it = Innate i ) N/A 68.03*** 45.66*** 21.10*** 23.41*** 16.22*** 26.38***Z-stat (Performance it - Innate i ) = (Performance it-1 - Innate i )YEAR FE YES YES YES YES YES YES YESJOB LEVEL FE YES YES YES YES YES YES YESNEXT JOB LEVEL FE NO YES YES YES YES YES YESN 12,437 32,507 32,507 32,507 32,507 32,507 32,507R2 0.0587 0.0581 0.0584 0.0747 0.0530 0.0417 0.0541
Performance it+1
0.10 1.12N/A N/A 1.16 0.07 -1.27
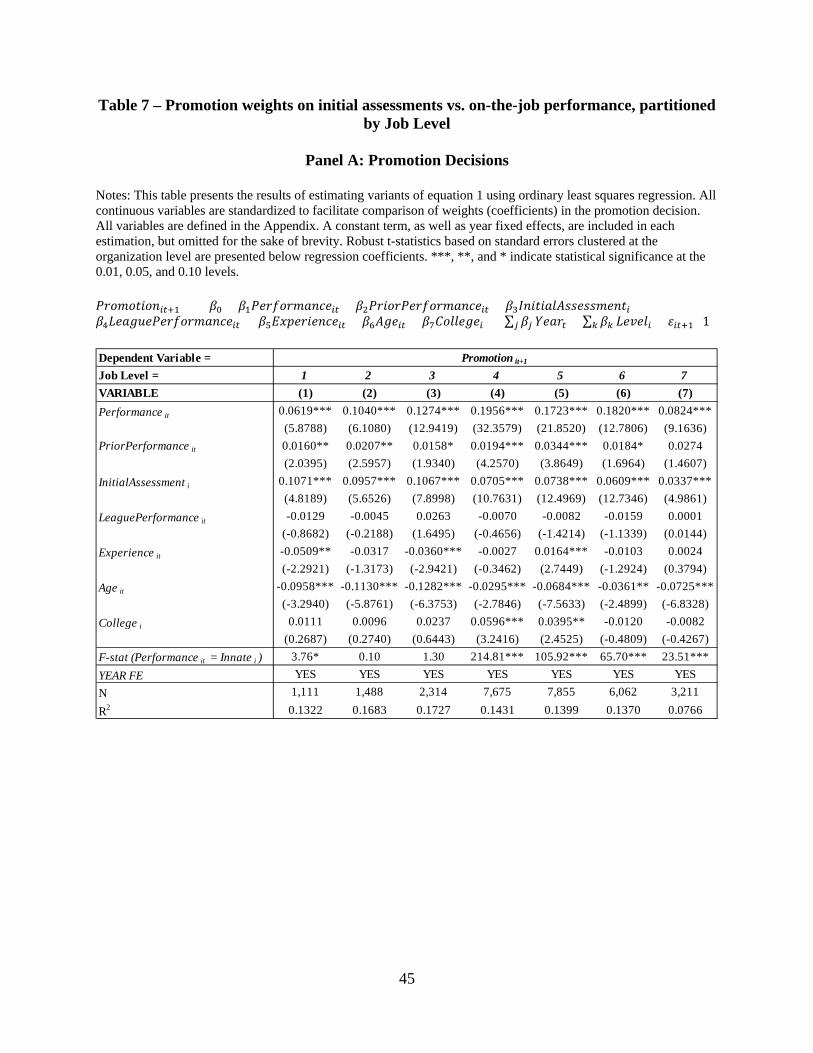
45
Table 7 – Promotion weights on initial assessments vs. on-the-job performance, partitioned by Job Level
Panel A: Promotion Decisions
Notes: This table presents the results of estimating variants of equation 1 using ordinary least squares regression. All continuous variables are standardized to facilitate comparison of weights (coefficients) in the promotion decision. All variables are defined in the Appendix. A constant term, as well as year fixed effects, are included in each estimation, but omitted for the sake of brevity. Robust t-statistics based on standard errors clustered at the organization level are presented below regression coefficients. ***, **, and * indicate statistical significance at the 0.01, 0.05, and 0.10 levels. 𝑃𝑃𝑃𝑃𝑃𝑃𝑃𝑃𝑃𝑖𝑖+1 = 𝛽0 + 𝛽1𝑃𝑃𝑃𝑃𝑃𝑃𝑃𝑃𝑃𝑃𝑃𝑖𝑖 + 𝛽2𝑃𝑃𝑃𝑃𝑃𝑃𝑃𝑃𝑃𝑃𝑃𝑃𝑃𝑃𝑃𝑃𝑖𝑖 + 𝛽3𝐼𝑃𝑃𝑃𝑃𝑃𝐼𝐼𝐼𝐼𝑃𝐼𝐼𝑃𝑃𝑃𝑃𝑖 +𝛽4𝐿𝑃𝑃𝐴𝐿𝑃𝑃𝑃𝑃𝑃𝑃𝑃𝑃𝑃𝑃𝑃𝑃𝑖𝑖 + 𝛽5𝐸𝐸𝐸𝑃𝑃𝑃𝑃𝑃𝑃𝑃𝑖𝑖 + 𝛽6𝐼𝐴𝑃𝑖𝑖 + 𝛽7𝐶𝑃𝐼𝐼𝑃𝐴𝑃𝑖 + ∑ 𝛽𝑗𝑗 𝑌𝑃𝑃𝑃𝑖 + ∑ 𝛽𝑘𝑘 𝐿𝑃𝐿𝑃𝐼𝑖 + 𝜀𝑖𝑖+1 (1)
Dependent Variable = Job Level = 1 2 3 4 5 6 7VARIABLE (1) (2) (3) (4) (5) (6) (7)Performance it 0.0619*** 0.1040*** 0.1274*** 0.1956*** 0.1723*** 0.1820*** 0.0824***
(5.8788) (6.1080) (12.9419) (32.3579) (21.8520) (12.7806) (9.1636)PriorPerformance it 0.0160** 0.0207** 0.0158* 0.0194*** 0.0344*** 0.0184* 0.0274
(2.0395) (2.5957) (1.9340) (4.2570) (3.8649) (1.6964) (1.4607)InitialAssessment i 0.1071*** 0.0957*** 0.1067*** 0.0705*** 0.0738*** 0.0609*** 0.0337***
(4.8189) (5.6526) (7.8998) (10.7631) (12.4969) (12.7346) (4.9861)LeaguePerformance it -0.0129 -0.0045 0.0263 -0.0070 -0.0082 -0.0159 0.0001
(-0.8682) (-0.2188) (1.6495) (-0.4656) (-1.4214) (-1.1339) (0.0144)Experience it -0.0509** -0.0317 -0.0360*** -0.0027 0.0164*** -0.0103 0.0024
(-2.2921) (-1.3173) (-2.9421) (-0.3462) (2.7449) (-1.2924) (0.3794)Age it -0.0958*** -0.1130*** -0.1282*** -0.0295*** -0.0684*** -0.0361** -0.0725***
(-3.2940) (-5.8761) (-6.3753) (-2.7846) (-7.5633) (-2.4899) (-6.8328)College i 0.0111 0.0096 0.0237 0.0596*** 0.0395** -0.0120 -0.0082
(0.2687) (0.2740) (0.6443) (3.2416) (2.4525) (-0.4809) (-0.4267)F-stat (Performance it = Innate i ) 3.76* 0.10 1.30 214.81*** 105.92*** 65.70*** 23.51***YEAR FE YES YES YES YES YES YES YESN 1,111 1,488 2,314 7,675 7,855 6,062 3,211
R2 0.1322 0.1683 0.1727 0.1431 0.1399 0.1370 0.0766
Promotion it+1
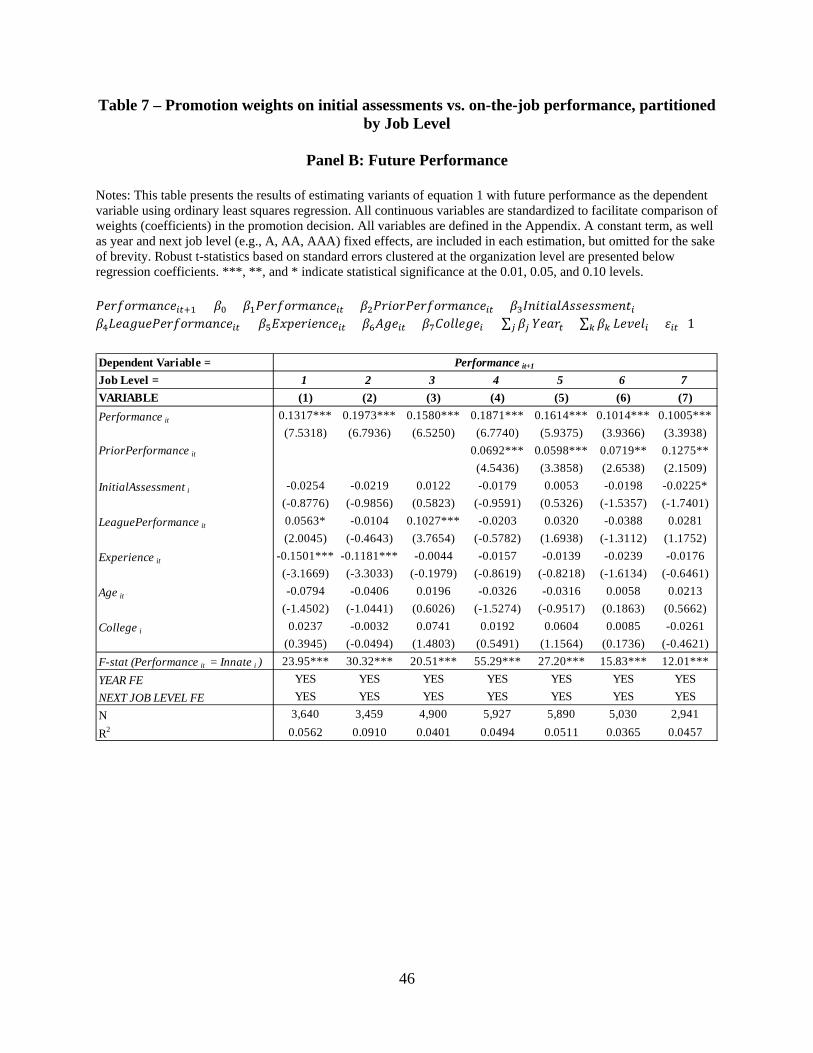
46
Table 7 – Promotion weights on initial assessments vs. on-the-job performance, partitioned by Job Level
Panel B: Future Performance
Notes: This table presents the results of estimating variants of equation 1 with future performance as the dependent variable using ordinary least squares regression. All continuous variables are standardized to facilitate comparison of weights (coefficients) in the promotion decision. All variables are defined in the Appendix. A constant term, as well as year and next job level (e.g., A, AA, AAA) fixed effects, are included in each estimation, but omitted for the sake of brevity. Robust t-statistics based on standard errors clustered at the organization level are presented below regression coefficients. ***, **, and * indicate statistical significance at the 0.01, 0.05, and 0.10 levels. 𝑃𝑃𝑃𝑃𝑃𝑃𝑃𝑃𝑃𝑃𝑃𝑖𝑖+1 = 𝛽0 + 𝛽1𝑃𝑃𝑃𝑃𝑃𝑃𝑃𝑃𝑃𝑃𝑃𝑖𝑖 + 𝛽2𝑃𝑃𝑃𝑃𝑃𝑃𝑃𝑃𝑃𝑃𝑃𝑃𝑃𝑃𝑃𝑃𝑖𝑖 + 𝛽3𝐼𝑃𝑃𝑃𝑃𝑃𝐼𝐼𝐼𝐼𝑃𝐼𝐼𝑃𝑃𝑃𝑃𝑖 +𝛽4𝐿𝑃𝑃𝐴𝐿𝑃𝑃𝑃𝑃𝑃𝑃𝑃𝑃𝑃𝑃𝑃𝑃𝑖𝑖 + 𝛽5𝐸𝐸𝐸𝑃𝑃𝑃𝑃𝑃𝑃𝑃𝑖𝑖 + 𝛽6𝐼𝐴𝑃𝑖𝑖 + 𝛽7𝐶𝑃𝐼𝐼𝑃𝐴𝑃𝑖 + ∑ 𝛽𝑗𝑗 𝑌𝑃𝑃𝑃𝑖 + ∑ 𝛽𝑘𝑘 𝐿𝑃𝐿𝑃𝐼𝑖 + 𝜀𝑖𝑖 (1)
Dependent Variable = Job Level = 1 2 3 4 5 6 7VARIABLE (1) (2) (3) (4) (5) (6) (7)Performance it 0.1317*** 0.1973*** 0.1580*** 0.1871*** 0.1614*** 0.1014*** 0.1005***
(7.5318) (6.7936) (6.5250) (6.7740) (5.9375) (3.9366) (3.3938)PriorPerformance it 0.0692*** 0.0598*** 0.0719** 0.1275**
(4.5436) (3.3858) (2.6538) (2.1509)InitialAssessment i -0.0254 -0.0219 0.0122 -0.0179 0.0053 -0.0198 -0.0225*
(-0.8776) (-0.9856) (0.5823) (-0.9591) (0.5326) (-1.5357) (-1.7401)LeaguePerformance it 0.0563* -0.0104 0.1027*** -0.0203 0.0320 -0.0388 0.0281
(2.0045) (-0.4643) (3.7654) (-0.5782) (1.6938) (-1.3112) (1.1752)Experience it -0.1501*** -0.1181*** -0.0044 -0.0157 -0.0139 -0.0239 -0.0176
(-3.1669) (-3.3033) (-0.1979) (-0.8619) (-0.8218) (-1.6134) (-0.6461)Age it -0.0794 -0.0406 0.0196 -0.0326 -0.0316 0.0058 0.0213
(-1.4502) (-1.0441) (0.6026) (-1.5274) (-0.9517) (0.1863) (0.5662)College i 0.0237 -0.0032 0.0741 0.0192 0.0604 0.0085 -0.0261
(0.3945) (-0.0494) (1.4803) (0.5491) (1.1564) (0.1736) (-0.4621)F-stat (Performance it = Innate i ) 23.95*** 30.32*** 20.51*** 55.29*** 27.20*** 15.83*** 12.01***YEAR FE YES YES YES YES YES YES YESNEXT JOB LEVEL FE YES YES YES YES YES YES YESN 3,640 3,459 4,900 5,927 5,890 5,030 2,941
R2 0.0562 0.0910 0.0401 0.0494 0.0511 0.0365 0.0457
Performance it+1