Do California’s Enterprise Zones Create Jobs? · PDF file ·...
32
www.ppic.org Do California’s Enterprise Zones Create Jobs? Jed Kolko ● David Neumark with research support from Jennifer Graves, Marisol Cuellar-Mejia, Ingrid Lefebvre-Hoang, Davin Reed, and Smith Williams SUMMARY C alifornia’s enterprise zone program was established in 1986 to spur the creation of busi- nesses in economically distressed areas and to create job opportunities for economically disadvantaged workers. It is the state’s largest economic development program, offer- ing tax credits and other incentives to businesses in 42 designated zones throughout the state. Yet, after more than 20 years, the program’s effects are still unclear. Little is required of the state or its local zones in the way of evaluation, and previous research studies of the program’s effects have had methodological problems, yielding suspect results. In this report, we assess the degree to which the program has met its most important goal: creating employment. We use a unique set of data and methods to measure employ- ment in enterprise zones in each year from 1992 through 2004, construct appropriate control groups for comparison, and estimate the effect of the program on employment. Our main finding is that, on average, enterprise zones have no effect on business creation or job growth. However, our report also includes several findings and recommendations that may be useful in making enterprise zones more effective. We found that the program’s effectiveness differs across zones, appearing to have a more favorable effect on job creation in zones with smaller employment shares in manufacturing and in zones where the administrators report greater marketing and outreach activity. We encourage a more critical evaluation of the program overall and of its effects in individual zones, using both our metric—employment—and others, such as poverty, unemployment, CORBIS/ANDREW BROWN
Transcript of Do California’s Enterprise Zones Create Jobs? · PDF file ·...

www.ppic.org
Do California’s Enterprise Zones Create Jobs?
Jed Kolko ● David Neumark
with research support from Jennifer Graves, Marisol Cuellar-Mejia, Ingrid Lefebvre-Hoang, Davin Reed, and Smith Williams
S u m m a r y
California’s enterprise zone program was established in 1986 to spur the creation of busi-
nesses in economically distressed areas and to create job opportunities for economically
disadvantaged workers. It is the state’s largest economic development program, offer-
ing tax credits and other incentives to businesses in 42 designated zones throughout the
state. Yet, after more than 20 years, the program’s effects are still unclear. Little is required
of the state or its local zones in the way of evaluation, and previous research studies of the
program’s effects have had methodological problems, yielding suspect results.
In this report, we assess the degree to which the program has met its most important
goal: creating employment. We use a unique set of data and methods to measure employ-
ment in enterprise zones in each year from 1992 through 2004, construct appropriate control
groups for comparison, and estimate the effect of the program on employment.
Our main finding is that, on average, enterprise zones have no effect on business creation
or job growth. However, our report also includes several findings and recommendations that
may be useful in making enterprise zones more effective.
We found that the program’s effectiveness differs across zones, appearing to have a more
favorable effect on job creation in zones with smaller employment shares in manufacturing
and in zones where the administrators report greater marketing and outreach activity.
We encourage a more critical evaluation of the program overall and of its effects in individual
zones, using both our metric—employment—and others, such as poverty, unemployment,
CoRbIS/AnDReW bRoWn

Do California’s Enterprise Zones Create Jobs?2
www.ppic.org
and property values. The state should evaluate individual zone success with consistent evalu-
ation metrics; this is an essential step for judging which factors make some zones more effec-
tive than others.
To increase the overall effectiveness of the program, zone selection should consider the
characteristics that we have identified that may lead to more effective zones, zone admin-
istrators should be encouraged to engage in the activities that make zones more effective,
and continuing evaluations should pay more attention to factors associated with success at
creating jobs.
Two relatively small changes would benefit future evaluation and administration of the
program. The first would be to require that local zone administrators and applicants create
digitized maps of their zones using geographic information system (GIS) software. GIS maps
can be read with standard mapping software and overlaid with data from the U.S. Census,
the National Establishment Time-Series (NETS), and other sources. The second change would
be to require that enterprise zones follow Census tract boundaries. This would make it easier
to analyze and control for demographic and other characteristics when selecting new zones
or evaluating existing ones. These two recommended changes would help the California
Department of Housing and Community Development (HCD) in its zone selection and evalu-
ation process and enable local administrators to work more effectively with businesses in
visualizing and marketing the zone.
The full report and related resources are available on the report’s publication page:
www.ppic.org/main/publication.asp?i=742.

3Do California’s Enterprise Zones Create Jobs?
www.ppic.org
3
Introduction
California’s enterprise zone program represents the state’s primary policy effort to encourage local economic devel-opment. However, there is considerable debate on the program’s effects on job creation and employment and on whether restructuring the program might enhance its effectiveness.1 The California Franchise Tax Board (2006) estimates the cost in terms of forgone tax revenue as $333 million in fiscal year 2005.2 However, in a period of severe fiscal difficulties, even relatively modest programs bear scrutiny. In April 2008, the Legislative Analyst’s Office (LAO) recommended scaling back the enterprise zone program to raise revenue, citing the program’s uncer-tain economic benefits (LAO, 2008). On the other hand, in late 2008, the California Association for Local Economic Development (CALED) proposed expanding the program to help stimulate the state’s economy; implicit in this rec-ommendation is a belief that the program helps create jobs (CALED, undated).3 Clearly there is little agreement on the program’s value.
In this report we answer the following questions: Does the enterprise zone program affect employment? If so, does the program affect employment more in certain types of businesses, such as manufacturing? How do program effects vary across zones? What factors influence the effect of enterprise zones on employment, and what does this mean for program design?
California’s enterprise zone program has several goals: attracting jobs and businesses and increasing local employ-ment is one goal; improving welfare by lowering poverty and unemployment and raising incomes is another.4 In recent years, an increasingly important additional goal has been strengthening the institutional capacity of local economic development agencies. In this report, we focus only on the goal of increasing employment. Although it is difficult to see how the program could achieve its other goals, such as reducing poverty, without creating jobs, we stress that we are directly evaluating only one aspect of the program. Thus, our findings must be weighed against other
research on the administration, design, costs, and effects of the program to arrive at a broader judgment of the program’s success. Nonetheless, the effect of the enterprise zone program on job creation strikes us as the most impor-tant criterion for evaluating the program. In addition, our results have implications for the program’s design, which
may prove informative in thinking about how to improve it. Other states and countries have similar programs and, although their details differ, lessons from California’s enterprise zone program will improve our general under-standing of the effects of geographically targeted economic development programs.
The most important criterion for evaluating the enterprise zones program is its effect on job creation.
CoRbIS
California’s enterprise zone program has several goals: attracting jobs and businesses and increasing local employment is one goal; improving welfare by lowering poverty and
unemployment and raising incomes is another.

Do California’s Enterprise Zones Create Jobs?4
www.ppic.org
4
In conducting our analysis, we use the NETS database, which provides employment and exact location data for nearly all business establishments in California from 1992 to 2004. We also construct a precise geographic database of existing enterprise zones—a complex exercise that we believe represents a significant improvement in the mea-surement of areas affected by the policy. These databases, combined with our spatial and statistical methods, allow us to overcome important limitations of previous research on the effects of enterprise zone programs.
We also conducted interviews with local administra-tors of the enterprise zone program. In these interviews, we asked about the goals of the program, the activities of local zone administrators, and the main challenges they face, among other questions. We use their responses to supplement the business establishment data in the NETS to assess whether local zone activities influence the effect of the program on jobs.
In the following pages, we describe California’s enter-prise zone program, including its goals and incentives. We also describe the 42 enterprise zones in California and their selection process. We then explain our approach and present our results. In particular, we describe the extensive process of mapping enterprise zones and estimating the program’s effectiveness. Finally, we discuss our findings and present our conclusions. We provide more extensive details and methodological explanations in a series of technical appendices, which we refer to throughout the text and which are available on the PPIC website.
Program Goals and Incentives
The goals of the enterprise zone program are to increase employment and incomes and to reduce unemployment and poverty. These multiple goals—job creation and improv-ing households’ economic circumstances—stem from the 1996 merger of two precursor programs that gave rise to the current enterprise zone program. These were the Enter-prise Zone Act, which provided incentives to businesses in specific areas (and which led to the creation of the original
enterprise zones), and the Employment and Economic Incentive Act, which provided incentives to businesses that hired employees living in distressed residential areas.5
In this report we focus on the creation of jobs, for two reasons.6 First, job creation is arguably a prerequisite for the second goal, improving residents’ circumstances. Second, in our survey of local zone managers, described below, nearly all respondents cited job or business creation when we asked about the purpose of the enterprise zone program; far fewer cited improving residents’ welfare.
The program seeks to accomplish its goals by provid-ing a variety of tax incentives to businesses in designated areas to encourage the hiring of economically disadvan-taged workers and to spur the creation of businesses. Businesses in enterprise zones may claim a tax credit of up to 50 percent of a new “disadvantaged” employee’s annual wages (up to 150% of the minimum wage) in the first year in which they are employed, 40 percent in the second year, and so on down to 10 percent in the fifth year. Workers qualify as “disadvantaged” if they are unemployed for a sufficient duration, or for certain other reasons—for example, if they have sufficiently low income, if they belong to one of several “eligibility groups” (veteran, enrolled in welfare-to-work, etc.), or if they live in a “targeted employ-ment area (TEA).”7 This hiring tax credit—worth up to $36,000 per qualified worker over the five-year period— is the largest incentive that the enterprise zone program offers. This incentive is clearly intended to encourage busi-nesses in enterprise zones to hire economically disadvan-taged workers. Moreover, this credit reduces the cost of hir-ing labor and hence ought to increase overall employment.
The program offers four other incentives: (1) an income tax credit for sales or use taxes for machinery or parts used within the zone, (2) a longer period (15 years versus 10 years) in which businesses can carry forward net operating losses into future years to reduce tax liabilities, (3) accelerated depreciation of depreciable property, and (4) a tax credit that low-income employees may claim, up to a maximum and subject to restrictions on work for the business in the zone and services performed within the zone.8 Each of these incentives is intended to reduce the tax burden or

5Do California’s Enterprise Zones Create Jobs?
www.ppic.org
5
cost of doing business in enterprise zones, which might be expected to spur the creation of new businesses or the expansion of existing ones. In addition, businesses in enterprise zones can sometimes receive preferential treat-ment on state contracts.9 And financial lenders may deduct from their income the net interest received from loans made to businesses in enterprise zones.
Description of Zones
The enterprise zone program allows for up to 42 zones in the state. HCD can conduct an application process when the number of zones falls below the maximum, whether as a result of zones expiring or being de-designated or because the legislature increases the maximum number of zones. Ten enterprise zones were created at the program’s inception in 1986; since then, legislation has increased the number to 42. Zones are designated for an initial 15-year term, after which five-year extensions can be granted. After the 15- or 20-year period, the enterprise zone expires and a new application must be submitted.
As noted above, 42 enterprise zones had been des-ignated as of the end of our sample period, although we could not obtain the information on all of them that is required for our mapping and empirical analysis. Table 1 lists the zones for which we were able to obtain this infor-mation; the table notes list the zones not included in this study because the information was not available.10 The table also lists the year in which each zone was initially desig-nated (for those zones for which we have full information), and the number of times that the zone expanded.11
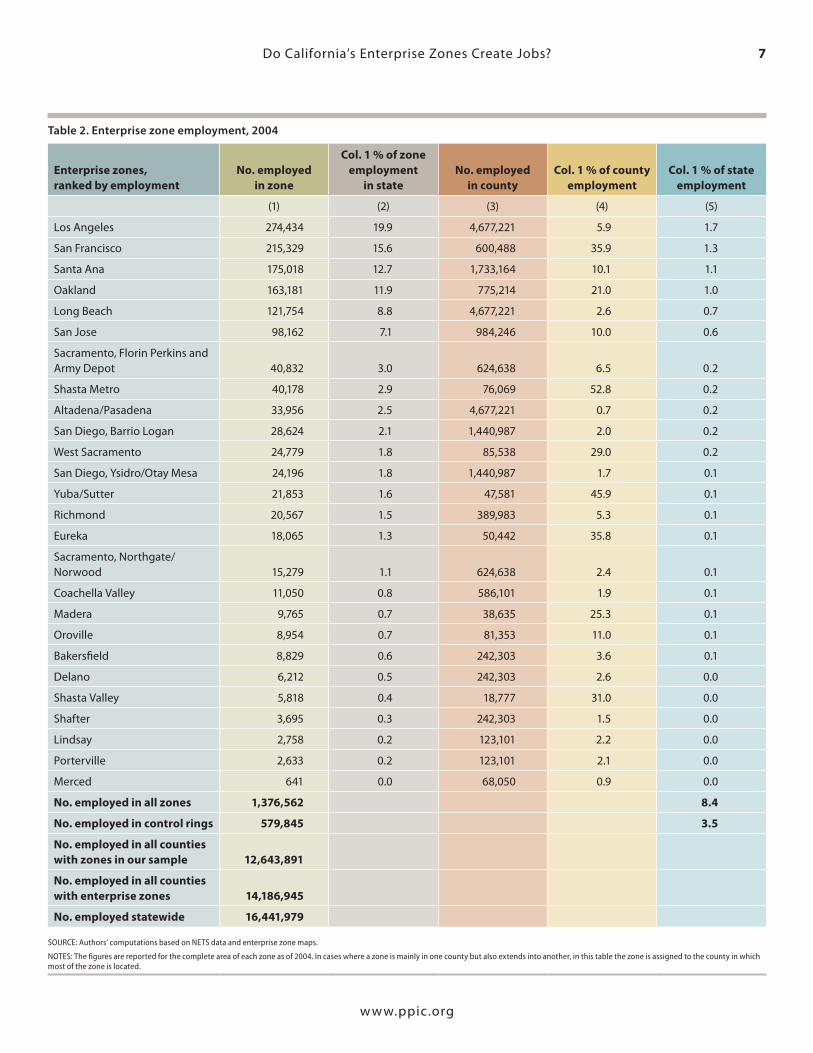
Tables 2 and 3 describe the size of each zone overall and relative to other standards; these tables include only zones for which we have full information. Table 2, col-umn 1, reports employment in each enterprise zone in our sample as of 2004. Column 2 reports the share of each zone in overall enterprise zone employment (that is, as a share of employment in the enterprise zones we study).
At the bottom of Table 2, we provide some additional information that is useful in thinking about the impor-
tance of enterprise zones and in thinking about our sample. Overall employment in the enterprise zones included in our study is about 1.38 million. Employment in the control rings used in our empirical analysis (extending 1,000 feet from the zone boundaries, as explained below) is about 580,000. Overall employment in the counties in which the zones we study are located is 12.6 million, so that enterprise zone employment represents about 11 percent of the total. Overall employment in all counties with enterprise zones—whether or not we could construct maps for those zones—was about 14.2 million. Thus, if we assume that the share of county employment represented by enterprise zones is the same in the counties for which we have the requisite information as for the counties for which we do not, then our enterprise zones represent 89 percent (12.6/14.2) of enterprise zone employment in the state.
Columns 3 to 5 provide information on enterprise zone employment relative to county and statewide employment.12 Measured enterprise zone employment represents 8.4 per-cent of statewide employment and, as noted above, about 11 percent of employment in the counties with zones. But these shares differ a good deal across counties. For example, the share of enterprise zone employment in county employ-ment differs from a high of 52.8 percent in Shasta Metro to a low of 0.7 percent in Altadena/Pasadena. Finally, column 5 indicates that the large zones (Los Angeles, San Francisco, Santa Ana, and Oakland) each account, on their own, for 1 percent or more of total statewide employment.
Table 3 reports similar information for establishments.13 For ease of comparison with Table 2, the enterprise zones are again ordered by 2004 employment; the order of zones by number of establishments is nearly the same. Over-all, the establishments in the enterprise zones we study account for 6.5 percent of the statewide total and 8.7 per-cent in the counties in which they are located.
The 42 zones in California’s enterprise zone program include a wide variety of places and local economies. The zones range from dense urban centers to rural areas. Some are in affluent counties, whereas others are in some of the state’s poorest counties. The industry composition of zones differs as well. Table 4 presents descriptive statistics for a

Do California’s Enterprise Zones Create Jobs?6
www.ppic.org
Designation year No. of zone expansions
Altadena/Pasadena 1992 1
Bakersfield 1986 3
Coachella Valleya 1992 2
Delano 1991 1
Eureka 1986 1
Lindsay 1997 0
Long Beach 1992 1
Los Angelesb ... 14
Los Angeles, Central City 1986
Los Angeles, East Side 1988
Los Angeles, Harbor Area 1989
Los Angeles, Mid-Alameda Corridor 1986
Los Angeles, Northeast Valley 1986
Madera 1989 0
Merced 1991 1
Oakland 1993 1
Oroville 1991 1
Porterville 1985 0
Richmond 1992 1
Sacramento, Florin Perkins and Army Depot 1989 2
Sacramento, Northgate/Norwood 1989 2
San Diego, Barrio Logan 1987 2
San Diego, Ysidro/Otay Mesa 1991 3
San Francisco 1992 4
San Jose 1986 1
Santa Ana 1993 1
Shafter 1995 0
Shasta Metro 1991 2
Shasta Valley 1993 0
West Sacramento 1988 0
Yuba/Sutter 1986 4
SOURCES: www.caez.org/Programs/Map_of_CA_Zones.html; street address changes are taken from street files, found in California Department of Housing and Community Development (undated-a); Assembly Jobs, Economic Development, and the Economy Committee (2006).
NOTES: In some cases, the sources listed above provided different start dates. In cases of such discrepancies, we checked with zone administrators to verify the start date. The zones not studied, and their designation years, are Agua Mansa (1986), Antelope Valley (1997), Calexico (1986), Fresno (1986), Kings County (1993), Pittsburg (1988), Stockton (1993), Watsonville (1997), Barstow (2005), Imperial Valley (2005), and Stanislaus (2005).aBecause the Coachella zone started in late 1991 (November 10), we use 1992 as the first year. bThe five Los Angeles zones are treated as one large zone for the analysis.
Table 1. California enterprise zones studied
7Do California’s Enterprise Zones Create Jobs?
www.ppic.org
Enterprise zones, ranked by employment
No. employed in zone
Col. 1 % of zone employment
in stateNo. employed
in county Col. 1 % of county
employmentCol. 1 % of state
employment
(1) (2) (3) (4) (5)
Los Angeles 274,434 19.9 4,677,221 5.9 1.7
San Francisco 215,329 15.6 600,488 35.9 1.3
Santa Ana 175,018 12.7 1,733,164 10.1 1.1
Oakland 163,181 11.9 775,214 21.0 1.0
Long Beach 121,754 8.8 4,677,221 2.6 0.7
San Jose 98,162 7.1 984,246 10.0 0.6
Sacramento, Florin Perkins and Army Depot 40,832 3.0 624,638 6.5 0.2
Shasta Metro 40,178 2.9 76,069 52.8 0.2
Altadena/Pasadena 33,956 2.5 4,677,221 0.7 0.2
San Diego, Barrio Logan 28,624 2.1 1,440,987 2.0 0.2
West Sacramento 24,779 1.8 85,538 29.0 0.2
San Diego, Ysidro/Otay Mesa 24,196 1.8 1,440,987 1.7 0.1
Yuba/Sutter 21,853 1.6 47,581 45.9 0.1
Richmond 20,567 1.5 389,983 5.3 0.1
Eureka 18,065 1.3 50,442 35.8 0.1
Sacramento, Northgate/Norwood 15,279 1.1 624,638 2.4 0.1
Coachella Valley 11,050 0.8 586,101 1.9 0.1
Madera 9,765 0.7 38,635 25.3 0.1
Oroville 8,954 0.7 81,353 11.0 0.1
Bakersfield 8,829 0.6 242,303 3.6 0.1
Delano 6,212 0.5 242,303 2.6 0.0
Shasta Valley 5,818 0.4 18,777 31.0 0.0
Shafter 3,695 0.3 242,303 1.5 0.0
Lindsay 2,758 0.2 123,101 2.2 0.0
Porterville 2,633 0.2 123,101 2.1 0.0
Merced 641 0.0 68,050 0.9 0.0
No. employed in all zones 1,376,562 8.4
No. employed in control rings 579,845 3.5
No. employed in all counties with zones in our sample 12,643,891
No. employed in all counties with enterprise zones 14,186,945
No. employed statewide 16,441,979
SOURCE: Authors’ computations based on NETS data and enterprise zone maps.
NOTES: The figures are reported for the complete area of each zone as of 2004. In cases where a zone is mainly in one county but also extends into another, in this table the zone is assigned to the county in which most of the zone is located.
Table 2. Enterprise zone employment, 2004

Do California’s Enterprise Zones Create Jobs?8
www.ppic.org
Enterprise zones, ranked by employment
No. of establishments
in zone
Col. 1 % of zone establishments
in state
No. of establishments
in county
Col. 1 % of establishments
in county
Col. 1 % of establishments
in state
(1) (2) (3) (4) (5)
Los Angeles 27,750 22.3 542,239 5.1 1.5
San Francisco 18,894 15.2 58,482 32.3 1.0
Santa Ana 13,341 10.7 201,444 6.6 0.7
Oakland 15,735 12.7 79,541 19.8 0.8
Long Beach 9,730 7.8 542,239 1.8 0.5
San Jose 8,571 6.9 95,321 9.0 0.4
Sacramento, Florin Perkins and Army Depot 2,795 2.2 62,598 4.5 0.1
Shasta Metro 4,157 3.3 10,643 39.1 0.2
Altadena/Pasadena 4,029 3.2 542,239 0.7 0.2
San Diego, Barrio Logan 2,261 1.8 168,061 1.3 0.1
West Sacramento 1,806 1.5 8,219 22.0 0.1
San Diego, Ysidro/Otay Mesa 2,543 2.0 168,061 1.5 0.1
Yuba/Sutter 2,140 1.7 6,065 35.3 0.1
Richmond 1,765 1.4 51,011 3.5 0.1
Eureka 1,831 1.5 6,736 27.2 0.1
Sacramento, Northgate/Norwood 1,013 0.8 62,598 1.6 0.1
Coachella Valley 1,204 1.0 73,996 1.6 0.1
Madera 834 0.7 4,952 16.8 0.0
Oroville 959 0.8 11,979 8.0 0.1
Bakersfield 570 0.5 27,900 2.0 0.0
Delano 733 0.6 27,900 2.6 0.0
Shasta Valley 671 0.5 3,331 20.1 0.0
Shafter 339 0.3 27,900 1.2 0.0
Lindsay 312 0.3 14,622 2.1 0.0
Porterville 184 0.1 14,622 1.3 0.0
Merced 122 0.1 7,218 1.7 0.0
No. of establishments in all zones 124,289 6.5
No. of establishments in control rings 58,069 3.0
No. of establishments in all counties with zones in our sample 1,434,358
No. of establishments in all counties with enterprise zones 1,614,114
No. of establishments statewide 1,912,173
SOURCE: Authors’ computations based on NETS data and enterprise zone maps.
NOTES: The figures are reported for the complete area of each zone as of 2004. In cases where a zone is mainly in one county but also extends into another, in this table the zone is assigned to the county in which most of the zone is located.
Table 3. Enterprise zone establishments, 2004

9Do California’s Enterprise Zones Create Jobs?
www.ppic.org
Enterprise zones, ranked by employment
No. employed in zone, 2004
No. employed per square mile
in zone, 1992
% employed in manufacturing,
1992
% employed in establishments
with < 50 employees, 1992
% with college degree in county,
1990
(1) (2) (3) (4) (5)
Los Angeles 274,434 5,062 28.8 40.4 22.3
San Francisco 215,329 22,813 9.2 44.2 35.0
Santa Ana 175,018 19,919 20.9 39.3 27.8
Oakland 163,181 5,854 12.9 41.7 28.8
Long Beach 121,754 8,285 11.2 46.9 22.3
San Jose 98,162 8,787 12.5 46.1 32.6
Sacramento, Florin Perkins and Army Depot 40,832 4,285 15.7 42.4 23.0
Shasta Metro 40,178 1,059 9.4 51.3 13.7
Altadena/Pasadena 33,956 8,744 10.4 44.8 22.3
San Diego, Barrio Logan 28,624 5,085 22.0 51.3 25.3
West Sacramento 24,779 1,673 11.1 46.9 30.3
San Diego, Ysidro/Otay Mesa 24,196 1,658 34.8 46.5 25.3
Yuba/Sutter 21,853 487 16.2 52.0 12.5
Richmond 20,567 3,561 17.4 47.3 31.6
Eureka 18,065 4,843 3.2 56.2 20.0
Sacramento, Northgate/Norwood 15,279 7,790 11.2 48.9 23.0
Coachella Valley 11,050 298 6.0 48.7 14.6
Madera 9,765 2,176 34.4 47.3 11.7
Oroville 8,954 1,006 11.3 48.8 19.5
Bakersfield 8,829 1,516 9.8 50.8 13.3
Delano 6,212 1,239 2.6 58.7 13.3
Shasta Valley 5,818 1,395 6.3 62.3 14.2
Shafter 3,695 786 3.6 73.4 13.3
Lindsay 2,758 1,331 21.0 55.1 11.8
Porterville 2,633 2,014 40.6 34.6 11.8
Merced 641 119 1.9 89.9 12.0
Total 1,376,562 5,052 14.8 50.6 20.4
SOURCE: Authors’ computations based on NETS data, enterprise zone maps, and the U.S. Census.
NOTES: The figures are reported for the complete area of each zone as of 2004. In cases where a zone is mainly in one county but also extends into another, in this table the zone is assigned to the county in which most of the zone is located.
Table 4. Descriptive information on enterprise zones

Do California’s Enterprise Zones Create Jobs?10
www.ppic.org
10
range of economic and demographic factors.14 As already noted, zones range in employment size from under 1,000 (Merced) to over 200,000 (San Francisco and Los Angeles). These larger zones do not necessarily cover more land area, so the density of employment per square mile differs consid-erably. Zones covering downtown areas, as in San Francisco and Santa Ana, show densities of well over 10,000 workers per square mile; at the other extreme, the Coachella Valley, Merced, Shafter, and Yuba/Sutter zones all have an employ-ment density of fewer than 1,000 workers per square mile.
The composition of employment differs, too. Manufac-turing accounts for more than one-third of employment in the Madera, Porterville, and San Diego Ysidro/Otay Mesa zones but less than 10 percent of employment in several zones. Nearly 90 percent of employees work in establish-ments with fewer than 50 employees in the Merced zone, whereas fewer than half of employees work in small estab-lishments in many zones, especially larger zones.
Finally, the demographics of the labor markets that enterprise zones draw from may vary. We are unable to measure the demographic characteristics of the residents of zones, since the NETS does not include such data. But this inability may not represent much of a limitation, because there is no reason to believe that enterprise zone employees are enterprise zone residents. As we noted above, many other groups—including, since 1997, all residents of other nearby areas of socioeconomic disadvantage (the TEAs)—are eligible for the hiring credit. In counties containing enterprise zones, the share of adults with college degrees in 1990 ranges from 35 percent in San Francisco County and 33 percent in Santa Clara County (which contains the San Jose zone) to 11.8 percent in Tulare (which contains the Lindsay and Porterville zones).15
Selection of Zones
Localities apply to HCD to have a geographic area desig-nated as an enterprise zone. The eligibility criteria include measures of residential income, unemployment, and pov-erty, as well as other indicators. New zones are selected by
HCD from the eligible areas based on these and other fac-tors, including the local applicant’s plan for bundling other local incentives, administering the program, and evaluating the outcome.16 In the 2006 application round, for instance, an area was eligible for consideration as an enterprise zone if it included a residential portion sufficiently “distressed” (as measured by income level, income growth, unemploy-ment, and poverty) or petitioned for “distressed” status on the basis of plant closures, gang violence, or other mea-sures.17 The proposed zone also had to include an industrial or commercial area “contiguous or adjacent to” the dis-tressed area.18 In addition, the applicants for enterprise zone status were required to prepare an economic development plan (including marketing, finance, and administration of the plan; other local incentives; infrastructure development plans; and information management). This new applica-tion process weighted localities’ economic development strategies more heavily than in the past and required that localities identify development objectives, rather than using program-wide evaluation measures.19
Program Assessments
Since enterprise zones represent the state’s largest eco-nomic development program, numerous groups have assessed the program’s effectiveness.20 Their studies provide important context for our research: Some of these studies looked, as we do, at the effect of the program on jobs, but used a less-satisfactory methodology; others looked at different effects or at the detailed workings of the program and are important context for our study.
The California Research Bureau (CRB) published a study of the effect of the program on employment, wages, and the number of firms (O’Keefe and Dunstan, 2001). This study is the most similar to ours in that it asks similar questions. It compares the growth in Census tracts covered by enterprise zones with demographically similar Census tracts, using 1990 Census data to select one matched tract for each Census tract in a zone. The authors found that employment growth between 1991 and 1999 in enterprise

11Do California’s Enterprise Zones Create Jobs?
www.ppic.org
11
zones established before 1990 far exceeds growth in the matched tracts, although the eff ect in enterprise zones established between 1990 and 1995 was much smaller, as was the eff ect on average monthly earnings per worker. In fact, monthly earnings growth was lower in enterprise zones established between 1990 and 1995 than in matched tracts. Further, the authors found considerable variation in the eff ects on growth in employment, earnings, and the number of fi rms across zones.
We fi nd the authors’ methodology problematic on two counts. First, they used data aggregated at the Census tract level, but California’s enterprise zones do not follow Census tract boundaries, so using tract-level data gives only an approximate picture of employment trends inside and outside enterprise zones. Second, they selected their control group tracts using 1990 Census data even though zones were created before 1990; it would have been prefer-able to have identifi ed similar “matched” tracts based on data from before the start of the program.21 Despite these problems, their results were the basis for a cost-benefi t analysis published by the California Association of Enter-prise Zones (CAEZ), authored by Bradshaw (2003).22 He calculated the increase in personal income taxes, sales taxes, and corporate income taxes paid to the state as a result of the increased employment in enterprise zones and found that these increased revenues outweighed the program’s costs.23 However, Bradshaw’s fi ndings are subject to the same concerns as those we raise above about O’Keefe and Dunstan’s results, bringing into question his overall conclusion about the program’s net fi scal benefi t.
A report sponsored by HCD (Nonprofi t Management Solutions and Tax Technology Research, 2006) looked at a related concern: the eff ect of enterprise zones on neigh-borhood poverty, income, rents, and vacancy rates.24 Th at study found that household economic and neighborhood housing indicators generally improve in enterprise zones relative to neighboring areas and the rest of the state. How-ever, this study, like the CRB study, also used questionable control groups: It compared Census tracts in enterprise zones with adjacent tracts, although these were not nec-essarily similar in any other way to enterprise zones. It
also misrepresented the mechanics of the enterprise zone program, claiming that “if industrial growth occurs in an EZ area, it should also manifest itself in economic growth for individuals living in the same area” (p. 1). In fact, as outlined above, since 1997, businesses in an enterprise zone have been able to claim hiring credits for employees living in a TEA or meeting other eligibility criteria. However, residence in the enterprise zone itself—which need not include the TEA—does not qualify a worker for the hir-ing credit. Consequently, if enterprise zones have positive eff ects on individuals and families in any particular areas, these eff ects should be more apparent in targeted employ-ment areas than in enterprise zones. Th e reports reviewed so far reveal some of the methodological challenges of assessing the enterprise zone program as well as the impor-tance of understanding the program’s intended eff ects.
In two reports that question numerous aspects of the design of the enterprise zone program, the California Budget Project (CBP) assesses the studies cited above and the enterprise zone program’s eff ectiveness generally. Th e reports criticize all the above studies for not focusing on employment eff ects specifi cally on businesses that used the program’s tax credits.25 We think this criticism is misguided, because it ignores the fact that local economic development
Zone eligibility criteria include measures of residential income, unemployment, and poverty.
JUPITeR IMAGeS

Do California’s Enterprise Zones Create Jobs?12
www.ppic.org
12
incentives are supposed to accompany state-level tax incentives as part of the enterprise zone program, so the tax credits are not the only mechanism by which the program could raise employment; and the other enterprise zone ben-efits could affect firms regardless of whether they claim tax credits. CBP also criticizes the design of the enterprise zone program, in part for how it targets benefits. CBP’s reports point out that relatively well-off cities, such as San Francisco and Los Angeles, receive far more benefits than poorer rural areas, and that well-paid workers qualify for hiring credits as long as they live in targeted employment areas (Califor-nia Budget Project, 2006a). CBP recommends restricting zone designations and expansions to include only “the most economically distressed communities” (2006a, p. 14). But, as argued above, the areas where the state’s neediest people live are not necessarily the areas where the enterprise zone pro-gram could create the most jobs for the neediest employees. Conversely, areas that are currently not distressed could be formerly distressed areas where the enterprise zone program produced positive effects in the past.26
Unlike the CBP and HCD reports, our study focuses on the most important goal of the enterprise zone pro-gram: job creation. Although these other studies raise important questions about the enterprise zone program, we think that any assessment should begin with the fun-damental question of whether employment grows faster in enterprise zones than in appropriately defined comparison areas. O’Keefe and Dunstan (2001) do examine this ques-tion but their study leaves considerable room for improve-ment. Below, we explain our methodology in some detail, since it distinguishes our work from other assessments of the program, and then we present our findings.
Mapping Enterprise Zones and Businesses
In this study, we measure the effects of enterprise zones by precisely mapping the zones and identifying which California businesses fall inside and outside the zones. We then track the areas inside and outside the zones over
time, comparing employment growth inside the zones to employment growth in appropriate control groups. We conduct similar analyses for changes in the number of establishments. Our methods improve on previous analy-ses of enterprise zones in California, discussed above, and on academic studies of enterprise zone programs generally, discussed in Technical Appendix A.
To identify zone boundaries precisely, we map Cali- fornia’s enterprise zones street by street rather than by approximating with Census tracts, zip codes, or other geo-graphic designations. Of course, the geographic contours of enterprise zones that we create are useful only if we can map business establishments or employment into them. We can do this using the NETS, a national, longitudinal file of the universe of business establishments created by Walls & Associates using establishment-level data from Dun & Bradstreet. The NETS provides exact street addresses for establishments in every year, allowing us to identify pre-cisely whether a business is inside an enterprise zone in a given year. To determine whether an individual establish-ment is in an enterprise zone in a given year, we undertook two data-intensive tasks: We geocoded establishments using address information in the NETS27 and we digitized enter-prise zone maps. We describe these processes, which rely heavily on GIS software, in Technical Appendix B.
Estimating the Ef fects of Enterprise Zones
Because economic conditions can differ dramatically within cities, we use two types of comparison areas with which to contrast areas included in enterprise zones. First, we choose a fixed geographic area near the outer boundary of an enterprise zone—within 1,000 feet—on the presump-tion that economic conditions and factors affecting the enterprise zone and this “control ring,” aside from the effects of the enterprise zone, are likely to be very similar. Second, we use areas that are later added to enterprise zones as control groups for areas original to (or added ear-lier to) the same enterprise zone, taking advantage of the

13Do California’s Enterprise Zones Create Jobs?
www.ppic.org
13
fact that many of California’s enterprise zones expanded numerous times (Table 1).
We analyze the effect of the program in two ways. First, we compare employment growth in enterprise zones at the time of designation or expansion with (1) employ-ment growth in areas added to the zone earlier and later and with (2) employment growth in the outside control ring. The second way we analyze the program effect is by comparing employment growth in the initial zone desig-nation and in later expansions, omitting the control rings from the analysis. We prefer this second type of compari-son because areas that are added to enterprise zones later presumably have economic conditions that are similar to those of the area initially designated as the enterprise zone—they are potentially more similar than areas in the control ring that never became part of the enterprise zone.28 In both approaches, we estimate the effects of enter-prise zones by comparing changes in outcomes in areas newly designated to areas whose status did not change.
To estimate the effect of the program across all zones, we use a regression framework, explained in Technical Appendix C, which essentially averages experiences across all zones and years. Our models account for the possibility of different growth rates over time for the area encompass-ing an enterprise zone and its control ring; for differences in enterprise zones (or parts thereof) that change little over time, such as proximity to infrastructure or the educa-tion level of residents; and for other possible confounding effects. We consider the possibility that enterprise zones lead to a relatively sharp one-time shift in employment rather than to a change in the rate of job creation, and we consider the possible overlap of enterprise zones with other geographically targeted policies, such as redevelopment areas.29
We examine the effects of enterprise zones on both employment levels and number of establishments. We also evaluate how enterprise zones affect the composition of employment. Because the size of the hiring credit per worker is capped, firms in industries that hire lower-wage workers would see their labor costs reduced by a higher percentage than would firms in high-wage industries.30
Also, the program’s tax incentives that target machinery and property are most likely to benefit manufacturing enterprises, so we examine whether enterprise zones affect the share of employment in manufacturing.
It is important to look at the time line of enterprise zone effects. The effects of enterprise zones may vary over their life cycle, and this is potentially significant for the structure of enterprise zone policy. If, for example, zones have most of their positive effect in the first five years of their existence, then a policy that creates the zone for a period of 15 years with a simple extension to 20 years, and which caps the number of zones (meaning that new zones can be designated only when existing zones are de-designated), may be mis-guided. On the other hand, because enterprise zone designa-tion requires a local economic development strategy, some of the effects, such as zoning relief, might take several years to have an effect on employment. Without necessarily identify-ing the reasons for differences in the time line of enterprise zone effects, some of the specifications we estimate attempt to pin down this time line.
Finally, we assess whether the enterprise zone program does a better job at raising employment in some zones than in others. California’s enterprise zones are diverse: They have different local economic development strategies and different local economic conditions, both of which could influence the effectiveness of the program. Local economic development strategies could have effects, because zones are required to develop strategies as part of their applica-tion for zone designation. Although the tax incentives offered by the state are uniform across enterprise zones, local zone administrators oversee marketing strategies for making businesses aware of the tax benefits and for coor-dinating complementary local incentives. To characterize the variation in local economic development strategies and local resources devoted to the program, we conducted a survey in 2007 of enterprise zone administrators, based on which we constructed quantitative measures of comple-mentary local involvement that are incorporated into the empirical analyses described below.
The effects of enterprise zones could also differ owing to diversity in employment density, the industry mix, local

Do California’s Enterprise Zones Create Jobs?14
www.ppic.org
14
demographics, other public investments, and so on. Cred-its on sales tax for machinery purchases, for instance, are likely to have a larger effect on manufacturing firms than on services firms, and certain areas may be more amenable to manufacturing development than others. The hiring credit, too, could have a differential effect if firms in some industries can more easily employ disadvantaged workers. In our analysis, therefore, we include a short list of mea-sures that could influence the effectiveness of the program at the zone level.
Enterprise Zone Ef fects on Employment and Establishments
Our primary analyses examine the effects of enterprise zones on employment and number of establishments. Although our main interest is employment growth, the results on number of establishments are of interest for two
reasons. First, they tell us whether enterprise zone incen-tives are leading to the creation of more business establish-ments. Second, the combined evidence on employment and establishments tells us how the size distribution of estab-lishments is changing: For example, if there are no employ-ment effects but fewer establishments, then establishments must be getting larger.
In Table 5, we present some descriptive statistics on the size of enterprise zones—both initial designations and expansions—and the control rings for 1992, the first year of the sample.31 Enterprise zone employment constitutes
about 69 percent of total employment in the zones and the control rings, and of this, about 72 percent is in the areas originally designated as part of the zones. Estab-lishment size in the zones and the control rings is quite similar (approximately 14.5 employees per establishment), although sizes are slightly larger in the enterprise zone expansion areas than in the originally designated areas. The same is true of the share of employees in low-wage industries.32 The share in manufacturing is somewhat higher in the zone expansion areas and somewhat lower in the control rings. We conclude that the three types of areas we compare in our analysis—initial designations, expan-sion areas, and control rings—are broadly similar in their characteristics. In our regression analysis, we control for initial or time-invariant differences between the areas and also examine evidence on any differences in such factors as prior trends in employment or job growth in the periods leading up to enterprise zone designations or expansions.
We then show how the growth in jobs and number of establishments compares in areas before and after being designated as part of an enterprise zone. To better explain how we do this, we need to introduce what we call “sub-zones,” which are the portions into which each enterprise zone can be divided, consisting of the area initially desig-nated as the zone, each additional expansion, and the con-trol ring. If, for instance, an enterprise zone was designated in 1994, expanded in 1998, and expanded again in 2001, we would have four subzones once we add the control ring to the initially designated area and the two expansion areas.
Table 6 ignores the control rings, focusing only on the subzones that ever became part of the enterprise zone. The row labeled “difference in growth rates” suggests that enterprise zones slightly reduced the growth of jobs, with a fairly small relative difference of 0.5 percent slower growth in enterprise zones. In other words, subzone employment grew slightly slower after the subzone was designated as part of the enterprise zone. In contrast, enterprise zones appear to have slightly increased the growth rate in the number of establishments.33
Our main finding is that enterprise zones have no sta-tistically significant effect on either employment levels or
Our main finding is that enterprise zones have no statistically
significant effect on either employment levels or employment growth rates.

15Do California’s Enterprise Zones Create Jobs?
www.ppic.org
Whole sampleall areas
ever in zonesareas in
original zonesareas in
zone expansions1,000-foot
control ring
Total no. employed 1,953,220 1,349,629 976,119 373,510 603,591
Total no. of establishments 140,969 96,752 71,006 25,746 44,217
No. of employees per establishment (weighted mean) 14.6 14.7 14.2 16.2 14.3
% of employees in low-wage industries (weighted mean) 11.6 11.8 11.6 12.4 10.9
% of employees in manufacturing (weighted mean) 8.0 8.6 7.8 10.8 6.7
Table 5. Statistics for enterprise zones and control rings, 1992
Table 6. Employment and establishment growth, within-zone comparisons (weighted by 1992 levels)
Employment Establishments
Enterprise subzones after zone designationAverage annual % change, year of designation to 2004 0.3 2.1
Enterprise subzones before zone designationAverage annual % change, 1992 to year of designation 0.8 1.8
Difference in growth rates, after versus before zone designationDifference between two rows, above –0.5 0.3
Effect of enterprise zone program on growth ratesMain regression results –0.7 –0.8**
NOTES: There is one observation for each year for each subzone. Only areas ever included in enterprise zones in the sample period are included in this table. Our main regression results are from Technical Appendix D, Table A.3, Panel A, columns 3 and 4. We present them as percentage point changes in the table above, for consistency with the descriptive statistics in the other rows of the table. ** Indicates that the estimate is statistically significant at the 5 percent level.
employment growth rates; the last row of Table 6 presents the effect on growth rates that we estimate using regres-sion analysis. This finding holds up even with numerous additional tests. As described in Technical Appendix D, we find no consistent, statistically significant effect on employment when using alternative definitions of the control rings; including streets that appeared to us to be erroneously omitted from the official list of streets in the zones; changing the weighting of the regressions; allowing for different effects beginning in 1997, when TEA residents became eligible for the hiring credit; or omitting the Los Angeles zones, which account for many of the expansions
we observe. We also found no difference in the effect of initial designations and subsequent expansions.
The effect on the growth rate of the number of estab-lishments is negative, although statistically significant, in only some of the many different estimations we examine. One possible interpretation of the decline in the number of establishments coupled with no change in employ-ment, which, as noted above, implies that establishments are becoming larger, is that there are fixed costs to taking advantage of enterprise zone benefits, and large establish-ments (or firms) are therefore more likely to find enterprise zone benefits more attractive. If this interpretation is valid,

Do California’s Enterprise Zones Create Jobs?16
www.ppic.org
16
it may have implications for the effects of enterprise zone policy on entrepreneurship in the form of small business creation. We stress, though, that the negative effect on establishments is not as statistically robust as the absence of any effect on employment. We cannot say conclusively whether the program has either (1) a negative effect on the number of establishments (and therefore a positive effect on average establishment size) or (2) no effect on the num-ber of establishments or on average establishment size.
The program has no statistically significant effect on employment even when a longer period of time is exam-ined. Figure 1 shows the effects of the program on employ-ment in the years before and after an area becomes part
of an enterprise zone. The dots show our estimate of the effect, and the short bars show the confidence interval: A result is “statistically significant” if the dot as well as the entire area between the upper and lower bar is either above or below the horizontal line indicating “zero.” Clearly, the program does not have a statistically significant effect on employment growth during either the year an area is designated or in any of the following years. We also look back to years before designation to see whether areas that were later designated as part of an enterprise zone showed different growth patterns before designation or whether businesses changed their hiring in anticipation of later zone designation. Again, there is generally no statistically significant relationship between employment growth and enterprise zone designation.
With respect to employment, our results are similar whether or not we include the control rings, which sug-gests that spillover effects are not causing us to understate the effectiveness of the program. If the enterprise zone program has spillovers, by which we mean that the pro-gram encourages employment growth not only within the zone but also just outside the zone, then our methodology could find no effect of enterprise zones, since we estimate the effect by comparing growth of zones with growth in immediately neighboring areas.34 By using two control groups—future expansion areas and control rings—we can assess whether spillovers color our results. Future expan-sion areas are closer geographically and in their economic conditions to current enterprise zone areas than control rings are, so any spillover effects should be greater in future expansion areas than in control rings. Had we found no employment effect only when using future expansion areas and a positive employment effect using control rings, then it would be possible that zones create positive spill-over effects in neighboring areas. Since our results with and without control rings are similar, we discount the pos-sibility of positive spillover effects.35
Another possibility is that there are negative spillover effects, with enterprise zones pulling jobs and businesses away from nearby areas. The similarity of results with and without control rings also undermines this possibility.
NOTES: Estimates are of the first-differenced form of equation (1) in Technical Appendix C, with four leads and eight lags of enterprise zone dummy variable added. The estimated lead effects are displayed to the left of zero, i.e., before enterprise zone designation at time zero, and the lagged effects are displayed to the right. The numbers on the horizontal axis indicate years before (negative numbers) or after (positive numbers) zone designation.
0.3
0.2
0.1
0.0
–0.1
–0.2
–0.3
Figure 1. Estimates of Effects of Enterprise Zone Designation on Rate of Job Growth
76543210–1
A. With control ring
–2–3–4 8
0.3
0.2
0.1
0.0
–0.1
–0.2
–0.376543210–1
B. Without control ring
–2–3–4 8

17Do California’s Enterprise Zones Create Jobs?
www.ppic.org
17
Moreover, such negative spillovers would tend to produce evidence that enterprise zones do encourage job growth relative to control areas. Thus, if there were negative spill-overs, our conclusion that there are no positive employ-ment effects would only be reinforced.
In addition to enterprise zones, other programs offer incentives for job creation in targeted geographic areas. The most important of these in terms of our analysis are redevelopment areas, because they are urban and very pervasive and hence are more likely to overlap with our enterprise zones, in which case there is the potential for confounding the effects of the two.36 In addition, three federal programs—Renewal Communities, Enterprise Communities, and Empowerment Zones—have a variety of similar benefits. These are listed and described in Tech-nical Appendix B. We mapped redevelopment areas and federal zones digitally, overlaid these with our enterprise zone maps, and repeated our analysis.
In all of the estimations, the estimated effects of enterprise zones in areas that do not overlap with redevel-opment areas or federal zones are small and statistically insignificant. In addition, there is no evidence that enter-prise zones have positive effects when they are combined with these other local programs.37 We conclude, therefore, that our estimated effects of enterprise zones are not mate-rially affected by whether or not a particular region is also in a redevelopment area or a federal zone.
Furthermore, the enterprise zone program has no effect on two measures of the composition of employment— the share of employment in low-wage industries and the share of employment in manufacturing. We examined these two measures, because enterprise zones are intended
to help create jobs for those who are economically dis-advantaged and likely to be low-skilled, and some of the enterprise zone benefits targeted on machinery and prop-erty are most likely to benefit manufacturing enterprises.38 These results are presented and described in Technical Appendix D.
Variation in Program Ef fectiveness
Given the heterogeneity of local economies in which zones are located, the effects of the program’s incentives could in fact differ across zones, even though the incentives offered to businesses are the same, regardless of the zones in which the businesses are located. For example, some of the tax incentives may be more beneficial to manufactur-ing firms, so that zones established in manufacturing areas might have more beneficial effects on employment. Or the program might have different effects in different zones because local administrators can influence the program’s effectiveness. Localities are encouraged to provide eco-nomic development strategies in the process of applying for zone designation, and much of the program’s admin-istration is left to local managers. Recent reform of the enterprise zone program places more emphasis on local management and local commitment.39
To assess whether local commitment to the program affects employment changes in zones, we conducted a survey of program administrators.40 We asked them open-ended qualitative questions about their views on the purpose of the enterprise zone program, if they evalu-ate the program’s effectiveness, and what their biggest successes and challenges have been. We asked detailed questions about how the local zone tries to maximize the effectiveness of the program, and we received quantitative responses to the following questions:
On a 1–5 scale, where 1 means “not at all active” and 5 means “extremely active,” how active is your zone in doing each of the following?1. Using marketing—for instance, informing businesses
about the zone and the incentives it offers;
The enterprise zone program has no effect on the share of employment
in low-wage industries or the share of employment in manufacturing.

Do California’s Enterprise Zones Create Jobs?18
www.ppic.org
18
2. Amending zoning or other local regulations to favor growth in your zone;
3. Training workers to make them qualified candidates or operating hiring centers to match individuals with businesses;
4. Facilitating the earning of tax credits—for example, by hosting informational sessions with business owners or employees;
5. Encouraging the building of additional infrastructure, such as a bus line or freeway spur; and
6. Offering other tax incentives, credits, or discounts on public services at the local level.
We included these quantitative assessments in our analysis. Of course, it would have been ideal to have gath-ered historical information about zone activities from the original dates of zone designation to the last year covered by the data, but this was not feasible. Some respondents have worked as zone administrators for as little as a few months, and their responses refer only to the very recent past and the present. On the other hand, many respon-dents had several years of experience with their zone, some up to 20 years. Thus, the responses we received rep-resent a mix of recent and long-term views and behaviors. Nonetheless, these surveys do provide insight into local zone activities.41
Among the six activities we asked about, local zone administrators said they were most active using market-ing and facilitating the earning of tax credits, which both received average scores of 4.0 on the 1–5 scale.42 The next
highest scores were, in order, offering other tax incentives, credits, or discounts (2.9); training workers or operating hiring centers (2.8); encouraging infrastructure building (2.3); and amending zoning or other local regulations (1.6).
Zones differed in their self-reported scores: The aver-age score across all six activities ranged from 4.3 for an urban zone in Southern California to 1.2 in a rural zone. In general, the larger and more urban zones are more likely to facilitate earning tax credits and to offer other tax incentives, credits, or discounts on public services, and less likely to encourage building additional infrastructure.43
We also found that enterprise zones face diverse chal-lenges. We asked zone administrators what their biggest challenge was in attracting businesses or raising employ-ment. Since our question was open-ended, the answers are not easily quantified, but it was clear that no single chal-lenge dominates. Three challenges were mentioned repeat-edly. The first was a lack of resources for marketing and outreach. In our 36 interviews, six respondents mentioned this constraint, including both small and large zones and urban and rural zones. Second was a lack of available land for new businesses, which was mentioned most often by more dense, urban zones, especially in Southern Califor-nia. Third were geographic isolation and a lack of trans-portation infrastructure, which was a common response among rural zones in the central and northern parts of the state. Other challenges, mentioned less frequently, include inadequacies in the local workforce, environmental and other regulations restricting growth, and the program’s benefits being too small to compete with larger incentives offered in other states. Finally, several administrators noted that small businesses in their zones often find the adminis-trative requirements too burdensome; they do not have the time or money to get the help they need to complete hiring voucher requests and gather required data.
At the same time, a couple of common themes emerged across the interviews. When asked if they mea-sure the effect of local enterprise zone activities on busi-ness creation or employment, the majority cited counting vouchers for the enterprise zone’s hiring credit as the primary evaluation method (which is required by the
In general, the larger and more urban zones are more likely to facilitate earning
tax credits and to offer other tax incentives, credits, or discounts on public services,
and less likely to encourage building additional infrastructure.

19Do California’s Enterprise Zones Create Jobs?
www.ppic.org
19
state). A few administrators mentioned attempts to count new business permits and employment changes and to keep track of business inquiries about the program, site visits, and other marketing outreach. But the primary data-collection effort is counting vouchers, which is a measure of resources going into the program rather than a measure of the program’s effectiveness.
Another common theme is that nearly every zone administrator had a similar view about the purpose of the enterprise zone program: to create jobs and to attract and retain businesses. When we asked respondents to state the primary goal of the program, nearly all mentioned job growth; far fewer also explicitly mentioned reduc-ing unemployment or poverty. Representative answers included:• “Tostimulatejobsandinvestmentineconomicallydis-
advantaged areas of the state.”• “Tohelpthelocaleconomybygivinglocalbusinessesa
means to expand, and to encourage new firms to enter their area instead of a competing area.”
• “Theprogramisabusinessattractionandretentiontool.It’s the only statewide program we have.”
• “TomakeCaliforniacompetitiveagainstotherstatesandregions in terms of manufacturing. Enterprise zones are the only incentive that they really have left.”
To assess how program effects differ across zones, we augment our regression model, described in Technical Appendix C, with self-reported scores, on a 1–5 scale, of the six zone activities. As before, we consider the effects of the program on both employment levels and employment
When we asked respondents to state the primary goal of the program, nearly all mentioned job growth;
far fewer also explicitly mentioned reducing unemployment or poverty.
growth. We find that enterprise zones have a positive effect on employment under each of the following conditions:• Manufacturingconstitutesasmallershareofoverall
zone employment.• Zoneadministratorsreportdoingmorelocalzonemar-
keting activities. • Zoneadministratorsreportdoinglessfacilitationof
earning tax credits.
Specifically, we simulated the effect of the program on employment for a hypothetical zone that is average on all of our measures, except for having different manufactur-ing shares and different self-reported levels of activities devoted to marketing or facilitating earning tax credits. We report results in Table 7. In zones with either a smaller share of manufacturing employment, more local zone marketing activities, or less facilitation of earning tax cred-its, the effect of the enterprise zone on employment levels (shown in the table) and on employment growth rates (not shown) is positive and statistically significant.
In one sense, it is surprising that enterprise zones have a stronger positive effect on employment when the zone is less manufacturing-heavy, since some of the tax incen-tives that the program offers, such as the sales tax credit for machinery, should benefit manufacturing firms more than firms in other industries. The program might be less effec-tive in these areas because manufacturing firms are often the target of other economic development efforts. The site-location decisions of automobile plants, for instance, get considerable public attention. A couple of the zone manag-ers we surveyed noted that their biggest challenge was that program benefits are small relative to the incentives offered by other states and localities. Although their comments may not be representative of all of California’s enterprise zones, they point out that the enterprise zone program is only one tool that economic developers use to attract and retain businesses. Even if the enterprise zone program offers incentives that should appeal to manufacturing more than to other sectors, the competition for manufacturing jobs may be stiffer than for other jobs, and enterprise zone benefits may therefore matter less for manufacturing firms.

Do California’s Enterprise Zones Create Jobs?20
www.ppic.org
20
Another possibility is that for manufacturing industries, some of the other enterprise zone benefits focused on prop-erty and machinery are more important; because these subsidize capital rather than labor, they could encourage a shift from labor to capital, offsetting the positive employ-ment effects that the hiring credit might create.
The evidence that activities focused on the hiring tax credit reduce the job-creating effects of enterprise zones is unexpected. One possible interpretation is that these activ-ities focus more on claiming the tax credits retroactively than on creating jobs currently. Tax credits can be claimed retroactively for up to four years, and a substantial share of enterprise zone tax credits are claimed retroactively (California Budget Project, 2006a). It is also clear from perusing the Internet that many tax-service companies advertise their ability to help businesses in California receive tax reductions for the credits retroactively.44 Crit-ics of enterprise zones point to this retroactive activity as evidence that the zone benefits do not help create jobs: “By definition, retroactive credits provide bonuses for past actions, but do not encourage businesses to increase or maintain employment in future years and thus do not further program goals” (California Budget Project, 2006a, p. 13). Retroactive claiming of credits despite little job
creation can occur if firms do not know initially about the hiring credit. However, another possibility is that firms may know about and respond to the credit but file retroac-tively only once they earn profits or once the “load” is large enough to justify the costs of filing. The behavior sur-rounding tax credits is difficult to pin down. But our esti-mates indicating that zones focusing on these credits are less effective at creating jobs might provide some evidence in favor of the more critical view of how the hiring tax credit gets used (i.e., that some of the activities surround-ing the hiring credit focus more on retroactive credits than on creating jobs contemporaneously).45
Of the local activities we asked zone administrators about in our survey, only marketing and outreach efforts improved the program’s effect on employment. Current zone application procedures require that localities formu-late a marketing plan, and marketing and outreach efforts are the activities that zone managers are most likely to say they do. We caution, however, that we are measuring zone managers’ own perceptions of local marketing and out-reach efforts. It is possible that managers view themselves as more active in marketing and outreach after observ-ing positive employment effects in their zones, in which case the self-assessment of marketing activity could be the
Characteristic Zone effect on employment Statistically significant?
Manufacturing share 5% of employment (zone average = 15%) 0.201 Yes
Manufacturing share 25% of employment (zone average = 15%) –0.143 No
Self-reported marketing effort 5 on 1–5 scale (zone average = 4) 0.166 Yes
Self-reported marketing effort 3 on 1–5 scale (zone average = 4) –0.150 No
Facilitating the earning of tax credits effort 5 on 1–5 scale (zone average = 4) –0.044 No
Facilitating the earning of tax credits effort 3 on 1–5 scale (zone average = 4) 0.202 Yes
NOTES: Estimates are reported for a hypothetical zone that is average on all our measures (see Technical Appendix D, Table A.8, for the full list) except the listed zone characteristic. The effect of the zone on the employment levels (measured as the natural log of employment) is based on regression coefficient estimates shown in Technical Appendix D, Table A.9, column 5, and includes control rings. Statistical significance is reported at the 5 percent level.
Table 7. Hypothetical zone characteristics and zone effect on employment estimated

21Do California’s Enterprise Zones Create Jobs?
www.ppic.org
21
Of the local activities we asked zone administrators about in our survey,
only marketing and outreach efforts improved the program’s effect on employment.
meant to increase employment, some of the benefits target-ing machinery and property could lead to substitution away from labor. This might also explain why manufacturing-heavy zones show no positive employment effect, since manufacturing firms rely more than other firms on capital and land.
A second possibility is that the program shifts hiring toward “disadvantaged workers” (as defined by the pro-gram) without an overall net increase in employment. Because the eligibility standards for using the hiring credit favor lower-wage workers and because the hiring credit is capped at a low salary level, the program’s benefits should reduce the cost of hiring lower-wage, disadvantaged work-ers relative to hiring higher-wage workers. We cannot directly assess this possibility because the NETS data-base reports the industry of an establishment but not the specific occupations or earnings of workers employed in that establishment, nor the skill levels or other indicators of the socioeconomic disadvantage of these workers. Our analysis shows no compositional shift toward lower-wage industries, but that does not rule out a shift toward disad-vantaged workers within firms in each industry.
We reject some other explanations for the lack of effect as implausible. One hypothetical explanation could be that the program results in higher wages for workers despite failing to increase employment. However, econom-ics research has clearly established that higher wages entice workers to enter the labor market (i.e., labor supply is “elas-tic”), so it is highly unlikely that the program raised wages without increasing employment.46 A second claim we find implausible is that the incentive effect of the program is weak. Dividing the cost of the program ($330 million in 2005) by the number of jobs in enterprise zones (roughly 1.4 million) yields an estimate of about $240 per worker— a small amount. However, for workers whom firms can claim for the hiring tax credit, the program offers subsi-dies of up to 50 percent of a low-income worker’s wages—hardly a small incentive.
A secondary finding is that average establishment size may grow in enterprise zones. Increasing establish-ment size is consistent with survey respondents’ comments
result of employment growth rather than a contributor. We also caution that we are asking current zone managers about their recent marketing efforts, whereas our analysis
of employment effects looks at the period 1992–2004. Thus, we are implicitly assuming that a zone’s self-reported mar-keting efforts today are a useful indicator of its marketing efforts in the past. This finding, though, supports the 2006 reforms to the enterprise zone program that placed more emphasis on local activities and local commitment in the belief that more effort on local marketing and outreach might lead to more positive employment effects.
Conclusions
California’s enterprise zone program—the state’s largest economic development program—has no statistically significant effect on employment. We arrived at this con-clusion after mapping nearly all businesses in the state, drawing precise enterprise zone boundaries, and compar-ing employment growth in enterprise zones with carefully considered control areas.
The lack of an effect on employment is surprising. Employment growth is an explicit goal of the program and, according to our survey, is the main focus of local zone managers. We do not assess, as others have, the effect of the program on unemployment or poverty, but it is difficult to see how these outcomes could improve in the absence of a positive effect on employment.
Why might there be no effect on employment? One possible reason is that even though the incentives are

Do California’s Enterprise Zones Create Jobs?22
www.ppic.org
22
that smaller businesses find it less worthwhile than larger businesses to claim enterprise zone benefits because of the administrative burden.48 Another possibility is that higher prices for land relative to other inputs lead employers to substitute toward other inputs, including labor.
The absence of evidence of a beneficial effect of Cali-fornia’s enterprise zones on job and business creation clearly calls into question whether the state should con-tinue to grant enterprise zone tax incentives. Finding no overall employment effects, the burden of proof shifts to identifying other positive effects, if any, or redesigning the program to focus on zones where positive effects are most likely. We have already mentioned why it is unlikely that the program raises wages for workers in the absence of employment increases. Another possible effect of the program, which we did not analyze in this study, is that enterprise zone benefits could be capitalized into land
values, because the benefits accrue to businesses in speci-fied geographic areas. This could happen if commercial landlords, knowing that businesses benefit from the enter-prise zone tax incentives, raise commercial rents enough to offset enterprise zone benefits, leaving a business in a zone no better or worse off than before an area became part of an enterprise zone. However, capitalization would not explain the lack of effect on employment. Even if land values rise, reductions in the relative cost of labor owing to the hiring credit still imply that employers will hire more labor relative to other inputs.
Our research may have some useful implications for making enterprise zones more effective. First, although we find that the enterprise zone program on average has no effect on employment, we found some evidence that the program’s effectiveness differs across zones. Several local factors appear to be correlated with the effectiveness of the program: Zones with smaller employment shares in manufacturing, zones where the administrators report greater marketing and outreach activity, and zones where administrators report expending less effort on facilitating the earning of tax credits all had a more positive effect on employment than other zones. The recent program reforms requiring greater local responsibility and commitment are consistent with our findings that local efforts—at least in regard to marketing—raise program effectiveness. There could be other factors—either initial zone conditions or local activities—that we did not study that also influence the effectiveness of the program. And, as the enterprise zone program is increasingly designed to leverage formulation of local economic development strategies, the state should look closely at which local strategies are more effective than others. Selecting future zones based on factors that make the program more effective would, of course, raise the overall effectiveness of the program. (The text box offers some tech-nical suggestions on how to define zones geographically to make evaluation and assessments more feasible.)
To increase the overall effect of the program on employment, zones could be selected or allowed to expire, depending on their effectiveness. This would represent a change from current practices in which we see minimal
Recommendations for improving the program
Two relatively small changes to the program would make future evaluation and administration of the program much more simple. The first would be to require that local zone administrators and applicants create digitized maps of their zones using GIS software. GIS maps can be read with standard mapping software and overlaid with data from the U.S. Cen-sus, the NETS, and other sources. The second change would be to require that enterprise zones follow Census tract boundaries. This would make it easier to analyze and control for demographic and other characteristics when selecting new zones or evaluating exist-ing ones. It would also make zone boundaries more defini-tive. Currently, conflicting information in different maps and street lists leads to some cases of ambiguity about whether individual streets are part of an enterprise zone. Taken together, these two recommendations—requiring digitized maps and following Census tract boundaries—would allow local administrators, local businesses, and HCD to definitively analyze the demographics and other charac-teristics of zones, so long as the Census continues to produce usable tract-level data.47 These improvements would aid HCD in the selection and evaluation processes and could help local administrators work with businesses to visualize and market the zone.
23Do California’s Enterprise Zones Create Jobs?
www.ppic.org
in the East San Fernando Valley—was combined with the Central Los Angeles/Hollywood zone, resulting in an application process that designated every applicant as an enterprise zone or part of another zone.50 In January 2008, eight more zones (out of a pool of 13 applicants) were designated to replace another round of expiring zones; of these eight, seven were in jurisdictions previously declared as enterprise zones.
We encourage a more critical evaluation of the pro-gram overall and of its effects in individual zones, using both our metric—employment—and others—such as poverty, unemployment, and property values. Although we believe that the state’s recent decision to encourage more local marketing efforts will probably increase the positive effect of the program on employment, the state should evaluate individual zone success with consistent evalua-tion metrics. The 2006 enterprise zone reform called for more individually tailored evaluation metrics to be applied zone by zone. Although zone-specific goals may encourage local commitment to the program, consistent evaluation metrics are essential for judging which factors make some zones more effective than others. Zones that show no posi-tive effects should be allowed to expire to make room for applicant zones exhibiting the characteristics that lead to positive employment effects.
Our findings cast a skeptical eye on California’s enter-prise zone program. For a cash-strapped state, it is too costly a program to simply continue with “business as usual” without clearer evidence of the program’s benefits or a well-defined plan to make the program more effective. ●
23
turnover in enterprise zones. All of the zones designated before 1990 were granted five-year extensions when they reached the end of their original 15-year terms. No enter-prise zone in the state has ever been de-designated for poor
audit results or for any other reason, and the Assembly committee responsible for oversight calls the performance reviews “very rudimentary.”49 Furthermore, the recent major application round, in 2006, was effectively non-selective. Because of the large number of zones created in 1986 (and that received five-year extensions) and another wave of zones created in 1991 and 1992 (that had yet to be extended), 23 of the 42 zones expired in 2006 and 2007. In 2006, 19 of the 23 expiring zones re-applied for a new 15-year term, and six new areas applied for eligibility in the program. Two of the 25 applicants—Central Los Angeles and Hollywood—were combined into a single application, and out of the resulting 24 applicants, HCD designated 23 new zones. Then, the one zone not selected—Pacoima
All technical appendices to this report are available on the PPIC website:
www.ppic.org/content/pubs/other/609JKR_appendix.pdf.
The absence of evidence of a beneficial effect of California’s enterprise zones
on job and business creation clearly calls into question whether the state should continue
to grant enterprise zone tax incentives.

Do California’s Enterprise Zones Create Jobs?24
www.ppic.org
24
Notes
1 California Budget Project (2006a) and Bradshaw (2003).
2 Of this total, $197 million in hiring and sales or use tax credits was claimed on corporate tax returns, and $136 million on per-sonal income tax returns. Additional, smaller incentives that the enterprise zone program offers should also count as part of the program’s costs but they are not listed separately as tax expendi-tures by the Franchise Tax Board.
3 CALED proposed extending zone benefits to businesses in any city or county in California with unemployment above the state average.
4 Assembly Jobs, Economic Development, and the Economy Committee (2006, p. 5).
5 Assembly Jobs, Economic Development, and the Economy Committee (2006).
6 Specifically, our study looks at the effects of enterprise zones on jobs and businesses inside the zones. It does not assess evidence on the effects on residents of the enterprise zones or of targeted employment areas, for reasons explained below.
7 The eligibility of residents in TEAs for the hiring credit began in 1997. Enterprise zones are defined by individual street addresses. TEAs are defined by Census tracts. TEAs typically include parts of an enterprise zone itself and other lower-income neighborhoods, but they are defined independently of enterprise zones and do not necessarily overlap them. A worker living in a TEA qualifies for the hiring credit regardless of other indi-vidual worker characteristics. TEAs include Census tracts where more than half the population earns less than 80 percent of the median area income, according to the 1980 Census (personal communication, Richard Friedman, former Deputy Director, Division of Financial Assistance, Department of Housing and Community Development, October 2006).
8 It appears that very few workers claim this credit—fewer than 500 in 2005, for a total cost of just over $100,000 (California Franchise Tax Board, 2006). Although technically this credit is given to the worker, economic theory teaches us that the inci-dence of the tax credit is independent of who receives it. As long as labor supply is not completely inelastic, market wages will fall (although wages plus the credit will rise) and employment will increase.
9 Firms in enterprise zones receive “a five-percent preference for state contracts in excess of $100,000” (Assembly Jobs, Economic Development, and the Economy Committee, 2006, p. 13).
10 Technical Appendix E explains issues regarding obtaining the required information.
11 We refer to “Los Angeles” as if the five enterprise zones in Los Angeles were a single zone. We explain in Technical Appendix B that we were able to determine whether a business was in any of the five Los Angeles enterprise zones but not which one, so for the purposes of our study we treat the Los Angeles zones as a single zone.
12 Note that some numbers repeat in column 3. This occurs when there are multiple zones in the same county.
13 In our work and in academic research on employment dynam-ics, a “firm” is a legal entity that can include one or more “estab-lishments,” which are physical locations where a firm conducts business and has at least one employee.
14 Descriptive statistics in columns 2–4 are based on 1992 employment for the areas that are or will become part of an enterprise zone by 2004. Data are from the NETS. Ideally we would describe zone characteristics before zone designation, so that we could characterize enterprise zones before they were affected by the policy. The best we can do is to use 1992 data, the earliest year for which the NETS has data of use for our analysis.
15 Demographic data for counties come from the 1990 Census.
16 Despite this last criterion, we have discovered only one evalu-ation of a specific enterprise zone, in Bakersfield (Lyman, 2001). However, this study does not establish any effect of the zone, as there is no comparison either with nonzone areas or with changes over periods before the zone designation.
17 Curiously, though, residents of the distressed areas within enterprise zones are not eligible for the hiring credit unless these areas coincide with a TEA or they are in other eligible groups.
18 Specifically, in the 2006 application process, an area was eligible if it met at least three of the following conditions: (1) the net increase in per capita income 1990–2004 was 80 percent or less of the statewide average, (2) average unemployment was at least 7.4 percent in both 2003 and 2004, (3) the personal poverty rate was at least 15.2 percent in 2000, (4) at least 70 percent of households had incomes below 80 percent of the median county family income in 2000, and (5) the area fell within a jurisdiction

25Do California’s Enterprise Zones Create Jobs?
www.ppic.org
25
declared a disaster area by the U.S. president within the last seven years. Areas not eligible by this definition could still “petition” as mentioned above. These 2006 criteria for eligibility are slightly different from those in previous rounds, but the general procedure of assessing a distressed residential area and combining it with a neighboring commercial or industrial area has not changed.
19 In the 2006 round of zone designation, applicants were scored and ranked on their economic development plan; the bulk of the score was derived from HCD’s assessments of the marketing strategy, the plans for financing and administering the program, local incentives, the infrastructure development plans, and information management. About one-quarter of the score was based on current conditions of the zone; this included the num-ber of businesses, commercial and industrial vacancy rates, and available land, as well as unemployment and income levels. HCD assigned an aggregate score as well as scores for individual com-ponents; information on all of these scores is publicly available. The application process is described in California Department of Housing and Community Development (2006).
20 Several studies were prepared in the years leading up to 2006, when the originally designated zones began to expire and new zones were to be designated.
21 This study was based on a companion academic paper by O’Keefe (2004), which we discuss in our review of the academic literature in Technical Appendix A.
22 The CAEZ is a nonprofit organization that acts as an advocate for enterprise zones.
23 Bradshaw applies various average tax rates to convert employ-ment changes into tax revenue changes.
24 A more recent version of this study, covering more states (Ham et al., 2009), reports results for employment effects as well, and concludes that enterprise zone “designation in California has no significant effect on employment” (p. 2). Other results in this study are curious. First, the only state in which enterprise zones have detectable employment effects is Ohio, although in that state the hiring credit is trivial. Sec-ond, for California, despite finding no employment effects, the study finds significant and positive effects on the fraction of households with wage and salary income. Conversely, in Ohio, despite the apparent strong employment effects, the study finds no effect on this fraction.
25 California Budget Project (2006a, p. 11, and 2006b, p. 2).
26 Bradshaw (2006) cites Potrero Hill in San Francisco as a prime example and references his 2003 cost-benefit analysis as evidence of the general effectiveness of the enterprise zone program. But he offers no specific evidence about the program’s effect on this neighborhood.
27 Geocoding (the conversion of street addresses or other des-ignators to latitude-longitude coordinates) provides a common language that enables geographic information from different sources to be combined.
28 In our survey of local enterprise zone administrators, we asked why zones expanded and when and where they did. Two main reasons emerged. First, zones often expanded to benefit busi-nesses that were moving to or growing in areas just outside the enterprise zone. Second, zones sometimes expanded to incor-porate areas newly designated as commercial or industrial by the local planning process. To the extent that zones expanded where businesses planned to relocate or grow, zone expansions were sometimes the effect rather than the cause of employment growth. If so, our estimates of the effect of the enterprise zone program on employment would be biased upward. Since we ultimately find no effect on employment, this only strengthens our conclusions.
29 We often do not observe the original designation of the zone in our sample period, which begins in 1992, even though most zones were originally designated earlier. Most of our identify-ing information comes from expansions. Thus, interpreting our results as estimating “the” effects of enterprise zones hinges on the assumption that the effects of the original designations and expansions are the same. We test this assumption and find that the effects of the initial designation and expansion are indeed similar.
30 The hiring credit is largest in the first year and declines to zero after the fifth year of employment, which has the potential effect of encouraging the churning of employees so that a larger share of the workforce at any time qualifies for the hiring credit. Unfortunately, our data do not allow us to track employees across business establishments, so there is no way to test directly for this possible effect, although it is an important issue for future research.
31 Ideally, we would like pre-treatment comparisons. However, many of the areas in the original zone designations were so designated before 1992, and there is no pre-treatment year for the control rings.

Do California’s Enterprise Zones Create Jobs?26
www.ppic.org
26
32 We ranked industries by average pay based on 2004 data from the Quarterly Census of Employment and Wages, dividing industry subsectors (as defined by the North American Indus-trial Classification System) into three groups, each containing approximately one-third of the workforce.
33 These data are weighted by the 1992 employment of the sub- zone. Unweighted, subzone employment grows faster after desig- nation than before. The weighted and unweighted results are different because smaller subzones grow faster after designation than before, and larger subzones grow slower after designa-tion than before. The weighted estimates are more meaningful, because they reflect the overall effect of enterprise zone designa-tion on jobs and establishments statewide.
34 Spillovers could stem from a number of potential sources, including increased retail “traffic,” rising incomes of nearby residents, and changes in infrastructure.
35 Moreover, the estimates remain similar when we use larger control rings that extend 2,500 feet.
36 Activities qualifying for redevelopment area benefits include the “rehabilitation/reconstruction of existing structures, the redesign/replanning of areas with inefficient site layout, the demolition and clearance of existing structures, the construction/rehabilitation of affordable housing and the construction of public facilities including, but not limited to, public buildings, streets, sidewalks, sewers, storm drains, water systems, and street lights” (California Redevelopment Association, undated). Redevelopment is typically financed through tax-increment revenue.
37 Some evidence shows positive effects of redevelopment areas and federal zones. We do not emphasize these, however, as our research was not designed to assess the effects of these areas in the most definitive way. In particular, the comparison groups fall within either the enterprise zones or the rings around them, which are not necessarily the best comparison groups for estimating the effects of redevelopment areas or federal zones. Rather, the main purpose of this analysis is simply to distinguish between different “parts” of enterprise zone areas that may or may not overlap with redevelopment areas or federal zones.
38 The NETS data do not allow us to determine anything about the particular workers employed by business establishments. However, we can determine whether there is a shift toward lower-paying industries.
39 California Assembly Bill 1550, enacted in 2006, updates standards for evaluation of enterprise zone performance, among other reforms. Insufficient local commitment to supporting the program, defined at the time of zone designation, is potentially grounds for de-designation (Arambula, 2008).
40 We conducted phone interviews in the spring and summer of 2007, lasting typically 30–45 minutes. The survey was a mix of yes/no, 1–5 scales, and open-ended questions. We talked to 36 zone managers; because some are responsible for multiple zones when these are in the same county, the 36 interviews covered all zones in the program listed in Table 1, as well as those we did not include in our quantitative analysis. We identified potential respondents from the list of enterprise zone contacts on the HCD website. We used a standardized survey instrument that included some quantitative and some open-ended questions. We promised respondents confidentiality.
41 Even if longitudinal data were available on questions such as those we asked, we would be skeptical about their reliability in tracking changes in what are, to a fairly large extent, subjective assessments of zone activities.
42 The open-ended responses to the survey made it clear that “earning tax credits” referred to the hiring credit, so we adopt that narrow interpretation.
43 The correlation of facilitating the earning of tax credits is 0.34 (p = 0.10) with employment and 0.30 (p = 0.15) with zone employ-ment density. The correlation of offering other tax incentives, credits, or discounts on public services is 0.33 (p = 0.12) with employment and 0.33 (p = 0.11) with zone density. The correlation of encouraging building additional infrastructure is –0.44 (p = 0.03) with density and –0.35 (p = 0.09) with employment.
44 See, for example, Ernst & Young (undated); Enterprise Tax Services LLC (undated).
45 There is also the possibility of “cross-vouchering,” whereby one zone helps businesses from other zones get vouchers for the hiring credit. According to California Budget Project (2006a), zone administrators charge for this, and some zones adopted lenient documentation standards; indeed, new regulations adopted in 2007 standardized the documentation requirements for vouchering (e.g., California CPA Magazine, 2008; Fine, 2007). Again, this cross-vouchering activity might have detracted from other efforts to boost zone employment, especially if the cross-vouchering is focused on retroactive credits.
27Do California’s Enterprise Zones Create Jobs?
www.ppic.org
27
Bibliography
Arambula, Juan, “California Enterprise Zone Program,” memo-randum, Sacramento, California, March 25, 2008.
Assembly Jobs, Economic Development, and the Economy Committee, “20 Years of California Enterprise Zones: A Review and Prospectus,” Sacramento, California, April 12, 2006.
Billings, Stephen, “Do Enterprise Zones Work? An Analysis at the Borders,” Public Finance Review, 2009.
Boarnet, Marlon, “Enterprise Zone and Job Creation: Linking Evaluation and Practice,” Economic Development Quarterly, Vol. 15, 2001, pp. 242–254.
Boarnet, Marlon G., and William T. Bogart, “Enterprise Zones and Employment: Evidence from New Jersey,” Journal of Urban Economics, Vol. 40, No. 2, 1996, pp. 198–215.
Bondonio, Daniele, and John Engberg, “Enterprise Zones and Local Employment: Evidence from the States’ Programs,” Regional Science & Urban Economics, Vol. 30, 2000, pp. 519–549.
Bondonio, Daniele, and Robert T. Greenbaum, “Do Local Tax Incentives Affect Economic Growth? What Mean Impacts Miss in the Analysis of Enterprise Zone Policies,” Regional Science & Urban Economics, Vol. 37, No. 1, 2007, pp. 121–136.
Bostic, Raphael, and Allen Prohofsky, “Enterprise Zones and Individual Welfare: A Case Study of California,” Journal of Regional Science, Vol. 46, 2006, pp. 175–203.
Bradshaw, Ted, “Cost-Benefit Analysis of California’s Enterprise Zone Program,” Applied Development Economics, Berkeley, California, 2003.
Bradshaw, Ted, “How California’s Enterprise Zones Have Saved the State From Decline,” California Chamber of Commerce, Sacramento, California, 2006.
Busso, Matias, and Patrick Kline, “Do Local Economic Develop-ment Programs Work? Evidence from the Federal Empower-ment Zone Program,” unpublished manuscript, 2007.
California Association for Local Economic Development (CALED), website, undated, available at www.caled.org/ economicdevelopment/press/caled-economic-stimulus-short-and-medium-term-solutions-economic-development.
46 The relevant elasticity is for the extensive margin of labor sup-ply, that is, entry into the labor market in response to a higher wage. There is ample evidence of elastic labor supply on this dimension. See, for example, Juhn (1992), who documents that wage declines for less-skilled black men in the 1960s and 1970s explain the decline in their employment.
47 With the demise of the Long Form of the Decennial Census, Census tract information is going to come from rolling up years of data from the American Community Survey, which could lead to less-reliable Census tract estimates of demographic composi-tion, poverty rates, and so on.
48 This is consistent with evidence from a survey conducted by the Department of Housing and Urban Development, which indicated that large firms used federal enterprise zone tax credits, wage subsidies, and capital writeoffs much more intensively than small firms did (Hebert et al., 2001).
49 See Assembly Jobs, Economic Development, and the Economy Committee (2006, p. 10) for more detail. The fact of no zone de-designations was mentioned in the committee’s December 5, 2005, legislative oversight hearing (Appendix F of the committee report, p. 54).
50 When it initially appeared that Pacoima would be the only rejected applicant, local leaders successfully lobbied the governor to be included in the enterprise zone program. See “No Proof of Zone’s Worth” (2008).

Do California’s Enterprise Zones Create Jobs?28
www.ppic.org
28
California Budget Project, California’s Enterprise Zones Miss the Mark, Sacramento, California, April 2006a.
California Budget Project, New Study Overstates Effectiveness of Enterprise Zones, Sacramento, California, August 2006b.
California CPA Magazine, “CA Enterprise Zones,” August 2008, available at www.calcpa.org/Content/25232.aspx.
California Department of Housing and Community Develop-ment, “Expired Enterprise Zones: Maps and Street Ranges,” undated-a, available at www.hcd.ca.gov/fa/cdbg/ez/enterprise/.
California Department of Housing and Community Develop-ment, “Los Angeles Revitalization Zone,” undated-b, available at www.hcd.ca.gov/fa/cdbg/ez/larz/.
California Department of Housing and Community Develop-ment, “California Enterprise Zone Program: Application for Designation—2006,” Sacramento, California, 2006.
California Franchise Tax Board, Annual Report 2006, available at www.ftb.ca.gov/aboutftb/annrpt/2006/2006AR.pdf.
California Redevelopment Association, “What Can Redevelop-ment Do?” undated, available at www.calredevelop.org/AM/Template.cfm?Section=Home&TEMPLATE=/CM/Content Display.cfm&CONTENTID=1705.
California State Controller’s Office, “Redevelopment Agencies Annual Report,” various years, available at www.sco.ca.gov/ard_locrep_redevelop.shtml.
Cameron, A. Colin, Jonah B. Gelbach, and Douglas L. Miller, “Bootstrap-Based Improvements for Inference with Clustered Errors,” Review of Economics and Statistics, Vol. 90, No. 3, 2008, pp. 414–427.
Dabney, Dan Y., “Do Enterprise Zone Incentives Affect Business Location Decisions?” Economic Development Quarterly, Vol. 5, 1991, pp. 325–334.
Dardia, Michael, Subsidizing Redevelopment in California, Public Policy Institute of California, San Francisco, California, 1998.
Dowall, David E., “An Evaluation of California’s Enterprise Zone Programs,” Economic Development Quarterly, Vol. 10, No. 4, 1996, pp. 352–368.
Elvery, Joel, “The Impact of Enterprise Zones on Residential Employment: An Evaluation of the Enterprise Zone Programs of California and Florida,” Economic Development Quarterly, Vol. 23, No. 1, 2009, pp. 44–59.
Engberg, John, and Robert Greenbaum, “State Enterprise Zones and Local Housing Markets,” Journal of Housing Research, Vol. 10, No. 2, 1999, pp. 163–187.
Enterprise Tax Services LLC, “Enterprise Zone Hiring Credit,” undated, available at http://enterprisetaxcredits.com/enterprise-zone-hiring-credit/
Erickson, R. A., S. W. Friedman, and R. E. McCluskey, Enter-prise Zones: An Evaluation of State Government Policies, Wash-ington, D.C.: U.S. Department of Commerce, Economic Devel-opment Administration, Technical Assistance and Research Division, 1989.
Erickson, Rodney A., and Paul M. Syms, “The Effects of Enter-prise Zones on Local Property Markets,” Regional Studies, Vol. 20, No. 1, pp. 1–14.
Ernst & Young, “Incentives Opportunities,” undated, available at https://wotc.ey.com/Help/IncentivesOpportunities.asp.
Fine, Howard, “Enterprise Zone Regs,” Los Angeles Business Journal, Monday, May 28, 2007, available at www.allbusiness .com/north-america/united-states-california-metro-areas/ 4502391-1.html.
Greenbaum, Robert, and John Engberg, “The Impact of State Enterprise Zones on Urban Manufacturing Establishments,” Journal of Policy Analysis and Management, Vol. 23, No. 2, 2004, pp. 315–339.
Ham, John C., Ayse Imrohoroglu, and Charles Swenson, “Gov-ernment Programs Can Improve Local Labor Markets: Evidence from State Enterprise Zones, Federal Empowerment Zones and Federal Enterprise Communities,” unpublished paper, Univer-sity of Maryland, College Park, Maryland, 2009.
Hebert, Scott, Avis Vidal, Greg Mills, Franklin James, and Debbie Gruenstein, “Interim Assessment of the Empowerment Zones and Enterprise Communities (EZ/EC) Program: A Progress Report,” Office of Policy Development and Research, Washington, D.C., 2001, available at www.huduser.org/ Publications/pdf/ezec_report.pdf.

29Do California’s Enterprise Zones Create Jobs?
www.ppic.org
29
Jacobson, Louis S., Robert T. Lalonde, and Daniel G. Sullivan, “Earnings Losses of Displaced Workers,” American Economic Review, Vol. 83, No. 4, 1993, pp. 685–709.
Juhn, Chinhui, “Decline of Male Labor Market Participation: The Role of Declining Market Opportunities,” Quarterly Journal of Economics, Vol. 107, No. 1, 1992, pp. 79–121.
Kolko, Jed, and David Neumark, Business Location Decisions and Employment Dynamics in California, Public Policy Institute of California, San Francisco, California, 2007.
Legislative Analyst’s Office (LAO), “California’s Enterprise Zone Program,” Sacramento, California, December 5, 2005.
Legislative Analyst’s Office (LAO), “Tax Expenditures and Rev-enue Options,” Sacramento, California, April 7, 2008.
Los Angeles Community Development Department, “State Enterprise Zones,” undated, available at www.lacity.org/Cdd/bus_statecred.html.
Lyman, David, “Zoning for Job Creation and Investment in Southeast Bakersfield,” Kern Economic Journal, Vol. 3, Issue 2, 2001, pp. 10–12.
Lynch, Devon, and Jeffrey S. Zax, “Incidence and Substitution in Enterprise Zone Programs,” unpublished manuscript, University of Colorado, Boulder, 2008.
Netzer, Dick, “Comment,” New England Economic Review, March/April, 1997, pp. 131–134.
Neumark, David, and Jed Kolko, “Do Enterprise Zones Create Jobs? Evidence from California’s Enterprise Zone Program,” unpublished paper, University of California, Irvine, 2009.
“No Proof of Zone’s Worth,” Los Angeles Daily News, March 24, 2008.
Nonprofit Management Solutions and Tax Technology Research LLC, Report to the California Department of Housing and Com-munity Development on Enterprise Zones, August 18, 2006.
O’Keefe, Suzanne, “Job Creation in California’s Enterprise Zones: A Comparison Using a Propensity Score Matching Model,” Journal of Urban Economics, Vol. 55, 2004, pp. 131–150.
O’Keefe, Suzanne, and Roger Dunstan, “Evaluation of Califor-nia’s Enterprise Zones,” California Research Bureau, 2001.
Papke, Leslie E., “What Do We Know About Enterprise Zones?” Tax Policy and the Economy, Vol. 7, 1993, pp. 37–72.
Papke, Leslie E., “Tax Policy and Urban Development: Evidence from the Indiana Enterprise Zone Program,” Journal of Public Economics, Vol. 54, No. 1, 1994, pp. 37–49.
Peters, Alan H., and Peter S. Fisher, State Enterprise Zone Pro-grams: Have They Worked? W. E. Upjohn Institute for Employ-ment Research, Kalamazoo, Michigan, 2002.
U.S. Department of Housing and Urban Development, “Renewal Community Census Tract List,” undated, available at www.hud.gov/offices/cpd/systems/mapping/rcezec/ boundaryfiles/metadata.htm.
U.S. Department of Housing and Urban Development, “State-Designated Enterprise Zones: Ten Case Studies,” Washington, D.C., 1986.
U.S. Department of Housing and Urban Development, “Califor-nia RC, EZ/ECs,” May 15, 2008, available at www.hud.gov/offices/cpd/economicdevelopment/programs/rc/tour/ca/index.cfm.
U.S. General Accounting Office, “Community Development: Federal Revitalization Programs Are Being Implemented, But Data on Use of Tax Benefits Are Limited,” Washington, D.C., 2004, available at www.gao.gov/new.items/d04306.pdf.
Wilder, Margaret, and Barry Rubin, “Rhetoric Versus Reality: A Review of Studies on State Enterprise Zone Programs,” Journal of the American Planning Association, Vol. 62, Issue 4, December 1996, pp. 473–91.

Do California’s Enterprise Zones Create Jobs?30
www.ppic.org
About the Authors
Jed Kolko is associate director of research at the Public Policy Institute of California. At PPIC, Jed has written numerous reports on the California economy, economic development, housing, and technology policy. Before coming to PPIC in 2006, Jed was vice president and research director at Forrester Research, a technol-ogy consultancy, where he managed Forrester’s consumer market research businesses and was the lead researcher on consumer
devices and access technologies. Jed has also worked at the Office of Federal Housing Enterprise Oversight, the World Bank, and the Progressive Policy Institute. He holds a Ph.D. in economics from Harvard University.
David Neumark is a senior fellow in economics at the Public Policy Institute of California, a professor of economics at the University of California–Irvine, a research associate of the National Bureau of Economic Research, a research fellow at the Institute for the Study of Labor, and a fellow at the Stanford University Center for the Study of Poverty and Inequality. He has published numerous studies and books on school-to-work programs, workplace segre-
gation, sex discrimination, the economics of gender and the family, affirmative action, aging, minimum wages, and living wages. He is an associate editor of the Review of Economics of the Household, and on the editorial boards of Industrial Relations, Contem-porary Economic Policy, Journal of Urban Economics, and Economics of Education Review. He has also held positions as professor of economics at Michigan State University, assistant professor of economics at the University of Pennsylvania, and economist at the Federal Reserve Board. He holds a Ph.D. in economics from Harvard University.
Acknowledgments
David Neumark is grateful to the Kauffman Foundation for its support of some of his research on enterprise zones. Both authors thank Marco Anderson, Eric Becker, Amy Ewing, Todd Feinstein, Matthew Gelbman, Ethan Jennings, and Mark Vasquez for their assistance with the research; Toni Symonds and Frank Luera for many helpful discussions about the state’s enterprise zone program; Daria Burnes, Joel Elvery, Mark Ibele, Magnus Lofstrom, Suzanne O’Keefe, Michael Teitz, and Lynette Ubois for their valuable comments; and the many local enterprise zone managers who participated in the survey. PPIC thanks David Coulter for supporting the acquisition of and research with the NETS database.

www.ppic.org
B oard of Dire c tors
WALT ER B . H E W L E T T, CHAI RDirectorCenter for Computer Assisted Researchin the Humanities
M AR K BAL DA SSAR EPresident and Chief Executive OfficerPublic Policy Institute of California
R U B EN BAR R AL E SPresident and Chief Executive OfficerSan Diego Regional Chamber of Commerce
J O H N E . B RYS O NRetired Chairman and CEOEdison International
G ARY K . H AR TFormer State Senator and Secretary of EducationState of California D O N NA LU C A SChief Executive OfficerLucas Public Affairs
K I SU H PAR KDesign and Managing PartnerGruen Associates
CO NS TAN CE L . R I CECo-DirectorThe Advancement Project
T H O M A S C . SU T TO NRetired Chairman and Chief Executive OfficerPacific Life Insurance Company
R AYM O N D L . WAT S O NVice Chairman of the Board EmeritusThe Irvine Company
C AR O L W H I T E SI D EPresident EmeritusGreat Valley Center
PPIC is a private operating foundation. It does not take or support positions on any ballot measures or on any local, state, or federal legislation, nor does it endorse, support, or oppose any political parties or candidates for public office.
Copyright © 2009 by Public Policy Institute of California. All rights reserved. San Francisco, CA
Short sections of text, not to exceed three paragraphs, may be quoted without written permission provided that full attribution is given to the source and the above copyright notice is included.
Research publications reflect the views of the authors and not necessarily those of the staff, officers, or the Board of Directors of the Public Policy Institute of California.
Library of Congress Cataloging-in-Publication Data are available for this publication. ISBN 978-1-58213-135-1

PU B L I C P O L I C Y I NS T I T U T E O F C AL I FO R N IA
500 Washington Street, Suite 600 ● San Francisco, California 94111Telephone 415.291.4400 ● Fax 415.291.4401
PPI C SACR A M EN TO CEN T ER
Senator Office Building ● 1121 L Street, Suite 801 ● Sacramento, California 95814Telephone 916.440.1120 ● Fax 916.440.1121
Additional resources related to economic development policy are available at www.ppic.org.
The Public Policy Institute of California is dedicated to
informing and improving public policy in California through
independent, objective, nonpartisan research.