
dNCUASSIFID (alp)HLL~LLL L JN1DJ4Ui · meter tests (SBPT's) performed in the ENEL-CRI *9'...
112
*/AD-4188 792 SEF N 1/2 dNCUASSIFID (alp)HLL~LLL L JN1DJ4Ui
Transcript of dNCUASSIFID (alp)HLL~LLL L JN1DJ4Ui · meter tests (SBPT's) performed in the ENEL-CRI *9'...

*/AD-4188 792 SEF N 1/2
dNCUASSIFID (alp)HLL~LLL L JN1DJ4Ui

p...
.IF
Lki
.. .... ..... ~
FILEI
AD-A188 792
SELM-O[NG IN PWUVIALL DEPOSITED SANDS
Final Technical Report
by
R. Dellotti. V. Crippa, V.P. Ghionna, N. Jamiolkowski
and P.K. Robertson
I June 1967
United States Army
EUROPEAN RESKAWN OFFICE OF THE U.S. ARNY
Londonl England 1""'" DTICELECTE
C OW 27AC T M D JA4S- 4-C- 034 oo 2 U0 2
a CRIS - MILAN (1Lv) (OH
Approved for Public JMlease, distriumtion unlimited
': 7 t ')0 6

UKCLA'5FIFI , - ,SE:CURITY CLASSIFICATION OF THIS PAGE (l%. 13.1. E.I.,4
REPORT DOCUMENTATION PAGE READ INSTRUCTIONSBEFORE COMPLETMNG FORMi. REPORT NUMBER . GOVT ACCESSION NO S. REICIPIEMT-S CATALOG NUMBER
4. TITLE (-d S.b911h.) k.,TY IE; OF REPORT A PEIFO COVEREDFINAL TECHNICAL REPORT
SELF-BORING PRESSUREMETER IN PLUVIALLY A 'A "r 'DEPOSITED SXNDS 6. Pf FORMIG ORG. REPORT NUMBER
BELLOTTI7. AUTHOR(.) 4. CONTRACT OR GRANT NUNMBEWR.)
.liiA 4S-f4--cz- 0Oo 4.R. Bellotti, V. Crippa, V.N. Ghionna,
BELLO -05M. Jamiolkowski, and P.K. Robertson
P. PERFORMING ORGANIZATION NAME AND ADDRESS 10. PROGRAM ELEMENT. PROJECT. TASKAREA & WORK UNIT NUMBERS
ENEL-CRIS bn I o2A.Via Ornato, 90/1420162 - MILANO (ITALY) I L C1 ItO2_aW51EiV-I
II. CONTROLLING OFFICE NAME AND ADORESS IM REPORT DATE
b LX - rA FP C hiV c%C)Isr 1j)k 1. NUMBER OF PAGES
t4. MONITORING AGENCY NAME A AD RESS(I difNrnI f.. C Ioloifn O11 1e) IS. SECURITY CLASS. (o &d.poa)
UNLP 7 V 'i F ii.T,IS.. OECLASSFICATION OWNGRADING
SCHEDULE
I. OISTRIOUTION STAT MENT (of lb %Ifep .l)
17. OISTRIBUTION STATEMENT (Of .e mltSi .. t.,d 1. 81-k 20. It dill# f R.pon)
IS. SUPPLEMENTARY NOTES
I9. KEY WOROS (CSiwi. I ... .. .9 If a..A* 7 ..- d ef- 111 &F' 91.6k a-A..)
Self-boring pressuremeter, Sands, Initial in-situ horizontal stress,.
Shear modulus, Shear Strength, Limit Pressure, Calibration Chamber
MA. AM TUAC? (C.&U -- Aft. It - lr -d 1~11iir O*. -9 -)
This report presents the results of 47 self-boring pressuremeter (SBP) tests
performed under strictly controlled boundary conditions os pluviallydeposited Ticino and Hokksund sand samples in the Calibration Chamberexisting at ENEL-CRIS (Milan-Italy): N*25 tests were performed with the
probe in place during sample preparation and N'22 with the probe self-bored
into saturated sand.
DD I 14n COrON Or I NOV AS IS OWSOICIC L4AduEASECURITY CL AISIFICATION 401 194I PA.IE (59.. DW. E,.i

SECURITY CLASSIFICATION OF THIS PAGC( -h D.,. EnId)
20. The purpose of the testing was to evaluate the performance of the self-
boring pressuremeter and to critically review existing interpretation
methods of SBPT in sand.
1
AeeoSelon 1or
DTIC TAB 0Unannounoed 03Justitloatto
By
Distrlbutlen/
AvallablltY Codos
Ddst 3,00151
(CUQITY CLASSfICATION Of THIS PAGE(V1% DoW. 1.'M.rE)
AL.
01
TABLE OF CONTENTS
1. INTRODUCTION .................................... page 5
2. TEST EQUIPMENT .................................. page 52.1. Calibration Chamber (CC) .................. page 52.2. Self-boring Pressuremeter ................. page 6
3. TEST SAND ........................................ page 7
4. TEST PROCEDURES ................................. page 74.1. Sample Formation ........................... page 74.2. Probe Installation ......................... page 7
4.2.1. Ideal ............................... page 74.2.2. Self-bored .......................... page 8
4.3. Sample Stresses ............................ page 84.4. Pressuremeter Expansion ................... page 9
5. TEST RESULTS ..................................... page 105.1. Initial Horizontal Stress ................. page 10
5.1.1, Initial Horizontal Stress:Ideal Installation ................. page 10
5.1.2. Evaluation of Stress Concentration page 115.1.3. Mechanical Compliance of Strain Arms page 115.1.4. Evaluation of Arching Effects ...... page 135.1.5. Initial Horizontal Stress:
Self-Bored Installation ............ page 135.2. Shear Modulus .............................. page 145.3. Shear Strength ............................. page 215.4. Limit Pressure ............................. page 255.5. Boundary Conditions ........................ page 25
6. SUMMARY AND CONCLUSIONS ......................... page 26
LITERATURE CITED ................................ page 29
NOTATIONS ........................................ page 32
TABLES
FIGURES
APPENDIXES

02
LIST OF TABLES
TABLE 1: SUMMARY OF INSTALLATION CONDITIONS DURING SELF-BORING
TABLE 2: SUMMARY OF GENERAL CALIBRATION CHAMBER CONDITIONSAFTER SAMPLE CONSOLIDATION
TABLE 3: SUMMARY OF PROBE AND CC CONDITIONS DURING SELF-BOREDTESTS
TABLE 4: SUMMARY OF LITF-OFF PRESSURES OF INDIVIDUAL ARMS
TABLE 5: SUMMARY OF LIMIT PRESSURE AND SECANT SHEAR MODULUS
TABLE 6: SUMMARY OF 1ST UNLOADING-RELOADING CYCLE
TABLE 7: SUMMARY OF 2ND UNLOADING-RELOADING CYCLE
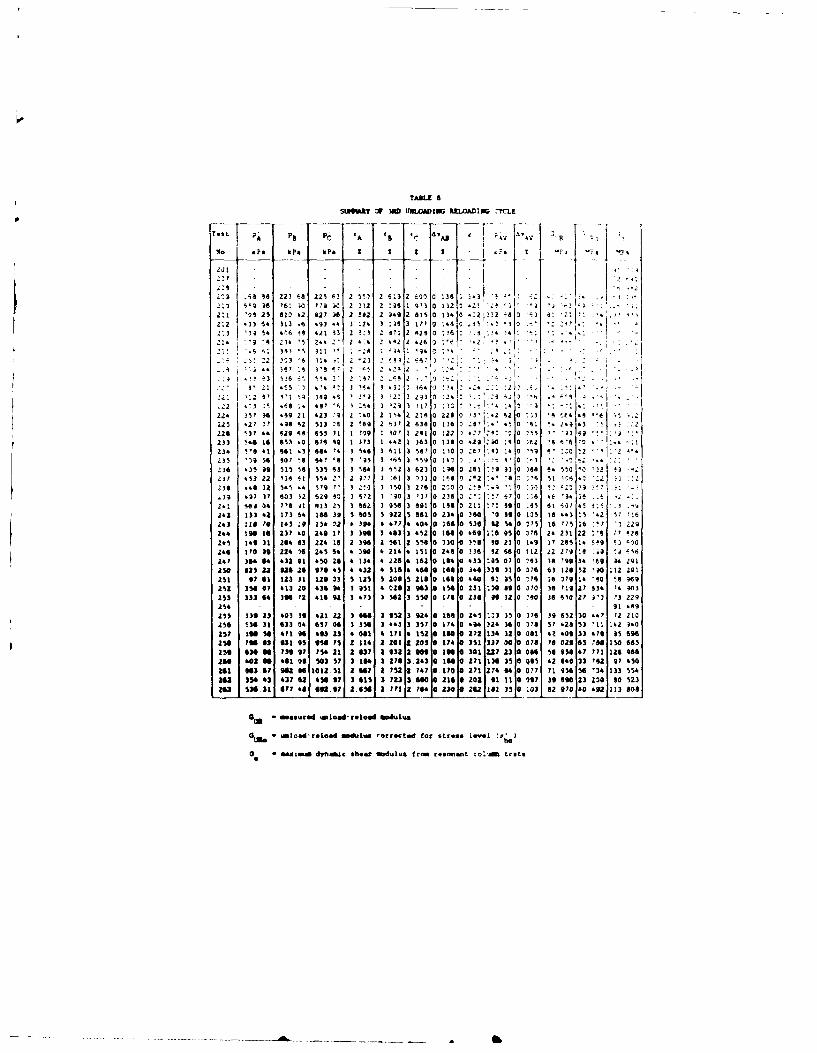
TABLE 8: SUMMARY OF 3RD UNLOADING-RELOADING CYCLE
TABLE 9: SUMMARY OF 4TH UNLOADING-RELOADING CYCLE
TABLE 10: SUMMARY OF 1ST RELOADING-UNLOADING CYCLE
TABLE 11: SUMMARY OF CALCULATED ANGLES OF FRICTION ANDDILATANCY [#cv = 34-1
ILIST OF FIGURES
FIG. 1: SCHEMATIC CROSS-SECTION OF ENEL-CRIS CALIBRATIONCHAMBER
FIG. 2: SCHEMATIC OUTLINE OF CC LOADING AND DATA ACQUISITIONSYSTEM FOR SBPT IN SAND
FIG. 3: SCHEMATIC OUTLINE OF SELF-BORING PRESSUREMETER PROBECANKOMETER MARK VIII
FIG. 4: GENERAL CHARACTERISTICS OF TICINO AND HOKKSUND SAND
FIG. 5: SCHEMATIC OUTLINE OF SAND SPREADER
FIG. 6: SCHEMATIC OUTLINE OF IDEAL INSTALLATION PROCEDUREIN CC
FIG. 7: SCHEMATIC OUTLINE OF SELF-BORING INSTALLATIONPROCEDURE IN CC

03
FIG. 8: EXAMPLE OF TYPICAL SAMPLE CONSOLIDATION
FIG. 9: AVAILABLE BOUNDARY CONDITIONS IN CC
FIG. 10: TYPICAL TEST RESULT FROM SBPT IN CC
FIG. 11: COMPARISON BETWEEN MEASURED AVERAGE LIFT-OFF SrRESSES(po) AND APPLIED BOUNDARY STRESSES (aho) :IDEAL INSTALLATION
FIG. 12: 1-D STRESSING OF CAMBRIDGE Ko - CELL IN CC
FIG. 13: EXAMPLE OF STRAIN ARM COMPLIANCE DURING SAMPLECONSOLIDATION STAGE
FIG. 14: EXAMPLE OF PRONOUNCED MECHANICAL COMPLIANCE OF STRAINARMS DURING PRESSUREMETER EXPANSION
FIG. 15: DETAILS OF ORIGINAL AND MODIFIED SBP STRAIN ARMS
FIG. 16: COMPARISON BETWEEN MEASURED AVERAGE LIFT-OFF STRESSES(po) AND APPLIED BOUNDARY STRESS (oho):SELF-BORED INSTALLATION
FIG. 17: SCHEMATIC OF SHEAR MODULI FROM SBP TEST
FIG. 18: SCHEMATIC OF EFFECTIVE STRESS PATH OF SOIL ELEMENT
ADJACENT TO AN EXPANDING PRESSUREMETER
FIG. 19: SCHEMATIC OF UNLOADING-RELOADING CYCLE DURING SBPT INSAND
FIG. 20: TYPICAL RESULTS OF SIMPLE SHEAR TESTS ON SAND (AFTERSTROUD) AND THE IDEAL SOIL MODEL ASSUMED BY HUGHES ETal. (1977).
FIG. 21: CALCULATED STRESS STRAIN RELATIONSHIPS FROM TESTNo.222 (DR - 46.2%) USING METHOD BY MANASSERO (1987)
FIG. 22: CALCULATED STRESS STRAIN RELATIONSHIPS FROM TESTNo.228 (DR - 77%) USING METHOD BY MANASSERO (1987)
FIG. 23: ANGLE P; DEVIATION OF ESP FROM ISOTROPIC ELASTICBEHAVIOUR (FOR WHICH @ - 90)
FIG. 24: DETERMINATION OF #Cv FROM RING SHEAR TESTS
FIG. 25: COMPARISON OF CALCULATED #Ps ROM SBPT AND EQUIVALENTO FROM TRIAXIAL TESTS

04
LIST OF APPENDIXES
APP. I : EXAMPLE OF COMPUTER GENERATED PLOTS FOR TYPICAL TESTRESULT
APP. II : COMPLETE LISTING FOR EACH SBPT RESULTS
APP. III: CALCULATION OF AVERAGE STRESS ON HORIZONTAL PLANEAROUND EXPANDING CAVITY
APP. IV DETAILS ON MANASSERO (1987) METHOD FOR DETERMINATIONOF * FROM SBPT IN SAND
1

05
1. INTRODUCTION
This report presents the results of 47 self-boring pressure-meter tests (SBPT's) performed in the ENEL-CRI *9' calibrationchamber (CC). The tests were performed in dry and saturatedTicino and Hokksund sand. Pressuremeter tests were performedwith the probe in-place during sample preparation (1adeal in-stallation-) and with the probe self,-bored into the saturatedsand.The purpose of the testing was to evaluate the performance ofthe self-boring pressuremeter (SBP) probe under strictlycontrolled laboratory conditions and to critically reviewexisting interpretation methods of the SBPT in sands. The SBPprobe used in the study was the Camkometer Mark VIIImanufactured by Cambridge In-situ Ltd., England.
F
2. TEST EQUIPMENT
2.1. Calibration Chamber (CC)
The ENEL-CRIS calibration chamber was designed to calibrate andevaluate different in-situ testing devices in sands understrictly controlled boundary conditions.A complete description of the chamber is given by Bellotti etal. (1982). The equipment consists of a double wall chamber, aloading frame, a mass sand spreader for sand deposition and asaturation system. The chamber can test a cylindrical sample ofsand 1.2 m (3.9 feet) in diameter and 1.5 m (4.9 feet) inheight.A schematic cross-section of the ENEL-CRIS calibration chamberis shown in Figure 1.The sample is confined laterally with a flexible rubbermembrane surrounded by water through which the horizontalstresses are applied. The bottom of the sample is supported ona water filled cushion resting on a rigid steel piston.The vertical confining stress is applied through the waterfilled base cushion and vertical deflection of the sample iscontrolled by the movement of the base steel piston. The top ofthe sample is confined by a rigid top plate and fixed beam.The double-walled chamber allows the application of a zeroaverage lateral strain boundary condition to the test sample bymaintaining the pressure in the double-wall cavity equal to thelateral pressure acting on the sample membrane.
(*) ENRL - CRIS: Italian National Electricity Board - Hydraulicand Structural Research Center.

06
The axial and lateral confining pressures can be variedindependently so that the ratio of the applied horizontal
stress (oh) to the vertical stress (av) can be maintained atany desired value.
A schematic cross-section of the CC loading system is shown in
Figure 2.
2.2. Self-boring Pressuremeter
The SBP probe used in the study was the Camkometer Mark VIIImanufactured by Cambridge In-Situ Ltd., England. A schematic
outline of the SBP probe is given in Figure 3.The SBP probe is essentially a thick walled steel cylinder witha flexible membrane attached to the outside. The instrument isadvanced into the ground as the soil displaced by a sharpcutting shoe is removed up the center of the probe by theaction of a rotating cutter inside the shoe. The cuttings areflushed to the surface by water or drilling mud which is pumpeddown to the cutting head.The cylindrical adiprene membrane used in this study was 82 mmin diameter and 490 m in length, corresponding to a length todiameter ratio (L/D) of approximately 6. The adiprene membranewas designed to be flush with the body of the probe. An outerflexible protective membrane with stainless steel strips("chinese lantern") can be placed over the adiprene membraneduring penetration and testing in dense or abrasive soils.Once the instrument is at the desired test depth, the membraneis expanded against the soil using pressurized N2 gas. Theradial expansion of the membrane is measured at the mid-heightof the membrane by three pivoted levers, called strain arms.The strain arms are located at 120 degrees around thecircumference. The strain arms are kept in light contact withthe inside of the membrane by strain gauged cantilever springs(Figure 3). Individual and average readings were taken of thethree strain arms. The sensitivity of the strain arms wasapproximately 0.02 mm/mV.A strain gauged total pressure cell (TPC) is located inside theprobe to measure the inflation gas pressure. Two strain gaugedpore pressure cells (PPC) are also incorporated into the
membrane. The sensitivity of the PPC and TPC was approximately
8 kPa/mV.The data from all six transducers (3 strain, 1 total pressure,
2 pore pressure) was collected by the original data acquisition
system consisting of a data capture unit, and a thermal paperprinter with the addition of a cartridge equipped HP 9825computer and a wider paper tape printer. The output was alsorecorded on a four channel Y-T chart recorder and an X-Yplotter for simultaneous plotting of raw data (Fig.2).

07
3. TEST SAND
Two natural sands have been tested; Ticino sand from Italy andHokksund sand from Norway. Both sands have a uniform gradationand are medium to coarse grained with a mean grain size,D50=0.53 mm, and 0.39 mm for Ticino and Hokksund sand, re-spectively.General characteristics of the sands and grain sizedistributions are given in Fig.4.A detailed description of the physical properties of the twosands is given by Baldi et al. (1985).During the course of the testing different batches of Ticinosand were used. However, each batch was tested to ensureconsistent grain size characteristics.
4. TEST PROCEDRES
4.1. Sample Formation
All test samples were prepared by pluvial deposition of drysand in air using a gravity mass sand spreader (Jacobsen,
1976). A schematic representation of the mass sand spreader isshown in Figure 5.
The pluvial deposition method has the following advantages;good repeatibility
wide range of obtainable relative densities
(20% s DR & 98%)• good homogeneity of sample* cost effectiveness.
The homogeneity of the samples is generally good althoughsomewhat erratic for medium dense specimens (40% s DR s 60%).
Full details concerning sample homogeneity is given by Baldi etal. (1985).Sample formation is performed in one operation and the sandcontainer holds enough sand necessary for specimen preparation.
4.2. Probe Installation
4.2.1. Ideal
To evaluate and avoid the influence of the self-boringinstallation on the pressuremeter results a series of testswere performed with "ideal installation".
For ideal installation the probe was placed in the CC beforesample formation. A schematic outline of the ideal installation
procedure is shown in Figure 6.

08
The SBP probe was placed in the center of the CC with the mid-height of the membrane approximately 65 cm (25 inches) from thesample base. A protective cylinder was placed above the probeand extended up to the base of the sand container (see Fig.6).This was done to avoid sand falling onto the top of the probeduring sample formation.
4.2.2. Self-bored
To simulate field self-boring conditions a series of tests wereperformed with the probe self-bored into the CC. A schematicoutline of the self-bored installation procedure is given inFigure 7.The sand samples were first formed using pluvial deposition andthen saturated with de-aired water. Full details of thesaturation procedures are given by Bellotti et al. (1982). Theprobe was self-bored into the CC using water as the flushingfluid. Drainage was generally allowed at the base of thesample. A summary of the installation conditions during self-boring is given in Table 1.Installation was performed with various boundary conditions inorder to evaluate their influence on the test results (seeTable 1).A small vacuum (5 t/m2) was applied to the inside of the SBPprobe to maintain the adiprene membrane in close contact withthe body of the probe.The cutter speed was generally maintained at a rate of about 60revolutions per minute. The distance of the cutter from theleading edge of the cutting shoe was varied from about 1.9 cm(0.75 inch) to 5.4 cm (2.13 inches). For the tests in densesand the adiprene membrane was generally protected by using thechinese lantern. The size of the cutting shoe was adjusted tobe the same diameter as the membranes.The probe was advanced into the CC at a rate of about 3 cm/mn.(1.18 inches/min).A flowmeter was used to monitor the flow rate of the flushingwater sent to the cutter. The flow rate was generally about 9to 12 lt/min. The flow rates from the probe and calibrationdrainage lines were also monitored. During the installation,the CC pore pressures and boundary stresses and strains weremonitored. All the sand flushed out from the CC duringinstallation was carefully collected and weighted (oven-dry).
4.3. Sample Stresses
Following sample formation and probe installation, the samplewas subjected to one-dimensional consolidation under conditionsof no average lateral strain (i.e. Ach - 0). Normally

09
consolidated (NC) and mechanically overconsolidated (OC)specimens were reproduced.During the loading and unloading consolidation phases, changesin vertical effective stress (a,) and the correspondingvertical strain (ev) were recorded. This allowed thecalculation of the constrained modulus (NO) and the coefficientof earth pressure at rest (Ko).A summary of the general CC conditions at the end ofconsolidation is given in Table 2.An example of data collected during a typical sample stressingis given in Figure 8.During the SBPT the sample boundary conditions could becontrolled.A summary of the possible boundary conditions is given inFigure 9.The boundary conditions applied during each pressuremeter testare given in Table 2.The most common boundary condition applied was constantvertical (ov = constant) and horizontal (oh = constant)stresses (BCI).
4.4. Pressuremeter Expansion
After sample stressing and the self-boring insertion whenappropriate, the pressuremeter test was performed by expandingthe membrane to a maximum cavity strain (co) of about 10%.Cavity strain is defined in terms of circumferential strain;
to A ... (1)O Re
where:Ro = initial cavity radiusAR - increment of cavity radius.
Generally, before the beginning of the expansion phase, arelaxation time ranging between:
* 30' to 60' in tests with ideal installation* 60' to 180' in tests with self-boring installation
was allowed.Only strain controlled tests were performed using an electronicStrain Control Unit (SCU) supplied by Cambridge In-Situ Ltd.The SCU automatically adjusts the expansion pressure as afunction of the output from the strain arms.Constant strain rates of O.1%/hour up to 2% per minute can beachieved. Generally, tests were performed at a strain rate ofabout 1%/minute.Generally, during each expansion phase, two or three unloading-reloading (UR) loops and, during the contraction phase, one ortwo reloading-unloading (RU) loops were performed. The strain

10
amplitude for each UR or RU loop was maintained constant and inthe order of 0.1 to 0.2%.An example of a typical pressuremeter test result is shown inFigure 10.Typical pressuremeter tests show the average strain for thethree strain arms. The average strain is calculated at anyinstant in time as the numerical average of each strain armmeasurement.A summary of the probe and chamber conditions for the testsusing self-bored installation is given in Table 3.Data from all transducers in the SBP probe were stored oncomputer cassettes and printed in digital form on a paper tapeprinter. After each test the basic data was processed andcorrected for membrane stiffness. Examples of the computergenerated plots are given in Appendix I.
5. TEST RSULTS
A complete listing of all the test results is given in AppendixII.
5.1. Initial Norizontal Stress
It is generally postulated that, if the SSP probe is insertedinto the ground with minimum disturbance to the surroundingsoil, the total horizontal stress (Oho) existing in the soilprior to insertion can be measured. The aho is measured byrecording the corrected SBP cavity pressure (po) causing "lift-offw of the pressuremeter membrane. This postulation should beespecially valid in the case of the 0ideal-installationO usedin the CC for test No.201 to 236, inclusive and No.262 and 263.Table 4 presents a summary of lift-off stresses for each strainarm. The lift-off stress was determined from a visual inspec-tion of the early part of the expansion curve.
5.1.1. initial Borisuatal Stres: Ideal Installation
Examination of the results in Table 4, for ideal installation,shows that the measured average lift-off stress (p.) is oftensignificantly different than the applied boundary stress (Ohe).Figure 11(a) presents a comparison of the measured averagelift-off stress and the applied boundary stress for the testswith ideal-installation.The average lift-off stress is defined as the observed "lift-off" from the cavity expansion versus average strain plot, asshown in Flg.1O. This lift-off is generally very close to thefirst lift-oft of one of the arms.

rhe reasons for the differenes are not clear btut sty re 'tasedby one or more of the following;
a. stress concentration around the riqid h-P prcbe l ring
one-dimensional stressing,b. mechanical compliance of the strain arms,
c. arching effects caused by the presence A sn snnLoAs .)tlooser sand around the iSP probe.
In the field. the possible existance of anisotropic stress
fields (Dalton and Ha kins 11482)) should also be onsilered,
but this possibility oess not exist in the trraxal C ests.
5.1.z. veluattom of Stream Conmmtration
rho possib lity of stress 7oncentrations tr.und he pi te .n
the CC durinq the consolidation staqe oas ,nvest jated usinq triqid selt-borin Ko-cell manufactured by i'mvbridqe :n-sirua
Ltd. The K -cell has the same diameter as the iSP probe and
consists o? a rigid steel 7ylinder with a wo-cell mounted flush
on one side. The K -cell is strain-qauqed and >perated on i
null-indicator prnCripIe. ;as pressure 3n the inside f the
cylinder is constantly adjusted to ensure no lateral strain 3f
the Ks-cell.
One test was performed CTest W22e) using the g -oell with
ideal-installation in the CC. Tre test was carried out using
Ticino sand at a DI 6O%. The sample w4s stressed under
boundary conditions IW J up to a stress of -h 0il 2 iand
avo " 6.2 k/cu 2 . A comparison between the applied horizontalstrem (a ) nd the measured stress (Ph) record with the g o
cell is s= in Figure 12.
The results from this special test indicate that there is
little or no stress concentratlon around the S&P probe after
ideal-installation in sand in the CC. A coarison between the
I -cell results and the SFW probe results is also included in11.
5.1.3. Mo~miasl 05ilami * Stue ArhmThe problem f m eical cm*lace s the strain arms hasbeen investigated in detail. The first indications of thisphniomes eerged durilg SMP tests performed at severel ItalLanclay and sand sites using the sae SUP ealipment used in thisstudy [Ghionna et &l. (1963). Jamiolkowsli et &1 lS),B~russi at &1. (19816)).
The following obser ations emerged from the field tests.a. the *lift-oft pressures froe each strain arm were
almost alweys different. This occured ewes in soil
deposits for which it was difficult to justify. base"
on geologic history, the presence of afisotropichoriLsontal in-situ stresses.

12
b. the differences between the three measured "lift-off"
pressures tended to increase with increasing soilstiffness and ambient in-situ soil stress.
These observations indicated a possible problem due tomechanical compliance of the strain arms. These problems where
further confirmed during the CC testing when the followingobservations were made;
* despite the *ideal installationO of the SBP probe andthe simple stress history of the CC specimens, different"lift-off' pressures were recorded for each of the threestrain arms. The difference was more pronounced in theqtiffer samples,
. during the sample stressing with the probe installed,apparent inward movement of the strain arms was recordedwhen the radial chamber stress was increased andapparent outward movement when the chamber stress wasdecreased. An example of this phenomenon is shown inFigure 13.
rigure 14 presents the results of the initial portion ofexpansion curves recorded with each strain arm and with theaveraged strain for a test with pronounced mechanicalcompl iance.The mechanical compliance of the strain arms tends to confusethe initial part of the expansion curves and makes the
detection of the lift-off pressure uncertain.The detection of the lift-off pressure becomes more difficultwith increasing stiffness of the surrounding soil because theslope of the initial portion of the expansion curve becomesvery steep.In an effort to eliminate or at least reduce the mechanicalcompliance the three strain arms were modified.& comperison between the oriqinal and modified strain armdeigns is sh in Figure 15. The modified arms had thefollowing major changes;
* the body of the arms were ode thicker and stiffer andwere machined from stainless steel instead of theoriginal brasa,
* the aligmt of the pivots and arms with respect totheir seats on the probe body were improved.
* the pivots were modified by using precision miniaturebearings.
All the tests from *Ills onwards used a SOP probe with the
modified strain arms.Pigure 11(b) shows a comperiam between the measured averagelift-off stress (with mlfied arm) and the applied chamberstress fee the remsiniig CC tests vith ideal-installation. ThereMts indicate that the mdificetims to the strain am haveiamimised to em extent the mechanical compliance but have notcoletely removed the probles.

13
At pesent, based on the CC results using ideal installation itappears that the strain measuring system in the existingversion of the Cambridge In-Situ Ltd., Cankometer (Mark VIII)requires radical changes in order to improve the precision ofthe measured lift-off pressures, especially in stiffer soils.
5.1.4. Evaluation of Arching Effects
The possible problem of arching around the SBP probe has notbeen directly investigated. The experience gained in theevaluation of sample homogeneity of pluvially deposited CCsamples (Baldi et al., (1985)] indicates that DR tends toincrease slightly towards the center of the sample. However,this experience refers to samples formed without the SBP probeinstalled inside the CC.
5.1.5. Initial Rorizontal Stress: Self-Bored Installation
Figure 16 compares the measured average lift-off pressuresagainst the applied boundary stress (Oho) for the CC tests withself-boring installation. In almost all cases the measuredaverage lift-off stress is less than the applied stress andoften close to the water pressure in the CC. This indicatessignificant sample disturbance during the installation,especially in loose and mdium dense samples.The ratio between the average lift-off stress (po (AV)) and theapplied boundary stress (Oho) for the self-bored installationis:
p0 (AV) - 0.47 ± 0.28 ... (2)
Oho
Table 4 presents a summary of the individual lift-off pressures
for each strain arm. Examination of Table 4 shows that, for theself-bored installation, the variation between lift-offpressures from the individual arms in extremely large.
Because sands are generally stiff in comparison to soft clays,the measurement of in-situ stress in sands is extremelydifficult.A slight outward disturbance during self-boring will tend toproduce an overestimate of sho. A slight inward disturbanceduring self-boring can cause the sand around the probe to archand produce a significant underestimate of Oho.
Based on the CC results, it appears that the measurement of in-situ stresses in sands using the self-boring pressuremeter isextreelly sensitive to disturbance.

14
5.2. Shear Modulus
The evaluation of deformation characteristics of soils from theresults of a SBPT is usually linked to the assumption that theprobe is expanded in a linear, isotropic, elastic, perfectlyplastic soil. With this assumption the soil surrounding theprobe is subjected to pure shear only. This holds trueprovided the applied pressuremeter cavity effective stress (p')stays below the yield stress (p,) of the soil element adjacentto the cavity wall. The values of pl in a purely frictionalCoulomb material is given by the formula (Baguelin et al.(1978):
= pL (1 + sin )... (3)
For the range of effective cavity stress p" < p's pl, theexpansion curve should have a constant slope dp/de, = 2 Gi(Baguelin et al. (1972, 1978)where:Gi = initial shear modulus of tested soil, see Fig.17
The above is true for SBPT's performed in an infinite medium(i.e. in-situ). However Fahey (1980) demonstrated that becauseof the limited dimensions of a CC the initial slope ofexpansion curves obtained in the CC tend to be sligthly toosmall. In this study, the effect of the limited dimensions ofthe ENEL CRIS CC has only a minor effect, resulting in areduction of less than 3% on the measured values of G.The definition of Gi given above implicity incorporates thefollowing simplified assumptions:
a. The length (L) to diameter (D) ratio of the probe issufficiently large to ensure deformations of thesurrounding soil occur in plane strain conditions(dZ = 0).
b. The expansion proceeds with no volume change in thesurrounding soil mass (i.e. linear, isotropic elasticmaterial).
c. All soil elements surrounding the expanding cavity have
the same stress strain characteristics.
The first assumption (a) appears reasonable for the Camkometerprobe used in this research, where the L/D-6. The otherassumptions (b) and (c) are both stri'ctly linked to thehypothesis made about the stress-strain relationship of soil.Both assumptions require that the effective stress path (ESP)projected on the horizontal plane should have a shape as shownschematically in Fig.lS. In reality because of, the strain non-linearity, elastic anisotropy, and work hardening plasticity,etc., the behavour of sands deviates from that of theisotropic-elastic perfectly plastic material so that volume

15
changes occur even during the early stage of the expansion. Amore realistic ESP, as obtained by Manassero (1987), isqualitatively also shown in Fiq.18. Comparison of the twostress paths shown in Fig.18 clearly indicates that beyond theinitial elastic stage (point 1') the mean effective stress (a;)in the soil surrounding the expanding pressuremeter probe isnot constant and consequently the volumetric strain cannot beequal to zero.
Since the modulus (Gi) can only be determined with validityfrom the very early part of the expansion curve the value isvery sensitive to disturbance.An alternative to the assessment of Gi from the initial part ofthe expansion curve is to evaluate G from correctly performedunloading-reloading (GUR) and reloading-unloading (GRu) loopsas illustrated in Fig.17. According to Wroth (1982) theamplitude of the unloading should be performed in such a manneras to avoid the failure of the soil at the cavity wall inextension. For an isotropic-elastic, perfectly plastic materialthe magnitude of the effective cavity stress change (Ap')during an elastic unloading should therefore not exceed thefollowing:
Ap, 2 sin OPS (4)1 + sin #PS
where:
#PS = friction angle under conditions of plain strainp = effective cavity stress at which unloading loop starts.
The slope of the secant within the loop, (see Fig.17) is againequal to 2 GUt or 2 GM. Both GU and GRU represent an"elastic" shear stiffness of the tested sand. Within theframework of elasto-plasticity it can be demonstrated thatduring a drained test any unloading of the expanding cavitywall will bring the surrounding soil below the current yieldsurface. Inside this yield surface, (see Fiq.19) the strainsare small and to a large extent recoverable.In addition to the above mentioned moduli (Gi, GUR, GRU) it isalso possible to evaluate directly from the expansion curvethe secant pressuremeter modulus Ga, as shown in Figure 17. Theassessment of Go is also based on the assumption of an elasticsoil behaviour which, except for the ve-,-y early part of theexpansion curve where Go - G, and during unloading-reloadingcycles, is conceptually not true.Despite the lack of a clear physical meaning, Go is frequentlyincorporated in the empirical design rules for shallow and deepfoundations in France (aguelin et al. (1978)).Table S reports the values of Go computed at cavity strainsequal to 0.5%, 1.0% and 1.5%.

16
Values of GUR for the different unloading-reloading cycles aregiven in Tables 6 to 9. Values of GRU for the reloading-unloading cycle are given in Table 10.
In all soils, and especially in sands, the early part of theself-bored pressuremeter curve is strongly influenced bydisturbance due to the installation. Therefore, Gi and Gs arealso strongly influenced by disturbance. On the other hand, GURand GRU are almost completely independent from the initialshape of the expansion curve and hence, independent fromdisturbance.Despite this advantage, there is still the problem of how toapply the measured GUR and GRU values in engineering design.This requires some assessment of the average stress and shearstrain levels relevant to the measured moduli [Robertson(1982). As with all boundary value problems this is difficultto assess and requires a number of simplifying assumptions.
Concerning the relevant stress level, existing pratice has beento refer GUR to the average stress existing around theexpanding pressuremeter probe. This average stress may beeither the mean octahedral effective stress [Robertson (1982)]or the mean value of the plane strain effective stress [Faheyand Randolph (1984)].In this study the latter stress will be adopted.When a value of the reference stress has been selected, thefollowing tentative procedure can be used to relate themeasured GUR and GRU values to any level of effective stress:
Consider the value of GUR corresponding to a given valueof the double shear strain amplitude of the cycle(A7 = 79 - 7A) and to the effective cavity stress fromwhich the cycle starts (pcf), see Fig.19 and Tables 6through 10.
Compute the weighted average of the current effectivestress (pAy) existing around the SDP probe at p ,adopting an appropriate constitutive equation:
PAV - X PC ... (5)
For elastic perfectly plastic material, referring to theaverage stress on the horizontal pl.-ne existing in theplastic zone (rc s r s P ), the parameter x can becomputed from the followlng equation, see also AppendixIll:

17
(~1-sinoPs~ ;l(+sin PS) -- (6x .. . (6)
•[ -sin ]PS, 2 P P 2[~~1-1Oo (1+sin , -
where:ao= initial effective horizontal stress. In a high
quality SBPT o should be closed to the measuredeffective lift-off pressure p.
I - sin OPS- 2 sin P (7)
2 sin OPS2 + ... (8)
r = radial distance from center of cavityRp= radius of plastic zonerc= radius of cavity when cavity pressure = p
In practice the true value of a o is generally unknown,therefore, the assessment of x is made by introducinginto the above formula the measured value of p,.The values of x computed for each SBPT performed in theCC are given in Tables 6 through 10 together with thecorresponding values of PAV"The use of the relationship, pAV = x pc, is correctprovided the following condition is satisfied:
,. ~ ~p, > a~o (I + sin OPS) . 9
If this condition is not fulfilled the PjV should beassumed equal to uoo M p;-
Once the PjV is assessed it is possible to compute themodulus number K0 from the following empirical formulaproposed by Janbu (1963):
fPjv nmUR - P'I a j (10)
where:- modulus number
n - modulus exponentpa - reference stress, usually pe - 90.1 kPa
PV - average effective stress around the probe
. . . . . .. . .. . .. . .. ..... ... ... .... .... .... .... .. -,b _ .. . ... .. ... .. . . .. S

For sand, the modulus exponent is generally within therange of 0.4 to 0.5, with a slight tendency to increasewith increasing level of strain [Wroth et al. (1979).Knowing the value of KG it is possible to compute theshear modulus G for any desired stress level.
Following the procedure outlined above, the measured GUR andGRU values for each cycle have been referred to the effectivehorizontal stress aAo applied to the boundary of the CCspecimen, assuming n=0.43 as obtained by Lo Presti (1987). Thecorresponding values of GURo and GRUo are given in Tables 6through 10.
The same tables also show the values of maximum dynamic shearmodulus (GO) obtained from resonant column tests performed byLo Presti (1987) on pluvially deposited Ticino sand. The valueof Go corresponding to each SBPT has been computed using thefollowing empirical equation based on the experimental dataobtained by Lo Presti (1987):
Go = 647.0 ( ho 10.43 (2.27 - e) 2 ... (11)
I Pa l+e
where:e = void ratio of the sand in the CC (*)
Pa - reference stress = 98.1 kPa
In order to make a meaningful comparison between the GURO andGO values it is necessary to consider other factors influencingthe deformation characteristics of sand. Among them, the mostrelevant is the strain level. Each cycle is characterized bythe double shear strain amplitude (6T) at the cavity wallwhere:
A7 m 7B - 7A = 2 (eoB - eoA) ... (12)
Values of 67 are reported in Tables 6 through 10.
The maximum shear modulus Go corresponds to a shear strain
level less than 10-4%, which is two orders of magnitude smallerthan the strains at which %R and G u have been measured. In
order to be able to compare G. aqainst GUR, at the same strain
level, it is necessary to use a relationship which can matchthe decay of G with increasing 1. The simplest solution is
offered by the well known hyperbolic stress-strain relation inthe form proposed by Hardin and Drnevich (1972):
(*) Computed assuming the specific weight of the tested sands3 3o26.35 ku/a and 26.72 kN/a for Ticino and Hokksund sands,respectively.
19
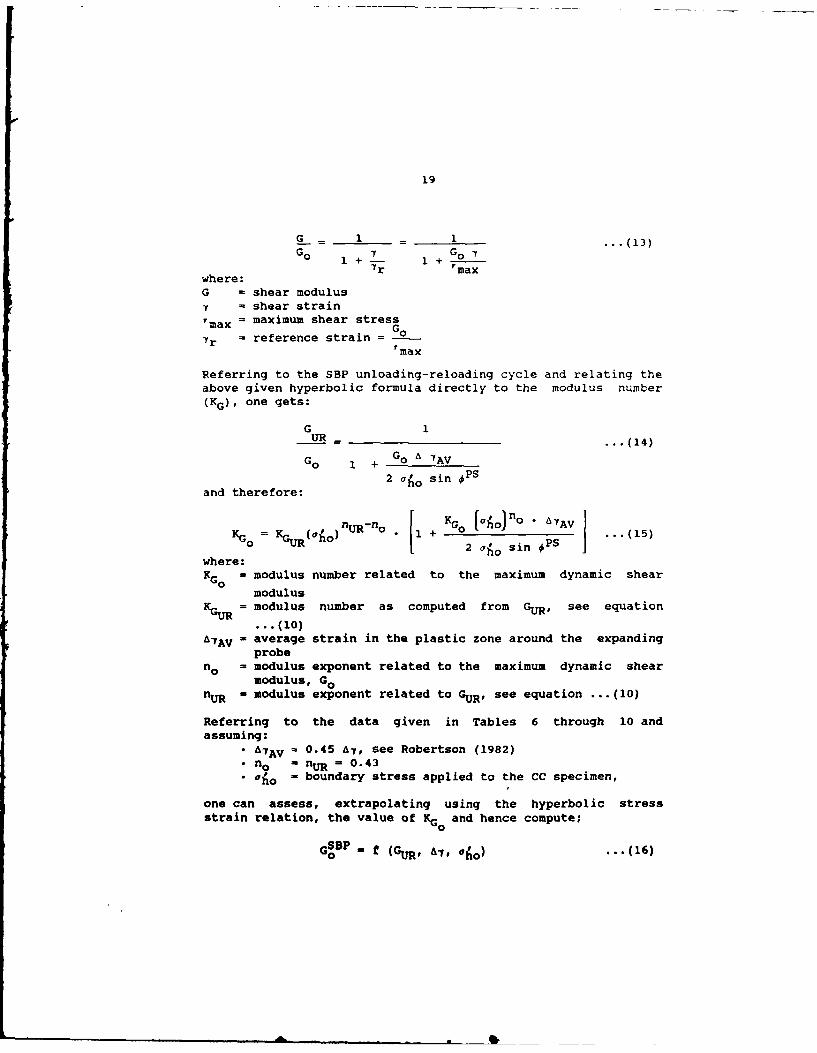
G _ 1 _ 1 .. (13)G 1LGo 1 + 7_. 1 + GO
r maxwhere:G = shear modulusk = shear strain
Tmax = maximum shear stressma = reference strain = G o
tmax
Referring to the SBP unloading-reloading cycle and relating theabove given hyperbolic formula directly to the modulus number(KG), one gets:
G 1UR _(14)
Go 1 + Go A _AV
2 aao sin OPS
and therefore:
K0 = K._ (aAo)inU R -no + KG. [ h 6AV ... (15)Go 2 aO sin OP S
where:= modulus number related to the maximum dynamic shear
FG0modulus
K_ = modulus number as computed from GUR, see equation
(10)aTAV = average strain in the plastic zone around the expanding
probeno = modulus exponent related to the maximum dynamic shear
modulus, GonUR = modulus exponent related to GUR, see equation ...(10)
Referring to the data given in Tables 6 through 10 andassuming:
" A7AV 0.45 Ay, see Robertson (1982)Sn o =nuR = 0.43* Oo -boundary stress applied to the CC specimen,
one can assess, extrapolating using the hyperbolic stressstrain relation, the value of KG and hence compute;
GSBP - f (G, , ... (16)0 R 67,n 0Ao)

20
For the available tests in this study this approach gives, for
the 1st and 2nd unloading-reloading cycles, the following:
Go1.3 s - S 1.8 ... (17)
GSBP0
where:Go = maximum dynamic shear modulus as measured in the
resonant column testsGSBP = maximum dynamic shear modulus assessed from GU.0 R
The lack of coincidence between Go and GSBP be due to theo maybedet th
following:
* The oversimplified and approximate nature of theprocedure used to obtain GSB P from GU.
* The influence of the number of unload-reload cycles onthe shear stiffness of sands. Values of GUR have beenmeasured during a single unloading-reloading cycle.Therefore the extrapolated GSBP values should be
0referred to the ist unload-reload cycle while theresonant column Go has been measured after thousands ofunload-reload cycles. For the given level of shearstrain amplitude this factor can be expected to beresponsible for differences between Go and GO of up toabout 10 to 20 percent.
* The pluvially deposited sand tends to exhibit ananisotropic behaviour. Within the framework of thetheory of elasticity for transverally isotropic soils,the available shear moduli can be defined as follows:
GUR = GHH = shear modulus for shearing in horizontaldirection
Go = GVH - shear modulus for shearing in verticaldirection
However this factor does little to justify the observeddifferences between Go and GSBP. The results of large
0scale tests performed by Stokoe and co-workers (Knox(1982, Stokoe and Ni (1985), Lee (1986)] indicate that,in sand the velocity of the horizontally polarized shearwave (VH1s) is 1.1 to 1.15 higer than the verticallypolarized shear wave velocity (v5 ). This data indicates
a GIH/GVH ratio ranging between 1.2 and 1.3, therefore
suggesting GSBP > Go .

21
5.3. Shear Strenqth
Theoretical methods for the determination of the peak frictionangle (0) of sands from pressuremeter test data have beenproposed by several authors; i.e. Gibson and Anderson (1961),Ladanyi (1963), Vesic (1972), Hughes et al. (1977), Robertson(1982) and Manassero (1987). Each method relies on a model forthe sand behaviour. Most of the above methods consider thatsand has a constant friction angle at failure. However, not allmethods allow for the fact that sand changes in volume duringshearing.In Ladanyi's method the volume change is considered to beconstant at the point the failure stress ratio is reached. Thisvolume change is introduced into the assessment of the frictionangle by a trial and error method.
Vdsic's solution uses the results of laboratory tests directlyto determine volume change. However, the problem of determiningthe appropriate laboratory density to perform the tests, is noteasy to resolve. Also, the laboratory tests may not producereliable volume change behaviour because the in-situ structureand fabric cannot be reproduced in the laboratory.
The solution developed by Hughes et al. (1977) relies on thefact that the volume changes are occurring during the expansionof the cavity and the amount of volume change (dilation) isclosely related to the current friction angle developed. Thisapproach brings together the stress dilatancy concept of Rowe(1962) and the observed behaviour of sand in simple shear, asfor example, observed by Stroud (1971).
Figure 20 shows typical results of simple shear tests on sandconducted by Stroud (1971) and the ideal soil model assumed inthe method by Hughes et al. (1977).In the method proposed by Hughes et al. (1977), it was shownthat:
log _R + n+ . log (P-uo) + constant ... (18)(O 2 1-Nwhere:Ro = initial radius of pressuremeterAR - change in radius of pressuremeter
AR/Ro = cavity strain, e0c = intercept shown on Fig.20 (c) and (d)p - total pressuremeter cavity stressUo - pore water pressure
I-N . (l+sin &) sin * = slope Sn+l (1+sin #)
sin . - maximum dilation rate

22
In the above method the intercept "c" is assumed zero and aplot of the pressuremeter data in terms of log (P-U0 )(effective cavity stress) against log (-R/Ro) will tend towardsa straight line with a slope S. This slope is related to thein-situ friction angle (#) and the maximum dilation rate (sin2/).
For very dense sands the intercept "c" is essentiallynegligible and for all practical purposes can be ignored. Theresults of the laboratory studies conducted by Jewel et al.(1980) in very dense sands (DR = 90%) using the self-boringpressuremeter probe show that the above technique appears towork very successfully. In loose materials the method is not soconvenient as the pressuremeter does not expand sufficientlyfor the sand around the probe to reach the linear portion ofits volumetric strain/shear strain curve.
The method by Robertson (1982) expands on the method by Hugheset al. (1977) but incorporates an empirical correction toaccount for the non-linear nature of the volume change - shearstrain relationship (see Figure 20).
The method developed by Manassero (1987) is also a furtherdevelopment of the Hughes et al. (1977) method but incorporatesthe full non-linear nature of the stress-strain curves. Themethod assumes that Rowes stress dilatancy concept is valid andsolves the shear-volume coupling in a unique manner by using afinite difference numerical solution.
The method by Manassero (1987) allows the complete stressstrain and stress path to be calculated for each pressuremetertest. Figures 21 and 22 show typical examples of the calculatedstress strain and stress paths for pressuremeter tests withideal installation. From the stress path plots (d) in Figures21 and 22 it is clear that the soil surrounding the probe isinitially strain hardening up to the point of peak strength(OV/})max, and then strain softening.
The deviation of the soil behaviour from the simple isotropicelastic behaviour can be represented by the angle p (seeFig.23), which is the angle between the point of peak strength(*r/2)max and the initial mean normal stress, Po. Values of pare given in Table 11 for each pressuremeter test analysedusing the method by lanassero (1987). In order to avoidnumerical instability in the calculation of the stress straincurves and stress paths using the method by Manassero (1987) a7th order polynominal function was made to fit the measuredcurve.

23
Full details of the method by Manassero (1987) is given inAppendix IV.
The methods by Hughes et al. (1977), Robertson (1982) andManassero (1987) have been evaluated using the results from theSBPT's performed in the CC, and results are presented in Table11.
All three methods require a knowledge of the friction angle atconstant volume (Ocv). Values of Ocv were determined for Ticinoand Hokksund sand using a ring shear apparatus. A summary ofthe ring shear results are shown in Figure 24. An average valueof Ocv = 34" was used in the analyses.A summary of the calculated angles of friction and dilatancyobtained from the pressuremeter tests performed in the CC arepresented in Table 11.Peak friction angles have also been determined from triaxialtests on Ticino sand at various stress levels and densities.Triaxial specimens were formed using the same pluvialdeposition technique as used to form the CC specimens.The peak friction angles (OPS ) and dilation angles ( PS )
determined from the pressuremeter are obtained underapproximately plain strain conditions and are related to theaverage effective stress around the probe during the test.Therefore, to compare the calculated peak friction angles fromthe pressuremeter (pS) with those obtained from triaxial tests(4 x) requires some corrections to account for stress level atfailure (off) and boundary conditions (plain strain-triaxial).
The peak friction angles obtained from the laboratory triaxialcompessin tets (TXs tests (¢T ) where corrected to the equivalent
stress level at failure (ajf) occurring in each pressuremetertest and then corrected to an equivalent plain strain value
PS(*Is).
The stress level at failure (vif) for each pressuremeter testwas calculated assuming a linear elastic isotropic soilbehaviour, where:
If ho [1-sin2 45] ...(19)
The values of TX were then determined at the oif stress level
using the curved strength envelope equation developed by Baligh(1975), where:
tan #TX. tan # tan. -l20)0 2.3 Pa
where:
. . . .. .... ...... ..... ... .... .. .. . .. .. ... ... . ... .. .. b

24
0TX = secant friction angle from triaxial compression test at
oif=2. 7 2 Pa
Pa = reference stress = 98.1 kPa
a = angle which describes the curvature of the failureenvelope
Values for ~X and a for Ticino sand are given by Baldi et al.(1986).
The triaxial friction angle values were then converted toequivalent S using the following equation by Lade and Lee(1976) ; $PS = *TX . 1.5 - 17"
P -
The calculated equivalent *S values determined from thelaboratory triaxial results are also shown in Table 11.
PSI Comparisons between the calculated #Sfrom the SBPT results
using the methods by Hughes et al. (1977), Robertson (1982) andManassero (1987) and the equivalent *S obtained from triaxialresults are shown in Figure 25. The following comments can bemade about the results presented in Figure 25.
I. No method provides a reliable estimate of *PS for sandsfrom the SBPT.
2. The method by Robertson (1982) appears to produce lessscatter.
PSS3. Generally the scatter in calculated #Sis slightly
larger for the test results where the probe was self-bored into the CC.
It is interesting to note that, although most of the self-boredresults gave very poor values of cho due to disturbance, theself-bored data gave reasonable values of OPS . This isconsistent with observations made in the field (Ghronna et al.,1983; Jamiolkowski at al., 1985; Bruzzi et al., 1986).Based on the CC results, it appears that the determination ofpeak friction angle (#p) in sands using the self-boringpressuremeter is not very reliable and depends on the method ofanalyses.
Table 11 also provides the values of the stat parameter (o),as defined by Been and Jefferies (1985). The # combines theinfluence of both mean effective stress level and void ratio onthe dilatancy of sand and may correlate to the parametersreflecting the behaviour at failure, i.e. 0,

5.4. Limit Pressure
Table 5 presents the calculated limit pressures (P,each SBPT using two existing methods. rhe ?,o ter 1s P'i.t..,.
were:
Plim Method by Windle ind Wroth
AAP1in :Method by Al Awkat i.')
Exizples of the plots to -a:i- ite P I m I:-I.Unfortunately, the zoncept .f A .nt pressure .5 -
applicable to pressuremeter tests in sand. especially .01thmaximum cavity strain of 3nly 10%. Because there .s -
fundamental concept to support the values 3f Pli*, theirapplication to design is related to ompirial correlat;ons.This is further complicated by the fact that tifferent val.;es
of Plim are obtained from the different method1s see Table
5.5. Boundary Conditions
The laboratory studies by Fahey (1980) showed that thecondition of a constant horizontal stress boundary at somefinite distance from the expanding pressuremeter had the effectof producing an apparent strain softening in the pressureexpansion curve. This situation was not observed in any of thepressuremeter tests performed for this study. The reasons forthis apparent lack of boundary effect could be the folbowinq:
• The KNEL-CUI S CC is 1.2 a in diameter, compared to the
0.9 a diameter CC used by Fahey (1960).
* Fahey studied only very dense sand (D - 92%) in whichthe plastic zone expands rapidly during the pressure-meter test. for the tests in this study where 90%
there was no strain softening observed.
No influence of boundary effects could be 'ubserved for the
interpreted values of dho' G and s.
---- A-

6. SW"y AND COWCSIONS
'k ;eries .t 47 seif-boring pressuremeter tests have been
;.er::_rmed in he ENEL-CRIS ibration chamrer. 25 tests were
e rt -red wth the probe in-place during sample preparation
1e. ideal installation) and 22 tests were performed dith the
;;r to selt-ored into saturated sand. I test was not completed
St r;pt~red membrane luring probe installation (Test
.p i.te 't the testing .as to evaluate t !e perfornance ot
;eIt--, :: n pressuremetpr pr*oe under strictly :cntrolled. IL :ttry -nditiins And to :riticil', review existing
. rterpretat: n methods of SBPr in sands.
the 3:8P prote used in the 3tudy was the CA.nk_:eter Mark VIII
manufactured by Cambridge In-Situ Ltd., England.
rhe results Df the testing --an be summarized as follows:
1. Assesment of in-situ stress (&ho
Ideal installation:
Large scatter exists in the experimental data because of
mechanical compliance of the strain measurement system.
The precision required (approximately 0.005 mm) is
probably beyond the limits of a mechanical system.
There is, therefore, a need for improvement in the
measurement system of lift-off pressure, possibly by
adding non-contact precision transducers.
The existing strain arm design is sufficiently reliable
to measure radial displacement during the main expansion
phase.
Self-bored installation:
The disturbance caused by the self-boring process
generally rendered the measured lift-off pressure too
low, highly scattered and generally unrealiable.
However, the soil tested in this study (i.e. freshly
deposited, unaged, uncemented, clean sand) creates
particularly unfavourable conditions with respect to the
reliable assessment of in-situ stress. More reliable
assessment of 'ho may be possible in natural sand
deposits.

27
2. Assessment of Shear Modulus. G
Even for the same sand (grain size, fabric, stresshistory, etc.) the shear stiffness is a complex functionof; void ratio (e), effective stress (p'), shear strain(0), number of cycles (Nc) and anisotropy andplasticity.
* There is a need to improve the link between the measuredG and the stiffness required for specific designproblems.
* The initial shear moduli (Gi) and the secant shearmoduli (Gs) are both sensitive to disturbance and arevery complex to locate within the framework of elasto-plastic theory.Therefore, Gi and G. are almost impossible to link toother laboratory and in-situ tests and to designproblems.
* The shear moduli determined from unload-reload cycles(GUR or GR) are "elastic" but non-linear and are muchless sensitive to disturbance due to installation. GURor GRU should be linked to the relevant design problemsvia appropriate corrections accounting for stress (p')and strain (7) level. Soil anisotropy should also beconsidered, since SBPT GUR = GHH, while in manypractical problems the value GyH is appropriate.
* Because GUR and GRU reflects the shear stiffness ofsands inside the current yield surface they implicityrefer only to overconsolidated (OC) materials.
* When relating GUR to the dynamic shear modulus (GO) theinfluence of number of cycles (Nc) should also beconsidered.
* Further theoretical work is required concerning theapplication of GUR to engineering design practice.
* At present GUR represents a rather unique method toassess directly some kind of shear stiffness for naturalsands in-situ, with the exception of, the dynamic shearmoduli from in-situ shear wave velocity measurements.

28
PPS
3. Assessment of peak friction anle #p_
* A large scatter exists between the calculated Sfromthe SBPT results and the equivalent vales P of pSobtained from triaxial compression tests.
* None of the existing methods evaluated (Hughes et al.,1977; Robertson, 1982; Manassero, 1987) providedconsistently reliable values of the peak friction angle
PSunder plane strain conditions ( S).
* Evaluation of the reference friction angle frcm labora-tory triaxial testing is complicated by the c'rvature ofthe failure envelope, the variation in stress level atfailure (off) in the pressuremeter test and the strainconditions (plain strain-triaxial).
• The calculation of OPS from the self-bored pressuremetertests appear to be less sensitive t o initial disturbancethan the measurement of in-situ stress (-ho).
* The method by Robertson (1982) appears to produce lessscatter.
* Because of the relatively high densities (DR > 40%) andlow stresses (max 500 kPa) the sand tested had S 4".Therefore, the high friction angles creates particularlyunfavourable conditions for the # methods evaluated.
The objective of this study has been to verify the performanceof the SBPT in sand and to critically review existingapproaches to interpretation of the data for geotechnicaldesign.The objectives of this study have been reached. However, thestudy has produced extensive data concerning the SBPT in sandand not all the information has been fully studied anddiscussed in this report. Further research can be performed tofully evaluate all the available data resulting from thisstudy.

29
LITERATURE CITED
AL AWKATI A., (1975). "On Problems of Soil Bearing Capacity at
Depth". Ph. D. Thesis, Duke Univ., Durham, N.C.
BAGUELIN F., JEZEQUEL J.F., LE MEE H. and LE MEHAUTE A.,(1972). "Expansion of Cylindrical Probes in Cohesive Soils".JSMFD, ASCE, SMIl.
BAGUELIN F., JEZEQUEL J.F. and SHIELDS D.H., (1978). "ThePressuremeter and Foundation Engineering". Trans. Tech.Publications, Clausthall.
BALDI G. et al. (1985). "Laboratory Validation of In-SituTests". AGI, Jubilee Volume, XI ICSMFE, San Francisco.
BALDI G. et al., (1986). "Interpretation of CPT's and CPTU's.II Part: Drained Penetration on Sands". Proc. IV Int.Geotech. Seminar NTI on Field Instrumentation and in SituMeasurements, Singapore.
BALIGH M.M., (1975). "Theory of Deep Site Static ConePenetration Resistance". Res. Rep. R75-56, N.517, MITCambridge Mass.
BELLOTTI R., BIZZI G., GHIONNA V.N., (1982). "DesignConstruction and Use of a Calibration Chamber". Proc. ESOPTII, Amsterdam, V.2.
BEEN K. and JEFFERIES M.G., (1985). "A State Parameter forSand". Geotechnique, N.2.
BRUZZI D. et al. (1986). "Self-Boring Pressuremeter in Po RiverSand". Proc. II Int. Symp. on the Pressuremeter and ItsMarine Applications. Texas A&M Univ., ASTM STP 950.
DALTON J.P.C., HAWKINS P.G., (1982). "Some Measurements of theIn-Situ Stress in a Meadow in Cambridge Shire Country Side".Gr. Enqng. N.5.
FAHEY M., (1980). "A Study of the Pressuremeter Test in DenseSand". Ph. D. Thesis, Cambridge Univ., U.K.
FAHEY M., RANDOLPH M.F., (1984). "Effect of Disturbance onParameters Derived from Self-Boring Pressuremeter Tests inSand", Geotechnique, N.l
30
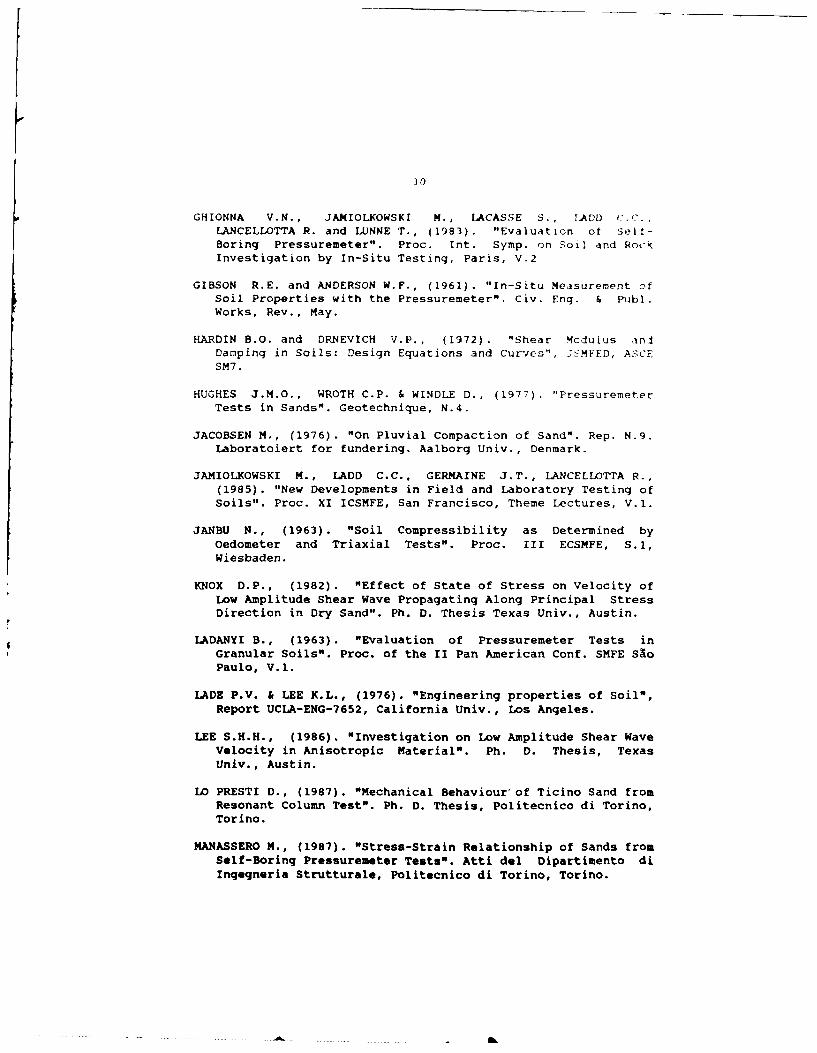
GHIONNA V.N., JAMIOLKOWSKI M., LACASSE S., [ADD C.C.
LANCELLOTTA R. and LUNNE T., (1983). "Evaluation of Self-
Boring Pressuremeter". Proc. Int. Symp. on Soil and Rock
Investigation by In-Situ Testing, Paris, V.2
GIBSON R.E. and ANDERSON W.F., (1961). "In-Situ Measurement of
Soil Properties with the Pressuremeter". Civ. Eng. & Publ.Works, Rev., May.
HARDIN B.O. and DRNEVICH V.P., (1972). "Shear Mcdulus tniDamping in Soils: Design Equations and Curves", :SMFED, ASCESM7.
HUGHES J.M.O., WROTH C.P. & WINDLE D., (1977). "PressuremeterTests in Sands". Geotechnique, N.4.
JACOBSEN M., (1976). "On Pluvial Compaction of Sand". Rep. N.9.Laboratoiert for fundering. Aalborg Univ., Denmark.
JAMIOLKOWSKI M., LADD C.C., GERMAINE J.T., LANCELLOTTA R.,(1985). "New Developments in Field and Laboratory Testing ofSoils". Proc. XI ICSMFE, San Francisco, Theme Lectures, V.I.
JANBU N., (1963). "Soil Compressibility as Determined byOedometer and Triaxial Tests". Proc. III ECSMFE, S.1,Wiesbaden.
KNOX D.P., (1982). "Effect of State of Stress on Velocity ofLow Amplitude Shear Wave Propagating Along Principal StressDirection in Dry Sand". Ph. D. Thesis Texas Univ., Austin.
LADANYI B., (1963). "Evaluation of Pressuremeter Tests inGranular Soils". Proc. of the II Pan American Conf. SMFE SloPaulo, V.I.
LADE P.V. & LEE K.L., (1976). "Engineering properties of Soil",Report UCLA-ENG-7652, California Univ., Los Angeles.
LEE S.H.H., (1986). "Investigation on Low Amplitude Shear WaveVelocity in Anisotropic Material". Ph. D. Thesis, TexasUniv., Austin.
LO PRESTI D., (1987). "Mechanical Behaviour of Ticino Sand fromResonant Column Test". Ph. D. Thesis, Politecnico di Torino,Torino.
MANASSERO M., (1987). "Stress-Strain Relationship of Sands fromSelf-Boring Pressuremeter Tests". Atti del Dipartimento diIngegneria Strutturale, Politecnico di Torino, Torino.

31
ROBERTSON P.K., (1982). "In-Situ Testing of Soil With Fmphasis
on Its Application to Liquefaction Assessment", Ph.D.,
Thesis, Univ. British Columbia, Vancouver.
ROWE P.W., (1962). "The Stress-Dilatancy Relation for Static
Equilibrium of An Assembly of Particles in Contact". Proc.
Royal Soc.
STROUD M.A., (1971). "Sand at Low Stress Levels in the Simple
Shear Apparatus", Ph. D. Thesis, Cambridge Univ., U..,.
STOKOE K.H. & NI F.H., (1985). "Effects of Stress .tate inj
Strain Amplitude on Shear Modulus of 7ry Sand". Proc. !I
Symp. on Interaction of Non-Nuclear Munitions with
Structures, Panama City Beach, Florida.
VESIC A.S., (1972). "Expansion of Cavities in Infinite Soil
Masses", JSMFED, ASCE, SM3.
WINDLE D., WROTH C.P., (1977). "In-Situ Measurement of the
Properties of Stiff Clays". Proc. IX ICSMFE, Tokyo, V.1
WROTH C.P., (1982). "British Experience with the Self-Boring
Pressuremeter". Proc. Symp. on the Pressuremeter and Its
Marine Applications, Paris.
WROTH C.P., RANDOLPH M.F., HOULSBY G.T. & FAHEY M., (1979). "A
Review of the Engineering Properties of Soils with
Particular Reference to the Shear Modulus", Cambridge Univ.,
CUED/D Soils TR75.
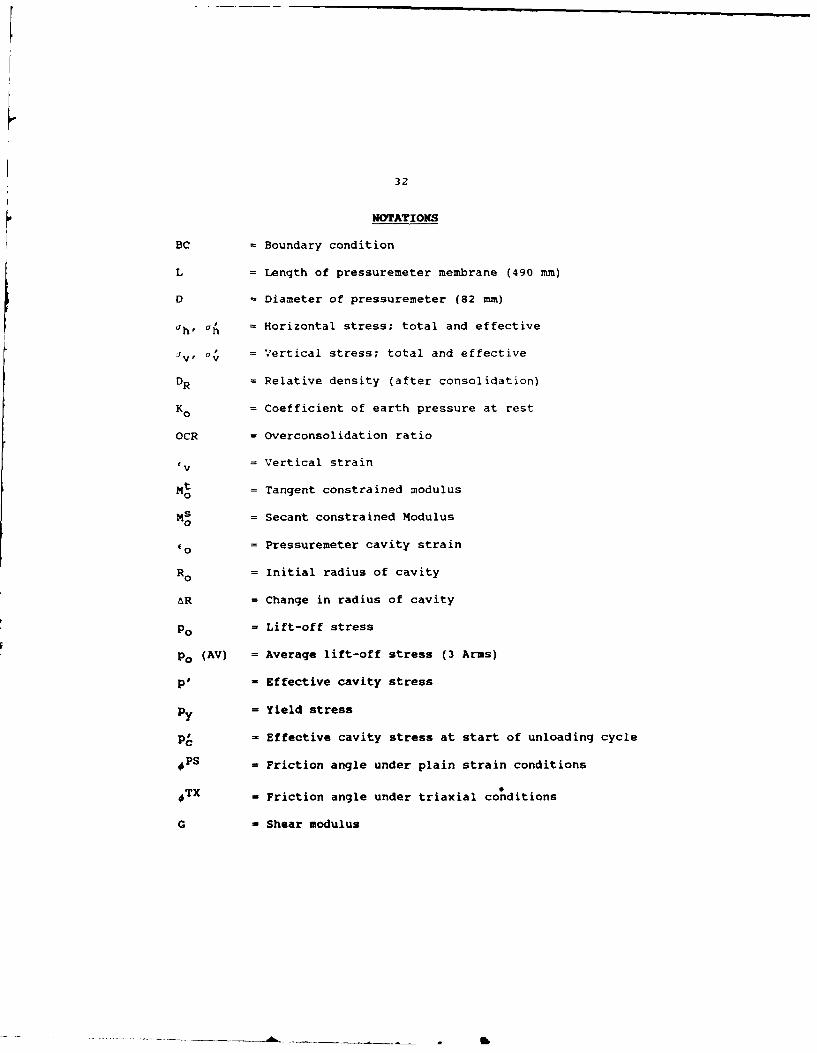
32
MOTATIOKS
BC = Boundary condition
L = Length of pressuremeter membrane (490 mm)
D = Diameter of pressuremeter (82 mm)
ch' aA = Horizontal stress; total and effective
So = Vertical stress; total and effectiveJ~ v
DR = Relative density (after consolidation)
Ko 0= Coefficient of earth pressure at rest
OCR = Overconsolidation ratio
v = Vertical strain
Mt = Tangent constrained modulus0
Ms = Secant constrained Modulus0
0o = Pressuremeter cavity strain
Ro 0= Initial radius of cavity
AR = Change in radius of cavity
P0 = Lift-off stress
po (AV) = Average lift-off stress (3 Arms)
p' = Effective cavity stress
Py = Yield stress
PC, = Effective cavity stress at start of unloading cycle
4PS = Friction angle under plain strain conditions
-TX = Friction angle under triaxial conditions
G = Shear modulus
.. . . .. .. .... ..... ... .. . . . . .. . . . . . . . ... . |b

33
Gi = Initial shear modulus
G1.5 = Secant shear modulus at cavity strain of 1.5%
GUR, GRU = Shear modulus for unload-reload and reload-unloadcycle
GURoGRUo = Shear modulus from unload-reload and reload-unloadcycle normalized to the stress level ao
Go = Maximum dynamic shear modulus obtained fromresonant column test
7d = Bulk density
uo = Pore pressure at center of CC
'AA
Plim = Effective limit pressure using method by Al Awkati(1975)
"WWPlim = Effective limit pressure using method by Windle and
Wroth (1977)
A-AB = Shear strain increment during unload-reload orreload-unload cycle
PAV = Calculated average effective stress around cavity
= Maximum dilation angle
= Angle of straight line connecting pl and the pointof peak strength (a/ea)max
= State parameter (Been and Jefferies, 1985)

TABLE I
St4IARY OF !WSTALLATION CONDITIONS k:u SELF-BORING
Test BC Mebrano Ty- Chamber Cutter Advanlceent Cutts, -tor -Drainage Sett n& Rat. Speed F' :-sc e
No. cal :=".In revlsin 's~
231 B-1 Not protected Open at top 2.5 3 0 5060 i-, 5 25 cm before 4=d of installationand base stopped for 3 =ns
238 B-1 Not pr-tected Open at base 2.5 .4 50 60 In 5 nsruent rT-a-ed 130' withrespect to est 4o.237o10 cmfrom end :f -stallatonstopped fr - ocos. At end of
instaUlatico f---ng in CC
239 B-i Not ;rotected Open at base 2 5 2 52-50 5 10 -n fren e-I :fc sltatcsn
probe starte-2 to toft
240 B-i Not protected Open at base 2.5 3 0 50-60 5 Failed test !-e to rupturedI embrane &-4 installation
241 B-1i Protected Open at base 2.0 3.0 50+60 :1 5
242 B-I Not protected 'en at base 1.9 3.3 50n0 io5
243 B-1 Not protected Open at base 2.5 '.2 50+60 5
244 B-i Not protected Open at base 3.5 3.0 50,60 .5
245 B-i Not protected Open at base 5. 3.0 60 0-9 5 After 22 cm of penetration in-stallation stopped for 5 mine
246 3-3 Not protected Open at base 4.5 3.0 60 a 5
247 B-3 Not protected open at base 3.4 3.0 60 0l:: 5
250 B-4 Not protected n at base 3.4 3.0 s0 +i0 5
251 B-4 Not protected n at base 3.4 3.0 60 1I 5
252 B-4 Not protected Open at base 3.3 3.0 60 1 5
253B-A Not protected an at base 3.3 3.0 60 - 5
253 B-I Not protected On at base 3.3 3.0 60 I 5 5
255 B-1 Protected On at base 3.3 3.0 60 1I 5
256 3-4 Protected " at base 2.4 3.0 60 :1 5
257 3-4 Protected O at base 1.9 3.0 60 11 5
258 3-4 Protected Opn at base 1.9 3.0 60 12 5 Probably disturbed due todrilling vibration*
253 3-4 Protected Open at bas 1.9 3.0 60 1i 5 Probably disturbed due todril1ing vibrations
260 3-4 Protected open at base 1.9 3.0 60 ". 5
261 8-4 Protected Open at base 1.9 3.0 60 1
TESTS FROI 237 TO 261 SAMPLES F'-..Y SA77ALATED

TABLE 2
SUNMARY OF GENERAL rALIBRATION CHAMBER CONDITIONS AFTR SAMPLE CONSOLIDATION
Test Sand Yd DRC OCR ao 0 ho K° u. Mo ';umber of BCv 0 0 0 cyc les
No. kN/m3 - kPa kPa - kPa MPa UR RU
201 HS 16.08 67.0 2.77 112.8 74.56 0.662 0 192.18 2 1 1
207 HS 15.22 43.9 3.29 109.9 64.75 0.586 0 185.51 2 1 1I 208 TS-4 14.82 43.2 1.00 112.8 45.13 0.400 0 34.14 2 1 1D 209 TS-4 15.01 49.2 1.00 116.7 51.99 0.441 0 43.56 3 1 1E 210 TS-4 15.13 53.3 1.00 511.1 244.27 0.479 0 100.06 3 1 1A 211 TS-4 15.57 67.4 1.00 512.1 242.31 0.473 0 114.88 3 2 1L 212 TS-4 15.49 64.6 2.86 110.9 82.40 0.747 0 189.82 3 1 1
213 TS-4 14.96 47.5 2.78 112.8 83.39 0.740 0 168.63 3 1 1
I 214 TS-4 14.80 42.4 1.00 113.8 53.96 0.476 0 50.82 3 1 4N 215 TS-4 16.42 92.3 1.00 514.6 225.63 0.439 0 143.72 3 1 1S 216 TS-4 14.92 46.3 7.57 60.8 56.90 0.927 0 156.76 3 1 1T 218 TS-4 15.51 65.4 7.66 59.8 59.84 0.980 0 169.62 3 1 1
A 219 TS-4 15.52 65.9 5.46 112.9 101.04 0.902 0 207.48 3 1 1
L 220 TS-4 14.95 47.2 1.00 313.3 150.09 0.481 0 80.15 3 1 1L 221 TS-4 14.87 44.6 2.88 108.9 81.42 0.751 0 167.36 3 1 1
A 222 TS-4 14.92 46.2 5.50 111.8 95.16 0.850 0 199.05 3 1 1
T 224 TS-4 15.81 74.6 5.38 113.8 93.20 0.816 0 222.39 3 1 1
I 225 TS-4 15.81 74.6 5.46 111.8 87.31 0.775 0 218.27 3 I
0 228 TS-4 15.89 77.0 1.00 518.0 215.82 0.417 0 120.27 3 1 1
N 233 TS-4 15.98 79.6 1.00 512.1 224.65 0.439 0 121.25 3 1 1
234 TS-4 15.93 76.1 5.34 115.8 103.99 0.904 0 216.21 3 1 1
235 TS-4 14.99 48.5 1.00 516.0 239.36 0.465 0 80.54 3 - 1236 TS-4 15.83 75.2 2.72 114.8 78.48 0.686 0 190.41 3 1 1
237 TS-4 15.79 74.6 2.90 96.1 81.42 0.850 6.87 178.35 3 1 1238 TS-4 15.79 74.8 2.83 101.0 83.39 0.828 5.89 171.28 3 1 1
239 TS-4 15.79 74.8 2.84 101.0 86.33 0.856 5.89 169.32 3 1 1240 TS-4 16.47 94.1 2.84 101.0 90.25 0.892 5.89 195.22 3 1 1
241 TS-4 16.38 91.8 2.76 104.0 86.33 0.829 5.89 192.37 3 1 1242 TS-4 14.72 40.1 1.00 103.0 49.05 0.475 6.87 32.67 3 1 1
S 243 TS-4 14.79 42.7 3.10 95.2 74.56 0.785 6.87 141.46 4 - 1
E 244 TS-4 14.80 42.8 6.12 97.1 94.18 0.970 5.89 172.36 4 - 1
L 245 TS-4 14.72 40.0 1.00 102.0 54.94 0.539 6.87 41.40 4 - I
F 246 TS-5 14.72 43.0 1.00 102.0 52.97 0.523 6.87 45.32 4 - 3247 TS-5 14.80 43.0 4.19 190.3 147.15 0.776 6.87 212.58 4 - 3
B 250 TS-5 14.81 43.0 1.00 480.7 219.74 0.457 6.87 93.20 4 - 40 251 TS-5 14.74 41.0 1.00 100.1 51.01 0.508 6.87 36.30 4 4
R 252 TS-6 15.79 75.0 1.00 101.0 52.97 0.518 6.87 58.27 4 1
E 253 TS-6 15.68 71.0 1.00 103.0 52.97 0.517 6.87 58.99 4 3D 254 TS-6 15.69 71.0 6.16 97.1 88.29 0.912 6.87 194.43 3 1
255 TS-6 15.49 65.0 1.00 108.9 55.92 0.514 6.87, 56.70 2 1
256 TS-7 15.46 65.0 1.73 345.3 277.62 0.690 6.87 263.69 4 1257 TS-7 16.22 87.0 1.00 130.5 77.50 0.597 6.87 69.16 4 1
258 TS-7 16.18 86.0 1.00 495.4 226.61 0.458 6.87 125.47 4 1259 TS-8 16.39 92.0 4.63 138.3 139.30 1.008 6.87 215.62 4 1
260 TS-8 16.29 89.0 1.00 131.5 78.48 0.595 6.87 70.S3 4 3261 TS-8 16.37 91.5 3.99 199.1 157.94 0.797 6.87 261.44 4 1
262 TS-9 16.28 88.7 1.00 113.8 45.10 0.398 0 73.77 4 1
IDEAL 263 TS-9 16.29 89.1 1.00 112.8 103.00 0.913 0 229.46 4 1
. . . ... .. .. ... . ... . .. .. . ......... .. .. .... ... ... - . . . ... . . . . .. _ _

TABLE 3
SU14ARY OF PROBE AND CC CONDITIONS DURING SELF-BORED TESTS
Test BC Membrane Type, NotesNo.i
237 B-I Not protected Modified arms + bushings
238 B-1 Not protected Modified arms + bearings
239 B-1 Not protected Arms + bushings
240 B-1 Not protected Arms + bushings
241 B-1 Protected Arms + bushings
242 B-I Not protected Arms trimed and rounded + bushings
243 B-1 Not protected Arms + bushings
244 B-I Not protected Arms + bushings
245 B-i Not protected Arms + bushings
246 5-3 Not protected Arms + bushings
247 B-3 Not protected Arms + bushings
250 5-4 Not protected Arms+bushings.5 lift-offs. Relaxation time-96 hrs
251 1-4 Not protected Arms + bushings
252 B-I Not protected Arms+bushings. Relaxation time-71 hrs
253 1-3 Not protected Arms+bushings. At 5 battotal pressure and 41 strain membrane ruptured
2541B-1 Not protected Arms+bushings. At 5.5 bartotal pressure membrane ruptured
255 5-1 Protected Arms + bushings
256 5-1 Protected Arms + bushings
257 1-1 Protected Arms + bushings
258 B-1 Protected Arms + bushings
2591B-1 Protected Arms+bushings.After 1st loop manual expansion dueto problems with SCU
260 B-3 Protected Arms+bushings.After 3rd loop aanual expansion dueto problems with SCU
261 B-1 Protected Arms+bushings.After lst loop manual expansion due
to problems with SCU

TABLE 4
SUMMARY OF LIFT-OFF PRESSURES OF INDIVIDUAL ARMS
Test 1ho ARM i ARM 2 ARM 3 Average
No. kPa kPa kPa kPa kPa
201 74.56 82.06 84.07 71.06 76.06 0 S207 64.75 150.53 69.05 65.05 65.05 R T
I 208 45.13 28.02 34.03 34.03 28.02 1 RD 209 51.99 42.03 49.04 43.03 45.04 G AE 210 244.27 87.08 61.10 136.12 81.06 I 1
A 211 242.31 65.02 65.02 90.03 56.04 N NL 212 82.40 108.95 114.45 104.25 104.27 A
213 83.39 129.25 164.26 165.15 120.23 LI 214 53.96 49.23 61.19 63.25 49.21 A
N 215 225.63 347.36 379.52 256.25 254.27 RS 216 56.90 139.26 97.28 80.22 73.23 MT 218 59.84 85.22 117.29 165.64 80.22 SA 219 101.04 179.27 173.29 145.24 131.28
L 220 150.09 171.32 122.29 190.35 139.28L 221 81.42 68.26 93.26 152.30 68.26 AA 222 95.16 119.25 163.28 146.32 141.28
T 224 93.20 116.70 162.30 136.02 124.84I 225 87.31 98.44 105.54 115.67 96.410 228 215.82 200.81 274.79 222.09 207.90
N 233 224.65 227.67 237.19 217.36 217.36 V234 103.99 134.07 124.56 144.39 117.42
235 239.36 115.04 109.48 70.62 142.80236 78.48 95.22 90.52 115.92 88.12
237 88.29 88.26 148.18 86.10 86.05 M238 89.28 177.50 309.01 50.01 50.01 0239 92.22 86.78 146.42 300.68 67.15 D241 92.22 80.39 80.39 356.82 80.39 1242 55.92 30.99 30.99 27.26 30.33 F
S 243 81.43 25.20 27.56 23.14 25.15 IE 244 100.07 37.27 24.71 22.07 24.58 EL 245 61.81 59.82 46.78 44.62 40.95 DF 246 59.84 70.81 18.53 97.58 19.81
247 154.02 26.53 18.53 78.65 18.53 S
B 250 226.61 82.06 84.07 71.06 76.06 T0 251 57.88 13.15 8.49 18.33 15.09 RR 252 59.84 90.79 68.44 114.35 74.51 AE 253 59.84 12.47 13.94 29.12 10.85 ID 254 95.16 34.94 31.28 36.88 34.94 N
255 62.79 36.47 57.51 62.38 36.47256 284.49 137.17 81.83 73.14 71.83 A257 84.37 62.98 47.64 79.05 47.64 R258 233.48 122.34 122.34 53.53 50.67 M259 146.17 64.34 37.34 32.46 43.17 S260 85.35 45.00 32.65 42.90 27.40261 164.81 79.79 88.16 67.02 63.65262 45.10 46.93 57.12 57.81 54.54
IDEAL 263 103.00 134.38 125.64 129.64 125.64
IDEAL p (AV) SELF-BORED p (AV)
INSTALLATION: 0 - 1.07 ± 0.29; INSTALLATION: 0.47 ± 0.28'ho -ho
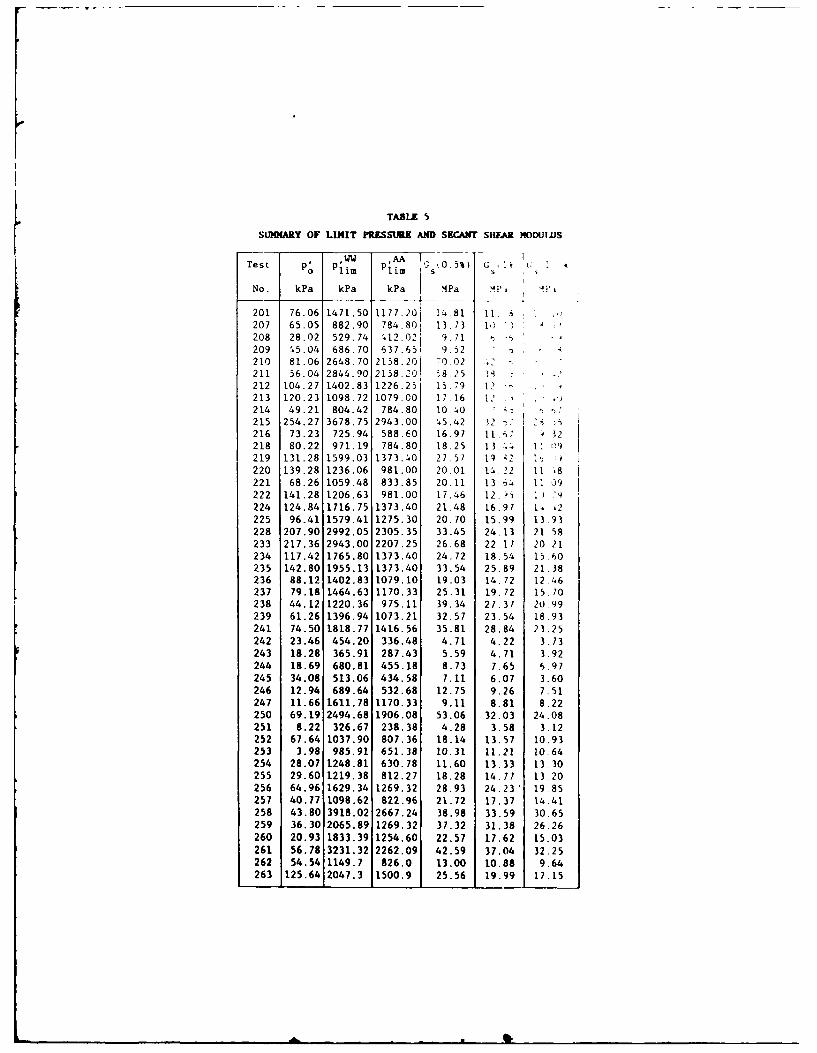
TABLE 5
SUMMARY OF LIMIT PRESSURE AND SECAPT SHEAR MODUIuS
-- - - AA I -T
Test p. ' ism O 5 G , I
No. kPa kPa kPa MPa MPI '
201 I 76.06 1471.50 11177.201 i4.81 11. 3 .
207 65.05 882.90 784.80i 13.73 1P
208 28.02 529.74 4 12.02 9,71 .
209 45.04 686.70 637.65 9.52210 81.06 2648.70
215
8.20 70.02 .1
211 56.04 2844.90 2158.10 3 .
212 104.27 1402.83 1226.25 15.9 12 213 120.23 1098.72 1079.00 17.16 12214 49.21 804.42 784.80 10.40 ,,
215 254.27 3678.75 2943.00 45.42 32 i 2216 73.23 725.94 588.60 16.97 11.67 32218 80.22 971.19 784.80 18.25 13... 11 01)
219 131.28 1599.03 1373.40 27.57 19 2 ". 0220 139.28 1236.06 981.00 20.01 14,22 11 .8221 68.26 1059.48 833.85 20.11 13 64 1' 09222 141.28 1206.63 981.00 17.46 12.-5 1 9224 124.84 1716.75 1373.40 21.48 16.97 1. .2225 96.41 1579.41 1275.30 20.70 15.99 13.93
228 207.90 2992.05 2305.35 33.45 24.13 21.58233 217.36 2943.00 2207.25 26.68 22.17 20.21234 117.42 1765.80 1373.40 24.72 18.54 15.60235 142.80 1955.13 1373.40 33.54 25.89 21.38236 88.12 1402.83 1079.10 19.03 14.72 12.46237 79.18 1464.63 1170.33 25.31 19.72 15.70238 44.12 1220.36 975.11 39.34 27.37 20.99239 61.26 1396.94 1073.21 32.57 23.54 18.93241 74.50 1818.77 1416.56 35.81 28.84 23.25242 23.46 454.20 336.48 4.71 4.22 3.73
243 18.28 365.91 287.43 5.59 4.71 3.92244 18.69 680.81 455.18 8.73 7.65 6.97245 34.08 513.06 434.58 7.11 6.07 3.60
246 12.94 689.64 532.68 12.75 9.26 7.51247 11.66 1611.78 1170.33 9.11 8.81 8.22
250 69.19 2494.68 1906.08 53.06 32.03 24.08251 8.22 326.67 238.38 4.28 3.58 3.12252 67.64 1037.90 807.36 18.14 13.57 10.93
253 3.98 985.91 651.38 10.31 11.21 10.64254 28.07 1248.81 630.78 11.60 13.33 13.30255 29.60 1219.38 812.27 18.28 14.77 13.20
256 64.96 1629.34 1269.32 28.93 24.23" 19.85257 40.77 1098.62 822.96 21.12 17.37 14.41258 43.80 3918.02 2667.24 38.98 33.59 30.65259 36.30 2065.89 1269.32 37.32 31.38 26.26260 20.93 1833.39 1254.60 22.57 17.62 15.03261 56.78 3231.32 2262.09 42.59 37.04 32.25262 54.54 1149.7 826.0 13.00 10.88 9.64263 125.64 2047.3 1500.9 25.56 19.99 17.15
,.6 n f

Sulmew 0 :ST IRAMIM UNIAMPINS T'11
b po $is a t-20 114 A .3
zs4 is to 3 a 1 0 1*3 b6 't14
:Z2 a 1.. r .!t St 1 c
-14 -40 130 a t.65 'S 161 25 3 "S 1 462 2 .2 a )a
2e: 66 n - a 03aa $0 :u a 2 'o 525 Sc 1Z
-ol I
46 :-4A7 2-9Q 14. .. : a , .. ) , as bi43 ;4 .4 4 19 1 '91 A 1 ..to a I I134 -6'. :)j 0 20 02. 1 50 U, 1 -41 1 W i' 13' 0 1 JA 0 ;,2 is '4 11, .4III " );o 44 )ZA U 1 -12 3 A" a off a I " 0 9 lad .5 C "S *1 116 13 lot
Z2 US 44 J:f 21 )25 so 2 9%, : 193 0 170 111 A a :4 -114 ma I226 1 3 03 237 . p 0 :64 oil
13 1 11 5 11 1 Is 164 S34 A" V a A* 0. 65 *pZ3 . 2&3 ry 317 a * 122 'S a jo 3 S. I So' 1 .0 on is'l " a *3 1323.) 317 5 a -12 al 2 2 "1 , 36 s4l 2" 1,1 Z 41 3 .1 63an 151 Is 231 It 233 44 3 Sl I 1, 34 109 -2 1" it q)o 94 4223, 252 12 3.5 it le 3 '32 a .10 1 1 its 14 1 so. A
13 323 13 3*6 303 57 a on : 6.4 a Is* a 1. 1 1 It 71 302 is 161 47 m go 0 044 1 0 . 0 11 . 69 uf 63 a 5 1 1 614 " -At Z261 Al *1 -56 20 " " 2 WI? 1 342 a m 0 IM m 160 26 6 so z a" se Ist 3 -602 a GO 37 Ay 51 1" GO I rig I p 70 ? pe 134 It$ " IF 0 '" 17 ou is on .7 --.*a 3 $21 11 73 50 ?o u 0 to 9 ?" yes 1" 714 sp 64 0 30s 14 $13 16 oil zat2L " Gil 91 .12 go, DO 0 641 1 564 564, is* Fos 71 ?1 *40 is 160 10 Is* -20;to 5 a 34 " S3 Los ? s 9 or$ I Sir P 79 L42 544 11 13 2rl is say Is s %a -34
: on 9 13942 3" lie 661 U43 of :01 .0 614 a so264 :20 So 111 16a 1 129 161 ISS sa OSS I , "I I" it* I to )73 as ? m DO u so .612L 401 29 141 it 441 66 6 us I m 126 142 6" aps 99 3" 41 we " 546 112 ZVIisI. 64 Is $a 20 as 1 964 1 13S gal In all " a 1.48 12 116 u P16 SO folllu 14W 23, Isa go W It .72 34 $1* SO M 16 oil2133 1., 11 : . : '" 11 11": 33" 74 " IM 31 an III "?IS4 lot In 71, in u 0 ON 1 .01. ow let 6es M 41 3?2 to 6?s 31 on 91 .60M ISO 214 14 its 13 0 PSG , eya "a I re of w 62 )?* A *15 31 &to Is -1 .-a5d lie so I" or Ist is 0 sit 0 to on 171 Sys 23), is 311 49 1" 69 1" a"zs? &sm " aw n an u : 6e3 : sm 544 111 425 n 411 $Is 37 760 26 2m tooM sea to 60 so 6" 441 04 sr "S ISS me m so or* to Mpg 063 its "II's in 614 as 6a so 0 on a 'To 774 193 611 ISS 60 M I M 144 no
ISS 154 of 2111 a Fri got "? Ift "a to Pw ow :4 wo a .1261 331 Is 6% is 41310 is p sm 103 6" IS: WFIS 43 mo I ?a 112 1%an to a Idd, is 171 a 0 60 M I's III M Is Now "S a us
an is NO 0 343 " 0 *ft "a us 1-14 301 2316 so GOOD %I I10 ?" Ili 900LT I I I I I , -- 'If- I -
sm emes"red at*"- Telaod we"bm
Imlead-rotood GoO.S."s c.frected f44' stree's

Al s WlDMIa QUT:n
T t-t - 1 . t t "" 00l1
.4 .. . ,) 1, a.4.1 , I.1 .6
.... . .. 1 :.* 4* ' 9+ 'a l.. :, 2 41 . .6 .)a .,
; 'l + +0+' 0 1] . . .
.3~ is$ a241 1-*2) 416 A 421-9. 4~ ' Y? 3136 "'' I *l 601 66| ? !:?+ : ':" t q
'a 3.
26 -A' 10 2 9a'f,
210 . 6 0 9+
2 ..Ia..a .42Z3 i. f 51. alI6 .1 . 1, a a a .6 a 1. 7I.24 '42 .6 1. ". .) 44 . a - A6 a i ' e. 1
226 '1 13 10 +61 C I 411 ; t 2 1 3 6 19. " . .!01 9 'O -6 #
As0 'I I) 0 21 , I Is I aa Ie I 3 126. a - ' 51 .4 -.
2)) .t* 4 1 '&4 9 141 1 .1 1, Ia 0 2 as 16, i 6 1 3241 1, 4 .6 43i 40 S" I a 19" 2 .S I I 7 6 o l " 44 1':
4 91 11 .4 9 Go 9 a 1 0 3l .I 1 . 7 -2 04 ? .: *to I" A
" D 4 I i P 6 4 2 1 . 6 3 3 e 20 1 a i n " 21 1 1 6' a s 1 1 5 . lS
2' I' $ io 26S. I64 PUG 6 1ap I Gs 111 162 we0 e14it0 I-4a $43. *a
2) 24 :' Ile 3 . 6 Ia 3 1 2 . SO 2 21 1 2 t 26 2 t G 94 7 ? 1 15 All * -a
26 2 6 l4 24 29 1)6 344 ' 3614 649"6*7!44114 41 61 .4 $ 14 966 +43, ',
34) -A I 2 t p Il al 1 4) A a3 " 1 I 3, 11561 1 u1 IS a" 'a 22
344 1 0 4 m 4 3 z" 3 a 64 me l a) 34 56 26 6 i s 564 is log 1 '
am ~ A in in I: ; e iit a al~ 1, II 2 1I l
261 11 6 a 14 Is 96 , It 11I a 641 a '1 164 5% 64 ? a " 1 7 3 3 I 3 . 4 No2m al3 l 4 :0 6 1& 66 21 a 1,301 3 Its 3 1 J F 6 1 ' U M o6 to 4 I
i O I ::1 a9 D 15 7 :O I liI SG I MII S is t * 1 j t l P : Il
247 VI4 366 6 1166 is 20 33o 040 14 s )) 1413 )6 31) 6 us 424as$ 60 a4 "it is 9 6 to I3 Is a U Is? 6 19 6 ISO 4 93 6) I 7 VI 16 511 i 4s JI 12 1124) - I 6 46 6 116 64*61 3'n.) a se o u S V *,a *, 04 143 i6 16 6 00 4 1'6112n4i3a 273643s6I4gas4141 l A2a6 17 e 16 16 "it6is #?a 341 mw isaf 460
Am4 )3 64 3ft as 4on I4 M 1 2 s a9 466I 374 GAS &W214 6 1 63 to6 Me1)4 ISO GOit's 24 69 we413 3m 1 6 9 a 13 067 an D4 m1 Of al" 414 37 4 6 lie '2s2
346 6643 . 41 I 04 1 '6 376 16 i61 & 4 3 1 ap 6 11 all IS 6 62 :3 6
-~o~l I'so4-re~l By Is 2
a " -is.F7 11 664 1 ro "1 19 I" 42l 40
3 S6 666 4604 46Wft 1604 1336"66 36 6 6 416#410 4644 13664tCC4Mt~
S196663Y OF 3AD IUWADIN3 611.080IVG 7CLEp
T.st. ps' C A a 7,
.4. Fa. k?. 4?. 1 2
22) .54 I8 223 -4 223 C63 2 5!i 2 61.1 2 420 a 136 3.3! "'
-2 6 4 A 76. ;0 P79 92O 2 232 2 -,95 1 973 0 132 2 .2 13'211 ')1 23 81 .2 827 96 2 962 2 99 2 613 0 134 0 .:21332 '-8
2'2 -23 641 3113 .6 933 .4 3 12. 1 :38 3 177 0 148 1!' ' -
1 3734 i56 ' 421 83 2 82 :4 ly1 2 8128 6 5. . . .
*. - 22 223 6 i84 ~22'23 2 '8 2 '61 I
1 45 : 23 1636 i8 .3 214 21 :it 2 .2 2: :1
Z 2 V "', 382. 1 1". 1321 3233 :2 .I''8 22:I .A,4
:2 2 2 .8 28 47 '6 Zit1' 3 1 2 3 2. I:'. it -1 13 '
22 3 4 .92 2 0 2 243 2 2134 9 0 226 0 3)- .2 62 0 Is Oft .9 8 '
Z2, -21 )1 488 62 313 282 a8 2 3) a 638 0 126 21 . :- - 0 2- . 2.3 '5-
226 '3 4 89 68 o 3 3Z1 I 39 : 31 281 0 122 zi is 2 0 ;33 '' 06 0 6 .9 1.
233 1.6 1.6 6330 664 17 423316.820622 '6'. .
23. '29 156 1 01 38 4,1 867 4 '6 3 12 19 5. .33 89 e2 1.93 8'0 .39
236 235 i9 515 "6 $3 63 3 %6. 3 '32 3 623 0 13n 0 26G1 )7 3 0 )a,, 64 0 '7 ' )'
2? 33 22 S36 88 554 2'297 321323 6 :2223 42:6 3 36'
.3: 73 37 603 32 62 82 3 81 , .30 a 3 3 7 ' 10:6 4 82.: a6 16 1 613 23 3 8962 3 936 3681 0 16 211 5' 60:391'2 '8
249 033 49 171 64 166 39 "1 60 9 %3 0 134 0 360 13 so 0 123 Is 443 .3 .2 37 !.6
z43 1to16 70 5 86 f 15 2 2 436 .1 67 0 0 166 0 336 U9 'A 0 113 16 113 16 :!7Y 2296 4 1 S6 1: 21 74 0 2669 17 3 36 3 63 3 43 0 15: 0 46 a: M3 0 076 24 231 22 '6G 28 2
245 16 31 206 63 224 15 2 396 961 538033 3 S 80 91 .8 1 8 4'6 ' 224 170 as 226 i6 23 6S o , 90 4 214 6 131 0 246 0 !36 89 84 0 112 22 279 28 .3 v 9 '.356
247 364 64 432 61 430o 26 6 1 34 6 226 6 162 0166 0 433 :93 07 0 ?93 36 ?99 34 ',e% 34 291ISO Us3 99 696 26 676 435 4 6)2 6 316 66"04 166 0 346 336 D1 0 216 63 126 529 1:12 291
231 13 16* 193 it 19 33 3 123 3 206 5 216 0 166 0 .40 61 035 0 276 16 279 14 '80 38 86922 33 07M 413 20 636 94 3 :51 4 026 3 9630 156 0 231 '.0 66 0 070 36 119 27 636 '4 903233 3 66 366 'Z 616 %a 373 3 34 3 330 0? 1 Z3022 4 39 0 2860 36 880 27 4 ' 7 ?3 229ASA .- . 91 99233 339 93 403 36 690 99 3 S44 1 69 3 94 0 156 0 243 1:3 35 0 V76 38 652 30 47 12 210256 36 31 633 04 637 36 3 336 3 443 3 357 0 174 0 684 324 36 0 278 53 628 33 'Il 2642 )-0
A57 360 36 411 66 663 93 6 061 6A 111 6 132 0 166 6 Z72 134 32 0 081 4Z 606 33 .10 93 696Is& 666 6is 257 9116 91 19 030.176 31 33?700 0078 IS802963798150 683936 636 66 76 73 73 91 1 9 6): 3 0 6 301212 6 6846 3 9 6
a"6 626 46106o 5 3337 3 164 3276 3 2:30166 : 11 136 35 0 Q6 4260 337.,69 97 60M6 663 Sy 69 61019 31 2 "1 I IM9 2 767 0170 0111 274 64 0 0'7 71 956 36 '34 133 336
962 36 63 4)7 62 636 67 3 6IS13 323 3 64 0 Z16 6 202961 11 0 017 39 860 23 220 90 523163 336.31 677 46 612.67 9 ,6"4 a 771 9 764 10 230 0 26.9 !1 35 0 .03 62 970 40 469 113 606
Go - mossuzed isplod7@16d mod*1u
(;U e wlood-rii1aad modLum "crrectod fot stross 1w*L '
0 a maximu dynatc shoat modults, frM r.oment to* Am tests

TABUE 9
s166mm ( 4TV LMAOIX-fLflADIZ CYCLE
~~p 9A C6 ~ A ' C "'AB P ~ A'AV ~2 I
bra bra t1 21 2p I 2p Mr 1. 1 71 ~ 4. MP*
1243 144.13 116 54 191 30 7 $46 7.975 7.179 0 :94 0 .77 91 22 0 347 :i 442 *6 o11 70 2291:4- 26 67 34 1 310 61 S6825 6 706 6 647 0 :9S& 0 4D? -'30 14 0 07 ZS 114 Z1 4!3 77 12S24 .e 65 252,51 Z70 07 5 IM8 5 987 5 953 0 148 0 32' 4 47 0 179 11 :20 14 '04 So 6C0244 244: 07 Z66.32 303 91 7 317 7 411 7 256 0 '28 3 294 86 38 0 -165 25 437 20 312 '9 1156
2477 '6862 466 6Z 582.03 6 476 6 573 6.496 0 .34 0 M68 2'6 06 0 C87 42 6315 35 3683 94 29120 : 1 0 1 16 1 56 8 9 1 06".90 0 0. m6 a .3 361 280 97 6 2 3 35 4 102 291
I 7 2.4 15.13 154 62 1907 7 965 7.998 0 24S 7 .33 47.11 0 079 17 43 2 15 493 58 9252 445.47 S04.33 526 73 6 541 $ 4326 6 506 Q 2: 2:3 *17 51 0 1,77 36 J'S 27 :49 14 4r3
2!3 - 73 2,49
~7 437 33 500.30 325 -a9 6 26 6 205 6155 2. 2:2: 11 an3 - ~2 6474 34 774 111 645. .3 5 412 5, 724 213 2 '.4^ .26 1 -1: '. 4':6hZ-i 1.2 3
Z!? 501.30 SIG 35 598 32 4 385 7.076 7 320 0 :.2 : :44 F 4 0 40 ' 23 7: 5 35 ,6
258 :S52 8I 1182.40 1240 al 3 421 3 504 3 489 0 '..s 1 : 372 45 0 )75 57? 329 5 o2 8374676 43861 323 61 6346 434 A424 7220 1 5 24 0 061 s 544 ,5 90 12423 5 ) 71 40 4 7 625 9 1 4 74h 4 i54 4 807 1 0 : 276 "a 54 0 :824413 7 7 40
61:132.86 1246 IS 1336 63 4.437 4 517 4 755 0 62 2.7 33 1 0 .72 ?. 252 58.378 133 55424 8 64 568.63 59468 6 531 5 6186 .543 0 174173 S 9 13 0 374 41 460 24.297 40 52323 716 0 3 642.66 657 29 6 206 4.311 4 313 0 2111 0 229 [:95 81 0 a95 92 810 '0 348 113 8")
G R* . lOad-r.eod sod-fl corroctod for st5r#s. WvIlK. ho
- us~~aty s h.ar modulus r'srs . :~ tests

TABLE 10
S566A6W OF IST RELOIN [IX6O~AIN 7W CICLR
So 6?. ke. kpa t t t t L p I '
201 446 36 562 71 575 65 13 604 13 731 13 131 0 ! 2541 :)a13J3 0 1 4 A1120 0.136 7 306 17 11 37 5,, 00 9. 110 2
206 7 50 07 53 17 13 91 6530 1'~ 3 0 62 1,
209 0 97 152 06120 32 B 299 9 2o9)~b 9 700 ~210 60 5 ZB 671 0 0 6 71 03 B 177 9 216 9 Zia1 '2% Ws so, 0 .3
Z11 114.65 16? 07 267.07B 938 705 11 712* 6092
211~ 55 4 27 656 25 656 25 6 1 1 9 15 9 ' o:20 6011
2 12 !57761a 652537 .52 3? B 626 9 596 9 01 *40 6 4..213 464 g9 556 23 533 26 9 555 9 1',6 9 -.. 'i .67 7.
216 70.2 )4 390 613 740 53 5010 3 68 4
2:5 1422.45 1579~ 1 0 39 530 0 . .
2'.6 556 46 631 23 601 23 .515 g 3 1 2
16 . 45 507 'o9 . c0405 10 '1 1F211 507.16 60 0 19 0 . 9 0 33 31" 4
220 366.66e 439 -6g 639 so g 396 10 062. . . .4 i44 4 I *
221 273.70 335 !0 335 50 9 311 9 919 3 1 1~ '2121 1
2.2 160.06 534.55 534 65 13 22 3 1 10 0' .2 jo6 50 I4 02.24 6562 75 34 750.7 15510 3 100' 215 9 6 0 C i
226: 1 66. 03 1320 43 1320.43 10 405 10 4'. 1 3 .I0 a 91 57 2 0 2 '6 s''24
23 4 552.30 663 11 !63 :6 86Z 82 A ' 6 6 0 ' 11
236 470.66 573 19 571.92 7 110 716 2 0220.32 0 ' .~6 64
237 526.60 596.45 94 49 7655 7719 '60 1Z~ 253 4 74 0 ~9'236 a70.6 527 76 126 0 7 .47#. 0 0000 275 04 ',2 . .'
239 47.79 569 SQ08 2 6 101 6 21, a 2:7022 221393304' :4
240 - 1 J2 3? 0 I6 1211 1 ,
242 1137.341 176.521 174.62 981 9 0 91 6 9 30 )42 L21 710 6.. 6.6921 92297014 23 '37064'22 1:.11 ;
I st Rtloadlzna-UnlodinS Cycle,. -- 2.nd 00 ~ 'n..,40
%U masured reaLoad-*n1oad go0,slus
Gnu.o rel.oad-unload modulus corroct4 for stress "*1 '.)
Go m azima AJr.c &hear mdu.... from r*s--nct cola,-oats

TAILK I
SUSME? OF CALZ1ATKD ANCLS OF PRIMTON AND 01 ATANCYIc -3'|
PS PS 71L P(2fl ' I"Iv2P(I I)
20, ' 1 0 3 .
1 3 'i '
21. q
216 0 12 31 1 16 * 2* 127 213 0 13 3 S,3 ~.. ~ 3'8 ~k 219 0.1 3. '.a .I,'~ .
L 221 0 .2 18. o, :L ''i.
A 222 0 V .01 1 A 3 :) ' .' ) Q .
T 224 0 .6. 2 .1 4 " ' .113 3 ,) " 111 .00 . .'
I 225 0 47 1 1 44 1 h ) 13 10 9 . . 0 209 .. 0
o 223 0 47 41 9 44 1 .1 4 0 0 13 5 12 7 S 0 189 .8 2
2 0 #9 43 3 0 5 .' 0 11 8 14 3 1' ) 62 2 0 198 18 12340 .5 40 41 43 1 . 1 II 1 3 - A 8 219 .89
235 0 .2 Is 4 4! 9 3 1 S 1 6 6 .9 -0 0AS .1238 0 '.8 42 6 45 0 . 8 10 9 14 2 11 9 47 9 0 211 .9 621 0 45 40 S 41 1 1 4 3 2 It 9 12 0 .1 1 0) 10 .9
236 0 34 12 6 17 6 21 1 8 1 6 1 5 3 0 209 .4 123q 0 3 15 6 19 '4 1 # 1 I 2 ..3 ) 0 203 . 1
241 0 40 37 0 40 55 .0 1 3 8 4 8 39 0 268 0 2
242 0 40 37 1 40 5 A 8 3 1 S 4 12 5 46 6 0 095 '.1 9
S 243 0 3? 14 8 38 9 )3 2 1 0 6 5 1 0 72 6 -0 098 f2 0
I 244 0 40 11 0 40 1 IS 1I 7 8 4 5 1 45 4 -0 095 .1 9
L 2.5 0 52 &O 3 41 47 4 14 6 t 8 6 0 093 '.2 0
F 2 06 0 39 8 363 39 9 - 2 9 1 1 0 094 42 7
2470 ,61 55 3 5531 4I 6 29 0 19 2 9 1 0 082 1 4
a 250 0 43 39 1 42 0 4i 0 8 4 10 5 11 4 486 0 08 41 0
0 251 0 47 81 9 44 ) 42 0 10 0 13 5 10 1 62 1 0 097 42 2
I 25 0 42 I8 4 41 6 19 0 5 5 10 2 8 2 39 ) 0 215 s0 I9 253 0 59 W 0 51 6 44 1 71 2 ? 9 15 0 45 0 0 203 50 0
D 254 0 56 4.3 n 49 A SI 1 13 3 19 3 23 1,5. 4 0 197 '.8255 0 47 41 9 44 1 -.1 0 10 0 13 S 16 9 42 4 0 161 436
256 0 42 13 4 41 6 38 4 ) 10 2 5 !. 65 8 0 141 '
257 0 '.8 42 8 44 3 38 9 10 9 14 1 3 (019 9 0 251 .2 5253 0 76 81 4 81 4 52 7 11 7 -25 2 33 3 0 213 .9 0259 0 48 42 8 44 3 4 4 2 10 9 14 2 13 1 45 0 0 259 .4 1280 046 41 2 4480 510 9 11)3025646 1 0 262 S0O2; 1 0 4I 4' 6 46 71 41 13 1 16 0 12 5 Q6 0 252 49 1262 0 53 46 0 83 1 49 4 15 5 1720 3 46 0 0 211 S2 1
IbUIAL 263 0 S5 87 49 1 48 1 11 4 19.0 1 ( Y 84 2 -0 258 s0 0
msthodl7 1: "wow~s or *1 (1977)
2 Iobertson (1982)3: mnamsero (1967)

FIG I SCHEMATIC CROSS-SECTION OF ENEL CRIS CALIBRATION CHAMBER
FIXED TOP
7 DIFFERENTIAL PRES-SURE MANOMETER
LATERAL DOUBLE
WALL BARREL
LATERAL RU1BBER
MEMBRANE
BASE WATER FILLED LATERAL INNER
MEMBRANE BASE CUSHION CELLIITOL PISTON l,-OISIIILACEMENT TRANSDUCER
LATERAL PRESSURE

FIG. 2 SCHEMATIC OUTLINE OF CC LOADING SYSTEM AND OF
DATA ACQUISITION SYSTEM FOR SBPT IN SAND
CC LOADING SYSTEM
"I) CHAMBER
.LOADING FRAME
D3REACTION JACK nPE NE TROME TER
DRIVING SYSTEM
5RUBBER MEMBRANE
7 OUTER RIGID WALL 5
E _7
DATA ACQUISITION SYSTEM
FEDN
GASIEECTROCITY / ES~o
PANEL
GSSUPPLY

FIG.3: SCHEMATIC OUTLINE OF SELF BORING
PRESSUREMETER PROBE -CAMKOMETER
MARK VIII
o- FLUSHING WATER
SLURRIED WATER AND SOIL
CABLE AND GASPRESSURE TUBE
GAS RETURN LINE
-.-
INSTRUMENTED- jRUBBER MEMBRANE
SPRINGFINE THREADS
FEELER-- \---P:ORE PRESSURE CELL
ARM
CLAMP--
-CUTTER
CUTTI SHOE

SAND 1-TICINO 2-HOKKSUND
DOMINANT QUARTZ (30%) QUARTZ (3S%)
MINERAL
ANGULARITY 8+-9 6-8(LEES' CHART)
MICA -'5% -10%
}''max (tm/rT 3 ) 1700 1.759
)rMin (t /m3 ) 1391 1.438
GRAVEL SAND1 1 C 1 1 M I F |
6.0 20 0.6 0.2 006size(mm) I) _._
,oo ___ II
~30,
80%~
70%-
< 10 20 40 8020
sieves ASTM n°
FIG.4 CHARACTERISTICS OF THE TESTED SANDS

-AND CONTAINER
SANDSPREADER
I -PERFORATED PLATE
-- HTE PLATE
AIR ACTIVATEDPISTON
PERSPEX INSPECTIONCHAMBER
SPECIMEN FORMER
CALIBRATIONCHAMBER LATERAL RUBBER
MEMBRANE
BASE CUSHION
FIGS5: SCHEMATIC OUTLINE OF SAND SPREADER

FIG.6: SCHEMATIC OUTLINE OF IDEAL INSTALLATION IN CC
SAND CONTAINERSHUTTER PLATE
SUSPENDING WIRE-
GAS/ELECTRICITYCABLE - DIFFUSER
PROTECTIONCYLINDER0
- --PULLEY
SLEEVE 1.
EXPANDIBLEMEMBRANE
MEMBRANE CENTER - -4MEN It LATERAL MEMBRANEPOINT
PORE PRESSURE DOBEWL
TRANSDUCERS I ! -DOUBLE WALL
SHEBARREL
SHOE c/m/---BASE MEMBRANE
....... ,....,..°. •

WATER SWIVEL
DRILLING WATERHYDRAULICMOTO R
P B=" SLURRIED WATER+CUTTINGPUSHING BAR
ROTATINGINNER RODS BALL SCREW
EX RODS
GAS/ELECTRICITY CABLE
REACTION FRAME REACTION PISTON
TOP DRAINAGEL I N E _ _ \
-DRAINAGE WATER
__--CC MEMBRANE
__B --- BOTTOM_ SB DRAINAGE
MEMBRANE LINE
PERFORATED
SCUTTING PLASTIC TUBESHOE
FIG.7: SCHEMATIC OUTLINE OF SELF-BORING INSTALLATIONPROCEDURE IN CC
. . . .... ...... . ......-----------------
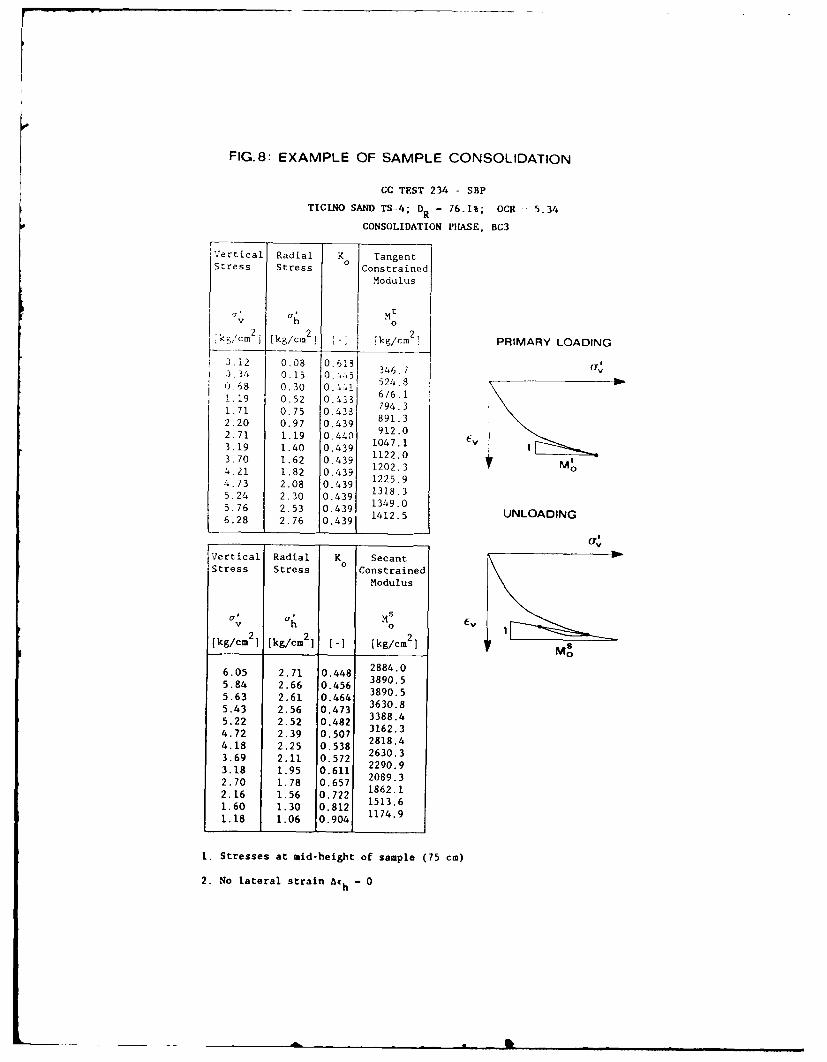
FIG.8: EXAMPLE OF SAMPLE CONSOLIDATION
CC TEST 234 - SBP
TICINO SAND TS-4; DR 76.1%; OCR -- 5.34
CONSOLIDATION PH1ASE, BC3
Vertical Radial K TangentStress Stress Constrained
Modulus
' a' Mtv o
k/cm 2 [kg/cm
2 [kg/cm
2 PRIMARY LOADING
j.12 0.08 0.613.0.34 0.15 0.4 1 5 346.70.68 0.30 0.41 524.8
1.19 0.52 0.433 676.1
1.71 0.75 0.433 794.3
2.20 0.97 0.439 891.3
2.71 1.19 0.440 912.0
3.19 1.40 0.439 1047.1 v
3.70 1.62 0.439 1122.0 t4.21 1.82 0.439 1202.3 0
4.73 2.08 0.439 1225.95.24 2.30 0.439 1318.35.76 2.53 0.439 1349.0
6.28 2.76 0.439 1412.5 UNLOADING
Vertical Radial K Secant o"Stress Stress 0 Constrained
Modulus
a af MS0
2 2 21[kg/cm2 kg/cm2 [-] [kg/cm M
2884.0
6.05 2.71 0.448 2884.0
5.84 2.66 0.456 3890.5
5.63 2.61 0.464 3890.5
5.43 2.56 0.473 3630.8
5.22 2.52 0.482 3388.4
4.72 2.39 0.507 3162.3
4.18 2.25 0.538 2818.4
3.69 2.11 0.572 2630.3
3.18 1.95 0.611 2290.9
2.70 1.78 0.657 2089.32.16 1.56 0.722 1862.1
1513.61.60 1.30 0.812 113.61.18 1.06 0.904
1. Stresses at mid-height of sample (75 cm)
2. No lateral strain Ath - 0
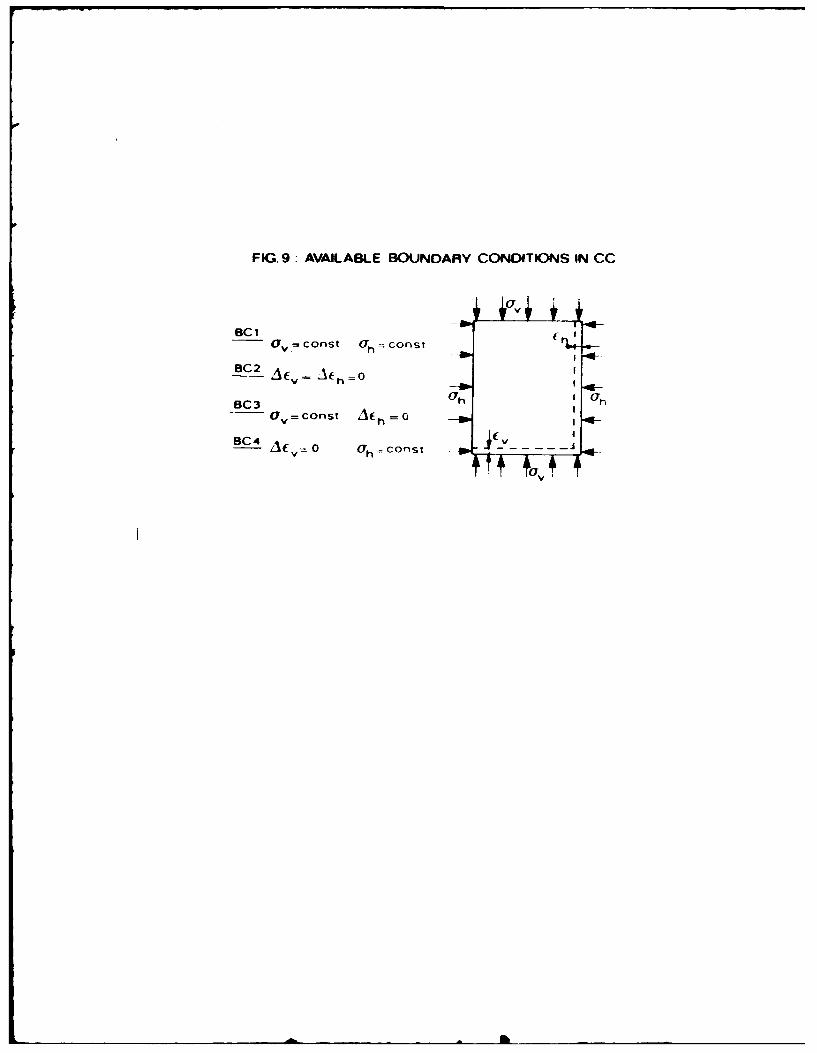
FIG. 9: AVAILABLE BOUJNDARY CONDITIONS IN CC
U
0C I -r,=const rh coflst
vh~o
BC3 Ut, atci -const lh=0 I
BC4 AfC~l~
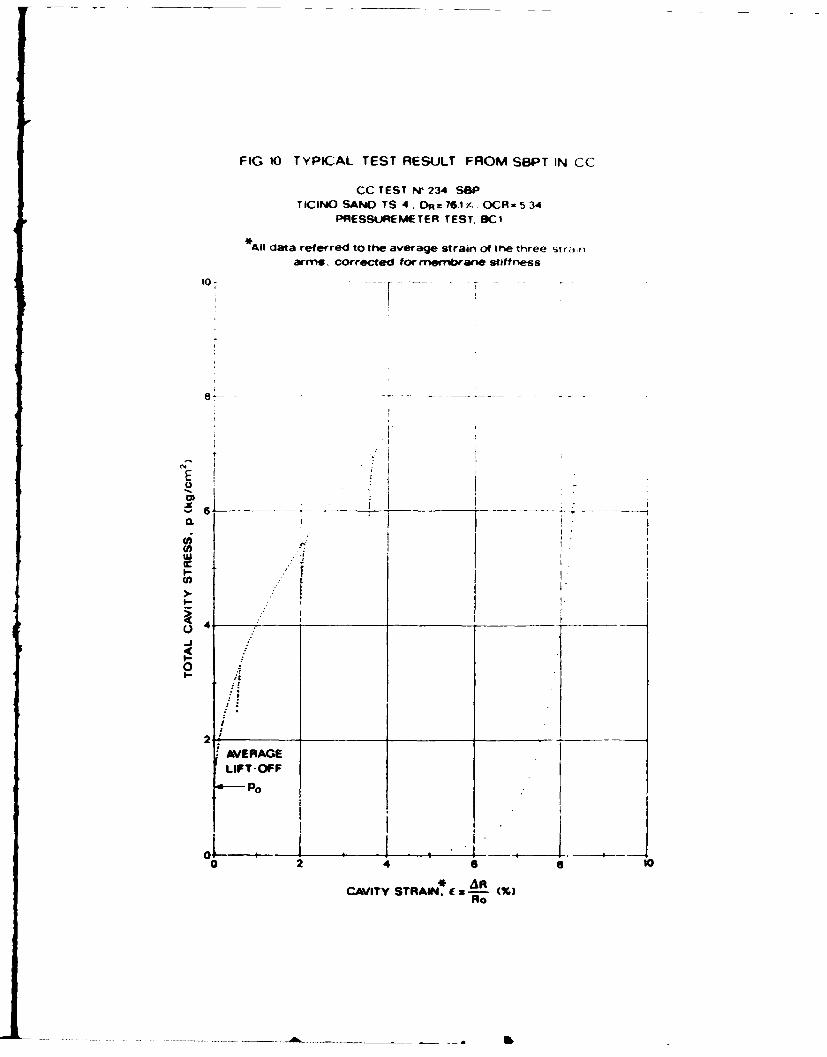
FIG 10 TYPI4CAL TEST RESULT FROM SBPT IN CC
CC TEST IW234 SSPTICINO SAND TS 4. ,)R76.I/, OCR -534
PRESSUREMETER TEST. SCI
*All data refer-ed to the average strain of the three strainarms. corrected tor mermbrane stittrness
~-6
u 4a, I0
0 2 4 a a to
-AJ
CAIT AVERAGEf

P, (kg/cm 2)
S(a)ua
" 3 r ORIGINAL STRAIN ARMS xoPIDEAL INSTALLATION
:;//o /
R
0 / -... CELL
31- ODIIED TRAN ARMS ./ . ro P
LI L
I DEAL INSTALLATION//-
4A IN A AN00
U. 2 -
APPLIED OUIZNAY STRESS FR~ (kg/cm STLLAO
K. CC
0
APLE BUDR SESrh k/m
(b
0
w
S0002 3
APPLIED BOUNDARY STRESS. (Y,, (kgCm 2 .
FIG. 11: COMPARISON OF MEASURFED LIFT -OFF STRESS ANDAPPLIED HORIZONTAL STRESS FOR IDEAL INSTALLATIONIN CC

FIG. 12
1-D STRESSING OF THE CAMBRIDGE KoCELL IN CC
TICINO SAND. DR= 60%, TEST N ° 226
D 5 t[ OiDING
-z0 W *. 13(- 3 UNLOADING S -'"
/
t0
0 -- -! - /
, /
l i l I l I 1 l l I0
] o I2 3 r,, ,g~c',,0
!£
IA

FEELER ARM COMPLIANCEDURING COMPRESSION PHASE
IDEAL INSTALLATION TEST N 213
0: T T
( r m(5 1 h 108 kg cr
2 , = 1:34 kg/crn"l
z I rv 2 2 0 kg/CM 2
, 2 71 kg/crn:l
0 KOUTWARD ! g " 2
cn INWARD
wi
Lnf LOADING
TIME (min)l-
.I 41 -r- 2' cmOh = 1.41 kg/cm =2 .34kgCh i V tr
= 28 kg/cm 2
> t -2.56 kg/cm2 (h="S3kg/Cm2 7 2 16 kg/mE
cc,z
0 TOUT WARD ' i
4 INWARD
Ix
4UNLOADING' ,
TIME (mIn)Vw
FIG. 13
- b ... .. . . . . .. . .. . . . . . .

-uu~
z- CL
U U-
LL
0 < V).-
u LL J~
< 0 j
_ < <>
w~
w
00
zzZe< za
U-
LL 40V -r
www
0>
0>0. 0
00 cd 0 ~ ( ~
(ALUi) SS3W.1S AIIAVO 03I1ddV

FIG 15 DETAILS OF ORIGINAL AND MODIFIED SBP
STRAIN ARMS
ORIGINAL DESIGN
30 5 82.4 ,mm
6
,317
, ,- 12-
Material:Brass
MODIFIED DESIGN
(30 5 91 5mm
4.5
10
Ball bearing L 361 85.9S3175 - - - -
122 mm
Material:
Stainless steelAISI 420 F

P0 (kPa)
wucc MODIFIED STRAIN ARMS
(n SELF- BORED tNSTALLATION
(n 00-
00
Cl)
ice.00£20 30 uka
APLE4ONAYSRS
FIG t6 oMP RS NBT EN M AURDAEAELF--
PRESUES NAPPLIED UD STRESSSFRSL-OE
INSTALLATION
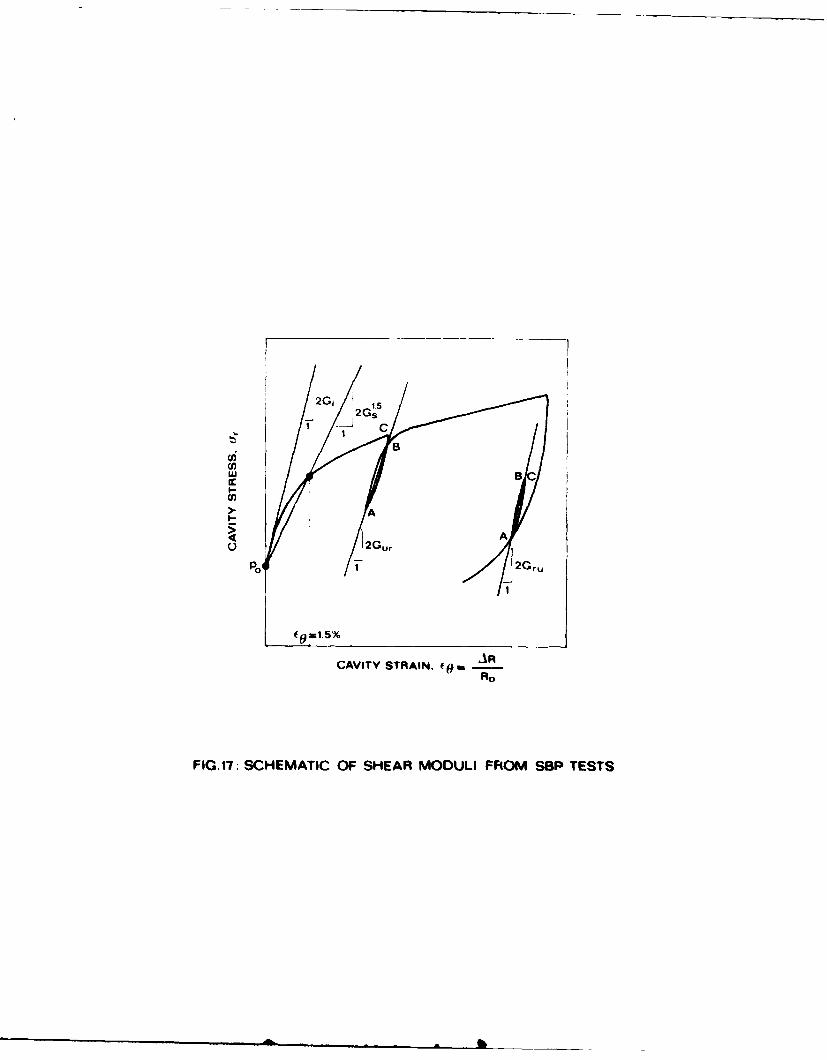
C2G,
11.
> AR
CAVITY STRAIN. E9o -
Ro
FIG. 17. SCHEMATIC OF SHEAR MODULI FROM SBP TESTS

22ELASTIC PERFECTLY ELASTIC-PLASTIC
PLASTICWORK HARDENING*
2' 3
222
011- LINEAR ELASTIC 01- ELASTIC
f.-2 -~PERFECTLY PLASTIC i'2' -~ ELASTO-PLASTIC STRAINHARDENING
2' -~ -qrl =MAXIMUM
23'- ELASTO-PLASTIC STRAINSOFTENING
(*) ACCORDING MANASSERO (1987)
FIG. 18: SCHEMATIC OF EFFECTIVE STRESS PATHOF SOIL ELEMENT ADJACENT TO ANEXPANDING PRESSUREMETER

cG,,CO
t,-I
t EXPANSION4/ / CURVE
" AU .
U.
o
CAVITY STRAIN
2
FIIEALIZE ESP|
2
FIG. 19: SCHEMATIC OF UNLOADING- RELOADING CYCLE
DURING SBPT IN SAND
.. ............
.. ..................
.. . . .----

0- 0
Iv o -AV
- 0.2 - LOOSE SAND
0.1' DENSE SAND 0 .1i
10 20_I4050
a) RESULTS OF SIMPLE SHEAR TEST (AFTER STROUD1971)
s s
p p
v
0 t
b) SIMPLIFIED MODEL ASSUMED BY HuDGES ET AL(1977)
FIG 20 STRESS-STRAIN AND VOLUMETRIC STRAIN-
SHEAR STRAIN CURVES FOR a) SIMPLE SHEARTEST RESULTS (STROUD. 1971), b) IDEALIZED BY
HUGES ETAL (1977)

FIG.21: Stress/I strain relationships from- test N 222 (D :46.2/A)
MANASSERO (1987)
a
2 14 i 6 11. I S 2
a)VOlurnetric Strain vs shear strain b) Stnear stress vs Shear Strain
'.a,aOr G() (MPa) (MPa)
.1 2
4 2 .3
a.pa
2
c) Stress ratio vs shear straw-I d) Shear stress vs mean normal stress
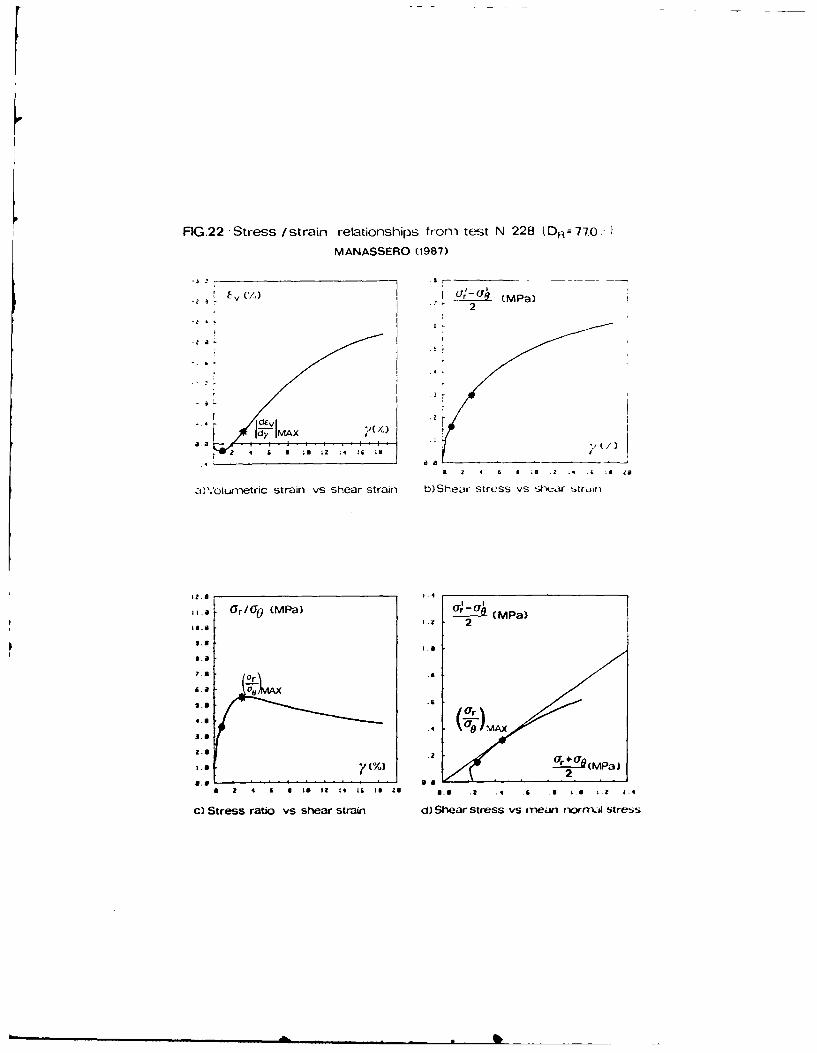
FIG.22 -Stress /strain relationships from test N 228 (OR= 77.0,;
MANASSERO (1987)
- , cm c i
-~ 1 1
I 2
[ Z MAX I
ia a2 4 6 o q . I
a4 4 6 A is 12 .4 i~ Is z4
a)VoLarTetric strain vs shear strain b)Shear Stress vs Sbc r strorn
11.a or/0 0 (MPa) o___(MPa)
.2 2I.4
ii~.4
.4 r ff MAX
m 2 (Mpa)L2
a.) S aI s s st1aIn S a stresss .1 1t.s
C).tresrtov ha tri ohasrs sea orvlsrs

tan i rV% oa s A'.
oL1
FIG. 23 ANGLE . DEVIATION OF THE ESP FRMISOTRICC
44MAO~MMO MWY)

FIG. 24: ocv OF SANDS USED IN CC TEST
A --.- .-.- ... -300- HOKKUNDSAND O' 3
T(kPa)
200-
100- Y.,
o oo 200 300 400 500
A 4,kPa)
500-
400L O ANoT(kPa) I
300-
200-
32-s~ 340
100-
0 0 1& - I300 400 500 600 700 800
or, (kPa)
lk- --
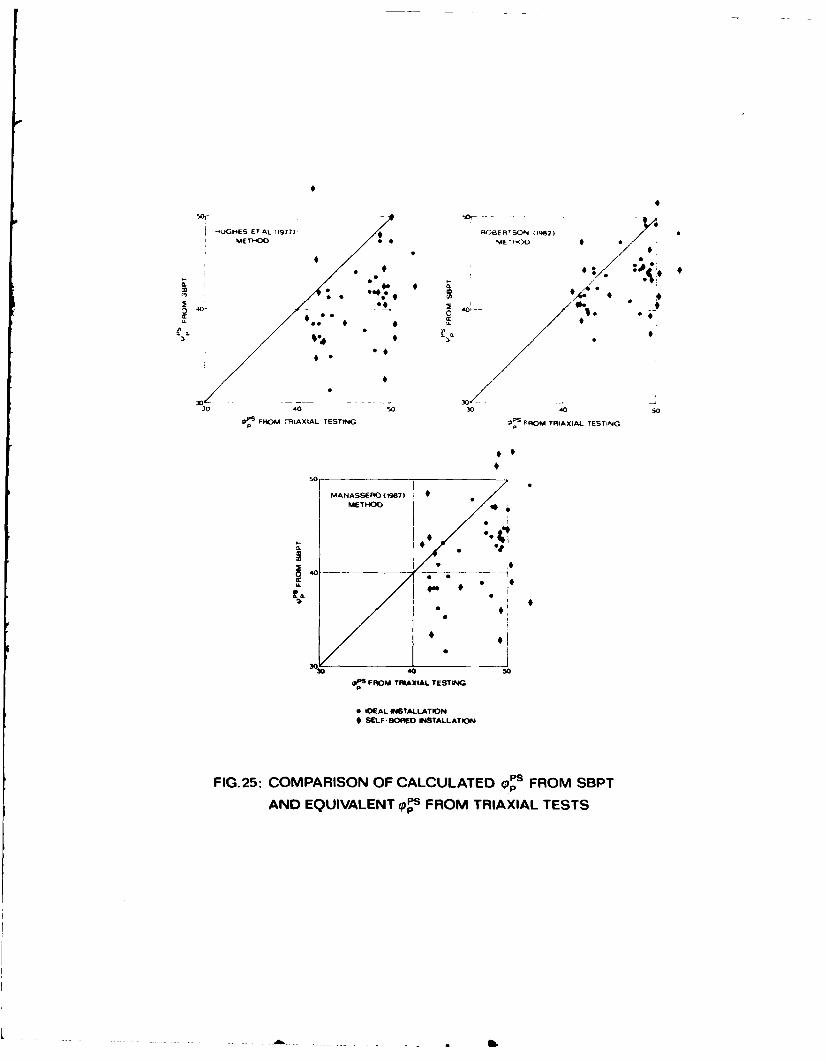
i4
.-UGHES TAL I977) ROBERTSON (192) 0
MET00 * 4 50
r
0
,nn
30 - -- - -
30 40 50 30 40 so
rFW TRAXIAL TESTING FROM TRIAXIAL TESTING
MANASSET (p A7)METHOD
30 30 405040- FP0AT*AXA ETN
SEF8tW INSALTD
AND EQIVALET ipS FROM TRIAXIAL TESTS

APPENDIX I
EXAMPLE OF COMPUTER GENERATED PLOTS
FOR TYPICAL SBPT RESULT
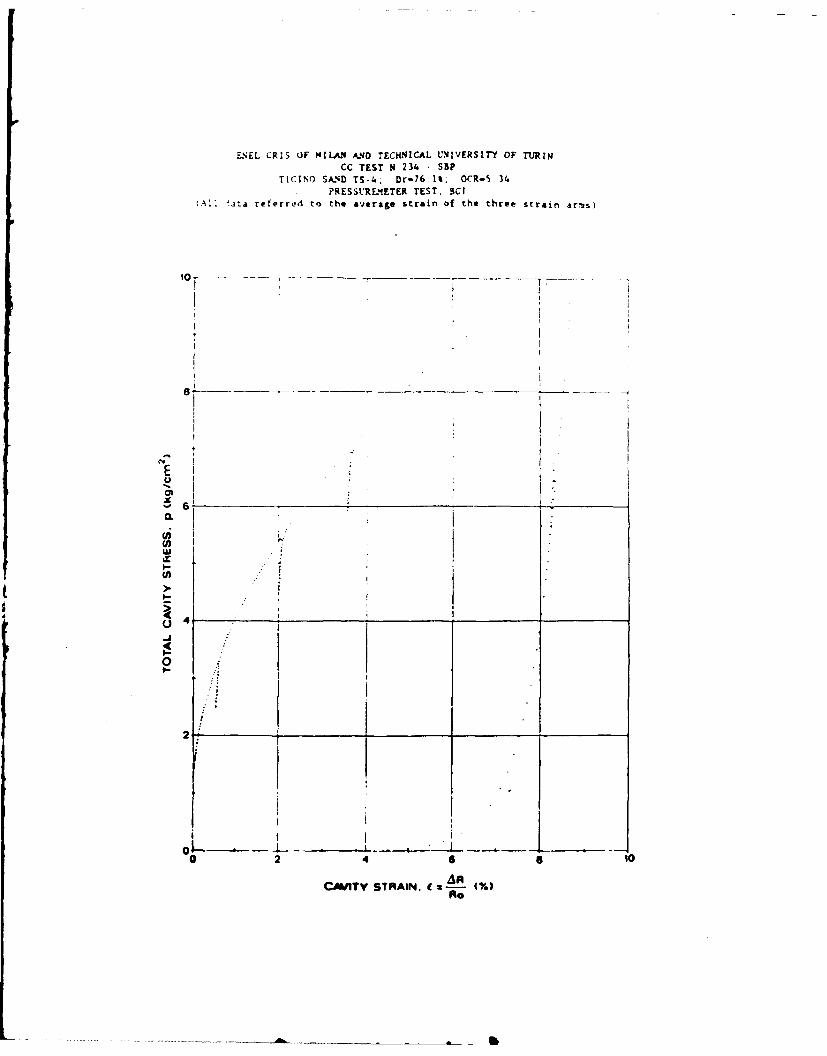
ENEL.CRIS OF MILAN AND TECHNlCAL L'NIVERSITY OF TURIN
CC TEST N 234 SSP
TICINO SAND TS-4' Dr-76.1% OCR-5 34
PRESSUREMETER TEST. SCI(Al! t.:a referred to the averaig strain of the three strain arms)
.j
2
El
ono
4 I
0 2 46 6 tO
CJIIITY STRAIN. ( (%)Re
. . . . . .. ..... ... . .... .... .. . . . ..... . ... .. .. . . . . .- --...... . . . . . .- S

ENEL-CRIS . "'.AN AND TECHNICAL OiEFSITY F RINCC TEST N 234 -
T,': '- SA ;D TS-4; Dr-76,14. 34--5 ]?.ESSUREMETER TEST. 3-1
All data ref~rr: -.o -he average strain 3f the three szrat arms)
LOOP W I
3.80 -- ... -- - --
o loadir.g ( ( IR/RO)A =
*unlloacdryo eload ( AR/Fo)= 0.609ao reloai P4= 2.487 kg/crn 2
Ip = 3.237 kg/Cm 2
G = 546.4 kg/cm2
3.50
EU
Z3.20~
0.(n
>
w
I-UJ)
4 2.90u-.J,
260
A:
2"6003 Q55 0_7 Q59 0.61 0.63
CAVITY STRAIN. f ':L (%) %
- -

I - ' F L-N AN!D TECHNICAL 'NIVERSITYcC TEST N 234 - BP
AND TS-4; Dr-76 I%. O R- .F:ESS 1R. ETER TEST. BC1
,. fata tet.erre1 t- he average s-rain of the three strair. arms)
LOOP N° 2 UR
o loading (AR/RO)A,= 1.994
I * unloading (ARIRO)B 2058
o reloading ;)4= 4.467 ,g/cm2
p3= 5.273 g/cm2
5.60 649.3 kg/cm
2
C
a 5.30
U)
U)-
I-PI5
4.70
:A:
4.40 "
(99 2-01 2.03 2.05 2.07 2.09
CAVITY STRAIN. ( = (M)Ro

{.wIt. ":S ',F MlttA AND TE Ht.';:.-. UNIVERSITY . 7 RCC TEST .'4 2314. SBP
T!,:NO A.4ND TS-4. Dr-'- 1%. 0,l- 5PRESSURE.'IETER TF3T. BC1
All Atara referred to the average striin of the thr.e strain a-'
LOOP N°3 UR
7.30
(,AR/Ro)A= 3.546O Ioading (AR/Ro)3= 361t
unloading pA= 5901 kg/cr-o reloadrg pB
= 674B Kg/cnm
IL ... G= 6837 kg/cm2
7.00 -.
6.70
W
0
&ii
01
,,
I-I0i
1S4 356 3.58 3.60 3.62 4
CAVITY STRAIN. (=A (%)Ro

I'.> JF MIILAN AND 7C~:~:LN''A~fCC TEST N 2'- 1WP
:NO SAND TS :,r. 6 it. , '-5PRESSURF,4ETER TEST. BCI
(All d.a :eferzed to the average s-rain of the th:ee rairi rr
LOOP N 4 RU
7.30 -- __- -__-____-_- --
(,A/Ro),: 8221 %
3 initial unloading ARMIR.)g- 8306 %o loading PA- 5632 kg/cm
2
unloading PE3 6 761 kg/cm12
G 726 3 Kg/cm2
6.90 -
U /41
CL 6.50 __ _ _ _ _ _ _ _/ _ _ _ _ _ _ _
C,,w
U
-J I4i
661-
5.70A
8.20 8.23 L26 6.29 8.32 8.3
CAIYSTRAIN. An M%)Ro

E*.-'-- -S OF MII1"AND TECHNICAL UNI.RS2: OF TURIN
CC TEST N 234 - SBP7ICINO SAND TS-4, Dr-76,1%. "C,- 34
PRESSUREItETER TEST, V,2
(All dada :_: rred to the average strain of :he t!iree strain a-=s)
5 k
1 140 kg/Cm
U)
q i
M 91 ._ _ _ _ _ _ __ _ _ _ _ _ _ _ _ _ - _ _ _ _ _
>.
U 6
.I
U)...
3.\
I-I
01
-II4f
t -
0246 a 0
'I /no__M, , ( eRIflo(%)
. ... . ... ... ... .. .a . .. . .... .. . ... . . .. .. .. | b

ENEL-CRIS OF MILAN AND TECHNICAL UN'VERSITY OF TURINCC TEST N.234 - S3?
TICINO SAND TS-4; Dr-76.1t. OCR-5 3.
PRESSUREMETER TEST. B,;1(All data referred to the average strain of the three strain arms)
15 ., 1~-___I PiremI8~ 0 g,'Zm 2
12.0
E
CoLluw
.ILO
o4_ _ _ _0
0.0001 0001 O •1
VOLUMETP4C ST A AWV (%
td ,- ,, ,,,hk m m m I,
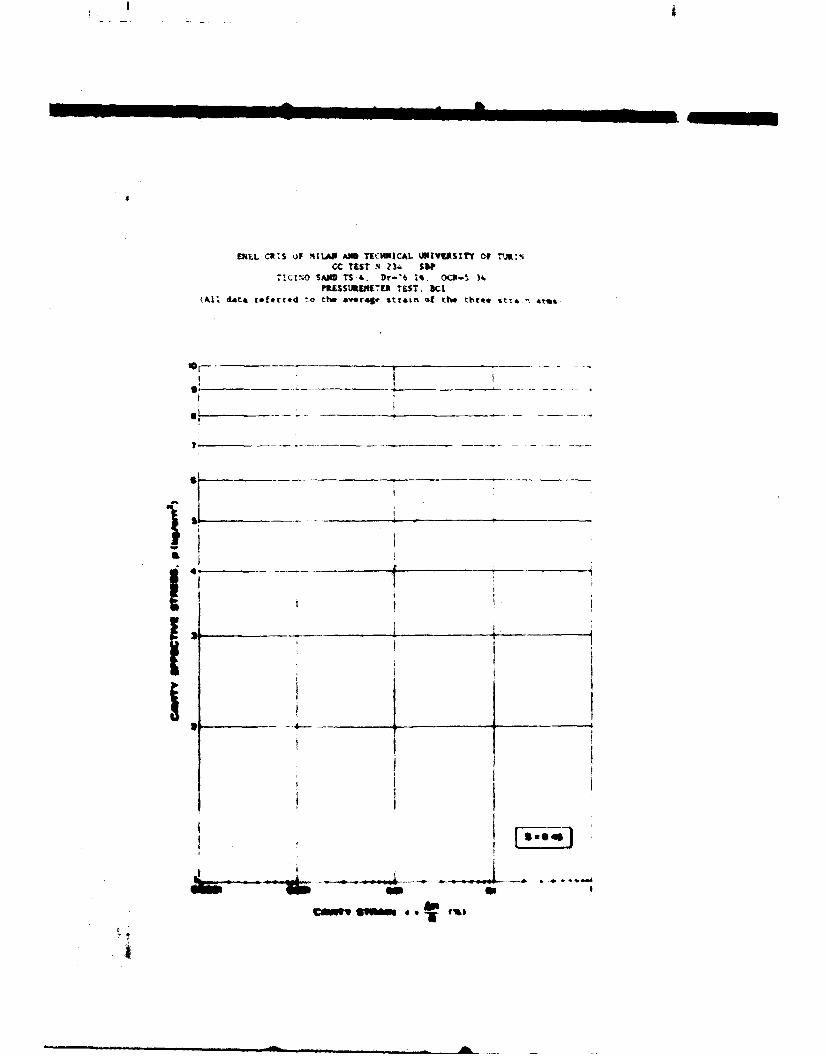
EL CM:S OF MILAP WID TICHNICAL UPIVUSIrY of Tj'A%CC TEST N Z34. SB?
tIC!NO SAilS rS-4, Dr-46 It. "c-5 )16?ILSSUIUIIE TEST. DCI
(411 date referrod to the avr..e st:.~un of the three str,_ arms,
107W ______t
7 w
*1 £L
APPENDIX Il
COMPLETE LISTING FOR EACH
S8PT RESULTS
77'1
APPE14DIX III
CALCULATION OF AVERAGE STRESS ON
HORIZONTAL PLANE IN PLASTIC ZONE
AROUND EXPANDING CAVITY
I-Ii

r ,-
AVERAGE STRESS Ol HORIZONTAL PANE IN PLASTIC ZONE
+ " H
2 1h-sin es rwhere:o r' = radial effective stress at a generl: raliial ds'j :. e
r ' Fp= circumferential effe:tive stress it -- ' .r - i.
distance r s R
p, = effective cavi y stress at 'hi:h .r- iL.;-r.. s,.
loop starts
r = radial distance
R = radius of plastic z:zeR = current cavity radi.s
1-sin :.'S
1+sin 06S
Rf s ir
Rf dror:
Rf s - 2wr drPiv . p-... (2b)
Rf 2*r - dr
Due to the tentative and preliminary nature of the proposedapproach, the more simple solution ... (2a) integrating s along
the radius r is the only method considered here.
Introducing the value of s from equation ... (1) into eqJation
... (2a) one obtains:
PC [R~ Rf(r rKa-1 dr
Piv 1 + sin fk R " R
~ RP jKa-A~V I - sin 06s R .. 3
R
. . .. . .. . . . ..... .. .. . . . . . q

AIso; R I sin ops
Introducing the ratio P from equation ... (4) into equationR
(3) one obtains:
-ho (1+sin ps) 1
where:
Ka i - sin PSI-Ka 2 sin oS
1 2 sin Ok-Ka i + sin *S
From equation ... (5) the following two formulae allows the
evaluation of PAY in the plastic zone around the expanding
cavity
At - of .. (6a)
or:
Piv = P, ... (6b)
where:
1 h0 (l+sin 'S) - 1
(1-sin t oS) ( Pc i'210 o (1+sin 6 $1 1
ho (1-sin ')o ) 2PI s°o (1+sin Ofs) - (
..o

111. 3
Equations (6a) and (6b) are valid only if a plastic zone existswhich means:
Otherwise one has to assume Piv ofo
Ii 06
APPENDIX IV
DETAILS ON RANASSERO 41987) METHOD
FOR DETERMINATION OF f FRO SOPT IN SAND
i A"

IV.:
FROCM DRAI';EZ SE--LF 3, RING TES 'STS :'N zS:.L
A-l'~ N e
ABSTRACT
A nzmerical .~:i s presented in order to Lti.t.e*ct±te stresses and strains path during a self boring pressuremne-ter test (SBPT) in sand.Plane strain conditions and a material behaviour according toRowe's /23/24,' dilatancy theory are assl..med.The obtained results have been checked using a large nu!.-.ber ofSBPT in sand performed in a calibraticn chamber (CC).
RIASSUNTO
Viene illustrato un procedimento di cal.colo numrrco che per-mette di ottenere gli andamenti completi delle componenti ditensione, e deforrmazione durante una prova di espansione esegiita, con il pressionetro autoperforante (SBPT) in sabbia.Si ipotizzano condizioni di detormazione piane ed un comporta-mento del materiale in accordo con la teoria della dilatinzadi Rowe /23/24/.I risultati ottenuti sono stati controllati usando nunerosiSBPT in sabbia, eseguiti in camera di calibrazione (CC).

IV. 21. INTRODUCTION
The first closed form sol.ticn of an c:.:3anding cavity
proble- has been obtained cnsidering a linear elastic
material and small deforma:icns (La:4 '18,1.
By usin. this solution it is possible t7 find the ela-
tic shear modulus G both frj: the firs- part cf the
SBPT and from an unlcad-rez:A cycle.
Soluti::ns for a lincar 1% --*1Ste.-73.-ac-
rial have been presented later by 3 1h *e t al. 6,
for a .jre cohesive soil. and by Hill " Menar,
)'20/, Cassan /8/, Salen.-n /25! an- .es: .26/ f r
frictional and cohesive sell.
On the basis of the above =entioned soluiticns, Gibson
et al. /10/, Ladanyi /13/14/15/16/, Palter /21/,Baguelin
et al . *,Wroth et al . 27 ', .1;; hes et -t" . 12 'ani P:,b-rtZ -n
/22/ have presented procedures for the interpretation
of pressuremeter tests, allowing the derivation of Lhe
stress-strain relaticnshp of a soil el7Cent at the
inner boundary of the expanding cavity.
The interpretation method for a pure frictional mate-
rial presented in this paper is clcsely related to
Wroth% et al. /27/ and Hughes's et al. 12/ analyses
and it is based on Rz 'e's /23/24 dila-_n:y theory.
2. BASIC ASSUMPTION
The basic assumptions, used in the here presented ap-
proach, are briefly sum=.arized in the following points
a) The particulate material surrounding the infinitely
long expanding cavity deforms in plane strain condi
ticns, i.e. the vertical strain c = 0z
1b

b) The principal stresses C I,o,0 3 are z:.ncident with
radial, vertical, hoop stresses arc:.nd the cavity,
rCza 0the same applies to the sirazns ,2, 3
and reCP 0 . In the following eith.er subscript
notations can be used.
c) Stresses and strains are posti:e 7: -ressicn.
d) All stresses and strength parameters are in ter7s
cf effective stress.
e) The strains are ccnsideret
plastic. Elastic tra:ns are not . .
f) fricticnal fzrces act at the :in-2-- points f
.r::cles (sand rin1.
g) Strazns due to particle crushing cr ziastic yield at
contact points are supposed -.-t affecting the
soil behaviour in the case of the conte-plated sani.
h) The hypothesis of small strains is adcpted.
3. CONSTITUTIVE RELATIC7.S'IP
According to Rowe's /23/24/ theory, the behaviour of a
particulate medium ray be described by the following
equation:
IdI K cv ()(a 2dc2+03dE3 P
where:1 sin
KCV cv ..Kc = cv :znstant 'lue ir...1al stresS ra-
cv *tnO ceefficient;
*cv a constant vol.ne friction angle
Taking into account for plain strain -:nitions
(dc2 . 0) the eq. 11) reduces to:
'I2

:v.4
01Ko dc3
3 p do:1 (2)
Shear (y) and volunetric (c ) strains are definedv
the following:
EC - C3 (3)
vz E c3 (4)
s this last s ,t :,f equations t- 3tr.Zs rat:c
(7 , 3) can be excressed also as foll ws
KeV
3 P vdy
The introduced relationships of the adopted constit'.ti
ve nodel are qualitatively shown in Fig. 1.
4. CAVITY EXPANSION RELATIONSHIPS
The equations of equilibrium and conpatibility of
strains all around the cavity are: (see also Fig.l
d r ) _- r
i -" r (6)dr r
de, E -E,rd =. Cr-)
dr r
where:
Srp: a principal stresses ( x and min) around the ca-
vity (corresponding to 01 and C 31
Cr#c 3 : principal strains around the cavity (corres-.'-
ding to I and c 3)
r : radial distance.
K a,

IV. 5
This last set of equations with eq. (2) described in
chapter 2 allows to obtain the solution of the expan-
ding cylindrical cavity problem (See 5th Sect.).
5. PROPOSED METHOD
Expressing the equations (6) and (7) as function ofdr
and referring ther to a generic rad.us r around the
expanding cavity, zne can write:
_ ar E r-E
dcdr L
introducing into e:. (8)
a dEr r
pgiven by eq. (2) and rearrangin; :t,cne gets
dc0 IKcv _.r)(1 +lK -)V
do r a dc0dE E C, (9)d0 r D
being :cva Rcv
p
This equation of general validity zan bc solved r a
soil element at the cavity wall -.ere the = andr
=a E are measured. To do this analitically, a re13-
tionship Cr * f(C" I is required (see Hughes et a.
/12/), nevertheless knowing p a F Wfl one can sclve
eq. (9) using numerical techniques, like finite d!ffe-
rence.
t t '
IV. 6
6. NUftERICAL ANALYSIS
With the aim to assess the E at the cavity .,allr
through a numerical procedure, the following eqiaticns
at the points (i) and (i-I) can be setup (see also
Fig. 3).
= p(i) - o (i-I)
de c(i) - c (i-i)
dE £ -) - E (i-I)r r r
d: _(1) C (1-1)
Introducing eqs. (10) and (11) into eq. (9), -sing ave
rage criteria between forward and backwards :nterpcz-
tions tecniques and making appropriate arrangements
it is obtained:
p(i) [ (i-1) K cv (i-1)1 - p(i-I)E(i)
( W a r -
r 2 [p(i) (1.Kc1 - p (i-I)]a
p~i [c i-1 -£r i-1'_ + p(i-1) 'r i- ) ]K V - (ia+ i E r -r a
2 K cv p (i-I)a
(12)
Moreover knowing that c (0)=O,ejuation(12iallows to ccomr
pute step by step the unknown values E (i) from i = 1r
to i = n.
Once r(i), c.i),p(i) and c9 (0)= p{O) are kno-n, one
can compute from eqs. (3) and (4) the deformation com-
ponents Y(i), E (i) and solving equation (2) or (5),
once more with finite difference technigue, the comple-
te stress-strain curve and stress-path --'or the soil
element at the cavity wall can be assessed.

AJNOWLEDGEMENTS
The author wishes tza .cwledqe Dr.P.3ertaCCt. a :
lotti of ENEL-CRZS -.Milan,who made ava._'Lae t'., .
SBPT's performed in the CC, used to vaiiiate th .. ,,:;. .
method exposed in the paper.
REFERENCES
1/ BAGUELIN, F., J.EL, .. .u.: ,.,..""Expansion of Cy.:ndrical Pr:Les 7 ... .
Journal of tne Soi Mechan .:s i- - n . -
kmerican Scc:ety :f Civil Eneer , V... . , -.
Proc. Paper 9377, (1972) Nrve:.er, 1p. "i -' '
12j BAGUELIN, F., jE 4UEL, J.F. and ..:E, !., ',-suremeter and foundation enSeere.r, nr.e ...and Rock Mechanics, Vol. 2, No.4, Tra:s T ;.."
(1978).
/3/ BALIGH, M.M., "Cavity Expansion in Sand wit! Curve_ _. velopes", Journ. Geot. Eng. Div. ASCE, GT. 11, (1976).
/4/ BALDI ET AL., "Laboratory ' ' iJdation uf in-Situ :"
Published by A.G.I. on the occasion of the ISSMFE .c<cd'nJubilee, (1985a).
/5/ BELLOTTI,R.,BRUZZI G. and GHICNNA V.,"Design, Cons :.c-tion and Use of a Calibration Chamber", Proc. ESOP 11,
Amsterdam, Vol. 2, (1982), pp. 439-446.
/6/ BISHOP, R.F., HILL, R.,andMCTT, N.F., "Theory of .±crt.-tion and hardness tests", Proc. Phys. Soc. 57, 247, (1945).
/7/ CARTER, J.P., BOOKER, J.RAndYEU.NG., S.K., "Cavit-' e .an-sion in cohesive frictional soils", Geotechnique 36,No.3,(1986J, pp. 349-358
- -- ,

A: I
Confereo on ' a d Four ta - -- ;.nee-
Brasi l. .oi. .(963 , -p . )-:0.S :,ADANY . . "Expan$. n ,f a - in. a -t'' : -
:.tAY., a Is,- v : :-a c: - L'"
Medium-, 7c..rnal cf -10 " o 5l Me:--.anlics anJ F.-_n:a ionDivision, Proceedings of the %k-er.can Societ, of CivilEngineers, Vol. 9O, No SM4, Prcc. Paper 3577, (1963),
July, pp. 127-161.
/16/ LADAN¥I, B., "In Sit.; :et:..-.nt'3 of Undra~ned Stress-Strain Behavior of Sensitive Cla-s with the Pressuremeter",
Canadian Gectechnical ourna.. ":l1. Q, (I-1,).
/17/ LADE,P.V.and LEE , K.L. "Engi.eer--ng Prcperties of Socis",
Report, UCLA-ENG-7652, (19761 . 1-. 45.
/16/ LAME, G., "Lecons sur la th~cr_-e .athtnatiq.e de l'elasticitd des corps solides", Bac-e.ier, Paris, France, (1852).
/19/ MENARD, L., "Mesure in situ des proprietds physiques dessols", Annales des Ponts et Chauss4es, Paris, No. 14,(1957), Mai-Juin, pp. 357-377.
/20/ M&NARD, L., "An Apparatus for Measuring the Strength ofSoils in Place", Thesis, University of Illinois, (1957).

IV. 9
121; PALIMER, A.C.."Undrained plane-strain expansion of acylindrical cavity in clayt a simple interpretation ofthe pressuremeter test', G~otechnique 22, No. 3, (19721,pp. 451-457.
/22" ROBERTSON, P.K., "In Situ Testing of Soil with emphasison its application to liquefaction assessment", PhDThesis Zemart.ment of Civil Engineering, Vancouver lCanada),(19821.
2>' RCWE, ?.W., "The stress-dilatancv relation for staticeq'.uil hr ~)f an assent!-: tf particles in contact",Proc. -:-:a! soc., %Vol. 1-69, (1962), p-. 30-527.
!4 E, ?., " tress-S::zin ?elationship for -artic, lateMaterz t equilibriuz", Froc. of tohe specialty Ccnfe-rence cn Performance of Earth and Earth-s:zpcrtedStructures. Purdue University, Lafayette (IndianaPublished by ASCE, (1972).
/25' SALEN-Z, J., "Expansion quasi-statique d'une cavit4 &symdtrie sph~rique ou cylindrique dans un milieu 61astoplastique", Annales des Ponts et Chauss4es, Paris, Vol.Il, (1966), pp. 175-187.
/26/ VESIC, A.S., "Expansion of cavities in infinite soilmass.', J. Soil Mech. Fdns Div. Am.Soc. Civ. Engrs 98,SM3, (1972), pp. 265-290.
/27/ WROTH, C.P. and WINDLE, D., "Analysis of the pressurene-ter test allowing for volume change", Technical Note,Geotechnique 25, 1975), pp. 598-610.
Ii

UJNCLASSIFIED a HL

• ... ':4:,' , . .. :: .,_ . -. .... . -.- -..... ... ... . -..... ..
'.17
I __t
r"1
IV. 20
TAB. I - TESTED SAND SHEAR STRENGTH
TICINO SAND
TX R2D R 00 OL R
(M) (0) (0) ()
45 38.2 4.2 0.67
65 40.2 6.5 0.7885 42.9 8.1 0.89
TX00oparameters describing the curved
a Istrength envelopes (Baligh/3/) (*)
R2= correlation coefficient
DR= average relative density of the testedspecimens, at the end of consolidation
TX Iff 1- TX ff )t p g = [tg.X ° tg ( ( - :C7 -1
p a f0 2.3 -10 o
where:TX
0 T secant peak friction angle from laboratory triaxialcompression test
Tff= shear stress on the failure surface at failure
= effective normal stress on the failure surface atfailure
0 reference stress, assumed equal to 1 Kg/dm2
-98.2 KPaf0 secant friction angle from laboratory triaxial
compression test at ff = 2.72 0
a angle which describes the curvatuzre cf the failureenvelope.

'V '7
TAB. 2 i Experimental readings frcn Test N. 228
Rd -p p d -C p R -C p
N. J .MPa] N. L% 'MPa2 N. [% mi
I 222Mae .2089 40 .34645 .4124 72 2.11714 .B2432 .20350 .2131 41 .36219 .4164 -- 2.2483G .84623 .20700 .2181 42 .37794 .4202 ?: 2.38134 .96724 .21225 .2232 43 .39194 .4266 2.51781 .29915 .2.575 .2292 44 .4254 .4312 3 2.65953 .3116 .22100 .2343 45 .42!:a .4342 34 2.80826 .23377 .22625 .2383 46 .43333 .4395 22 2.88174 .94469 .22374 .2444 47 .45143 .4462 22 3.83221 .26749 .23849 .2524 49 .46893 .4506 97 3.19143 .290110 .24199 .2555 49 .4E117 .4543 -= 3.35055 .1129II .04724 .2606 50 .54231 .4709 99 3 .5336 .031912 .25424 .2656 51 .53921 .4755 22 3,67959 1.055813 .O6124 .2716 52 .57216 .4901 ell 3.84923 1.077714 .26649 .2757 53 .58366 .4847 32 4.02950 1.299615 .07174 .2807 54 .62130 .4893 33 4.21146 1.121616 .28049 .2977 55 .62115 .494a 94 4.39517 1.144417 .23099 .2927 56 .63690 .4994 95 4.58588 1.1664le .09798 .2969 57 .65440 .5050 BE 4.78184 1.1898319 .12673 .3019 59 .67199 .5096 97 4.98129 1.2t1!20 .11549 .3079 59 .68939 .5133 99 5.16425 1.233321 .12599 .3139 6 .71039 .5206 53 5.39595 1.255822 .13473 .3179 61 .72613 .5234 Lbe 5.61299 1.279523 .14349 .3229 62 .7G463 .5335 le 5.93684 1.303224 .15399 .328 63 .90312 .5437 :Z2 6.05904 1.324125 .16622 .3351 64 .94511 .5556 103 6.29.923 1.346826 .17672 .3390 65 .95984 .5804 14 6.52617 1.368627 .19722 .3451 66 1.8864 .5905 ia5 6.76586 1.392326 .19597 .3491 67 1.04109 .6006 i ZS 7.01430 1.414e29 .20997 .3562 6 1.8132 .6109 107 7.27499 1.437730 .22047 .3602 69 1.12507 .6209 :29 7.53216 1.459431 .23096 .3652 70 1.16991 .6310 2-2 7.60334 1.402132 .24321 .3713 71 *.21255 .6411 1:2 9.0786 2 1.505633 .25546 .3763 72 1.25804 .6502 :I: 8.36144 1.528234 .26596 .3003 73 1.43301 .6999 112 8.65196 1.549935 .27996 .3984 74 1.53099 .7127 :13 9.5213 1.5715
7 36 .29395 .3924 75 1.63773 .7337 :- 9.26594 1.595e37 .32795 .3994 76 1.74971 .75S6 115 9.58795 1.615639 .32020 .4034 77 1.26593 .7795 11 9.91325 1.639139 .33420 .4084 78 1.67s6 .S8I5 !17 io.
25265 1.6605
R d : number of the experimental read4n;
: hcc, strain at the cavity wall
p : radial stress at the cavity i
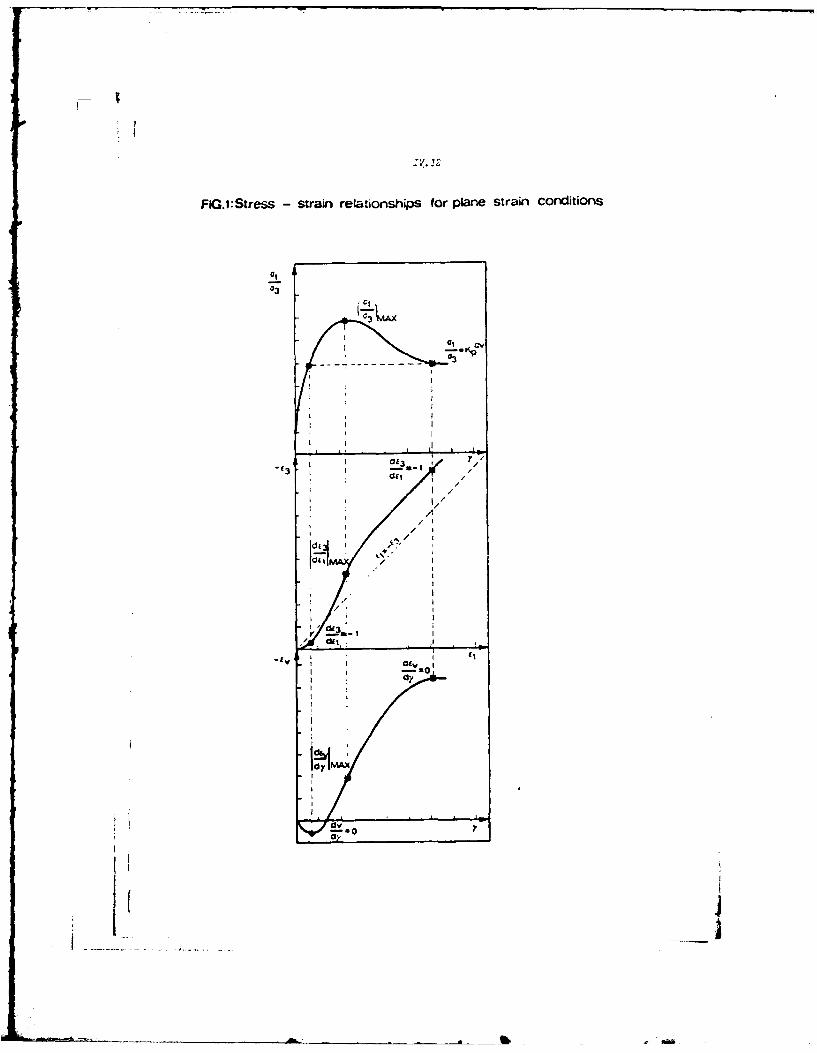
FIQ.1:StreSS- strain relationships for plane strain conditions
3
I I
C 3/A
I 01-/~f03
ldall
IdId
-O

IV. 2.3
FIG.2 Stresses and strains around the expandir cavity
010c
dOO
/ /
-, R>R0 -I' I
' i
r e- dr
Er (radial strain) .-dlor
ComnpatibilIty equation8
Co (,ioop strain)-- /r
At the cavity wall E (-Cavity srain).- I/Ro
Equilibrium equation ._r 00 'Ordr r
V

FIG. 3: Use of pressuremeter curve for numerical anialysis
p~)pn
I *t=IA/Ro
(Wrr
I IL

:V. .
FIG. 4: Characteristics of the tested sand
SAND 1.2 -TICINO
DOMINANT QUARTZ(30,)MINERAL _____
ANGULARITY(LEE'S CHART 8-
MICA -5%
?Max (t/rn3) 1] 1.705__________21 1.700
3)111.398?mn (~m3 )211.391
GRAVEL SAND_F I C I M I F
60 20 06 02 006104size (mm) I1.0 011
90;
80;'C
U60-4-
COS40:'
20.,
4 10 20 40 80 200
ASTM sieves n*

FIG 5: Stress / strain relationships using the experimental
readings from test Nz 228 (DR= 7 7 .0 %)
-6.4 *v(%) - t (MPa)
-i.4 .1**** w
I.* .3
-. I 2 ,*. 1. {,
.4 6.6 1 I 1 i l l
a)VoIumetnrC strain vS shear Strairl b)Shear stresS vs shear strain
i s 1.4 -
aa orlo CMPa) t t CMPa)
rI i.I
4 **. *%* .,'ll
; :* l
. * I .
;j('- I SLZ s,. s (MPa)
, s . . . . . Il ie 14 sh a I IS & x I .4 .6 . .1 l.i
C) StreSS ratio vs shear Straw d) Srnoar stre=s vs nlean nornnw3 ste~ss

IV. 27
FIG. 6: Curve fitting results with 7th polynomial degree inoriginal p vs E plot
1.8
p (MPa)
.3
.2
.7
o.a
8 2 6 Z~ 12
a) Test N. 222
2.0
p CMPa)1.6
1.6
1.4
1.2
I.!
1.13
.4
.2
2 4 6 8 I?
b) Test N.228
I I.'

FIG.1 Stress ratio - strain Curve for 5 th, 7th and 9 thdegree polynomials (Test K0 228)
6
4
3
2 5th Deg.
- 7th Del.
.. .. Sth Deg.
a 2 4 S U is 12 14 16 18 23

FIG.68 Stress Istrain relationships from test N. 222 (D:46.2 V)
-i.0t (MPa)
.5
I .6
4 6 a a4 at 14 1 s t 4 Si .I
a)Oluesric tra vs shear strain d) Shear stress vs smearyv srit s
6.3 .

FIG.9 :Stress / strain relationships from test N. 228 (DR= 77.0/0.)
.6
-2.4x
tS (M~a)
..
.2
a t 4 i * ii1 i II l B I S IS
a)Volunmetri strain vS shear strain b)Shear stress vs She.ar straw-
I1.1 1.4
8I.3 Gr/O 0 (Ma) t (MPa)85.5 Il.a
'.5t.i
ar .1
4..4
a.'
L.• 1S1(M :a)
a a . a IS l t lqI. I I IS is m .af .4 .& .I I.0 1.i 1.4
c) Stress ratio vs shear strain d)lShe ar stress vs m~ea. normal stress

DATE
FILMED


