DMC-ODS Treatment Perception Survey
13
April 2020 DMC-ODS Treatment Perception Survey Fall 2019 Shereen Khatapoush, Ph.D. Samira Amirazizi, B.A.
Transcript of DMC-ODS Treatment Perception Survey

A p r i l 2 0 2 0
DMC-ODS Treatment
Perception Survey
Fall 2019
Shereen Khatapoush, Ph.D.
Samira Amirazizi, B.A.

1
DMC-ODS Treatment Perception Survey
April 6, 2020
OVERVIEW The California Drug Medi-Cal Organized Delivery System (DMC-ODS) waiver is a 5-year demonstration project.
The DMC-ODS expands services available to Drug Medi-Cal beneficiaries, enhances care coordination, and
supports the development of an organized system of care for substance use disorders in participating California
counties. Santa Barbara County DMC-ODS began December 1, 2018.
As part of the DMC-ODS evaluation, counties are required to administer the client Treatment Perception Survey
(TPS) on an annual basis. The administration of the TPS fulfills the county’s External Quality Review Organization
(EQRO) requirement related to having a valid client survey. Because the TPS collects standardized data, it can be
utilized both locally for quality improvement and for statewide comparison and evaluation.
METHODS & LIMITATIONS Participants
The TPS is intended for youth (12-17 years old) and adult (18 years old and older) clients participating in
substance use disorder (SUD) treatment. Clients who are physically present and receive face-to-face SUD
services are given the opportunity to complete the brief survey during an annual five-day survey period. The
target population includes clients receiving services in:
• Outpatient
• Residential
• Opioid/narcotic treatment
• Detoxification/withdrawal management
• Partial hospitalization programs, and
• also includes clients who are receiving face-to-face services outside the office (e.g. field-based settings)
The TPS is not intended for:
• Clients who do not receive face-to-face services during the survey period
• Clients in immediate crisis (e.g.: emergency incidences)
Materials/Measures
The TPS includes two different survey instruments:
1. Adult: clients 18 and older
2. Youth: clients aged 12-17
The TPS Adult survey includes 14 questions and the Youth includes 8 questions, plus demographic questions. The
survey is a paper-based form (Teleform) and is available in 13 languages: English, Chinese, Hmong, Spanish,
Russian, Tagalog, Vietnamese, Arabic, Korean, Armenian (Eastern and Western), Cambodian and Farsi.
Procedure
Santa Barbara County Quality Care Management (QCM) staff prepare the surveys for printing, print the surveys
and deliver them to SUD treatment providers throughout the County the week prior to survey administration.
Detailed instructions are provided (see appendix) to support standardized survey data collection. The TPS was
administered October 7-11, 2019. QCM staff compiled the completed surveys and sent them to the DMC-ODS
evaluation team at UCLA1. A total of 553 adult surveys were collected; 538 (97%) were usable (at least one of
1 Thank you to Cheryl Teruya and team at UCLA for swift data analysis.
2
DMC-ODS Treatment Perception Survey
April 6, 2020
the 14 questions was answered). A total of 11 youth surveys were collected; all (100%) were usable. UCLA
researchers scanned in the survey, analyzed the data and prepared county and program level summary reports.
Limitations
The PS is meant to be a census sample; that is, ideally, all clients receiving services during the survey
administration week would participate. However, while conducting the survey is mandatory for the county,
individual participation is entirely voluntary/optional. The relatively low response rate (37%) and the small
number of youth respondents (N=11) is a limitation to the generalizability of TPS results.
Domains, Scoring & Results
The adult and youth surveys are not identical; there are differences in survey questions and domains (see survey
questions in the appendix). The data are organized into five (5) domains for adults and six (6) domains for youth:
1. Access
2. Quality
3. Care Coordination
4. Outcome
5. General Satisfaction
6. Therapeutic Alliance2
Results are reported here by domain; adult and youth data are examined, and data from Santa Barbara County
are compared to (average) California state data.
Most questions on the TPS instruments have the same response scale:
N/A
Strongly
Disagree Disagree Neutral Agree
Strongly
Agree
0 1 2 3 4 5
Thus, the higher a number (e.g., average), the more positive the response.
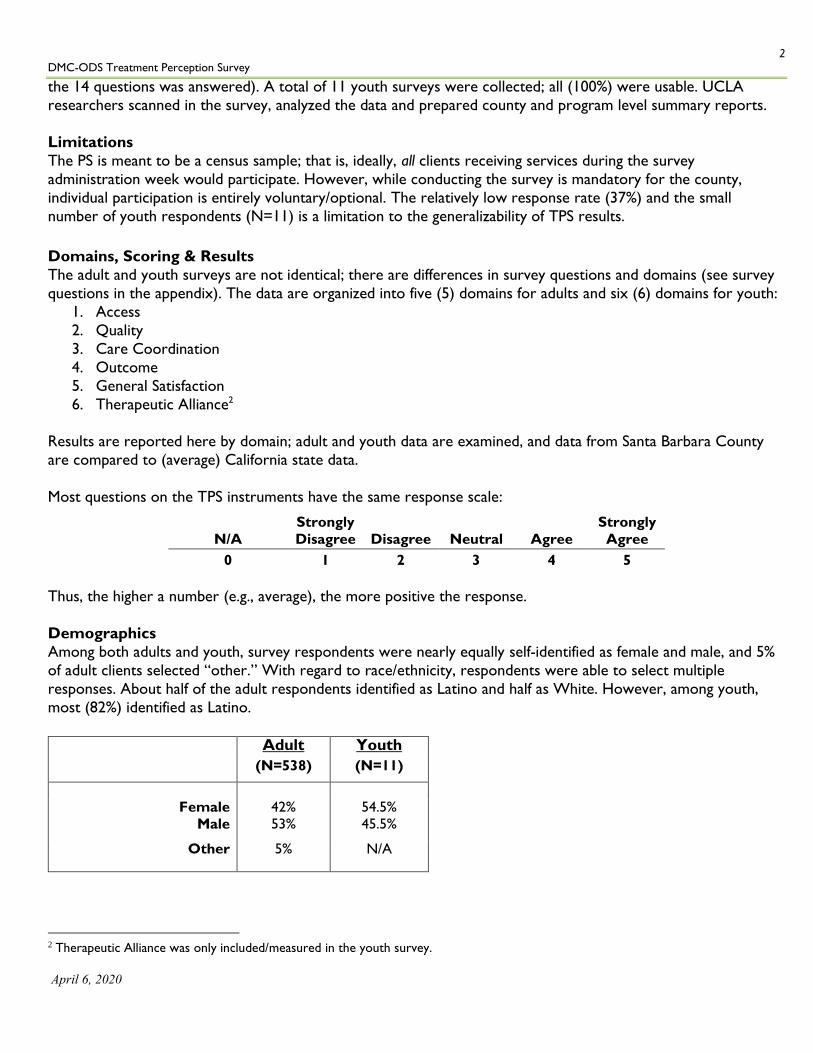
Demographics
Among both adults and youth, survey respondents were nearly equally self-identified as female and male, and 5%
of adult clients selected “other.” With regard to race/ethnicity, respondents were able to select multiple
responses. About half of the adult respondents identified as Latino and half as White. However, among youth,
most (82%) identified as Latino.
Adult Youth
(N=538) (N=11)
Female
Male
42%
53%
54.5%
45.5%
Other 5% N/A
2 Therapeutic Alliance was only included/measured in the youth survey.

3
DMC-ODS Treatment Perception Survey
April 6, 2020
Adult Youth
(N=538) (N=11)
Latino 45% 81.8%
White 43% 27.3%
Services 2+ weeks
Services 1-5 months
86%
N/A
N/A
55%
Appendix C provides response rates by provider. There were 1,574 clients open when the survey was
administered. Of these open cases, 576 people responded to the survey (36.6% response rate).
The pie charts below indicate the percentage of respondents by age. Over half (57%) of adult respondents were
26-45 years; youth respondents age was more evenly distributed.
RESULTS The scores reported here are the average (mean) of all respondents’ replies within each domain. For example, a
score of 4.5 indicates that the average response to that domain was squarely between agree (4) and strongly
agree (5). Most TPS questions are drawn from and are therefore identical to the Mental Health Consumer
Perception Survey (CPS). Analysis of CPS data are coded such that 3.5 or higher is considered “high/positive.”
For consistency, the TPS data have been coded and analyzed as such.
0-1 Low
1-3.5 Medium
3.5-5 High/Positive
N/A
Strongly
Disagree Disagree Neutral Agree
Strongly
Agree
0 1 2 3 4 5
Adult and youth clients were asked different
questions about how long they had been
receiving services. The majority of adult
respondents (86%) had been receiving services
for more than 2 weeks. Youth were asked a
different question; about half had been receiving
services for 1-5 months.
Note the much smaller sample size of youth
(N=11) compared to adults (N=538).
12%
35%
22%
16%
10% 5%
Age: Adults(N=538)
18-25 years old
26-35 years old
36-45 years old
46-55 years old
55 + years old
Missing
37%
36%
27%
Age: Youth(N=11)
12-14 years old
15-16 years old
17+ years old

4
DMC-ODS Treatment Perception Survey
April 6, 2020
As indicated in the table below, the average domain scores among youth and adults were relatively high
(positive). The highest domain scores for adults were in general satisfaction and quality of care. The highest
domain scores for youth were in general satisfaction and therapeutic alliance. The average of all domain
scores was slightly higher for adults (4.4) than youth (4.1). Overall, the average of all domain scores was 4.3.
Average Domain Scores Adult
(N=538) Youth (N=11)
Average
Adult &
Youth
Perception of Access 4.3 4.0 4.2
Perception of Quality 4.5 3.9 4.2
Perception of Care Coordination 4.3 4.0 4.2
Perception of Outcome 4.4 4.1 4.3
Perception of General Satisfaction 4.5 4.2 4.4
Perception of Therapeutic Alliance* N/A 4.2 4.2
AVG 4.4 4.1 4.3
Average domain score data is displayed in the chart below (4 = agree, 5 = strongly agree).
California Comparison: Average Domain Scores
For adult respondents, the average domain scores for Santa Barbara County clients and clients across California
were, interestingly, exactly the same. There were no differences in average scores in any domains.
Access Quality Care
Coordination
Outcome General
Satisfaction
Therapeutic
Alliance
4.34.5
4.3 4.4 4.5
n/a
4.1 4.1 4.2 4.1 4.2 4.3
SUD Treatment Perception Survey
Average Domain Scores Adult Youth

5
DMC-ODS Treatment Perception Survey
April 6, 2020
Average Domain Scores, Adult Santa Barbara
County CA
Percent Difference
SB:CA
Perception of Access 4.3 4.3 0.0%
Perception of Quality 4.5 4.5 0.0%
Perception of Care Coordination 4.3 4.3 0.0%
Perception of Outcome 4.4 4.4 0.0%
Perception of General Satisfaction 4.5 4.5 0.0%
AVG 4.4 4.4 0.00%
Among youth respondents, the average domain scores for Santa Barbara County clients and clients across
California were similar. Santa Barbara County average scores for the domains of Perception of Outcome and
General Satisfaction were equal to average scores across California. In the remaining four (4) domains, Santa Barbara County average scores were nearly the same as (slightly lower than) average scores across California.
Average Domain Scores, Youth Santa Barbara
County CA
Percent Difference
SB:CA
Perception of Access 4.0 4.1 -2.5%
Perception of Quality 3.9 4.1 -5.1%
Perception of Care Coordination 4.0 4.2 -5.0%
Perception of Outcome 4.1 4.1 0.0%
Perception of General Satisfaction 4.2 4.2 0.0%
Perception of Therapeutic Alliance 4.2 4.3 -2.4
AVG 4.1 4.2 -2.5%
The TPS data were examined by the percentage of responses that were high (positive) - equal to or greater than
3.5. Among adults, 88.6% of responses were positive. The most positively ranked domains were general
satisfaction, quality, and outcomes. Among youth, the percentage of positive responses was also high (on
average 74%) though lower than adults. The most positively ranked domains were outcomes, general
satisfaction and therapeutic alliance.
Percent of High (Positive) Responses Adult Youth
Perception of Access 85.8% 71.6%
Perception of Quality 91.7% 72.1%
Perception of Care Coordination 85.0% 66.4%
Perception of Outcome 89.1% 81.8%
Perception of General Satisfaction 91.3% 77.4%
Perception of Therapeutic Alliance N/A 75.8%
AVG 88.6 74.2

6
DMC-ODS Treatment Perception Survey
April 6, 2020
ANALYSES OF COMMENTS Comments were solicited from respondents on all survey instruments. Comments written in Spanish were
translated to English. All comments were transcribed exactly as written. Content analysis was conducted and
comments were scored as positive, neutral, or negative, and the results were furthered categorized by thematic
content.
Adult surveys included the following statement:
“Comments: Please don’t write any information that may identify you, included but not limited to your name and/or
phone number.”
Youth surveys included the following statement:
“Let us know your comments. What was most helpful about this program? What would you change about this
program? Please don’t write any information that may identify you, included but not limited to your name and/or
phone number.”
Adult Comments:
There were a total of 194 comments out of 559 respondents (34.7% commented, 65.3% were blank/missing/no
comment). Of those that commented, 66% were positive, 19% were negative and 15% were neutral.
Access
Quality
Care Coordination
Outcome
General Satisfaction
Therapeutic Alliance
85.8
91.7
85.0
89.1
91.3
n/a
71.6
72.1
66.4
81.8
77.35
75.8
Percent of High (Positive) Responses(≥3.5)
Youth Adult
7
DMC-ODS Treatment Perception Survey
April 6, 2020
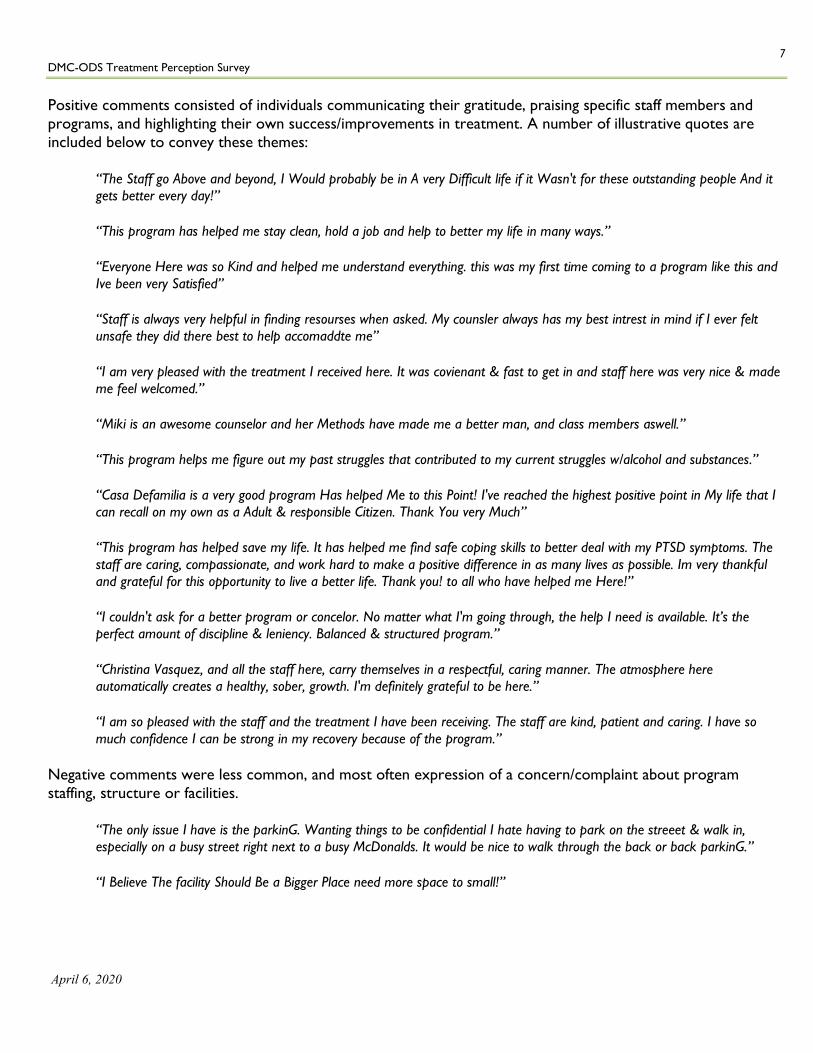
Positive comments consisted of individuals communicating their gratitude, praising specific staff members and
programs, and highlighting their own success/improvements in treatment. A number of illustrative quotes are
included below to convey these themes:
“The Staff go Above and beyond, I Would probably be in A very Difficult life if it Wasn't for these outstanding people And it
gets better every day!”
“This program has helped me stay clean, hold a job and help to better my life in many ways.”
“Everyone Here was so Kind and helped me understand everything. this was my first time coming to a program like this and
Ive been very Satisfied”
“Staff is always very helpful in finding resourses when asked. My counsler always has my best intrest in mind if I ever felt
unsafe they did there best to help accomaddte me”
“I am very pleased with the treatment I received here. It was covienant & fast to get in and staff here was very nice & made
me feel welcomed.”
“Miki is an awesome counselor and her Methods have made me a better man, and class members aswell.”
“This program helps me figure out my past struggles that contributed to my current struggles w/alcohol and substances.”
“Casa Defamilia is a very good program Has helped Me to this Point! I've reached the highest positive point in My life that I
can recall on my own as a Adult & responsible Citizen. Thank You very Much”
“This program has helped save my life. It has helped me find safe coping skills to better deal with my PTSD symptoms. The
staff are caring, compassionate, and work hard to make a positive difference in as many lives as possible. Im very thankful
and grateful for this opportunity to live a better life. Thank you! to all who have helped me Here!”
“I couldn't ask for a better program or concelor. No matter what I'm going through, the help I need is available. It’s the
perfect amount of discipline & leniency. Balanced & structured program.”
“Christina Vasquez, and all the staff here, carry themselves in a respectful, caring manner. The atmosphere here
automatically creates a healthy, sober, growth. I'm definitely grateful to be here.”
“I am so pleased with the staff and the treatment I have been receiving. The staff are kind, patient and caring. I have so
much confidence I can be strong in my recovery because of the program.”
Negative comments were less common, and most often expression of a concern/complaint about program
staffing, structure or facilities.
“The only issue I have is the parkinG. Wanting things to be confidential I hate having to park on the streeet & walk in,
especially on a busy street right next to a busy McDonalds. It would be nice to walk through the back or back parkinG.”
“I Believe The facility Should Be a Bigger Place need more space to small!”

8
DMC-ODS Treatment Perception Survey
April 6, 2020
I feel that the agency needs to expand - larger facility. There is a lot of patients and it seems like the clinic is getting very busy
and more patients and there are times when it is a long wait to be dosed. Being a worker it gets hard to get dosed and be in
time for work.
“I feeL that our Facility is under staffed & need more employees.”
“Honestly believe groups are too long. I get more out of a 20-30 minute group. Anything longer and I loss focuse, attention
and become irritated with the entire thing. 20 minutes I engage, participate openly and honestly and feel a lot better. Feel
after 30 days blackout/clean should have more say on meetings I attend. You say it's my recovery but with no choices I don't
feel like it s. when I leave it's on me and I think you should focus more on that to help the transitien process.
Groups/meetings everyday makes me want to say screw it and use.”
“I had to go to 2 groups A day And because of that had to give up my full time Job which kept me out of trouble and gave
me tons of free time which is very bad For me. Staff was un willing to work with me on allowing met o go to work”
“Need classes later than 4:30 during the week for people who work until 5, and more classes on the weekend.”
Neutral comments were neither positive nor negative. Neutral comments included responses such as “no
comment” and also comments that were not relevant. For example, many people wrote their name and phone
number (though instructed not to do so). Responses that were mixed (both positive and negative comments) as
well as suggestions, were also coded as neutral.
“No COMMENTS AT THIS TIME”
“This place personally has helped me a lot. I felt that I gotten the help Ive needed and information I den't have any proble
w/my sessions but I to with the stability of not having not enough employee or changing directors and the change of rules and
cordination this place in life changing but need more stability, and Not so many changes w/ every New drector it stresses our
counselor and us.
”I do love this program. However, due to the overload on Staff, it is near Impossible to get or receive the one-on-one service
of my counselor… I have no idea (still) what my treatment plan is - or if my counselor is aware of my goals here.”
“I believe a number system would be easer for everyone. We all take a number and it shows on a screen when your turn is.
Just an idea.”
“I believe that if the 12 steps of recovery were introduced and broken down for clients for part of the curriculam, that the
recovery rates would excel tremendously.”
“Project Premie is a great program. Staff does what they can with what they are given to work with. They are understaffed.
We need counseloRs.”
Youth Comments
There were a total of 4 comments out of 11 respondents (36.5% commented, 63.5% were blank/missing/no
comment). Of those that commented, 50% were positive and 50% were neutral.
Positive comments included:

9
DMC-ODS Treatment Perception Survey
April 6, 2020
“It feels welcoming.”
“The thing most helpful in this Program is that they take time to talk to you and help you with your issue. Nothing really to
change it's good how it is.”
Neutral comments were neither positive nor negative.
“IDK”
“I know I can stop when I want to.”
There were no negative comments.
SUMMARY The TPS is organized into 5 domains for adults and 6 domains for youth. These domains include Access, Quality,
Care Coordination, Outcome, General Satisfaction, and for youth respondents, Therapeutic Alliance. Both adult
and youth respondents scored highly (positively) on all domains, with an average score of 4.4 on a five-point scale
for adult respondents and an average score of 4.1 on a five-point scale for youth respondents. Average domain
scores for adult respondents in Santa Barbara were the same as the average for all adults in California. Youth
respondents had similar scores to youth clients across California – two domains were exactly the same and the
remaining four were nearly the same (slightly lower). Among adults 88.6% of responses were high/positive.
Among youth, the percentage of positive responses was also high (on average 74%) though lower than adults.
Finally, client comments were transcribed, coded and analyzed. The vast majority of client comments were
favorable and provided an important vehicle for client feedback.
Looking forward: These results will be shared broadly throughout our system of care. Behavioral Wellness
will work with our providers to increase response rates, which will increase the generalizability of findings.

10
DMC-ODS Treatment Perception Survey
April 6, 2020
APPENDIX A Treatment Perception Survey Adult and Youth – Domain Composition
Domain Survey Items Adult Survey Items Youth
Access 1. Convenient Location
2. Convenient Time
1. Convenient Location
2. Convenient Time
3. Good Enrollment Experience
Quality 3. I Chose My Treatment Goals
4. Staff Gave Me Enough Time
5. Treated with Respect
6. Understood Communication
7. Cultural Sensitivity
5. I received the right services
6. Treated with Respect
9. Cultural Sensitivity
15. Provided Family Services
Care Coordination
8. Work with Physical Health Providers
9. Work with Mental Health Providers
13. Health/Emotional Health Needs Being Met
14. Helped with Other Issues/Concerns
Outcome 10. Better Able to Do Things 16. Better Able to Do Things
General Satisfaction
11. Felt Welcomed
12. Overall Satisfied with Services
13. Got the Help I Needed
14. Recommend Agency
17. Overall Satisfied with Services
18. Recommend Services
Therapeutic Alliance
N/A: Adult respondents did not get these items. 4. Worked with Counselor on Goals
7. Counselor Listened
8. Positive/Trusting Relationship with Counselor
10. Counselor Interested in Me
11. Liked Counselor
12. Counselor Capable of Helping

11
DMC-ODS Treatment Perception Survey
April 6, 2020
Appendix B: Survey Questions and Average Scores
Adult TPS Questions and Average Scores 1. The location was convenient (public transportation, distance,
parking, etc.).
4.1
2. Services were available when I needed them. 4.4
3. I chose the treatment goals with my provider’s help. 4.3
4. Staff gave me enough time in my treatment sessions. 4.5
5. Staff treated me with respect. 4.5
6. Staff spoke to me in a way I understood. 4.5
7. Staff were sensitive to my cultural background (race/ethnicity,
religion, language, etc.).
4.4
8. Staff here work with my physical health care providers to
support my wellness.
4.3
9. Staff here work with my mental health care providers to
support my wellness.
4.3
10. As a direct result of the services I am receiving, I am better
able to do things that I want to do.
4.4
11. I felt welcomed here. 4.5
12. Overall, I am satisfied with the services I received. 4.5
13. I was able to get all the help/services that I needed. 4.4
14. I would recommend this agency to a friend or family member. 4.5
Youth TPS Questions and Average Scores 1. The location of services was convenient for me. 3.8
2. Services were available at times that were convenient for me. 4.3
3. I had a good experience enrolling in treatment. 4.1
4. My counselor and I worked on treatment goals together. 4.2
5. I received services that were right for me. 4.0
6. Staff treated me with respect. 4.2
7. I feel my counselor took the time to listen to what I had to
say.
4.4
8. I developed a positive, trusting relationship with my counselor. 4.1
9. Staff were sensitive to my cultural background (race/ethnicity,
religion, language, etc.).
3.7
10. I feel my counselor was sincerely interested in me and
understood me.
4.1
11. I liked my counselor here. 4.0
12. My counselor is capable of helping me. 4.2

12
DMC-ODS Treatment Perception Survey
April 6, 2020
13. Staff here make sure that my health and emotional health
needs are being met (physical exams, depressed mood, etc).
4.1
14. Staff here helped me with other issues and concerns I had
related to legal/probation, family and educational systems.
3.8
15. My counselor provided necessary services for my family. 4.0
16. As a result of the services I received, I am better able to do
things I want to do.
4.1
17. Overall, I am satisfied with the services I received. 4.3
18. I would recommend the services to a friend who is need of
similar help.
4.1
Appendix C: Response Rate, by Provider October 2019
Provider Program # of Open
Clients
# of
Surveys
Returned
Response
rate
Salvation Army Salvation Army 19 18 94.7%
Good Samaritan Shelter Project P.R.E.M.I.E 18 16 88.9%
Good Samaritan Shelter Lompoc Recovery Center 38 32 84.2%
Good Samaritan Shelter Recovery Point Acute Care 12 10 83.3%
Good Samaritan Shelter Transitional Center for Women and
Children 19 15 78.9%
Good Samaritan Shelter Turning Point 16 12 75.0%
LAGS Spine and Sports care Medical
Centers, Inc. LAGS Medical Centers 47 31 66.0%
Good Samaritan Shelter Recovery Way Home 15 9 60.0%
Good Samaritan Shelter Recovery Point 56 32 57.1%
Good Samaritan Shelter Another Road Detox 7 4 57.1%
Council on Alcoholism and Drug
Abuse Project Recovery 118 63 53.4%
Good Samaritan Shelter Casa De Familia Treatment Center 25 12 48.0%
Council on Alcoholism and Drug
Abuse
Daniel Bryant Adolescent Treatment Center
Santa Maria 13 6 46.2%
Sanctuary Centers of Santa Barbara,
Inc. Arlington Day Treatment Center 75 31 41.3%
Coast Valley Worship Center Coast Valley Substance Abuse Treatment
Center 120 49 40.8%
Coast Valley Worship Center Coast Valley Substance Abuse Treatment
Center 105 41 39.0%
Aegis Treatment Centers, LLC Aegis Treatment Centers, Santa Maria 450 122 27.1%
Council on Alcoholism and Drug
Abuse CADA ARTS 12 3 25.0%
Aegis Treatment Centers, LLC Aegis Treatment Centers, Santa Barbara 350 68 19.4%
Council on Alcoholism and Drug
Abuse
Daniel Bryant Adolescent Treatment Center
Santa Barbara 30 2 6.7%
Family Service Agency of Santa Barbara
County Santa Maria Valley Youth and Family Center 29 0 0.0%