Division of Nutritional Sciences What is Vitamin D?
15
1 home.caregroup.org Vitamin D Saurabh Mehta, M.B.B.S., Sc.D. Assistant Professor of Global Health and Nutrition Division of Nutritional Sciences Cornell University September 15, 2011 What is Vitamin D? Rickets Vitamin D and Disease Bennett JH. Sutherland and Knox, Edinburgh. 1853 Nobel Prize 1903 1903 Sun Beds and Sanatoria
Transcript of Division of Nutritional Sciences What is Vitamin D?

1
hom
e.ca
regr
oup.
org
Vitamin D Saurabh Mehta, M.B.B.S., Sc.D.
Assistant Professor of Global Health and NutritionDivision of Nutritional SciencesCornell University
September 15, 2011 What is Vitamin D?
Rickets Vitamin D and Disease Bennett JH. Sutherland and Knox, Edinburgh. 1853
Nobel Prize 19031903
Sun Beds and Sanatoria

2
History of Vitamin DHistory of Vitamin D Vitamin D Sources andSources and Synthesis
Metabolism• Systemic transport of calcitriol to distal target
organs
• Binding of 1,25(OH)2D3 to nuclear receptor or membrane receptor at target organs
• Biological responses in intestines, parathyroid glands, bone, kidney
• Excess 25(OH)D3 is metabolized to inactive metabolites (P-450)
• Excreted into the bile
Assessment: Vitamin D Status• Serum calcidiol concentration (25(OH)D)
Reflects vitamin D from solar synthesis, diet, supplementsOptimal level: 35–55 ng/mLDeficiency: 10-15 ng/mL y g
Fairly long circulating half-life (15 days) However, does not indicate vitamin D stored in body tissues
• Circulating 1,25(OH)2D is less optimalShort half-life (15 hours)Tight regulation by parathyroid hormone, calcium, phosphate
Vitamin D Cutoff
0 20 40 60
Optimal Calcium Homeostasis
Maximize extrarenal 1alpha(OH)2ase
Overt deficiency
Giovannucci E. 2005
Units - ng/mL Why Vitamin D?
ww
w.v
itam
inds
ocie
ty.o
rg

3
hom
e.ca
regr
oup.
org
Vitamin D and Bone Health
© F
. Net
ter
Fracture Risk Meta-Analysis (age >= 65 years)
Vitamin D in doses > 400 IU/day RR for hip fracture: 0 82 (0 65 0 97) [5 RCTs; n=31872]RR for hip fracture: 0.82 (0.65, 0.97) [5 RCTs; n=31872]
RR for nonvertebral fracture: 0.80 (0.72, 0.89) [9 RCTs; n=33265]
Nonvertebral fracture prevention started with achieved 25(OH)D levels of at least 75 nmol/L
No effect of vitamin D at a dose of 400 IU or less
Bischoff-Ferrari HA et al. Arch Intern Med 2009;169:551-61 Bischoff-Ferrari HA et al. JAMA 2005;293:2257-64
Fall Prevention Meta-Analysis (age >= 65 years)
Vitamin D in doses of 700-1000 IU/day RR for falls: 0 81 (0 71 0 92) [7 RCTs; n=1921]RR for falls: 0.81 (0.71, 0.92) [7 RCTs; n=1921]
No effect of vitamin D in doses less than 700 IU/day
Optimal fall prevention with achieved mean 25(OH)D levels of 75-100 nmol/L
Better lower extremity function (8-foot walk, repeated sit-to-stand) with higher 25(OH)D levels
Bischoff-Ferrari HA et al. BMJ 2009;339:b3692 Bischoff-Ferrari HA et al. Am J Clin Nutr 2004;80:752-58
Bischoff-Ferrari HA et al. Osteoporos Int 2010;21:1121-32
hom
e.ca
regr
oup.
org
Vitamin D and Metabolic Diseases
NHANES Third NHANES between 1988-1994 Comparing those in the lowest quartile of serum 25(OH)D levels with those in the highest quartile:levels with those in the highest quartile:
Prevalence of Hypertension, OR: 1.30
Diabetes Mellitus, OR: 1.98
Obesity, OR: 2.29
High serum triglycerides, OR: 1.47
Martins D et al. Arch Intern Med 2007;167:1159-65

4
Mechanisms Improves insulin secretion and sensitivity Inhibits vascular smooth-muscle cell proliferation M d l t i fl tiModulates inflammation Downregulates the renin-angiotensin system If vitamin D levels are low and PTH levels are high, calcium is resorbed from bones - may end up in arterial walls
Wang L et al. Ann Intern Med 2010;152:315-23 Li YC et al. J Steroid Biochem Mol Biol 2004;89-90; 387-92
Hypertension Results from the Nurses’ Health Study and the Health Professionals Follow-up Study
RR of Incident Hypertension (4-8 years of follow-up) in thoseRR of Incident Hypertension (4 8 years of follow up) in those with <15 ng/mL, compared to those with >=30 ng/mL: 3.18 (1.39, 7.29)
Men: 6.13 (1.00, 37.80)
Women: 2.67 (1.05, 6.79)
Meta-Analyses of 10 trials Vitamin D supplementation nonsignificantly reduced SBP but had no effect on DBP
Forman JP et al. Hypertension 2007;49:1063-69 Pittas AG et al. Ann Intern Med 2010;152:307-14
Diabetes Equivocal evidence Observational studies:
Lower incident diabetes risk in the highest vs the lowestLower incident diabetes risk in the highest vs. the lowest vitamin D status group
Framingham Heart Study: Vitamin D levels inversely correlated with serum insulin levels
Trials: No effect of vitamin D supplementation on glycemia or incident diabetes
Pittas AG et al. Ann Intern Med 2010;152:307-14 Cheng S et al. Diabetes 2010;59:242-48
Cardiovascular Disease MI, CVD-related death, Stroke Observational:
Higher risk in lowest vitamin D groupsHigher risk in lowest vitamin D groups
RR: 1.53 (1.00, 2.36) for levels 10 to <15 ng/mL
Trials: No effect of supplementation when results pooled; though individual studies have suggested lower risk for outcomes such as ischemic heart disease
Pittas AG et al. Ann Intern Med 2010;152:307-14 Wang L et al. Ann Intern Med 2010;152:315-23
Cardio-Metabolic Outcomes
Cardiovascular Disease, Metabolic Syndrome, and Type 2 Diabetes Systematic Review of 28 studies with n=99745Systematic Review of 28 studies with n 99745
RR: 0.57 (0.48, 0.68) for those in the highest vitamin D group compared to those in the lowest vitamin D group
Parker J et al. Maturitas 2010;65:225-36
hom
e.ca
regr
oup.
org
Vitamin D and Cancer

5
Vitamin D and Cancer Vitamin D metabolites prevent disjunction of cells, a key step in cancer etiology Higher levels of serum 25(OH)D associated with lower risk of:Higher levels of serum 25(OH)D associated with lower risk of:
Colon CA
Breast CA
Ovarian CA
Renal CA
Pancreatic CA
Garland CF et al. Ann Epidemiol 2009;19:468-83
RCT of Vitamin D and Cancer Risk
1179 healthy postmenopausal women aged >55 years in a 9-county rural area of Nebraska Randomly assigned to 1400-1500 mg supplemental calciumRandomly assigned to 1400 1500 mg supplemental calcium alone, calcium plus 1100 IU of vitamin D, or placebo per day RR for incident cancer in the Ca plus D group: 0.40 (0.20, 0.82) RR for incident cancer diagnosed after the first 12 months in the Ca plus D group: 0.23 (0.09, 0.60)
Lappe JM. Am J Clin Nutr 2007;85:1586-91
hom
e.ca
regr
oup.
org
Vitamin D and Mortality
Cardiovascular Disease Mortality
Third NHANES 3408 U.S. individuals aged 65 and older
Hazard Ratio (HR) for those with 25(OH)D levels <10 ng/mLHazard Ratio (HR) for those with 25(OH)D levels <10 ng/mL compared to those with >=40 ng/mL: 2.36 (1.17, 4.75)
Tuscany, Italy 1006 adults
HR for CVD mortality for those with levels <10.5 ng/mL compared to those with >26.5 ng/mL: 2.64 (1.14, 4.79)
Ginde AA et al. J Am Geriatr Soc 2009;57:1595-603 Semba RD et al. Eur J Clin Nutr 2010;64:203-09
Cancer Mortality Estimated that 1000 IU/day can lead to a
7% reduction in mortality rate for males in the U.S.;
9% for U S females;9% for U.S. females;
14% and 20% for males and females in Western Europe living below 59 degrees
Grant WB et al. Recent Results Cancer Res 2007;174:225-34
All-Cause Mortality Third NHANES
3408 U.S. individuals aged 65 and older
Hazard Ratio (HR) for those with 25(OH)D levels <10 ng/mLHazard Ratio (HR) for those with 25(OH)D levels <10 ng/mL compared to those with >=40 ng/mL: 1.83 (1.14, 2.94)
Tuscany, Italy 1006 adults
HR for CVD mortality for those with levels <10.5 ng/mL compared to those with >26.5 ng/mL: 2.11 (1.22, 3.64)
Ginde AA et al. J Am Geriatr Soc 2009;57:1595-603 Semba RD et al. Eur J Clin Nutr 2010;64:203-09
6
hom
e.ca
regr
oup.
org
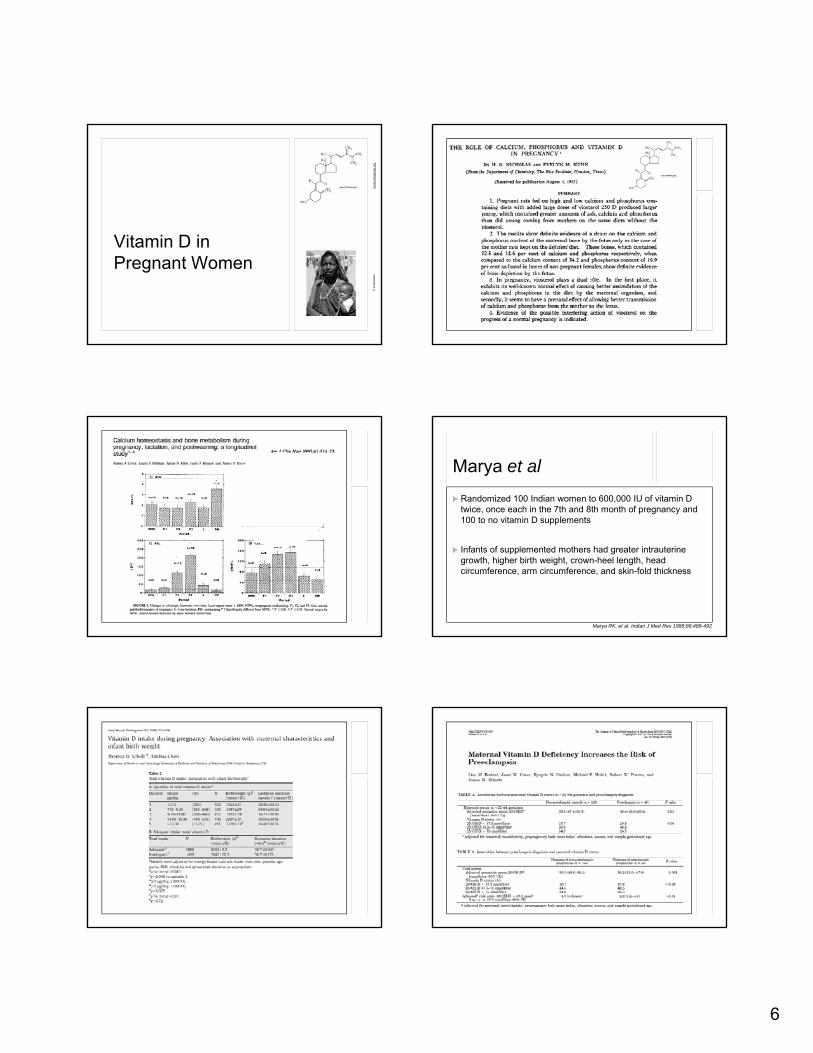
Vitamin D in Pregnant Women
© F
inke
lste
in
Marya et al Randomized 100 Indian women to 600,000 IU of vitamin D twice, once each in the 7th and 8th month of pregnancy and 100 to no vitamin D supplements
Infants of supplemented mothers had greater intrauterine growth, higher birth weight, crown-heel length, head circumference, arm circumference, and skin-fold thickness
Marya RK, et al. Indian J Med Res 1988;88:488-492

7
Vitamin D and Immune System
Vitamin D deficiency in laboratory studies:Mononuclear cells - decreased ability to ingest E. coli
Neutrophils impaired motilityNeutrophils - impaired motility
Phagocytic capacity of macrophages decreased
Inflammatory response is depressed
Cell-mediated immunity is impaired
Stroder J. Acta paediat scand 1970;59:288-92Lorente F et al. Acta paediat scand 1976;65:695-99
Bar-Shavit Z et al. Calif Tissue Int 1981;33:673-76
Vitamin D and Immune System
Vitamin D supplementation in laboratory studies:
Enhanced secretion of HydrogenEnhanced secretion of Hydrogen peroxide by Monocytes
Increased cytotoxicity shown by macrophages
Increase in cell-mediated immunity shown by mice supplemented with Vitamin D for 8 weeks
Stock JL et al. Biochem Biophys Res Commun 1982;109:935-42Abe E et al. Proc Natn Acad Sci USA 1984;81:7112-16Yang S et al. Arch Biochem Biophys 1993;303:98-106

8
Vitamin D and Innate Immunity From: AAAS | Science's STKE | Toll-Like Receptor Pathway
http://stke.sciencemag.org/cgi/cm/stkecm;CMP_8643
Toll-like Receptors (TLRs) Map
Role in ImmunityMammalian TLR recognize microbial patterns such as lipopolysaccharide and bacterial DNAInnate immunityInnate immunity
Activation of TLRs triggers direct antimicrobial activity against intracellular bacteria
Adaptive immunity Activation of TLRs activates MAPKs and NF-kB pathways, leading to pro-inflammatory gene expression that regulate the adaptive immune response (by production of cytokines and costimulatory molecules)
P. T. Liu et al., Science 311, 1770 -1773 (2006)
Role of the Vitamin D Pathway in Induction of Cathelicidin mRNA and Antimicrobial Activity
Mehta S. Adapted from Ralph AP, et al. Trends Microbiol 2008;16:336-44
ConclusionsTLR2/1 on stimulation leads to up-regulation of VDR and the hydroxylase enzyme for conversion of 25D to 1,25DIf enough 25D, converted to 1,25D and induces cathelicidinIf enough 25D, converted to 1,25D and induces cathelicidinConsequent direct antimicrobial effect

9
Vitamin D and TuberculosisLucien Lévy-Dhurmer
Serum 25(OH)D in nmol/LIndia: Sasidharan PK et al. J Assoc Physicians India 2002;Apr:554-8
Malaysia: Tan TT et al. J Trop Med Hyg 1993;96:349-51Thailand: Davies PD et al. Intern Med (Thailand) 1988;4:45-47
Hong Kong: Chan TY et al. J Trop Med Hyg 1994;97:26-30UK: Davies PD et al. Thorax 1985;40:187-90
Randomized Trials • Nursyam et al 2006: RCT in Indonesia -
• 67 TB patients randomized to receive vitamin D (0.25 /d ) l b i d bl bli d d img/day) or placebo in a double blind design
• All vitamin D recipients showed sputum conversion compared to 77% of placebo recipients (p=0.002)
• More subjects with radiological improvement in the vitamin D group
Nursyam EW et al. Acta Med Indones 2006;38:3-5
Randomized Trials• Randomized placebo-controlled trial in UK
• 192 healthy adult contacts of tuberculosis • Oral dose of 2.5 mg (100,000 IU) vitamin D or placebo g ( ) p• Vitamin D significantly enhanced participants' BCG-lux assay* in
vitro compared with placebo (0.57, vs. 0.71, p=0.03) but did not affect antigen-stimulated interferon-gamma secretion
• Potential role of vitamin D in prevention of tuberculosis infection (or activation of latent infection)
Martineau A, et al. Am J Trop Med Hyg 2007
*Note: BCG-lux assay is a functional whole blood assay, which measures the ability of whole blood to restrict luminescence (growth) of recombinant reporter mycobacteria in vitro (luminescence ratio)

10
hom
e.ca
regr
oup.
org
Research in Tanzania
Mehta S, et al. Eur J Clin Nutr 2010
Table 3 Multivariate Correlates of Low Vitamin D Status
Multivariate
Variable Risk Ratio pa(95% CI)
CD8 cells, per 100 cells/µL 1.04 (1.01, 1.07) 0.01
ESR ≥81 mm/hr 1.45 (1.14, 1.83) <0.01
Vitamin A levels, per 0.35 µmol/L 0.87 (0.77, 0.98) 0.02
Vitamin E levels, per 10 µmol/L 1.69 (1.16, 2.45) 0.01
Gestational age at randomization * 0.03b
a P values are from binomial regression models b P values represent overall significance of the curve between the variable
and low vitamin D status using the log likelihood ratio test * Non-linear variables
Mehta S, et al. Eur J Clin Nutr 2010
The Journal of Infectious Diseases 2009; 200:1022-30
Table 2 Maternal Vitamin D Status and Adverse Pregnancy Outcomes in HIV-infected Women in Tanzania
Maternal vitamin D
Low Adequate Univariate Multivariate2
Outcome % (N) % (N) RR (95% CI) P1 RR (95% CI) P1
Low birth weight (<2500 grams) 10.7 (261)12.6 (414) 0.85 (0.55, 1.32) 0.47 0.84 (0.55, 1.28) 0.42
Preterm birth (<37 weeks) 23.9 (289)28.8 (469) 0.83 (0.65, 1.07) 0.14 0.84 (0.65, 1.07) 0.15
Severe preterm birthSevere preterm birth (<34 weeks) 9.0 (289) 11.7 (469) 0.77 (0.49, 1.19) 0.24 0.77 (0.50, 1.18) 0.23
Small for gestational age 12.6 (261) 10.1 (414) 1.25 (0.81, 1.91) 0.31 1.25 (0.82, 1.90) 0.31
Adverse pregnancy outcome (composite of low birth weight, preterm birth, and small for gestational age)
34.3 (289) 37.1 (469) 0.92 (0.76, 1.13) 0.43 0.92 (0.76, 1.12) 0.41
1P values are from log-binomial regression models2All multivariate models adjusted for multivitamin supplementation, maternal age at baseline, CD4 cell counts at baseline, and HIV disease stage at baseline

11
Table 3 HIV Infection and Mortality Outcomes up to 6 Weeks Postpartum in Offspring of HIV-infected Women by Maternal Vitamin D Status
Maternal vitamin D
Low Adequate Univariate Multivariate1
Outcome % (N) % (N) RR (95% CI) P2 RR (95% CI) P2
Fetal loss 9.5 (336) 6.4 (519) 1.50 (0.94, 2.39) 0.09 1.05 (0.63, 1.74)3 0.86
HIV+ at birth 10.7 (233) 6.5 (370) 1.65 (0.97, 2.83) 0.07 1.54 (0.90, 2.64) 0.11
HIV+ or dead at birth 21.5 (265) 14.0 (400) 1.54 (1.10, 2.15) 0.01 1.49 (1.07, 2.09) 0.02
HIV+ at 6 weeks 27.5 (120) 19.3 (239) 1.43 (0.97, 2.11) 0.07 1.50 (1.02, 2.20) 0.04
HIV+ at 6 weeks among HIV- at birth 21.7 (97) 16.3 (196) 1.33 (0.81, 2.17) 0.26 1.40 (0.86, 2.28) 0.17
1All multivariate models adjusted for multivitamin supplementation, maternal age at baseline, CD4 cell counts at baseline, and HIV disease stage at baseline2P values are from binomial regression models3Adjusted for continuous CD8 cell counts at baseline and primiparity in addition to covariates in footnote 1
Table 4 HIV Infection and Mortality Outcomes up to 24 Months Postpartum in Offspring of HIV-infected Women by Maternal Vitamin D Status
Maternal vitamin DLow Adequate Univariate Multivariate2
Outcome % (N) % (N) RR (95% CI) P1 RR (95% CI) P1
HIV transmission through breastfeeding (among children known to be HIV-uninfected at six weeks of age)
20.7 (87) 12.4 (193) 1.89 (1.03, 3.49) 0.04 2.03 (1.08, 3.82) 0.03
HIV transmission through breastfeeding (among children not known to be HIV-infected at six weeks of age)
21.2 (222) 15.8 (392) 1.55 (1.06, 2.26) 0.02 1.55 (1.06, 2.27) 0.02
HIV+ at 24 months (Total HIV infection) 35.2 (270) 27.0 (452) 1.49 (1.14, 1.95) <0.01 1.46 (1.11, 1.91) <0.01
Death by end of follow-up among live births 38.8 (304) 26.8 (486) 1.64 (1.28, 2.11) <0.01 1.61 (1.25,
2.07)3 <0.01
Total mortality by end of follow-up (including fetal deaths) 44.6 (336) 31.4 (519) 1.61 (1.29, 2.01) <0.01 1.58 (1.26,
1.97)3 <0.01
Total HIV infection or mortality by end of follow-up (including fetal deaths) 53.9 (336) 40.9 (519) 1.54 (1.26, 1.87) <0.01 1.50 (1.23,
1.83)3 <0.01
1P values are from Cox (Proportional Hazards) Regression Models2All multivariate models adjusted for maternal age at baseline, HIV disease stage at baseline, CD4 cell count categories (CDC), and regime received
3Additionally adjusted for maternal death while child alive
Table 2 Vitamin D Status and HIV Disease Progression and Mortality among HIV-infected Women
Vitamin D
Low Adequate Univariate Models Multivariate Models1
Outcome % (N)2 % (N)2 RR (95% CI) P3 RR (95% CI) P3
Progression to ≥ stage III 60.1 (333) 61.2 (531) 1.20 (1.00, 1.43) 0.05 1.25 (1.05, 1.50) 0.01
Progression to stage ≥ III or death from AIDS-related causes
67.8 (338) 66.4 (533) 1.20 (1.02, 1.42) 0.03 1.26 (1.06, 1.49) 0.01
Progression to stage ≥ III or death from all causes 71.7 (339) 71.7 (533) 1.19 (1.01, 1.40) 0.04 1.23 (1.04,
1.45) 0.01
Death from AIDS-related causes 22.5 (347) 22.9 (537) 1.04 (0.78, 1.38) 0.79 1.11 (0.83,
1.48) 0.47
Death from all causes 32.9 (347) 32.2 (537) 1.08 (0.85, 1.37) 0.51 1.13 (0.89, 1.43) 0.34
1All multivariate models adjusted for maternal age, treatment regimen, CD4 cell counts at baseline, and HIV disease stage at baseline 2% (N): Percentage of cases (Total number) 3p-values obtained from Cox regression models

12
Table 4 Vitamin D Status and Anemia Outcomes Vitamin D
Low Adequate Univariate models Multivariate models6
Outcome % (N)2 % (N)2 HR (95% CI) P1 HR (95% CI) P1
Severe Anemia (Hb <8.5 g/dL) 38.7 (212) 31.0 (339) 1.44 (1.08, 1.92) 0.01 1.46 (1.09, 1.96) 0.01
Anemia (Hb <11 g/dL) 92.5 (40) 83.0 (94) 1.18 (0.80, 1.75) 0.40 1.19 (0.77, 1.83) 0.43
Hypochromic microcytosis
Severe3 21.9 (256) 10.5 (391) 2.34 (1.58, 3.45) <0.01 2.56 (1.72, 3.79) <0.01 Moderate andModerate and above4 43.6 (234) 34.8 (399) 1.39 (1.08, 1.80) 0.01 1.45 (1.12, 1.88) 0.01
Mild and above5 73.5 (151) 66.3 (261) 1.39 (1.10, 1.77) 0.01 1.41 (1.10, 1.80) 0.01
Macrocytosis 4.5 (269) 4.8 (439) 0.99 (0.49, 2.02) 0.99 1.11 (0.54, 2.28) 0.77
1p-values are from Cox Regression Models 2% (N): Percentage of cases (Total number) 3Severe: Hypochromasia ≥2+ and microcytic cells observed 4Moderate and above: Hypochromasia ≥1+ and microcytic cells observed 5Mild and above: Hypochromasia ≥1+ 6All multivariate models adjusted for maternal age, CD4 cell counts, HIV disease stage at baseline, and regime received
*Adjusted for baseline age, CD4 T-cell count, HIV disease stage and multivitamin regime
*Adjusted for baseline age, CD4 T-cell count, HIV disease stage and multivitamin regime
hom
e.ca
regr
oup.
org
Vitamin D and HIV-Related Complications In Press (AIDS Patient Care and STDs)
Table 3 Vitamin D and HIV-related complications - first 2 years of follow-up (N=884)
Complication Episodes1 RR for Low Vitamin D (95% CI) P2 Adjusted RR for Low
Vitamin D (95% CI)3 P2
Mean (SD)
Thrush 0.06 (0.40) 2.67 (1.31, 5.44) 0.01 2.92 (1.43, 5.96) <0.01
Acute Upper Respiratory Tract Infection 0.72 (1.30) 1.34 (1.10, 1.62) 0.00 1.28 (1.05, 1.55) 0.01
Reported Mouth and Throat Ulcers 0.30 (1.15) 1.54 (1.06, 2.23) 0.02 1.44 (0.98, 2.11) 0.06
Painful Tongue or Mouth 0.36 (1.20) 1.35 (0.96, 1.90) 0.08 1.27 (0.90, 1.80) 0.18
Difficult or Painful Swallowing 0.16 (0.62) 1.15 (0.75, 1.77) 0.51 1.12 (0.72, 1.74) 0.62
Nausea and Vomiting 0.44 (1.19) 1.05 (0.79, 1.39) 0.75 1.06 (0.79, 1.41) 0.70
Diarrhea 0.67 (1.37) 0.98 (0.77, 1.26) 0.88 0.96 (0.75, 1.22) 0.73
Dysentery 0.21 (0.74) 0.88 (0.60, 1.28) 0.50 0.85 (0.60, 1.23) 0.39
Fatigue 0.72 (1.66) 1.35 (1.05, 1.75) 0.02 1.31 (1.02, 1.68) 0.04
Rash 1.14 (2.05) 1.17 (0.93, 1.48) 0.18 1.12 (0.89, 1.41) 0.32
1 Mean number of episodes per year per woman (the average number of episodes per visit*12) 2 p-values from Generalized Estimating Equations 3 All multivariate models adjusted for age, multivitamin regime received, HIV disease stage, and CD4 cell count at baseline
Mehta S, et al. AIDS Patient Care and STDs. In Press Mehta S, et al. AIDS Patient Care and STDs. In Press

13
Table 4. Low Maternal Vitamin D Status and Pediatric Growth Outcomes (n=732)Low
Vitamin DAdequate Vitamin D Univariate Multivariate
n/N n/N Hazard Ratio (95% CI) p-value Hazard Ratio
(95% CI) p-value
StuntingHAZ score < -2 160/276 256/456 1.27 (1.04, 1.55) 0.02 1.30 (1.06, 1.59) 0.01
UnderweightWAZ score < -2 122/276 182/456 1.36 (1.08, 1.72) 0.01 1.38 (1.09, 1.74) 0.01
WastingWHZ score < -2 79/276 115/456 1.34 (1.01, 1.79) 0.04 1.34 (1.01, 1.79) 0.05
**All multivariate models were adjusted for maternal age, HIV disease stage at baseline, CD4 cell count at baseline, and multivitamin regimen
Finkelstein JL, Mehta S, et al. Pediatr Infect Dis J. In Press
hom
e.ca
regr
oup.
org
Summary
Benefits of Vitamin D Optimal benefits at serum 25(OH)D levels of 40-60 ng/mL Bone Health; Fall and Fracture Prevention C di t b li tCardio-metabolic outcomes Cancer Mortality Infectious Diseases Maternal and Child Health
Holick MF. Nutr Rev 2008;66:S182-94
Bischoff-Ferrari HA et al. Osteoporos Int 2010;21:1121-32
hom
e.ca
regr
oup.
org
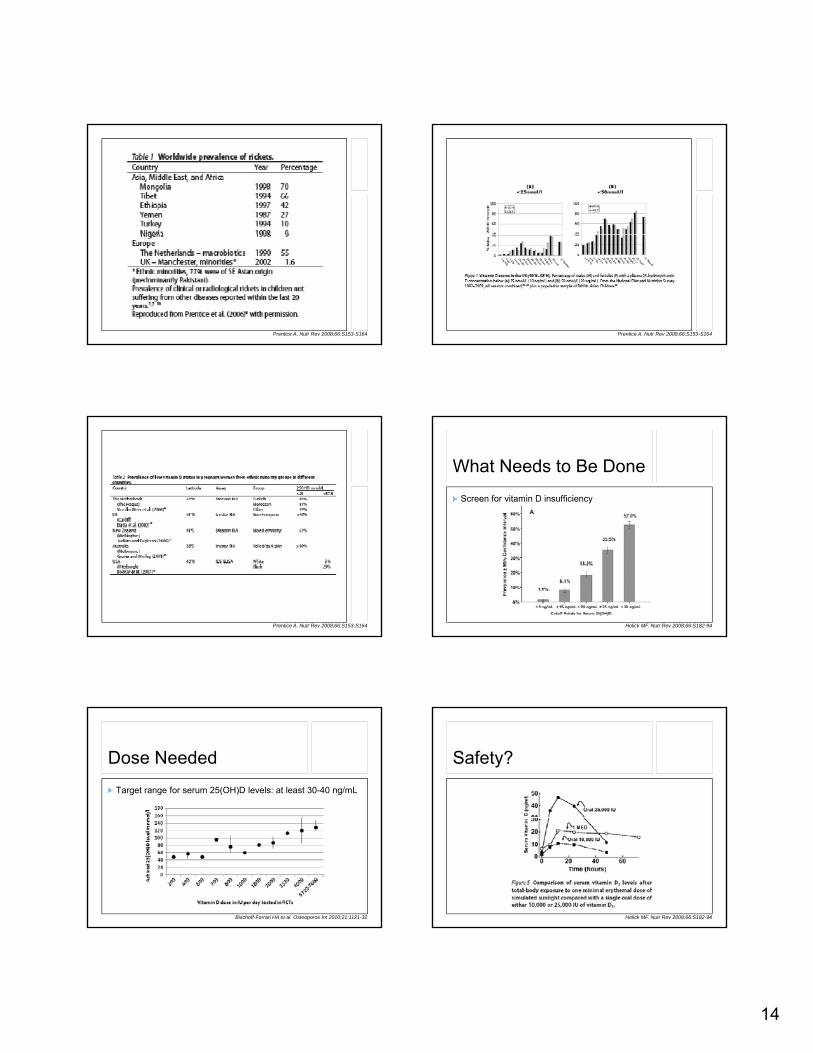
Global Deficiency Most common medical condition in the world?
14
Prentice A. Nutr Rev 2008;66:S153-S164 Prentice A. Nutr Rev 2008;66:S153-S164
Prentice A. Nutr Rev 2008;66:S153-S164
What Needs to Be Done Screen for vitamin D insufficiency
Holick MF. Nutr Rev 2008;66:S182-94
Dose Needed Target range for serum 25(OH)D levels: at least 30-40 ng/mL
Bischoff-Ferrari HA et al. Osteoporos Int 2010;21:1121-32
Safety?
Holick MF. Nutr Rev 2008;66:S182-94
15
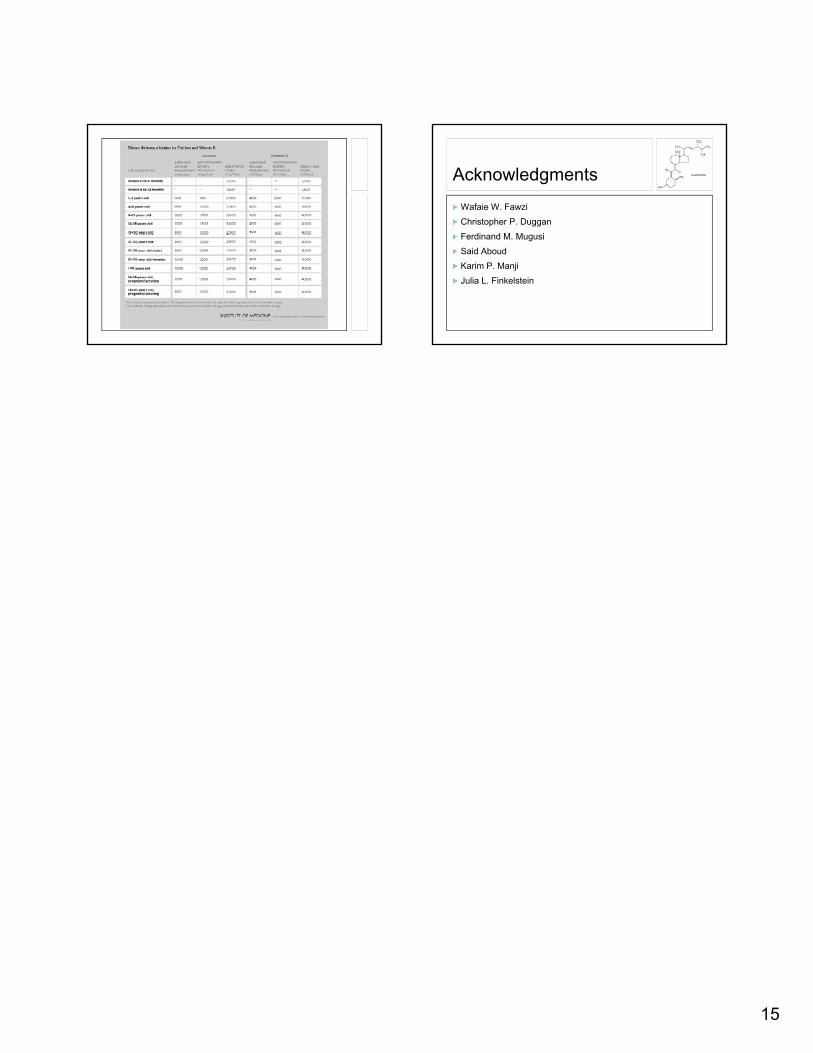
Acknowledgments Wafaie W. Fawzi Christopher P. Duggan F di d M M iFerdinand M. Mugusi Said Aboud Karim P. Manji Julia L. Finkelstein