Diversity Report 2014-2015
75
Santa Monica College 1900 Pico Boulevard Santa Monica, CA 90405 Office of Human Resources 310-434-4415 10/1/2015 Santa Monica College Santa Monica College is within one of the most racially and ethnically diverse counties within the United States. The diversity of Los Angeles County is enhanced by its location in the State of California, the comfortable climate, the stunning geography, the variety of things to do and most importantly the easy access to a multitude of options and opportunities for the people who live here. Santa Monica College's reputation as a premier institution of higher education continues to reinforce its popularity and respected status with educators, students and the communities which this college serves. Santa Monica College Diversity Report 2014-2015
Transcript of Diversity Report 2014-2015
S a n t a M o n i c a C o l l e g e
1 9 0 0 P i c o B o u l e v a r d
S a n t a M o n i c a , C A 9 0 4 0 5
O f f i c e o f H u m a n R e s o u r c e s
3 1 0 - 4 3 4 - 4 4 1 5
1 0 / 1 / 2 0 1 5
Santa Monica College
Santa Monica College is within one of the most racially and
ethnically diverse counties within the United States. The diversity of
Los Angeles County is enhanced by its location in the State of
California, the comfortable climate, the stunning geography, the
variety of things to do and most importantly the easy access to a
multitude of options and opportunities for the people who live here.
Santa Monica College's reputation as a premier institution of higher
education continues to reinforce its popularity and respected status
with educators, students and the communities which this college
serves.
Santa Monica College Diversity Report 2014-2015

2 | P a g e
Table of Contents Page
Executive Summary 3 The Trend 3 Categories to Watch 4 Student Population Data 6 Data Collection 6 Statistics 6
Overview of SMC Personnel 2009-2012 8 SMC Student Enrollment Information 9
Student Diversity 9 SMC Employees Academic Administrators 11 Classified Managers 13 Confidential Support Staff 15 Classified Support Staff 16 SMC Police Officers 18 Full-Time Faculty 20 Part-Time Faculty 22 Academic Applicant Data 25 Academic New Hire Information 26 Tenured Full-time Faculty 28 Classified Applicant Pools 30 Interpretation of the Academic Data 32 District Equal Employment Opportunity Plan 32 Selection Committees 32 Training 32 Historical Summary from 1990-2014 33 Global Connectivity 39 Acknowledgement 39 Appendix 1: State of California - Census 2010 40 Appendix 2: County of Los Angeles - Ethnic Projections 2010-2060 42 Appendix 3: Ethnicity by Employee Group 2006-2012 44 Appendix 4: Full-Time Faculty by Department 45 Appendix 5: Part-Time Faculty by Department 46 Appendix 6: BP 3120 – Equal Employment Opportunity 47
BP 3121 – Diversity

3 | P a g e
FACULTY AND STAFF Diversity Report
EXECUTIVE SUMMARY
As one of the largest employers within the City of Santa Monica, CA, Santa Monica Community
College District is known for its rich, inclusive, global, higher education learning environment and for
its commitment to excellence and dedication to its diverse student population. Santa Monica
College attracts and retains an outstanding workforce of faculty, staff and administrators.
This report is provided to assist in monitoring Santa Monica College’s progress towards achieving a
workforce representative of the diverse populations within the State of California, County of Los
Angeles, and the students of SMC. To allow for comparisons ethnicity data is displayed within a six-
year window from fall semesters 2009 through 2014.
THE TREND
In reviewing the College’s student population data from the previous report, Hispanic students
remain the predominant ethnic group of students at SMC. As of the Fall 2014 Semester, enrollment
data indicates that Hispanic students now represent 38.5% of the total credit student population.1
The preponderance of Hispanic students attending SMC mirrors population dynamics occurring
within California and Los Angeles County. Population projections by the U.S. Census Bureau to the
year 2060 indicate that Hispanics will comprise 58% of L.A. County’s population.2 (See Student
Population data and Appendix 2 for Los Angeles County census data).
SMC’s Office of Institutional Research “Fast Facts Fall 2014" data reveal that Asian/Pacific Islander is
the next largest ethnic minority group representing 14.4% of the total credit student population.
1 http://www.smc.edu/EnrollmentDevelopment/InstitutionalResearch/Documents/FastFactsFa2014.pdf
2 http://www.dof.ca.gov/research/demographic/reports/projections/P-1/documents/Projections_Press_Release_2010-2060.pdf

4 | P a g e
CATEGORIES TO WATCH
Academic Applicant Pool
Within the past four years the total number of academic applications increased as there were more
faculty openings. Outreach efforts have been successful as the applicant pools are moving to be
more reflective of Los Angeles County’s ethnic diversity. Please refer to the Academic Applicant
Section of this report for specific details.
Full-Time Faculty
As of the Fall 2014 Semester, there were 311 full-time faculty members which comprised 16.2% of
the employee categories reviewed in this report. The number of new hires during the period of this
report include the following: zero (0) full-time faculty were hired in Academic Year 2009-2010, ten
(10) in 2010-2011, eighteen (18) in 2011-2012, twelve (12) in 2012-2013, and seven (7) in 2013-
2014. These new hires were counterbalanced by full-time faculty retirements and attrition. The
majority of full-time faculty members identified as Caucasian/White. Minority populations remain
significantly under-represented but progress has been made towards diversification. The Board of
Trustees has made hiring more full-time faculty members a priority for the District. As recruitment
processes are opened, the opportunity for improved representation increases. Progress, though
incremental, is being made. Approximately 35.36% of full-time faculty members are sixty (60) or
more years of age.
Special Note: Though not incorporated within this faculty and staff diversity report as it did not
happen last Fall, twenty-nine (29) tenure track, full-time faculty hires started in Fall 2015. These
faculty members are representative of all ethnic minorities and 51.72% were existing adjunct faculty
members prior to their selection as full-time faculty for Fall 2015 semester.
Part-Time Faculty
From Fall 2012 through Fall 2014 the total number of part-time faculty increased from 1018 to 1085.
Caucasians remain the dominant ethnic group among part-time faculty members and represent
64.42% of all part-time faculty at SMC. Hispanic representation increased from 9.6% to 11%.
Remaining ethnic groups are also significantly under-represented given the total number of faculty
in this employee category. However slight representation improvements were made towards
diversity.
As part-time faculty members are a primary resource group for full-time faculty, greater outreach
for broader representation must continue when tenure track, full-time positions do become
available. Three hundred and twenty five (325) or 29.95% of SMC’s part-time faculty members are
sixty (60) years of age or greater.

5 | P a g e
Classified Managers
From Fall 2012 to Fall 2014, the number of classified managers declined from forty-four (44) to
thirty-eight (38). Caucasians remain the dominant ethnic group and represent 52.6% of the
managers. Hispanic and Asian representation increased. African American representation
decreased by one. With the number of separations and retirements within this category, it is
anticipated that there will be opportunities for constructive impacts to diversity. Refer to the SMC
Employees: Classified Managers section.
Community College Police Officers
There are nine (9) police officers at the time of this report. Recruitments are ongoing for officers.
SMC community college police officers continue to best reflect ethnic diversity with 33.3% Hispanic,
33.3% Caucasian, 11.11% Asian and 22.2% African American. Refer to the SMC Employees:
Community College Police Officers section.
Classified Support Personnel
Classified Support employees are the most ethnically diverse employee category within this District.
All ethnic groups are well represented. The total number of classified support employees declined
from four hundred-sixty (460) in Fall 2012 to four hundred-thirty-seven (437) in Fall 2014.
Approximately 19.9% are at sixty (60) years of age or more.
Employees Designated as “Confidential”
SMC continues to have a very limited number of employees with confidential status. Over the past
two years retirements claimed two (2) positions. New confidential employees were hired to fill
these positions but their hire does not impact this report. Presently there are six (6) ethnically
diverse employees. Three (3) confidential employees are at sixty (60) years of age or more.
Academic Administrators
In Fall 2012 the number of Academic Administrators fell from forty-eight (48) to forty-five (45). By
Fall 2014 the number rose back to forty-eight (48). The ethnic group of most of the administrators is
Caucasian/White. Hispanic representation increased from seven (7) at 14.6% to ten (10) at 20.8%.
The number of African American administrators remained constant with nine (9) and represent
18.8% of the group. The number of Asian/Pacific Islander administrators also remained constant
with eight (8) identifying within these groups reflecting 16.6% of all administrators. One
administrator self-identified as multi-racial and one chose not to identify race/ethnicity.

6 | P a g e
STUDENT POPULATION DATA
SMC’s student enrollment has grown slightly since the years of the fiscal crisis. The number of
international students, though highly representative, has declined and this is a result of global
economic impacts. Competition for students is very high among Southern California community
college districts. Despite this Santa Monica College has been able to maintain a strong student
population.
DATA COLLECTION
Census information for the State of California and the County of Los Angeles was drawn from the website of
the U.S. Census Bureau3 as well as the California Department of Finance
4. Population projections for 2014
based on the 2010 Census, indicate an overall population increase to 38,802,500 - a 4.2% increase between
April 1, 2010 and July 1, 2014. The percentage of change in California's population by race is highlighted in
Appendix 1.
Los Angeles County population projection shows that as of July 1, 2014 the county population will have
grown by 298,041 persons over the 2010 Census numbers to 10,116,705, a 3.0% increase. In 2014 persons of
Hispanic or Latino origin compromised 48.4% of the total population…an increase from 47.74% in 2010. The
percentage of female residents remained steady at 50.7% of the county which is just over half of the total
population.
SMC employee and student information was collected from the College’s database. All information within
this report is based on the first day of each Fall Semester from 2009 through 2014. The data is
comprehensive and current.
Ethnicity and gender data is collected through an optional voluntary Equal Employment Opportunity (EEO)
Survey given to each applicant and newly hired employee. Respondents identify whether or not they are
Hispanic/Latino or of Spanish origin and then if their race is African American/Black, American Indian/Native
American, Asian, Caucasian/White, Filipino, Hispanic, Multi-Racial, or Pacific Islander. If there is no response
or the survey is left blank, the data is identified as Unknown. Significant effort has been made for employees
to self-identify ethnicity. However, there are instances where the choice made by the applicant or employee
is to leave the category as “unknown”.
STATISTICS
In response to challenging economic situation of the past five years within the California Community
College System and the effect of resulting funding reductions, SMC had instituted a hiring freeze for
classified and management positions. Exceptions were made for vacant positions deemed essential
3 http://quickfacts.census.gov/qfd/states/06/06037.html
4 http://www.dof.ca.gov/research/demographic/reports/projections/ &
http://www.dof.ca.gov/research/demographic/reports/projections/P-1/documents/Projections_Press_Release_2010-2060.pdf

7 | P a g e
to sustain a mission-critical or compliance function for the college. Hiring has continued and overall
there has been an increase of the SMC employee base.
Data in this report is summarized by employee category and covers the academic years 2009-2010,
through 2013-2014. All employee data is based on the first day of the Fall semester in each of those
academic years.
In-depth statistical information can be found in the Appendices at the end of this report and covers
Academic Years 2009-2010 through 2013-2014. This more extensive information is presented to
facilitate discussion on employee diversity at Santa Monica College.
Ethnicity and Gender information is presented by employee category. Total numbers of employees
by category are shown on the right side of each chart. The number of employees within each ethnic
group and corresponding percentage to the total are listed by academic year. Race and ethnicity
information is followed by gender and age data.
LEGEND
In this report the following abbreviations are used:
Abbreviations Description
AFR AMR African American/Black
AMR IND American Indian/Native American
ASIAN Asian (Chinese, Japanese, Vietnamese, etc.)
CAUCASIAN Caucasian/White
FILIPINO Filipino
HISPANIC Hispanic (Mexican, South American, Central American, etc.)
MULTI-RACIAL Two or more races
PACIFIC ISLANDER Native Hawaiian, Other Pacific Islander
UNKNOWN Declined to State/Unreported
∞∞∞

8 | P a g e
Overview of SMC Personnel 2009-2014
SMC Employee Groups
Fall 2009 Fall 2010 Fall 2011 Fall 2012 Fall 2013 Fall 2014
No. % No. % No. % No. % No. % No. % Academic Administrators 51 2. 7% 50 2.7% 46 2.5% 48 2.5% 45 2.3% 48 2.4% Classified Managers 41 2.1% 42 2.2% 41 2.3% 44 2.3% 41 2.1% 38 1.9% Classified Support 477 24.9% 472 25.2% 471 26.1% 460 24.3% 442 23.0% 437 23.7% Confidential Staff 7 0.4% 7 0.4% 8 0.4% 8 0.4% 8 0.4% 6 0.3% Full-time Faculty 311 16.3% 310 16.5% 312 17.3% 318 16.8% 309 16.1% 311 16.2% Part-time Faculty 1,026 53.6% 994 53.0% 927 51.4% 1,017 53.7% 1,069 55.6% 1,085 55.1% Police Officers n/a n/a n/a n/a n/a n/a n/a n/a 8 0.4% 9 0.4% Totals 1,913 100% 1,875 100% 1,805 100% 1,895 100% 1,922 100% 1,934 100%
The graph below shows the number of SMC employees in each group from Fall 2009 through Fall
2014.
SMC Employee Groups – Ethnicity 2009-2014
∞∞∞
0
200
400
600
800
1000
1200
Fall 2009 Fall 2010 Fall 2011 Fall 2012 Fall 2013 Fall 2014
Emp
loye
es
by
Emp
loye
e G
rou
p
Academic Years
Academic Administrators
Classified Managers
Classified Support
Confidential Staff
Full-Time Faculty
Part-Time Faculty
Police Officers

9 | P a g e
SMC STUDENT ENROLLMENT INFORMATION
Student information is included for comparison purposes with the District workforce. Student enrollment information is drawn from college database sources and can be found on the SMC website.5 Total student enrollment is a combination of credit and non-credit student headcount data and is included for reference purposes. Student diversity in this report was based on credit student count only.
STUDENT DIVERSITY
In reviewing data from Fall 2009 through Fall 2014, students identifying themselves as Hispanic increased from 28.61% of the total student population to more than one-third of the student population (38.5%). The Multi-Racial identification (sometimes known as the ‘Two or More’ category) also increased from 1.6% to 3.9% in the same time period. African American and Asian students decreased during the same period as did Caucasian students.
All other ethnic reporting groups declined against the total population. Ethnicity Fall 2009 Fall 2010 Fall 2011 Fall 2012 Fall 2013 Fall 2014
No. % No. % No. % No. % No. % No. %
AFR AMR 3,406 10.5% 3,047 9.8% 2,925 9.8% 2,914 9.6% 2,769 9.2% 2,748 9.1%
AMR IND 110 0.3% 83 0.2% 74 0.2% 79 0.3% 66 0.2% 55 0.2%
ASIAN/PAC ISL
6,048 18.7% 5,860 18.8% 5,545 18.5% 4,680 15.5% 4,136 13.8% 4,339 14.4%
CAUCASIAN 10,399 32.2% 9,710 31.2% 9,149 30.5% 8,504 28.1% 7,982 26.6% 8,046 26.7%
HISPANIC 9,250 28.6% 9,889 31.8% 10,096 33.7% 10,838 35.8% 11,221 37.4% 11,616 38.5%
MULTI-RACIAL
514 1.6% 889 2.9% 1,041 3.5% 1,100 3.6% 1,163 3.9% 1,190 3.9%
UNKNOWN 2,600 8.0% 1,660 5.3% 1,147 3.8% 2,145 7.1% 2,663 8.9% 2,165 7.2%
TOTALS 32,327 100% 31,138 100% 29,977 100% 30,260 100% 30,000 100% 30,159 100%
5 http://www.smc.edu/EnrollmentDevelopment/InstitutionalResearch/Pages/Stu-Background-Demo.aspx
0
2,000
4,000
6,000
8,000
10,000
12,000
14,000
AFR AM AM IND ASIAN CAUCASIAN OTHER, NW HISPANIC MULTI-R UNKNOWN
Nu
mb
er
of
Stu
de
nts
by
Eth
nic
Gro
up
2
00
8-2
01
2
Student Ethnic Groups by Year (Credit only)
Fall 2008
Fall 2009
Fall 2010
Fall 2011
Fall 2012
Fall 2013
Fall 2014

10 | P a g e
STUDENT GENDER
Although female students continue to outnumber male students in all study years, the percentage
of male students against the total number has been rising over the past 4 years. 6
∞∞∞
6 http://www.smc.edu/EnrollmentDevelopment/InstitutionalResearch/Documents/Fall%20Documents/Gender.pdf
Gender Fall 2009 Fall 2010 Fall 2011 Fall 2012 Fall 2013 Fall 2014
Female 17,831 55.2% 17,102 54.9% 16,195 54.0% 16,019 52.9% 15,694 52.3% 15,819 52.5%
Male 14,496 44.8% 14,036 45.1% 13,782 46.0% 14,241 47.1% 14,306 47.7% 14,340 47.5%
Total 32,327 100% 31,138 100% 29,977 100% 30,260 100% 30,000 100% 30,159 100%
11 | P a g e
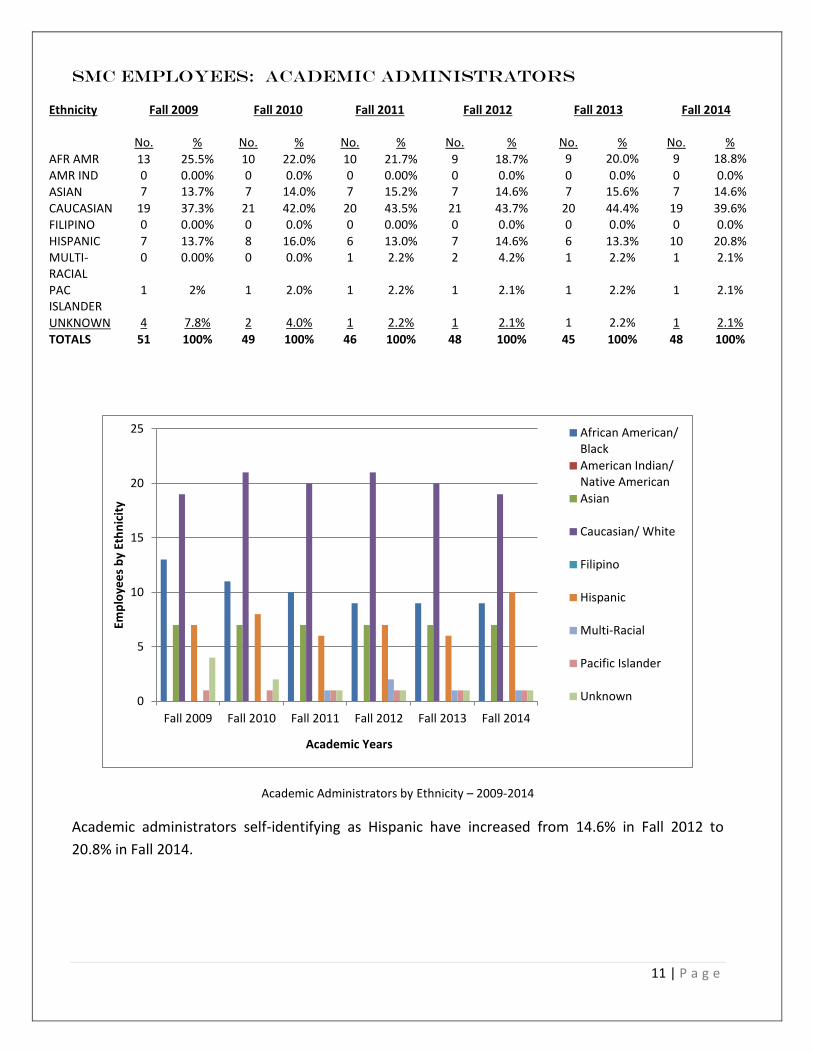
SMC EMPLOYEES: ACADEMIC ADMINISTRATORS
Ethnicity Fall 2009 Fall 2010 Fall 2011 Fall 2012 Fall 2013 Fall 2014
No. % No. % No. % No. % No. % No. %
AFR AMR 13 25.5% 10 22.0% 10 21.7% 9 18.7% 9 20.0% 9 18.8%
AMR IND 0 0.00% 0 0.0% 0 0.00% 0 0.0% 0 0.0% 0 0.0% ASIAN 7 13.7% 7 14.0% 7 15.2% 7 14.6% 7 15.6% 7 14.6%
CAUCASIAN 19 37.3% 21 42.0% 20 43.5% 21 43.7% 20 44.4% 19 39.6% FILIPINO 0 0.00% 0 0.0% 0 0.00% 0 0.0% 0 0.0% 0 0.0%
HISPANIC 7 13.7% 8 16.0% 6 13.0% 7 14.6% 6 13.3% 10 20.8% MULTI-RACIAL
0 0.00% 0 0.0% 1 2.2% 2 4.2% 1 2.2% 1 2.1%
PAC ISLANDER
1 2% 1 2.0% 1 2.2% 1 2.1% 1 2.2% 1 2.1%
UNKNOWN 4 7.8% 2 4.0% 1 2.2% 1 2.1% 1 2.2% 1 2.1%
TOTALS 51 100% 49 100% 46 100% 48 100% 45 100% 48 100%
Academic Administrators by Ethnicity – 2009-2014
Academic administrators self-identifying as Hispanic have increased from 14.6% in Fall 2012 to
20.8% in Fall 2014.
0
5
10
15
20
25
Fall 2009 Fall 2010 Fall 2011 Fall 2012 Fall 2013 Fall 2014
Emp
loye
es
by
Eth
nic
ity
Academic Years
African American/Black
American Indian/Native American
Asian
Caucasian/ White
Filipino
Hispanic
Multi-Racial
Pacific Islander
Unknown

12 | P a g e
GENDER
Gender statistics remained fairly constant over the past 3 years with female academic administrators outnumbering male administrators almost three to one: FEMALE: 72.92% (35) MALE: 27.08% (13)
AGE
The age spread for Academic Administrators in Fall 2014 is consistent and indicates reasonable
coverage for succession planning.
Ages 18-29 Ages 30-39 Ages 40-49 Ages 50-59 Ages 60-69 Ages 70-79 +80
1 10 14 13 10 0 0
However, seven (14.58%) of the forty-eight Academic Administrators in Fall 2015 are age 65 or
older.
Decade No./Age
Group Age in 2014*
% of Total
1900-1920 0 0 0.00%
1921-1930 0 0 0.00%
1931-1940 0 0 0.00%
1941-1950 7 64 14.58%
1951-1960 14 54 29.17%
1961-1970 12 44 25.00%
1971-1980 13 34 27.08%
1981-1990 2 24 4.17%
1991-2000 0 0 0.00%
Total 48
100.00%
*Age is calculated based on the last year of the decade (i.e., Age 64 during the decade of 1941-1950
is calculated as 2014-1950=64.)
∞∞∞

13 | P a g e
SMC EMPLOYEES: CLASSIFIED MANAGERS
Ethnicity Fall 2009 Fall 2010 Fall 2011 Fall 2012 Fall 2013 Fall 2014
No. % No. % No. % No. % No. % No. %
AFR AMR 7 17.1% 7 16. 7% 7 17.1% 8 18.2% 8 19.5% 7 18.4%
AMR IND 1 2.4% 1 2.4% 1 2.4% 1 2.3% 1 2.4% 1 2.6% ASIAN 3 7.3% 4 9.5% 4 9.8% 4 9.1% 4 9.8% 4 10.5%
CAUCASIAN 27 65.9% 26 61.9% 24 58.5% 26 59.1% 22 53.7% 20 52.6%
FILIPINO 1 2.4% 1 2.4% 1 2.4% 1 2.3% 1 2.4% 1 2.6%
HISPANIC 2 4.9% 3 7.1% 4 9.8% 3 6.8% 4 9.8% 5 13.2%
MULTI-RACIAL
0 0.0% 0 0.0% 0 0.0% 1 2.3% 1 2.4% 0 0.0%
PAC ISLANDER
0 0.0% 0 0.0% 0 0.0% 0 0.0% 0 0.0% 0 0.0%
UNKNOWN 0 0.0% 0 0.0% 0 0.0% 0 0.0% 0 0.0% 0 0.0%
TOTALS 41 100% 42 100% 41 100% 44 100% 41 100% 38 100%
This category remained less racially and ethnically diverse compared to college employees overall
and the data indicates that more outreach is needed to qualified non-Caucasian/White populations
as vacancies become available.
Classified Managers by Ethnicity – 2009-2014
0
5
10
15
20
25
30
Fall 2009 Fall 2010 Fall 2011 Fall 2012 Fall 2013 Fall 2014
Emp
loye
es
by
Eth
nic
ity
Academic Years
African American/Black
American Indian/Native American
Asian
Caucasian/ White
Filipino
Hispanic
Multi-Racial
Pacific Islander
Unknown

14 | P a g e
GENDER
In Fall 2012, female classified anagers are outnumbered by male managers two to one based on a
total manager count of 44 within this employment category.
FEMALE: 37.21% (16)
MALE: 62.79% (27)
Over the next two years, the number of classified managers decreased from 44 to 41 in 2013 and
from 41 to 38 in 2014. In 2014, male classified managers comprised 71.05 % (27) of the group, and
female classified managers 28.95% (11).
AGE
During Fall 2014, 73.68% of classified managers are 50 years of age or older. As separations occur,
there is reasonable expectation that recruitment opportunities will develop.
Ages 20-29 Ages 30-39 Ages 40-49 Ages 50-59 Ages 60-69 Ages 70-79 80+
0 4 6 22 5 1 0 SMC is a Merit District with a generous longevity incentive for permanent classified employees. This has encouraged employees to remain within the District.
∞∞∞
FEMALE 11
28.95%
MALE 27
71.05%
Classified Managers - Gender Effective Fall 2014

15 | P a g e
SMC EMPLOYEES: Confidential Support staff
Ethnicity Fall 2009 Fall 2010 Fall 2011 Fall 2012 Fall 2013 Fall 2014 No. % No. % No. % No. % No. % No. %
AFR AMR 2 28.8% 2 28.6% 2 25.0% 2 25.0% 2 25.0% 0 0.0% AMR IND 0 0.0% 0 0.0% 0 0.0% 0 0.0% 0 0.0% 0 0.0% ASIAN 0 0.0% 0 0.0% 1 12.5% 1 12.5% 2 25.0% 2 33.3% CAUCASIAN 3 42.9% 3 42.9% 3 37.5% 3 37.5% 3 37.5% 3 50.0% FILIPINO 0 0.0% 0 0.0% 0 0.0% 0 0.0% 0 0.0% 0 0.0% HISPANIC 2 28.6% 2 28.6% 2 25.0% 2 25.0% 1 12.5% 1 16.7%
MULTI-RACIAL
0 0.00 0 0.0% 0 0.0% 0 0.0% 0 0.0% 0 0.0%
PAC ISLANDER
0 0.0% 0 0.0% 0 0.0% 0 0.0% 0 0.0% 0 0.0%
UNKNOWN 0 0.0% 0 0.0% 0 0.0% 0 0.0% 0 0.0% 0 0.0% TOTALS 7 100% 7 100% 8 100% 8 100% 8 100% 6 100%
The number of staff designated as confidential is very limited. Separations via retirement and attrition directly impacted diversity.
GENDER
During this report period all six employees designated as confidential are female.
AGE
Ages 20-29 Ages 30-39 Ages 40-49 Ages 50-59 Ages 60-69 Ages 70-79 80+
1 1 0 1 3 0 0
∞∞∞
0
ASIAN 2
33.3%
CAUCASIAN 3
50%
HISPANIC 1
16.7%
Confidential Support Staff by Ethnicity Fall 2014

16 | P a g e
SMC EMPLOYEES: CLASSIFIED SUPPORT
Ethnicity Fall 2009 Fall 2010 Fall 2011 Fall 2012 Fall 2013 Fall 2014 No. % No. % No. % No. % No. % No. % AFR AMR 123 25.8% 118 25.0% 114 24.2% 109 23.7% 105 24.2% 100 22.9% AMR IND 1 0.2% 1 0.2% 1 0.2% 0 0.0% 0 0.0% 0 0.0% ASIAN 36 7.5% 35 7.4% 39 8.3% 40 8.7% 38 8.8% 40 9.2% CAUCASIAN 174 36.5% 176 37.3% 173 36.7% 168 36.5% 156 35.9% 148 33.9% FILIPINO 11 2.3% 12 2.5% 12 2.5% 13 2.8% 11 2.5% 11 2.5% HISPANIC 115 24.1% 113 23.9% 117 24.8% 115 25.0% 108 24.9% 117 26.8% MULTI-RACIAL
0 0.00 3 0.6% 3 0.6% 3 0.7% 1 0.2% 1 0.2%
PAC ISLANDER
0 0.0% 0 0.0% 0 0.00 0 0.0% 0 0.0% 0 0.0%
UNKNOWN 17 3.6% 14 3.0% 12 2.5% 12 2.6% 15 3.5% 20 4.6% TOTALS 477 100% 472 100% 471 100% 460 100% 434 100% 437 100%
Hispanics and African Americans are well represented in classified support positions. Under-
representation is evident in the other minority categories of Native American, Asian, Filipino, Multi-
Racial, and Pacific Islander in respect to current SMC Classified Support personnel but overall the
statistics are improving.
Classified Support by Ethnicity – 2009-2014
0
20
40
60
80
100
120
140
160
180
200
Fall 2009 Fall 2010 Fall 2011 Fall 2012 Fall 2013 Fall 2014
African American/Black
American Indian/Native American
Asian
Caucasian/ White
Filipino
Hispanic
Multi-Racial
Pacific Islander
Unknown
17 | P a g e
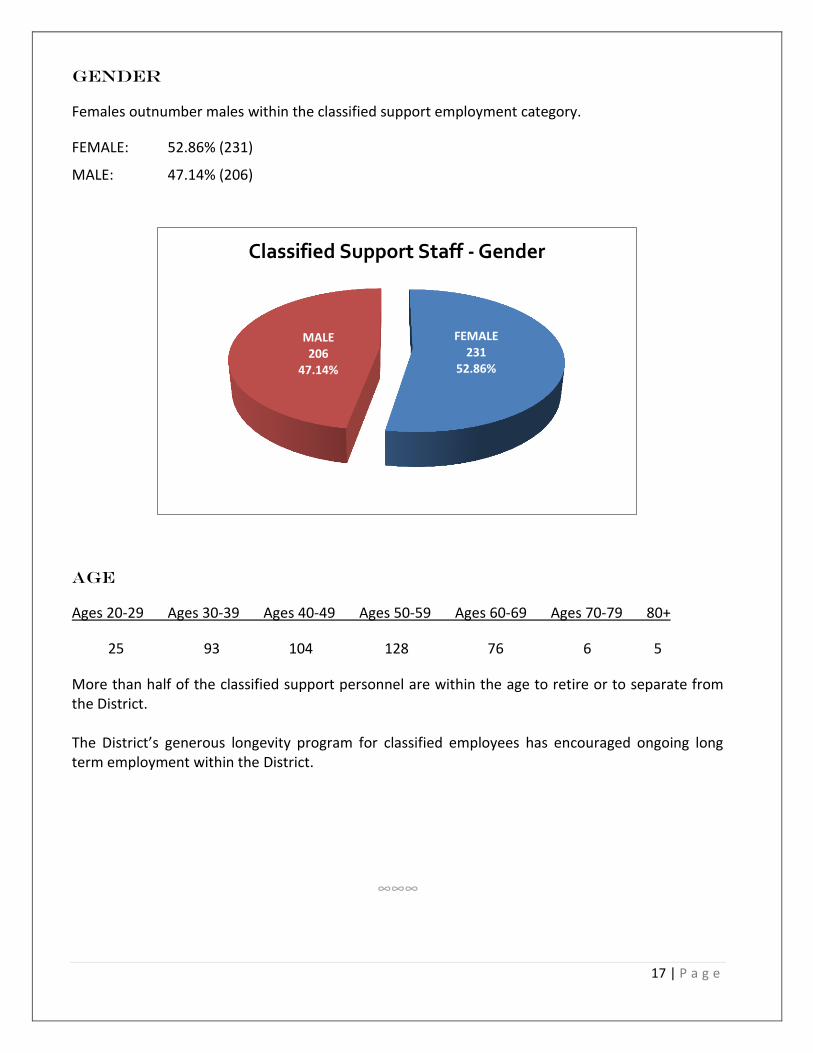
GENDER
Females outnumber males within the classified support employment category.
FEMALE: 52.86% (231)
MALE: 47.14% (206)
AGE
Ages 20-29 Ages 30-39 Ages 40-49 Ages 50-59 Ages 60-69 Ages 70-79 80+
25 93 104 128 76 6 5
More than half of the classified support personnel are within the age to retire or to separate from the District. The District’s generous longevity program for classified employees has encouraged ongoing long term employment within the District.
∞∞∞
FEMALE 231
52.86%
MALE 206
47.14%
Classified Support Staff - Gender

18 | P a g e
SMC COMMUNITY COLLEGE POLICE Officers
Recruitment for community college police officers is continuous. It is anticipated that more police
officers will be hired by the District. The SMC Police Officers are sworn classified employees with
their own bargaining unit that is separate from the classified support employees. The SMC Police
Officer ethnicity and gender statistics are still reported under classified support staff. For the
purpose of this report, racial and ethnic data is listed below:
College Police Officer Ethnicity 2009-2014
0
1
2
3
4
5
6
Fall 2009 Fall 2010 Fall 2011 Fall 2012 Fall 2013 Fall 2014
Nu
mb
er
of
Po
lice
Off
ice
rs
African American/Black
Asian
Caucasian/White
Hispanic
Ethnicity Fall 2009 Fall 2010 Fall 2011 Fall 2012 Fall 2013 Fall 2014
No. % No. % No. % No. % No. % No. %
AFR AMR 3 27.3% 3 27.3% 3 27.3% 1 11.1% 1 12.5% 2 22.2%
AMR IND 0 0.0% 0 0.0% 0 0.0% 0 0.0% 0 0.0% 0 0.0% ASIAN 0 0.0% 0 0.0% 0 0.0% 1 11.1% 1 12.5% 1 11.1% CAUCASIAN 4 36.4% 4 36.4% 5 45. 5% 3 33.3% 3 37.5% 3 33.3%
FILIPINO 0 0.00% 0 0.00% 0 0.0% 0 0.0% 0 0.0% 0 0.0% HISPANIC 4 36.4% 4 36.4% 3 27.3% 4 44.4% 3 37.5% 3 33.3% MULTI-RACIAL
0 0.0% 0 0.0% 0 0.0% 0 0.0% 0 0.0% 0 0.0%
PAC ISLANDER
0 0.0% 0 0.0% 0 0.0% 0 0.0% 0 0.0% 0 0.0%
UNKNOWN 0 0.0% 0 0.0% 0 0.0% 0 0.0% 0 0.0% 0 0.0%
TOTALS 11 100% 11 100% 11 100% 9 100% 8 100% 9 100%

19 | P a g e
GENDER
As of Fall Semester 2014 there is one female officer (11.11%) and eight male officers (88.89%).
AGE
Ages 20-29 Ages 30-39 Ages 40-49 Ages 50-59 Ages 60-69 Ages 70-79 80+
1 4 2 2 0 0 0
∞∞∞
Female 1
11.11%
Male 8
88.89%
SMC Police Officers Fall 2014 Gender
20 | P a g e
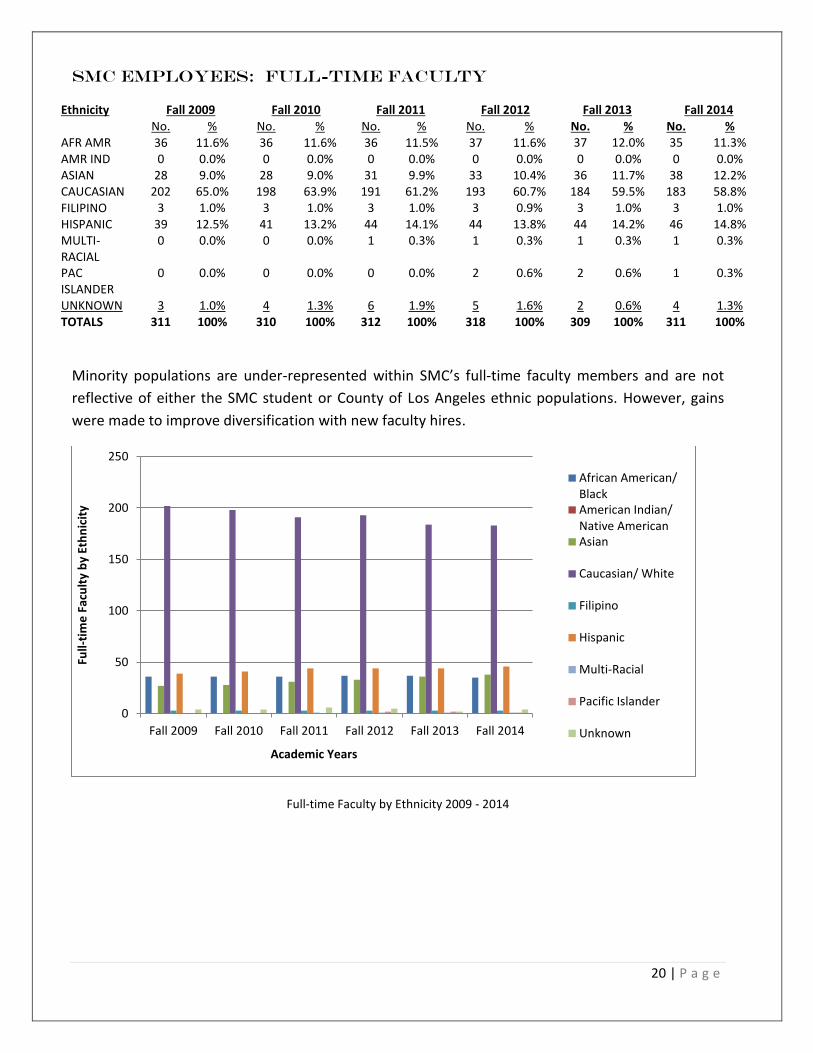
SMC EMPLOYEES: FULL-TIME FACULTY
Ethnicity Fall 2009 Fall 2010 Fall 2011 Fall 2012 Fall 2013 Fall 2014 No. % No. % No. % No. % No. % No. % AFR AMR 36 11.6% 36 11.6% 36 11.5% 37 11.6% 37 12.0% 35 11.3% AMR IND 0 0.0% 0 0.0% 0 0.0% 0 0.0% 0 0.0% 0 0.0% ASIAN 28 9.0% 28 9.0% 31 9.9% 33 10.4% 36 11.7% 38 12.2% CAUCASIAN 202 65.0% 198 63.9% 191 61.2% 193 60.7% 184 59.5% 183 58.8% FILIPINO 3 1.0% 3 1.0% 3 1.0% 3 0.9% 3 1.0% 3 1.0% HISPANIC 39 12.5% 41 13.2% 44 14.1% 44 13.8% 44 14.2% 46 14.8% MULTI-RACIAL
0 0.0% 0 0.0% 1 0.3% 1 0.3% 1 0.3% 1 0.3%
PAC ISLANDER
0 0.0% 0 0.0% 0 0.0% 2 0.6% 2 0.6% 1 0.3%
UNKNOWN 3 1.0% 4 1.3% 6 1.9% 5 1.6% 2 0.6% 4 1.3% TOTALS 311 100% 310 100% 312 100% 318 100% 309 100% 311 100%
Minority populations are under-represented within SMC’s full-time faculty members and are not
reflective of either the SMC student or County of Los Angeles ethnic populations. However, gains
were made to improve diversification with new faculty hires.
Full-time Faculty by Ethnicity 2009 - 2014
0
50
100
150
200
250
Fall 2009 Fall 2010 Fall 2011 Fall 2012 Fall 2013 Fall 2014
Full-
tim
e F
acu
lty
by
Eth
nic
ity
Academic Years
African American/BlackAmerican Indian/Native AmericanAsian
Caucasian/ White
Filipino
Hispanic
Multi-Racial
Pacific Islander
Unknown

21 | P a g e
GENDER
There are 41 more full-time faculty females to full-time faculty males as of Fall 2014.
FEMALES: 56.59% (176)
MALES: 43.41% (135)
AGE
The age spread for full-time faculty indicates reasonable coverage for succession planning.
Ages 20-29 Ages 30-39 Ages 40-49 Ages 50-59 Ages 60-69 Ages 70-79 80+
2 42 67 90 90 20 0
More than half of the full-time faculty members are within the ages to retire or to separate from the
District.
∞∞∞
FEMALE 176
56.59%
MALE 135
43.41%
Full-time Faculty - Gender Effective Fall 2014

22 | P a g e
SMC EMPLOYEES: Part-Time Faculty
Minority populations are under-represented within SMC’s part-time faculty and are not reflective of
either the SMC student or County of Los Angeles ethnic populations. This category has been a key
resource for full-time faculty hires. A number of newly hired full-time, tenure track faculty come
from the adjunct (part-time) faculty base. The influence is evident when reviewing the number of
new full-time faculty hired since academic years 2007-2008 through 2014-2015. The following lists
the percentage of part-time faculty members who transitioned from part-time status to full-time
tenure track faculty members:
Academic Year 2007-2008 66.66%
2008-2009 38.46%
2009-2010 No full time faculty hires
2010-2011 60.00%
2011-2012 38.88%
2012-2013 41.66%
2013-2014 42.85%
2014-2015 37.50%
Ethnicity Fall 2009 Fall 2010 Fall 2011 Fall 2012 Fall 2013 Fall 2014 No. % No. % No. % No. % No. % No. % AFR AMR 94 9.2% 81 8.2% 71 7.7% 76 7.5% 80 7.5% 89 8.2% AMR IND 1 0.1% 2 0.2% 2 0.2% 1 0.1% 1 0.1% 1 0.1% ASIAN 77 7.5% 78 7.9% 80 8.6% 96 9.4% 95 8.9% 94 8.7% CAUCASIAN 664 64.7% 660 66.4% 633 68.3% 678 66.6% 712 66.6% 699 64.4% FILIPINO 7 0.7% 6 0.6% 5 0.5% 8 0.8% 8 0.7% 8 0.7% HISPANIC 76 7.4% 77 7.8% 74 8.0% 98 9.6% 109 10.2% 119 11.0% MULTI-RACIAL
1 0.1% 5 0.5% 7 0.8% 8 0.8% 14 1.3% 14 1.3%
PAC ISLANDER
2 0.2% 3 0.3% 4 0.4% 4 0.4% 4 0.4% 5 0.5%
UNKNOWN 104 10.1% 82 8.3% 51 5.5% 49 4.8% 46 4.3% 56 5.2% TOTALS 1,026 100% 994 100% 927 100% 1,018 100% 1,069 100% 1,085 100%

23 | P a g e
Part-Time Faculty by Ethnicity 2009 - 2014
GENDER
As with full-time faculty, female part-time faculty members outnumber their male counterparts.
FEMALES: 54.01% (586)
MALES: 45.99% (499)
0
100
200
300
400
500
600
700
800
Fall 2009 Fall 2010 Fall 2011 Fall 2012 Fall 2013 Fall 2014
Par
t-ti
me
Fac
ult
y b
y Et
hn
icit
y
Academic Years
African American/ Black
American Indian/ NativeAmerican
Asian
Caucasian/ White
Filipino
Hispanic
Multi-Racial
Pacific Islander
Unknown

24 | P a g e
AGE
The following statistics reflect the aging of the part-time faculty as a whole in all categories except
the 20-29 year old age range.
Fall 2012:
Ages 20-29 Ages 30-39 Ages 40-49 Ages 50-59 Ages 60-69 Ages 70-79 80+
42 207 217 259 230 51 12
Fall 2014:
Ages 20-29 Ages 30-39 Ages 40-49 Ages 50-59 Ages 60-69 Ages 70-79 80+
39 225 224 272 236 73 16
∞∞∞
FEMALE 586
54.01%
MALE 499
45.99%
Part-Time Faculty - Gender Effective Fall 2014

25 | P a g e
Academic Applicant DATA
Academic applicant data for Fall 2009 to Fall 2012 contained a number of people who did not
respond to the voluntary EEO survey form. Recent data revealed that 84.00% of the academic
applicant pool for 2011-2012, and 89.47% of the applicant pool during 2012-2013 chose to self-
identify ethnicity. This result may be attributed to the online application system now in-place.
During the 2014-2015 academic year, Caucasian applicants constituted 47.39% of all full-time
academic applicants, African Americans dropped from 13.74% to 10.42% and Asians from 16.08% to
10.90%. Hispanics made up 11.03% of the total pool of academic applicants during 2014-2015.
(Note, these statistics reflect applicants for specific job postings and do not include those for part-
time postings.)
Academic Applicants by Ethnicity – 2009 – 2014
During the 2014-2015 academic year, female applicants comprised 45.59%, male 48.65%, and those
choosing not to disclose were 5.76% of all full-time applicants.
∞∞∞
0
500
1000
1500
2000
2500
3000
3500
4000
4500
5000
2009-2010 2010-2011 2011-2012 2012-2013 2013-2014
Aca
de
mic
Ap
plic
ants
by
Eth
nic
ity
Academic Years
AFR AMR
AMR IND
ASIAN
CACAUSIAN
FILIPINO
HISPANIC
MULTI-RAC
PAC ISL
UNKNOWN

26 | P a g e
ACADEMIC new hire Information
In spite of the fiscal difficulties facing the District, SMC made a concerted effort to hire additional
new faculty during the past several years. Since Fall 2012 through Fall of 2014 twenty-nine (29) full-
time faculty were hired.
Ethnicity 2009-2010 2010-2011 2011-2012 2012-2013 2013-2014 2014-2015 No. % No. % No. % No. % No. % No. % AFR AMR 0 0.00% 1 10.00% 1 5.56% 2 20.00% 0 0.00% 2 8.70% AMR IND 0 0.00% 0 0.00% 0 0.00% 0 0.00% 0 0.00% 0 0.00% ASIAN 0 0.00% 1 10.00% 3 16.67% 1 10.00% 2 33.33% 2 8.70% CAUCASIAN 0 0.00% 5 50.00% 6 33.33% 6 60.00% 1 16.67% 11 47.83% FILIPINO 0 0.00% 0 0.00% 0 0.00% 0 0.00% 0 0.00% 0 0.00% HISPANIC 0 0.00% 3 30.00% 4 22.22% 0 0.00% 3 50.00% 6 26.09% MULTI-RACIAL
0 0.00%
0 0.00%
1 5.56% 0 0.00% 0 0.00% 0 0.00%
PAC ISLANDER
0 0.00%
0 0.00%
1 5.56% 1 10.00% 0 0.00% 0 0.00%
UNKNOWN 0 0.00% 0 0.00% 2 11.11% 0 0.00% 0 0.00% 2 8.70% TOTALS 0 0.00% 10 100% 18 100% 10 100% 6 100% 23 100%
Ethnicity of Academic New Hires 2010-2014
0
2
4
6
8
10
12
2010 2011 2012 2013 2014
Ethnicity of Academic New Hires 2010-2014
AFR AMR
ASIAN
CAUCASIAN/WHITE
HISPANIC
MULTI-RACES
PAC ISL OTH
UNKNOWN

27 | P a g e
Gender
In Fall 2013 there were six (6) newly hired faculty of which two (2) female and four (4) male.
For Fall 2014 there were 23 newly hired faculty: female faculty members comprised 47.83%, and male newly hired faculty were at 52.17%.
AGE
The age range spread for newly hired full-time faculty for Fall 2014 was as follows:
Ages 20-29 Ages 30-39 Ages 40-49 Ages 50-59 Ages 60-69 Ages 70-79 80+
1 12 6 3 1 0 0
∞∞∞
0
2
4
6
8
10
12
14
2010-2011 2011-2012 2012-2013 2013-2014 2014-2015
Female
Male
Academic New Hires Gender 2010-2014

28 | P a g e
Tenure Track full-time faculty
Tenured faculty are those full-time faculty members who have been under contract with the District
for four (4) years in probationary status. During each probationary year, the non-tenured faculty
member is evaluated by his/her peers. At the end of four years tenure may be offered.
Ethnicity 2009-2010 2010-2011 2011-2012 2012-2013 2013-2014 2014-2015 No. % No. % No. % No. % No. % No. % AFR AMR 0 0.00% 0 0.00% 3 20.00% 1 7.69% 4 12.50% 4 7.84% AMR IND 0 0.00% 0 0.00% 0 0.00% 0 0.00% 0 0.00% 0 0.00% ASIAN 1 20.00% 0 0.00% 3 20.00% 2 15.38% 5 15.63% 10 19.61% CAUCASIAN 3 60.00% 2 100.00% 4 26.67% 8 61.54% 19 59.38% 22 43.14% FILIPINO 0 0.00% 0 0.00% 0 0.00% 0 0.00% 0 0.00% 0 0.00% HISPANIC 1 20.00% 0 0.00% 2 13.33% 2 15.38% 4 12.50% 9 17.65% MULTI-RACIAL
0 0.00% 0 0.00% 0 0.00% 0 0.00% 0 0.00% 1 1.96%
PAC ISLANDER
0 0.00% 0 0.00% 0 0.00% 0 0.00% 0 0.00% 1 1.96%
UNKNOWN 0 0.00% 0 0.00% 3 20.00% 0 0.00% 0 0.00% 4 7.84% TOTALS 5 100% 2 100% 15 100% 13 100% 32 100% 51 100%
Ethnicity of Tenure Track Full-time Faculty
A review of the tenured faculty data clearly reflects the efforts of the District to increase full-time
faculty. Full-time faculty recruitment is now done almost exclusively online. Coupled with increased
advertising dollars and focused outreach efforts, gains have been made to reach a broad and diverse
qualified applicant pool. Recruitments are discipline focused and website postings are a good venue
for outreach. Successful recruitment efforts on websites such as the Chronicle for Higher Learning,
HigherEdJobs.com, JobTarget.com, National Black Nurses Association, the Association of Black
0
5
10
15
20
25
2009-2010 2010-2011 2011-2012 2012-2013 2013-2014 2014-2015
AFR AM
AMR IND
ASIAN
CAUCASIAN
FILIPINO
HISPANIC
MULTI R
PAC ISL
UNKNOWN

29 | P a g e
Psychologists, National Association of Hispanic MBA’s, National Association of Asian American
Professionals, Association of Latino Professionals in Finance & Accounting, Society of Women
Engineers, and the National Black MBA Association reflect the District’s commitment to ethnic
diversity as seen in the statistics in this report.
To further educate and promote diversity, the District continues to ensure that its search and
selection committee members are diverse and are trained in Equal Employment Opportunity laws. It
is also reinforced that committee members are aware that they are charged with finding faculty
who are cognizant, open and most importantly, sensitive to understanding the socio-economic,
academic, cultural and ethnic diversity within the community college student populations, including
students with physical and/or learning disabilities, as these factors relate to differences in learning
styles.
GENDER
As with full-time faculty, female newly tenure track faculty members outnumber their male counterparts in most years.
Gender 2009-2010 2010-2011 2011-2012 2012-2013 2013-2014 2014-2015
No. % No. % No. % No. % No. % No. %
Female 2 40.00% 1 50.00% 12 75.00% 6 50% 20 62.50% 30 58.82%
Male 3 60.00% 1 50.00% 4 25.00% 6 50% 12 37.50% 21 41.18%
Totals 5 100% 2 100% 16 100% 12 100% 32 100% 51 100%
AGE
The age range of the tenure track faculty reflected in the 2014-2015 data are as follows:
Ages 20-29 Ages 30-39 Ages 40-49 Ages 50-59 Ages 60-69 Ages 70-79 80+
2 26 15 6 2 0 0
∞∞∞

30 | P a g e
Classified applicant pools
The Personnel Commission Office manages classified employment processes using NEOGOV as its
online application tracking system to process classified employment applications. During the 2013-
2014 as well as the 2014-2015 fiscal years there were 54 classified positions (not including internal
transfer positions) posted online:
Type of Classified Position 2012 - 2013 2013 - 2014 2014 - 2015 Classified support 24 45 43 Classified manager 1 8 9 Confidential 1 0 1 Police 2 1 1 Totals 28 54 54
Ethnicity
The number of applications received increased significantly during the review period of this report
and that the ethnicity of applicants shows great interest in employment opportunities with Santa
Monica College.
Without knowing whether or not the applicants are actually qualified for the positions for which
they applied, the statistics show that during the past two fiscal years, African American applicants
declined from 25.18% in 2013 to 21.07% in the 2014-2015 period; Caucasians declined from 25.01%
to 23.66%, and Filipino applications declined from 2.03% to 1.92%. However, the same period saw
an increase in the following ethnic group applications: Asian applications increased from 7.40% to
9.56%, Hispanic from 24.12% to 24.42%, and Pacific Islanders (Hawaii, Guam, Sumatra, etc.)
increased form 0.39% to 9.70%.
2012-2013 2013-2014 2014-2015 Ethnicity No. % No. % No. % AFR AMR 1,027 25.18% 1,022 24.16% 1,042 21.07% AMR IND 36 0.88% 16 0.38% 17 0.34% ASIAN 302 7.40% 378 8.94% 473 9.56% CAUCASIAN 1,020 25.01% 1,025 24.23% 1,170 23.66% FILIPINO 83 2.03% 79 1.87% 95 1.92% HISPANIC 984 24.12% 989 23.38% 1,208 24.42% MULTI-RACIAL 254 6.23% 199 4.70% 278 5.62% PAC ISLANDER 16 0.39% 363 8.58% 480 9.70% UNKNOWN 357 8.75% 159 3.76% 183 3.70% TOTALS 4,079 100% 4,230 100% 4,946 100%
Ethnicity of Classified Applicants

31 | P a g e
Gender
In the previous report, a significantly greater number of females applied for classified support
positions than male applicants – 60.58% female vs. 36.77% male; 2.65% of applicants listing
themselves as ‘unknown’.
Classified support applications reflect a closing of this ‘gender gap’ for the current report. The
unknown designation for gender increased. This could possibly be a sign of more awareness about
gender identification. It could also mean that the applicant tracking system may need review to
ensure there is an option for better self-identification.
AGE
The NeoGov system used by the Personnel Commission reports age of classified applicants using the
following three categories: “Under 40”, “40 or Older”, or “Unknown”.
The past two academic year reporting periods reflect the following information:
Age Group
2013-2014 2014-2015
No. % No. %
Under 40 2,732 64.59% 3,293 66.58%
40 or Older 1,082 25.58% 1,223 24.73%
Unknown 416 9.83% 430 8.69%
Total 4,230 100% 4,946 100%
∞∞∞
FEMALE 2,639
53.36%
MALE 2,097
42.40%
UNKNOWN 210
4.25%
Classified Support Applicants - Gender Fall 2014

32 | P a g e
Interpretation of the Academic data
In reviewing the Faculty Diversity Data by department, it was apparent that minority populations are
under-represented within SMC’s full-time and part-time faculty membership. Ensuring fair and
impartial non-discriminatory recruitment processes is a responsibility which is taken seriously and
responsibly by the Office of Human Resources and Administration. Progress to improve
representation is being made as positions become available for recruitment.
District Equal employment Opportunity PLAN
An Equal Employment Opportunity Board Policy and a Diversity Board Policy were approved in April
2010. In March, 2012, the District Policy Advisory Committee (DPAC) unanimously approved and
accepted the EEO Plan recommended by its Human Resources subcommittee. Since that time,
Federal Americans with Disabilities laws and regulations have been updated. Although the EEO Plan
is not mandatory, the Board of Trustees accepted and approved an EEO plan in November, 2012; it
can be found on the Santa Monica College-Human Resources website.7
Selection Committees
All participants serving on selection committees go through an orientation with Human Resources in
which they receive training on equal employment opportunity requirements, federal and state non-
discrimination laws. Training is presented in a manner to help committee members understand
SMC’s commitment to diversity and to non-discrimination. The Office of Human Resources and the
Personnel Commission Office ensure that committee members for all academic and classified
recruitments receive appropriate training prior to interaction with candidates.
Training
Specialized training emphasizing the benefits of diversity awareness, tolerance and ethical behavior
are ongoing for faculty and staff and are available through the Office of Human Resources. While
the District’s Professional Development Coordinator position remains vacant, academic, classified
and management professional development training options continue to be offered to employees
through the efforts of designated professional development committees and the Human Resources
Office.
7 http://www.smc.edu/HumanResources/HumanResourcesDepartment/Documents/EEO_Plan.pdf

33 | P a g e
HISTORICAL SUMMARY FROM 1990-2014
The District is making progress towards a diverse employee base but the pace is dependent of the
number of positions that become available for hires. Several factors inherent in the Santa Monica
Community College employment structure impact historical data.
One factor when reviewing employment category data is longevity. Just over a quarter of all full-
time faculty members, classified support personnel, and classified managers have been employed
with the District for 20 years or more. This is significant.
A second factor to consider is the age range of existing employees. When considering all employee
groups except the Police Officers (22% are over age 50), those age 50 and over comprise 59% of all
employees.
Another factor that influenced the historic overview of faculty and staff members has been career
advancement possibilities generated by transitional and promotional opportunities.
Employee Group Fall 2013 Fall 2014
Academic Administrators 45% 48%
Classified Managers 55% 74%
Confidential Staff 75% 67%
Classified Support Staff 52% 49%
Full-time Faculty 62% 64%
Part-time Faculty 54% 51%
Average of all employee groups 57% 59%
40.00%
45.00%
50.00%
55.00%
60.00%
65.00%
70.00%
75.00%
80.00%
Fall 2013 Fall 2014
AcademicAdministrators
ClassifiedManagers
Confidentials
ClassifiedSupport
Full-timeFaculty
Part-timeFaculty
34 | P a g e
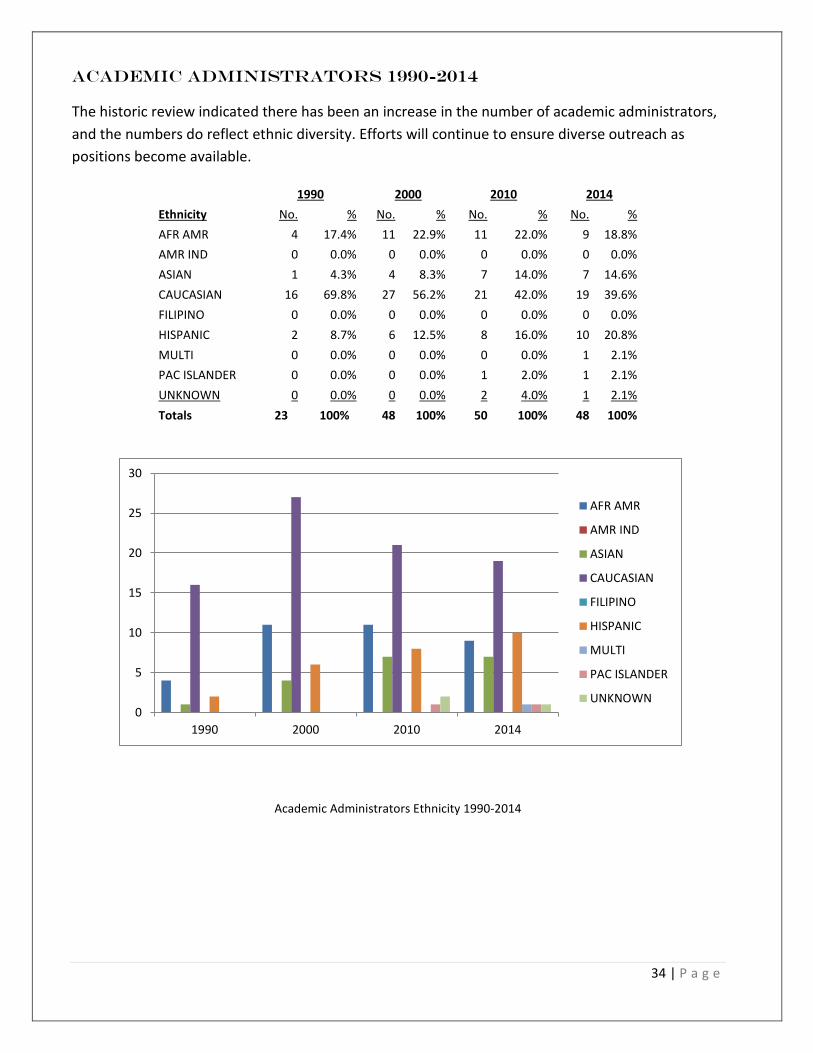
Academic Administrators 1990-2014
The historic review indicated there has been an increase in the number of academic administrators,
and the numbers do reflect ethnic diversity. Efforts will continue to ensure diverse outreach as
positions become available.
Ethnicity
1990 2000 2010 2014
No. % No. % No. % No. %
AFR AMR 4 17.4% 11 22.9% 11 22.0% 9 18.8%
AMR IND 0 0.0% 0 0.0% 0 0.0% 0 0.0%
ASIAN 1 4.3% 4 8.3% 7 14.0% 7 14.6%
CAUCASIAN 16 69.8% 27 56.2% 21 42.0% 19 39.6%
FILIPINO 0 0.0% 0 0.0% 0 0.0% 0 0.0%
HISPANIC 2 8.7% 6 12.5% 8 16.0% 10 20.8%
MULTI 0 0.0% 0 0.0% 0 0.0% 1 2.1%
PAC ISLANDER 0 0.0% 0 0.0% 1 2.0% 1 2.1%
UNKNOWN 0 0.0% 0 0.0% 2 4.0% 1 2.1%
Totals 23 100% 48 100% 50 100% 48 100%
Academic Administrators Ethnicity 1990-2014
0
5
10
15
20
25
30
1990 2000 2010 2014
AFR AMR
AMR IND
ASIAN
CAUCASIAN
FILIPINO
HISPANIC
MULTI
PAC ISLANDER
UNKNOWN
35 | P a g e
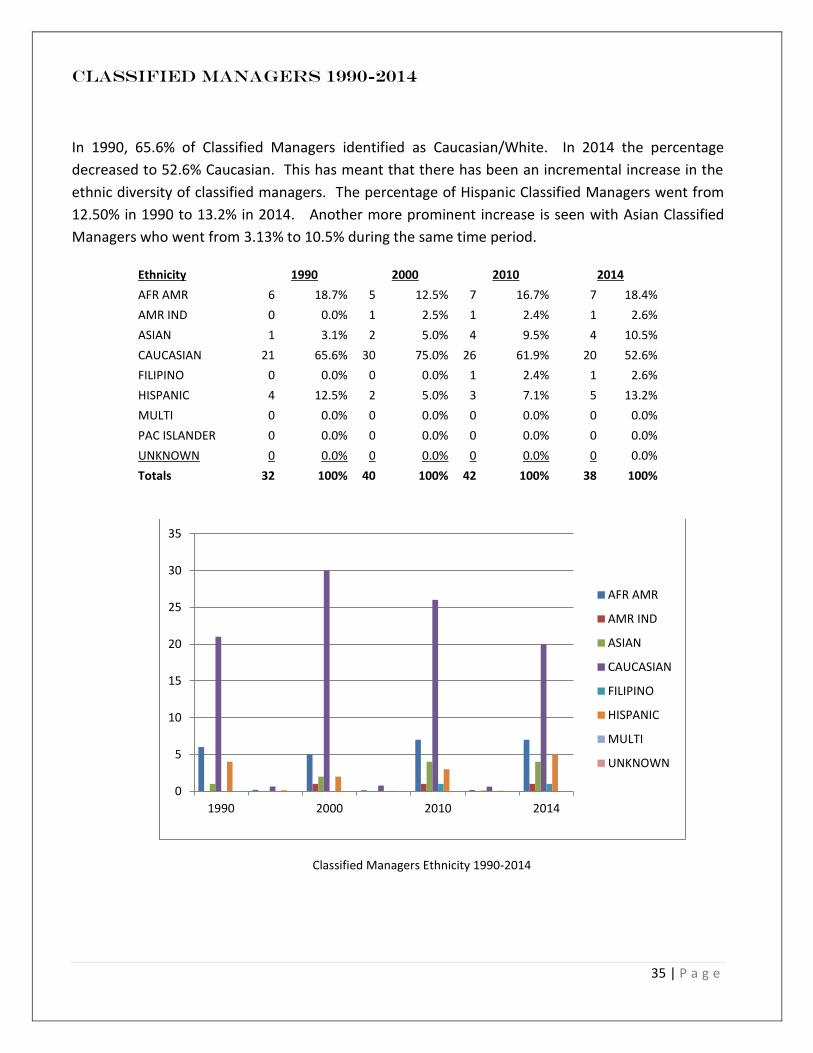
Classified Managers 1990-2014
In 1990, 65.6% of Classified Managers identified as Caucasian/White. In 2014 the percentage
decreased to 52.6% Caucasian. This has meant that there has been an incremental increase in the
ethnic diversity of classified managers. The percentage of Hispanic Classified Managers went from
12.50% in 1990 to 13.2% in 2014. Another more prominent increase is seen with Asian Classified
Managers who went from 3.13% to 10.5% during the same time period.
Ethnicity 1990 2000 2010 2014
AFR AMR 6 18.7% 5 12.5% 7 16.7% 7 18.4%
AMR IND 0 0.0% 1 2.5% 1 2.4% 1 2.6%
ASIAN 1 3.1% 2 5.0% 4 9.5% 4 10.5%
CAUCASIAN 21 65.6% 30 75.0% 26 61.9% 20 52.6%
FILIPINO 0 0.0% 0 0.0% 1 2.4% 1 2.6%
HISPANIC 4 12.5% 2 5.0% 3 7.1% 5 13.2%
MULTI 0 0.0% 0 0.0% 0 0.0% 0 0.0%
PAC ISLANDER 0 0.0% 0 0.0% 0 0.0% 0 0.0%
UNKNOWN 0 0.0% 0 0.0% 0 0.0% 0 0.0%
Totals 32 100% 40 100% 42 100% 38 100%
Classified Managers Ethnicity 1990-2014
0
5
10
15
20
25
30
35
1990 2000 2010 2014
AFR AMR
AMR IND
ASIAN
CAUCASIAN
FILIPINO
HISPANIC
MULTI
UNKNOWN

36 | P a g e
Classified Support Personnel 1990-2014
Over the past three decades diversity outreach efforts have been most successful in the Classified
Support Staff employment group. The applicant data does not indicate whether the applicants
meet qualifications for the positions for which they applied; but, the fact that the District had a large
number of ethnically diverse classified support personnel does suggest that the implementation of
the online application system expanded the District’s outreach which increased ethnic
representation within this employment group. There has been an increase in the unknown ethnic
data indicating that the employees chose not to self-identify their ethnicity.
Ethnicity 1990 2000 2010 2014
AFR AMR 84 20.69% 119 24.95% 118 25.00% 100 22.9%
AMR INDIAN 3 0.74% 5 1.05% 1 0.21% 0 0.0%
ASIAN 26 6.40% 34 7.13% 35 7.42% 40 9.2%
CAUCASIAN 239 58.87% 210 44.03% 176 37.29% 148 33.9%
FILIPINO 4 0.99% 9 1.89% 12 2.54% 11 2.5%
HISPANIC 50 12.32% 100 20.96% 113 23.94% 117 26.8%
MULTI-RACES 0 0.00% 0 0.00% 3 0.64% 1 0.2%
PAC ISL 0 0.00% 0 0.00% 0 0.00% 0 0.0%
UNKNOWN 0 0.00% 0 0.00% 14 2.97% 20 4.6%
TOTALS 406 100.00% 477 100.00% 472 100.00% 437 100%
Classified Support Personnel 1990-2014
0
50
100
150
200
250
300
1990 2000 2010 2014
AFR AMR
AMR INDIAN
ASIAN
CAUCASIAN
FILIPINO
HISPANIC
MULTI-RACES
PAC ISL
UNKNOWN

37 | P a g e
Full-time Faculty 1990-2014
Santa Monica Community College District wants more full-time faculty. The Board of Trustees has
set the hiring of more full-time faculty as a priority over the years. Administration fully supports this
goal and approved recruitments have yielded good results with improving ethnically diverse
representation. There is much work to do in terms of extending outreach to disciplines which have
limited or no ethnically diverse faculty within departments.
Annually academic and student support departments identify and request the number of full-time
faculty positions needed. A list is generated and positions are ranked through a collaborate process
between the Academic Senate and Administration. From this list the Superintendent/President
selects the disciplines which will be granted approval for recruitments and the number of full-time
faculty that are hired for the next academic year.
The Superintendent/President is ultimately responsible for and selects all new full-time, tenure
track faculty.
In reviewing the new hires that have occurred during the time frame of this report and the data that
will be used for Fall 2015 (which is not contained in this report), immediate past
Superintendent/President Chui L. Tsang helped make progress towards a more ethnically diverse
full-time, tenure track faculty group.
Ethnicity 1990 2000 2010 2014
AFR AMR 27 10.23% 31 9.63% 36 11.61% 35 11.3%
AMR IND 2 0.76% 1 0.31% 0 0.10% 0 0.0%
ASIAN 11 4.17% 25 7.76% 28 9.03% 38 12.2%
CAUCASIAN 202 76.52% 225 69.88% 198 63.87% 183 58.8%
FILIPINO 2 0.76% 4 1.24% 3 1.52% 3 1.0%
HISPANIC 20 7.58% 36 11.18% 41 13.23% 46 14.8%
MULTI 0 0.00% 0 0 0 0.00% 1 0.3%
PAC ISLANDER 0 0.00% 0 0 0 0.00% 1 0.3%
UNKNOWN 0 0.00% 0 0 4 1.29% 4 1.3%
Totals 264 100.00% 322 100.00% 310 100.00% 311 100%
Full-time Faculty Ethnicity 1990-2014
0
50
100
150
200
250
1990 2000 2010 2014
AFR AMR
AMR IND
ASIAN
CAUCASIAN
FILIPINO
HISPANIC
MULTI

38 | P a g e
Part-time Faculty 1990-2014
Ethnicity 1990 2000 2010 2014
AFR AMR 35 6.2% 81 9.0% 81 8.1% 89 8.2%
AMR IND 4 0.7% 4 0.4% 2 0.2% 1 0.1%
ASIAN 36 6.3% 58 6.4% 78 7.8% 94 8.7%
CAUCASIAN 464 81.7% 666 73.7% 660 66.4% 699 64.4%
FILIPINO 1 0.2% 10 1.1% 6 0.6% 8 0.7%
HISPANIC 27 4.7% 66 7.3% 77 7.7% 119 11.0%
MULTI 0 0.0% 0 0.0% 5 0.5% 14 1.3%
PAC ISLANDER 0 0.0% 0 0.0% 3 0.3% 5 0.5%
UNKNOWN 1 0.2% 18 2.0% 82 8.2% 56 5.2%
Totals 568 100% 903 100% 994 100% 1,085 100%
Part-time Faculty Ethnicity 1990-2014
Diversification efforts in all employee categories are evidenced by slow but steady progress towards
a diverse ethnicity more representative of the county and student body. In a county whose Hispanic
demographic majority is currently at 48% and growing, however, it is clear that SMC must continue
to expand its outreach not only to the Hispanic community but to all ethnic minority populations.
∞∞∞
0
100
200
300
400
500
600
700
800
1990 2000 2010 2014
AFR AMR
AMR IND
ASIAN
CAUCASIAN
FILIPINO
HISPANIC
MULTI
PAC ISLANDER
UNKNOWN

39 | P a g e
GLOBAL CONNECTIVITY
Incorporating Web-based and more focused print advertising for specific, hard to fill positions has
helped SMC to generate more diverse applicant pools from national and international sources.
In conclusion, Santa Monica College is nestled within one of the most diverse regions of our country.
The student body reflects this diversity on a global scale. SMC is committed to insuring that its
employees reflect the diversity of the students and communities served by this unique Community
College District. To that end, we are focused on creating an environment that recognizes and
welcomes all members of the college community. The Board of Trustees supports efforts initiated by
the Human Resources Office and the Personnel Commission Office to ensure equitable and
responsible hiring processes and practices.
ACKNOWLEDGEMENT
Sincere gratitude and acknowledgement is expressed to Laurie Heyman of the Human Resources
Office for design and analytical assistance in the preparation of this report, to the Office of
Institutional Research, Dean Sherri Lee-Lewis, Delia Padilla Acosta and Alan Kuykendall, of the HR
Office and to Personnel Commission Director Carol Long and the staff of the Personnel Commission
Office for assisting in the collection of the data.
Marcia M. Wade
Vice President, Human Resources
40 | P a g e
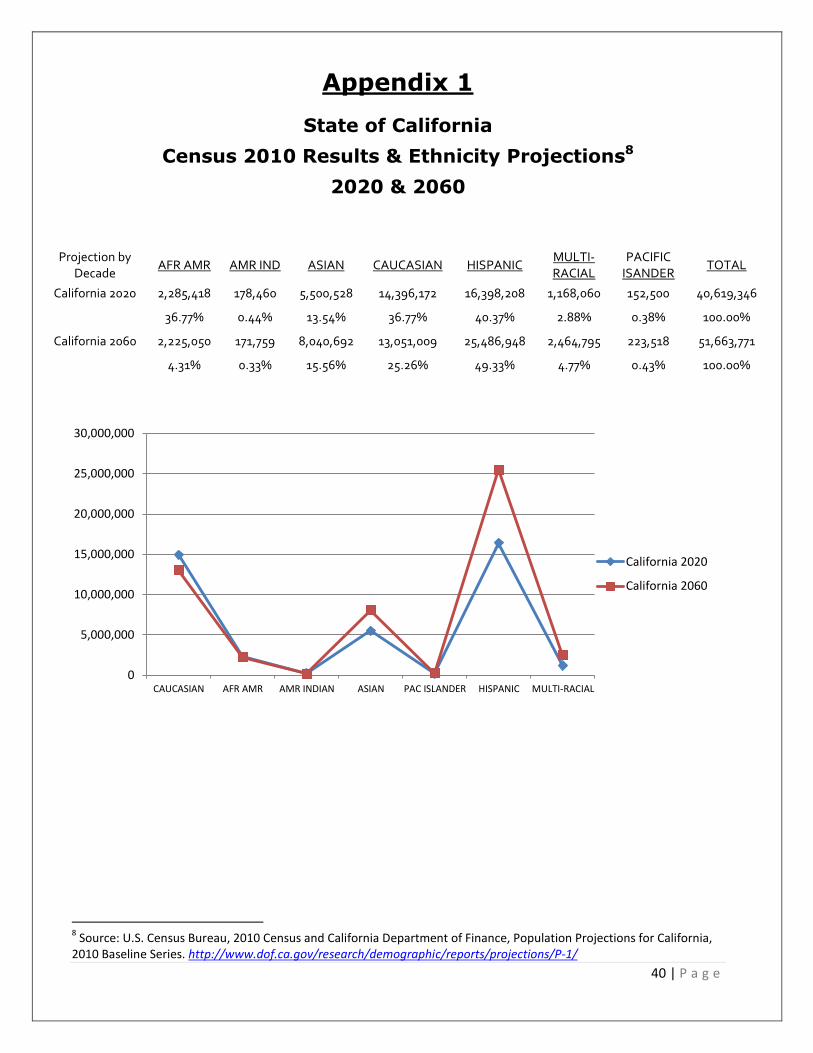
Appendix 1
State of California
Census 2010 Results & Ethnicity Projections8
2020 & 2060
Projection by Decade
AFR AMR AMR IND ASIAN CAUCASIAN HISPANIC MULTI-RACIAL
PACIFIC ISANDER
TOTAL
California 2020 2,285,418 178,460 5,500,528 14,396,172 16,398,208 1,168,060 152,500 40,619,346
36.77% 0.44% 13.54% 36.77% 40.37% 2.88% 0.38% 100.00%
California 2060 2,225,050 171,759 8,040,692 13,051,009 25,486,948 2,464,795 223,518 51,663,771
4.31% 0.33% 15.56% 25.26% 49.33% 4.77% 0.43% 100.00%
8 Source: U.S. Census Bureau, 2010 Census and California Department of Finance, Population Projections for California,
2010 Baseline Series. http://www.dof.ca.gov/research/demographic/reports/projections/P-1/
0
5,000,000
10,000,000
15,000,000
20,000,000
25,000,000
30,000,000
CAUCASIAN AFR AMR AMR INDIAN ASIAN PAC ISLANDER HISPANIC MULTI-RACIAL
California 2020
California 2060
41 | P a g e
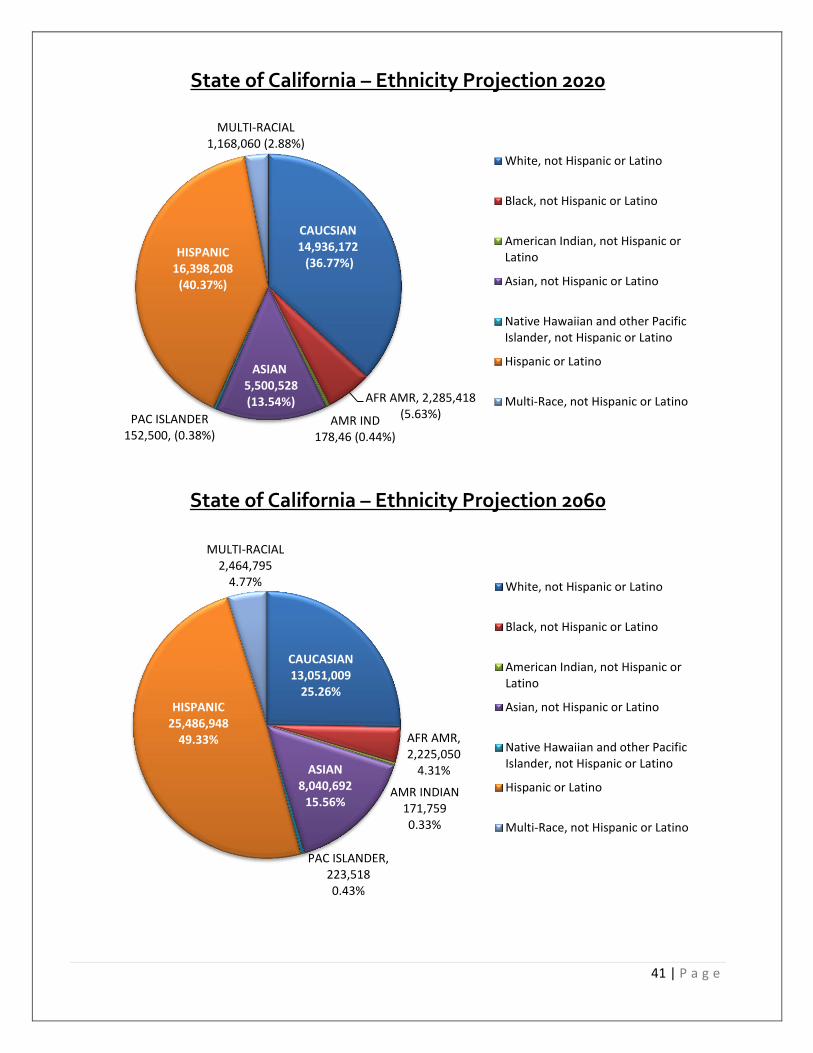
State of California – Ethnicity Projection 2020
State of California – Ethnicity Projection 2060
CAUCSIAN 14,936,172 (36.77%)
AFR AMR, 2,285,418 (5.63%)
AMR IND 178,46 (0.44%)
ASIAN 5,500,528 (13.54%)
PAC ISLANDER 152,500, (0.38%)
HISPANIC 16,398,208
(40.37%)
MULTI-RACIAL 1,168,060 (2.88%)
White, not Hispanic or Latino
Black, not Hispanic or Latino
American Indian, not Hispanic orLatino
Asian, not Hispanic or Latino
Native Hawaiian and other PacificIslander, not Hispanic or Latino
Hispanic or Latino
Multi-Race, not Hispanic or Latino
CAUCASIAN 13,051,009
25.26%
AFR AMR, 2,225,050
4.31%
AMR INDIAN 171,759 0.33%
ASIAN 8,040,692
15.56%
PAC ISLANDER, 223,518 0.43%
HISPANIC 25,486,948
49.33%
MULTI-RACIAL 2,464,795
4.77% White, not Hispanic or Latino
Black, not Hispanic or Latino
American Indian, not Hispanic orLatino
Asian, not Hispanic or Latino
Native Hawaiian and other PacificIslander, not Hispanic or Latino
Hispanic or Latino
Multi-Race, not Hispanic or Latino

42 | P a g e
Appendix 2
County of Los Angeles
Ethnic Projections 2020 & 20609
Ethnicity projections over the next five decades show an increase in the Hispanic population, and
a corresponding decrease in the Caucasian/White population of almost equal proportions. In the Asian
and Native Hawaiian/Pacific Islander populations, a slight increase is projected while other ethnic
groups’ numbers are projected to decrease slightly in the county. The exception to this is the Multi-Race
category which is slated to grow from 1.86% to 3.07% of the total population.
Projection by Decade
AFR AMR AMR IND ASIAN CAUCASIAN HISPANIC MULTI-RACIAL
PACIFIC ISLANDER
TOTAL
LA County 2020 837,517 19,534 1,447,085 2,585,846 5,297,419 224,222 24,368 10,435,991
8.03% 0.19% 13.87% 24.78% 50.76% 2.15% 0.23% 100.00%
LA County 2060 692,070 13,355 1,619,015 1,846,766 6,877,707 411,901 28,313 11,489,127
6.02% 0.12% 14.09% 16.07% 59.86% 3.59% 0.25% 100.00%
County of Los Angeles - Ethnicity Projection 2020
9Source: State of California, Department of Finance, Report P-1 (Race): State and County Population Projections by Race/Ethnicity, 2010-2060.
Sacramento, California, January 2013. http://www.dof.ca.gov/research/demographic/reports/projections/P-1/
0
1,000,000
2,000,000
3,000,000
4,000,000
5,000,000
6,000,000
7,000,000
8,000,000
LA County 2020
LA County 2060

43 | P a g e
County of Los Angeles - Ethnicity Projection 2060
Caucasian/White 2,585,846
24.78%
African American 837,517 8.03%
Native American 19,534 0.19%
Asian 1,447,085 13.87%
Pacific Islander 24,368 0.23%
Hispanic 5,297,419
50.76%
Multi-racial 224,222 2.15%
CAUCASIAN/ White
AFR AMR/ Black
American Indian
Asian
Native Hawaiian/ Pacific Islander
Hispanic or Latino
Multi-Race
Caucasian 1,846,766
16.07%
African American 692,070 6.02%
Native American 13,355 0.12% Asian
1,619,015 14.09%
Pacific Islander 28,313 0.25%
Hispanic 6,877,707
59.86%
Multi-racial 411,901 3.59%
CAUCASIAN/ White
AFR AMR/ Black
American Indian
Asian
Native Hawaiian/ Pacific Islander
Hispanic or Latino
Multi-Race

44 | P a g e
Appendix 3
Ethnicity by Employee Group 2006-2014
Academic Administrators
Classified Managers
Confidential Support Staff
Classified Support Staff
Community College Police Officers
Full-Time Faculty
Part-Time Faculty

Santa Monica CollegeEthnicity of Employee Groups
2006-2014
* Data effective 1st day of Fall Semester for each Academic Year listed. Page 1 of 7 9/28/2015
No. % No. % No. % No. % No. % No. % No. % No. % No. % No. %
2006-2007 8 18.18% 0 0.00% 6 13.64% 21 47.73% 2 4.55% 7 15.91% 0 0.00% 0 0.00% 0 0.00% 44 100.00%2007-2008 9 19.57% 0 0.00% 4 8.70% 21 45.65% 2 4.35% 5 10.87% 0 0.00% 0 0.00% 5 10.87% 46 100.00%2008-2009 13 24.53% 0 0.00% 4 7.55% 21 39.62% 2 3.77% 6 11.32% 0 0.00% 1 1.89% 6 11.32% 53 100.00%2009-2010 13 25.49% 0 0.00% 7 13.73% 19 37.25% 0 0.00% 7 13.73% 0 0.00% 1 1.96% 4 7.84% 51 100.00%2010-2011 11 22.00% 0 0.00% 7 14.00% 21 42.00% 0 0.00% 8 16.00% 0 0.00% 1 2.00% 2 4.00% 50 100.00%2011-2012 10 21.74% 0 0.00% 7 15.22% 20 43.48% 0 0.00% 6 13.04% 1 2.17% 1 2.17% 1 2.17% 46 100.00%2012-2013 9 18.75% 0 0.00% 7 14.58% 21 43.75% 0 0.00% 7 14.58% 2 4.17% 1 2.08% 1 2.08% 48 100.00%2013-2014 9 20.00% 0 0.00% 7 15.60% 20 44.40% 0 0.00% 6 13.30% 1 2.20% 1 2.20% 1 2.20% 45 100.00%2014-2015 9 18.80% 0 0.00% 7 14.60% 19 39.60% 0 0.00% 10 20.80% 1 2.10% 1 2.10% 1 2.10% 48 100.00%
Academic Administrators
AFR AMR AMR INDIAN ASIAN CAUCASIAN FILIPINO MULTI-RACIAL PAC ISLANDER UNKNOWN TOTALHISPANIC
0
5
10
15
20
25
African American
AMR IND
ASIAN
CAUCASIAN
FILIPINO
HISPANIC
MULTI-RACIAL
PAC ISLANDER
UNKNOWN

Santa Monica CollegeEthnicity of Employee Groups
2006-2014
* Data effective 1st day of Fall Semester for each Academic Year listed. Page 2 of 7 9/28/2015
No. % No. % No. % No. % No. % No. % No. % No. % No. % No. %
2006-2007 5 15.15% 1 3.03% 3 9.09% 22 66.67% 0 0.00% 2 6.06% 0 0.00% 0 0.00% 0 0.00% 33 100.00%2007-2008 5 14.71% 1 2.94% 3 8.82% 22 64.71% 0 0.00% 3 8.82% 0 0.00% 0 0.00% 0 0.00% 34 100.00%2008-2009 6 17.65% 1 2.94% 3 8.82% 22 64.71% 0 0.00% 2 5.88% 0 0.00% 0 0.00% 0 0.00% 34 100.00%2009-2010 7 17.07% 1 2.44% 3 7.32% 27 65.85% 1 2.44% 2 4.88% 0 0.00% 0 0.00% 0 0.00% 41 100.00%2010-2011 7 16.67% 1 2.38% 4 9.52% 26 61.90% 1 2.38% 3 7.14% 0 0.00% 0 0.00% 0 0.00% 42 100.00%2011-2012 7 17.07% 1 2.44% 4 9.76% 24 58.54% 1 2.44% 4 9.76% 0 0.00% 0 0.00% 0 0.00% 41 100.00%2012-2013 8 18.18% 1 2.27% 4 9.09% 26 59.09% 1 2.27% 3 6.82% 1 2.27% 0 0.00% 0 0.00% 44 100.00%2013-2014 8 19.50% 1 2.40% 4 9.80% 22 53.70% 1 2.40% 4 9.80% 1 2.40% 0 0.00% 0 0.00% 41 100.00%2014-2015 7 18.40% 1 2.60% 4 10.50% 20 52.60% 1 2.60% 5 13.20% 0 0.00% 0 0.00% 0 0.00% 38 100.00%
TOTALAFR AMR AMR INDIAN ASIAN CAUCASIAN FILIPINO HISPANIC MULTI-RACIAL PAC ISLANDER UNKNOWN
Classified Managers
0
5
10
15
20
25
30
AFR AMR
AMR INDIAN
ASIAN
CAUCASIAN
FILIPINO
HISPANIC
MULTI-RACIAL
PAC ISLANDER
UNKNOWN

Santa Monica CollegeEthnicity of Employee Groups
2006-2014
* Data effective 1st day of Fall Semester for each Academic Year listed. Page 3 of 7 9/28/2015
No. % No. % No. % No. % No. % No. % No. % No. % No. % No. %
2006-2007 3 37.50% 0 0.00% 0 0.00% 3 37.50% 0 0.00% 2 25.00% 0 0.00% 0 0.00% 0 0.00% 8 100.00%2007-2008 2 28.57% 0 0.00% 0 0.00% 3 42.86% 0 0.00% 2 28.57% 0 0.00% 0 0.00% 0 0.00% 7 100.00%2008-2009 2 33.33% 0 0.00% 0 0.00% 3 50.00% 0 0.00% 1 16.67% 0 0.00% 0 0.00% 0 0.00% 6 100.00%2009-2010 2 28.57% 0 0.00% 0 0.00% 3 42.86% 0 0.00% 2 28.57% 0 0.00% 0 0.00% 0 0.00% 7 100.00%2010-2011 2 28.57% 0 0.00% 0 0.00% 3 42.86% 0 0.00% 2 28.57% 0 0.00% 0 0.00% 0 0.00% 7 100.00%2011-2012 2 25.00% 0 0.00% 1 12.50% 3 37.50% 0 0.00% 2 25.00% 0 0.00% 0 0.00% 0 0.00% 8 100.00%2012-2013 2 25.00% 0 0.00% 1 12.50% 3 37.50% 0 0.00% 2 25.00% 0 0.00% 0 0.00% 0 0.00% 8 100.00%2013-2014 2 25.00% 0 0.00% 2 25.00% 3 37.50% 0 0.00% 1 12.50% 0 0.00% 0 0.00% 0 0.00% 8 100.00%2014-2015 0 0.00% 0 0.00% 2 33.33% 3 50.00% 0 0.00% 1 16.67% 0 0.00% 0 0.00% 0 0.00% 6 100.00%
Confidential Staff AFR AMR AMR INDIAN ASIAN CAUCASIAN TOTALFILIPINO HISPANIC MULTI-RACIAL PAC ISLANDER UNKNOWN
0
0.5
1
1.5
2
2.5
3
3.5
AFR AMR
AMR INDIAN
ASIAN
CAUCASIAN
FILIPINO
HISPANIC
MULTI-RACIAL
PAC ISLANDER
UNKNOWN

Santa Monica CollegeEthnicity of Employee Groups
2006-2014
* Data effective 1st day of Fall Semester for each Academic Year listed. Page 4 of 7 9/28/2015
No. % No. % No. % No. % No. % No. % No. % No. % No. % No. %
2006-2007 107 25.30% 1 0.24% 33 7.80% 160 37.83% 12 2.84% 100 23.64% 0 0.00% 0 0.00% 10 2.36% 423 100.00%2007-2008 110 26.00% 1 0.24% 29 6.86% 160 37.83% 12 2.84% 98 23.17% 0 0.00% 0 0.00% 13 3.07% 423 100.00%
2008-2009 121 26.65% 1 0.22% 35 7.71% 162 35.68% 12 2.64% 109 24.01% 0 0.00% 0 0.00% 14 3.08% 454 100.00%2009-2010 123 25.79% 1 0.21% 36 7.55% 174 36.48% 11 2.31% 115 24.11% 0 0.00% 0 0.00% 17 3.56% 477 100.00%2010-2011 118 25.00% 1 0.21% 35 7.42% 176 37.29% 12 2.54% 113 23.94% 3 0.64% 0 0.00% 14 2.97% 472 100.00%2011-2012 114 24.20% 1 0.21% 39 8.28% 173 36.73% 12 2.55% 117 24.84% 3 0.64% 0 0.00% 12 2.55% 471 100.00%2012-2013 109 23.70% 0 0.00% 40 8.70% 168 36.52% 13 2.83% 115 25.00% 3 0.65% 0 0.00% 12 2.61% 460 100.01%2013-2014 105 24.20% 0 0.00% 38 8.80% 156 35.90% 11 2.50% 108 24.90% 1 0.20% 0 0.00% 15 3.50% 434 100.00%2014-2015 100 22.90% 0 0.00% 40 9.20% 148 33.90% 11 2.50% 117 26.80% 1 0.20% 0 0.00% 20 4.60% 437 100.10%
TOTALAFR AMR AMR INDIAN ASIAN CAUCASIAN FILIPINO HISPANIC MULTI-RACIAL PAC ISLANDER UNKNOWNClassified Support
0
20
40
60
80
100
120
140
160
180
200
AFR AMR
AMR INDIAN
ASIAN
CAUCASIAN
FILIPINO
HISPANIC
MULTI-RACIAL
PAC ISLANDER
UNKNOWN

Santa Monica CollegeEthnicity of Employee Groups
2006-2014
* Data effective 1st day of Fall Semester for each Academic Year listed. Page 5 of 7 9/28/2015
No. % No. % No. % No. % No. % No. % No. % No. % No. % No. %
2006-2007 3 25.00% 0 0.00% 0 0.00% 6 50.00% 0 0.00% 3 25.00% 0 0.00% 0 0.00% 0 0.00% 12 100.00%2007-2008 3 25.00% 0 0.00% 0 0.00% 6 50.00% 0 0.00% 3 25.00% 0 0.00% 0 0.00% 0 0.00% 12 100.00%2008-2009 3 25.00% 0 0.00% 0 0.00% 5 41.67% 0 0.00% 4 33.33% 0 0.00% 0 0.00% 0 0.00% 12 100.00%2009-2010 3 27.27% 0 0.00% 0 0.00% 4 36.36% 0 0.00% 4 36.36% 0 0.00% 0 0.00% 0 0.00% 11 100.00%2010-2011 3 27.27% 0 0.00% 0 0.00% 4 36.36% 0 0.00% 4 36.36% 0 0.00% 0 0.00% 0 0.00% 11 100.00%2011-2012 3 27.27% 0 0.00% 0 0.00% 5 45.45% 0 0.00% 3 27.27% 0 0.00% 0 0.00% 0 0.00% 11 100.00%2012-2013 1 11.11% 0 0.00% 1 11.11% 3 33.33% 0 0.00% 4 44.44% 0 0.00% 0 0.00% 0 0.00% 9 100.00%2013-2014 1 12.50% 0 0.00% 1 12.50% 3 37.50% 0 0.00% 3 37.50% 0 0.00% 0 0.00% 0 0.00% 8 100.00%2014-2015 2 22.22% 0 0.00% 1 11.11% 3 33.33% 0 0.00% 3 33.33% 0 0.00% 0 0.00% 0 0.00% 9 100.00%
Community College Police Officers
AFR AMR AMR INDIAN ASIAN CAUCASIAN FILIPINO HISPANIC MULTI-RACIAL PAC ISLANDER UNKNOWN TOTAL
0
1
2
3
4
5
6
7
AFR AMR
AMR INDIAN
ASIAN
CAUCASIAN
FILIPINO
HISPANIC
MULTI-RACIAL
PAC ISLANDER
UNKNOWN
Santa Monica CollegeEthnicity of Employee Groups
2006-2014
* Data effective 1st day of Fall Semester for each Academic Year listed. Page 6 of 7 9/28/2015
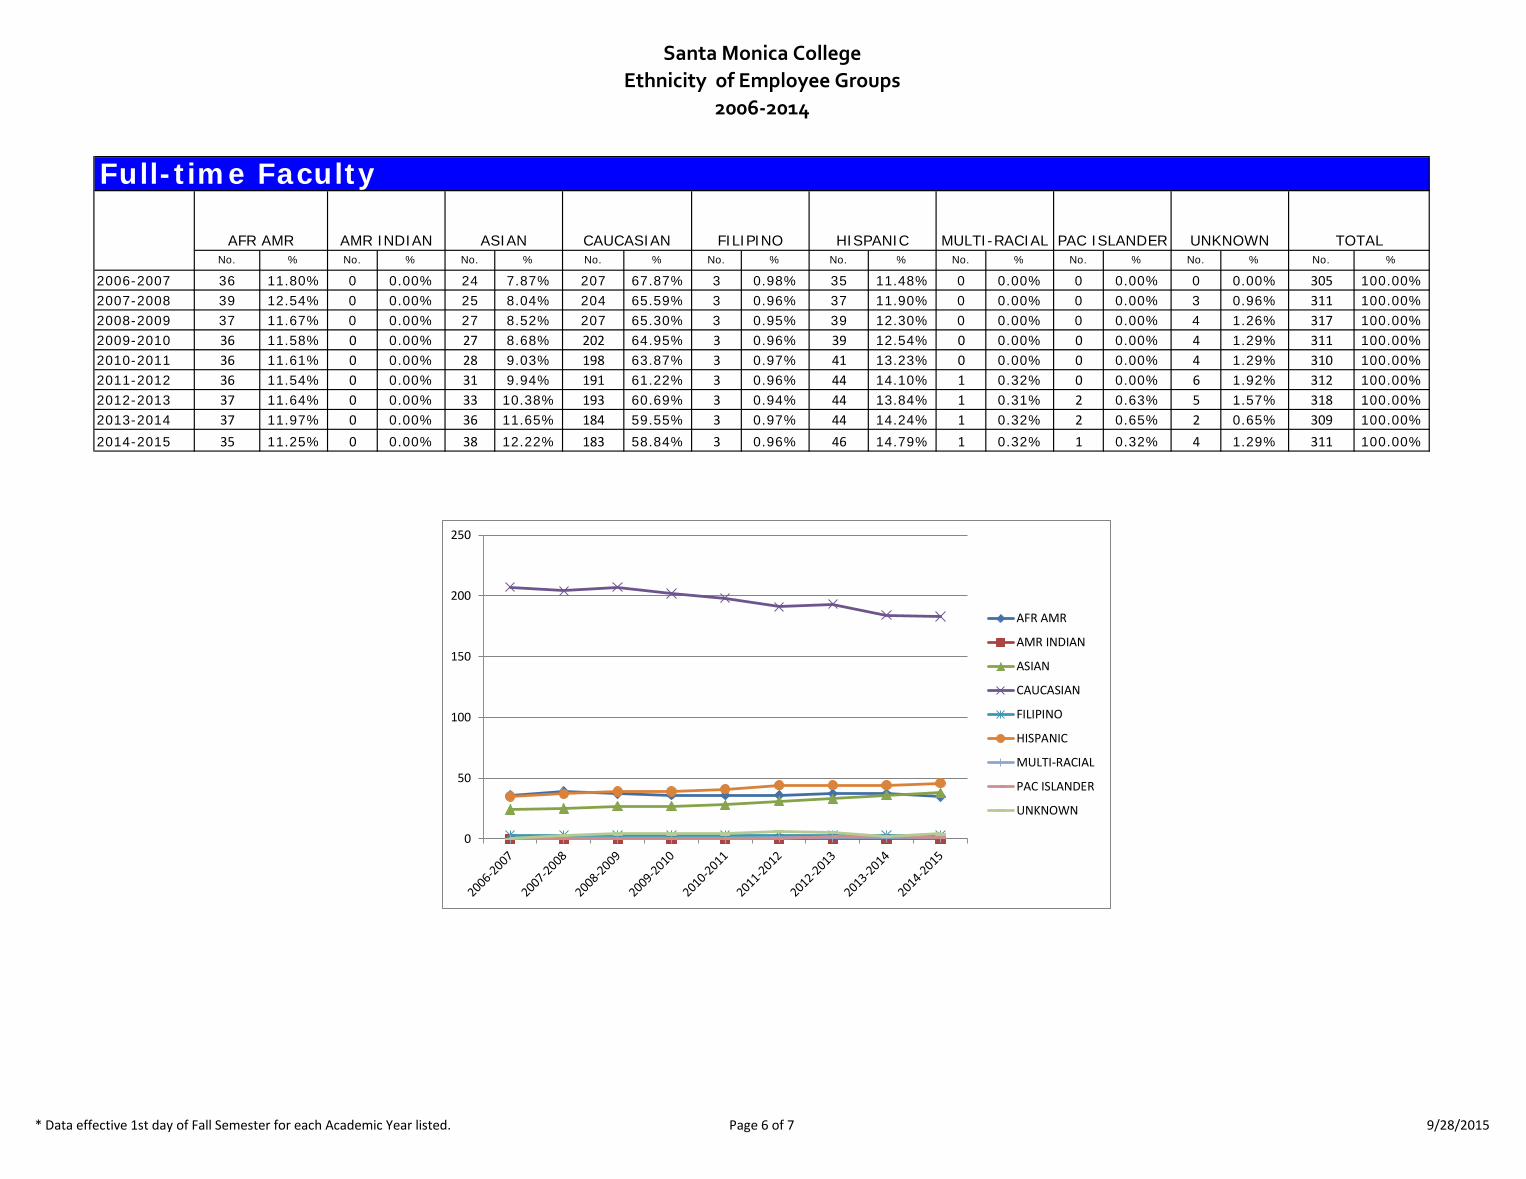
No. % No. % No. % No. % No. % No. % No. % No. % No. % No. %
2006-2007 36 11.80% 0 0.00% 24 7.87% 207 67.87% 3 0.98% 35 11.48% 0 0.00% 0 0.00% 0 0.00% 305 100.00%2007-2008 39 12.54% 0 0.00% 25 8.04% 204 65.59% 3 0.96% 37 11.90% 0 0.00% 0 0.00% 3 0.96% 311 100.00%2008-2009 37 11.67% 0 0.00% 27 8.52% 207 65.30% 3 0.95% 39 12.30% 0 0.00% 0 0.00% 4 1.26% 317 100.00%2009-2010 36 11.58% 0 0.00% 27 8.68% 202 64.95% 3 0.96% 39 12.54% 0 0.00% 0 0.00% 4 1.29% 311 100.00%2010-2011 36 11.61% 0 0.00% 28 9.03% 198 63.87% 3 0.97% 41 13.23% 0 0.00% 0 0.00% 4 1.29% 310 100.00%2011-2012 36 11.54% 0 0.00% 31 9.94% 191 61.22% 3 0.96% 44 14.10% 1 0.32% 0 0.00% 6 1.92% 312 100.00%2012-2013 37 11.64% 0 0.00% 33 10.38% 193 60.69% 3 0.94% 44 13.84% 1 0.31% 2 0.63% 5 1.57% 318 100.00%2013-2014 37 11.97% 0 0.00% 36 11.65% 184 59.55% 3 0.97% 44 14.24% 1 0.32% 2 0.65% 2 0.65% 309 100.00%2014-2015 35 11.25% 0 0.00% 38 12.22% 183 58.84% 3 0.96% 46 14.79% 1 0.32% 1 0.32% 4 1.29% 311 100.00%
TOTALAFR AMR FILIPINO HISPANIC
Full-time Faculty
MULTI-RACIAL PAC ISLANDER UNKNOWNAMR INDIAN ASIAN CAUCASIAN
0
50
100
150
200
250
AFR AMR
AMR INDIAN
ASIAN
CAUCASIAN
FILIPINO
HISPANIC
MULTI-RACIAL
PAC ISLANDER
UNKNOWN

Santa Monica CollegeEthnicity of Employee Groups
2006-2014
* Data effective 1st day of Fall Semester for each Academic Year listed. Page 7 of 7 9/28/2015
No. % No. % No. % No. % No. % No. % No. % No. % No. % No. %
2006-2007 88 8.42% 1 0.10% 61 5.84% 668 63.92% 5 0.48% 73 6.99% 1 0.10% 1 0.10% 147 14.07% 1,045 100.00%2007-2008 84 7.84% 1 0.09% 76 7.09% 710 66.23% 4 0.37% 72 6.72% 1 0.09% 2 0.19% 122 11.38% 1,072 100.00%2008-2009 87 7.87% 1 0.09% 81 7.32% 708 64.01% 6 0.54% 80 7.23% 1 0.09% 2 0.18% 140 12.66% 1,106 100.00%2009-2010 94 9.16% 1 0.10% 77 7.50% 664 64.72% 7 0.68% 76 7.41% 1 0.10% 2 0.19% 104 10.14% 1,026 100.00%2010-2011 81 8.15% 2 0.20% 78 7.85% 660 66.40% 6 0.60% 77 7.75% 5 0.50% 3 0.30% 82 8.25% 994 100.00%2011-2012 71 7.66% 2 0.22% 80 8.63% 633 68.28% 5 0.54% 74 7.98% 7 0.76% 4 0.43% 51 5.50% 927 100.00%2012-2013 76 7.47% 1 0.10% 96 9.43% 678 66.60% 8 0.79% 98 9.63% 8 0.79% 4 0.39% 49 4.81% 1,018 100.00%2013-2014 80 7.48% 1 0.09% 95 8.89% 712 66.60% 8 0.75% 109 10.20% 14 1.31% 4 0.37% 46 4.30% 1,069 100.00%
2014-2015 89 8.20% 1 0.09% 94 8.66% 699 64.42% 8 0.74% 119 10.97% 14 1.29% 5 0.46% 56 5.16% 1,085 100.00%
TOTALAFR AMR AMR INDIAN ASIAN CAUCASIAN FILIPINO HISPANIC MULTI-RACIAL PAC ISLANDER UNKNOWN
Part-time Faculty
0
100
200
300
400
500
600
700
800
AFR AMR
AMR INDIAN
ASIAN
CAUCASIAN
FILIPINO
HISPANIC
MULTI-RACIAL
PAC ISLANDER
UNKNOWN

45 | P a g e
Appendix 4
Full-Time Faculty by Department

Santa Monica College
Full-time Faculty
Ethnicity by Department
2006-2014
Number % Number % Number % Number % Number % Number % Number % Number % Number %
ART 2006 1 10.00% 0 0.00% 0 0.00% 8 80.00% 0 0.00% 1 10.00% 0 0.00% 0 0.00% 10 100.00%
ART 2007 1 11.11% 0 0.00% 0 0.00% 7 77.78% 0 0.00% 1 11.11% 0 0.00% 0 0.00% 9 100.00%
ART 2008 1 11.11% 0 0.00% 0 0.00% 7 77.78% 0 0.00% 1 11.11% 0 0.00% 0 0.00% 9 100.00%
ART 2009 1 11.11% 0 0.00% 0 0.00% 7 77.78% 0 0.00% 1 11.11% 0 0.00% 0 0.00% 9 100.00%
ART 2010 1 10.00% 0 0.00% 0 0.00% 8 80.00% 0 0.00% 1 10.00% 0 0.00% 0 0.00% 10 100.00%
ART 2011 1 10.00% 0 0.00% 0 0.00% 8 80.00% 0 0.00% 1 10.00% 0 0.00% 0 0.00% 10 100.00%
ART 2012 1 11.11% 0 0.00% 0 0.00% 7 77.78% 0 0.00% 1 11.11% 0 0.00% 0 0.00% 9 100.00%
ART 2013 1 11.11% 0 0.00% 0 0.00% 7 77.78% 0 0.00% 1 11.11% 0 0.00% 0 0.00% 9 100.00%
ART 2014 1 10.00% 0 0.00% 0 0.00% 8 80.00% 0 0.00% 1 10.00% 0 0.00% 0 0.00% 10 100.00%
ATHLETICS 2006 3 100.00% 0 0.00% 0 0.00% 0 0.00% 0 0.00% 0 0.00% 0 0.00% 0 0.00% 3 100.00%
ATHLETICS 2007 3 75.00% 0 0.00% 0 0.00% 1 25.00% 0 0.00% 0 0.00% 0 0.00% 0 0.00% 4 100.00%
ATHLETICS 2008 3 100.00% 0 0.00% 0 0.00% 0 0.00% 0 0.00% 0 0.00% 0 0.00% 0 0.00% 3 100.00%
ATHLETICS 2009 3 100.00% 0 0.00% 0 0.00% 0 0.00% 0 0.00% 0 0.00% 0 0.00% 0 0.00% 3 100.00%
ATHLETICS 2010 2 100.00% 0 0.00% 0 0.00% 0 0.00% 0 0.00% 0 0.00% 0 0.00% 0 0.00% 2 100.00%
ATHLETICS 2011 2 100.00% 0 0.00% 0 0.00% 0 0.00% 0 0.00% 0 0.00% 0 0.00% 0 0.00% 2 100.00%
ATHLETICS 2012 1 100.00% 0 0.00% 0 0.00% 0 0.00% 0 0.00% 0 0.00% 0 0.00% 0 0.00% 1 100.00%
ATHLETICS 2013 1 100.00% 0 0.00% 0 0.00% 0 0.00% 0 0.00% 0 0.00% 0 0.00% 0 0.00% 1 100.00%
ATHLETICS 2014 1 100.00% 0 0.00% 0 0.00% 0 0.00% 0 0.00% 0 0.00% 0 0.00% 0 0.00% 1 100.00%
BUSINESS 2006 2 16.67% 0 0.00% 1 8.33% 8 66.67% 0 0.00% 1 8.33% 0 0.00% 0 0.00% 12 100.00%
BUSINESS 2007 3 21.43% 0 0.00% 1 7.14% 8 57.14% 0 0.00% 1 7.14% 0 0.00% 1 7.14% 14 100.00%
BUSINESS 2008 2 14.29% 0 0.00% 1 7.14% 8 57.14% 0 0.00% 1 7.14% 0 0.00% 2 14.29% 14 100.00%
BUSINESS 2009 2 14.29% 0 0.00% 3 21.43% 8 57.14% 0 0.00% 1 7.14% 0 0.00% 0 0.00% 14 100.00%
BUSINESS 2010 2 15.38% 0 0.00% 2 15.38% 7 53.85% 0 0.00% 1 7.69% 0 0.00% 1 7.69% 13 100.00%
BUSINESS 2011 2 15.38% 0 0.00% 3 23.08% 7 53.85% 0 0.00% 1 7.69% 0 0.00% 0 0.00% 13 100.00%
BUSINESS 2012 2 15.38% 0 0.00% 3 23.08% 7 53.85% 0 0.00% 1 7.69% 0 0.00% 0 0.00% 13 100.00%
BUSINESS 2013 2 18.18% 0 0.00% 3 27.27% 5 45.45% 0 0.00% 1 9.09% 0 0.00% 0 0.00% 11 99.99%
BUSINESS 2014 2 18.18% 0 0.00% 3 27.27% 5 45.50% 0 0.00% 1 9.09% 0 0.00% 0 0.00% 11 100.04%
CHILD CENTER 2006 1 100.00% 0 0.00% 0 0.00% 0 0.00% 0 0.00% 0 0.00% 0 0.00% 0 0.00% 1 100.00%
CHILD CENTER 2007 1 100.00% 0 0.00% 0 0.00% 0 0.00% 0 0.00% 0 0.00% 0 0.00% 0 0.00% 1 100.00%
CHILD CENTER 2008 1 100.00% 0 0.00% 0 0.00% 0 0.00% 0 0.00% 0 0.00% 0 0.00% 0 0.00% 1 100.00%
CHILD CENTER 2009 1 100.00% 0 0.00% 0 0.00% 0 0.00% 0 0.00% 0 0.00% 0 0.00% 0 0.00% 1 100.00%
CHILD CENTER 2010 1 100.00% 0 0.00% 0 0.00% 0 0.00% 0 0.00% 0 0.00% 0 0.00% 0 0.00% 1 100.00%
CHILD CENTER 2011 1 100.00% 0 0.00% 0 0.00% 0 0.00% 0 0.00% 0 0.00% 0 0.00% 0 0.00% 1 100.00%
CHILD CENTER 2012 1 100.00% 0 0.00% 0 0.00% 0 0.00% 0 0.00% 0 0.00% 0 0.00% 0 0.00% 1 100.00%
CHILD CENTER 2013 1 100.00% 0 0.00% 0 0.00% 0 0.00% 0 0.00% 0 0.00% 0 0.00% 0 0.00% 1 100.00%
Full Time Faculty - Diversity by Department - 2006-2014
Department
African American/ Black
American Indian/
Native American Asian Pacific Islander
Year
Multi-Racial/ Unknown TotalCaucasian/ White Filipino Hispanic
Page 1 of 10 10/1/2015

Santa Monica College
Full-time Faculty
Ethnicity by Department
2006-2014
Number % Number % Number % Number % Number % Number % Number % Number % Number %
Full Time Faculty - Diversity by Department - 2006-2014
Department
African American/ Black
American Indian/
Native American Asian Pacific Islander
Year
Multi-Racial/ Unknown TotalCaucasian/ White Filipino Hispanic
CHILD CENTER 2014 1 100.00% 0 0.00% 0 0.00% 0 0.00% 0 0.00% 0 0.00% 0 0.00% 0 0.00% 1 100.00%
COMMUNICATIONS 2006 1 10.00% 0 0.00% 1 10.00% 8 80.00% 0 0.00% 0 0.00% 0 0.00% 0 0.00% 10 100.00%
COMMUNICATIONS 2007 1 9.09% 0 0.00% 1 9.09% 8 72.73% 0 0.00% 0 0.00% 0 0.00% 1 9.09% 11 100.00%
COMMUNICATIONS 2008 1 9.09% 0 0.00% 1 9.09% 8 72.73% 0 0.00% 0 0.00% 0 0.00% 1 9.09% 11 100.00%
COMMUNICATIONS 2009 1 10.00% 0 0.00% 1 10.00% 7 70.00% 0 0.00% 1 10.00% 0 0.00% 0 0.00% 10 100.00%
COMMUNICATIONS 2010 1 8.33% 0 0.00% 1 8.33% 8 66.67% 0 0.00% 2 16.67% 0 0.00% 0 0.00% 12 100.00%
COMMUNICATIONS 2011 1 9.09% 0 0.00% 1 9.09% 7 63.64% 0 0.00% 2 18.18% 0 0.00% 0 0.00% 11 100.00%
COMMUNICATIONS 2012 1 9.09% 0 0.00% 1 9.09% 7 63.64% 0 0.00% 2 18.18% 0 0.00% 0 0.00% 11 100.00%
COMMUNICATIONS 2013 1 8.33% 0 0.00% 1 8.33% 7 58.33% 0 0.00% 2 16.67% 0 0.00% 1 8.33% 12 100.00%
COMMUNICATIONS 2014 0 0.00% 0 0.00% 1 9.09% 7 63.64% 0 0.00% 2 18.18% 0 0.00% 1 9.09% 11 100.00%
COSMETOLOGY 2006 1 33.33% 0 0.00% 0 0.00% 2 66.67% 0 0.00% 0 0.00% 0 0.00% 0 0.00% 3 100.00%
COSMETOLOGY 2007 1 33.33% 0 0.00% 0 0.00% 2 66.67% 0 0.00% 0 0.00% 0 0.00% 0 0.00% 3 100.00%
COSMETOLOGY 2008 1 33.33% 0 0.00% 0 0.00% 2 66.67% 0 0.00% 0 0.00% 0 0.00% 0 0.00% 3 100.00%
COSMETOLOGY 2009 1 33.33% 0 0.00% 0 0.00% 2 66.67% 0 0.00% 0 0.00% 0 0.00% 0 0.00% 3 100.00%
COSMETOLOGY 2010 1 33.33% 0 0.00% 0 0.00% 2 66.67% 0 0.00% 0 0.00% 0 0.00% 0 0.00% 3 100.00%
COSMETOLOGY 2011 1 25.00% 0 0.00% 0 0.00% 2 50.00% 0 0.00% 1 25.00% 0 0.00% 0 0.00% 4 100.00%
COSMETOLOGY 2012 1 25.00% 0 0.00% 0 0.00% 2 50.00% 0 0.00% 1 25.00% 0 0.00% 0 0.00% 4 100.00%
COSMETOLOGY 2013 1 25.00% 0 0.00% 0 0.00% 2 50.00% 0 0.00% 1 25.00% 0 0.00% 0 0.00% 4 100.00%
COSMETOLOGY 2014 1 25.00% 0 0.00% 0 0.00% 2 50.00% 0 0.00% 1 25.00% 0 0.00% 0 0.00% 4 100.00%
COUNSELING 2006 4 16.00% 0 0.00% 1 4.00% 11 44.00% 0 0.00% 8 32.00% 0 0.00% 1 4.00% 25 100.00%
COUNSELING 2007 4 15.38% 0 0.00% 1 3.85% 12 46.15% 0 0.00% 8 30.77% 0 0.00% 1 3.85% 26 100.00%
COUNSELING 2008 4 16.00% 0 0.00% 1 4.00% 11 44.00% 0 0.00% 8 32.00% 0 0.00% 1 4.00% 25 100.00%
COUNSELING 2009 4 16.00% 0 0.00% 1 4.00% 11 44.00% 0 0.00% 9 36.00% 0 0.00% 0 0.00% 25 100.00%
COUNSELING 2010 4 16.67% 0 0.00% 1 4.17% 10 41.67% 0 0.00% 9 37.50% 0 0.00% 0 0.00% 24 100.00%
COUNSELING 2011 5 20.83% 0 0.00% 1 4.17% 9 37.50% 0 0.00% 9 37.50% 0 0.00% 0 0.00% 24 100.00%
COUNSELING 2012 5 20.83% 0 0.00% 1 4.17% 9 37.50% 0 0.00% 9 37.50% 0 0.00% 0 0.00% 24 100.00%
COUNSELING 2013 8 18.60% 0 0.00% 3 6.98% 17 39.53% 1 2.33% 14 32.56% 0 0.00% 0 0.00% 43 100.00%
COUNSELING 2014 8 18.18% 0 0.00% 4 9.09% 17 38.64% 1 2.27% 14 31.82% 0 0.00% 0 0.00% 44 100.00%
CSIS 2006 2 16.67% 0 0.00% 0 0.00% 9 75.00% 0 0.00% 1 8.33% 0 0.00% 0 0.00% 12 100.00%
CSIS 2007 2 15.38% 0 0.00% 0 0.00% 10 76.92% 0 0.00% 1 7.69% 0 0.00% 0 0.00% 13 100.00%
CSIS 2008 2 15.38% 0 0.00% 0 0.00% 10 76.92% 0 0.00% 1 7.69% 0 0.00% 0 0.00% 13 100.00%
CSIS 2009 1 8.33% 0 0.00% 0 0.00% 10 83.33% 0 0.00% 1 8.33% 0 0.00% 0 0.00% 12 100.00%
CSIS 2010 1 8.33% 0 0.00% 0 0.00% 10 83.33% 0 0.00% 1 8.33% 0 0.00% 0 0.00% 12 100.00%
CSIS 2011 1 8.33% 0 0.00% 0 0.00% 10 83.33% 0 0.00% 1 8.33% 0 0.00% 0 0.00% 12 100.00%
CSIS 2012 1 8.33% 0 0.00% 0 0.00% 10 83.33% 0 0.00% 1 8.33% 0 0.00% 0 0.00% 12 100.00%
Page 2 of 10 10/1/2015

Santa Monica College
Full-time Faculty
Ethnicity by Department
2006-2014
Number % Number % Number % Number % Number % Number % Number % Number % Number %
Full Time Faculty - Diversity by Department - 2006-2014
Department
African American/ Black
American Indian/
Native American Asian Pacific Islander
Year
Multi-Racial/ Unknown TotalCaucasian/ White Filipino Hispanic
CSIS 2013 1 8.33% 0 0.00% 0 0.00% 10 83.33% 0 0.00% 1 8.33% 0 0.00% 0 0.00% 12 100.00%
CSIS 2014 1 8.33% 0 0.00% 0 0.00% 10 83.33% 0 0.00% 1 8.33% 0 0.00% 0 0.00% 12 100.00%
DANCE 2006 0 0.00% 0 0.00% 0 0.00% 2 100.00% 0 0.00% 0 0.00% 0 0.00% 0 0.00% 2 100.00%
DANCE 2007 0 0.00% 0 0.00% 0 0.00% 2 66.67% 0 0.00% 0 0.00% 0 0.00% 1 33.33% 3 100.00%
DANCE 2008 0 0.00% 0 0.00% 0 0.00% 2 66.67% 0 0.00% 0 0.00% 0 0.00% 1 33.33% 3 100.00%
DANCE 2009 0 0.00% 0 0.00% 1 33.33% 2 66.67% 0 0.00% 0 0.00% 0 0.00% 0 0.00% 3 100.00%
DANCE 2010 0 0.00% 0 0.00% 1 33.33% 2 66.67% 0 0.00% 0 0.00% 0 0.00% 0 0.00% 3 100.00%
DANCE 2011 0 0.00% 0 0.00% 1 50.00% 1 50.00% 0 0.00% 0 0.00% 0 0.00% 0 0.00% 2 100.00%
DANCE 2012 0 0.00% 0 0.00% 1 33.33% 2 66.67% 0 0.00% 0 0.00% 0 0.00% 0 0.00% 3 100.00%
DANCE 2013 0 0.00% 0 0.00% 1 33.33% 2 66.67% 0 0.00% 0 0.00% 0 0.00% 0 0.00% 3 100.00%
DANCE 2014 0 0.00% 0 0.00% 1 33.33% 2 66.67% 0 0.00% 0 0.00% 0 0.00% 0 0.00% 3 100.00%
DESIGN TECH. 2006 0 0.00% 0 0.00% 0 0.00% 5 62.50% 1 12.50% 2 25.00% 0 0.00% 0 0.00% 8 100.00%
DESIGN TECH. 2007 0 0.00% 0 0.00% 0 0.00% 5 62.50% 1 12.50% 2 25.00% 0 0.00% 0 0.00% 8 100.00%
DESIGN TECH. 2008 0 0.00% 0 0.00% 0 0.00% 5 62.50% 1 12.50% 2 25.00% 0 0.00% 0 0.00% 8 100.00%
DESIGN TECH. 2009 0 0.00% 0 0.00% 0 0.00% 5 62.50% 1 12.50% 2 25.00% 0 0.00% 0 0.00% 8 100.00%
DESIGN TECH. 2010 0 0.00% 0 0.00% 0 0.00% 5 71.43% 1 14.29% 1 14.29% 0 0.00% 0 0.00% 7 100.00%
DESIGN TECH. 2011 0 0.00% 0 0.00% 0 0.00% 4 66.67% 1 16.67% 1 16.67% 0 0.00% 0 0.00% 6 100.00%
DESIGN TECH. 2012 0 0.00% 0 0.00% 1 12.50% 4 50.00% 1 12.50% 1 12.50% 0 0.00% 1 12.50% 8 100.00%
DESIGN TECH. 2013 0 0.00% 0 0.00% 2 25.00% 4 50.00% 1 12.50% 1 12.50% 0 0.00% 0 0.00% 8 100.00%
DESIGN TECH. 2014 0 0.00% 0 0.00% 2 25.00% 4 50.00% 1 12.50% 1 12.50% 0 0.00% 0 0.00% 8 100.00%
DISABL STU CTR 2006 0 0.00% 0 0.00% 1 11.11% 7 77.78% 0 0.00% 0 0.00% 0 0.00% 1 11.11% 9 100.00%
DISABL STU CTR 2007 0 0.00% 0 0.00% 1 12.50% 6 75.00% 0 0.00% 0 0.00% 0 0.00% 1 12.50% 8 100.00%
DISABL STU CTR 2008 0 0.00% 0 0.00% 1 11.11% 7 77.78% 0 0.00% 0 0.00% 0 0.00% 1 11.11% 9 100.00%
DISABL STU CTR 2009 0 0.00% 0 0.00% 1 11.11% 8 88.89% 0 0.00% 0 0.00% 0 0.00% 0 0.00% 9 100.00%
DISABL STU CTR 2010 0 0.00% 0 0.00% 1 11.11% 8 88.89% 0 0.00% 0 0.00% 0 0.00% 0 0.00% 9 100.00%
DISABL STU CTR 2011 0 0.00% 0 0.00% 1 11.11% 8 88.89% 0 0.00% 0 0.00% 0 0.00% 0 0.00% 9 100.00%
DISABL STU CTR 2012 0 0.00% 0 0.00% 1 11.11% 8 88.89% 0 0.00% 0 0.00% 0 0.00% 0 0.00% 9 100.00%
DISABL STU CTR 2013 0 0.00% 0 0.00% 0 0.00% 0 0.00% 0 0.00% 0 0.00% 0 0.00% 0 0.00% 0 0.00%
DISABL STU CTR 2014 0 0.00% 0 0.00% 0 0.00% 0 0.00% 0 0.00% 0 0.00% 0 0.00% 0 0.00% 0 0.00%
EARTH SCIENCE 2006 0 0.00% 0 0.00% 0 0.00% 10 100.00% 0 0.00% 0 0.00% 0 0.00% 0 0.00% 10 100.00%
EARTH SCIENCE 2007 0 0.00% 0 0.00% 0 0.00% 11 100.00% 0 0.00% 0 0.00% 0 0.00% 0 0.00% 11 100.00%
EARTH SCIENCE 2008 0 0.00% 0 0.00% 0 0.00% 10 90.91% 0 0.00% 0 0.00% 0 0.00% 1 9.09% 11 100.00%
EARTH SCIENCE 2009 0 0.00% 0 0.00% 0 0.00% 11 100.00% 0 0.00% 0 0.00% 0 0.00% 0 0.00% 11 100.00%
EARTH SCIENCE 2010 0 0.00% 0 0.00% 0 0.00% 11 100.00% 0 0.00% 0 0.00% 0 0.00% 0 0.00% 11 100.00%
EARTH SCIENCE 2011 0 0.00% 0 0.00% 0 0.00% 11 100.00% 0 0.00% 0 0.00% 0 0.00% 0 0.00% 11 100.00%
Page 3 of 10 10/1/2015

Santa Monica College
Full-time Faculty
Ethnicity by Department
2006-2014
Number % Number % Number % Number % Number % Number % Number % Number % Number %
Full Time Faculty - Diversity by Department - 2006-2014
Department
African American/ Black
American Indian/
Native American Asian Pacific Islander
Year
Multi-Racial/ Unknown TotalCaucasian/ White Filipino Hispanic
EARTH SCIENCE 2012 0 0.00% 0 0.00% 0 0.00% 12 100.00% 0 0.00% 0 0.00% 0 0.00% 0 0.00% 12 100.00%
EARTH SCIENCE 2013 0 0.00% 0 0.00% 0 0.00% 12 100.00% 0 0.00% 0 0.00% 0 0.00% 0 0.00% 12 100.00%
EARTH SCIENCE 2014 0 0.00% 0 0.00% 0 0.00% 12 100.00% 0 0.00% 0 0.00% 0 0.00% 0 0.00% 12 100.00%
EDUCATION/ECE 2006 1 25.00% 0 0.00% 1 25.00% 2 50.00% 0 0.00% 0 0.00% 0 0.00% 0 0.00% 4 100.00%
EDUCATION/ECE 2007 1 20.00% 0 0.00% 1 20.00% 3 60.00% 0 0.00% 0 0.00% 0 0.00% 0 0.00% 5 100.00%
EDUCATION/ECE 2008 1 20.00% 0 0.00% 1 20.00% 3 60.00% 0 0.00% 0 0.00% 0 0.00% 0 0.00% 5 100.00%
EDUCATION/ECE 2009 1 20.00% 0 0.00% 1 20.00% 3 60.00% 0 0.00% 0 0.00% 0 0.00% 0 0.00% 5 100.00%
EDUCATION/ECE 2010 1 20.00% 0 0.00% 1 20.00% 3 60.00% 0 0.00% 0 0.00% 0 0.00% 0 0.00% 5 100.00%
EDUCATION/ECE 2011 1 20.00% 0 0.00% 1 20.00% 3 60.00% 0 0.00% 0 0.00% 0 0.00% 0 0.00% 5 100.00%
EDUCATION/ECE 2012 1 25.00% 0 0.00% 1 25.00% 2 50.00% 0 0.00% 0 0.00% 0 0.00% 0 0.00% 4 100.00%
EDUCATION/ECE 2013 1 25.00% 0 0.00% 1 25.00% 2 50.00% 0 0.00% 0 0.00% 0 0.00% 0 0.00% 4 100.00%
EDUCATION/ECE 2014 1 20.00% 0 0.00% 2 40.00% 2 40.00% 0 0.00% 0 0.00% 0 0.00% 0 0.00% 5 100.00%
ENGLISH 2006 3 8.57% 0 0.00% 1 2.86% 28 80.00% 0 0.00% 3 8.57% 0 0.00% 0 0.00% 35 100.00%
ENGLISH 2007 3 7.89% 0 0.00% 1 2.63% 30 78.95% 0 0.00% 3 7.89% 0 0.00% 1 2.63% 38 100.00%
ENGLISH 2008 3 8.11% 0 0.00% 1 2.70% 28 75.68% 0 0.00% 3 8.11% 0 0.00% 2 5.41% 37 100.00%
ENGLISH 2009 3 8.11% 0 0.00% 1 2.70% 29 78.38% 0 0.00% 3 8.11% 0 0.00% 1 2.70% 37 100.00%
ENGLISH 2010 3 8.11% 0 0.00% 1 2.70% 29 78.38% 0 0.00% 3 8.11% 0 0.00% 1 2.70% 37 100.00%
ENGLISH 2011 3 8.11% 0 0.00% 1 2.70% 29 78.38% 0 0.00% 3 8.11% 0 0.00% 1 2.70% 37 100.00%
ENGLISH 2012 3 8.11% 0 0.00% 1 2.70% 28 75.68% 0 0.00% 3 8.11% 1 2.70% 1 2.70% 37 100.00%
ENGLISH 2013 3 8.33% 0 0.00% 1 2.78% 28 77.78% 0 0.00% 3 8.33% 1 2.78% 0 0.00% 36 100.00%
ENGLISH 2014 3 7.69% 0 0.00% 2 5.13% 29 74.36% 0 0.00% 4 10.26% 1 2.56% 0 0.00% 39 100.00%
EOPS 2006 0 0.00% 0 0.00% 0 0.00% 1 33.33% 1 33.33% 1 33.33% 0 0.00% 0 0.00% 3 100.00%
EOPS 2007 0 0.00% 0 0.00% 0 0.00% 1 33.33% 1 33.33% 1 33.33% 0 0.00% 0 0.00% 3 100.00%
EOPS 2008 0 0.00% 0 0.00% 0 0.00% 1 33.33% 1 33.33% 1 33.33% 0 0.00% 0 0.00% 3 100.00%
EOPS 2009 0 0.00% 0 0.00% 0 0.00% 1 50.00% 1 50.00% 0 0.00% 0 0.00% 0 0.00% 2 100.00%
EOPS 2010 0 0.00% 0 0.00% 0 0.00% 1 50.00% 1 50.00% 0 0.00% 0 0.00% 0 0.00% 2 100.00%
EOPS 2011 0 0.00% 0 0.00% 0 0.00% 1 50.00% 1 50.00% 0 0.00% 0 0.00% 0 0.00% 2 100.00%
EOPS 2012 0 0.00% 0 0.00% 0 0.00% 1 50.00% 1 50.00% 0 0.00% 0 0.00% 0 0.00% 2 100.00%
EOPS 2013 0 0.00% 0 0.00% 0 0.00% 1 100.00% 0 0.00% 0 0.00% 0 0.00% 0 0.00% 1 100.00%
EOPS 2014 0 0.00% 0 0.00% 0 0.00% 0 0.00% 0 0.00% 0 0.00% 0 0.00% 0 0.00% 0 0.00%
ESL 2006 1 10.00% 0 0.00% 0 0.00% 8 80.00% 0 0.00% 1 10.00% 0 0.00% 0 0.00% 10 100.00%
ESL 2007 1 10.00% 0 0.00% 0 0.00% 8 80.00% 0 0.00% 1 10.00% 0 0.00% 0 0.00% 10 100.00%
ESL 2008 1 10.00% 0 0.00% 0 0.00% 8 80.00% 0 0.00% 1 10.00% 0 0.00% 0 0.00% 10 100.00%
ESL 2009 1 10.00% 0 0.00% 0 0.00% 8 80.00% 0 0.00% 1 10.00% 0 0.00% 0 0.00% 10 100.00%
ESL 2010 1 10.00% 0 0.00% 0 0.00% 8 80.00% 0 0.00% 1 10.00% 0 0.00% 0 0.00% 10 100.00%
Page 4 of 10 10/1/2015

Santa Monica College
Full-time Faculty
Ethnicity by Department
2006-2014
Number % Number % Number % Number % Number % Number % Number % Number % Number %
Full Time Faculty - Diversity by Department - 2006-2014
Department
African American/ Black
American Indian/
Native American Asian Pacific Islander
Year
Multi-Racial/ Unknown TotalCaucasian/ White Filipino Hispanic
ESL 2011 1 11.11% 0 0.00% 0 0.00% 8 88.89% 0 0.00% 0 0.00% 0 0.00% 0 0.00% 9 100.00%
ESL 2012 1 9.09% 0 0.00% 0 0.00% 10 90.91% 0 0.00% 0 0.00% 0 0.00% 0 0.00% 11 100.00%
ESL 2013 1 9.09% 0 0.00% 0 0.00% 10 90.91% 0 0.00% 0 0.00% 0 0.00% 0 0.00% 11 100.00%
ESL 2014 1 9.09% 0 0.00% 0 0.00% 9 81.82% 0 0.00% 1 9.09% 0 0.00% 0 0.00% 11 100.00%
HEALTH SCIENCE 2006 2 28.57% 0 0.00% 0 0.00% 5 71.43% 0 0.00% 0 0.00% 0 0.00% 0 0.00% 7 100.00%
HEALTH SCIENCE 2007 3 37.50% 0 0.00% 0 0.00% 5 62.50% 0 0.00% 0 0.00% 0 0.00% 0 0.00% 8 100.00%
HEALTH SCIENCE 2008 2 28.57% 0 0.00% 0 0.00% 5 71.43% 0 0.00% 0 0.00% 0 0.00% 0 0.00% 7 100.00%
HEALTH SCIENCE 2009 2 28.57% 0 0.00% 0 0.00% 5 71.43% 0 0.00% 0 0.00% 0 0.00% 0 0.00% 7 100.00%
HEALTH SCIENCE 2010 2 28.57% 0 0.00% 0 0.00% 5 71.43% 0 0.00% 0 0.00% 0 0.00% 0 0.00% 7 100.00%
HEALTH SCIENCE 2011 2 28.57% 0 0.00% 0 0.00% 4 57.14% 0 0.00% 1 14.29% 0 0.00% 0 0.00% 7 100.00%
HEALTH SCIENCE 2012 2 28.57% 0 0.00% 0 0.00% 4 57.14% 0 0.00% 1 14.29% 0 0.00% 0 0.00% 7 100.00%
HEALTH SCIENCE 2013 2 28.57% 0 0.00% 0 0.00% 4 57.14% 0 0.00% 1 14.29% 0 0.00% 0 0.00% 7 100.00%
HEALTH SCIENCE 2014 2 33.33% 0 0.00% 0 0.00% 3 50.00% 0 0.00% 1 16.67% 0 0.00% 0 0.00% 6 100.00%
HEALTH SERVICES 2006 0 0.00% 0 0.00% 0 0.00% 0 0.00% 0 0.00% 1 100.00% 0 0.00% 0 0.00% 1 100.00%
HEALTH SERVICES 2007 0 0.00% 0 0.00% 0 0.00% 0 0.00% 0 0.00% 1 100.00% 0 0.00% 0 0.00% 1 100.00%
HEALTH SERVICES 2008 0 0.00% 0 0.00% 0 0.00% 0 0.00% 0 0.00% 1 100.00% 0 0.00% 0 0.00% 1 100.00%
HEALTH SERVICES 2009 0 0.00% 0 0.00% 0 0.00% 0 0.00% 0 0.00% 0 0.00% 0 0.00% 0 0.00% 0 0.00%
HEALTH SERVICES 2010 0 0.00% 0 0.00% 0 0.00% 0 0.00% 0 0.00% 1 100.00% 0 0.00% 0 0.00% 1 100.00%
HEALTH SERVICES 2011 0 0.00% 0 0.00% 0 0.00% 0 0.00% 0 0.00% 1 100.00% 0 0.00% 0 0.00% 1 100.00%
HEALTH SERVICES 2012 0 0.00% 0 0.00% 0 0.00% 0 0.00% 0 0.00% 1 100.00% 0 0.00% 0 0.00% 1 100.00%
HEALTH SERVICES 2013 0 0.00% 0 0.00% 0 0.00% 0 0.00% 0 0.00% 0 0.00% 0 0.00% 0 0.00% 0 0.00%
HEALTH SERVICES 2014 0 0.00% 0 0.00% 0 0.00% 0 0.00% 0 0.00% 0 0.00% 0 0.00% 0 0.00% 0 0.00%
HISTORY 2006 1 11.11% 0 0.00% 1 11.11% 5 55.56% 0 0.00% 2 22.22% 0 0.00% 0 0.00% 9 100.00%
HISTORY 2007 1 12.50% 0 0.00% 1 12.50% 5 62.50% 0 0.00% 1 12.50% 0 0.00% 0 0.00% 8 100.00%
HISTORY 2008 1 12.50% 0 0.00% 1 12.50% 5 62.50% 0 0.00% 1 12.50% 0 0.00% 0 0.00% 8 100.00%
HISTORY 2009 1 12.50% 0 0.00% 1 12.50% 5 62.50% 0 0.00% 1 12.50% 0 0.00% 0 0.00% 8 100.00%
HISTORY 2010 1 14.29% 0 0.00% 1 14.29% 4 57.14% 0 0.00% 1 14.29% 0 0.00% 0 0.00% 7 100.00%
HISTORY 2011 0 0.00% 0 0.00% 2 28.57% 4 57.14% 0 0.00% 1 14.29% 0 0.00% 0 0.00% 7 100.00%
HISTORY 2012 0 0.00% 0 0.00% 2 25.00% 5 62.50% 0 0.00% 1 12.50% 0 0.00% 0 0.00% 8 100.00%
HISTORY 2013 0 0.00% 0 0.00% 2 28.57% 4 57.14% 0 0.00% 1 14.29% 0 0.00% 0 0.00% 7 100.00%
HISTORY 2014 0 0.00% 0 0.00% 2 28.57% 4 57.14% 0 0.00% 1 14.29% 0 0.00% 0 0.00% 7 100.00%
INT'L STUD CNTR 2006 0 0.00% 0 0.00% 1 33.33% 1 33.33% 0 0.00% 1 33.33% 0 0.00% 0 0.00% 3 100.00%
INT'L STUD CNTR 2007 0 0.00% 0 0.00% 1 33.33% 1 33.33% 0 0.00% 1 33.33% 0 0.00% 0 0.00% 3 100.00%
INT'L STUD CNTR 2008 0 0.00% 0 0.00% 1 33.33% 1 33.33% 0 0.00% 1 33.33% 0 0.00% 0 0.00% 3 100.00%
INT'L STUD CNTR 2009 0 0.00% 0 0.00% 1 33.33% 1 33.33% 0 0.00% 1 33.33% 0 0.00% 0 0.00% 3 100.00%
Page 5 of 10 10/1/2015

Santa Monica College
Full-time Faculty
Ethnicity by Department
2006-2014
Number % Number % Number % Number % Number % Number % Number % Number % Number %
Full Time Faculty - Diversity by Department - 2006-2014
Department
African American/ Black
American Indian/
Native American Asian Pacific Islander
Year
Multi-Racial/ Unknown TotalCaucasian/ White Filipino Hispanic
INT'L STUD CNTR 2010 0 0.00% 0 0.00% 1 33.33% 1 33.33% 0 0.00% 1 33.33% 0 0.00% 0 0.00% 3 100.00%
INT'L STUD CNTR 2011 0 0.00% 0 0.00% 1 33.33% 1 33.33% 0 0.00% 1 33.33% 0 0.00% 0 0.00% 3 100.00%
INT'L STUD CNTR 2012 0 0.00% 0 0.00% 1 33.33% 1 33.33% 0 0.00% 1 33.33% 0 0.00% 0 0.00% 3 100.00%
INT'L STUD CNTR 2013 0 0.00% 0 0.00% 0 0.00% 0 0.00% 0 0.00% 0 0.00% 0 0.00% 0 0.00% 0 0.00%
INT'L STUD CNTR 2014 0 0.00% 0 0.00% 0 0.00% 0 0.00% 0 0.00% 0 0.00% 0 0.00% 0 0.00% 0 0.00%
ITALIAN 2011 0 0.00% 0 0.00% 0 0.00% 0 0.00% 0 0.00% 1 100.00% 0 0.00% 0 0.00% 1 100.00%
ITALIAN 2012 0 0.00% 0 0.00% 0 0.00% 0 0.00% 0 0.00% 0 0.00% 0 0.00% 0 0.00% 0 0.00%
ITALIAN 2013 0 0.00% 0 0.00% 0 0.00% 0 0.00% 0 0.00% 0 0.00% 0 0.00% 0 0.00% 0 0.00%
ITALIAN 2014 0 0.00% 0 0.00% 0 0.00% 0 0.00% 0 0.00% 0 0.00% 0 0.00% 0 0.00% 0 0.00%
KINESIOLOGY 2006 0 0.00% 0 0.00% 0 0.00% 2 66.67% 1 33.33% 0 0.00% 0 0.00% 0 0.00% 3 100.00%
KINESIOLOGY 2007 0 0.00% 0 0.00% 0 0.00% 3 75.00% 1 25.00% 0 0.00% 0 0.00% 0 0.00% 4 100.00%
KINESIOLOGY 2008 0 0.00% 0 0.00% 0 0.00% 2 66.67% 1 33.33% 0 0.00% 0 0.00% 0 0.00% 3 100.00%
KINESIOLOGY 2009 0 0.00% 0 0.00% 0 0.00% 2 66.67% 1 33.33% 0 0.00% 0 0.00% 0 0.00% 3 100.00%
KINESIOLOGY 2010 0 0.00% 0 0.00% 0 0.00% 2 66.67% 1 33.33% 0 0.00% 0 0.00% 0 0.00% 3 100.00%
KINESIOLOGY 2011 0 0.00% 0 0.00% 0 0.00% 2 66.67% 1 33.33% 0 0.00% 0 0.00% 0 0.00% 3 100.00%
KINESIOLOGY 2012 1 25.00% 0 0.00% 0 0.00% 2 50.00% 1 25.00% 0 0.00% 0 0.00% 0 0.00% 4 100.00%
KINESIOLOGY 2013 1 33.33% 0 0.00% 0 0.00% 1 33.33% 1 33.33% 0 0.00% 0 0.00% 0 0.00% 3 100.00%
KINESIOLOGY 2014 1 33.33% 0 0.00% 0 0.00% 1 33.33% 1 33.33% 0 0.00% 0 0.00% 0 0.00% 3 100.00%
LIBRARY 2006 2 28.57% 0 0.00% 0 0.00% 5 71.43% 0 0.00% 0 0.00% 0 0.00% 0 0.00% 7 100.00%
LIBRARY 2007 2 28.57% 0 0.00% 0 0.00% 5 71.43% 0 0.00% 0 0.00% 0 0.00% 0 0.00% 7 100.00%
LIBRARY 2008 2 28.57% 0 0.00% 0 0.00% 5 71.43% 0 0.00% 0 0.00% 0 0.00% 0 0.00% 7 100.00%
LIBRARY 2009 2 28.57% 0 0.00% 0 0.00% 5 71.43% 0 0.00% 0 0.00% 0 0.00% 0 0.00% 7 100.00%
LIBRARY 2010 2 28.57% 0 0.00% 0 0.00% 5 71.43% 0 0.00% 0 0.00% 0 0.00% 0 0.00% 7 100.00%
LIBRARY 2011 2 28.57% 0 0.00% 0 0.00% 5 71.43% 0 0.00% 0 0.00% 0 0.00% 0 0.00% 7 100.00%
LIBRARY 2012 2 28.57% 0 0.00% 0 0.00% 5 71.43% 0 0.00% 0 0.00% 0 0.00% 0 0.00% 7 100.00%
LIBRARY 2013 2 28.57% 0 0.00% 0 0.00% 5 71.43% 0 0.00% 0 0.00% 0 0.00% 0 0.00% 7 100.00%
LIBRARY 2014 2 28.57% 0 0.00% 0 0.00% 5 71.43% 0 0.00% 0 0.00% 0 0.00% 0 0.00% 7 100.00%
LIFE SCIENCE 2006 1 5.26% 0 0.00% 4 21.05% 12 63.16% 0 0.00% 2 10.53% 0 0.00% 0 0.00% 19 100.00%
LIFE SCIENCE 2007 1 5.00% 0 0.00% 4 20.00% 12 60.00% 0 0.00% 2 10.00% 0 0.00% 1 5.00% 20 100.00%
LIFE SCIENCE 2008 1 4.76% 0 0.00% 4 19.05% 12 57.14% 0 0.00% 2 9.52% 0 0.00% 2 9.52% 21 100.00%
LIFE SCIENCE 2009 1 5.00% 0 0.00% 4 20.00% 12 60.00% 0 0.00% 2 10.00% 0 0.00% 1 5.00% 20 100.00%
LIFE SCIENCE 2010 1 4.55% 0 0.00% 4 18.18% 12 54.55% 0 0.00% 3 13.64% 0 0.00% 2 9.09% 22 100.00%
LIFE SCIENCE 2011 1 4.76% 0 0.00% 5 23.81% 10 47.62% 0 0.00% 4 19.05% 0 0.00% 1 4.76% 21 100.00%
LIFE SCIENCE 2012 1 4.55% 0 0.00% 5 22.73% 10 45.45% 0 0.00% 4 18.18% 1 4.55% 1 4.55% 22 100.00%
LIFE SCIENCE 2013 1 4.55% 0 0.00% 5 22.73% 11 50.00% 0 0.00% 4 18.18% 1 4.55% 0 0.00% 22 100.00%
Page 6 of 10 10/1/2015

Santa Monica College
Full-time Faculty
Ethnicity by Department
2006-2014
Number % Number % Number % Number % Number % Number % Number % Number % Number %
Full Time Faculty - Diversity by Department - 2006-2014
Department
African American/ Black
American Indian/
Native American Asian Pacific Islander
Year
Multi-Racial/ Unknown TotalCaucasian/ White Filipino Hispanic
LIFE SCIENCE 2014 1 4.55% 0 0.00% 5 22.73% 12 54.55% 0 0.00% 4 18.18% 0 0.00% 0 0.00% 22 100.00%
MATHEMATICS 2006 3 11.54% 0 0.00% 5 19.23% 14 53.85% 0 0.00% 3 11.54% 0 0.00% 1 3.85% 26 100.00%
MATHEMATICS 2007 3 11.11% 0 0.00% 4 14.81% 15 55.56% 0 0.00% 3 11.11% 0 0.00% 2 7.41% 27 100.00%
MATHEMATICS 2008 3 10.71% 0 0.00% 5 17.86% 14 50.00% 0 0.00% 4 14.29% 0 0.00% 2 7.14% 28 100.00%
MATHEMATICS 2009 3 10.71% 0 0.00% 5 17.86% 15 53.57% 0 0.00% 4 14.29% 0 0.00% 1 3.57% 28 100.00%
MATHEMATICS 2010 3 11.11% 0 0.00% 5 18.52% 14 51.85% 0 0.00% 4 14.81% 0 0.00% 1 3.70% 27 100.00%
MATHEMATICS 2011 3 11.11% 0 0.00% 5 18.52% 14 51.85% 0 0.00% 4 14.81% 0 0.00% 1 3.70% 27 100.00%
MATHEMATICS 2012 4 14.81% 0 0.00% 5 18.52% 13 48.15% 0 0.00% 4 14.81% 0 0.00% 1 3.70% 27 100.00%
MATHEMATICS 2013 4 16.00% 0 0.00% 6 24.00% 10 40.00% 0 0.00% 5 20.00% 0 0.00% 0 0.00% 25 100.00%
MATHEMATICS 2014 4 16.67% 0 0.00% 5 20.83% 10 41.67% 0 0.00% 5 20.83% 0 0.00% 0 0.00% 24 100.00%
MATRICULATION 2006 1 50.00% 0 0.00% 0 0.00% 0 0.00% 0 0.00% 1 50.00% 0 0.00% 0 0.00% 2 100.00%
MATRICULATION 2007 1 50.00% 0 0.00% 0 0.00% 0 0.00% 0 0.00% 1 50.00% 0 0.00% 0 0.00% 2 100.00%
MATRICULATION 2008 1 50.00% 0 0.00% 0 0.00% 0 0.00% 0 0.00% 1 50.00% 0 0.00% 0 0.00% 2 100.00%
MATRICULATION 2009 1 50.00% 0 0.00% 0 0.00% 0 0.00% 0 0.00% 1 50.00% 0 0.00% 0 0.00% 2 100.00%
MATRICULATION 2010 1 50.00% 0 0.00% 0 0.00% 0 0.00% 0 0.00% 1 50.00% 0 0.00% 0 0.00% 2 100.00%
MATRICULATION 2011 1 50.00% 0 0.00% 0 0.00% 0 0.00% 0 0.00% 1 50.00% 0 0.00% 0 0.00% 2 100.00%
MATRICULATION 2012 1 50.00% 0 0.00% 0 0.00% 0 0.00% 0 0.00% 1 50.00% 0 0.00% 0 0.00% 2 100.00%
MATRICULATION 2013 0 0.00% 0 0.00% 0 0.00% 0 0.00% 0 0.00% 0 0.00% 0 0.00% 0 0.00% 0 0.00%
MATRICULATION 2014 0 0.00% 0 0.00% 0 0.00% 0 0.00% 0 0.00% 0 0.00% 0 0.00% 0 0.00% 0 0.00%
MODERN LANGUAGE 2006 1 9.09% 0 0.00% 3 27.27% 3 27.27% 0 0.00% 4 36.36% 0 0.00% 0 0.00% 11 100.00%
MODERN LANGUAGE 2007 1 9.09% 0 0.00% 3 27.27% 3 27.27% 0 0.00% 4 36.36% 0 0.00% 0 0.00% 11 100.00%
MODERN LANGUAGE 2008 1 9.09% 0 0.00% 3 27.27% 3 27.27% 0 0.00% 4 36.36% 0 0.00% 0 0.00% 11 100.00%
MODERN LANGUAGE 2009 1 9.09% 0 0.00% 3 27.27% 3 27.27% 0 0.00% 4 36.36% 0 0.00% 0 0.00% 11 100.00%
MODERN LANGUAGE 2010 1 9.09% 0 0.00% 3 27.27% 3 27.27% 0 0.00% 4 36.36% 0 0.00% 0 0.00% 11 100.00%
MODERN LANGUAGE 2011 1 9.09% 0 0.00% 3 27.27% 2 18.18% 0 0.00% 4 36.36% 0 0.00% 1 9.09% 11 100.00%
MODERN LANGUAGE 2012 1 9.09% 0 0.00% 3 27.27% 2 18.18% 0 0.00% 5 45.45% 0 0.00% 0 0.00% 11 100.00%
MODERN LANGUAGE 2013 1 9.09% 0 0.00% 4 36.36% 2 18.18% 0 0.00% 4 36.36% 0 0.00% 0 0.00% 11 100.00%
MODERN LANGUAGE 2014 1 9.09% 0 0.00% 4 36.36% 2 18.18% 0 0.00% 4 36.36% 0 0.00% 0 0.00% 11 100.00%
MUSIC 2006 0 0.00% 0 0.00% 0 0.00% 6 100.00% 0 0.00% 0 0.00% 0 0.00% 0 0.00% 6 100.00%
MUSIC 2007 0 0.00% 0 0.00% 0 0.00% 5 100.00% 0 0.00% 0 0.00% 0 0.00% 0 0.00% 5 100.00%
MUSIC 2008 0 0.00% 0 0.00% 0 0.00% 5 100.00% 0 0.00% 0 0.00% 0 0.00% 0 0.00% 5 100.00%
MUSIC 2009 0 0.00% 0 0.00% 0 0.00% 5 100.00% 0 0.00% 0 0.00% 0 0.00% 0 0.00% 5 100.00%
MUSIC 2010 1 20.00% 0 0.00% 0 0.00% 4 80.00% 0 0.00% 0 0.00% 0 0.00% 0 0.00% 5 100.00%
MUSIC 2011 1 16.67% 0 0.00% 0 0.00% 4 66.67% 0 0.00% 0 0.00% 0 0.00% 1 16.67% 6 100.00%
MUSIC 2012 1 16.67% 0 0.00% 1 16.67% 4 66.67% 0 0.00% 0 0.00% 0 0.00% 0 0.00% 6 100.00%
Page 7 of 10 10/1/2015

Santa Monica College
Full-time Faculty
Ethnicity by Department
2006-2014
Number % Number % Number % Number % Number % Number % Number % Number % Number %
Full Time Faculty - Diversity by Department - 2006-2014
Department
African American/ Black
American Indian/
Native American Asian Pacific Islander
Year
Multi-Racial/ Unknown TotalCaucasian/ White Filipino Hispanic
MUSIC 2013 1 16.67% 0 0.00% 1 16.67% 4 66.67% 0 0.00% 0 0.00% 0 0.00% 0 0.00% 6 100.00%
MUSIC 2014 1 14.29% 0 0.00% 1 14.29% 5 71.43% 0 0.00% 0 0.00% 0 0.00% 0 0.00% 7 100.00%
OFF OF SCH REL 2006 1 33.33% 0 0.00% 0 0.00% 2 66.67% 0 0.00% 0 0.00% 0 0.00% 0 0.00% 3 100.00%
OFF OF SCH REL 2007 1 33.33% 0 0.00% 0 0.00% 2 66.67% 0 0.00% 0 0.00% 0 0.00% 0 0.00% 3 100.00%
OFF OF SCH REL 2008 1 33.33% 0 0.00% 0 0.00% 2 66.67% 0 0.00% 0 0.00% 0 0.00% 0 0.00% 3 100.00%
OFF OF SCH REL 2009 1 33.33% 0 0.00% 0 0.00% 2 66.67% 0 0.00% 0 0.00% 0 0.00% 0 0.00% 3 100.00%
OFF OF SCH REL 2010 1 50.00% 0 0.00% 0 0.00% 1 50.00% 0 0.00% 0 0.00% 0 0.00% 0 0.00% 2 100.00%
OFF OF SCH REL 2011 1 100.00% 0 0.00% 0 0.00% 0 0.00% 0 0.00% 0 0.00% 0 0.00% 0 0.00% 1 100.00%
OFF OF SCH REL 2012 1 100.00% 0 0.00% 0 0.00% 0 0.00% 0 0.00% 0 0.00% 0 0.00% 0 0.00% 1 100.00%
OFF OF SCH REL 2013 1 100.00% 0 0.00% 0 0.00% 0 0.00% 0 0.00% 0 0.00% 0 0.00% 0 0.00% 1 100.00%
OFF OF SCH REL 2014 0 0.00% 0 0.00% 0 0.00% 0 0.00% 0 0.00% 0 0.00% 0 0.00% 0 0.00% 0 0.00%
PHILOSOPHY/SOCI 2006 0 0.00% 0 0.00% 2 11.11% 13 72.22% 0 0.00% 3 16.67% 0 0.00% 0 0.00% 18 100.00%
PHILOSOPHY/SOCI 2007 0 0.00% 0 0.00% 2 11.76% 12 70.59% 0 0.00% 3 17.65% 0 0.00% 0 0.00% 17 100.00%
PHILOSOPHY/SOCI 2008 0 0.00% 0 0.00% 2 11.76% 12 70.59% 0 0.00% 3 17.65% 0 0.00% 0 0.00% 17 100.00%
PHILOSOPHY/SOCI 2009 0 0.00% 0 0.00% 2 11.76% 12 70.59% 0 0.00% 3 17.65% 0 0.00% 0 0.00% 17 100.00%
PHILOSOPHY/SOCI 2010 0 0.00% 0 0.00% 2 11.76% 12 70.59% 0 0.00% 3 17.65% 0 0.00% 0 0.00% 17 100.00%
PHILOSOPHY/SOCI 2011 0 0.00% 0 0.00% 2 11.76% 12 70.59% 0 0.00% 3 17.65% 0 0.00% 0 0.00% 17 100.00%
PHILOSOPHY/SOCI 2012 0 0.00% 0 0.00% 2 11.11% 13 72.22% 0 0.00% 3 16.67% 0 0.00% 0 0.00% 18 100.00%
PHILOSOPHY/SOCI 2013 0 0.00% 0 0.00% 2 11.11% 13 72.22% 0 0.00% 3 16.67% 0 0.00% 0 0.00% 18 100.00%
PHILOSOPHY/SOCI 2014 0 0.00% 0 0.00% 2 11.11% 12 66.67% 0 0.00% 3 16.67% 0 0.00% 1 5.56% 18 100.00%
PHOTO - FASHION 2006 0 0.00% 0 0.00% 0 0.00% 4 100.00% 0 0.00% 0 0.00% 0 0.00% 0 0.00% 4 100.00%
PHOTO - FASHION 2007 0 0.00% 0 0.00% 0 0.00% 4 100.00% 0 0.00% 0 0.00% 0 0.00% 0 0.00% 4 100.00%
PHOTO - FASHION 2008 0 0.00% 0 0.00% 0 0.00% 4 100.00% 0 0.00% 0 0.00% 0 0.00% 0 0.00% 4 100.00%
PHOTO - FASHION 2009 0 0.00% 0 0.00% 0 0.00% 4 100.00% 0 0.00% 0 0.00% 0 0.00% 0 0.00% 4 100.00%
PHOTO - FASHION 2010 0 0.00% 0 0.00% 0 0.00% 5 100.00% 0 0.00% 0 0.00% 0 0.00% 0 0.00% 5 100.00%
PHOTO - FASHION 2011 0 0.00% 0 0.00% 0 0.00% 5 100.00% 0 0.00% 0 0.00% 0 0.00% 0 0.00% 5 100.00%
PHOTO - FASHION 2012 0 0.00% 0 0.00% 0 0.00% 5 100.00% 0 0.00% 0 0.00% 0 0.00% 0 0.00% 5 100.00%
PHOTO - FASHION 2013 0 0.00% 0 0.00% 0 0.00% 5 100.00% 0 0.00% 0 0.00% 0 0.00% 0 0.00% 5 100.00%
PHOTO - FASHION 2014 0 0.00% 0 0.00% 0 0.00% 4 100.00% 0 0.00% 0 0.00% 0 0.00% 0 0.00% 4 100.00%
PHYSICAL SCI 2006 3 17.65% 0 0.00% 1 5.88% 12 70.59% 0 0.00% 1 5.88% 0 0.00% 0 0.00% 17 100.00%
PHYSICAL SCI 2007 2 13.33% 0 0.00% 1 6.67% 11 73.33% 0 0.00% 1 6.67% 0 0.00% 0 0.00% 15 100.00%
PHYSICAL SCI 2008 2 11.76% 0 0.00% 1 5.88% 13 76.47% 0 0.00% 1 5.88% 0 0.00% 0 0.00% 17 100.00%
PHYSICAL SCI 2009 2 14.29% 0 0.00% 0 0.00% 11 78.57% 0 0.00% 1 7.14% 0 0.00% 0 0.00% 14 100.00%
PHYSICAL SCI 2010 2 12.50% 0 0.00% 2 12.50% 11 68.75% 0 0.00% 1 6.25% 0 0.00% 0 0.00% 16 100.00%
PHYSICAL SCI 2011 2 11.11% 0 0.00% 2 11.11% 12 66.67% 0 0.00% 1 5.56% 0 0.00% 1 5.56% 18 100.00%
Page 8 of 10 10/1/2015

Santa Monica College
Full-time Faculty
Ethnicity by Department
2006-2014
Number % Number % Number % Number % Number % Number % Number % Number % Number %
Full Time Faculty - Diversity by Department - 2006-2014
Department
African American/ Black
American Indian/
Native American Asian Pacific Islander
Year
Multi-Racial/ Unknown TotalCaucasian/ White Filipino Hispanic
PHYSICAL SCI 2012 2 10.53% 0 0.00% 2 10.53% 12 63.16% 0 0.00% 1 5.26% 0 0.00% 2 10.53% 19 100.00%
PHYSICAL SCI 2013 2 11.11% 0 0.00% 2 11.11% 12 66.67% 0 0.00% 0 0.00% 0 0.00% 2 11.11% 18 100.00%
PHYSICAL SCI 2014 2 11.11% 0 0.00% 2 11.11% 12 66.67% 0 0.00% 0 0.00% 0 0.00% 2 11.11% 18 100.00%
PHYSICS 2011 0 0.00% 0 0.00% 0 0.00% 0 0.00% 0 0.00% 0 0.00% 0 0.00% 1 100.00% 1 100.00%
PHYSICS 2012 0 0.00% 0 0.00% 0 0.00% 0 0.00% 0 0.00% 0 0.00% 0 0.00% 0 0.00% 0 0.00%
PHYSICS 2013 0 0.00% 0 0.00% 0 0.00% 0 0.00% 0 0.00% 0 0.00% 0 0.00% 0 0.00% 0 0.00%
PHYSICS 2014 0 0.00% 0 0.00% 0 0.00% 0 0.00% 0 0.00% 0 0.00% 0 0.00% 0 0.00% 0 0.00%
PSYCH SERVICES 2008 2 66.67% 0 0.00% 0 0.00% 0 0.00% 0 0.00% 0 0.00% 0 0.00% 1 33.33% 3 100.00%
PSYCH SERVICES 2009 1 20.00% 1 20.00% 1 20.00% 1 20.00% 0 0.00% 1 20.00% 0 0.00% 0 0.00% 5 100.00%
PSYCH SERVICES 2010 1 50.00% 0 0.00% 0 0.00% 1 50.00% 0 0.00% 0 0.00% 0 0.00% 0 0.00% 2 100.00%
PSYCH SERVICES 2011 1 50.00% 0 0.00% 0 0.00% 1 50.00% 0 0.00% 0 0.00% 0 0.00% 0 0.00% 2 100.00%
PSYCH SERVICES 2012 1 50.00% 0 0.00% 0 0.00% 1 50.00% 0 0.00% 0 0.00% 0 0.00% 0 0.00% 2 100.00%
PSYCH SERVICES 2013 0 0.00% 0 0.00% 0 0.00% 0 0.00% 0 0.00% 0 0.00% 0 0.00% 0 0.00% 0 0.00%
PSYCH SERVICES 2014 0 0.00% 0 0.00% 0 0.00% 0 0.00% 0 0.00% 0 0.00% 0 0.00% 0 0.00% 0 0.00%
PSYCHOLOGY 2006 1 12.50% 0 0.00% 1 12.50% 5 62.50% 0 0.00% 1 12.50% 0 0.00% 0 0.00% 8 100.00%
PSYCHOLOGY 2007 1 12.50% 0 0.00% 1 12.50% 5 62.50% 0 0.00% 1 12.50% 0 0.00% 0 0.00% 8 100.00%
PSYCHOLOGY 2008 1 12.50% 0 0.00% 1 12.50% 5 62.50% 0 0.00% 1 12.50% 0 0.00% 0 0.00% 8 100.00%
PSYCHOLOGY 2009 1 14.29% 0 0.00% 1 14.29% 4 57.14% 0 0.00% 1 14.29% 0 0.00% 0 0.00% 7 100.00%
PSYCHOLOGY 2010 1 14.29% 0 0.00% 1 14.29% 3 42.86% 0 0.00% 2 28.57% 0 0.00% 0 0.00% 7 100.00%
PSYCHOLOGY 2011 1 12.50% 0 0.00% 1 12.50% 4 50.00% 0 0.00% 2 25.00% 0 0.00% 0 0.00% 8 100.00%
PSYCHOLOGY 2012 1 12.50% 0 0.00% 1 12.50% 4 50.00% 0 0.00% 2 25.00% 0 0.00% 0 0.00% 8 100.00%
PSYCHOLOGY 2013 1 14.29% 0 0.00% 1 14.29% 3 42.86% 0 0.00% 2 28.57% 0 0.00% 0 0.00% 7 100.00%
PSYCHOLOGY 2014 1 12.50% 0 0.00% 1 12.50% 3 37.50% 0 0.00% 2 25.00% 0 0.00% 1 12.50% 8 100.00%
STUDENT LIFE 2006 1 100.00% 0 0.00% 0 0.00% 0 0.00% 0 0.00% 0 0.00% 0 0.00% 0 0.00% 1 100.00%
STUDENT LIFE 2007 1 100.00% 0 0.00% 0 0.00% 0 0.00% 0 0.00% 0 0.00% 0 0.00% 0 0.00% 1 100.00%
STUDENT LIFE 2008 1 100.00% 0 0.00% 0 0.00% 0 0.00% 0 0.00% 0 0.00% 0 0.00% 0 0.00% 1 100.00%
STUDENT LIFE 2009 1 100.00% 0 0.00% 0 0.00% 0 0.00% 0 0.00% 0 0.00% 0 0.00% 0 0.00% 1 100.00%
STUDENT LIFE 2010 1 100.00% 0 0.00% 0 0.00% 0 0.00% 0 0.00% 0 0.00% 0 0.00% 0 0.00% 1 100.00%
STUDENT LIFE 2011 1 100.00% 0 0.00% 0 0.00% 0 0.00% 0 0.00% 0 0.00% 0 0.00% 0 0.00% 1 100.00%
STUDENT LIFE 2012 1 100.00% 0 0.00% 0 0.00% 0 0.00% 0 0.00% 0 0.00% 0 0.00% 0 0.00% 1 100.00%
STUDENT LIFE 2013 0 0.00% 0 0.00% 0 0.00% 0 0.00% 0 0.00% 0 0.00% 0 0.00% 0 0.00% 0 0.00%
STUDENT LIFE 2014 0 0.00% 0 0.00% 0 0.00% 0 0.00% 0 0.00% 0 0.00% 0 0.00% 0 0.00% 0 0.00%
THEATRE ARTS 2006 0 0.00% 0 0.00% 1 25.00% 3 75.00% 0 0.00% 0 0.00% 0 0.00% 0 0.00% 4 100.00%
THEATRE ARTS 2007 0 0.00% 0 0.00% 1 25.00% 3 75.00% 0 0.00% 0 0.00% 0 0.00% 0 0.00% 4 100.00%
Page 9 of 10 10/1/2015

Santa Monica College
Full-time Faculty
Ethnicity by Department
2006-2014
Number % Number % Number % Number % Number % Number % Number % Number % Number %
Full Time Faculty - Diversity by Department - 2006-2014
Department
African American/ Black
American Indian/
Native American Asian Pacific Islander
Year
Multi-Racial/ Unknown TotalCaucasian/ White Filipino Hispanic
THEATRE ARTS 2008 0 0.00% 0 0.00% 1 25.00% 3 75.00% 0 0.00% 0 0.00% 0 0.00% 0 0.00% 4 100.00%
THEATRE ARTS 2009 0 0.00% 0 0.00% 1 25.00% 3 75.00% 0 0.00% 0 0.00% 0 0.00% 0 0.00% 4 100.00%
THEATRE ARTS 2010 0 0.00% 0 0.00% 1 25.00% 3 75.00% 0 0.00% 0 0.00% 0 0.00% 0 0.00% 4 100.00%
THEATRE ARTS 2011 0 0.00% 0 0.00% 1 25.00% 3 75.00% 0 0.00% 0 0.00% 0 0.00% 0 0.00% 4 100.00%
THEATRE ARTS 2012 0 0.00% 0 0.00% 1 25.00% 3 75.00% 0 0.00% 0 0.00% 0 0.00% 0 0.00% 4 100.00%
THEATRE ARTS 2013 0 0.00% 0 0.00% 1 25.00% 3 75.00% 0 0.00% 0 0.00% 0 0.00% 0 0.00% 4 100.00%
THEATRE ARTS 2014 0 0.00% 0 0.00% 1 25.00% 3 75.00% 0 0.00% 0 0.00% 0 0.00% 0 0.00% 4 100.00%
WELCOME CENTER 2006 0 0.00% 0 0.00% 0 0.00% 0 0.00% 0 0.00% 1 100.00% 0 0.00% 0 0.00% 1 100.00%
WELCOME CENTER 2007 0 0.00% 0 0.00% 0 0.00% 0 0.00% 0 0.00% 1 100.00% 0 0.00% 0 0.00% 1 100.00%
WELCOME CENTER 2008 0 0.00% 0 0.00% 0 0.00% 0 0.00% 0 0.00% 1 100.00% 0 0.00% 0 0.00% 1 100.00%
WELCOME CENTER 2009 0 0.00% 0 0.00% 0 0.00% 0 0.00% 0 0.00% 1 100.00% 0 0.00% 0 0.00% 1 100.00%
WELCOME CENTER 2010 0 0.00% 0 0.00% 0 0.00% 0 0.00% 0 0.00% 1 100.00% 0 0.00% 0 0.00% 1 100.00%
WELCOME CENTER 2011 0 0.00% 0 0.00% 0 0.00% 0 0.00% 0 0.00% 1 100.00% 0 0.00% 0 0.00% 1 100.00%
WELCOME CENTER 2012 0 0.00% 0 0.00% 0 0.00% 0 0.00% 0 0.00% 1 100.00% 0 0.00% 0 0.00% 1 100.00%
WELCOME CENTER 2013 0 0.00% 0 0.00% 0 0.00% 0 0.00% 0 0.00% 0 0.00% 0 0.00% 0 0.00% 0 0.00%
WELCOME CENTER 2014 0 0.00% 0 0.00% 0 0.00% 0 0.00% 0 0.00% 0 0.00% 0 0.00% 0 0.00% 0 0.00%
2006 TOTALS 2006 37 12.05% 0 0.00% 25 8.14% 201 65.47% 3 0.98% 38 12.38% 0 0.00% 3 0.98% 307 100.00%
2007 TOTALS 2007 38 12.03% 0 0.00% 24 7.59% 205 64.87% 3 0.95% 37 11.71% 0 0.00% 9 2.85% 316 100.00%
2008 TOTALS 2008 36 11.39% 0 0.00% 25 7.91% 201 63.61% 3 0.95% 38 12.03% 0 0.00% 13 4.11% 316 100.00%
2009 TOTALS 2009 36 11.58% 0 0.00% 28 9.00% 202 64.95% 3 0.96% 39 12.54% 0 0.00% 3 0.96% 311 100.00%
2010 TOTALS 2010 36 11.61% 0 0.00% 28 9.03% 198 63.87% 3 0.97% 41 13.23% 0 0.00% 4 1.29% 310 100.00%
2011 TOTALS 2011 36 11.54% 0 0.00% 31 9.94% 191 61.22% 3 0.96% 44 14.10% 0 0.00% 7 2.24% 312 100.00%
2012 TOTALS 2012 37 11.64% 0 0.00% 33 10.38% 193 60.69% 3 0.94% 44 13.84% 2 0.63% 6 1.89% 318 100.00%
2013 TOTALS 2013 37 11.97% 0 0.00% 36 11.65% 184 59.55% 3 0.97% 44 14.24% 2 0.65% 3 0.97% 309 100.00%
2014 TOTALS 2014 35 11.25% 0 0.00% 38 12.22% 183 58.84% 3 0.96% 46 14.79% 1 0.32% 5 1.61% 311 100.00%
Page 10 of 10 10/1/2015

46 | P a g e
Appendix 5
Part-Time Faculty by Department

Santa Monica CollegeDiversity Report
Part-time Faculty Ethnicity by DepartmentFall 2006-2012
Page 1 of 910/1/201512:48 PM
Year Number % Number % Number % Number % Number % Number % Number % Number % Number %ACAD OF ENTER 2006 1 33.33% 0 0.00% 0 0.00% 0 0.00% 0 0.00% 0 0.00% 0 0.00% 2 66.67% 3 100.00%ACAD OF ENTER 2007 1 33.33% 0 0.00% 0 0.00% 1 33.33% 0 0.00% 0 0.00% 0 0.00% 1 33.33% 3 100.00%ACAD OF ENTER 2008 1 33.33% 0 0.00% 0 0.00% 1 33.33% 0 0.00% 0 0.00% 0 0.00% 1 33.33% 3 100.00%ACAD OF ENTER 2009 0 0.00% 0 0.00% 0 0.00% 0 0.00% 0 0.00% 0 0.00% 0 0.00% 0 0.00% 0 0.00%ACAD OF ENTER 2010 0 0.00% 0 0.00% 0 0.00% 0 0.00% 0 0.00% 0 0.00% 0 0.00% 0 0.00% 0 0.00%ACAD OF ENTER 2011 0 0.00% 0 0.00% 0 0.00% 0 0.00% 0 0.00% 0 0.00% 0 0.00% 0 0.00% 0 0.00%ACAD OF ENTER 2012 0 0.00% 0 0.00% 0 0.00% 1 100.00% 0 0.00% 0 0.00% 0 0.00% 0 0.00% 1 100.00%ACAD OF ENTER 2013 0 0.00% 0 0.00% 0 0.00% 0 0.00% 0 0.00% 0 0.00% 0 0.00% 0 0.00% 0 0.00%ACAD OF ENTER 2014 0 0.00% 0 0.00% 0 0.00% 0 0.00% 0 0.00% 0 0.00% 0 0.00% 0 0.00% 0 0.00%
ACAD. AFFAIRS 2006 0 0.00% 0 0.00% 0 0.00% 1 100.00% 0 0.00% 0 0.00% 0 0.00% 0 0.00% 1 100.00%ACAD. AFFAIRS 2007 0 0.00% 0 0.00% 0 0.00% 0 0.00% 0 0.00% 0 0.00% 0 0.00% 0 0.00% 0 0.00%ACAD. AFFAIRS 2008 0 0.00% 0 0.00% 0 0.00% 0 0.00% 0 0.00% 0 0.00% 0 0.00% 0 0.00% 0 0.00%ACAD. AFFAIRS 2009 0 0.00% 0 0.00% 0 0.00% 0 0.00% 0 0.00% 0 0.00% 0 0.00% 0 0.00% 0 0.00%ACAD. AFFAIRS 2010 0 0.00% 0 0.00% 0 0.00% 0 0.00% 0 0.00% 0 0.00% 0 0.00% 0 0.00% 0 0.00%ACAD. AFFAIRS 2011 0 0.00% 0 0.00% 0 0.00% 0 0.00% 0 0.00% 0 0.00% 0 0.00% 0 0.00% 0 0.00%ACAD. AFFAIRS 2012 0 0.00% 0 0.00% 0 0.00% 0 0.00% 0 0.00% 0 0.00% 0 0.00% 0 0.00% 0 0.00%ACAD. AFFAIRS 2013 0 0.00% 0 0.00% 0 0.00% 0 0.00% 0 0.00% 0 0.00% 0 0.00% 0 0.00% 0 0.00%ACAD. AFFAIRS 2014 0 0.00% 0 0.00% 0 0.00% 0 0.00% 0 0.00% 0 0.00% 0 0.00% 0 0.00% 0 0.00%
ART 2006 3 6.98% 0 0.00% 4 9.30% 28 65.12% 0 0.00% 2 4.65% 0 0.00% 6 13.95% 43 100.00%ART 2007 3 7.50% 0 0.00% 5 12.50% 26 65.00% 0 0.00% 1 2.50% 0 0.00% 5 12.50% 40 100.00%ART 2008 2 4.88% 0 0.00% 6 14.63% 28 68.29% 0 0.00% 0 0.00% 0 0.00% 5 12.20% 41 100.00%ART 2009 2 5.56% 0 0.00% 6 16.67% 23 63.89% 0 0.00% 0 0.00% 0 0.00% 5 13.89% 36 100.00%ART 2010 3 7.89% 0 0.00% 6 15.79% 25 65.79% 0 0.00% 0 0.00% 0 0.00% 4 10.53% 38 100.00%ART 2011 3 9.38% 0 0.00% 5 15.63% 21 65.63% 0 0.00% 0 0.00% 0 0.00% 3 9.38% 32 100.00%ART 2012 3 8.57% 0 0.00% 5 14.29% 25 71.43% 0 0.00% 0 0.00% 0 0.00% 2 5.71% 35 100.00%ART 2013 3 7.69% 0 0.00% 4 10.26% 27 69.23% 0 0.00% 3 7.69% 0 0.00% 2 5.13% 39 100.00%ART 2014 1 2.44% 0 0.00% 4 9.76% 32 78.04% 0 0.00% 2 4.88% 0 0.00% 2 4.88% 41 100.00%
ATHLETICS 2006 2 14.29% 0 0.00% 0 0.00% 4 28.57% 0 0.00% 1 7.14% 0 0.00% 7 50.00% 14 100.00%ATHLETICS 2007 1 7.69% 0 0.00% 0 0.00% 5 38.46% 0 0.00% 1 7.69% 0 0.00% 6 46.15% 13 100.00%ATHLETICS 2008 0 0.00% 0 0.00% 0 0.00% 5 38.46% 0 0.00% 2 15.38% 0 0.00% 6 46.15% 13 100.00%ATHLETICS 2009 1 7.69% 0 0.00% 0 0.00% 6 46.15% 0 0.00% 2 15.38% 0 0.00% 4 30.77% 13 100.00%ATHLETICS 2010 1 6.67% 0 0.00% 0 0.00% 7 46.67% 0 0.00% 3 20.00% 0 0.00% 4 26.67% 15 100.00%ATHLETICS 2011 1 8.33% 0 0.00% 0 0.00% 6 50.00% 0 0.00% 1 8.33% 0 0.00% 4 33.33% 12 100.00%ATHLETICS 2012 2 15.38% 0 0.00% 0 0.00% 7 53.85% 0 0.00% 2 15.38% 0 0.00% 2 15.38% 13 100.00%ATHLETICS 2013 3 18.75% 0 0.00% 0 0.00% 9 56.25% 0 0.00% 2 12.50% 0 0.00% 2 12.50% 16 100.00%ATHLETICS 2014 4 22.22% 0 0.00% 0 0.00% 10 55.56% 0 0.00% 2 11.11% 0 0.00% 2 11.10% 18 99.99%
BUSINESS 2006 4 9.52% 0 0.00% 2 4.76% 31 73.81% 0 0.00% 1 2.38% 0 0.00% 4 9.52% 42 100.00%BUSINESS 2007 3 6.67% 0 0.00% 3 6.67% 33 73.33% 0 0.00% 2 4.44% 0 0.00% 4 8.89% 45 100.00%BUSINESS 2008 3 6.82% 0 0.00% 4 9.09% 32 72.73% 0 0.00% 2 4.55% 0 0.00% 3 6.82% 44 100.00%BUSINESS 2009 4 9.09% 0 0.00% 3 6.82% 31 70.45% 0 0.00% 3 6.82% 0 0.00% 3 6.82% 44 100.00%BUSINESS 2010 2 5.13% 0 0.00% 3 7.69% 30 76.92% 0 0.00% 2 5.13% 0 0.00% 2 5.13% 39 100.00%BUSINESS 2011 2 4.88% 0 0.00% 3 7.32% 30 73.17% 0 0.00% 3 7.32% 0 0.00% 3 7.32% 41 100.00%BUSINESS 2012 2 4.88% 0 0.00% 3 7.32% 30 73.17% 0 0.00% 4 9.76% 0 0.00% 2 4.88% 41 100.00%BUSINESS 2013 2 4.65% 0 0.00% 4 9.30% 31 72.09% 0 0.00% 4 9.30% 0 0.00% 2 4.65% 43 100.00%BUSINESS 2014 2 4.17% 0 0.00% 5 10.42% 35 72.92% 0 0.00% 4 8.33% 0 0.00% 2 4.17% 48 100.00%
COMMUNICATIONS 2006 3 6.67% 0 0.00% 0 0.00% 29 64.44% 0 0.00% 2 4.44% 1 2.22% 10 22.22% 45 100.00%COMMUNICATIONS 2007 3 6.98% 0 0.00% 0 0.00% 30 69.77% 0 0.00% 2 4.65% 1 2.33% 7 16.28% 43 100.00%COMMUNICATIONS 2008 3 6.67% 0 0.00% 0 0.00% 32 71.11% 0 0.00% 2 4.44% 1 2.22% 7 15.56% 45 100.00%COMMUNICATIONS 2009 3 6.82% 0 0.00% 0 0.00% 31 70.45% 0 0.00% 2 4.55% 1 2.27% 7 15.91% 44 100.00%COMMUNICATIONS 2010 4 8.70% 0 0.00% 0 0.00% 33 71.74% 0 0.00% 1 2.17% 1 2.17% 7 15.22% 46 100.00%
Total
Part Time Faculty Ethnicity by Department - 2006-2014
Department
African American/ Black
American Indian/ Native American Asian Caucasian/ White Filipino Hispanic Pacific Islander Unknown/Multi-Races

Santa Monica CollegeDiversity Report
Part-time Faculty Ethnicity by DepartmentFall 2006-2012
Page 2 of 910/1/201512:48 PM
Year Number % Number % Number % Number % Number % Number % Number % Number % Number %Total
Part Time Faculty Ethnicity by Department - 2006-2014
Department
African American/ Black
American Indian/ Native American Asian Caucasian/ White Filipino Hispanic Pacific Islander Unknown/Multi-Races
COMMUNICATIONS 2011 3 6.52% 0 0.00% 0 0.00% 35 76.09% 0 0.00% 1 2.17% 1 2.17% 6 13.04% 46 100.00%COMMUNICATIONS 2012 6 11.32% 0 0.00% 0 0.00% 42 79.25% 0 0.00% 1 1.89% 1 1.89% 3 5.66% 53 100.00%COMMUNICATIONS 2013 7 11.67% 0 0.00% 2 3.33% 47 78.33% 0 0.00% 0 0.00% 1 1.67% 3 5.00% 60 100.00%COMMUNICATIONS 2014 8 12.90% 0 0.00% 0 0.00% 47 75.81% 0 0.00% 1 1.61% 1 1.61% 5 8.06% 62 100.00%
COMMUNITY SERV 2006 0 0.00% 0 0.00% 0 0.00% 1 100.00% 0 0.00% 0 0.00% 0 0.00% 0 0.00% 1 100.00%COMMUNITY SERV 2007 0 0.00% 0 0.00% 0 0.00% 1 100.00% 0 0.00% 0 0.00% 0 0.00% 0 0.00% 1 100.00%COMMUNITY SERV 2008 0 0.00% 0 0.00% 0 0.00% 1 50.00% 0 0.00% 1 50.00% 0 0.00% 0 0.00% 2 100.00%COMMUNITY SERV 2009 0 0.00% 0 0.00% 0 0.00% 1 100.00% 0 0.00% 0 0.00% 0 0.00% 0 0.00% 1 100.00%COMMUNITY SERV 2010 0 0.00% 0 0.00% 0 0.00% 0 0.00% 0 0.00% 0 0.00% 0 0.00% 0 0.00% 0 0.00%COMMUNITY SERV 2011 0 0.00% 0 0.00% 0 0.00% 0 0.00% 0 0.00% 0 0.00% 0 0.00% 0 0.00% 0 0.00%COMMUNITY SERV 2012 0 0.00% 0 0.00% 0 0.00% 0 0.00% 0 0.00% 0 0.00% 0 0.00% 0 0.00% 0 0.00%COMMUNITY SERV 2013 0 0.00% 0 0.00% 0 0.00% 0 0.00% 0 0.00% 0 0.00% 0 0.00% 0 0.00% 0 0.00%COMMUNITY SERV 2014 0 0.00% 0 0.00% 0 0.00% 0 0.00% 0 0.00% 0 0.00% 0 0.00% 0 0.00% 0 0.00%
COSMETOLOGY 2006 1 5.26% 0 0.00% 1 5.26% 9 47.37% 0 0.00% 3 15.79% 0 0.00% 5 26.32% 19 100.00%COSMETOLOGY 2007 5 22.73% 0 0.00% 1 4.55% 8 36.36% 0 0.00% 4 18.18% 0 0.00% 4 18.18% 22 100.00%COSMETOLOGY 2008 5 22.73% 0 0.00% 2 9.09% 6 27.27% 0 0.00% 6 27.27% 0 0.00% 3 13.64% 22 100.00%COSMETOLOGY 2009 5 26.32% 0 0.00% 1 5.26% 6 31.58% 0 0.00% 4 21.05% 0 0.00% 3 15.79% 19 100.00%COSMETOLOGY 2010 4 23.53% 0 0.00% 1 5.88% 5 29.41% 0 0.00% 4 23.53% 0 0.00% 3 17.65% 17 100.00%COSMETOLOGY 2011 4 25.00% 0 0.00% 1 6.25% 5 31.25% 0 0.00% 4 25.00% 0 0.00% 2 12.50% 16 100.00%COSMETOLOGY 2012 4 25.00% 0 0.00% 1 6.25% 5 31.25% 0 0.00% 5 31.25% 0 0.00% 1 6.25% 16 100.00%COSMETOLOGY 2013 4 25.00% 0 0.00% 1 6.25% 5 31.25% 0 0.00% 5 31.25% 0 0.00% 1 6.25% 16 100.00%COSMETOLOGY 2014 4 25.00% 0 0.00% 1 6.25% 5 31.25% 0 0.00% 5 31.25% 0 0.00% 1 6.25% 16 100.00%
COUNSELING 2006 14 20.29% 0 0.00% 3 4.35% 24 34.78% 0 0.00% 12 17.39% 0 0.00% 16 23.19% 69 100.00%COUNSELING 2007 14 19.18% 0 0.00% 4 5.48% 32 43.84% 0 0.00% 11 15.07% 0 0.00% 12 16.44% 73 100.00%COUNSELING 2008 13 16.46% 0 0.00% 4 5.06% 33 41.77% 0 0.00% 17 21.52% 0 0.00% 12 15.19% 79 100.00%COUNSELING 2009 13 18.06% 0 0.00% 4 5.56% 29 40.28% 0 0.00% 17 23.61% 0 0.00% 9 12.50% 72 100.00%COUNSELING 2010 14 19.44% 0 0.00% 3 4.17% 28 38.89% 0 0.00% 17 23.61% 0 0.00% 10 13.89% 72 100.00%COUNSELING 2011 10 15.15% 0 0.00% 3 4.55% 27 40.91% 0 0.00% 17 25.76% 0 0.00% 9 13.64% 66 100.00%COUNSELING 2012 13 19.12% 0 0.00% 2 2.94% 26 38.24% 0 0.00% 21 30.88% 0 0.00% 6 8.82% 68 100.00%COUNSELING 2013 18 17.31% 0 0.00% 6 5.77% 42 40.38% 0 0.00% 30 28.85% 0 0.00% 8 7.69% 104 100.00%COUNSELING 2014 22 16.79% 0 0.00% 8 6.11% 43 32.82% 0 0.00% 47 35.88% 0 0.00% 11 8.40% 131 100.00%
CSIS 2006 2 10.53% 0 0.00% 0 0.00% 14 73.68% 0 0.00% 1 5.26% 0 0.00% 2 10.53% 19 100.00%CSIS 2007 2 11.11% 0 0.00% 0 0.00% 14 77.78% 0 0.00% 1 5.56% 0 0.00% 1 5.56% 18 100.00%CSIS 2008 3 15.00% 0 0.00% 1 5.00% 13 65.00% 0 0.00% 2 10.00% 0 0.00% 1 5.00% 20 100.00%CSIS 2009 3 17.65% 0 0.00% 0 0.00% 12 70.59% 0 0.00% 2 11.76% 0 0.00% 0 0.00% 17 100.00%CSIS 2010 3 17.65% 0 0.00% 0 0.00% 12 70.59% 0 0.00% 2 11.76% 0 0.00% 0 0.00% 17 100.00%CSIS 2011 3 15.79% 0 0.00% 0 0.00% 13 68.42% 0 0.00% 2 10.53% 0 0.00% 1 5.26% 19 100.00%CSIS 2012 3 17.65% 0 0.00% 0 0.00% 11 64.71% 0 0.00% 2 11.76% 0 0.00% 1 5.88% 17 100.00%CSIS 2013 3 11.54% 0 0.00% 2 7.69% 15 57.69% 1 3.85% 4 15.38% 0 0.00% 1 3.85% 26 100.00%CSIS 2014 3 11.54% 0 0.00% 1 3.85% 14 53.85% 1 3.85% 4 15.38% 0 0.00% 3 11.54% 26 100.00%
DANCE 2006 4 23.53% 0 0.00% 0 0.00% 9 52.94% 0 0.00% 2 11.76% 0 0.00% 2 11.76% 17 100.00%DANCE 2007 2 11.76% 0 0.00% 1 5.88% 8 47.06% 0 0.00% 2 11.76% 0 0.00% 4 23.53% 17 100.00%DANCE 2008 5 20.00% 0 0.00% 1 4.00% 14 56.00% 0 0.00% 2 8.00% 0 0.00% 3 12.00% 25 100.00%DANCE 2009 3 15.00% 0 0.00% 1 5.00% 13 65.00% 0 0.00% 3 15.00% 0 0.00% 0 0.00% 20 100.00%DANCE 2010 3 10.71% 0 0.00% 3 10.71% 17 60.71% 0 0.00% 4 14.29% 0 0.00% 1 3.57% 28 100.00%DANCE 2011 2 9.52% 0 0.00% 2 9.52% 13 61.90% 0 0.00% 3 14.29% 0 0.00% 1 4.76% 21 100.00%DANCE 2012 2 8.70% 0 0.00% 2 8.70% 12 52.17% 0 0.00% 5 21.74% 1 4.35% 1 4.35% 23 100.00%DANCE 2013 1 4.76% 0 0.00% 1 4.76% 12 57.14% 0 0.00% 4 19.05% 1 4.76% 2 9.52% 21 100.00%DANCE 2014 1 4.00% 0 0.00% 2 8.00% 13 52.00% 0 0.00% 5 20.00% 1 4.00% 3 12.00% 25 100.00%

Santa Monica CollegeDiversity Report
Part-time Faculty Ethnicity by DepartmentFall 2006-2012
Page 3 of 910/1/201512:48 PM
Year Number % Number % Number % Number % Number % Number % Number % Number % Number %Total
Part Time Faculty Ethnicity by Department - 2006-2014
Department
African American/ Black
American Indian/ Native American Asian Caucasian/ White Filipino Hispanic Pacific Islander Unknown/Multi-Races
DESIGN TECH. 2006 2 5.13% 0 0.00% 0 0.00% 35 89.74% 0 0.00% 0 0.00% 0 0.00% 2 5.13% 39 100.00%DESIGN TECH. 2007 0 0.00% 0 0.00% 0 0.00% 31 91.18% 0 0.00% 1 2.94% 0 0.00% 2 5.88% 34 100.00%DESIGN TECH. 2008 2 4.55% 0 0.00% 0 0.00% 37 84.09% 0 0.00% 2 4.55% 0 0.00% 3 6.82% 44 100.00%DESIGN TECH. 2009 2 4.76% 0 0.00% 1 2.38% 32 76.19% 0 0.00% 3 7.14% 0 0.00% 4 9.52% 42 100.00%DESIGN TECH. 2010 1 2.70% 0 0.00% 1 2.70% 32 86.49% 0 0.00% 1 2.70% 0 0.00% 2 5.41% 37 100.00%DESIGN TECH. 2011 1 2.38% 0 0.00% 3 7.14% 36 85.71% 0 0.00% 0 0.00% 0 0.00% 2 4.76% 42 100.00%DESIGN TECH. 2012 2 5.13% 0 0.00% 5 12.82% 31 79.49% 0 0.00% 0 0.00% 0 0.00% 1 2.56% 39 100.00%DESIGN TECH. 2013 1 2.50% 0 0.00% 3 7.50% 34 85.00% 0 0.00% 1 2.50% 0 0.00% 1 2.50% 40 100.00%DESIGN TECH. 2014 1 2.04% 0 0.00% 2 4.08% 41 83.67% 0 0.00% 2 4.08% 0 0.00% 3 6.12% 49 100.00%
DISABL STU CTR 2006 1 5.88% 0 0.00% 1 5.88% 10 58.82% 0 0.00% 1 5.88% 0 0.00% 4 23.53% 17 100.00%DISABL STU CTR 2007 1 6.25% 0 0.00% 1 6.25% 10 62.50% 0 0.00% 0 0.00% 0 0.00% 4 25.00% 16 100.00%DISABL STU CTR 2008 1 7.69% 0 0.00% 1 7.69% 9 69.23% 0 0.00% 0 0.00% 0 0.00% 2 15.38% 13 100.00%DISABL STU CTR 2009 1 9.09% 0 0.00% 1 9.09% 8 72.73% 0 0.00% 0 0.00% 0 0.00% 1 9.09% 11 100.00%DISABL STU CTR 2010 1 9.09% 0 0.00% 1 9.09% 8 72.73% 0 0.00% 0 0.00% 0 0.00% 1 9.09% 11 100.00%DISABL STU CTR 2011 1 10.00% 0 0.00% 1 10.00% 7 70.00% 0 0.00% 0 0.00% 0 0.00% 1 10.00% 10 100.00%DISABL STU CTR 2012 1 9.09% 0 0.00% 1 9.09% 9 81.82% 0 0.00% 0 0.00% 0 0.00% 0 0.00% 11 100.00%DISABL STU CTR 2013 0 0.00% 0 0.00% 0 0.00% 0 0.00% 0 0.00% 0 0.00% 0 0.00% 0 0.00% 0 0.00%DISABL STU CTR 2014 0 0.00% 0 0.00% 0 0.00% 0 0.00% 0 0.00% 0 0.00% 0 0.00% 0 0.00% 0 0.00%
EARTH SCIENCE 2006 0 0.00% 0 0.00% 0 0.00% 19 79.17% 0 0.00% 0 0.00% 0 0.00% 5 20.83% 24 100.00%EARTH SCIENCE 2007 0 0.00% 0 0.00% 0 0.00% 20 83.33% 0 0.00% 0 0.00% 0 0.00% 4 16.67% 24 100.00%EARTH SCIENCE 2008 1 4.17% 0 0.00% 0 0.00% 21 87.50% 0 0.00% 0 0.00% 0 0.00% 2 8.33% 24 100.00%EARTH SCIENCE 2009 1 5.00% 0 0.00% 0 0.00% 18 90.00% 0 0.00% 0 0.00% 0 0.00% 1 5.00% 20 100.00%EARTH SCIENCE 2010 1 4.76% 0 0.00% 1 4.76% 18 85.71% 0 0.00% 0 0.00% 0 0.00% 1 4.76% 21 100.00%EARTH SCIENCE 2011 2 10.00% 0 0.00% 0 0.00% 16 80.00% 0 0.00% 0 0.00% 0 0.00% 2 10.00% 20 100.00%EARTH SCIENCE 2012 1 4.35% 0 0.00% 1 4.35% 18 78.26% 0 0.00% 1 4.35% 0 0.00% 2 8.70% 23 100.00%EARTH SCIENCE 2013 1 5.00% 0 0.00% 0 0.00% 16 80.00% 0 0.00% 2 10.00% 0 0.00% 1 5.00% 20 100.00%EARTH SCIENCE 2014 1 5.00% 0 0.00% 0 0.00% 18 90.00% 0 0.00% 1 5.00% 0 0.00% 0 0.00% 20 100.00%

Santa Monica CollegeDiversity Report
Part-time Faculty Ethnicity by DepartmentFall 2006-2012
Page 4 of 910/1/201512:48 PM
Year Number % Number % Number % Number % Number % Number % Number % Number % Number %Total
Part Time Faculty Ethnicity by Department - 2006-2014
Department
African American/ Black
American Indian/ Native American Asian Caucasian/ White Filipino Hispanic Pacific Islander Unknown/Multi-Races
EDUCATION/ECE 2006 0 0.00% 0 0.00% 0 0.00% 8 88.89% 0 0.00% 1 11.11% 0 0.00% 0 0.00% 9 100.00%EDUCATION/ECE 2007 1 11.11% 0 0.00% 0 0.00% 7 77.78% 0 0.00% 1 11.11% 0 0.00% 0 0.00% 9 100.00%EDUCATION/ECE 2008 1 9.09% 0 0.00% 0 0.00% 8 72.73% 0 0.00% 2 18.18% 0 0.00% 0 0.00% 11 100.00%EDUCATION/ECE 2009 1 10.00% 0 0.00% 0 0.00% 7 70.00% 0 0.00% 2 20.00% 0 0.00% 0 0.00% 10 100.00%EDUCATION/ECE 2010 1 9.09% 0 0.00% 0 0.00% 7 63.64% 0 0.00% 2 18.18% 0 0.00% 1 9.09% 11 100.00%EDUCATION/ECE 2011 1 11.11% 0 0.00% 0 0.00% 7 77.78% 0 0.00% 1 11.11% 0 0.00% 0 0.00% 9 100.00%EDUCATION/ECE 2012 0 0.00% 0 0.00% 1 8.33% 10 83.33% 0 0.00% 1 8.33% 0 0.00% 0 0.00% 12 100.00%EDUCATION/ECE 2013 1 5.88% 0 0.00% 0 0.00% 13 76.47% 0 0.00% 2 11.76% 0 0.00% 1 5.88% 17 100.00%EDUCATION/ECE 2014 1 5.88% 0 0.00% 1 5.88% 13 76.47% 0 0.00% 1 5.88% 0 0.00% 1 5.88% 17 100.00%
EMERITUS 2006 3 3.95% 0 0.00% 5 6.58% 59 77.63% 0 0.00% 3 3.95% 0 0.00% 6 7.89% 76 100.00%EMERITUS 2007 3 3.61% 0 0.00% 5 6.02% 65 78.31% 0 0.00% 3 3.61% 0 0.00% 7 8.43% 83 100.00%EMERITUS 2008 3 3.75% 0 0.00% 6 7.50% 60 75.00% 0 0.00% 3 3.75% 0 0.00% 8 10.00% 80 100.00%EMERITUS 2009 4 5.33% 0 0.00% 6 8.00% 56 74.67% 0 0.00% 3 4.00% 0 0.00% 6 8.00% 75 100.00%EMERITUS 2010 4 5.48% 0 0.00% 6 8.22% 56 76.71% 0 0.00% 2 2.74% 0 0.00% 5 6.85% 73 100.00%EMERITUS 2011 4 5.41% 0 0.00% 5 6.76% 58 78.38% 0 0.00% 3 4.05% 0 0.00% 4 5.41% 74 100.00%EMERITUS 2012 4 5.48% 0 0.00% 5 6.85% 59 80.82% 0 0.00% 2 2.74% 0 0.00% 3 4.11% 73 100.00%EMERITUS 2013 4 6.67% 0 0.00% 4 6.67% 49 81.67% 0 0.00% 2 3.33% 0 0.00% 1 1.67% 60 100.00%EMERITUS 2014 4 6.67% 0 0.00% 4 6.67% 48 80.00% 0 0.00% 2 3.33% 0 0.00% 2 3.30% 60 100.00%
ENGLISH 2006 1 0.90% 0 0.00% 4 3.60% 84 75.68% 0 0.00% 4 3.60% 0 0.00% 18 16.22% 111 100.00%ENGLISH 2007 4 3.36% 0 0.00% 4 3.36% 92 77.31% 0 0.00% 3 2.52% 0 0.00% 16 13.45% 119 100.00%ENGLISH 2008 5 4.20% 0 0.00% 4 3.36% 95 79.83% 0 0.00% 4 3.36% 0 0.00% 11 9.24% 119 100.00%ENGLISH 2009 4 3.67% 0 0.00% 4 3.67% 89 81.65% 0 0.00% 4 3.67% 0 0.00% 8 7.34% 109 100.00%ENGLISH 2010 4 3.64% 0 0.00% 3 2.73% 89 80.91% 0 0.00% 5 4.55% 0 0.00% 9 8.18% 110 100.00%ENGLISH 2011 2 1.89% 0 0.00% 4 3.77% 86 81.13% 0 0.00% 5 4.72% 0 0.00% 9 8.49% 106 100.00%ENGLISH 2012 1 0.88% 0 0.00% 7 6.14% 88 77.19% 1 0.88% 9 7.89% 0 0.00% 8 7.02% 114 100.00%ENGLISH 2013 1 0.85% 0 0.00% 8 6.84% 87 74.36% 1 0.85% 12 10.26% 0 0.00% 8 6.84% 117 100.00%ENGLISH 2014 1 0.97% 0 0.00% 5 4.85% 76 73.79% 1 0.97% 12 11.65% 0 0.00% 8 7.77% 103 100.00%
EOPS 2006 1 100.00% 0 0.00% 0 0.00% 0 0.00% 0 0.00% 0 0.00% 0 0.00% 0 0.00% 1 100.00%EOPS 2007 1 100.00% 0 0.00% 0 0.00% 0 0.00% 0 0.00% 0 0.00% 0 0.00% 0 0.00% 1 100.00%EOPS 2008 1 100.00% 0 0.00% 0 0.00% 0 0.00% 0 0.00% 0 0.00% 0 0.00% 0 0.00% 1 100.00%EOPS 2009 1 100.00% 0 0.00% 0 0.00% 0 0.00% 0 0.00% 0 0.00% 0 0.00% 0 0.00% 1 100.00%EOPS 2010 1 100.00% 0 0.00% 0 0.00% 0 0.00% 0 0.00% 0 0.00% 0 0.00% 0 0.00% 1 100.00%EOPS 2011 1 100.00% 0 0.00% 0 0.00% 0 0.00% 0 0.00% 0 0.00% 0 0.00% 0 0.00% 1 100.00%EOPS 2012 1 25.00% 0 0.00% 0 0.00% 1 25.00% 0 0.00% 1 25.00% 0 0.00% 1 25.00% 4 100.00%EOPS 2013 0 0.00% 0 0.00% 0 0.00% 1 100.00% 0 0.00% 0 0.00% 0 0.00% 0 0.00% 1 100.00%EOPS 2014 0 0.00% 0 0.00% 0 0.00% 0 0.00% 0 0.00% 0 0.00% 0 0.00% 0 0.00% 0 0.00%
ESL 2006 1 4.00% 0 0.00% 0 0.00% 23 92.00% 0 0.00% 0 0.00% 0 0.00% 1 4.00% 25 100.00%ESL 2007 1 3.57% 0 0.00% 1 3.57% 25 89.29% 0 0.00% 0 0.00% 0 0.00% 1 3.57% 28 100.00%ESL 2008 1 3.33% 0 0.00% 1 3.33% 23 76.67% 0 0.00% 1 3.33% 0 0.00% 4 13.33% 30 100.00%ESL 2009 0 0.00% 0 0.00% 0 0.00% 27 87.10% 0 0.00% 0 0.00% 0 0.00% 4 12.90% 31 100.00%ESL 2010 0 0.00% 0 0.00% 2 7.41% 19 70.37% 0 0.00% 1 3.70% 0 0.00% 5 18.52% 27 100.00%ESL 2011 0 0.00% 0 0.00% 4 13.79% 20 68.97% 0 0.00% 2 6.90% 1 3.45% 2 6.90% 29 100.00%ESL 2012 0 0.00% 0 0.00% 3 9.09% 22 66.67% 1 3.03% 5 15.15% 1 3.03% 1 3.03% 33 100.00%ESL 2013 0 0.00% 0 0.00% 5 14.71% 24 70.59% 1 2.94% 1 2.94% 1 2.94% 2 5.88% 34 100.00%ESL 2014 0 0.00% 0 0.00% 5 16.13% 22 70.97% 1 3.23% 0 0.00% 1 3.23% 2 6.45% 31 100.00%
HEALTH SCIENCES 2006 4 22.22% 0 0.00% 0 0.00% 9 50.00% 2 11.11% 0 0.00% 0 0.00% 3 16.67% 18 100.00%HEALTH SCIENCES 2007 5 22.73% 0 0.00% 4 18.18% 10 45.45% 1 4.55% 0 0.00% 0 0.00% 2 9.09% 22 100.00%HEALTH SCIENCES 2008 5 17.86% 0 0.00% 3 10.71% 15 53.57% 2 7.14% 1 3.57% 0 0.00% 2 7.14% 28 100.00%HEALTH SCIENCES 2009 6 20.69% 0 0.00% 3 10.34% 14 48.28% 4 13.79% 1 3.45% 0 0.00% 1 3.45% 29 100.00%

Santa Monica CollegeDiversity Report
Part-time Faculty Ethnicity by DepartmentFall 2006-2012
Page 5 of 910/1/201512:48 PM
Year Number % Number % Number % Number % Number % Number % Number % Number % Number %Total
Part Time Faculty Ethnicity by Department - 2006-2014
Department
African American/ Black
American Indian/ Native American Asian Caucasian/ White Filipino Hispanic Pacific Islander Unknown/Multi-Races
HEALTH SCIENCES 2010 2 7.41% 0 0.00% 2 7.41% 16 59.26% 2 7.41% 2 7.41% 0 0.00% 3 11.11% 27 100.00%HEALTH SCIENCES 2011 2 9.52% 0 0.00% 1 4.76% 10 47.62% 2 9.52% 3 14.29% 0 0.00% 3 14.29% 21 100.00%HEALTH SCIENCES 2012 3 12.50% 0 0.00% 2 8.33% 14 58.33% 3 12.50% 2 8.33% 0 0.00% 0 0.00% 24 100.00%HEALTH SCIENCES 2013 4 16.00% 0 0.00% 2 8.00% 14 56.00% 3 12.00% 2 8.00% 0 0.00% 0 0.00% 25 100.00%HEALTH SCIENCES 2014 5 21.74% 0 0.00% 1 4.35% 13 56.52% 3 13.04% 1 4.35% 0 0.00% 0 0.00% 23 100.00%
HISTORY 2006 4 11.76% 0 0.00% 2 5.88% 14 41.18% 1 2.94% 4 11.76% 0 0.00% 9 26.47% 34 100.00%HISTORY 2007 2 8.00% 0 0.00% 1 4.00% 13 52.00% 1 4.00% 3 12.00% 0 0.00% 5 20.00% 25 100.00%HISTORY 2008 3 11.11% 0 0.00% 1 3.70% 13 48.15% 1 3.70% 4 14.81% 0 0.00% 5 18.52% 27 100.00%HISTORY 2009 3 12.50% 0 0.00% 1 4.17% 12 50.00% 1 4.17% 3 12.50% 0 0.00% 4 16.67% 24 100.00%HISTORY 2010 3 11.54% 0 0.00% 1 3.85% 14 53.85% 1 3.85% 3 11.54% 0 0.00% 4 15.38% 26 100.00%HISTORY 2011 1 4.17% 0 0.00% 1 4.17% 13 54.17% 1 4.17% 3 12.50% 0 0.00% 5 20.83% 24 100.00%HISTORY 2012 1 3.85% 0 0.00% 1 3.85% 16 61.54% 1 3.85% 3 11.54% 0 0.00% 4 15.38% 26 100.00%HISTORY 2013 1 3.57% 0 0.00% 1 3.57% 17 60.71% 1 3.57% 3 10.71% 0 0.00% 5 17.86% 28 100.00%HISTORY 2014 2 7.41% 0 0.00% 1 3.70% 17 62.96% 1 3.70% 3 11.11% 0 0.00% 3 11.11% 27 100.00%
ISC 2006 0 0.00% 0 0.00% 2 28.57% 2 28.57% 0 0.00% 2 28.57% 0 0.00% 1 14.29% 7 100.00%ISC 2007 0 0.00% 0 0.00% 2 28.57% 2 28.57% 0 0.00% 2 28.57% 0 0.00% 1 14.29% 7 100.00%ISC 2008 0 0.00% 0 0.00% 3 42.86% 2 28.57% 0 0.00% 1 14.29% 0 0.00% 1 14.29% 7 100.00%ISC 2009 0 0.00% 0 0.00% 3 42.86% 2 28.57% 0 0.00% 1 14.29% 0 0.00% 1 14.29% 7 100.00%ISC 2010 0 0.00% 0 0.00% 2 33.33% 2 33.33% 0 0.00% 1 16.67% 0 0.00% 1 16.67% 6 100.00%ISC 2011 0 0.00% 0 0.00% 2 33.33% 2 33.33% 0 0.00% 1 16.67% 0 0.00% 1 16.67% 6 100.00%ISC 2012 0 0.00% 0 0.00% 3 42.86% 3 42.86% 0 0.00% 0 0.00% 0 0.00% 1 14.29% 7 100.00%ISC 2013 0 0.00% 0 0.00% 1 50.00% 0 0.00% 0 0.00% 0 0.00% 0 0.00% 1 50.00% 2 100.00%ISC 2014 0 0.00% 0 0.00% 1 50.00% 1 50.00% 0 0.00% 0 0.00% 0 0.00% 0 0.00% 2 100.00%
KINESIOLOGY 2006 2 6.90% 0 0.00% 0 0.00% 17 58.62% 0 0.00% 1 3.45% 0 0.00% 9 31.03% 29 100.00%KINESIOLOGY 2007 2 5.56% 0 0.00% 1 2.78% 22 61.11% 0 0.00% 2 5.56% 0 0.00% 9 25.00% 36 100.00%KINESIOLOGY 2008 1 2.86% 0 0.00% 2 5.71% 22 62.86% 0 0.00% 3 8.57% 0 0.00% 7 20.00% 35 100.00%KINESIOLOGY 2009 2 6.90% 0 0.00% 3 10.34% 20 68.97% 0 0.00% 1 3.45% 0 0.00% 3 10.34% 29 100.00%KINESIOLOGY 2010 1 4.17% 0 0.00% 2 8.33% 17 70.83% 0 0.00% 3 12.50% 0 0.00% 1 4.17% 24 100.00%KINESIOLOGY 2011 0 0.00% 0 0.00% 2 10.53% 13 68.42% 0 0.00% 2 10.53% 0 0.00% 2 10.53% 19 100.00%KINESIOLOGY 2012 1 4.00% 0 0.00% 1 4.00% 19 76.00% 0 0.00% 3 12.00% 0 0.00% 1 4.00% 25 100.00%KINESIOLOGY 2013 1 3.70% 0 0.00% 1 3.70% 21 77.78% 0 0.00% 3 11.11% 0 0.00% 1 3.70% 27 100.00%KINESIOLOGY 2014 1 4.00% 0 0.00% 0 0.00% 21 84.00% 0 0.00% 3 12.00% 0 0.00% 0 0.00% 25 100.00%
LIBRARY 2006 1 12.50% 0 0.00% 0 0.00% 6 75.00% 0 0.00% 0 0.00% 0 0.00% 1 12.50% 8 100.00%LIBRARY 2007 0 0.00% 0 0.00% 0 0.00% 4 80.00% 0 0.00% 0 0.00% 0 0.00% 1 20.00% 5 100.00%LIBRARY 2008 1 14.29% 0 0.00% 0 0.00% 5 71.43% 0 0.00% 0 0.00% 0 0.00% 1 14.29% 7 100.00%LIBRARY 2009 0 0.00% 0 0.00% 0 0.00% 4 80.00% 0 0.00% 0 0.00% 0 0.00% 1 20.00% 5 100.00%LIBRARY 2010 0 0.00% 0 0.00% 0 0.00% 4 80.00% 0 0.00% 0 0.00% 0 0.00% 1 20.00% 5 100.00%LIBRARY 2011 0 0.00% 0 0.00% 0 0.00% 2 66.67% 0 0.00% 0 0.00% 0 0.00% 1 33.33% 3 100.00%LIBRARY 2012 0 0.00% 0 0.00% 0 0.00% 3 100.00% 0 0.00% 0 0.00% 0 0.00% 0 0.00% 3 100.00%LIBRARY 2013 0 0.00% 0 0.00% 0 0.00% 4 100.00% 0 0.00% 0 0.00% 0 0.00% 0 0.00% 4 100.00%LIBRARY 2014 0 0.00% 0 0.00% 0 0.00% 3 100.00% 0 0.00% 0 0.00% 0 0.00% 0 0.00% 3 100.00%
LIFE SCIENCE 2006 1 3.03% 0 0.00% 1 3.03% 21 63.64% 0 0.00% 2 6.06% 0 0.00% 8 24.24% 33 100.00%LIFE SCIENCE 2007 1 2.78% 0 0.00% 1 2.78% 25 69.44% 0 0.00% 2 5.56% 0 0.00% 7 19.44% 36 100.00%LIFE SCIENCE 2008 1 2.63% 0 0.00% 2 5.26% 21 55.26% 0 0.00% 2 5.26% 0 0.00% 12 31.58% 38 100.00%LIFE SCIENCE 2009 1 3.03% 0 0.00% 3 9.09% 19 57.58% 0 0.00% 0 0.00% 0 0.00% 10 30.30% 33 100.00%LIFE SCIENCE 2010 1 2.86% 0 0.00% 3 8.57% 22 62.86% 0 0.00% 2 5.71% 0 0.00% 7 20.00% 35 100.00%LIFE SCIENCE 2011 1 3.45% 0 0.00% 2 6.90% 19 65.52% 0 0.00% 1 3.45% 0 0.00% 6 20.69% 29 100.00%LIFE SCIENCE 2012 1 3.13% 0 0.00% 3 9.38% 22 68.75% 0 0.00% 3 9.38% 0 0.00% 3 9.38% 32 100.00%LIFE SCIENCE 2013 1 2.86% 0 0.00% 3 8.57% 24 68.57% 0 0.00% 3 8.57% 0 0.00% 4 11.43% 35 100.00%LIFE SCIENCE 2014 1 2.78% 0 0.00% 3 8.33% 24 66.67% 0 0.00% 3 8.33% 0 0.00% 5 13.89% 36 100.00%
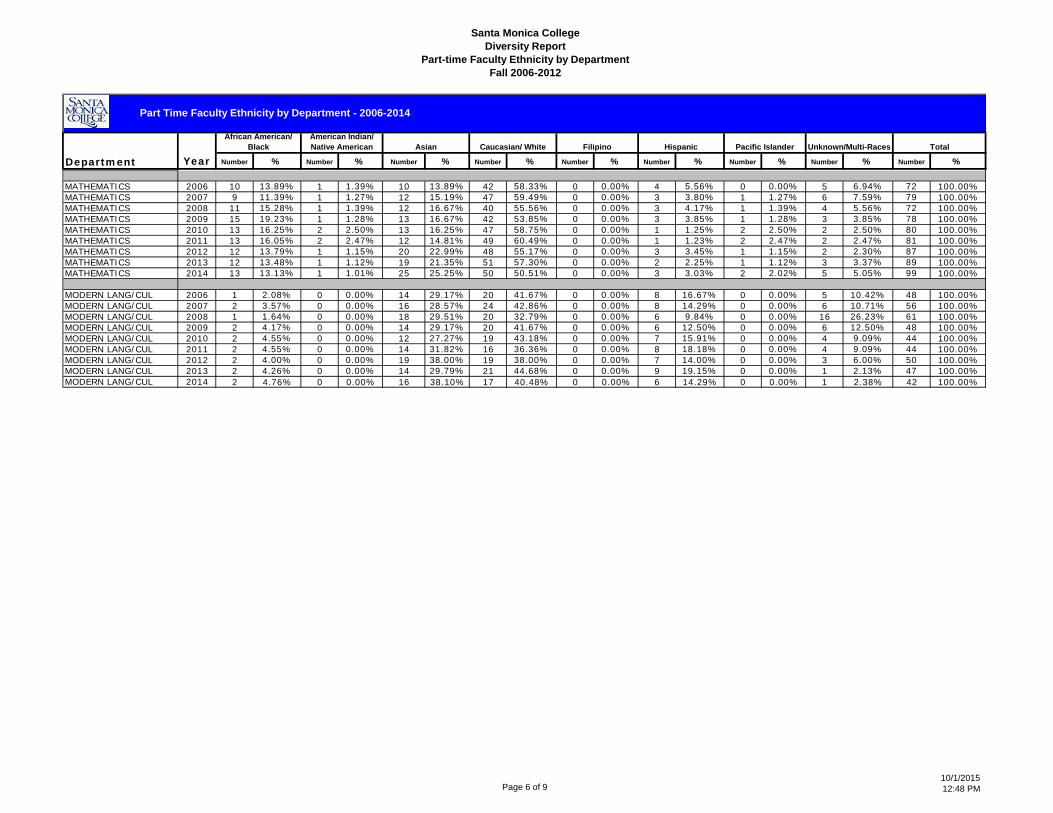
Santa Monica CollegeDiversity Report
Part-time Faculty Ethnicity by DepartmentFall 2006-2012
Page 6 of 910/1/201512:48 PM
Year Number % Number % Number % Number % Number % Number % Number % Number % Number %Total
Part Time Faculty Ethnicity by Department - 2006-2014
Department
African American/ Black
American Indian/ Native American Asian Caucasian/ White Filipino Hispanic Pacific Islander Unknown/Multi-Races
MATHEMATICS 2006 10 13.89% 1 1.39% 10 13.89% 42 58.33% 0 0.00% 4 5.56% 0 0.00% 5 6.94% 72 100.00%MATHEMATICS 2007 9 11.39% 1 1.27% 12 15.19% 47 59.49% 0 0.00% 3 3.80% 1 1.27% 6 7.59% 79 100.00%MATHEMATICS 2008 11 15.28% 1 1.39% 12 16.67% 40 55.56% 0 0.00% 3 4.17% 1 1.39% 4 5.56% 72 100.00%MATHEMATICS 2009 15 19.23% 1 1.28% 13 16.67% 42 53.85% 0 0.00% 3 3.85% 1 1.28% 3 3.85% 78 100.00%MATHEMATICS 2010 13 16.25% 2 2.50% 13 16.25% 47 58.75% 0 0.00% 1 1.25% 2 2.50% 2 2.50% 80 100.00%MATHEMATICS 2011 13 16.05% 2 2.47% 12 14.81% 49 60.49% 0 0.00% 1 1.23% 2 2.47% 2 2.47% 81 100.00%MATHEMATICS 2012 12 13.79% 1 1.15% 20 22.99% 48 55.17% 0 0.00% 3 3.45% 1 1.15% 2 2.30% 87 100.00%MATHEMATICS 2013 12 13.48% 1 1.12% 19 21.35% 51 57.30% 0 0.00% 2 2.25% 1 1.12% 3 3.37% 89 100.00%MATHEMATICS 2014 13 13.13% 1 1.01% 25 25.25% 50 50.51% 0 0.00% 3 3.03% 2 2.02% 5 5.05% 99 100.00%
MODERN LANG/CUL 2006 1 2.08% 0 0.00% 14 29.17% 20 41.67% 0 0.00% 8 16.67% 0 0.00% 5 10.42% 48 100.00%MODERN LANG/CUL 2007 2 3.57% 0 0.00% 16 28.57% 24 42.86% 0 0.00% 8 14.29% 0 0.00% 6 10.71% 56 100.00%MODERN LANG/CUL 2008 1 1.64% 0 0.00% 18 29.51% 20 32.79% 0 0.00% 6 9.84% 0 0.00% 16 26.23% 61 100.00%MODERN LANG/CUL 2009 2 4.17% 0 0.00% 14 29.17% 20 41.67% 0 0.00% 6 12.50% 0 0.00% 6 12.50% 48 100.00%MODERN LANG/CUL 2010 2 4.55% 0 0.00% 12 27.27% 19 43.18% 0 0.00% 7 15.91% 0 0.00% 4 9.09% 44 100.00%MODERN LANG/CUL 2011 2 4.55% 0 0.00% 14 31.82% 16 36.36% 0 0.00% 8 18.18% 0 0.00% 4 9.09% 44 100.00%MODERN LANG/CUL 2012 2 4.00% 0 0.00% 19 38.00% 19 38.00% 0 0.00% 7 14.00% 0 0.00% 3 6.00% 50 100.00%MODERN LANG/CUL 2013 2 4.26% 0 0.00% 14 29.79% 21 44.68% 0 0.00% 9 19.15% 0 0.00% 1 2.13% 47 100.00%MODERN LANG/CUL 2014 2 4.76% 0 0.00% 16 38.10% 17 40.48% 0 0.00% 6 14.29% 0 0.00% 1 2.38% 42 100.00%

Santa Monica CollegeDiversity Report
Part-time Faculty Ethnicity by DepartmentFall 2006-2012
Page 7 of 910/1/201512:48 PM
Year Number % Number % Number % Number % Number % Number % Number % Number % Number %Total
Part Time Faculty Ethnicity by Department - 2006-2014
Department
African American/ Black
American Indian/ Native American Asian Caucasian/ White Filipino Hispanic Pacific Islander Unknown/Multi-Races
MUSIC 2006 2 3.85% 0 0.00% 4 7.69% 37 71.15% 0 0.00% 3 5.77% 0 0.00% 6 11.54% 52 100.00%MUSIC 2007 3 5.26% 0 0.00% 4 7.02% 41 71.93% 1 1.75% 3 5.26% 0 0.00% 5 8.77% 57 100.00%MUSIC 2008 5 8.20% 0 0.00% 3 4.92% 45 73.77% 1 1.64% 3 4.92% 0 0.00% 4 6.56% 61 100.00%MUSIC 2009 4 7.55% 0 0.00% 3 5.66% 39 73.58% 0 0.00% 3 5.66% 0 0.00% 4 7.55% 53 100.00%MUSIC 2010 2 4.55% 0 0.00% 3 6.82% 34 77.27% 1 2.27% 2 4.55% 0 0.00% 2 4.55% 44 100.00%MUSIC 2011 1 2.78% 0 0.00% 3 8.33% 28 77.78% 0 0.00% 2 5.56% 0 0.00% 2 5.56% 36 100.00%MUSIC 2012 2 4.00% 0 0.00% 3 6.00% 39 78.00% 0 0.00% 4 8.00% 0 0.00% 2 4.00% 50 100.00%MUSIC 2013 2 4.17% 0 0.00% 3 6.25% 38 79.17% 0 0.00% 4 8.33% 0 0.00% 1 2.08% 48 100.00%MUSIC 2014 3 6.67% 0 0.00% 2 4.44% 34 75.56% 0 0.00% 4 8.89% 0 0.00% 2 4.44% 45 100.00%
NC EDUCATION 2006 0 0.00% 0 0.00% 0 0.00% 7 63.64% 0 0.00% 2 18.18% 0 0.00% 2 18.18% 11 100.00%NC EDUCATION 2007 0 0.00% 0 0.00% 0 0.00% 7 70.00% 0 0.00% 2 20.00% 0 0.00% 1 10.00% 10 100.00%NC EDUCATION 2008 0 0.00% 0 0.00% 0 0.00% 7 77.78% 0 0.00% 2 22.22% 0 0.00% 0 0.00% 9 100.00%NC EDUCATION 2009 2 13.33% 0 0.00% 0 0.00% 8 53.33% 0 0.00% 1 6.67% 0 0.00% 4 26.67% 15 100.00%NC EDUCATION 2010 0 0.00% 0 0.00% 0 0.00% 6 75.00% 0 0.00% 1 12.50% 0 0.00% 1 12.50% 8 100.00%NC EDUCATION 2011 0 0.00% 0 0.00% 0 0.00% 6 75.00% 0 0.00% 1 12.50% 0 0.00% 1 12.50% 8 100.00%NC EDUCATION 2012 0 0.00% 0 0.00% 0 0.00% 7 87.50% 0 0.00% 1 12.50% 0 0.00% 0 0.00% 8 100.00%NC EDUCATION 2013 0 0.00% 0 0.00% 0 0.00% 6 100.00% 0 0.00% 0 0.00% 0 0.00% 0 0.00% 6 100.00%NC EDUCATION 2014 0 0.00% 0 0.00% 0 0.00% 5 100.00% 0 0.00% 0 0.00% 0 0.00% 0 0.00% 5 100.00%
OFF OF SCH REL 2006 3 37.50% 0 0.00% 0 0.00% 2 25.00% 0 0.00% 3 37.50% 0 0.00% 0 0.00% 8 100.00%OFF OF SCH REL 2007 3 37.50% 0 0.00% 0 0.00% 2 25.00% 0 0.00% 3 37.50% 0 0.00% 0 0.00% 8 100.00%OFF OF SCH REL 2008 3 37.50% 0 0.00% 0 0.00% 2 25.00% 0 0.00% 3 37.50% 0 0.00% 0 0.00% 8 100.00%OFF OF SCH REL 2009 3 37.50% 0 0.00% 0 0.00% 2 25.00% 0 0.00% 3 37.50% 0 0.00% 0 0.00% 8 100.00%OFF OF SCH REL 2010 3 42.86% 0 0.00% 0 0.00% 1 14.29% 0 0.00% 3 42.86% 0 0.00% 0 0.00% 7 100.00%OFF OF SCH REL 2011 3 42.86% 0 0.00% 0 0.00% 1 14.29% 0 0.00% 3 42.86% 0 0.00% 0 0.00% 7 100.00%OFF OF SCH REL 2012 2 33.33% 0 0.00% 0 0.00% 2 33.33% 0 0.00% 2 33.33% 0 0.00% 0 0.00% 6 100.00%OFF OF SCH REL 2013 0 0.00% 0 0.00% 0 0.00% 0 0.00% 0 0.00% 0 0.00% 0 0.00% 0 0.00% 0 0.00%OFF OF SCH REL 2014 0 0.00% 0 0.00% 0 0.00% 0 0.00% 0 0.00% 0 0.00% 0 0.00% 0 0.00% 0 0.00%
PHILOSOPHY/SOCI 2006 4 8.89% 0 0.00% 1 2.22% 29 64.44% 0 0.00% 2 4.44% 0 0.00% 9 20.00% 45 100.00%PHILOSOPHY/SOCI 2007 3 6.98% 0 0.00% 0 0.00% 29 67.44% 0 0.00% 2 4.65% 0 0.00% 9 20.93% 43 100.00%PHILOSOPHY/SOCI 2008 3 6.38% 0 0.00% 0 0.00% 34 72.34% 0 0.00% 3 6.38% 0 0.00% 7 14.89% 47 100.00%PHILOSOPHY/SOCI 2009 3 8.11% 0 0.00% 0 0.00% 28 75.68% 0 0.00% 3 8.11% 0 0.00% 3 8.11% 37 100.00%PHILOSOPHY/SOCI 2010 3 9.38% 0 0.00% 0 0.00% 23 71.88% 0 0.00% 3 9.38% 0 0.00% 3 9.38% 32 100.00%PHILOSOPHY/SOCI 2011 2 8.70% 0 0.00% 0 0.00% 17 73.91% 0 0.00% 2 8.70% 0 0.00% 2 8.70% 23 100.00%PHILOSOPHY/SOCI 2012 2 6.67% 0 0.00% 1 3.33% 24 80.00% 0 0.00% 2 6.67% 0 0.00% 1 3.33% 30 100.00%PHILOSOPHY/SOCI 2013 2 5.88% 0 0.00% 1 2.94% 27 79.41% 0 0.00% 3 8.82% 0 0.00% 1 2.94% 34 100.00%PHILOSOPHY/SOCI 2014 2 6.67% 0 0.00% 0 0.00% 24 80.00% 0 0.00% 2 6.67% 0 0.00% 2 6.67% 30 100.00%
PHOTO - FASHION 2006 0 0.00% 0 0.00% 2 6.90% 19 65.52% 1 3.45% 1 3.45% 0 0.00% 6 20.69% 29 100.00%PHOTO - FASHION 2007 0 0.00% 0 0.00% 1 3.23% 23 74.19% 0 0.00% 1 3.23% 0 0.00% 6 19.35% 31 100.00%PHOTO - FASHION 2008 0 0.00% 0 0.00% 1 3.45% 23 79.31% 1 3.45% 1 3.45% 0 0.00% 3 10.34% 29 100.00%PHOTO - FASHION 2009 1 3.57% 0 0.00% 1 3.57% 21 75.00% 1 3.57% 1 3.57% 0 0.00% 3 10.71% 28 100.00%PHOTO - FASHION 2010 0 0.00% 0 0.00% 2 6.90% 23 79.31% 1 3.45% 1 3.45% 0 0.00% 2 6.90% 29 100.00%PHOTO - FASHION 2011 0 0.00% 0 0.00% 2 7.69% 20 76.92% 1 3.85% 1 3.85% 0 0.00% 2 7.69% 26 100.00%PHOTO - FASHION 2012 0 0.00% 0 0.00% 1 3.57% 23 82.14% 1 3.57% 1 3.57% 0 0.00% 2 7.14% 28 100.00%PHOTO - FASHION 2013 0 0.00% 0 0.00% 2 5.00% 34 85.00% 0 0.00% 2 5.00% 0 0.00% 2 5.00% 40 100.00%PHOTO - FASHION 2014 1 3.13% 0 0.00% 0 0.00% 30 93.75% 0 0.00% 0 0.00% 0 0.00% 1 3.13% 32 100.00%
PHYSICAL SCI 2006 3 10.34% 0 0.00% 2 6.90% 13 44.83% 1 3.45% 1 3.45% 0 0.00% 9 31.03% 29 100.00%PHYSICAL SCI 2007 3 8.82% 0 0.00% 3 8.82% 15 44.12% 1 2.94% 1 2.94% 0 0.00% 11 32.35% 34 100.00%PHYSICAL SCI 2008 3 10.00% 0 0.00% 5 16.67% 14 46.67% 1 3.33% 1 3.33% 0 0.00% 6 20.00% 30 100.00%PHYSICAL SCI 2009 2 6.45% 0 0.00% 5 16.13% 15 48.39% 1 3.23% 2 6.45% 0 0.00% 6 19.35% 31 100.00%

Santa Monica CollegeDiversity Report
Part-time Faculty Ethnicity by DepartmentFall 2006-2012
Page 8 of 910/1/201512:48 PM
Year Number % Number % Number % Number % Number % Number % Number % Number % Number %Total
Part Time Faculty Ethnicity by Department - 2006-2014
Department
African American/ Black
American Indian/ Native American Asian Caucasian/ White Filipino Hispanic Pacific Islander Unknown/Multi-Races
PHYSICAL SCI 2010 2 6.45% 0 0.00% 7 22.58% 16 51.61% 1 3.23% 2 6.45% 0 0.00% 3 9.68% 31 100.00%PHYSICAL SCI 2011 2 7.69% 0 0.00% 5 19.23% 13 50.00% 1 3.85% 2 7.69% 0 0.00% 3 11.54% 26 100.00%PHYSICAL SCI 2012 2 7.14% 0 0.00% 6 21.43% 16 57.14% 1 3.57% 2 7.14% 0 0.00% 1 3.57% 28 100.00%PHYSICAL SCI 2013 2 6.25% 0 0.00% 8 25.00% 15 46.88% 1 3.13% 3 9.38% 0 0.00% 3 9.38% 32 100.00%PHYSICAL SCI 2014 2 6.45% 0 0.00% 7 22.58% 15 48.39% 1 3.23% 3 9.68% 0 0.00% 3 9.68% 31 100.00%
PICO PARTNERSHIP 2012 0 0.00% 0 0.00% 0 0.00% 0 0.00% 0 0.00% 1 50.00% 0 0.00% 1 50.00% 2 100.00%PICO PARTNERSHIP 2013 0 0.00% 0 0.00% 0 0.00% 0 0.00% 0 0.00% 1 100.00% 0 0.00% 0 0.00% 1 100.00%PICO PARTNERSHIP 2014 0 0.00% 0 0.00% 0 0.00% 0 0.00% 0 0.00% 1 100.00% 0 0.00% 0 0.00% 1 100.00%
PROGRAM DEVELOP 2006 0 0.00% 0 0.00% 0 0.00% 1 100.00% 0 0.00% 0 0.00% 0 0.00% 0 0.00% 1 100.00%
PSYCH SERVICES 2006 2 66.67% 0 0.00% 0 0.00% 1 33.33% 0 0.00% 0 0.00% 0 0.00% 0 0.00% 3 100.00%PSYCH SERVICES 2007 1 50.00% 0 0.00% 0 0.00% 0 0.00% 0 0.00% 1 50.00% 0 0.00% 0 0.00% 2 100.00%PSYCH SERVICES 2008 0 0.00% 0 0.00% 0 0.00% 0 0.00% 0 0.00% 1 100.00% 0 0.00% 0 0.00% 1 100.00%PSYCH SERVICES 2009 0 0.00% 0 0.00% 0 0.00% 0 0.00% 0 0.00% 0 0.00% 0 0.00% 0 0.00% 0 0.00%PSYCH SERVICES 2010 0 0.00% 0 0.00% 0 0.00% 0 0.00% 0 0.00% 0 0.00% 0 0.00% 0 0.00% 0 0.00%PSYCH SERVICES 2011 0 0.00% 0 0.00% 0 0.00% 0 0.00% 0 0.00% 0 0.00% 0 0.00% 0 0.00% 0 0.00%PSYCH SERVICES 2012 0 0.00% 0 0.00% 0 0.00% 0 0.00% 0 0.00% 0 0.00% 0 0.00% 0 0.00% 0 0.00%PSYCH SERVICES 2013 0 0.00% 0 0.00% 0 0.00% 0 0.00% 0 0.00% 0 0.00% 0 0.00% 0 0.00% 0 0.00%PSYCH SERVICES 2014 0 0.00% 0 0.00% 0 0.00% 0 0.00% 0 0.00% 0 0.00% 0 0.00% 0 0.00% 0 0.00%
PSYCHOLOGY 2006 1 4.76% 0 0.00% 0 0.00% 20 95.24% 0 0.00% 0 0.00% 0 0.00% 0 0.00% 21 100.00%PSYCHOLOGY 2007 1 5.26% 0 0.00% 0 0.00% 18 94.74% 0 0.00% 0 0.00% 0 0.00% 0 0.00% 19 100.00%PSYCHOLOGY 2008 1 5.00% 0 0.00% 0 0.00% 19 95.00% 0 0.00% 0 0.00% 0 0.00% 0 0.00% 20 100.00%PSYCHOLOGY 2009 2 8.70% 0 0.00% 0 0.00% 19 82.61% 0 0.00% 2 8.70% 0 0.00% 0 0.00% 23 100.00%PSYCHOLOGY 2010 2 10.00% 0 0.00% 0 0.00% 17 85.00% 0 0.00% 1 5.00% 0 0.00% 0 0.00% 20 100.00%PSYCHOLOGY 2011 2 10.53% 0 0.00% 0 0.00% 16 84.21% 0 0.00% 1 5.26% 0 0.00% 0 0.00% 19 100.00%PSYCHOLOGY 2012 2 11.11% 0 0.00% 0 0.00% 15 83.33% 0 0.00% 1 5.56% 0 0.00% 0 0.00% 18 100.00%PSYCHOLOGY 2013 4 16.67% 0 0.00% 0 0.00% 17 70.83% 0 0.00% 2 8.33% 0 0.00% 1 4.17% 24 100.00%PSYCHOLOGY 2014 4 18.18% 0 0.00% 0 0.00% 15 68.18% 0 0.00% 2 9.09% 0 0.00% 1 4.55% 22 100.00%
STUDENT LIFE 2012 0 0.00% 0 0.00% 0 0.00% 0 0.00% 0 0.00% 2 100.00% 0 0.00% 0 0.00% 2 100.00%
THEATRE ARTS 2006 0 0.00% 0 0.00% 1 7.69% 9 69.23% 0 0.00% 1 7.69% 0 0.00% 2 15.38% 13 100.00%THEATRE ARTS 2007 0 0.00% 0 0.00% 1 10.00% 8 80.00% 0 0.00% 0 0.00% 0 0.00% 1 10.00% 10 100.00%THEATRE ARTS 2008 0 0.00% 0 0.00% 1 7.69% 9 69.23% 0 0.00% 0 0.00% 0 0.00% 3 23.08% 13 100.00%THEATRE ARTS 2009 0 0.00% 0 0.00% 0 0.00% 8 66.67% 0 0.00% 0 0.00% 0 0.00% 4 33.33% 12 100.00%THEATRE ARTS 2010 0 0.00% 0 0.00% 0 0.00% 9 81.82% 0 0.00% 0 0.00% 0 0.00% 2 18.18% 11 100.00%THEATRE ARTS 2011 1 9.09% 0 0.00% 0 0.00% 8 72.73% 0 0.00% 0 0.00% 0 0.00% 2 18.18% 11 100.00%THEATRE ARTS 2012 0 0.00% 0 0.00% 0 0.00% 11 84.62% 0 0.00% 0 0.00% 0 0.00% 2 15.38% 13 100.00%THEATRE ARTS 2013 0 0.00% 0 0.00% 0 0.00% 11 84.62% 0 0.00% 0 0.00% 0 0.00% 2 15.38% 13 100.00%THEATRE ARTS 2014 0 0.00% 0 0.00% 0 0.00% 13 86.67% 0 0.00% 0 0.00% 0 0.00% 2 13.33% 15 100.00%
TITLE V 2010 0 0.00% 0 0.00% 0 0.00% 1 100.00% 0 0.00% 0 0.00% 0 0.00% 0 0.00% 1 100.00%TITLE V 2011 0 0.00% 0 0.00% 0 0.00% 0 0.00% 0 0.00% 0 0.00% 0 0.00% 0 0.00% 0 0.00%TITLE V 2012 0 0.00% 0 0.00% 0 0.00% 0 0.00% 0 0.00% 0 0.00% 0 0.00% 0 0.00% 0 0.00%TITLE V 2013 0 0.00% 0 0.00% 0 0.00% 0 0.00% 0 0.00% 0 0.00% 0 0.00% 0 0.00% 0 0.00%TITLE V 2014 0 0.00% 0 0.00% 0 0.00% 0 0.00% 0 0.00% 0 0.00% 0 0.00% 0 0.00% 0 0.00%
TRIO 2006 0 0.00% 0 0.00% 0 0.00% 0 0.00% 0 0.00% 1 100.00% 0 0.00% 0 0.00% 1 100.00%TRIO 2007 0 0.00% 0 0.00% 0 0.00% 0 0.00% 0 0.00% 1 100.00% 0 0.00% 0 0.00% 1 100.00%TRIO 2008 0 0.00% 0 0.00% 0 0.00% 0 0.00% 0 0.00% 1 100.00% 0 0.00% 0 0.00% 1 100.00%TRIO 2009 0 0.00% 0 0.00% 0 0.00% 0 0.00% 0 0.00% 1 100.00% 0 0.00% 0 0.00% 1 100.00%TRIO 2010 0 0.00% 0 0.00% 0 0.00% 0 0.00% 0 0.00% 1 100.00% 0 0.00% 0 0.00% 1 100.00%

Santa Monica CollegeDiversity Report
Part-time Faculty Ethnicity by DepartmentFall 2006-2012
Page 9 of 910/1/201512:48 PM
Year Number % Number % Number % Number % Number % Number % Number % Number % Number %Total
Part Time Faculty Ethnicity by Department - 2006-2014
Department
African American/ Black
American Indian/ Native American Asian Caucasian/ White Filipino Hispanic Pacific Islander Unknown/Multi-Races
TRIO 2011 0 0.00% 0 0.00% 0 0.00% 0 0.00% 0 0.00% 0 0.00% 0 0.00% 0 0.00% 0 0.00%TRIO 2012 0 0.00% 0 0.00% 0 0.00% 0 0.00% 0 0.00% 0 0.00% 0 0.00% 0 0.00% 0 0.00%TRIO 2013 0 0.00% 0 0.00% 0 0.00% 0 0.00% 0 0.00% 0 0.00% 0 0.00% 0 0.00% 0 0.00%TRIO 2014 0 0.00% 0 0.00% 0 0.00% 0 0.00% 0 0.00% 0 0.00% 0 0.00% 0 0.00% 0 0.00%
WELCOME CENTER 2012 1 33.33% 0 0.00% 0 0.00% 0 0.00% 0 0.00% 2 66.67% 0 0.00% 0 0.00% 3 100.00%WELCOME CENTER 2013 0 0.00% 0 0.00% 0 0.00% 0 0.00% 0 0.00% 0 0.00% 0 0.00% 0 0.00% 0 0.00%WELCOME CENTER 2014 0 0.00% 0 0.00% 0 0.00% 0 0.00% 0 0.00% 0 0.00% 0 0.00% 0 0.00% 0 0.00%
WORKFORCE/ECON 2006 0 0.00% 0 0.00% 0 0.00% 0 0.00% 0 0.00% 0 0.00% 0 0.00% 1 100.00% 1 100.00%WORKFORCE/ECON 2007 0 0.00% 0 0.00% 0 0.00% 0 0.00% 0 0.00% 0 0.00% 0 0.00% 0 0.00% 0 0.00%WORKFORCE/ECON 2008 0 0.00% 0 0.00% 0 0.00% 0 0.00% 0 0.00% 0 0.00% 0 0.00% 0 0.00% 0 0.00%WORKFORCE/ECON 2009 0 0.00% 0 0.00% 0 0.00% 0 0.00% 0 0.00% 0 0.00% 0 0.00% 0 0.00% 0 0.00%WORKFORCE/ECON 2010 0 0.00% 0 0.00% 0 0.00% 0 0.00% 0 0.00% 0 0.00% 0 0.00% 0 0.00% 0 0.00%WORKFORCE/ECON 2011 0 0.00% 0 0.00% 0 0.00% 0 0.00% 0 0.00% 0 0.00% 0 0.00% 0 0.00% 0 0.00%WORKFORCE/ECON 2012 0 0.00% 0 0.00% 0 0.00% 0 0.00% 0 0.00% 0 0.00% 0 0.00% 0 0.00% 0 0.00%WORKFORCE/ECON 2013 0 0.00% 0 0.00% 0 0.00% 0 0.00% 0 0.00% 0 0.00% 0 0.00% 0 0.00% 0 0.00%WORKFORCE/ECON 2014 0 0.00% 0 0.00% 0 0.00% 0 0.00% 0 0.00% 0 0.00% 0 0.00% 0 0.00% 0 0.00%
2006 TOTALS 2006 81 7.81% 1 0.10% 59 5.69% 657 63.36% 4 0.39% 68 6.56% 1 0.10% 166 16.01% 1,037 100.00%2007 TOTALS 2007 80 7.44% 1 0.09% 71 6.60% 698 64.93% 4 0.37% 66 6.14% 2 0.19% 153 14.23% 1,075 100.00%2008 TOTALS 2008 88 7.92% 1 0.09% 82 7.38% 709 63.82% 6 0.54% 81 7.29% 2 0.18% 142 12.78% 1,111 100.00%2009 TOTALS 2009 94 9.16% 1 0.10% 76 7.41% 662 64.52% 7 0.68% 76 7.41% 2 0.19% 108 10.53% 1,026 100.00%2010 TOTALS 2010 81 8.15% 2 0.20% 77 7.75% 657 66.10% 6 0.60% 77 7.75% 3 0.30% 91 9.15% 994 100.00%2011 TOTALS 2011 70 7.55% 2 0.22% 75 8.09% 613 66.13% 5 0.54% 73 7.87% 4 0.43% 85 9.17% 927 100.00%2012 TOTALS 2012 76 7.47% 1 0.10% 96 9.43% 678 66.60% 8 0.79% 98 9.63% 4 0.39% 57 5.60% 1,018 100.00%2013 TOTALS 2013 80 7.48% 1 0.09% 95 8.89% 712 66.60% 8 0.75% 109 10.20% 4 0.37% 60 5.61% 1,069 100.00%2014 TOTALS 2014 89 8.20% 1 0.09% 94 8.66% 699 64.42% 8 0.74% 119 10.97% 5 0.46% 70 6.45% 1,085 100.00%

47 | P a g e
Appendix 6
BP 3120 – Equal Employment Opportunity
BP 3121 – Diversity

Santa Monica Community College District
BOARD OF TRUSTEES POLICY
Section 3000: Human Resources
Page 6 Section 3000 Human Resources
ARTICLE 3100 GENERAL PROVISIONS ALL PERSONNEL BP 3120 Equal Employment Opportunity and Nondiscrimination in Employment The Santa Monica Community College District is committed to the principles of equal employment opportunity. The District will provide equal employment opportunity in accordance with all applicable federal, state, and local laws, and will implement a comprehensive program to put those principles into practice. No person shall be subjected to unlawful discrimination in any program or activity of the District on the basis of ethnic group identification, race, color, national origin (including language and accent), religious creed, age, sex, gender, physical disability, mental disability, ancestry, sexual orientation, citizenship status, gender identity, gender expression, familial status, marital status, socio-economic status, military and veteran status, genetic information, or medical condition. No person shall be subjected to discrimination on the basis of these actual or perceived characteristics, or based on association with a person or group with one or more of these actual or perceived characteristics. The Board commits the District to vigorous equal employment opportunity in all aspects of its academic and classified employment programs, including recruitment, selection, assignment, retention, promotion, and transfer. The District will strive to achieve a workforce that reflects and welcomes diversity to ensure an inclusive educational environment. Such an environment fosters cooperation, acceptance, democracy and free expression of ideas. The Board of Trustees approves the Equal Employment Opportunity Plan and assumes overall responsibility for the success or failure of the Plan. The Board delegates to the Superintendent/President the responsibility for implementing this policy consistent with all applicable provisions of the Education Code and Title 5. The Equal Employment Opportunity Plan will be maintained to ensure principles that conform to all applicable federal, state, and local laws. Reference: Education Code 87100, et seq., Title 5, 53000, et seq Approved by DPAC: 2/10/2010 Approved: 8/3/2010 Revised by DPAC: 6/25/2014 (combined Board Policy sections 3120 and 3122) Approved: 9/2/2014

Santa Monica Community College District
BOARD OF TRUSTEES POLICY
Section 3000: Human Resources
Page 7 Section 3000 Human Resources
ARTICLE 3100 GENERAL PROVISIONS ALL PERSONNEL BP 3121 Diversity The Santa Monica Community College District is committed to building an inclusive and diverse environment and maintains a comprehensive program to ensure that practice reflects these principles. Diversity within the college environment provides opportunity to foster mutual awareness, knowledge, and sensitivity, to challenge ingrained stereotypes, and to promote mutual understanding and respect. The District is committed to a work and learning environment conducive to open discussion and the free exchange of ideas. Global awareness and exploring the diversity of the local communities served by the college are both important components of the College’s commitment to diversity. Embodying, promoting and celebrating diversity inspires innovative ideas, practical solutions, and team-building in achieving the District’s goal of professional and educational excellence. Approved by DPAC: 6/9/10 Approved: 8/3/2010 BP 3123 Sexual Harassment Sexual harassment of students or employees in the academic and work environments violates both
n in the investigation or resolution of a formal or informal, written or oral complaint of sexual harassment. This policy also applies to the unlawful harassment of any employee as to all terms and conditions of
absence, training opportunities, compensation, work
assignments, and hours of work, shifts, or workload. This policy applies to the unlawful harassment of any student on the basis of sex by any employee of the
disciplinary action, or any other aspect of college life
within the control of the District or its employees. This policy shall be posted in prominent locations on college campuses and in the Office of Human