Diversity and Distribution of sulfate-reducing …Many bacteria can use sulfur compounds in...
24
Marine Biological Laboratory Semester in Environmental Science 2011 1 Diversity and Distribution of sulfate-reducing bacteria in Siders Pond, a meromictic salt pond Sarah Nalven Department of Biology, Colby College, Waterville, ME 04901 USA Abstract Genetic diversity and community structure of sulfate-reducing bacteria was investigated down the 12 meter water column of Siders Pond, a meromictic salt pond in Falmouth, MA. The physical and chemical gradients down this water column were also investigated, as they provide distinct niches for the microorganisms of Siders Pond. Microbial DNA was extracted from water samples at 12 depths. The dissimilatory sulfite reductase (dsr) gene was amplified via PCR, and dsr amplicons from three depths were subsequently cloned and sequenced. Of the 12 sampled depths, dsr was detected in the lower 10 samples, all of which were taken from the anoxic portion of the water column. The dsr sequences in 12 m were genetically distinct from the dsr found in the 4 and 8 m samples, and contained more diversity, exemplifying niche differentiation of sulfate-reducing bacteria along the profile of the water column. Using BLAST to compare Siders Pond dsr sequences to the GenBank database also showed that the closest relatives of Siders Pond sulfate-reducing bacteria were all isolated from human-impacted and organic-rich environments. Key words: sulfate-reducing bacteria, dissimilatory sulfite reductase (dsr), meromictic, water column, pelagic zone, diversity, distribution, niche differentiation. Introduction Many bacteria can use sulfur compounds in energy-yielding reactions, called dissimilatory sulfur metabolism. In one type of these reactions, sulfate (SO 4 2- ) is used as a terminal electron acceptor and reduced to sulfide (S 2- ), while organic carbon compounds (such as organic acids, fatty acids or alcohols) act as electron donors. Known as sulfate reduction, this process is strictly anaerobic and is carried out in anoxic, sulfate-rich environments such as marine sediments, benthic microbial mats, and water columns according to this equation: CH 3 COO - + SO 4 2- + H + 2HCO 3 - + H 2 S Bacterial sulfate reduction is performed by a diverse set of organisms within proteobacteria, and is essential to the global sulfur cycle and several other global cycles, including those of carbon, nitrogen and phosphorus. In fact, sulfate reduction is the dominant carbon mineralization process in most marine and coastal sediments (Jorgensen, 1982; Skyring, 1987). Although it is recognized that sulfate- reducing bacteria play an important role in ecosystems and in global cycles, little is known about the
Transcript of Diversity and Distribution of sulfate-reducing …Many bacteria can use sulfur compounds in...
Marine Biological Laboratory Semester in Environmental Science 2011
1
Diversity and Distribution of sulfate-reducing bacteria in Siders Pond,
a meromictic salt pond
Sarah Nalven
Department of Biology, Colby College, Waterville, ME 04901 USA
Abstract Genetic diversity and community structure of sulfate-reducing bacteria was investigated down
the 12 meter water column of Siders Pond, a meromictic salt pond in Falmouth, MA. The physical and
chemical gradients down this water column were also investigated, as they provide distinct niches for
the microorganisms of Siders Pond. Microbial DNA was extracted from water samples at 12 depths. The
dissimilatory sulfite reductase (dsr) gene was amplified via PCR, and dsr amplicons from three depths
were subsequently cloned and sequenced. Of the 12 sampled depths, dsr was detected in the lower 10
samples, all of which were taken from the anoxic portion of the water column. The dsr sequences in 12
m were genetically distinct from the dsr found in the 4 and 8 m samples, and contained more diversity,
exemplifying niche differentiation of sulfate-reducing bacteria along the profile of the water column.
Using BLAST to compare Siders Pond dsr sequences to the GenBank database also showed that the
closest relatives of Siders Pond sulfate-reducing bacteria were all isolated from human-impacted and
organic-rich environments.
Key words: sulfate-reducing bacteria, dissimilatory sulfite reductase (dsr), meromictic, water column,
pelagic zone, diversity, distribution, niche differentiation.
Introduction Many bacteria can use sulfur compounds in energy-yielding reactions, called dissimilatory sulfur
metabolism. In one type of these reactions, sulfate (SO42-) is used as a terminal electron acceptor and
reduced to sulfide (S2-), while organic carbon compounds (such as organic acids, fatty acids or alcohols)
act as electron donors. Known as sulfate reduction, this process is strictly anaerobic and is carried out in
anoxic, sulfate-rich environments such as marine sediments, benthic microbial mats, and water columns
according to this equation:
CH3COO- + SO42- + H+ 2HCO3
- + H2S
Bacterial sulfate reduction is performed by a diverse set of organisms within proteobacteria, and
is essential to the global sulfur cycle and several other global cycles, including those of carbon, nitrogen
and phosphorus. In fact, sulfate reduction is the dominant carbon mineralization process in most
marine and coastal sediments (Jorgensen, 1982; Skyring, 1987). Although it is recognized that sulfate-
reducing bacteria play an important role in ecosystems and in global cycles, little is known about the

Diversity and distribution of sulfate-reducing bacteria
2
genetic distribution of their populations, especially in water columns (Jorgensen et al., 1979; Overmann,
1996).
This study examined the water column of Siders Pond (Figure 1), a coastal pond in a residential
neighborhood of Falmouth, MA. The pond has a history of slight eutrophication (Moore 2009,
Unpublished Report), since Falmouth’s wastewater was not sewered until 1986 and until then
wastewater reached the pond through groundwater input. Today, the pond is completely surrounded
by houses, many of which fertilize their lawns, so nutrient loading still occurs. Trees also grow near the
shore of the pond, so the water receives some terrestrial carbon input.
Siders Pond is also meromictic, or never mixes below a few meters. This feature is mostly due to
the salinity of the water, which can be attributed to occasional seawater intrusion through a small
channel that connects the pond to Martha’s Vineyard Sound during large storms, but it is also due to the
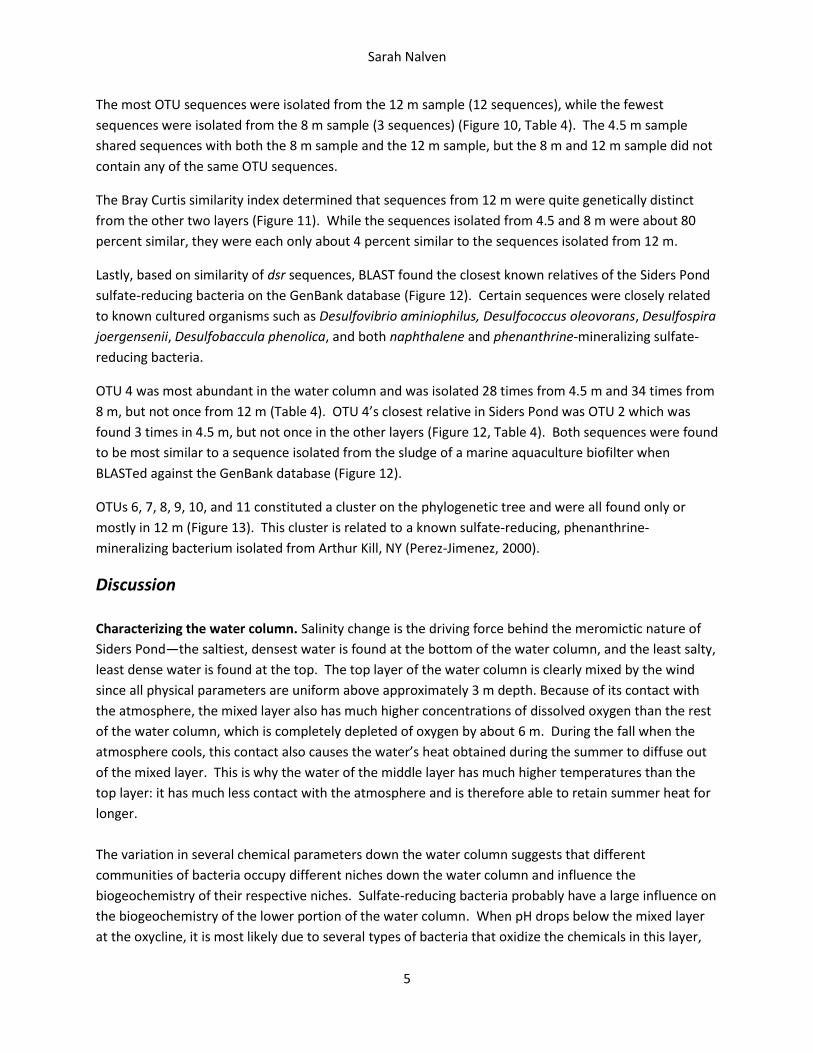
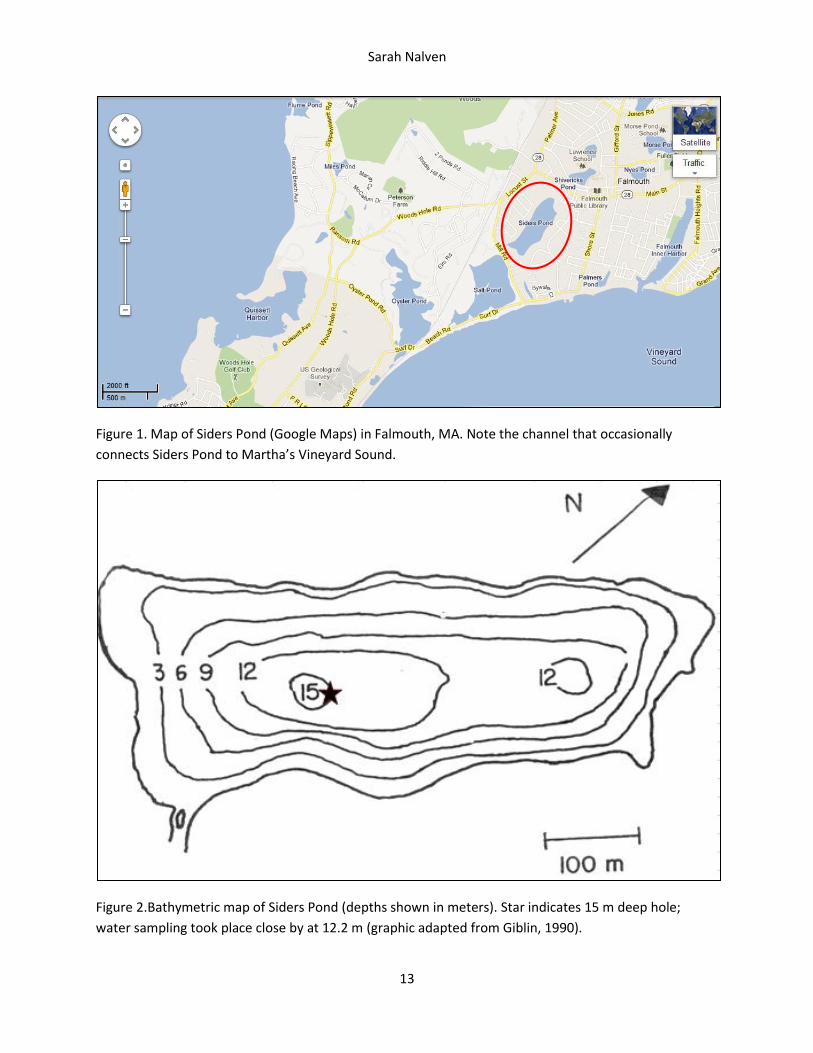
shape of the pond’s basin, which is unusually deep for the pond’s surface area (Figure 2). Due to the
meromictic nature of the pond, the water column is stratified and steep physico-chemical gradients
have developed. These vertical gradients provide different habitats for the development of different
microbial communities within short distances. This means that communities of sulfate-reducing
bacteria living in different regions of the water column will have very different habitats, and will most
likely adapt to those habitats in a process called niche differentiation.
In order to examine niche differentiation in the water column of Siders Pond, a highly conserved
region of the dissimilatory sulfite reductase (dsr) gene was examined. Dsr encodes the enzyme
responsible for catalyzing the final step of dissimilatory sulfate metabolism, the reduction of sulfite
(SO32-) to sulfide (S2-). Through PCR, cloning and sequencing of dsr DNA isolated from several depths, as
well as characterization of the physico-chemical properties of the water column, diversity and
distribution of sulfate-reducing bacteria was evaluated.
Methods
Sampling. Water samples were collected on November 14, 2011 from Siders Pond in Falmouth, MA.
Samples were obtained in the southwest part of the pond where the water was 12.2 meters deep.
Samples for DNA analysis were collected at 2, 4, 4.5, 5, 5.5, 6, 7, 8, 9, 10, 11, and 12 m and stored in 1-
liter NalgeneTM bottles. Samples for nutrient analysis and cell counts were taken at every meter from 1
to 12 m depth and stored in 125-mL NalgeneTM bottles. Temperature, salinity, dissolved oxygen, and pH
were also measured with a Hydrolab sonde, DS5X (Hatch Hydrolab, Loveland, CO), at 1, 2, 3, 4, 4.5, 5,
5.5, 6, 7, 8, 9, 10, 11, and 12 m.
Inorganic Nutrient Analysis and Cell Counts. Samples were analyzed for sulfate (SO42-) with an ion
chromatograph, DX-120 (Dionex, Sunnyvale, CA) and for sulfide (S2-) with a UV colorimetric
spectrophotometer, UV-1601 (Shimadzu, Kyoto, Japan). Expected sulfate was calculated by multiplying
measured salinity values by 806.5, a known seawater salinity to sulfate ratio. Cells were enumerated
using 4',6-diamidino-2-phenylindole (DAPI) epifluorescence microscopy.
DNA Isolation. Pond water was filtered from each depth onto 0.22-μm-pore-size polyethersulfone SterivexTM filter units using a gentle vacuum (Figure 3 for filtering set-up). Different volumes of water

Sarah Nalven
3
were filtered for each sample based on ease of filtration (Table 1). Filters were stored at - 80°C until DNA extraction. DNA was extracted from each of the 12 samples using the MOBIO PowerWater® SterivexTM DNA Isolation Kit. Samples were then run on a 1% agarose gel and visualized with ethidium bromide to confirm successful extraction. Extracted DNA was also quantified using a Micro-Volume UV-Vis Spectrophotometer, NanoDrop 2000 (Thermo Scientific, Waltham, MA).
PCR Amplification. Dsr DNA sequences were amplified from each sample of isolated DNA with the
primers dsr1F and 1334R (Santillano, 2010). Total volume of the PCR amplification reaction was 50 μl,
which included 1 μl of template DNA, 5 μl of each primer (20 μM), 1 μl of deoxynucleoside triphosphates
(10 mM), 2 U Taq polymerase, 10 μl of 5x PCR buffer, and 27.8 μl of sterile water. The amplification
conditions involved one step at 95°C for 3 min., then 35 cycles at 94° for 35 sec., 54°C for 1 min., and
72°C for 2 min., and then a last step of 72°C for 10 min. PCR-amplified DNA was run on a 1% agarose gel
and visualized with ethidium bromide to determine whether the dsr gene was present. DNA from
depths 4.5, 8, and 12 m were then amplified in triplicate, and products were pooled prior to further use.
Cloning. Pooled PCR products from 4.5, 8, and 12 m were purified using the QIAquick PCR Purification Kit. Each purified product was then separated on a 0.8% agarose gel, and 900 bp bands were excised and re-purified using the QIAquick Gel Extraction Kit. PCR-amplified dsr DNA sequences from the three depths were then ligated into the pCR™4-TOPO® TA vector and transformed into Electrocomp™ E. coli using the PureLink™ Quick Plasmid Miniprep Kit (Invitrogen, Grand Island, NY) and an electroporator at 1600 V, Eppendorf Multiporator® (Eppendorf, Hamburg, Germany). Clones containing dsr from each of the depths were then grown in Super Broth to prepare for sequencing.
DNA Sequencing. Each clone underwent plasmid isolation (alkaline lysis) and bidirectional sequencing,
ABI v 3.1 BigDye terminator (Applied Biosystems, Carlsbad, CA) at the Keck Facility of the JBPC, MBL,
Woods Hole, Massachusetts. The dsr gene was sequenced from 37 different 4.5 m clones, 40 different 8
m clones, and 38 different 12 m clones for a total of 115 dsr sequences.
Phylogenetic Analyses. Sequences were aligned so a distance matrix could be calculated. Using this
matrix, sequences were clustered into operational taxonomic units (OTUs) with the software MOTHUR.
Several sequence difference levels were calculated, but an 8 percent sequence difference level was
chosen to cluster the sequences into 17 OTU representative sequences for further phylogenetic analysis.
The Bray Curtis similarity index was used to compare OTU sequences with each other and BLAST was
used to compare OTU sequences against the GenBank dsr database.
To relate each of these OTUs to each other and to similar sequences found in GenBank, a phylogenetic
tree was created. Using NCBI’s Batch Entrez, accession numbers were entered and a fasta file was
downloaded. This file was opened in BioEdit, sequences were aligned and trimmed, and files were finally
entered into Phylogeny.fr: Robust Phylogenetic Analysis for the Non-Specialist in order to create a tree.
FigTree was used to enhance tree design.

Diversity and distribution of sulfate-reducing bacteria
4
Results
Characterizing the water column. Saline stratification is evident down the water column, as sharp
increases in salinity are seen at about 3 m and 8 m depth, dividing the water column into three distinct
layers (Figure 4). All physical parameters are completely uniform throughout the top layer of the water
column, which extends down about 3 m. At 3 m, a sharp decline in dissolved oxygen begins until the
water column becomes completely anoxic at 6 m. Temperature in the surface layer is about 11.3 °C,
slightly warmer than 10.2 °C, the average atmospheric temperature of the two weeks prior to sampling.
The middle layer reaches temperatures over 17 °C, and the bottom layer, like the surface, is about 11 °C.
Water at the surface is slightly alkaline, but a substantial decrease in pH exists at the oxycline from
about 3 to 5 m, making the water slightly acidic by 4 m depth (Figure 5). At 5 m, this decreasing trend in
pH turns around, but it is not until 6 or 7 m that pH increases substantially. By 9 m, the water column is
alkaline once again, and continues increasing for the remaining measurements.
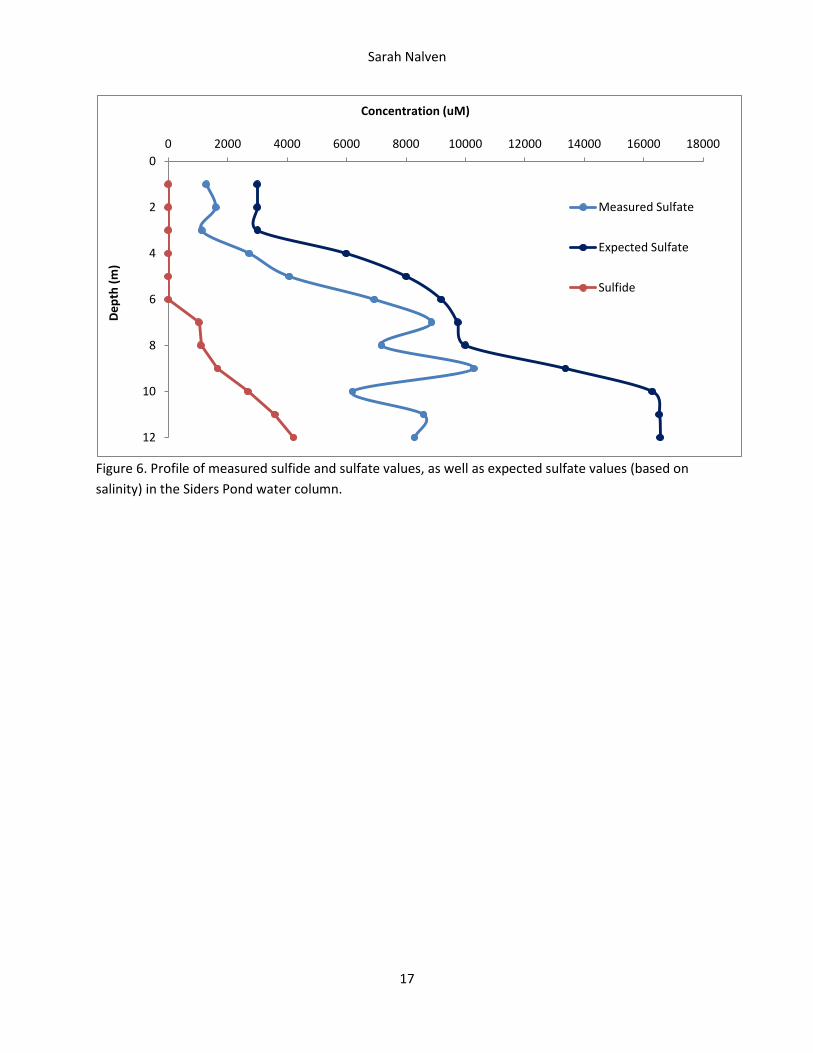
The chemical composition of the water column also indicates stratification (Figure 6). Because expected
sulfate was calculated based on measured salinity values, the trend in expected sulfate shows the same
three layers as salinity does, and increases down the water column. Measured sulfate follows the same
trend as expected sulfate in the upper section of the water column. However at 7 m the discrepancy
between expected and measured sulfate begins to widen, and continues to widen until the bottom of
the water column. (The oscillation seen in the measured sulfate values toward the bottom can be
attributed to noise in the measuring methods.) Also at 7 m, concentrations of sulfide become
detectable and continue to increase down the water column.
Samples from 1 and 2 m depth contained 106 cells/mL while all samples from 3 m and below contained
107 cells/mL. Cell concentrations were highest at the oxycline and at the bottom of the water column
(Figure 7). Observations of cells under the microscope also revealed that cell structure was much more
varied higher up in the water column and ranged in size, shape, and color, while cells were much all
small and uniform further down in the water column (Figure 8).
DNA Isolation and PCR. As the cells that were once suspended in each depth of the water column were
trapped onto each filter, filters turned unique colors (Table 1, Figure 9). DNA was successfully isolated
from each of these filters, and each samples produced a different concentration of DNA (Table 1). When
each of these DNA samples underwent PCR and gel electrophoresis, the 2 m and 4 m samples showed
extremely weak or nonexistent dsr signals, but every sample from 4.5 m and below showed strong dsr
signals (Table 2).
DNA Sequencing and Phylogenetic Analyses. Dsr DNA was successfully sequenced from all three
samples (4.5, 8 and 12 m). Of the 115 sequences, 106 were unique; at the 8 percent distance level,
sequences were clustered into 17 OTU sequences (Table 3). Of the 17 OTU sequences, certain
sequences were very abundant at one or two levels of the water column, but not one sequence was
isolated from all three levels of the water column (Table 4).
Sarah Nalven
5
The most OTU sequences were isolated from the 12 m sample (12 sequences), while the fewest
sequences were isolated from the 8 m sample (3 sequences) (Figure 10, Table 4). The 4.5 m sample
shared sequences with both the 8 m sample and the 12 m sample, but the 8 m and 12 m sample did not
contain any of the same OTU sequences.
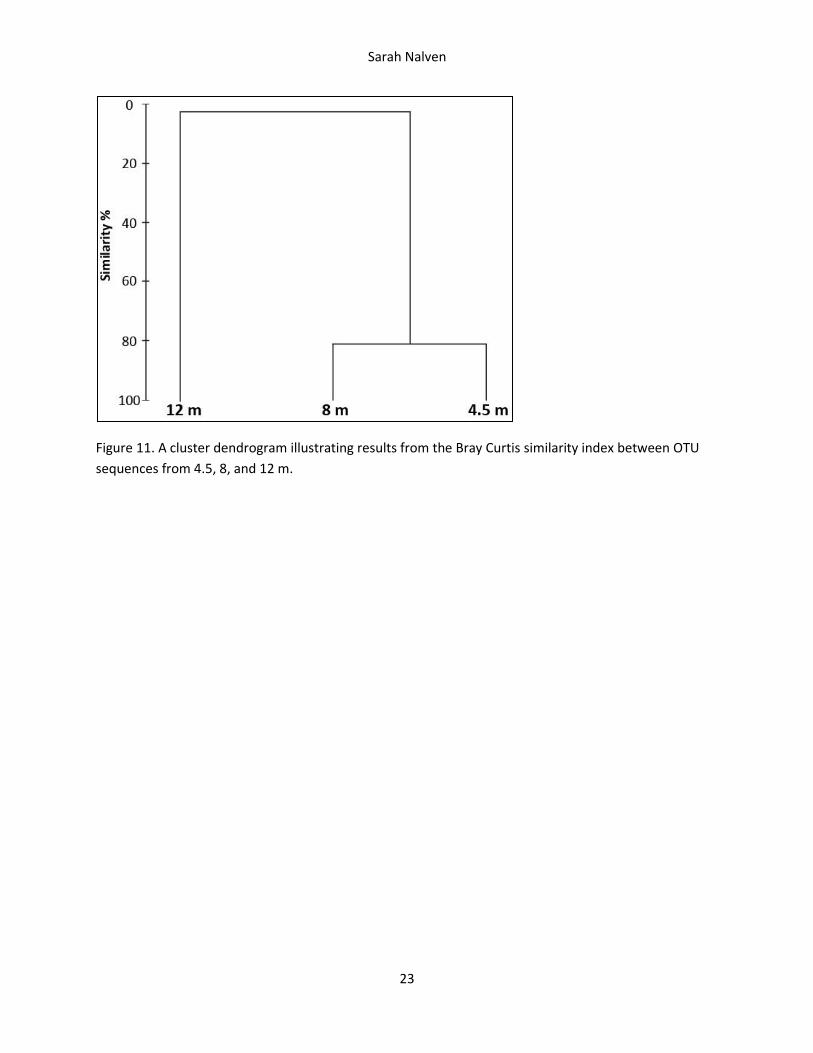
The Bray Curtis similarity index determined that sequences from 12 m were quite genetically distinct
from the other two layers (Figure 11). While the sequences isolated from 4.5 and 8 m were about 80
percent similar, they were each only about 4 percent similar to the sequences isolated from 12 m.
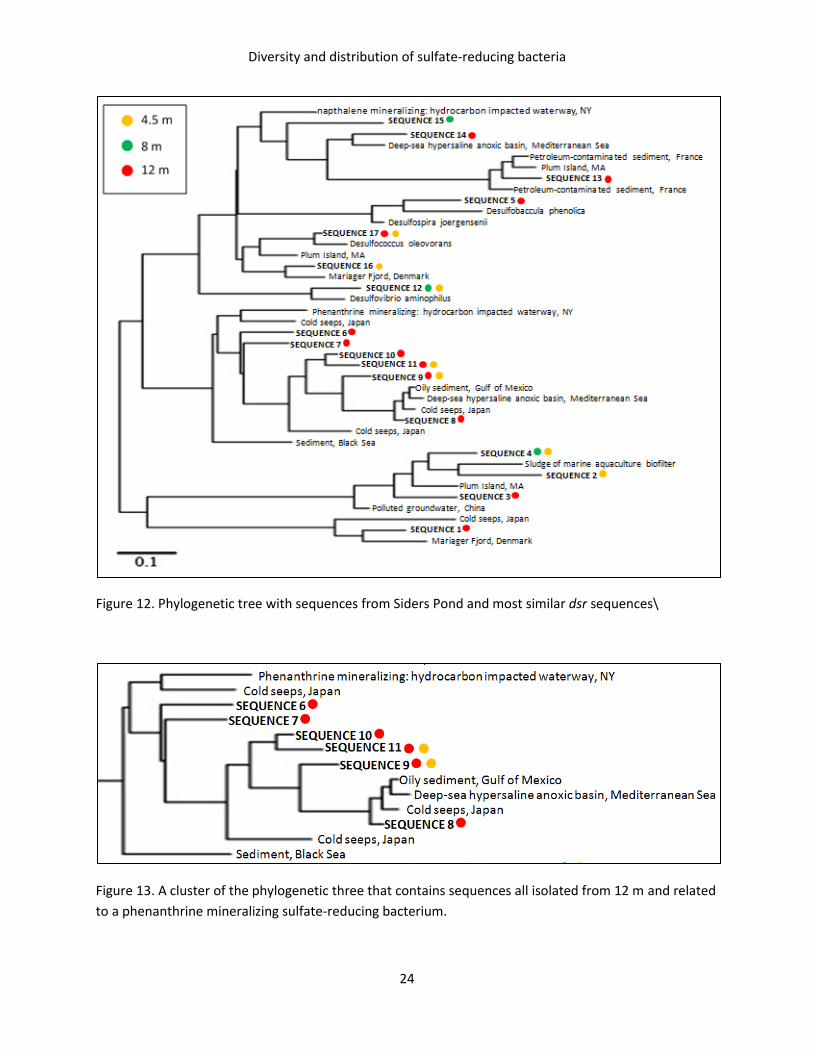
Lastly, based on similarity of dsr sequences, BLAST found the closest known relatives of the Siders Pond
sulfate-reducing bacteria on the GenBank database (Figure 12). Certain sequences were closely related
to known cultured organisms such as Desulfovibrio aminiophilus, Desulfococcus oleovorans, Desulfospira
joergensenii, Desulfobaccula phenolica, and both naphthalene and phenanthrine-mineralizing sulfate-
reducing bacteria.
OTU 4 was most abundant in the water column and was isolated 28 times from 4.5 m and 34 times from
8 m, but not once from 12 m (Table 4). OTU 4’s closest relative in Siders Pond was OTU 2 which was
found 3 times in 4.5 m, but not once in the other layers (Figure 12, Table 4). Both sequences were found
to be most similar to a sequence isolated from the sludge of a marine aquaculture biofilter when
BLASTed against the GenBank database (Figure 12).
OTUs 6, 7, 8, 9, 10, and 11 constituted a cluster on the phylogenetic tree and were all found only or
mostly in 12 m (Figure 13). This cluster is related to a known sulfate-reducing, phenanthrine-
mineralizing bacterium isolated from Arthur Kill, NY (Perez-Jimenez, 2000).
Discussion
Characterizing the water column. Salinity change is the driving force behind the meromictic nature of
Siders Pond—the saltiest, densest water is found at the bottom of the water column, and the least salty,
least dense water is found at the top. The top layer of the water column is clearly mixed by the wind
since all physical parameters are uniform above approximately 3 m depth. Because of its contact with
the atmosphere, the mixed layer also has much higher concentrations of dissolved oxygen than the rest
of the water column, which is completely depleted of oxygen by about 6 m. During the fall when the
atmosphere cools, this contact also causes the water’s heat obtained during the summer to diffuse out
of the mixed layer. This is why the water of the middle layer has much higher temperatures than the
top layer: it has much less contact with the atmosphere and is therefore able to retain summer heat for
longer.
The variation in several chemical parameters down the water column suggests that different
communities of bacteria occupy different niches down the water column and influence the
biogeochemistry of their respective niches. Sulfate-reducing bacteria probably have a large influence on
the biogeochemistry of the lower portion of the water column. When pH drops below the mixed layer
at the oxycline, it is most likely due to several types of bacteria that oxidize the chemicals in this layer,

Diversity and distribution of sulfate-reducing bacteria
6
(including hydrogen sulfide) and produce hydrogen ions in the process. Since sulfate-reducing bacteria
use a hydrogen ion in the reduction of sulfate, however, these bacteria would influence pH in the other
direction and cause pH of the water column to increase. Not surprisingly, the pH of the water column
begins to increase at 4.5 m, and continues to increase down the remainder of the water column, the
exact zone where the dsr gene was detected. Furthermore, the water becomes much less acidic at 7 m,
exactly where hydrogen sulfide becomes apparent in substantial concentrations. Presumably sulfate-
reducing bacteria are removing hydrogen ions from their surroundings and turning them into this
hydrogen sulfide.
Comparison of expected to measured sulfate values further suggests presence of sulfate-reducing
bacteria in the lower portion of the water column. The apparent depletion of sulfate in the water
column below about 7 m (according to calculated expected sulfate values) indicates that sulfate-
reducing bacteria are the cause of this depletion as they reduce sulfate. The detection of hydrogen
sulfide production and sulfate depletion at about 7 m however does not mean sulfate-reducing bacteria
are not active until this point: higher in the water column, hydrogen sulfide produced could be getting
oxidized by other organisms, and sulfate depleted could be overshadowed by sulfate produced,
therefore preventing detection.
Cell abundance most likely increases at the oxycline due to the many microhabitats the oxycline
provides. Once oxygen is no longer available as an electron acceptor, organisms capable of respiring
other compounds can occupy different niches according to the electron acceptors present in the water
column at that point and their energetic properties. Galand et al. found that in the Clipperton Lagoon
(California), prokaryotic cells were four times more abundant in the oxycline than in the rest of the
water column, and putative green sulfur bacteria represented half of these cells (2011). This could be
the case in Siders Pond as well. The increase in cell abundance at the bottom of the water column could
be also be attributed to sediment influence, which might increase the number of microhabitats and
provide plenty of organic matter for the bacteria to mineralize. Cell count could also increase due to the
absence of grazers since toxic levels of sulfide and other chemicals might prevent grazers from living in
the lower portion of the water column. Joye et al. (1995) and Casamayor et al. (2002) found that sulfide
and ammonia toxicity may result in the exclusion of zooplankton grazers from anoxic or hypoxic regions
of the water column. The absence of grazers could also explain the difference in the microscope
observations between samples from the top and bottom of the water column. Cells in the upper layers
were probably more varied in shapes and sizes because some were phytoplankton cells or grazers. In
the lower layers, however, phytoplankton can no longer survive because there is no light, and grazers
can no longer survive due to toxicity of certain chemicals.
DNA Isolation and PCR. Detection of the dsr gene in every sample from 4.5 m and below indicates that
sulfate-reducing bacteria are present in the anoxic region of the water column. The ambiguous signal
from the 2 and 4 m samples should be studied further in order to determine whether dsr was in fact
present. If it was, its presence could be attributed to slight mixing between the water at 4.5 m and
upper layers. It is also noteworthy that detection of dsr DNA only suggests presence of sulfate-reducing
bacteria, and it does not suggest activity; even if sulfate-reducing bacteria were in fact present in the
Sarah Nalven
7
upper part of the water column, they might not necessarily be active. It is also possible that sulfate-
reducing bacteria present in the upper part of the water column were active, but they had undergone a
metabolic switch, in which they used a more energetically favorable electron acceptor such as nitrate
(NO3-). Seitz & Cypionka have found that some organisms are capable of this metabolic switch (1986).
DNA Sequencing and Phylogenetic Analyses. Sequencing of dsr genes from the water column of Siders
Pond revealed the presence of novel dsr sequences, which is to be expected considering how rapid
microbial turnover and therefore microbial evolution is, and also considering how few sulfate-reducing
bacteria have been cultured or identified. Sequencing also revealed that the Siders Pond water column
is not simply colonized by a few sulfate-reducing organisms, but that there are many sulfate-reducing
communities present, and the distribution of these communities demonstrates structure.
Community structure is known because each OTU sequence was abundant at only one depth or at two
adjacent depths (Table 4). In fact there was quite a bit of community overlap between 4.5 and 8 m since
these samples shared two abundant OTU sequences (Figure 10), including the most abundant sequence,
OTU 4. Considering the physical profile of the water column, however, it is not surprising that 4.5 and 8
m contain so many common sequences since the physical characteristics at the two depths are not
drastically different (Figure 4): 4.5 m is at the very top of the water column’s middle layer and 8 m is at
the very bottom, but both physically and chemically these two habitats are not nearly as different from
each other as they are from 12 m. It is also possible that since the two depths are found in water of
similar densities, there is some gene flow between the depths.
The sequences found in 12 m were quite distinct from the sequences found from either of the depths
above 12 m (Figure 11), which is probably because the water at 12 m has very different physico-
chemical characteristics from the other layers (Figures 4, 5 and 6), causing natural selection for different
dsr genes in 12 m than in the other layers. It is likely that the 12 m sequences were also distinct because
they were extremely isolated from the other levels of water and had been for a long time, due to salinity
and therefore density differences, and due to the lack of wind-driven mixing or bioturbation in the
bottom layer. Isolation would have allowed deep evolutionary branching of organisms in 12 m without
any gene flow from the layers above.
This would also explain why the sequences isolated from 12 m were not only genetically distinct (Figure
11) from the 4.5 and 8 m sequences, but why they were much more genetically diverse (Figures 10 and
12). In addition to isolation, elevated diversity at 12 m could also be attributed to the extreme
environmental conditions at this depth. Compared to the rest of the water column, 12 m contained the
highest salinity and pressure, as well as the highest concentrations of sulfide and possibly other
chemicals that have accumulated over the pond’s meromictic history. Galand et al. (2011) and
Humayoun et al. (2003) both also found the meromictic bottom waters of Clipperton lagoon and Mono
Lake, respectively, to have the highest microbial diversity. Galand et al. proposed that the unique
conditions of the deep layers of the Clipperton lagoon may explain the novelty of the microbial
communities found there, which were characterized by anoxia, high concentrations of organic carbon,
inorganic nitrogen compounds, an iron. Humayoun et al. also proposed that in Mono Lake the extreme

Diversity and distribution of sulfate-reducing bacteria
8
bottom water, characterized by sulfide and ammonia toxicity, may have contributed to elevated
diversity (2003).
One final explanation for elevated diversity at 12 m is that dsr genes here were influenced by the
sediment, since the water column sampled was about 12.2 m deep. However it is not likely that the
sediment would be suspended 0.2 meters up the water column since there is no wind-driven current at
12 m or bioturbation.
Creation of a phylogenetic tree that included Siders Pond dsr sequences and their closest relatives from
GenBank allowed insight into evolutionary relationships amongst the Siders Pond sequences and the
physiological properties of the sulfate-reducing bacteria to whom they belong. Several sequences that
were isolated only from or mainly from 12 m constituted a cluster in the phylogenetic tree (Figure 13).
The organisms in this cluster were related to a known bacterium that mineralizes phenanthrine and was
isolated from Arthur Kill, NY, a hydrocarbon impacted waterway (Perez-Jimenez et al. 2000). This
suggests that the environment of the water column at 12 m could contain phenanthrine, and is most
likely hydrocarbon-rich, like the environment from which the known phenanthrine-mineralizing
bacterium was isolated. Several other similar sequences were also isolated from hydro-carbon rich
environments, many of which were also human-impacted. It is logical that Siders Pond would be
hydrocarbon rich because it is eutrophic. Some hydrocarbons in the water column could also be coming
from sinking terrestrial input, though further investigation would be required to determine this
conclusively. Regardless, the fact that these sulfate-reducing bacteria in Siders Pond are similar to
organisms that were investigated for bioremediation purposes suggests that the sulfate-reducing
bacteria that exist at 12 m in Siders Pond could have the potential to degrade petroleum or other
pollutants, or could even be doing so in Siders Pond currently.
OTU sequence 4, the most abundant sequence isolated from the water column, was found in both 4.5
and 8 m about 30 times, but was not closely related to any sulfate-reducing bacterium with known
physiological properties. Its closest relatives were organisms isolated from a marine aquaculture
biofilter (Schwermer et al. 2010), from groundwater contaminated by landfill leachate (Wu et al. 2009),
and from a New England salt marsh sediment (Bahr et al. 2004). Again, the environments from which
these similar sequences were isolated suggest the environment of Siders Pond that these sulfate-
reducing bacteria are living in, which seems to be polluted and organic-rich.
Finally, one interesting finding was that three different OTU sequences (OTUs 9, 11, 17) were found in
both 4.5 and 12 m, but never in 8 m. Furthermore, not one sequence was found in both 8 and 12 m.
One possible explanation for this finding is that sinking zooplankton fecal pellets may have transported
4.5 m sulfate-reducing bacteria into the 12 m region of the water column. Since there are probably not
many zooplankton at 8 m due to hydrogen sulfide toxicity, it would make sense that no sequence was
transported in this manner from 8 m to 12 m. In fact, Humayoun et al. proposed that in the meromictic
Mono Lake (California), sinking fecal pellets of the brine shrimp Artemia monica, the dominant
zooplankter, could have been responsible for transporting sequences from the top layer to the bottom
layer (2003). Another possible explanation is that in 4.5 m, these organisms are present as rare dormant

Sarah Nalven
9
cells, but in deeper waters, these cells develop as conditions become adequate. OTU 9, for example,
was found once at 4.5 m but 10 times at 12 m, and could exhibit this phenomenon. Galand et al.
proposes that this phenomenon could be responsible for the dispersal of deep water or marine
sediment organisms (2011). Lastly, 4.5 and 12 m both contain many more cells than 8 m (Figure 7), and
it could be that these particular dsr sequences somehow give sulfate-reducing bacteria an advantage in
waters with high bacterial abundance.
Conclusions
Sequencing and phylogenetic analysis of dsr in the Siders Pond water column, in parallel with a
physico-chemical evaluation of the water column, can tell a lot of information about the communities of
sulfate-reducing bacteria and the environments of their habitats. This study determined that sulfate-
reducing bacteria are present throughout the entire anoxic portion of the Siders Pond water column and
that these sulfate-reducing communities exhibit niche differentiation in their respective water column
habitats. Of the 4.5, 8, and 12 m dsr samples sequenced, 12 m dsr exhibited the most genetic distinction
and diversity. Similar dsr sequences from GenBank suggested that sulfate-reducing bacteria in every
layer of the Siders Pond water column have adapted to high concentrations of hydrocarbons and
possibly other pollutants.
Directions for Future Research
To continue this study, a more comprehensive assessment of the physico-chemical properties of
the water column would have to be done, especially an assessment of the types of hydro-carbons and
metals present. Activity of sulfate-reducing bacteria could also be examined since detection of dsr DNA
only suggests presence and not activity. Furthermore, attempts at culturing some of the sulfate-
reducing bacteria from Siders Pond could be carried out, especially OTU 4, the most abundant sulfate-
reducing bacteria isolated.
Acknowledgements
Many thanks to Julie Huber, my advisor; without her guidance this project could not have been
completed, nor would I have learned nearly as much. All the personnel in Julie’s lab were also of
tremendous help in teaching me several new molecular techniques and exhibiting the utmost patience
when I didn’t get things right the first time around. Special thanks to Angus Angermeyer and Emily
Reddington for taking hours out of their days to help me. Leslie Murphy also lent me her filtering rig,
and put up with the strong sulfidic odors of some of my water samples, which quickly pervaded the
entire lab. I would also like to thank all the Semester in Environmental Science (SES) teaching assistants,
especially Rich McHorney for critical assistance in the field and Carrie Harris and Stef Strebel for the
countless questions they answered and their assistance in lab. Also I would like to thank my secondary

Diversity and distribution of sulfate-reducing bacteria
10
advisor, Joe Vallino, for critical assistance in the planning stages of this project and for making me
excited about microbes. Finally I would like to thank the Marine Biological Laboratory and SES for the
necessary funding for this project.
Literature Cited
Bahr, Michele, Byron C. Crump, Vanja Klepac-Ceraj, Andreas Teske, Mitchell L. Sogin, and John E.
Hobbie. "Molecular Characterization of Sulfate-reducing Bacteria in a New England Salt Marsh."
Environmental Microbiology 7.8 (2005): 1175-185. Print.
Casamayor, Emilio O., Ramon Massana, Susana Benlloch, Lise Øvreås, Beatriz Díez, Victoria J. Goddard,
and Josep M. Gasol. "Changes in Archaeal, Bacterial and Eukaryal Assemblages along a Salinity Gradient
by Comparison of Genetic Fingerprinting Methods in a Multipond Solar Saltern." Environmental
Microbiology 4.6 (2002): 338-48. Print.
Jørgensen et al., 1979 B.B Jørgensen, J.G Kuenen and Y Cohen, Microbial transformations of sulfur
compounds in a stratified lake (Solar Lake, Sinai). Limnol. Oceanogr., 24 (1979), pp. 799–822.
Jorgensen, Bo Barker. "Mineralization of Organic Matter in the Sea Bed-- the Role of Sulphate
Reduction." Nature 296 (1982): 643-45. Print.
Joye, Samantha B., Tracy L. Connell, Laurence G. Miller, Ronald S. Oremland, and Robert S. Jellison.
"Oxidation of Ammonia and Methane in an Alkaline, Saline Lake." American Society of Limnology and
Oceanography 44 (1999): 178-88. Print.
Galand, Pierre E., Muriel Bourrain, Emmanuel De Maistre, Philippe Catala, Yves Desdevises, Hila Elifantz,
David Kirchman, and Philippe Lebaron. "Phylogenetic and Functional Diversity of Bacteria and Archaea in
a Unique Stratified Lagoon, the Clipperton Atoll (N Pacific)." FEMS Microbiology Ecology 79 (2011): 203-
17. Print.
Humayoun, Shaheen B., Nasreen Bano, and James T. Hollibaugh. "Depth Distribution of Microbial
Diversity in Mono Lake, a Meromictic Soda Lake in California." Applied and Environmental Microbiology
69.2 (2003): 1030-042. Print.
McIntyre, A. D. "A Global Census of Marine Microbes." Life in the World's Oceans: Diversity, Distribution,
and Abundance. Ames, IA: Blackwell Pub., 2010. Print.
Moore, Marshall. “Getting to the ‘Core’ of Coastal Ponds: A Reconstruction of Biogeochemical Cycling
and Community Structure in Siders and Salt Ponds, MA.” SES Unpublished Report. 2009.
Overmann, Jorg, J. Thomas Beatty, H. Roy Krouse, and Ken J. Hall. "The Sulfur Cycle in the Chemocline of
a Meromictic Salt Lake." Limnology and Oceanography 41.1 (1996): 147-56. Print.

Sarah Nalven
11
Pennisi, Elizabeth. "How a Marine Bacterium Adapts to Multiple Environments." Science 24 Mar. 2006:
1697. Print.
Perez-Jimenez, J. R., L. Y. Young, and L. J. Kerkhof. "Molecular Characterization of Sulfate-reducing
Bacteria in Anaerobic Hydrocarbon-degrading Consortia and Pure Cultures Using the Dissimilatory
Sulfite Reductase (dsrAB) Genes." FEMS Microbiology Ecology 35 (2001): 145-50. Print.
Santillano, Daniel, Antje Boetius, and Alban Ramette. "Improved Dsr-A-Based Terminal Restriction
Fragment Length Polymorphism Analysis of Sulfate-Reducing Bacteria." Applied and Environmental
Microbiology 76.15 (2010): 5308-311. Print.
Schuler, Dirk. "2.1 Salt Marshes and Salt Ponds." Magnetoreception and Magnetosomes in Bacteria.
Berlin: Springer, 2007. 82. Print.
Schwermer, Carsten Ulrich, Timothy G. Ferdelman, Peter Stief, Armin Gieseke, Nastaran Rezakhani, Jaap
Van Rijn, Dirk De Beer, and Andreas Schramm. "Effect of Nitrate on Sulfur Transformations in
Sulfidogenic Sludge of a Marine Aquaculture Biofilter." FEMS Microbiology Ecology 72 (2010): 476-84.
Print.
Seitz, H.-J. & Cypionka, H. (1986). Chemolithotrophic growth of Desulfovibrio desulfuricans with
hydrogen coupled to ammonification of nitrate or nitrite. Arch Microbiol 146, 63–67.
Sievert, Stefan M., Ronald P. Kiene, and Heide N. Schulz-Vogt. "The Sulfur Cycle." Oceanography June
2007: 117-22. Web.
Skyring, G. W. (1987). Sulfate reduction in coastal ecosystems. Geomicrobiol. J. 5: 295-374 Teske, Andreas, Cathrin Wawer, Gerard Muyzer, and Niels B. Ramsing. "Distribution of Sulfate-Reducing
Bacteria in a Stratified Fjord (Mariager Fjord, Denmark) as Evaluated by Most-Probable-Number Counts
and Denaturing Gradient Gel Electrophoresis of PCR-Amplified Ribosomal DNA Fragments." Applied and
Environmental Microbiology 62.4 (1996): 1405-415. Print.
Teske, Andreas, Cathrin Wawer, Gerard Muyzer, and Niels B. Ramsing. "Distribution of Sulfate-Reducing
Bacteria in a Stratified Fjord (Mariager Fjord, Denmark) as Evaluated by Most-Probable-Number Counts
and Denaturing Gradient Gel Electrophoresis of PCR-Amplified Ribosomal DNA Fragments." Applied and
Environmental Microbiology 62.4 (1996): 1405-415. Print.
West, Nyree J., and David J. Scanlan. "Niche-Partitioning of Prochlorococcus Populations in a Stratified
Water Column in the Eastern North Atlantic Ocean." Applied and Environmental Microbiology 65.6
(1999): 2585-591. Print.
Wu, Xiu-Juan, Jian-Liang Pan, Xiang-Long Liu, Jing Tan, Dao-Tang Li, and Hong Yang. "Sulfate-reducing
Bacteria in Leachate-polluted Aquifers along the Shore of the East China Sea." NRC Research Press 55
(2009): 818-28. NRC Research Press. 10 July 2009. Web. 15 Dec. 2011.

Diversity and distribution of sulfate-reducing bacteria
12
Figures
Figure 1. Map of Siders Pond and surrounding Falmouth area.
Figure 2. Baythmetry map of Siders Pond
Figure 3. Diagram of filtering rig set-up used for DNA Extraction
Figure 4. Physical profile of the examined Siders Pond water column.
Figure 4b. pH of water column up close
Figure 5. Chemical profile of the examined Siders Pond water column.
Figure 6. Cell abundance profile of the examined Siders Pond water column.
Figure 7. DAPI pics
Figure 8. filter colors
Figure 9. Cluster dendrogram of sequence similarity index
Figure 10. Venn Diagram
Figure 11. Phylogenetic Tree
Tables
Table 1. Volume of water filtered, color of filters, concentration of extracted DNA
Table 2. Detection of dsr at different depths
Table 3. Number of operational taxonomic units in sequences based on similarity cutoff
Table 4. Number of times each taxonomic unit was found in each level of the water column.
Sarah Nalven
13
Figure 1. Map of Siders Pond (Google Maps) in Falmouth, MA. Note the channel that occasionally
connects Siders Pond to Martha’s Vineyard Sound.
Figure 2.Bathymetric map of Siders Pond (depths shown in meters). Star indicates 15 m deep hole;
water sampling took place close by at 12.2 m (graphic adapted from Giblin, 1990).

Diversity and distribution of sulfate-reducing bacteria
14
Figure 3. Filtering set-up for DNA extraction.

Sarah Nalven
15
Figure 4. Profile of temperature, salinity, and dissolved oxygen in the Siders Pond water column.
0
2
4
6
8
10
12
0 5 10 15 20 25
De
pth
(m
)
Temperature (°C), Salinity (‰), Dissolved Oxygen (ppm)
Temperature
Salinity
Dissolved Oxygen

Diversity and distribution of sulfate-reducing bacteria
16
Figure 5. Profile of pH in the Siders Pond water column.
0
2
4
6
8
10
12
14
6.7 6.8 6.9 7 7.1 7.2 7.3 7.4 7.5 7.6
De
pth
(m
) pH
Sarah Nalven
17
Figure 6. Profile of measured sulfide and sulfate values, as well as expected sulfate values (based on
salinity) in the Siders Pond water column.
0
2
4
6
8
10
12
0 2000 4000 6000 8000 10000 12000 14000 16000 18000
De
pth
(m
) Concentration (uM)
Measured Sulfate
Expected Sulfate
Sulfide

Diversity and distribution of sulfate-reducing bacteria
18
Figure 7. Profile of cell abundance in the Siders Pond water column.
Figure 8. DAPI stained images from 2 meters and 10 meters depth.
0
2
4
6
8
10
12
5.E+06 1.E+07 2.E+07 2.E+07 3.E+07 3.E+07 4.E+07 4.E+07
de
pth
(m
) cells/mL
OXYCLINE

Sarah Nalven
19
Depth (m)
Volume Filtered (mL)
Filter Color Nucleic Acid Concentration (ng/uL)
2 960 light yellowish white 29.0
4 820 light yellowish white 19.9
4.5 830 pale lime green (purple water came out) 62.8
5 655 beige (purple water came out) 61.5
5.5 210 beige 27.9
6 620 dark brown 40.9
7 630 smoky gray 9.2
8 530 lighter beige 27.7
9 680 --- 39.3
10 615 lighter gray 23.5
11 510 lighter beige 20.2
12 450 lighter beige 21.7
Table 1. Volume of water filtered for each sample, color of filter, and concentration of nucleic acids
extracted from the water sample using these filters.
Figure 9. Different colored SterivexTM filters during DNA extraction.

Diversity and distribution of sulfate-reducing bacteria
20
Depth (m)
dsr present? band description
2 maybe faint
4 maybe faint
4.5 yes bright
5 yes bright
5.5 yes bright
6 yes bright
7 yes bright
8 yes bright
9 yes bright
10 yes bright
11 yes bright
12 yes bright
Table 2. Detection of the dsr gene in the Siders Pond water column

Sarah Nalven
21
Cutoff (%) # OTUs
unique 106
1 37
2 26
3 25
4 22
5 21
6 19
8 17
Table 3. Number of operational taxonomic units in sequences based on similarity cutoff.
Sample 4.5 m 8 m 12 m
OTU 1 0 0 3
OTU 2 3 0 0
OTU 3 0 0 1
OTU 4 28 34 0
OTU 5 0 0 1
OTU 6 0 0 1
OTU 7 0 0 4
OTU 8 0 0 1
OTU 9 1 0 10
OTU 10 0 0 2
OTU 11 1 0 1
OTU 12 2 4 0
OTU 13 0 0 1
OTU 14 0 0 12
OTU 15 0 2 0
OTU 16 1 0 0
OTU 17 1 0 1
TOTAL 37 40 38
Table 4. Number of times each taxonomic unit was found in each level of the water column.

Diversity and distribution of sulfate-reducing bacteria
22
Figure 10. Venn diagram depicting number of OTU sequences shared between 4.5, 8, and 12 m
communities. Circle size represents the approximate OTU sequences isolated from each depth.
Sarah Nalven
23
Figure 11. A cluster dendrogram illustrating results from the Bray Curtis similarity index between OTU
sequences from 4.5, 8, and 12 m.
Diversity and distribution of sulfate-reducing bacteria
24
Figure 12. Phylogenetic tree with sequences from Siders Pond and most similar dsr sequences\
Figure 13. A cluster of the phylogenetic three that contains sequences all isolated from 12 m and related
to a phenanthrine mineralizing sulfate-reducing bacterium.