Lipopolysaccharide (LPS) core biosynthesis in Proteus mirabilis
RESEARCH ARTICLE Open Access
Divergent responses to peptidoglycans derivedfrom different E. coli serotypes influenceinflammatory outcome in trout, Oncorhynchusmykiss, macrophagesSebastian Boltaña1, Felipe Reyes-Lopez2, Davinia Morera1, Frederick Goetz3, Simon A MacKenzie1*
Abstract
Background: Pathogen-associated molecular patterns (PAMPs) are structural components of pathogens such aslipopolysaccharide (LPS) and peptidoglycan (PGN) from bacterial cell walls. PAMP-recognition by the host results inan induction of defence-related genes and often the generation of an inflammatory response. We evaluated boththe transcriptomic and inflammatory response in trout (O. mykiss) macrophages in primary cell culture stimulatedwith DAP-PGN (DAP; meso-diaminopimelic acid, PGN; peptidoglycan) from two strains of Escherichia coli (PGN-K12and PGN-O111:B4) over time.
Results: Transcript profiling was assessed using function-targeted cDNA microarray hybridisation (n = 36) andresults show differential responses to both PGNs that are both time and treatment dependent. Wild type E. coli(K12) generated an increase in transcript number/diversity over time whereas PGN-O111:B4 stimulation resulted ina more specific and intense response. In line with this, Gene Ontology analysis (GO) highlights a specifictranscriptomic remodelling for PGN-O111:B4 whereas results obtained for PGN-K12 show a high similarity to ageneralised inflammatory priming response where multiple functional classes are related to ribosome biogenesis orcellular metabolism. Prostaglandin release was induced by both PGNs and macrophages were significantly moresensitive to PGN-O111:B4 as suggested from microarray data.
Conclusion: Responses at the level of the transcriptome and the inflammatory outcome (prostaglandin synthesis)highlight the different sensitivity of the macrophage to slight differences (serotype) in peptidoglycan structure.Such divergent responses are likely to involve differential receptor sensitivity to ligands or indeed different receptortypes. Such changes in biological response will likely reflect upon pathogenicity of certain serotypes and thedevelopment of disease.
BackgroundDetection of pathogens by host organisms requiresdirect contact between host PRRs (pattern recognitionreceptors) and pathogen-associated molecular patterns(PAMPs) where PAMP-PRR interactions subsequentlydictate the development of the host immune response[1,2]. PAMPs such as the lipopolysaccharides (LPS) andpeptidoglycans (PGN), both bacterial cell wall compo-nents, have been directly implicated in the induction of
the host immune response across the vertebrata [3-9].Peptidoglycan and related fragments are recognised bythe host and induce diverse biological effects, includinginflammation, leukocytosis, or enhanced immuneresponses [10-13]. Like LPS, peptidoglycan, including itsminimal immunomodulatory subunit, muramyl dipep-tide, can bind to the CD14 receptor of target cells inmammals [14-16] although peptidoglycan does not bindto LBP or BPI [17,18]. PGN’s do not activate TLR4-mediated signal transduction but do activate both theTLR2 and NOD pathways [19-24].In Drosophila, PGN recognition is achieved by the
Toll or Immune deficiency (Imd) pathways, at least in
* Correspondence: [email protected] of Biotechnology and Biomedicine, Universitat Autónoma deBarcelona, 08193 Barcelona, SpainFull list of author information is available at the end of the article
Boltaña et al. BMC Genomics 2011, 12:34http://www.biomedcentral.com/1471-2164/12/34
© 2011 Boltaña et al; licensee BioMed Central Ltd. This is an Open Access article distributed under the terms of the Creative CommonsAttribution License (http://creativecommons.org/licenses/by/2.0), which permits unrestricted use, distribution, and reproduction inany medium, provided the original work is properly cited.
part, through peptidoglycan recognition proteins(PGRPs) [25,26]. Both pathways share common featureswith mammalian Toll-like receptor (TLR) and tumournecrosis factor-a (TNF-a) receptor signalling cascadesthat regulate NF-�B activation [27-29]. In vivo studiesin the zebrafish have shown that the PGRP response isessential for successful responses to bacterial infection[30]. Recently, PGN in trout macrophages has beenshown to be the major stimulatory component in crudeLPS preparations characterised by an increase in cyto-kine mRNAs, IL-1b and IL-6, and release of inflamma-tory products as prostaglandin E2 (PGE2) [9]. However,studies addressing different responses to serotype-specific PGNs are scarce throughout the vertebrataincluding mammals.PGN may account for approximately one-half of the
cell wall mass in gram-positive bacteria whereas ingram-negative bacteria only a relatively thin PGN layerin the periplasmic space is present [31,32]. Gram-negative peptidoglycan contains meso-diaminopimelicacid (DAP) as the major peptide group that is directlycross-linked whereas most gram-positive bacteria haveL-lysine as the third amino acid (Lys-type). These Lys-type peptides are cross-linked through an inter-peptidebridge that varies in length and amino acid compositionin different bacteria [32-34].As the structure and composition of the microbial
motif has an important role in host sensing and minormodifications in structure can influence the immuneresponse [35-38] we explored the response of differen-tiated trout macrophages in cell culture to differentPGNs from E. coli of different strains (K12 and O111:B4). Our results show that trout macrophages differen-tially respond to different PGNs at the level of thetranscriptome by either differentially activating RNAtranscripts related to prostaglandin synthesis resultingin the liberation of prostaglandin’s (PGN-O111:B4) orby generating a non-defined inflammatory response,(PGN-K12).
MethodsAnimals and MaterialsHealthy adult specimens (160 g mean weight) of rain-bow trout (O. mykiss) were purchased from a commer-cial hatchery (Piscifactoria Andrés, St Privat, Girona)and held in recirculating freshwater stock tanks (300 L)in the aquarium facilities at the Universitat Autònomade Barcelona. Fish were kept at 15°C with a 12 h light/12 h dark photoperiod cycle, and were fed with a main-tenance ratio of about 0.5% body weight per day. Waterquality indicators (dissolved oxygen, ammonia, nitrite,pH) were analysed periodically.DMEM and FBS were purchased from PAA Labora-
tories (Spain). Poly-D-lysine was purchased from Sigma
(Tres Cantos, Madrid). Primocin, and PGN preparations(PGN E. coli K12, O111:B4) were purchased from Invi-vogen (Nucliber, Spain). Cell strainers and plasticwarewere purchased from BD Biosciences (Madrid, Spain).Gel Green was purchased from Biotium (Labnet, Spain).Prostaglandin E2 and D2 enzyme immunoassay (EIA) kitwas from Cayman (Scharlab, Spain).
Cell culture and stimulationThe experimental protocols used for head kidney isola-tion have been reviewed and approved by the Ethics andAnimal Welfare Committee of the Universitat Auton-oma de Barcelona, Spain. After anaesthetising the fish in3-aminobenzoic acid ethyl ester (0.1 g/L), animals weresacrificed and the head kidney was dissected out. Troutmacrophages were isolated as previously described [39].Before stimulation, differentiated macrophages wereincubated in serum free medium for 3 h. For stimula-tion, the medium of each well was removed and freshmedium containing the indicated concentrations ofPGN were added and the cultures were incubated forthe indicated times.
RNA extraction and complementary DNA (cDNA)synthesisTotal RNA was extracted from cell cultures using 1 mLof TriReagent (Molecular Research Center) per well cellculture, following the manufacturer’s instructions.Quantification was carried out with a Nanodrop1000(Thermo Scientific) and the quality of the RNA waschecked with a Bioanalyzer (Agilent technologies). AllRNA samples had a RIN value >7. Total RNA (2 μg)was used to synthesise cDNA with SuperScript III Tran-scriptase (Invitrogen) and oligo-dT primer (Promega).
Measurement of PGE2 and PGD2 levelsSupernatants from stimulated cell cultures (triplicates)from 3 different fish were recovered, centrifuged andstored at -80°C until use. Measurement of PGE2 andPGD2 levels was completed with a monoclonal EIAaccording to the manufacturer’s instructions. The pros-taglandin kit detection limit was 8 pg/mL. Prior to pros-taglandin determination supernatants were dilutedfive times in EIA assay buffer. The same macrophagecells were used to obtain total RNA for the determina-tion of COX-2 and Prostaglandin D synthase geneexpression as well as the supernatants for PGE2-PGD2
determination.
Microarray analysisThe design of the microarray is described in detailelsewhere [40,41] and a full description of the platformand data presented in this manuscript are accessiblethrough the public GEO depositories (accession number
Boltaña et al. BMC Genomics 2011, 12:34http://www.biomedcentral.com/1471-2164/12/34
Page 2 of 13

GPL6154 and GSE22330). The genes were selected byfunctional classes; random clones from common andsubtracted cDNA libraries 1800 genes printed in sixreplicates each were compared with the known vertebrateproteins using BlastX; overall, the platform was enrichedin a number of functional classes, such as immuneresponse (236 genes), signal transduction (245 genes),receptor activity (126 genes), apoptosis (120 genes), cellcycle (70 genes), protein catabolism (90 genes), folding(70 genes), response to oxidative stress (39 genes), stressand defence response (145 and 105 genes, respectively),and chaperone activity (41 genes). Total RNA wasextracted from cell cultures using 1 mL of TriReagent(Molecular Research Centre) per well, following the man-ufacturer’s instructions, the quantity and integrity wasanalysed by Experion RNA StdSens Analysis Kit (Bio-Rad). Microarray analyses were conducted in pooledsamples (see experimental design of microarray assay).A dye-swap design of hybridisation was applied. In ana-lyses of infected immune cells, the non-infected cellswere used as a control. Each sample was analysed withtwo slides. Scanning was performed with Alphascan(High Performance Dual-Laser Scanner for MicroarraySlides from Alpha Innotech and images were processedwith VisionLite (ThermoSpectronic). The measurementsin spots were filtered by criteria I/B ≥ 3 and (I-B)/(SI +SB) ≥ 0.6, where I and B are the mean signal and back-ground intensities and SI, SB are the standard deviations.After subtraction of mean background, locally weightednon-linear regression (Lowess) normalisation [42] wasperformed separately for each slide. To assess differentialexpression of genes, the normalised log intensity ratioswere analysed with Student’s t-test (p < 0.01). The Baye-sian modification to the false discovery rate (FDR) wasused to correct for multiple comparison tests, estimatingthe q-value for the set of differentially expressed genes[43]. The functional categories of Gene Ontology [44]were compared with regulated genes (p < 0.01) by thesums of ranks (Student t-test p < 0.05). The statisticalsignificance of over-represented functional categories,showing the differential expression in the experimentgrouped by functional classes compared with all genes anGO categories from the chip, was assessed using the Chisquare test with Yates correction (p < 0.05).
Real-Time quantitative PCR and validationIn order to verify microarray results, real-time PCR(qRT-PCR) was carried out. Two micrograms of theindividuals RNA was used to synthesise cDNA withSuperScript III RNase Transcriptase (Invitrogen) andoligo-dT primer (Promega). As a house-keeping gene,18S was amplified from the same cDNA samples. Fordifferent gene expression analysis specific primers wereused (Additional file 1). Real-time PCR reactions were
carried out in a 25 μL reaction with SYBR Green I(Stratagene) using a 1:25 dilution of the cDNA and250 nM of primers. Quantitative qRT-PCR was performedusing a Mx 3000P System (Stratagene) and quantificationwas done according to the Pfaffl method corrected for effi-ciency for each primer set [45]. Values for each samplewere expressed as “fold differences”, calculated relative tocontrols group and normalised for each gene against thoseobtained for the house keeping gene 18S.
Experimental designMicroarray analysismacrophage cell cultures isolated from 84 animals werestimulated with PGNs from E.coli O111:B4 and K12strains and compared to parallel control cultures (with-out stimulation). Cell cultures were individually stimu-lated with both peptidoglycans for 1, 6 and 12 h (12 byPGN and time, n = 72), and 12 control cultures (total;n = 84). Individuals RNAs were grouped into threepools from 4 cell cultures for each time point (1, 6, and12 h). The transcriptomic response was analysed bymicroarray assay, and divided in three experimentaltime points named early (1 h), median (6 h) and latestage (12 h). The analysis was carried out with commongenes expressed within three replicate pools over thecontrol (GDE one way ANOVA p > 0.01). The qRT-PCR validation assay was conducted with total RNAfrom late stage cell cultures.Time Coursemacrophage cell cultures isolated from 9 animals werestimulated with PGN O111:B4 and K12 during 0,30 min, 1, 3, 6, and 12 h (10 μg/mL). The mRNA abun-dance of COX-2 (or prostaglandin endoperoxidesynthase 2) and PTGDS was measured by qRT-PCR,prostaglandin release (PGE2-PGD2) were measuredusing a prostaglandin EIA assay (Cayman). Three indivi-dual replicates were made for each peptidoglycan stimu-lation. The control group was non-stimulated cellcultures (n = 3).Dose-Responsemacrophage cell cultures isolated from 9 animals werestimulated with PGN from the E. coli strains 0111:B4and K12. The treatment was conducted overnight (12 h)with different concentrations, 0, 0.1 and 10 μg/mL, ofPGNs. Expression of COX-2 and PTGDS mRNAs wasmeasured by qRT-PCR, prostaglandin release (PGE2-PGD2) were measured using a prostaglandin EIA assay(Cayman). Three individual replicates were made foreach peptidoglycan stimulation. The control group wasnon-stimulated cell cultures (n = 3).
Statistical analysisAll statistical analysis was conducted with the softwareSPSS Statistic 17.0. The relationship between intensity
Boltaña et al. BMC Genomics 2011, 12:34http://www.biomedcentral.com/1471-2164/12/34
Page 3 of 13
of expression and time was examined and tested for sig-nificant differences between the PGNs with covarianceanalysis (ANCOVA) using the transcriptomic magnitudeas co-variable, followed by one-way ANOVA analysis forup- or down regulated transcripts. The Student t-testwas made to explore the difference between the expres-sion registered in the microarray assay and the qRT-PCR (Additional file 2). Two-way ANOVAs were madeto compare the differences between COX-2 and PTGDSexpression and prostaglandin release in the time-courseand dose-response assay.
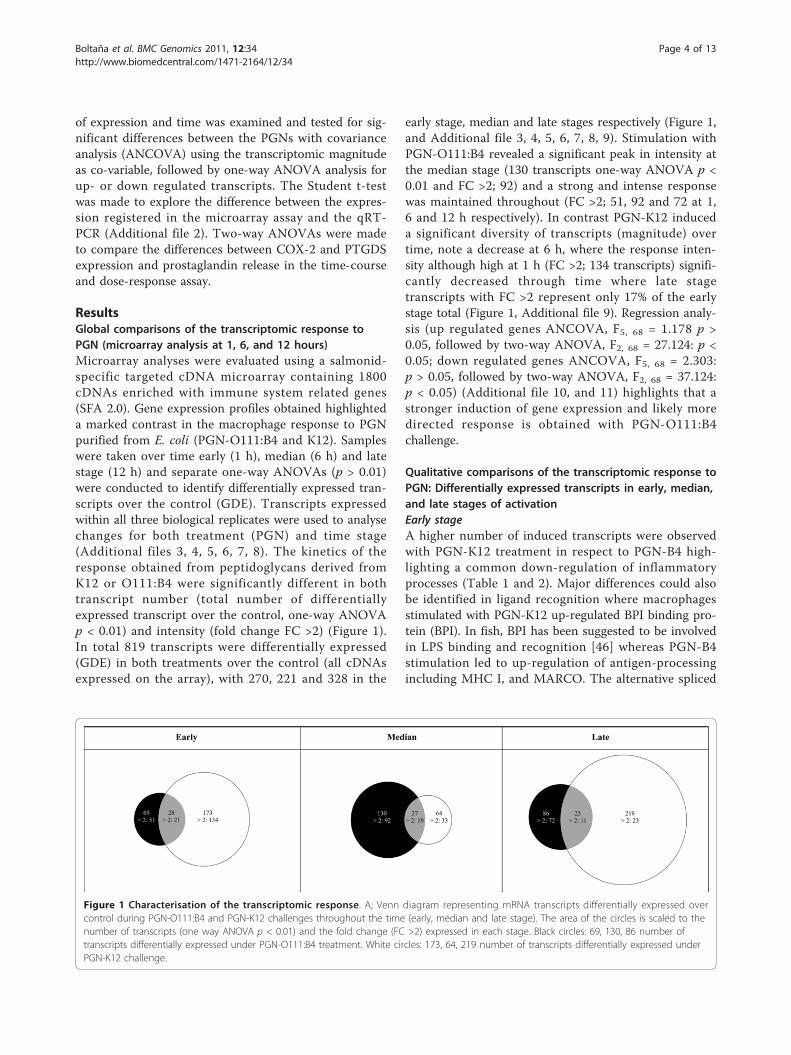
ResultsGlobal comparisons of the transcriptomic response toPGN (microarray analysis at 1, 6, and 12 hours)Microarray analyses were evaluated using a salmonid-specific targeted cDNA microarray containing 1800cDNAs enriched with immune system related genes(SFA 2.0). Gene expression profiles obtained highlighteda marked contrast in the macrophage response to PGNpurified from E. coli (PGN-O111:B4 and K12). Sampleswere taken over time early (1 h), median (6 h) and latestage (12 h) and separate one-way ANOVAs (p > 0.01)were conducted to identify differentially expressed tran-scripts over the control (GDE). Transcripts expressedwithin all three biological replicates were used to analysechanges for both treatment (PGN) and time stage(Additional files 3, 4, 5, 6, 7, 8). The kinetics of theresponse obtained from peptidoglycans derived fromK12 or O111:B4 were significantly different in bothtranscript number (total number of differentiallyexpressed transcript over the control, one-way ANOVAp < 0.01) and intensity (fold change FC >2) (Figure 1).In total 819 transcripts were differentially expressed(GDE) in both treatments over the control (all cDNAsexpressed on the array), with 270, 221 and 328 in the
early stage, median and late stages respectively (Figure 1,and Additional file 3, 4, 5, 6, 7, 8, 9). Stimulation withPGN-O111:B4 revealed a significant peak in intensity atthe median stage (130 transcripts one-way ANOVA p <0.01 and FC >2; 92) and a strong and intense responsewas maintained throughout (FC >2; 51, 92 and 72 at 1,6 and 12 h respectively). In contrast PGN-K12 induceda significant diversity of transcripts (magnitude) overtime, note a decrease at 6 h, where the response inten-sity although high at 1 h (FC >2; 134 transcripts) signifi-cantly decreased through time where late stagetranscripts with FC >2 represent only 17% of the earlystage total (Figure 1, Additional file 9). Regression analy-sis (up regulated genes ANCOVA, F5, 68 = 1.178 p >0.05, followed by two-way ANOVA, F2, 68 = 27.124: p <0.05; down regulated genes ANCOVA, F5, 68 = 2.303:p > 0.05, followed by two-way ANOVA, F2, 68 = 37.124:p < 0.05) (Additional file 10, and 11) highlights that astronger induction of gene expression and likely moredirected response is obtained with PGN-O111:B4challenge.
Qualitative comparisons of the transcriptomic response toPGN: Differentially expressed transcripts in early, median,and late stages of activationEarly stageA higher number of induced transcripts were observedwith PGN-K12 treatment in respect to PGN-B4 high-lighting a common down-regulation of inflammatoryprocesses (Table 1 and 2). Major differences could alsobe identified in ligand recognition where macrophagesstimulated with PGN-K12 up-regulated BPI binding pro-tein (BPI). In fish, BPI has been suggested to be involvedin LPS binding and recognition [46] whereas PGN-B4stimulation led to up-regulation of antigen-processingincluding MHC I, and MARCO. The alternative spliced
Figure 1 Characterisation of the transcriptomic response. A; Venn diagram representing mRNA transcripts differentially expressed overcontrol during PGN-O111:B4 and PGN-K12 challenges throughout the time (early, median and late stage). The area of the circles is scaled to thenumber of transcripts (one way ANOVA p < 0.01) and the fold change (FC >2) expressed in each stage. Black circles: 69, 130, 86 number oftranscripts differentially expressed under PGN-O111:B4 treatment. White circles: 173, 64, 219 number of transcripts differentially expressed underPGN-K12 challenge.
Boltaña et al. BMC Genomics 2011, 12:34http://www.biomedcentral.com/1471-2164/12/34
Page 4 of 13

form of MARCO, Cysteine-rich protein 1, that alsorecognises bacterial cell wall PAMP’s was co-ordinatelydown-regulated [47]. Transcripts related to the inflam-matory response were down regulated under both PGNchallenges including for PGN-B4; N-acetylmuramoyl-L-alanine amidase (bactericidal activity), PGLYPR6 andperoxiredoxin (Table 1) and for PGN-K12; NF-�B inhi-bitor alpha-1 and arachidonate 5-lipoxygenase (Table 2).Microsomal glutathione S-transferase, a precursor forleukotriene and prostaglandin production [48] wasdown-regulated by both treatments. Interestingly,annexin A1-1 was strongly up-regulated (FC; 9.8) inresponse to PGN-K12. This transcript has been
suggested to have anti-inflammatory activity due to itsphospholipase A2 (essential for inflammatory prosta-glandin production) inhibitory activity [49] (Table 2 andAdditional file 6).Median stageOf note at the median stage is that PGN-B4 induces aco-ordinated increase in pro-inflammatory and cellulardefence activity with increased intensity (Table 1 and 2).Mediators of inflammatory prostaglandin production areup-regulated highlighted by increased arachidonate 5lipoxygenase mRNA synthesis. In parallel, cathepsintranscripts (protease activity) (n = 6), PGLYPR6 (ami-dase) and the interleukin enhancer 3 mRNA (regulatesinterleukin production during infectious processes (e.g.,[50]), were also up-regulated. PGN-K12 stimulation atthis point is highlighted by a strong down-regulation oftranscript diversity, including cell adhesion, defenceresponse, cell homeostasis and metabolism, with almostall observed early stage transcripts returning to base-lineconditions (Table 1 and 2). Potentially of importance isthe up-regulation of the transcription factor CCAAT/enhancer binding protein b (C/EBP-b) mRNA by PGN-K12. C/EBP-b has been shown to be intimately linkedto immune and inflammatory processes and regulatesthe transcription of the pro-inflammatory cytokine,interleukin-6. On the other hand, the tumour necrosisfactor (TNF) decoy receptor, which inhibits apoptosis,and NF-�B inhibitor alpha-3 were strongly up-regulatedin addition to an abrupt increase in BPI with PGN-B4.Late stageFor PGN-B4 a defined response was observed after 12 hof stimulation where the prostaglandin endoperoxidesynthase-2 (COX-2), and prostaglandin D synthase, bothlinked to the synthesis of inflammatory prostaglandins,were strongly up-regulated (Table 1). COX-2 (prostaglan-din endoperoxide synthase-2) catalyses the conversion ofarachidonic acid to prostaglandin (PGH2) [51,52], andprostaglandin D synthase (PTGDS) catalyses the conver-sion of PGH2 to prostaglandin D2 (PGD2) [53,54]. Signal-ling components for TLR pathways are also up-regulatedby PGN-B4 including the MAPK pathways and myeloiddifferentiation primary response (MyD88) mRNA, anadapter protein between TLR and the transcription factorNF-�B. Interestingly these components plus the serine/threonine-protein kinase 2 are required to respond tomicrobial ligands [55]. TNF decoy receptor is maintainedup-regulated highlighting the anti-apoptotic response ofPGN-B4 activated macrophages. TNF-a is secreted intothe culture medium as soon as 1 h after PGN treatment[MacKenzie et al, unpublished results]. In contrast to thestrong inflammatory profile obtained for PGN-B4 thePGN-K12, response at 12 h appears related to biologicalthemes associated with energy, protein metabolism andcellular homeostasis at a low level of intensity (Table 2
Table 1 Summary of selected transcripts expressed afterchallenges with PGN-O111:B4
Early Median Late
Antigen presenttion Mean SD Mean SD Mean SD
MHC class I heavy chain-1 4.92 2.35 3.27 1.67 n/s n/s
Macrophage receptor MARCO 2.07 0.56 5.02 1.75 n/s n/s
Cysteine-rich protein 1 -3.59 0.74 n/s n/s n/s n/s
BPI binding protein n/s n/s 11.93 5.78 n/s n/s
Cell adhesion and proliferation
CD166 1.79 0.35 4.99 2.97 3.06 1.48
Cytokines and Chemokines
C-C chemokine receptor type 3 4.25 3.47 n/s n/s n/s n/s
Chemokine receptor CXCR4 n/s n/s -4.24 1.01 n/s n/s
Cellullar defense response
N-acetylmuramoyl-L-alanineamidase
-1.60 0.05 1.46 0.03 1.46 0.17
Peroxiredoxin 1-1 -2.98 1.42 1.30 0.76 1.74 0.30
Interleukin enhancer-bindingfactor 3
n/s n/s 2.39 1.47 n/s n/s
TNF decoy receptor n/s n/s 11.42 3.86 12.09 10.98
NF-kappaB inhibitor alpha-3 n/s n/s 9.24 6.05 n/s n/s
Myeloid differentiation primaryresponse
n/s n/s n/s n/s 1.56 0.29
Phosphotyrosine SH2 domain n/s n/s n/s n/s 2.86 1.17
Procathepsin L-1 n/s n/s 4.11 1.67 n/s n/s
Procathepsin L-2 n/s n/s 3.47 1.28 n/s n/s
Cathepsin B-2 n/s n/s 3.36 2.29 n/s n/s
Cathepsin D-2 n/s n/s 3.99 0.25 n/s n/s
Cathepsin C-1 n/s n/s 3.28 1.16 n/s n/s
Cathepsin C-2 n/s n/s 5.14 5.30 n/s n/s
MAPK/ERK
Serine/threonine-proteinkinase 2
n/s n/s 5.03 2.65 n/s n/s
MAPK/ERK kinase kinase 5-1 n/s n/s -1.68 0.33 n/s n/s
C-Jun protein n/s n/s n/s n/s 3.99 1.62
MAPK/ERK kinase kinase 1-2 n/s n/s n/s n/s 1.87 0.46
MAPK kinase 9-2 n/s n/s n/s n/s 5.78 3.73
Transcripts represented were firstly selected for expression level (p < 0.01)and then implication in biological processes related to PGN stimulation(immune/inflammatory responses) during PGN-O111:B4. n/s: not signal, Mean:Fold expression average (n = 3), SD: standard deviation.
Boltaña et al. BMC Genomics 2011, 12:34http://www.biomedcentral.com/1471-2164/12/34
Page 5 of 13
and Additional file 8). These results imply close similari-ties with those previously obtained for trout macrophagesactivated with crude LPS [56-59] suggesting a commonrecognition mechanism distinct to that observed forPGN-B4.
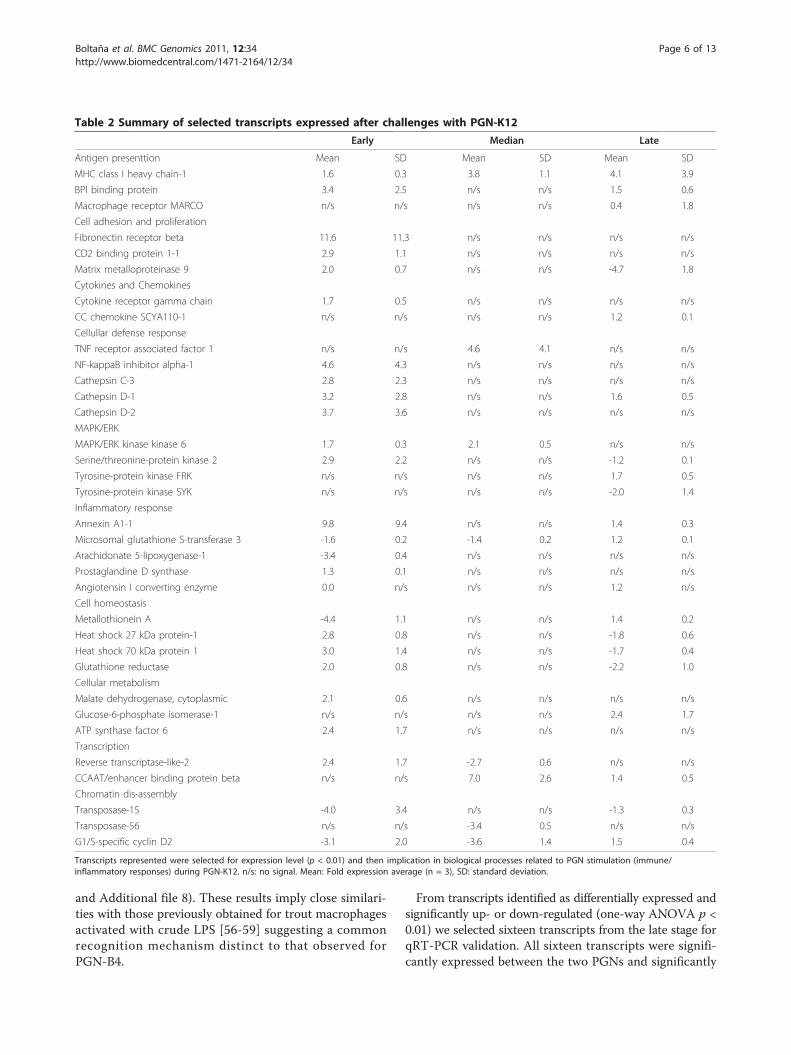
From transcripts identified as differentially expressed andsignificantly up- or down-regulated (one-way ANOVA p <0.01) we selected sixteen transcripts from the late stage forqRT-PCR validation. All sixteen transcripts were signifi-cantly expressed between the two PGNs and significantly
Table 2 Summary of selected transcripts expressed after challenges with PGN-K12
Early Median Late
Antigen presenttion Mean SD Mean SD Mean SD
MHC class I heavy chain-1 1.6 0.3 3.8 1.1 4.1 3.9
BPI binding protein 3.4 2.5 n/s n/s 1.5 0.6
Macrophage receptor MARCO n/s n/s n/s n/s 0.4 1.8
Cell adhesion and proliferation
Fibronectin receptor beta 11.6 11.3 n/s n/s n/s n/s
CD2 binding protein 1-1 2.9 1.1 n/s n/s n/s n/s
Matrix metalloproteinase 9 2.0 0.7 n/s n/s -4.7 1.8
Cytokines and Chemokines
Cytokine receptor gamma chain 1.7 0.5 n/s n/s n/s n/s
CC chemokine SCYA110-1 n/s n/s n/s n/s 1.2 0.1
Cellullar defense response
TNF receptor associated factor 1 n/s n/s 4.6 4.1 n/s n/s
NF-kappaB inhibitor alpha-1 4.6 4.3 n/s n/s n/s n/s
Cathepsin C-3 2.8 2.3 n/s n/s n/s n/s
Cathepsin D-1 3.2 2.8 n/s n/s 1.6 0.5
Cathepsin D-2 3.7 3.6 n/s n/s n/s n/s
MAPK/ERK
MAPK/ERK kinase kinase 6 1.7 0.3 2.1 0.5 n/s n/s
Serine/threonine-protein kinase 2 2.9 2.2 n/s n/s -1.2 0.1
Tyrosine-protein kinase FRK n/s n/s n/s n/s 1.7 0.5
Tyrosine-protein kinase SYK n/s n/s n/s n/s -2.0 1.4
Inflammatory response
Annexin A1-1 9.8 9.4 n/s n/s 1.4 0.3
Microsomal glutathione S-transferase 3 -1.6 0.2 -1.4 0.2 1.2 0.1
Arachidonate 5-lipoxygenase-1 -3.4 0.4 n/s n/s n/s n/s
Prostaglandine D synthase 1.3 0.1 n/s n/s n/s n/s
Angiotensin I converting enzyme 0.0 n/s n/s n/s 1.2 n/s
Cell homeostasis
Metallothionein A -4.4 1.1 n/s n/s 1.4 0.2
Heat shock 27 kDa protein-1 2.8 0.8 n/s n/s -1.8 0.6
Heat shock 70 kDa protein 1 3.0 1.4 n/s n/s -1.7 0.4
Glutathione reductase 2.0 0.8 n/s n/s -2.2 1.0
Cellular metabolism
Malate dehydrogenase, cytoplasmic 2.1 0.6 n/s n/s n/s n/s
Glucose-6-phosphate isomerase-1 n/s n/s n/s n/s 2.4 1.7
ATP synthase factor 6 2.4 1.7 n/s n/s n/s n/s
Transcription
Reverse transcriptase-like-2 2.4 1.7 -2.7 0.6 n/s n/s
CCAAT/enhancer binding protein beta n/s n/s 7.0 2.6 1.4 0.5
Chromatin dis-assembly
Transposase-15 -4.0 3.4 n/s n/s -1.3 0.3
Transposase-56 n/s n/s -3.4 0.5 n/s n/s
G1/S-specific cyclin D2 -3.1 2.0 -3.6 1.4 1.5 0.4
Transcripts represented were selected for expression level (p < 0.01) and then implication in biological processes related to PGN stimulation (immune/inflammatory responses) during PGN-K12. n/s: no signal. Mean: Fold expression average (n = 3), SD: standard deviation.
Boltaña et al. BMC Genomics 2011, 12:34http://www.biomedcentral.com/1471-2164/12/34
Page 6 of 13

correlated when tested by qRT-PCR and Students-T test(p < 0.05); thereby confirming the microarray results. FCvalues obtain by microarray and qRT-PCR analyses arelisted in the additional file 2 (Student T tests p > 0.05).
Functional categories are associated with combinations ofPGN and time parametersAnalysis of function using GO annotations revealed thatmost over-expressed transcripts were related to theimmune response and GO functional categories are speci-fically influenced by a combinatorial PGN-Time effect(Chi-square with Yates correction, p < 0.01, Figure 2). Inthe early stage, different GO categories expressed werePGN-dependent and include MHC class I receptor,lysozome, NF-�B cascade, peptidase activity, cell adhesion,ribosome, or chromatin assembly or disassembly (Figure 2).At the median stage the intensity of the PGN-B4 responseis highlighted by a set of biological processes specificallyassociated to the immune response whereas only two GOclasses, cell adhesion and negative regulation of cell prolif-eration, were represented with PGN-K12 (Figure 2). Atthe late stage an inverse correlation was observed wherepeptidase activity, complement activation, cell homeosta-sis, and mitochondrial electron transport were highlyrepresented with PGN-K12 and NF-�B cascade, protein-MAPK cascade, and ribosome related to the PGN-O111:B4 response (Figure 2). Remarkably, cell wall catabolismwas only observed with PGN-K12 and not during PGN-O111:B4 challenge (Figure 2).
Characterisation of the prostaglandin response (timecourse and dose response of PGN challenges)Both COX-2 and PTGDS were identified by microarrayanalyses as differentially expressed between the twoPGNs, therefore we measured both PGE2 and PGD2
release into the culture supernatant and in parallel
COX-2 and PTGDS mRNA abundance by qRT-PCR.Analyses were done both in respect to response toPGN-B4 and PGN-K12 over time (30 min, 1, 3, 6 and12 h; Figure 3) and subsequently as a dose response(0.1, 1 and 10 μg/mL; Figure 4).
Time course response assay (0, 30 min, 1, 3, 6, and 12 hrsof PGN challenges)COX-2 mRNA expression is strongly regulated by PGN-B4 over time followed by a significant increase in PGE2secretion into the culture medium. Stimulation withPGN-K12 results in an increase of mRNA abundance at1 h (two way ANOVA, F5, 35 = 8.678, p < 0.05, Figure3a, Additional file 12) and a more gradual accumulationof PGE2 in the culture medium in comparison withPGN-B4. The dynamics of PTGDS mRNA expressionwas time dependent (two way ANOVA, F5, 35 = 4.584,p < 0.05, Figure 3a, Additional file 12) showing changesa few minutes after stimulation with both PGNs(30 min) and a strong increase 1 h post-treatment(Figure 3a). The release of PGD2 was significantly differ-ent (increasing) in PGN-B4 treated macrophages 6 hafter stimulation. Differences observed between PGE2 andPGD2 release are correlated to both time and treatment(two way ANOVA, F10, 54 = 4.553, p < 0.05, Figure 3b,Additional file 12) where PGD2 has a low response, con-centrations in the range of 1-14 pg/mL, when comparedwith the PGE2 secretion, >200 pg/mL. PGE2 and PGD2
liberation patterns were strongly influenced by theinteraction between PGN and time (two way ANOVA,F10, 54 = 2.522, p < 0.05, Figure 3b, Additional file 12).
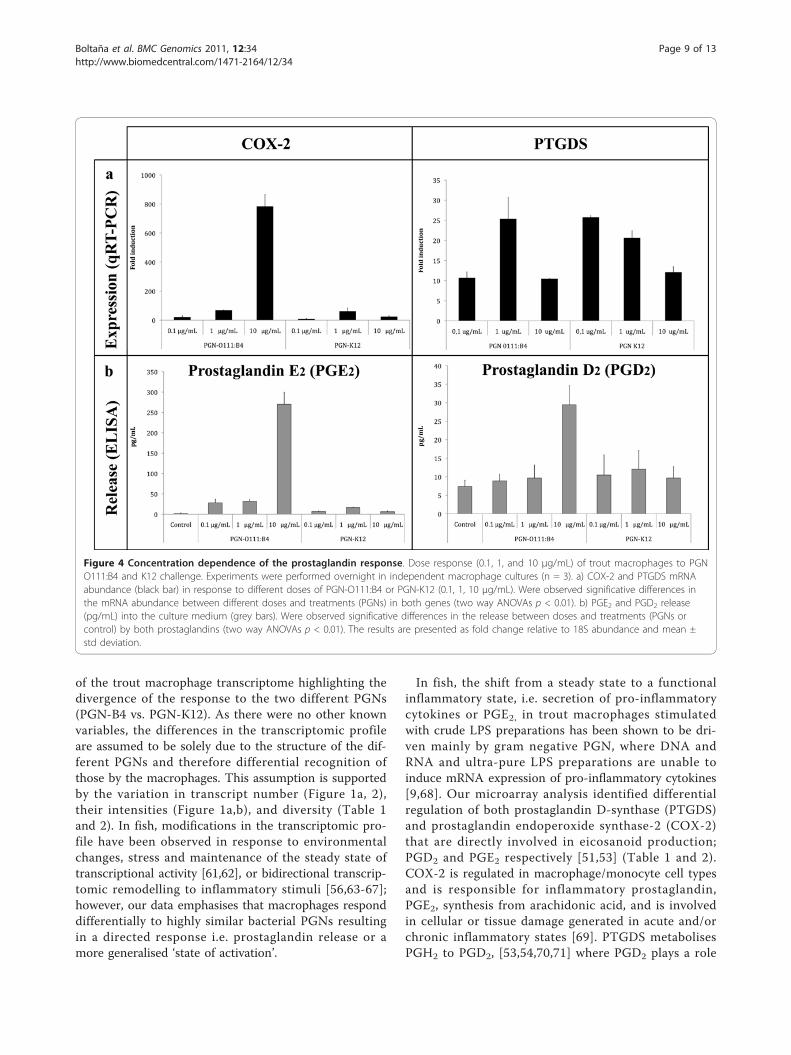
Dose response assay (0.1, 1, and 10 μg/mL of PGN O111:B4 and K12)In dose response assays the expression pattern of COX-2 mRNA induction was both dose and PGN-dependent
Figure 2 Qualitative and quantitative representations of biological processes (GO) over represented during challenges. Qualitative andquantitative representations of over expressed GO categories (Chi-square with Yates correction p < 0.05). The corners of the spider-web mapsrepresent biological processes identified in the GO analysis. Different numbers of transcripts were grouped in each biological process. Thecontinuous mark lines (black or grey) represent the different number of transcripts in each biological process. The differences in the shape of theGO pattern (continuous mark line) are due to divergence in the number of transcripts grouped to each Gene Class (biological process) underboth PGN challenges; the black line shows the GO pattern for PGN-O111:B4 and the grey line shows the GO pattern for PGN-K12 treatment.
Boltaña et al. BMC Genomics 2011, 12:34http://www.biomedcentral.com/1471-2164/12/34
Page 7 of 13

(two way ANOVA, F5, 18 = 5.824, p < 0.05, Figure 4a,Additional file 12). In figure 4a, a peak of COX-2expression was registered at 10 μg/mL of PG-B4. Inter-estingly, PGN-K12 stimulation generated a lowerexpression of COX-2 mRNA (10 μg/mL; >50 fold) whencompared to PGN-B4 although at a dose of 1 μg/mLfold changes are similar for both PGNs (Figure 4a). Thisis reflected in PGE2 liberation where 10 μg/mL of PGN-B4 generated a strong response (>600 fold increase;PGN-interaction, two way ANOVA, F2, 48 = 182.588,p < 0.05, Additional file 12) that correlated to increasedCOX-2 mRNA abundance and all other concentrationsfor both PGNs induced similar responses (>50 fold).The liberation pattern of PGD2 was significantly depen-dent upon PGN type, and showed a single increase at10 μg/mL with PGN-B4 (Two way ANOVA, F2, 48 =4.588, p < 0.05, Additional file 12). Surprisingly this isnot mirrored in PTGDS mRNA abundance levels wherePTGDS mRNA is significantly up-regulated by PGN-
K12 at 0.1 and 1 μg/mL and PGN-B4 at 1 μg/mL(Figure 4b, Additional file 12).
DiscussionIn recent studies on trout macrophages, peptidoglycan(PGN-B4) was identified as a major pro-inflammatorycomponent of crude LPS preparations in which TLR4and canonical TLR2 signalling pathways were discardedas potential recognition systems for peptidoglycans [9].As structural differences in PGN peptide moieties fromdifferent bacterial-strains have been shown to modulatehost responses in both Drosophila and mammals[32,36,38] we investigated, a priori with targeted micro-array analysis, the effects of two different PGNs fromdifferent strains of E. coli, O111:B4 and K12. These dif-ferent serological features have been shown to affect thehost immune response [60]. A systematic dissection ofthe impact of (combinations of) culture parameters(time and treatment) revealed a significant re-modelling
Figure 3 Temporal characterisation of the prostaglandin response. Time course response to macrophages stimulated during 0, 30 min, 1, 3,6, and 12 h with 10 μg/mL of PGN O111:B4 and K12. Experiments were performed in independent groups of PGN-stimulated (n = 3) or controlmacrophage cultures (n = 9). a) COX-2 and PTGDS mRNA abundance over time in response to PGN-B4 (black bar) or PGN-K12 (white bar). Wereobserved significative differences in the mRNA abundance between the times and treatments (PGNs) in both genes (two way ANOVA p < 0.01).b) PGE2 and PGD2 release (pg/mL) stimulated by PGN-O111:B4 (black bars), PGN-K12 (white bars) and control (grey bars) into the culturemedium (n = 3/treatment). Were observed significative differences in the release between the times and treatments (PGNs or control) by bothprostaglandin (two way ANOVAs p < 0,01). The results are presents as fold change relative to 18S abundance and ± std deviation.
Boltaña et al. BMC Genomics 2011, 12:34http://www.biomedcentral.com/1471-2164/12/34
Page 8 of 13
of the trout macrophage transcriptome highlighting thedivergence of the response to the two different PGNs(PGN-B4 vs. PGN-K12). As there were no other knownvariables, the differences in the transcriptomic profileare assumed to be solely due to the structure of the dif-ferent PGNs and therefore differential recognition ofthose by the macrophages. This assumption is supportedby the variation in transcript number (Figure 1a, 2),their intensities (Figure 1a,b), and diversity (Table 1and 2). In fish, modifications in the transcriptomic pro-file have been observed in response to environmentalchanges, stress and maintenance of the steady state oftranscriptional activity [61,62], or bidirectional transcrip-tomic remodelling to inflammatory stimuli [56,63-67];however, our data emphasises that macrophages responddifferentially to highly similar bacterial PGNs resultingin a directed response i.e. prostaglandin release or amore generalised ‘state of activation’.
In fish, the shift from a steady state to a functionalinflammatory state, i.e. secretion of pro-inflammatorycytokines or PGE2, in trout macrophages stimulatedwith crude LPS preparations has been shown to be dri-ven mainly by gram negative PGN, where DNA andRNA and ultra-pure LPS preparations are unable toinduce mRNA expression of pro-inflammatory cytokines[9,68]. Our microarray analysis identified differentialregulation of both prostaglandin D-synthase (PTGDS)and prostaglandin endoperoxide synthase-2 (COX-2)that are directly involved in eicosanoid production;PGD2 and PGE2 respectively [51,53] (Table 1 and 2).COX-2 is regulated in macrophage/monocyte cell typesand is responsible for inflammatory prostaglandin,PGE2, synthesis from arachidonic acid, and is involvedin cellular or tissue damage generated in acute and/orchronic inflammatory states [69]. PTGDS metabolisesPGH2 to PGD2, [53,54,70,71] where PGD2 plays a role
Figure 4 Concentration dependence of the prostaglandin response. Dose response (0.1, 1, and 10 μg/mL) of trout macrophages to PGNO111:B4 and K12 challenge. Experiments were performed overnight in independent macrophage cultures (n = 3). a) COX-2 and PTGDS mRNAabundance (black bar) in response to different doses of PGN-O111:B4 or PGN-K12 (0.1, 1, 10 μg/mL). Were observed significative differences inthe mRNA abundance between different doses and treatments (PGNs) in both genes (two way ANOVAs p < 0.01). b) PGE2 and PGD2 release(pg/mL) into the culture medium (grey bars). Were observed significative differences in the release between doses and treatments (PGNs orcontrol) by both prostaglandins (two way ANOVAs p < 0.01). The results are presented as fold change relative to 18S abundance and mean ±std deviation.
Boltaña et al. BMC Genomics 2011, 12:34http://www.biomedcentral.com/1471-2164/12/34
Page 9 of 13
during the injury process as vasodilator/constrictor or aspotent inflammatory mediator [72,73]. However, theaction of PGD2 in fish as a mediator of the immuneresponse is undefined. Downstream analyses, qRT-PCRand prostaglandin release, of both COX-2 and PTGDSmRNA regulation and PGH2 and PGD2 concentrationin supernatants reveals a strong correlation, both timeand dose-dependent, between PGN-type (B4 vs K12),mRNA abundance and inflammatory outcome (Figure 4).PGN-B4 is clearly a more potent regulator of the COX-2 mRNA/PGE2 pathway where the activation thresholdfor de novo synthesis of COX-2 is 10 μg/mL of PGN-B4.Interestingly this threshold concentration has also beenobserved on numerous occasions for pro-inflammatorycytokine mRNA synthesis in trout macrophages[9,39,46,68]. On the other hand, PTGDS mRNA synth-esis appears as more dose sensitive for both PGNs witha similar temporal expression pattern suggestive of a dif-ferent signal transduction mechanism. However PGN-B4stimulation at 10 μg/mL results in higher PGD2 secre-tion. The regulation and biological effects of PGE2 andPGD2 secretion in inflammatory responses in fish clearlywarrant more investigation.In Drosophila the biological activity of a large panel of
natural and synthetic DAP-PGN showed significant varia-bility in their stimulatory capacity and immune response[74] and PGRP (peptidoglycan recognition protein) defi-cient Drosophila are more susceptible to bacterial infec-tions [75]. In human monocytes exposed to syntheticmuropeptides (peptide moiety of PGNs), TNF-a mRNAexpression and release was highly dependent upon struc-tural modifications between peptides [38]. Thus inflamma-tory outcomes are modified in accordance to sensitivity topeptidoglycan structure. Such sensitivity is likely conferredby the participation of different PRRs, PAMP-PRR interac-tions or the accumulative signalling intensity (i.e. thresh-old) of the group of PRRs involved in recognition.Peptidoglycan recognition in mammals is mainly facili-
tated by three different PRR families; TLR2 (gram posi-tive peptidoglycan), NOD2 and PGRPs all of which canbind peptidoglycans [35,75,76]. TLR2 has been describedin fish species [77] although stimulation with lipoprotein(Pam3CSK4), a classical TLR2-ligand, does not stimulatean inflammatory response in our macrophage model [9].However MyD88, an adaptor molecule involved in theclassical Drosophila or mammalian Toll signalling cas-cades, which together with the receptor associatedkinase (IRAK) and TNF activated factor (TRAF6) allowNF-�B translocation to the nucleus (promoting expres-sion of inducible inflammatory cytokines such asTNF-a) during gram-negative bacterial infection[46,78-80] was specifically up-regulated during PGN-B4 stimulation. This suggests TLR involvement inthe PGN-mediated inflammatory response in trout
macrophages. Concerning PGRPs, PGRP-2, -5 and -6,have been shown in the zebrafish to play an essentialrole in defence during bacterial infections [30] and inthe trout PGRP-2 responds to PGN-B4 [9]. In this studywe also identified PGLYRP-6 (up-regulated; PGN-B4)suggesting that the PGRPs also play a role in specific-PGN recognition and this may be conserved throughoutthe fishes.In contrast to the specific directed response obtained
from PGN-B4 stimulation, PGN-K12 did not elicit a clearfunctional response at the level of the macrophage tran-scriptome or release of inflammatory mediators. A widediversity of transcripts were activated although at arelatively low level. These results are similar to thosepreviously observed for stimulation with crude LPS pre-parations in trout macrophages [[56], Boltaña et al.,unpublished data] where both preparations can stimulatethe release of TNF-a into the culture medium [[68],Roher et al., unpublished data]. Interestingly, TNF recep-tor associated factor 1 was specifically induced by PGN-K12. This transcript encodes a receptor-protein involvedin the activity of apoptotic pathways mediated by TNF-a[80-82], however, we did not detect apoptosis duringthe experimental period [MacKenzie et al, unpublisheddata]. Moreover, the gene ontology category cell wallcatabolism was consistently over-expressed through-out PGN-K12 treatment (Figure 2a,b) supporting theexistence of a strong transduction signal generated byPGN-K12.
ConclusionsOur data highlights the significant differences observedin macrophages responding to two PGNs derived fromdifferent serotypes of the same bacteria. Responses atthe level of the transcriptome and the inflammatory out-come (prostaglandin synthesis) highlight the differentsensitivity of the macrophage to slight differences (sero-type) in peptidoglycan structure. Such divergentresponses are likely to involve differential receptor sensi-tivity to ligands or indeed different receptor types. Suchchanges in biological response will likely reflect uponpathogenicity of certain serotypes and the developmentof disease.
Additional material
Additional file 1: Specific primers used for quantitative qRT-PCR(sequence and accession number).
Additional file 2: Comparison of expression data for selectedtranscripts obtained from microarray analyses and qRT-PCRvalidation. The results are presented as fold change relative to 18Sabundance and mean ± std deviation.
Additional file 3: Description of PGN (O111;B4) regulatedtranscripts/genes over the control (all cDNAs on the array) at earlystage (1 h).
Boltaña et al. BMC Genomics 2011, 12:34http://www.biomedcentral.com/1471-2164/12/34
Page 10 of 13
Additional file 4: Description of PGN (O111;B4) regulatedtranscripts/genes over the control (all cDNAs on the array) atmedian stage (6 h). xls
Additional file 5: Description of PGN (O111;B4) regulatedtranscripts/genes over the control (all cDNAs on the array) at latestage (12 h). xls
Additional file 6: Description of PGN (K12) regulated transcripts/genes over the control (all cDNAs on the array) at early stage (1 h).
Additional file 7: Description of PGN (K12) regulated transcripts/genes over the control (all cDNAs on the array) at median stage (6 h).
Additional file 8: Description of PGN (K12) regulated transcripts/genes over the control (all cDNAs on the array) at late stage (12 h).
Additional file 9: Quantitative summary of transcripts/genesdifferentially expressed over the control in both treatment andstages.
Additional file 10: Relationship between intensity and magnitude oftranscriptomic response in up (a) and down (b) regulated genes atdifferent time stages during the PGNs challenge. The horizontalabscises (magnitude) show the number of transcripts grouped inbiological processes expressed in both treatments as: Antigenpresentation, Cell adhesion and proliferation, Cytokines and Chemokines,Cellullar defense response, MAPK/ERK, Inflammatory response, Cellhomeostasis, Transcription. The vertical abscises (intensity) show foldchange mean (FC: intensity) of the transcripts grouped in each biologicalprocess. The black circle and the blue slope represented the fitgenerated by the intensity and magnitude of the transcriptomicresponse under PGN-O111:B4 treatment. The white circle and the redslope represented the fit generated by the intensity and magnitude ofthe transcriptomic response under PGN-K12 treatment. Transcriptomicprofiles were highly ranked dependent upon PGN-type (two-wayANCOVA on transcriptomic magnitudes of respective intensities a = 0.05;n = 68).
Additional file 11: Summary of ANCOVA analysis for common slopeof regression and adjusted means examining differences inintensity and magnitude of the transcriptomic response at differenttimes (1, 6 and 12 h; n = 68).
Additional file 12: Summary of multiple comparisons of two wayANOVAS.
AbbreviationsPAMPs: pathogen-associated molecular patterns; PGN: peptidoglycans;PGRPs: peptidoglycan recognition proteins; GDE: differentially expressedgenes; COX-2: Cyclooxygenase 2; PTGDS: prostaglandin D synthase.
AcknowledgementsThis study was supported by the Consolider-Ingenio Programme 2010,project CSD2007-0002 funded by the Spanish Ministry of Science andEducation, Spain to SM.
Author details1Institute of Biotechnology and Biomedicine, Universitat Autónoma deBarcelona, 08193 Barcelona, Spain. 2Departamento de Biologia, Universidadde Santiago de Chile, Santiago de Chile, Chile. 3Great Lakes WATER Institute,600 E. Greenfield Ave., Milwaukee, WI 53204, USA.
Authors’ contributionsSM, SB and FG participated in the conception of the experimental design. SBand SM carried out the analysis. SB, FRL and DM performed microarrayexperiments. SB edited expression data, carried all statistical analysis andvalidated array data with qRT-PCR. SB and SM wrote the manuscript and FGcorrected it. All listed authors edited the manuscript. All authors read andapproved the manuscript.
Received: 16 June 2010 Accepted: 14 January 2011Published: 14 January 2011
References1. Kopp E, Medzhitov R: Recognition of microbial infection by Toll-like
receptors. Curr Opin Immunol 2003, 15:396-401.2. Kabelitz D, Medzhitov R: Innate immunity cross-talk with adaptive
immunity through pattern recognition receptors and cytokines. CurrOpin Immunol 2007, 19:1-3.
3. Gupta D, Kirkland TN, Viriyakosol S, Dziarski R: CD14 Is a Cell-activatingReceptor for Bacterial Peptidoglycan. J Biol Chem 1996,271(38):23310-23316.
4. Dziarski R, Tapping RI, Tobias PS: Binding of Bacterial Peptidoglycan toCD14. J Biol Chem 1998, 273(15):8680-8690.
5. Dziarski R, Viriyakosol S, Kirkland TN, Gupta D: Soluble CD14 EnhancesMembrane CD14-Mediated Responses to Peptidoglycan: StructuralRequirements Differ from those for Responses to Lipopolysaccharide.Infect Immun 2000, 68(9):5254-5260.
6. Schrijver IA, Melief MJ, Eulderink F, Hazenberg MP, Laman JD: BacterialPeptidoglycan Polysaccharides in Sterile Human Spleen InduceProinflammatory Cytokine Production by Human Blood Cells. J Infect Dis1999, 179:1459-1468.
7. Rabehi L, Irinopoulou T, Cholley B, Heaffner-Cavaillon N, Carreno MP: Gram-Positive and Gram-Negative Bacteria Do Not Trigger Monocytic CytokineProduction through Similar Intracellular Pathways. Infect Immun 2001,69(7):4590-4599.
8. Iliev DB, Liarte CQ, Mackenzie S, Goetz FW: Activation of rainbow trout(Oncorhynchus mykiss) mononuclear phagocytes by different pathogenassociated molecular pattern (PAMP) bearing agents. Mol Immunol 2005,42:1215-1223.
9. Mackenzie S, Roher N, Boltaña S, Goetz FW: Peptidoglycan, not endotoxin,is the key mediator of cytokine gene expression induced in rainbowtrout macrophages by crude LPS. Mol Immunol 2010, 47:1450-1457.
10. Dziarski R, Gupta D: Role of MD-2 in TLR2-and TLR4-mediated recognitionof Gram-negative and Gram-positive bacteria and activation ofchemokine genes. Innate Immun 2000, 6:401-405.
11. Dziarski R, Gupta D: Staphylococcus aureus Peptidoglycan Is a Toll-LikeReceptor 2 Activator: a Reevaluation. Infect Imm 2005, 78(8):5212-5216.
12. Wang JE, Dahle MK, McDonald M, Foster SJ, Aasen AO, Thiemermann C:Peptidoglycan and lipoteichoic acid in gram-positive bacterial sepsis:receptors, signal transduction, biological effects, and sinergismo. Shock2003, 20(5):402-414.
13. Xu Z, Dziarski R, Wang Q, Swartz K, Sakamoto KM, Gupta D: BacterialPeptidoglycan-Induced tnf- Transcription Is Mediated Through theTranscription Factors Egr-1, Elk-1, and NF-. J Immunol 2001,167(12):6975.
14. Weidemann B, Schletter J, Dziarski R, Kusumoto S, Stelter F, Rietschel ET,Flad HD, Ulmer AJ: Specific Binding of Soluble Peptidoglycan andMuramyldipeptide to CD14 on Human Monocytes. Infect Imm 1997,65(3):858-864.
15. Dziarski R, Tapping RI, Tobias PS: Binding of Bacterial Peptidoglycan toCD14. J Biol Chem 1998, 273(15):8680-8690.
16. Gupta D, Wang Q, Vinson CH, Dziarski R: Bacterial Peptidoglycan InducesCD14-dependent Activation of Transcription Factors CREB/ATF and AP-1.J Biol Chem 1999, 274(20):14012-14020.
17. Mathison JC, Tobias PS, Wolfson E, Ulvevitch RJ: Plasma lipopolysaccharide(LPS)-Binding protein. A Key Component in macropophage Recognitionof Gram-Negative LPS. J Immunol 1992, 149(1):200-206.
18. Dziarski R: Recognition of bacterial peptidoglycan by the innate immunesystem. Cell Mol Life Sci 2003, 60:1793-1804.
19. Schwandner R, Dziarski R, Wesche H, Rothe M, Kirschning CJ:Peptidoglycan-and lipoteichoic acid-induced cell activation is mediatedby toll-like receptor 2. J Biol Chem 1999, 274(25):17406-17419.
20. Schröder N, Morath S, Alexander C, Hamann L, Hartung T, Zahringer U,Gobel U, Weber J, Schumann RRalf: Lipoteichoic Acid (LTA) ofStreptococcus pneumoniae and Staphylococcus aureus ActivatesImmune Cells via Toll-like Receptor (TLR)-2, Lipopolysaccharide-bindingProtein (LBP), and CD14, whereas TLR-4 and MD-2 Are Not Involved.J Biol Chem 2003, 278(18):15587-15594.
21. Chamaillard M, Girardin S, Viala J, Philpott D: NODs, Nalps and Naip:intracellular regulators of bacterial-induced inflammation. Cell Microbiol2003, 5:581-592.
22. Girardin SE, Boneca IG, Viala J, Chamaillard M, Labigne A, Thomas G,Philpott DJ, Sansonetti PJ: Nod2 Is a General Sensor of Peptidoglycan
Boltaña et al. BMC Genomics 2011, 12:34http://www.biomedcentral.com/1471-2164/12/34
Page 11 of 13

through Muramyl Dipeptide (MDP) Detection. J Biol Chem 2003,278(11):8869-8872.
23. Girardin SE, Boneca IG, Carneiro LA, Antignac A, Jehanno M, Viala J, Tedin K,Taha MK, Labigne A, Zaehringer U, Coyl AJ, Di Stefano PS, Bertin J,Sansonetti PJ, Philpott DJ: Nod1 Detects a Unique Muropeptide fromGram-Negative Bacterial Peptidoglycan. Science 2003, 300:1584-1587,2003.
24. Inohara N, Ogura Y, Fontalba A, Gutierrez O, Pons F, Crespo J, Fukase K,Inamura S, Kusumoto S, Hashimoto M, Foster SJ, Moran AP, Fernandez-Luna JS, Nuñez G: Host Recognition of Bacterial Muramyl DipeptideMediated through NOD2. J Biol Chem 2003, 278:5509-5512.
25. Kang D, Liu G, Lundstrom A, Gelius E, Steiner H: A peptidoglycanrecognition protein in innate immunity conserved from insects tohumans. Proc Natl Acad Sci USA 1998, 95:10078-10082.
26. Werner T, Liu G, Kang D, Ekengren S, Steiner H, Hultmark D: A family ofpeptidoglycan recognition proteins in the fruit fly Drosophilamelanogaster. Proc Natl Acad Sci USA 2000, 97:13772-13777.
27. De Gregorio E, Spellman PT, Rubin GM, Lemaitre B: Genome-wide analysisof the Drosophila immune response by using oligonucleotidemicroarrays. Proc Natl Acad Sci USA 2001, 98:12590-12595.
28. De Gregorio E, Spellman P, Tzou P, Rubin GM, Lematrie B: The Toll andImd pathways are the major regulators of the immune response inDrosophila. EMBO Journal 2002, 21(11):2568-2579.
29. Boutros M, Agaisse H, Perrimon N: Sequential Activation of SignalingPathways during Innate Immune Responses in Drosophila. Dev Cell 2002,3:711-722.
30. Li X, Wang S, Qi J, Echtenkamp SF, Chatterjee R, Wang M, Boons G,Dziarski R, Gupta D: Zebrafish Peptidoglycan Recognition Proteins AreBactericidal Amidases. Nature Rev Immunol 2007, 2:725-734.
31. Ghuysen JM: Use of Bacteriolytic Enzymes in Determination of WallStructure and Their Role in Cell Metabolism. Bacteriol Rev 1968,32(4):425-464.
32. Schleifer KH, Kandler O: Peptidoglycan types of bacterial cell walls andtheir taxonomic implications. Bacteriol Rev 1972, 36:407-77.
33. Jenni R, Berger-Bächi B: Teichoic acid content in different lineages ofStaphylococcus aureus NCTC832. Arch Microbiol 1998, 170:171-178.
34. Deininger S, Stadelmaier A, Von Aulock S, Morath S, Schmidt RR, Hartung T:Definition of structural prerequisites for lipoteichoic acid-induciblecytokine induction by synthetic derivatives. J Immunol 2003,170:4134-4138.
35. Boneca IG: The role of peptidoglycan in pathogenesis. Curr Opin Microbiol2005, 8:46-53.
36. Kumar S, Roychowdhury A, Ember B, Wang Q, Guan R, Mariuzza RA,Boons GJ: Selective recognition of synthetic lysine and meso-diaminopimelic acid-type peptidoglycan fragments by humanpeptidoglycan recognition proteins. J Biol Chem 2005, 280:37005-37012.
37. Wolfert MA, Murray TF, Boons GJ, Moore JN: The Origin of the SynergisticEffect of Muramyl Dipeptide with Endotoxin and Peptidoglycan. J BiolChem 2002, 277(42):39179-39186.
38. Wolfert MA, Roychowdhury A, Boons GJ: Modification of the Structure ofPeptidoglycan Is a Strategy To Avoid Detection by Nucleotide-BindingOligomerization Domain Protein 1. Infect Immun 2007, 75(2):706-713.
39. Mackenzie S, Planas JV, Goetz FW: LPS-stimulated expression of a tumornecrosis factor-alpha mRNA in primary trout monocytes and in vitrodifferentiated macrophages. Dev Comp Immunol 2003, 27:393-400.
40. Koskinen H, Pehkonen P, Vehniainen E, Krasnov A, Rexroad C, Afanasyev S,Molsa H, Oikari A: Response of rainbow trout transcriptome to modelchemical contaminants. Biochem Biophys Res Commun 2004, 320:745-753.
41. Krasnov A, Koskinen H, Pehkonen P, Rexroad CE, Afanasyev S, Molsa H:Gene expression in the brain and kidney of rainbow trout in responseto handling stress. BMC Genomics 2005, 6(1):3-18.
42. Cleveland WS, Grosse E, Shyu WM: Local regression models. In StatisticalModels. Edited by: Chambers JM, S TJHE. Pacific Grove, Wadsworth androoks/Cole; 1999:309-376.
43. Storey JD, Tibshirani R: Statistical significance for genomewide studies.Proceedings of the National Academy of Sciences of the United States ofAmerica 2003, 100(16):9440-9445.
44. Ashburner M, Ball CA, Blake JA, Botstein D, Butler H, Cherry JM, Davis AP,Dolinski K, Dwight SS, Eppig JT, Harris MA, Hill DP, Issel-Tarver L, Kasarskis A,Lewis S, Matese JC, Richardson JE, Ringwald M, Rubin GM, Sherlock G: Gene
ontology: tool for the unification of biology. The Gene OntologyConsortium. Nat Genet 2000, 25(1):25-29.
45. Pfaffl MW: A new mathematical model for relative quantification in real-time RT-PCR. Nucleic Acids Res 2001, 29:45-53.
46. Iliev DB, Roach KC, Mackenzie S, Planas JV, Goetz FW: Endotoxinrecognition: In fish or not in fish? FEBS Letters 2005, 579:6519-6528.
47. Kraal G, Luc JW, Laan V, Eloma O, Tryggvason K: The macrophage receptorMARCO. Microbes Infect 2000, 2:313-316.
48. Hebert H, Jegerschöld C: The structure of membrane associated proteinsin eicosanoid and glutathione metabolism as determined by electroncrystallography. Curr Opin Struc Biol 2007, 17(4):396-404.
49. Wallner BP, Mattaliano RJ, Hession C, Cate RL, Tizard R, Sinclair LK, Foeller C,Chow EP, Browning JL, Ramachandran KL, Pepinsky B: Cloning andexpression of human lipocortin, a phospholipase A2 inhibitor withpotential anti-inflammatory activity. Nature 1986, 320:77-81.
50. Saunders L, Perkins R, Balachandran D, Michaels S, Ford R, Mayeda R,Barber A: Characterization of two evolutionarily conserved, alternativelyspliced nuclear phosphoproteins, NFAR-1 and -2, that function inmRNA processing and interact with the double-stranded RNA-dependent protein kinase, PKR. J. Biological Chem 2001,276:32300-32312.
51. Hla T, Neilson K: Human cyclooxygenase-2 cDNA. Proc Natl Acad Sci USA1992, 89:7384-7388.
52. Tazawa R, Xu XM, Wu KK, Wang LH: Characterization of the GenomicStructure, Chromosomal Location and Promoter of Human ProstaglandinH Synthase-2 Gene. Biochem Bioph Res Co 1994, 203(1):190-199.
53. Shimizu T, Yamamoto S, Hayaishi O: Purification and properties ofprostaglandin D synthetase from rat brain. J Biol Chem 1979,254:5222-5228.
54. Nagata A, Suzuki Y, Igarashi M, Eguchi N, Toho H, Urade Y, Hayaishi O:Human brain prostaglandin D synthase has been evolutionarilydifferentiated from lipophilic-ligand carrier proteins. Proc. Nati. Acad. Sci.USA 1991, 88:4020-4024.
55. Kambris Z, Jang BS, Nam IH, Romeo HJ, Takahashi Y, Lee K, Ueda WJ,Lemaitre B: Drosophila immunity: a large-scale in vivo RNAi screenidentifies five serine proteases required for Toll activation. Curr Biol 2006,16:808-813.
56. Mackenzie S, Balasch JC, Novoa B, Ribas L, Roher N, Krasnov A, Figueras A:Comparative analysis of the acute response of the trout, O. mykiss, headkidney to in vivo challenge with virulent and attenuated infectioushematopoietic necrosis virus and LPS-induced inflammation. BMCGenomics 2008, 9:141-156.
57. Goetz FW, Planas JV, Mackenzie S: Tumor necrosis factors. Dev CompImmunol 2004, 28:487-497.
58. Mackenzie S, Montserrat N, Mas M, Acerete L, Tort L, Krasnov A, Goetz FW,Planas JV: Bacterial lipopolysaccharide induces apoptosis in the troutovary. Reprod Biol Endocrin 2006, 4:46-58.
59. Mackenzie S, Iliev D, Liarte C, Koskinen H, Planas JV, Goetz FW, Molsä H,Krasnov A, Tort L: Transcriptional analysis of LPS-stimulated activation oftrout (Oncorhynchus mykiss) monocyte/macrophage cells in primaryculture treated with cortisol. Molec Immun 2006, 43(9):1340-1348.
60. Barclay GR, Scott BB: Serological Relationships between Escherichia coliand Salmonella smooth- and rough-mutant lipopolysaccharides asrevealed by enzyme-linked immunosorbent assay for humanimmunoglobulin G Antiendotoxin Antibodies. Innate Immun 1987,55(11):2706-2714.
61. Bayne CJ, Gerwick L, Wheeler PA, Thorgaard GH: Transcriptome profiles oflivers and kidneys from three rainbow trout (Oncorhynchus mykiss)clonal lines distinguish stocks from three allopatric populations. ComBiochem Physiol 2006, 1:396-403.
62. Roberge C, Einum S, Guderley H: Bernatchez Rapid parallel evolutionarychanges of gene transcription profiles in farmed Atlantic salmon. MolEcol 2006, 15:9-20.
63. Doñate , Balasch JC, Callol A, Bobe J, Tort L, Mackenzie S: The effects ofimmunostimulation through dietary manipulation in the rainbow trout;evaluation of mucosal immunity. Mar Biotechnol 2010, 12(1):88-99.
64. Byon JY, Ohira T, Hirono I, Aoki T: Use of a cDNA microarray to studyimmunity against viral hemorrhagic septicemia (VHS) in Japaneseflounder (Paralichthys olivaceus) following DNA vaccination. Fish ShellfishImmunol 2005, 18:135-147.
Boltaña et al. BMC Genomics 2011, 12:34http://www.biomedcentral.com/1471-2164/12/34
Page 12 of 13
65. Martin S, Blaney SC, Houlihan DF, Secombes CJ: Transcriptome responsefollowing administration of a live bacterial vaccine in Atlantic salmon(Salmo salar). Mol Immunol 2006, 43:1900-1911.
66. Jorgensen SM, Afanasyev S, Krasnov A: Gene expression analyses inAtlantic salmon challenged with infectious salmon anemia virus revealdifferences between individuals with early, intermediate and latemortality. BMC Genomics 2008, 9:179-186.
67. Aluru N, Vijayan MM: Stress transcriptomics in fish: A role for genomiccortisol signaling. Gen Com Endoc 2009, 164:142-150.
68. Roher N, Callol A, Planas J, Goetz F, Mackenzie S: Endotoxin recognition infish results in inflammatory cytokine secretion not gene expresión.Innate Immun 2010, 10:245-267.
69. Hinz B, Brune K: Cyclooxygenase-2-10 years later. J Pharmacol Exp Ther2002, 300(2):367-375.
70. Chen BC, Liao CC, Hsu MJ, Liao YT, Lin CC, Sheu JR, Lin CH: Peptidoglycan-induced IL-6 production in RAW 264.7 macrophages is mediated bycyclooxygenase-2, PGE2/PGE4 receptors, protein kinase A, I kappa Bkinase, and NF-kappa B. J. Immunol 2006, 177:681-693.
71. Chen BC, Kang JC, Lu YT, Hsu MJ, Liao CC, Chiu WT, Yeh FL, Lin CH: Rac1regulates peptidoglycan-induced nuclear factor-kappaB activation andcyclooxygenase-2 expression in RAW 264.7 macrophages by activat- ingthe phosphatidylinositol 3-kinase/Akt pathway. Mol. Immunol 2009,46:1179-1188.
72. Urade Y, Hayaishi O: Prostaglandin D synthase: Structure and function.Vitam Horm 2000, 58:89-120.
73. Kanaoka Y, Urade Y: Hematopoietic prostaglandin D synthase.Prostaglandins Leukot Essent Fat Acids 2003, 69(3):163-167.
74. Stenbak C, Ryu J, Leulier F, Pili-Floury S, Parquet C, Herve M, Chaput C,Boneca I, Lee W, Lemaitre B, Mengin-Lecreulx D: Peptidoglycan molecularrequirements allowing detection by the Drosophila immune deficiencypathway. J. Immunol 2004, 173:7339-7348.
75. Royet J, Dziarski R: Peptidoglycan recognition proteins: pleiotropicsensors and effectors of antimicrobial defences. Nature Rev Microbiol2007, 5(4):267-277.
76. McDonald C, Inohara N, Nuñez G: Peptidoglycan Signaling in InnateImmunity and Inflammatory Disease. J Biol Chem 2005,280(21):20177-20180.
77. Baoprasertkul P, Peatman E, Abernathy J, Liu Z: Structural characterisationand expression analysis of Toll-like receptor 2 gene from catfish. FishShellfish Immun 2007, 22(4):418-426.
78. Hoebe K, Du X, Georgel P, Janssen E, Tabeta K, Kim S, Goode J, Lin P,Mann N, Mudd S, Crozat K, Sovath S, Han J, Beutler B: Identification ofLps2 as a key transducer of MyD88-independent TIR signalling. Nature2003, 424:743-748.
79. Jiang Z, Georgel P, Du X, Shamel L, Sovath L, Mudd S, Huber M, Kalis C,Keck S, Galanos C, Freudenberg M, Beutler B: CD14 is required for MyD88-independent LPS signaling. Nature Immunol 2005, 6(6):565-573.
80. Akira S: Mammalian Toll-like receptors. Curr opin 2003, 15:5-11.81. Locksley RM, Killeen N, Lenardo MJ: The TNF and TNF receptor
superfamilies: integrating mammalian biology. Cell 2001, 104(4):487-501.82. Cha GH, Cho KS, Lee JH, Kim M, Kim E, Park J, Lee SB, Chung J: Discrete
Functions of TRAF1 and TRAF2 in Drosophila melanogaster Mediated byc-Jun N-Terminal Kinase and NF-B-Dependent Signaling Pathways. MolCell Biol 2003, 23(22):7982-7991.
doi:10.1186/1471-2164-12-34Cite this article as: Boltaña et al.: Divergent responses to peptidoglycansderived from different E. coli serotypes influence inflammatory outcomein trout, Oncorhynchus mykiss, macrophages. BMC Genomics 2011 12:34. Submit your next manuscript to BioMed Central
and take full advantage of:
• Convenient online submission
• Thorough peer review
• No space constraints or color figure charges
• Immediate publication on acceptance
• Inclusion in PubMed, CAS, Scopus and Google Scholar
• Research which is freely available for redistribution
Submit your manuscript at www.biomedcentral.com/submit
Boltaña et al. BMC Genomics 2011, 12:34http://www.biomedcentral.com/1471-2164/12/34
Page 13 of 13