DIuIN PAPr SrI - IZA Institute of Labor Economicsftp.iza.org/dp10513.pdf · 2017-02-02 · DIuIN...
37
DISCUSSION PAPER SERIES IZA DP No. 10513 Bernt Bratsberg Oddbjørn Raaum Knut Røed Immigrant Labor Market Integration across Admission Classes JANUARY 2017
Transcript of DIuIN PAPr SrI - IZA Institute of Labor Economicsftp.iza.org/dp10513.pdf · 2017-02-02 · DIuIN...

Discussion PaPer series
IZA DP No. 10513
Bernt BratsbergOddbjørn RaaumKnut Røed
Immigrant Labor Market Integration across Admission Classes
jANuAry 2017
Any opinions expressed in this paper are those of the author(s) and not those of IZA. Research published in this series may include views on policy, but IZA takes no institutional policy positions. The IZA research network is committed to the IZA Guiding Principles of Research Integrity.The IZA Institute of Labor Economics is an independent economic research institute that conducts research in labor economics and offers evidence-based policy advice on labor market issues. Supported by the Deutsche Post Foundation, IZA runs the world’s largest network of economists, whose research aims to provide answers to the global labor market challenges of our time. Our key objective is to build bridges between academic research, policymakers and society.IZA Discussion Papers often represent preliminary work and are circulated to encourage discussion. Citation of such a paper should account for its provisional character. A revised version may be available directly from the author.
Schaumburg-Lippe-Straße 5–953113 Bonn, Germany
Phone: +49-228-3894-0Email: [email protected] www.iza.org
IZA – Institute of Labor Economics
Discussion PaPer series
IZA DP No. 10513
Immigrant Labor Market Integration across Admission Classes
jANuAry 2017
Bernt BratsbergRagnar Frisch Centre for Economic Research
Oddbjørn RaaumRagnar Frisch Centre for Economic Research and IZA
Knut RøedRagnar Frisch Centre for Economic Research and IZA
AbstrAct
IZA DP No. 10513 jANuAry 2017
Immigrant Labor Market Integration across Admission Classes*
We examine patterns of labor market integration across immigrant groups. The study
draws on Norwegian longitudinal administrative data covering labor earnings and social
insurance claims over a 25‐year period and presents a comprehensive picture of immigrant‐
native employment and social insurance differentials by admission class and by years since
entry. For refugees and family immigrants from low‐income source countries, we uncover
encouraging signs of labor market integration during an initial period upon admission, but
after just 5‐10 years, the integration process goes into reverse with widening immigrant-
native employment differentials and rising rates of immigrant social insurance dependency.
Yet, the analysis reveals substantial heterogeneity within admission class and points to an
important role of host‐country schooling for successful immigrant labor market integration.
JEL Classification: F22, H55, J22
Keywords: migration, refugees, assimilation, social insurance
Corresponding author:Bernt BratsbergThe Ragnar Frisch Centre for Economic ResearchGaustadalléen 210349 OsloNorway
E‐mail: [email protected]
* The manuscript is prepared for the Nordic Economic Policy Review special issue on labor market integration of refugees. We are grateful to Anna Piil Damm, Anders Forslund, and Torben Tranæs for helpful comments. We also acknowledge funding from the Ministry of Finance (project “Employment and Social Insurance among Immigrant Groups in Norway”) and NORFACE (project “Globalisation, Institutions and the Welfare State”). The paper is part of the research activities of Oslo Fiscal Studies - a Centre for Public Economics, University of Oslo. Data made available by Statistics Norway have been essential for this research.

3
1. Introduction
Rising rates of immigration over the past decade have spurred debates on immigration and
integration policies in many destination countries, questioning the absorptive capacity of
recipient economies. In the Nordic countries, two important developments have lifted
immigration and integration issues to the top of the political agenda. The first is the 2004
and 2007 enlargements of the common European labor market, which triggered a massive
inflow of labor migrants from Eastern Europe. The second is the recent refugee crisis, which
culminated during the autumn of 2015 with historically high levels of asylum seekers in most
European countries. At the same time, family immigration has brought fundamental change
to the demographic make‐up of the Nordic populations.
In a world with large cross‐country productivity differences, there will potentially be
considerable economic gains associated with unrestricted movement of persons across
national borders, as open borders allow labor to flow towards its best use (Clemens, 2011;
Kennan, 2013). With the ageing of European populations, immigration has also been hailed
as a possible solution to the demographic and fiscal challenges facing these countries over
the coming decades (Storesletten, 2000). However, for higher immigration rates to alleviate
rather than to aggravate the fiscal challenges ahead, successful integration of immigrants in
the host‐country labor market is crucial. In order to assess the merits of integration policies,
and, more generally, the economic and fiscal consequences of increased immigration, it is
necessary to examine residential decisions as well as labor market behavior and social
insurance claims over the long haul. In particular, studying the labor market performance of
immigrants during their very first years in the host country provides little insight into the
overall economic consequences of immigration, as, for example, labor immigrants by
definition will have a job whereas refugees have had little chance of obtaining employment
at this stage. This observation also implies that simple cross‐sectional comparisons of, say,
employment rates between immigrants and natives may not be informative about the
ultimate economic consequences of immigration. What we need is knowledge about how
the labor market careers are likely to evolve over the potentially productive years spent in
the host country.
In the present paper, we take advantage of population‐based administrative register data,
linked to detailed information of type of immigrant admission, and give a comprehensive

4
account of the longitudinal labor market performance of the major immigrant groups that
have arrived in Norway over the past 25 years. In particular, we distinguish between
immigrants from the “old” and “new” EU, and, for immigrants from low‐income source
countries, those admitted for protection (e.g., given refugee or asylum status) and for family
(re)unification, whether with an immigrant or a Norwegian reference person. Some of our
findings are unsettling: For immigrants admitted for protection or family reunification, we
find that the initially encouraging labor‐market integration process comes to a halt already
after five to seven years, for most groups at employment levels still well below those of
similar natives. More surprisingly, the integration process then runs into reverse, with
consistently widening immigrant‐native employment differentials over time. Hence, apart
from the first few years of residence, we find that the expected difference in labor market
performance between immigrants and natives increases with years since migration, ceteris
paribus. Our findings also contain some more encouraging results: There is substantial
variation in labor market performance within origin country and admission class, and human
capital investments, particularly through the Norwegian educational system, appear to make
a big difference. Some immigrant groups reach employment rates that are similar to those of
natives, at least over some years. Such heterogeneity in outcomes suggests that poor
immigrant integration is not inevitable and that there is a genuine potential for higher and
more stable employment.
Our results add to a body of empirical evidence indicating that humanitarian immigrants in
Europe tend to be underrepresented in employment and/or overrepresented among
claimants in social insurance programs (Husted et al., 2001; Sarvimäki, 2011, 2017;
Lundborg, 2013; Bratsberg et al., 2014; Damas de Matos and Liebig, 2014; Schultz‐Nielsen,
2017; Åslund et al., 2017). Recent studies using cross‐sectional EU labor force survey (EU‐
LFS) data from 2008 (Damas de Matos and Liebig, 2014; Dustmann et al., 2016) and 2014
(Dumont et al., 2016) document low employment rates among refugees in most destination
countries. However, the EU‐LFS based studies also indicate that the native‐refugee
employment gap in general declines with the length of stay in Europe, similar to findings for
refugee immigrants in the United States (Borjas, 1982; Cortes, 2004). According to the 2014
EU‐LFS, refugees even catch up with natives after 15 years in five of out of nine member
states included with reliable data for such comparisons (Dumont et al., 2016; p. 21). Behind

5
this average employment profile, refugee employment varies widely across destination
countries. The study also points to large differentials by origin country, with Bosnian
refugees being highly successful and refugees from the Middle East having significantly
lower employment rates. A recent study using 2011 administrative data from Sweden finds
an average employment gap to natives of 30 percentage points for humanitarian migrants
(refugees) and 26 percentage point for family immigrants (Luik et al., 2016).
To our knowledge, along with Schultz‐Nielsen (2017), the present paper is the first to
present a comprehensive picture of immigrant‐native employment and social insurance
differentials by admission class and by years since migration based on panel data. While our
findings may be viewed as a bit discouraging with respect to the ability of the Norwegian
labor market to utilize the productive resources of immigrants over the long haul, it is also
worth emphasizing that our results indicate considerable scope for improvement. The fact
that immigrants’ employment rates in many cases decline after just five years of residence
suggests that there exists an underutilized labor supply potential. Paired with the finding of
large employment differentials linked to Norwegian schooling, we argue that there is a case
for increased early human capital investments in order to improve language skills and
provide marketable qualifications. In view of the inexorable rise in social insurance program
participation with time in the country, we also advocate a more activity‐oriented social
insurance system, with focus on finding and offering suitable paid work rather than merely
securing family income.
2. ImmigrationtoNorway
Figure 1 shows annual gross inflows of immigrants to Norway over the last 26 years.
Migration flows from outside the EU and OECD are split into four admission classes; work,
education (a category that includes au pairs), family (re)unification, and refugee protection.1
The figure also distinguishes between inflows from countries that were included in the
European Union following the 2004 and 2007 enlargements (“New EU”) and the old EU
member countries in western Europe, the Nordic countries, and other OECD countries (for
simplicity grouped together as “Old EU/OECD”). The visible spikes during the 1990s reflect
1 Refugees include both resettlement refugees (typically through the United Nations High Commissioner for Refugees resettlement program) and those admitted following asylum application (who reached Norway by independent means before seeking asylum).

6
waves of refugee arrivals and persons granted political asylum, the Balkans (early 1990s),
and Iraq and Somalia (late 1990s). Over the last ten years, refugee arrivals have trended
upwards although immigrants from the new EU countries have dominated overall inflows.
Fig 1: Immigrant (gross) inflows by admission class or major source region, 1990‐2015
Until the EU enlargement in 2004, the vast majority of admissions from outside Europe were
based on humanitarian motives and family reunification. Since the 1975 immigration freeze,
work‐related immigration from developing countries has been limited as such admissions
have been restricted to the “specialist” or “seasonal worker” programs, which normally
require that the applicant already has a job offer at the time of application. The immigration
legislation gives citizens of countries with a labor agreement with Norway the right to enter
and search for a job for up to six months. Important labor agreements in recent times
include those between the Nordic countries since 1954 and the European Economic Area
(EEA; i.e., the European Union and member states of the European Free Trade Association)
since 1994. Although Norway has stayed outside the European Union, the 2004 and 2007
010
2030
4050
60Im
mig
ratio
n (
100
0s)
1990 1995 2000 2005 2010 2015
New EUOld EU/OECDWork (LDC)Education
FamilyRefugee

7
eastwards enlargements of the European Union opened the Norwegian labor market to
citizens of accession countries owing to Norway’s EEA membership. As is evident from Figure
1, the EU enlargements triggered massive labor migration to Norway and account for the
majority of the rise in immigration since 2004.
A considerable fraction of the immigrants leaves the country after just a few years. As
illustrated in Figure 2, this is particularly the case for immigrants from the old EU and for
students and work‐related immigrants from developing countries. For these groups, fewer
than 50 percent remain in the country 5 years after entry. For refugees and family migrants,
the picture is very different, and around 80 percent appear to have settled permanently in
the country. Immigrants from the new EU have a settlement pattern somewhere in
between, with approximately 70 percent settled on a permanent basis. An implication of
such differential outmigration patterns is that the long‐term labor market performance of
refugees and family immigrants is of particular economic and fiscal importance.
Fig 2: Fraction of immigrants still in Norway, by admission class, arrival cohort, and years since
entry
020
4060
8010
00
2040
6080
100
0 5 10 15 20 0 5 10 15 20 0 5 10 15 20
A. Refugee B. Family C. Education
D. Work (LDC) E. Old EU/OECD F. New EU
1990-94 1995-99 2000-04 2005-09 2010-14
In N
orw
ay (
%)
Years since entry
8
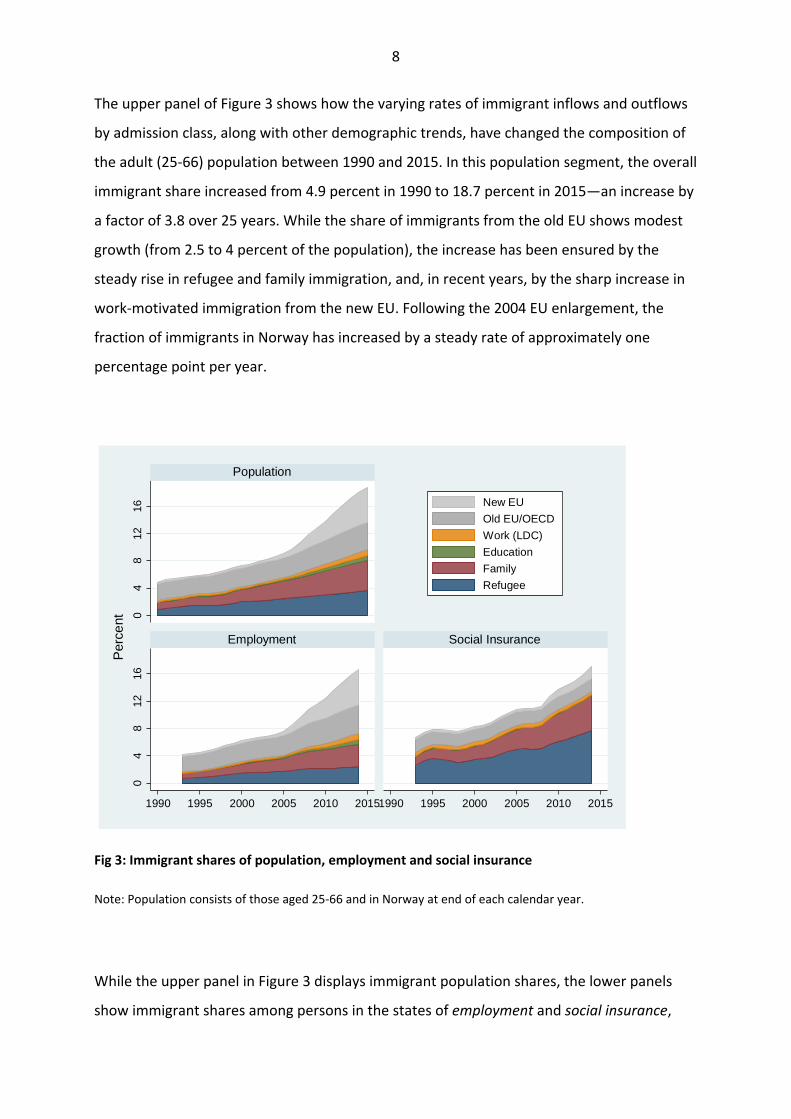
The upper panel of Figure 3 shows how the varying rates of immigrant inflows and outflows
by admission class, along with other demographic trends, have changed the composition of
the adult (25‐66) population between 1990 and 2015. In this population segment, the overall
immigrant share increased from 4.9 percent in 1990 to 18.7 percent in 2015—an increase by
a factor of 3.8 over 25 years. While the share of immigrants from the old EU shows modest
growth (from 2.5 to 4 percent of the population), the increase has been ensured by the
steady rise in refugee and family immigration, and, in recent years, by the sharp increase in
work‐motivated immigration from the new EU. Following the 2004 EU enlargement, the
fraction of immigrants in Norway has increased by a steady rate of approximately one
percentage point per year.
Fig 3: Immigrant shares of population, employment and social insurance
Note: Population consists of those aged 25‐66 and in Norway at end of each calendar year.
While the upper panel in Figure 3 displays immigrant population shares, the lower panels
show immigrant shares among persons in the states of employment and social insurance,
04
812
160
48
1216
1990 1995 2000 2005 2010 20151990 1995 2000 2005 2010 2015
Population
Employment Social Insurance
New EU
Old EU/OECD
Work (LDC)
Education
Family
Refugee
Per
cent
9
respectively. Both here and in the subsequent analyses we define the state of “employment”
in a particular year as having employment or self‐employment earnings as the most
important (i.e., the largest) source of income in that year. Conversely, we define the state of
“social insurance” as having social insurance and/or social assistance (welfare) as the most
important source of income. Based on these definitions, there is a residual category,
characterized by zero earnings and zero transfers, presumably supported by their families.
In total, the immigrant share of employment has developed roughly on par with its
population share, i.e., from 2.9 percent in 1993 to 15.8 percent in 2014. (Although we can
study population shares through 2015, data availably restricts the analyses of labor market
and social insurance outcomes to the period between 1993 and 2014.) The trends in
population and employment shares varies considerably across admission classes, with
employment shares of refugees and family immigrants lagging their growth in population
shares. In a welfare state, differential employment patterns are typically mirrored by the
opposite structure of social insurance. During our data window, immigrant social insurance
shares increased at a slower pace than their employment shares. However, here the shares
of the various immigrant groups have developed very differently, with strongly increasing
shares of refugees and family immigrants and roughly constant shares of labor immigrants.
In 2014, refugees and family immigrants accounted for 12.8 percent of social insurance
claims, compared to 5.7 percent of employment (and 7.7 percent of the adult population). In
contrast, the two EU groups made up 9.3 percent of employment (and 8.8 percent of the
adult population) but only 3.6 percent of social insurance claimants. Although these
patterns do illuminate the immediate (short‐term) fiscal impacts of immigration at each
particular point in time, they are heavily influenced by each year’s immigrant composition –
in terms of age, years since migration, and admission classes – and therefore provide little
information about long‐term consequences and impacts of fiscal sustainability. To assess the
latter, we need to focus on longer‐term integration in the Norwegian labor market.

10
3. Data
In order to study employment and social insurance claim patterns over the entire time
period spent in Norway, we follow adult immigrants entering Norway from 1990 onwards for
as long as the data permit, i.e., until 2014 or until exit from Norway. The analysis will be
made separately for each admission class. Owing to their relatively modest number and low
stay rates we leave out the admission classes made up by students and labor migrants from
less developed countries (see, however, Bratsberg et al., 2010), and focus on labor migrants
from new and old EU countries and on refugees and family immigrants from low‐income
countries. For family immigrants, we further distinguish between those married to a
Norwegian born at the time of immigration and other family immigrants, presumably
reunited with an immigrant reference person.
Table 1 shows some descriptive statistics for the resultant analysis samples, separately for
men and women. While columns (1)‐(5) report statistics for the five immigrant admission
classes under study, column (6) lists the corresponding statistics for a native born
comparison group consisting of a ten percent random sample of the working age native
population. For immigrant men, the sample average share in employment (i.e., whose main
source of income is work) ranges from 58 percent for refugees to 89 percent for EU
immigrants, with family migrants somewhere between (around 80 percent). The average
shares with social insurance as the main source of income ranges from only four percent for
EU immigrants to as much as 38 percent for refugees. The corresponding shares for native
men are 87 percent in employment and 12 percent with social insurance as their main
income source. For women, the average shares in employment vary from 46 percent for
refugees to 85 percent for new EU immigrants, whereas the average shares in social
insurance vary from five percent for new EU immigrants to 42 percent for refugees. The
corresponding rates for native women are 80 percent in employment and 17 percent with
social insurance as their main source of income.

11
Table 1: Descriptive statistics, regression samples
Refugee Family to immigrant
Family to Norwe‐gian New EU Old EU Native
(1) (2) (3) (4) (5) (6)
A. Men Educational attainment Less than secondary 0.430 0.345 0.351 0.215 0.208 0.393 Secondary 0.248 0.169 0.202 0.579 0.302 0.345 Tertiary 0.229 0.190 0.212 0.169 0.422 0.257Attainment acquired in Norway Less than secondary 0.192 0.159 0.179 0.014 0.026 Secondary 0.052 0.033 0.047 0.006 0.020 Tertiary 0.026 0.021 0.030 0.006 0.037 Educ in Norway below highest 0.131 0.028 0.035 0.005 0.009 Education missing 0.093 0.296 0.236 0.038 0.068 0.004Educ imputed from occupation 0 0 0 0.371 0.188 0Local unemployment rate 0.024 0.025 0.024 0.021 0.023 0.025Age at entry 30.7 29.2 28.3 32.8 31.7 Years since entry 8.58 7.52 7.98 3.62 6.55 Age 39.3 36.8 36.3 36.4 38.3 43.8Employment 0.581 0.768 0.799 0.883 0.890 0.871Social insurance 0.379 0.164 0.149 0.050 0.046 0.120Observations 366,136 109,390 75,442 322,823 402,884 2,093,261B. Women Educational attainment Less than secondary 0.487 0.404 0.377 0.238 0.157 0.475 Secondary 0.227 0.143 0.154 0.298 0.223 0.227 Tertiary 0.181 0.174 0.288 0.417 0.558 0.295Attainment acquired in Norway Less than secondary 0.174 0.181 0.134 0.062 0.031 Secondary 0.053 0.033 0.044 0.022 0.021 Tertiary 0.025 0.019 0.027 0.042 0.068 Educ in Norway below highest 0.101 0.040 0.042 0.028 0.015 Education missing 0.106 0.278 0.181 0.048 0.061 0.003Educ imputed from occupation 0 0 0 0.188 0.115 0Local unemployment rate 0.024 0.025 0.022 0.022 0.023 0.025Age at entry 30.8 28.5 30.8 30.2 29.9 Years since entry 8.66 7.95 7.06 5.12 7.09 Age 39.4 36.4 37.9 35.3 37.0 44.1Employment 0.463 0.508 0.733 0.803 0.846 0.803Social insurance 0.416 0.213 0.102 0.064 0.050 0.168Observations 231,710 301,878 214,786 191,564 291,723 1,963,026
Note: Samples are restricted to those 25‐62 years of age, not in education, and in the country at the end of the
observation year. Immigrant samples are further restricted to those 18‐47 years of age at entry and who
entered between 1990 and 2013. Observation period is 1993‐2014. Native samples are 10 percent random
population extracts.
Figures 4 and 5 give a more detailed picture of employment rates and social insurance
dependency by years since entry. Not surprisingly, we see that refugees have very low

12
employment rates – and correspondingly high rates of social insurance dependency – during
their first years upon admission. They then catch up rather quickly during a five‐year period,
after which employment rates appear to stabilize (for women) or decline (for men). EU
immigrants, on the other hand, have high employment rates to begin with, but for the new
EU immigrants the employment rate tends to decline a bit after some years. For family
migrants, the picture is quite different for men and women. Male family migrants have
relatively high employment rates early in their stay, but the rates then decline relatively fast.
Female family migrants, on the other hand, have very low employment rates to begin with,
but they increase rapidly over the first five years in the country. With the exception of
refugees, all the immigrant groups under study experience a quite sharp increase in their
reliance on social insurance transfers over time.
Fig 4: Share of immigrants whose main source of income is work, by gender, admission class, and
years since entry
Note: Samples consist of immigrants aged 18‐47 at entry and admitted between 1990 and 2013. Observation period is 1993 to 2014. Figure entry is the mean employment rate for those aged 25‐62 and in the country at the end of the calendar year.
020
4060
8010
0
0 5 10 15 20 0 5 10 15 20
A. Men B. Women
Refugee Fam imm Fam Nor New EU Old EU
Em
ploy
me
nt (
%)
Years since entry

13
The descriptive statistics in Table 1 reveal substantial variation across the five immigrant
admission classes in terms of age distribution, educational attainment, and years since
migration during the observation window. As we return to below, they also differ with
respect to origin country. There is also substantial variation in characteristics within each of
the five classes, and particularly for the refugee and family immigrant groups, these
differences correlate strongly with years since migration. This makes it difficult to interpret
the employment and social insurance profiles displayed in Figures 4 and 5 directly, as they
reflect both the impacts of sorting and causality.
Fig 5: Share of immigrants whose main source of income is social insurance transfers, by gender, admission class, and years since entry
Note: Samples consist of immigrants aged 18‐47 at entry and admitted between 1990 and 2013. Observation period is 1993 to 2014. Figure entry is the mean social insurance rate for those aged 25‐62 and in the country at the end of the calendar year.
For example, the fact that refugees from the Balkans dominated refugee arrivals during the
early 1990s implies that these immigrants are strongly overrepresented among those we can
020
4060
0 5 10 15 20 0 5 10 15 20
A. Men B. Women
Refugee Fam imm Fam Nor New EU Old EU
Soc
ial i
nsu
ran
ce (
%)
Years since entry
14
follow for as much as 20 years. And, as we show below, since they turned out to have more
successful labor market careers on average than other refugees, this will, if not controlled
for, give the impression that employment rates rise more (or decline less) with years since
migration than what we would find conditioned on country of origin. Hence, in order to
establish employment social insurance dependency profiles that capture the structural
impacts of years since migration, we need to control for relevant background characteristics.
This will also facilitate an analysis of which characteristics – e.g., in terms of educational
attainment, age at immigration, or country of origin – that are conducive for success in the
Norwegian labor market.
4. Empiricalmodel
To study the immigrant employment assimilation processes in more detail, we set up an
empirical model built on the framework of Borjas (1995; 1999). Suppose the outcome
(employment or social insurance as main source of income) of a person j belonging to
immigrant group I observed in calendar year t can be represented by the following equation:
I I I I I I I Ijt jt a ajt m mjt c cj e ej t jt jt
a m c e t
y X A YSM C E , (1)
while the outcome for a native is represented by
N N N N Njt jt a ajt t jt jt
a t
y X A , (2)
where yjt is the outcome of person j in year t; X is a vector of socio‐economic characteristics
(such as educational attainment); A is a vector of indicator variables for the age of the
individual at the time of observation; YSM is a vector of indicator variables for the number of
years the immigrant has resided in the host country; C is a vector of indicators for the
country of origin; E is a vector of indicators for the age at the time of entry; and is a
vector of indicators for the calendar year. Now, looking at Equation (1) in isolation, it is clear
that because the model includes indicator variables for age at entry, age in the year of
observation, the number of years since migration, and the year of observation, we have a
serious multicollinearity problem. In order to identify the model, we therefore need to
impose restrictions across Equations (1) and (2); i.e., assume that some factors affect

15
immigrants and natives the same way (Borjas, 1995; 1999). In our case, we need two such
restrictions in order to identify the model, and we are going to assume that the pure cyclical
variation captured by the calendar year dummies as well as the age effects are the same for
immigrants and natives. Thus, we assume that I Na a a and that I N
t t t .
The equal year (period) effect assumption is, however, unlikely to hold as prior evidence
from Norway (Barth et al., 2004), Germany and the UK (Dustmann et al., 2010), and the US
(Bratsberg et al., 2006) shows that immigrant wages (and employment) are more strongly
pro‐cyclical than those of natives. To relax this restriction, we follow Barth et al. (2004) and
include the local unemployment rate, interacted with immigrant admission class, as extra
covariates (in X) in order to allow for differential responses to cyclical fluctuations. Note,
however, that this does not imply that we rely exclusively on cross‐sectional variation in local
unemployment to identify differences between immigrants and natives in cyclical sensitivity.
As the calendar year dummy variables take the same coefficient for immigrants and natives,
systematic differences in the responses to nation‐wide unemployment fluctuations will be
absorbed by the differential responses to local unemployment.
From the set of jointly estimated coefficients from equations (1) and (2) we predict the
outcome differential between immigrants and natives, for different values of years since
migration (YSM). The differential for admission class I and evaluated at YSM=m reads
ˆ ˆ ˆˆ ˆ ( )I II I N I I N Icm mYSM m
c
y y X C
, (3)
where X is the mean of explanatory variables in the immigrant sample and age at migration
is set to its reference value of 25‐29.
5. Results
5.1 Immigrant‐nativeemploymentandsocialinsurancedifferentials
Figures 6 and 7 present the estimation results regarding the developments of the immigrant‐
native employment and social insurance differentials by years since migration, along with
their 95 percent confidence intervals. The differentials given by Equation (3) are designed to
capture the pure impact of years since migration, holding everything else constant.
16
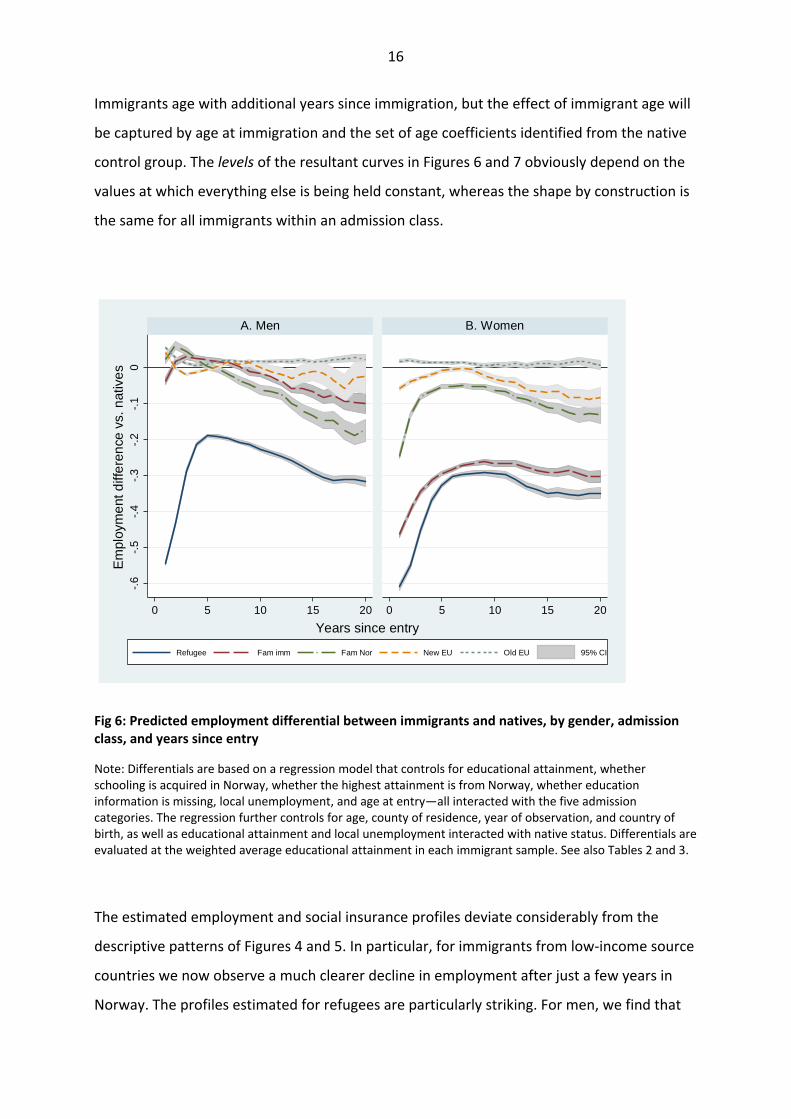
Immigrants age with additional years since immigration, but the effect of immigrant age will
be captured by age at immigration and the set of age coefficients identified from the native
control group. The levels of the resultant curves in Figures 6 and 7 obviously depend on the
values at which everything else is being held constant, whereas the shape by construction is
the same for all immigrants within an admission class.
Fig 6: Predicted employment differential between immigrants and natives, by gender, admission class, and years since entry
Note: Differentials are based on a regression model that controls for educational attainment, whether schooling is acquired in Norway, whether the highest attainment is from Norway, whether education information is missing, local unemployment, and age at entry—all interacted with the five admission categories. The regression further controls for age, county of residence, year of observation, and country of birth, as well as educational attainment and local unemployment interacted with native status. Differentials are evaluated at the weighted average educational attainment in each immigrant sample. See also Tables 2 and 3.
The estimated employment and social insurance profiles deviate considerably from the
descriptive patterns of Figures 4 and 5. In particular, for immigrants from low‐income source
countries we now observe a much clearer decline in employment after just a few years in
Norway. The profiles estimated for refugees are particularly striking. For men, we find that
-.6
-.5
-.4
-.3
-.2
-.1
0
0 5 10 15 20 0 5 10 15 20
A. Men B. Women
Refugee Fam imm Fam Nor New EU Old EU 95% CI
Em
ploy
me
nt d
iffe
ren
ce v
s. n
ativ
es
Years since entry

17
the native‐immigrant employment gap reaches its minimum value at 20 percentage points
after five to six years of residence. The gap then starts to increase quite sharply again, and
reaches 30 percentage points after 15 years. This development is mirrored by a
corresponding increase in social insurance dependency. For female refugees, the
employment differential reaches its minimum of 30 percentage points after 5‐9 years of
residence. The subsequent decline is less dramatic than what we observe for men, but the
differential stands at 35 percentage points 15 years after admission. 2
Fig 7: Predicted social insurance differential between immigrants and natives, by gender, admission class, and years since entry
Note: Differentials are based on a regression model that controls for educational attainment, whether schooling is acquired in Norway, whether the highest attainment is from Norway, whether education information is missing, local unemployment, and age at entry—all interacted with the five admission categories. The regression further controls for age, county of residence, year of observation, and country of birth, as well as educational attainment and local unemployment interacted with native status. Differentials are evaluated at the weighted average educational attainment in each immigrant sample. See also Tables 4 and 5.
2Bratsberg et al. (2016c) find that, conditional on employment, annual earnings of refugees do not exhibit similar declines relative to those of natives.
-.1
0.1
.2.3
.4.5
0 5 10 15 20 0 5 10 15 20
A. Men B. Women
Refugee Fam imm Fam Nor New EU Old EU 95% CI
Soc
ial i
nsu
ran
ce d
iffer
ence
vs.
na
tives
Years since entry

18
Turning to the two family immigrant groups, our estimates reveal very different profiles for
men and women. For male family immigrants, we generally observe an immigrant
employment advantage to start with. After around five years, however, a negative
employment differential builds up, and it increases faster for family immigrants with a
Norwegian‐born reference person than for those with an immigrant reference person. After
15 years of residence, the negative employment differentials are around 13 percentage
points for the former, and 8 percentage points for the latter group. Again, these
developments are mirrored by a corresponding rise in social insurance differentials. For
female family immigrants, on the other hand, we estimate the employment differential to be
very large during the first years in Norway. It then follows a pattern similar to that of female
refugees, with rapid labor market integration during the first 5‐10 years, and a moderate
disintegration afterwards. As for males, there is a rather monotonous increase in social
insurance differentials with years since entry (see Figure 7).
For immigrants from the old EU, the employment differential is slightly in favor of
immigrants regardless of years since migration, and the social insurance differentials remain
consistently negative. In other words, employment of old EU immigrants is almost
indistinguishable from that of natives, and they are less likely to claim social insurance
benefits. For immigrants from the new EU, a slight negative employment differential builds
over time. The use of social insurance is moderate for this group, although there are some
indications of a positive trend for women. It should be emphasized, however, that estimates
of the long‐term developments for immigrants from the new EU are based on a relatively
small group of immigrants that migrated prior to the 2004 EU enlargement; hence their
outcomes may not be representative for those who came after the enlargement. These
results should therefore be interpreted with some care.
5.2Heterogeneitywithinandbetweenorigincountries
Even when we compare immigrants of the same age and length of stay in Norway,
employment rates differ considerably across workers depending on educational attainment,
age at entry, country of origin, and labor market conditions. In Tables 2 through 5, we focus
on individual heterogeneity within admission class and origin country, controlling for age
and years since admission. In terms of Figure 6 and 7, in this section we study factors that

19
determine “the intercept” of the curves, or how the predicted immigrant‐native differential
varies across individuals according to their observed characteristics.
Table 2: Determinants of employment, men
Refugee Family to immigrant
Family to Norwegian New EU Old EU Native
(1) (2) (3) (4) (5) (6)
Educ attainment (ref=sec) Less than secondary ‐0.061*** ‐0.049*** ‐0.040*** ‐0.017*** ‐0.011*** ‐0.132*** (0.002) (0.004) (0.004) (0.001) (0.002) (0.000) Tertiary 0.040*** 0.020*** 0.015*** 0.039*** 0.047*** 0.039*** (0.002) (0.004) (0.004) (0.002) (0.001) (0.000)Attainment acq in Norway Less than secondary 0.056*** ‐0.023*** ‐0.037*** ‐0.097*** ‐0.109*** (0.002) (0.003) (0.004) (0.005) (0.003) Secondary 0.136*** 0.067*** 0.072*** 0.063*** 0.039*** (0.003) (0.006) (0.006) (0.008) (0.004) Tertiary 0.226*** 0.101*** 0.117*** 0.007 0.004* (0.004) (0.007) (0.007) (0.008) (0.003)
Norwegian schooling below 0.042*** ‐0.025*** ‐0.061*** ‐0.135*** ‐0.102*** highest attainment (0.002) (0.006) (0.007) (0.008) (0.005)
Local unemployment rate ‐5.673*** ‐3.311*** ‐4.022*** ‐1.839*** ‐0.971*** ‐1.164*** (0.070) (0.136) (0.157) (0.090) (0.065) (0.011)Age at entry (ref=25‐29) 18‐24 0.038*** ‐0.007** 0.006* ‐0.013*** ‐0.013*** (0.002) (0.003) (0.003) (0.002) (0.002) 30‐34 ‐0.034*** ‐0.048*** ‐0.015*** ‐0.005*** ‐0.009*** (0.002) (0.003) (0.003) (0.002) (0.001) 35‐39 ‐0.080*** ‐0.086*** ‐0.041*** ‐0.014*** ‐0.022*** (0.002) (0.003) (0.004) (0.002) (0.002) 40‐47 ‐0.160*** ‐0.149*** ‐0.086*** ‐0.010*** ‐0.041*** (0.002) (0.004) (0.006) (0.002) (0.002)
*/**/***Statistically significant at the 10/5/1 percent level. Note: Standard errors, clustered within individual, are reported in parentheses. Regression samples are restricted to those 25‐62 years of age, not in education, and in the country at the end of the observation year. Immigrant samples are further restricted to those 18‐47 years of age at entry. Native samples are 10 percent random population extracts; regression is weighted to account for the 10 percent extract. Regressions control for years since entry and education missing—interacted with admission class—and age, observation year, county of residence, and country of birth (for a total of 449 regressors).
Tables 2 and 3 reveal that employment rates vary considerably with educational attainment.
The two top rows display the estimated differentials according to attainment from abroad,
with completed upper secondary school (“high school”) as the reference category. Both
immigrants and natives with tertiary education are more likely to be employed. The most

20
severe employment penalty for not having completed secondary education appears for
natives. In general, within admission class employment differentials across educational
attainments are larger for women than for men.
Table 3: Determinants of employment, women
Refugee Family to immigrant
Family to Norwegian New EU Old EU Native
(1) (2) (3) (4) (5) (6)
Educ attainment (ref=sec) Less than secondary ‐0.092*** ‐0.083*** ‐0.019*** ‐0.001 ‐0.055*** ‐0.157*** (0.003) (0.003) (0.003) (0.003) (0.003) (0.000) Tertiary 0.094*** 0.032*** 0.045*** 0.044*** 0.042*** 0.063*** (0.003) (0.003) (0.002) (0.002) (0.002) (0.000)Attainment acq in Norway Less than secondary 0.154*** 0.144*** 0.048*** ‐0.026*** ‐0.051*** (0.002) (0.002) (0.003) (0.004) (0.004) Secondary 0.273*** 0.212*** 0.153*** 0.061*** 0.016*** (0.004) (0.004) (0.005) (0.006) (0.05) Tertiary 0.259*** 0.258*** 0.167*** 0.088*** 0.021*** (0.006) (0.005) (0.005) (0.005) (0.003)
Norwegian schooling below 0.094*** 0.093*** 0.039*** ‐0.022*** ‐0.039*** highest attainment (0.003) (0.004) (0.004) (0.005) (0.006)
Local unemployment rate ‐4.801*** ‐3.994*** ‐3.657*** ‐3.206** ‐1.454** ‐1.671*** (0.102) (0.092) (0.104) (0.123) (0.085) (0.014)Age at entry (ref=25‐29) 18‐24 ‐0.003 0.035*** 0.005* ‐0.003 ‐0.011*** (0.002) (0.002) (0.002) (0.002) (0.002) 30‐34 ‐0.025*** ‐0.028*** ‐0.013*** ‐0.031*** ‐0.039*** (0.002) (0.002) (0.002) (0.002) (0.002) 35‐39 ‐0.053*** ‐0.049*** ‐0.028*** ‐0.020*** ‐0.064*** (0.003) (0.002) (0.003) (0.003) (0.002) 40‐47 ‐0.119*** ‐0.066*** ‐0.014** ‐0.007** ‐0.067*** (0.003) (0.003) (0.003) (0.003) (0.002)
*/**/***Statistically significant at the 10/5/1 percent level. Note: Standard errors, clustered within individual, are reported in parentheses. See also note to Table 2.
The empirical model allows for additional differentials among immigrants when schooling is
acquired in Norway. Rows three to five show the additional (interaction) coefficient when
the highest attainment is from the Norwegian educational system. In Table 2, male refugees
with upper secondary school from Norway have an average employment rate that is 13.6
percentage points higher than those with similar attainment from abroad. This differential is
very large (27.3 percentage points) for women, see Table 3. For both genders, Norwegian

21
education is associated with significantly higher employment rates across all admission
classes, unless the attainment is basic (below completed upper secondary school). While
male refugees and all female immigrants from LDC countries seem to gain from Norwegian
schooling even below secondary education, other immigrant groups with basic Norwegian
schooling have lower employment rates than their fellow nationals who did not acquire
education in Norway. A similar pattern appears for immigrants who have some education
from Norway, but at a level below the pre‐migration attainment.
This study cannot determine whether differentials across educational attainment reflect
causal effects of schooling or sorting on unobserved characteristics. For the admission
classes under study (recall that we exclude foreign students), acquisition of additional
schooling in Norway is likely to be driven by factors that generate both positive and negative
selection in terms of employment prospects. While school entry can be triggered by
negative employment shocks or labor market barriers, immigrants with high labor market
attachment will gain more in terms of improved job careers from additional human capital
investments.
The state of the labor market affects employment rates of all six groups studied. When the
municipal unemployment rate (in percent of the population) increases by one percentage
point, the employment rate of male natives drops by a similar magnitude (1.16 percentage
point). Except for western Europeans, immigrant employment rates are far more sensitive to
labor market conditions. The employment rate of male refugees falls by more than five
percentage points when the overall local unemployment rate increases by one. Similar
patterns appear for women, see Table 3. The greater business cycle sensitivity of refugee
employment may reflect a more precarious attachment to the labor market, with more
marginal and less secure jobs. Moreover, given that the last‐in‐first‐out principle largely
governs downsizing processes in Norway, immigrant employees (who tend to have shorter
than average tenure) are typically harder hit by adverse employer shocks and reorganization
processes.3
3 Last‐in‐first‐out is stated as a guiding downsizing principle in the “Basic Agreement” (Hovedavtalen) between the major employer and employee associations in Norway. According to the Working Environment Act (Arbeidsmiljøloven), the selection of layoffs during downsizing processes should be justifiable, with short tenure often referred to as a valid criterion.

22
Immigrants differ widely in age at the time of admission. Young immigrants will have a
longer time horizon for host country human capital investments and bring short foreign
experiences from both within and outside the labor market. We find significant
heterogeneity according to age at arrival for refugees and family immigrants from low‐
income countries; see Tables 2 and 3, columns (1)‐(3). Immigrants arriving after they turn
thirty seem to have much lower employment rates, conditional on age and years since entry.
The largest “penalty” appears for male refugees arriving in their forties. For immigrants from
(old and new) EU countries, there is less age at immigration heterogeneity in employment.
Table 4: Determinants of social insurance, men
Refugee Family to immigrant
Family to Norwegian New EU Old EU Native
(1) (2) (3) (4) (5) (6)
Educ attainment (ref=sec) Less than secondary 0.063*** 0.053*** 0.024*** 0.011*** 0.023*** 0.130*** (0.002) (0.003) (0.004) (0.001) (0.001) (0.000) Tertiary ‐0.042*** ‐0.028*** ‐0.026*** ‐0.010*** ‐0.025*** ‐0.041*** (0.002) (0.003) (0.004) (0.002) (0.001) (0.000)Attainment acq in Norway Less than secondary ‐0.051*** 0.017*** 0.048*** 0.110*** 0.114*** (0.002) (0.003) (0.004) (0.005) (0.003) Secondary ‐0.127*** ‐0.070*** ‐0.060*** ‐0.026*** ‐0.013*** (0.003) (0.006) (0.006) (0.007) (0.004) Tertiary ‐0.224*** ‐0.091*** ‐0.093*** ‐0.029*** ‐0.005* (0.004) (0.007) (0.007) (0.008) (0.003)
Norwegian schooling below ‐0.033*** 0.028*** 0.055*** 0.146*** 0.105*** highest attainment (0.002) (0.006) (0.006) (0.008) (0.005)
Local unemployment rate 4.488*** 2.302*** 3.040*** 1.011*** 0.742*** 1.162*** (0.067) (0.131) (0.152) (0.086) (0.062) (0.011)Age at entry (ref=25‐29) 18‐24 ‐0.044*** 0.003 ‐0.006* 0.001 ‐0.006*** (0.002) (0.004) (0.003) (0.002) (0.002) 30‐34 0.035*** 0.034*** 0.007** 0.002 0.011*** (0.001) (0.003) (0.003) (0.002) (0.001) 35‐39 0.083*** 0.063*** 0.020*** 0.006** 0.019*** (0.002) (0.003) (0.004) (0.002) (0.002) 40‐47 0.151*** 0.091*** 0.005 0.002 0.019*** (0.002) (0.003) (0.006) (0.002) (0.002)
*/**/***Statistically significant at the 10/5/1 percent level. Note: Standard errors, clustered within individual, are reported in parentheses. See also note to Table 2.

23
Individual characteristics of immigrants also influence the probability of receiving social
insurance. Among men, nearly all non‐employed receive social insurance and the
differentials in Table 4 are basically similar to those in Table 2, but with the opposite sign.
For female family immigrants, we uncover some cases where short schooling from Norway is
associated with higher rates of both employment and social insurance. Local labor market
conditions are less important for social insurance claims among women than among men.
Table 5: Determinants of social insurance, women
Refugee Family to immigrant
Family to Norwegian New EU Old EU Native
(1) (2) (3) (4) (5) (6)
Educ attainment (ref=sec) Less than secondary 0.082*** 0.037*** 0.008*** 0.015*** 0.043*** 0.146*** (0.002) (0.002) (0.003) (0.003) (0.002) (0.000) Tertiary ‐0.055*** ‐0.038*** ‐0.030*** ‐0.018*** ‐0.021*** ‐0.055*** (0.003) (0.003) (0.003) (0.002) (0.002) (0.000)Attainment acq in Norway Less than secondary ‐0.088*** ‐0.009*** 0.022*** 0.042*** 0.072*** (0.002) (0.002) (0.003) (0.004) (0.004) Secondary ‐0.213*** ‐0.108*** ‐0.076*** ‐0.010* 0.010** (0.004) (0.004) (0.004) (0.006) (0.005) Tertiary ‐0.224*** ‐0.128*** ‐0.091*** ‐0.057*** ‐0.005* (0.005) (0.005) (0.005) (0.005) (0.003)
Norwegian schooling below ‐0.050*** 0.008** 0.015*** 0.047*** 0.063*** highest attainment (0.003) (0.004) (0.004) (0.005) (0.006)
Local unemployment rate 0.111 0.768*** 1.825*** 1.158*** 1.103** 1.403*** (0.095) (0.087) (0.098) (0.115) (0.080) (0.013)Age at entry (ref=25‐29) 18‐24 ‐0.015*** ‐0.022*** 0.000 ‐0.001 ‐0.007*** (0.002) (0.002) (0.002) (0.002) (0.002) 30‐34 0.028*** 0.026*** 0.014*** 0.014*** 0.014*** (0.002) (0.002) (0.002) (0.002) (0.002) 35‐39 0.055*** 0.059*** 0.018*** 0.018*** 0.018*** (0.002) (0.002) (0.003) (0.002) (0.002) 40‐47 0.101*** 0.056*** 0.021** 0.021*** 0.014*** (0.002) (0.003) (0.003) (0.003) (0.002)
*/**/***Statistically significant at the 10/5/1 percent level. Note: Standard errors, clustered within individual, are reported in parentheses. See also note to Table 2.
Destination country outcomes tend to differ significantly across individuals from various
origin countries. These differentials may reflect a multitude of factors such as culture,
tradition, language distance, past political/military conflicts, and transferability of human

24
capital acquired in the home‐country labor market or educational system, in turn influenced
by school quality. Among refugees, the three largest origin countries in our samples are
Bosnia, Iraq, and Somalia. Table 6 shows large employment and social insurance differentials
across these source countries, with reported coefficients interpreted as average differences
across origin countries relative to the mean overall outcome of the group of refugees. All
coefficients are from the regression model and hold educational attainment, age, years since
entry, age at immigration, county of residence and local labor market conditions constant.
As the table shows, refugees from Bosnia do well in the Norwegian labor market, with
employment rates 11.1 (men) and 16.0 (women) percentage points above the gender‐
specific average for refugees. The employment difference between refugees from Bosnia
and Somalia is fully 22.2 percentage points for men and 37.7 points for women. Other male
differentials are smaller, typically plus/minus 5 to 8 percentage points, with men from
Afghanistan and Kosovo also having employment rates above the mean. Among female
refugees from the seven major source countries include in the table, only Bosnians have
employment rates significantly above the average among female refugees.
Table 6: Country of birth effects, main source countries in refugee samples
Men Women
Percent of sample
Employ‐ment
Social insurance
Percent of sample
Employ‐ment
Social insurance
(1) (2) (3) (4) (5) (6)
Afghanistan 0.051 0.078*** ‐0.055*** 0.033 ‐0.115*** 0.112*** (0.009) (0.009) (0.014) (0.014)Bosnia 0.147 0.111*** ‐0.099*** 0.225 0.160*** ‐0.165*** (0.008) (0.007) (0.009) (0.009)Eritrea 0.031 ‐0.052*** 0.053*** 0.044 ‐0.006 0.127*** (0.010) (0.010) (0.013) (0.012)Iran 0.081 ‐0.044*** 0.055*** 0.074 ‐0.048*** 0.043*** (0.010) (0.010) (0.012) (0.012)Iraq 0.206 ‐0.066*** 0.064*** 0.079 ‐0.133*** 0.066*** (0.008) (0.007) (0.012) (0.012)Kosovo 0.081 0.047*** ‐0.051*** 0.095 0.009 ‐0.080*** (0.009) (0.008) (0.011) (0.010)Somalia 0.122 ‐0.111*** 0.082*** 0.142 ‐0.217*** 0.232*** (0.008) (0.008) (0.010) (0.010)
*/**/***Statistically significant at the 10/5/1 percent level. Note: Standard errors, clustered within individual, are reported in parentheses. Regression coefficient gives the differential from the weighted average country of birth effect in the refugee sample. See also note to Table 2.
25
Social insurance reflects non‐employment and origin country differentials tend to have the
opposite sign, but similar magnitude as the employment coefficients; see Table 6. Among
women, there are some exceptions with less social insurance claims than expected from the
observed employment differential (e.g., Kosovo), while others (e.g., Eritrea) have higher
social insurance rates than suggested by employment alone.
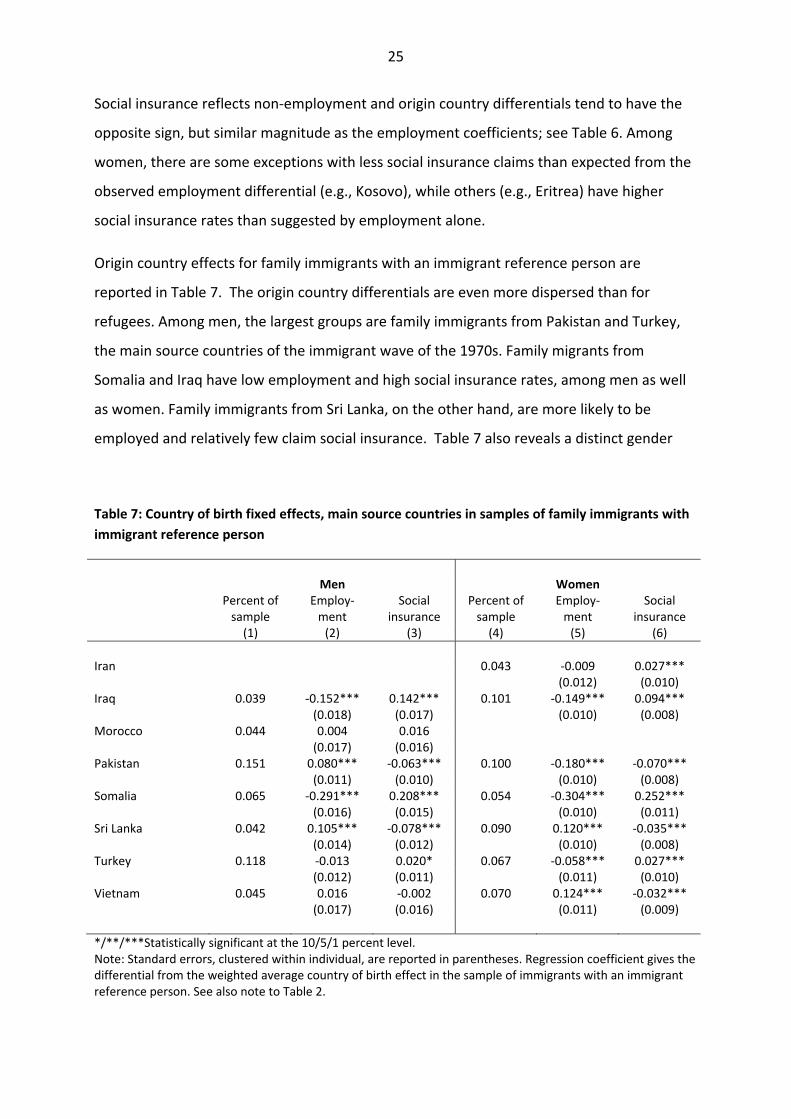
Origin country effects for family immigrants with an immigrant reference person are
reported in Table 7. The origin country differentials are even more dispersed than for
refugees. Among men, the largest groups are family immigrants from Pakistan and Turkey,
the main source countries of the immigrant wave of the 1970s. Family migrants from
Somalia and Iraq have low employment and high social insurance rates, among men as well
as women. Family immigrants from Sri Lanka, on the other hand, are more likely to be
employed and relatively few claim social insurance. Table 7 also reveals a distinct gender
Table 7: Country of birth fixed effects, main source countries in samples of family immigrants with
immigrant reference person
Men Women
Percent of sample
Employ‐ment
Social insurance
Percent of sample
Employ‐ment
Social insurance
(1) (2) (3) (4) (5) (6)
Iran 0.043 ‐0.009 0.027*** (0.012) (0.010)Iraq 0.039 ‐0.152*** 0.142*** 0.101 ‐0.149*** 0.094*** (0.018) (0.017) (0.010) (0.008)Morocco 0.044 0.004 0.016 (0.017) (0.016) Pakistan 0.151 0.080*** ‐0.063*** 0.100 ‐0.180*** ‐0.070*** (0.011) (0.010) (0.010) (0.008)Somalia 0.065 ‐0.291*** 0.208*** 0.054 ‐0.304*** 0.252*** (0.016) (0.015) (0.010) (0.011)Sri Lanka 0.042 0.105*** ‐0.078*** 0.090 0.120*** ‐0.035*** (0.014) (0.012) (0.010) (0.008)Turkey 0.118 ‐0.013 0.020* 0.067 ‐0.058*** 0.027*** (0.012) (0.011) (0.011) (0.010)Vietnam 0.045 0.016 ‐0.002 0.070 0.124*** ‐0.032*** (0.017) (0.016) (0.011) (0.009)
*/**/***Statistically significant at the 10/5/1 percent level. Note: Standard errors, clustered within individual, are reported in parentheses. Regression coefficient gives the differential from the weighted average country of birth effect in the sample of immigrants with an immigrant reference person. See also note to Table 2.
26
differential among Pakistanis. While men have high employment rates, few women work.
For female family immigrants from Pakistan, even social insurance uptake is significantly
below average suggesting widespread traditional female household responsibilities.
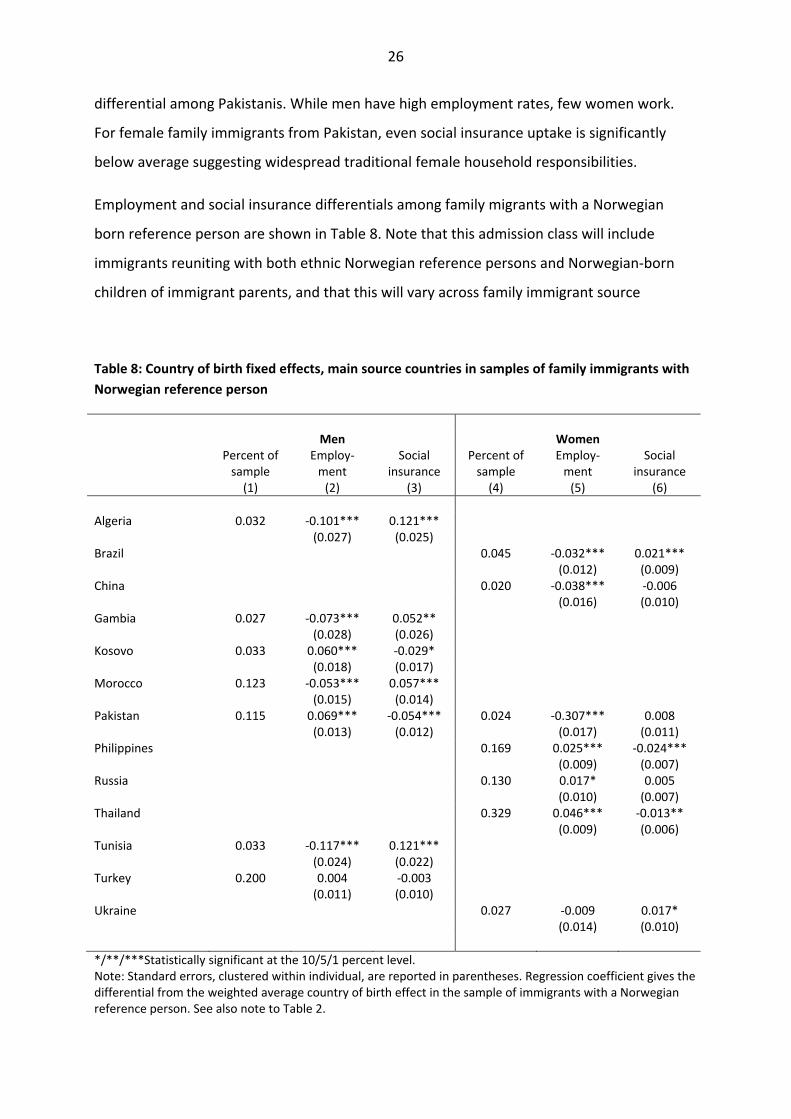
Employment and social insurance differentials among family migrants with a Norwegian
born reference person are shown in Table 8. Note that this admission class will include
immigrants reuniting with both ethnic Norwegian reference persons and Norwegian‐born
children of immigrant parents, and that this will vary across family immigrant source
Table 8: Country of birth fixed effects, main source countries in samples of family immigrants with
Norwegian reference person
Men Women
Percent of sample
Employ‐ment
Social insurance
Percent of sample
Employ‐ment
Social insurance
(1) (2) (3) (4) (5) (6)
Algeria 0.032 ‐0.101*** 0.121*** (0.027) (0.025) Brazil 0.045 ‐0.032*** 0.021*** (0.012) (0.009)China 0.020 ‐0.038*** ‐0.006 (0.016) (0.010)Gambia 0.027 ‐0.073*** 0.052** (0.028) (0.026) Kosovo 0.033 0.060*** ‐0.029* (0.018) (0.017) Morocco 0.123 ‐0.053*** 0.057*** (0.015) (0.014) Pakistan 0.115 0.069*** ‐0.054*** 0.024 ‐0.307*** 0.008 (0.013) (0.012) (0.017) (0.011)Philippines 0.169 0.025*** ‐0.024*** (0.009) (0.007)Russia 0.130 0.017* 0.005 (0.010) (0.007)Thailand 0.329 0.046*** ‐0.013** (0.009) (0.006)Tunisia 0.033 ‐0.117*** 0.121*** (0.024) (0.022) Turkey 0.200 0.004 ‐0.003 (0.011) (0.010) Ukraine 0.027 ‐0.009 0.017* (0.014) (0.010)
*/**/***Statistically significant at the 10/5/1 percent level. Note: Standard errors, clustered within individual, are reported in parentheses. Regression coefficient gives the differential from the weighted average country of birth effect in the sample of immigrants with a Norwegian reference person. See also note to Table 2.
27
countries. In this admission group, men from Pakistan and Kosovo have the highest
employment rates, while North African men are less likely to be employment and more
frequently receive social insurance. The origin country mix of female family migrants with a
Norwegian‐born reference person is quite different from that of men, dominated by
immigrants from Thailand and the Philippines who have above average employment rates
when compared to other female family immigrants. Yet, even after adding the estimated
five‐percentage points advantage, the employment rate after 10‐15 years is significantly
below that of native women (see Figure 6). Again, Pakistani women have very low
employment rates, although, unlike for other groups, low employment is not mirrored by
high rates social insurance dependency. In general, the heterogeneity with respect to origin
country is relatively modest among family immigrants with a Norwegian‐born reference
person.
5.3Ontherolesofeducationandselectiveoutmigration
Perhaps the most striking finding of the empirical analysis is that the employment gap
between natives and refugees/family immigrants widens after some years of residence,
mirrored by a comparable rise in immigrant reliance on social insurance. The analysis also
shows that acquisition of education in Norway is associated with substantial employment
gains. The years of residence (YSM) profiles in Figures 6 and 7 are drawn, however, holding
educational attainment constant. For an immigrant who acquires schooling after admission,
there will be a predicted boost in employment from that year onwards, not captured in the
profile. For example, among refugees and family immigrants with ten years of residence,
around one in three have acquired their highest educational attainment in Norway. Over the
next eight years, an additional ten percentage points upgrade their education. (Detailed
statistics are available upon request.) If host‐country schooling is an outcome of the
integration process, such post‐admission educational attainment may be a “bad control” in
the analysis. In particular, a concern is that the finding of widening employment gaps might
be the result of such model specification issues.
To address this concern, in Table 9 we report results from a number of sensitivity checks,
focusing on refugees and family immigrants and the span of residence years where we
observe widening employment gaps for both males and females (i.e., between 9 and 18

28
years after admission). 4 First, row A1 lists the predicted change in the immigrant‐native
employment differential over the time interval based on the model underlying Figure 6,
showing, for example, that the employment gap between male refugees and natives
Table 9: Estimates of change in immigrant‐native employment and social insurance differentials between 9 and 18 years since admission, using pre‐admission educational attainment and low‐education native reference groups
Men Women
Refugee
Family to immigrant
Family to Norwegian Refugee
Family to immigrant
Family to Norwegian
(1) (2) (3) (4) (5) (6)
A. Employment 1. Baseline (Fig 6) ‐0.092*** ‐0.091*** ‐0.128*** ‐0.055*** ‐0.035*** ‐0.080*** (0.004) (0.008) (0.011) (0.006) (0.006) (0.009) 2. Fix educ pre‐ ‐0.074*** ‐0.086*** ‐0.123*** ‐0.033*** ‐0.005 ‐0.056*** admission (0.004) (0.009) (0.011) (0.006) (0.006) (0.009) 3. Drop educ from ‐0.070*** ‐0.079*** ‐0.115*** ‐0.024*** 0.008 ‐0.039*** model (0.005) (0.010) (0.011) (0.006) (0.006) (0.009) 4. Low educ ref ‐0.063*** ‐0.089*** ‐0.126*** ‐0.036*** ‐0.027*** ‐0.070*** (0.006) (0.012) (0.013) (0.007) (0.007) (0.010) B. Social insurance 1. Baseline (Fig 7) 0.071*** 0.080*** 0.096*** 0.077*** 0.062*** 0.070*** (0.004) (0.009) (0.010) (0.006) (0.006) (0.008) 2. Fix educ pre‐ 0.056*** 0.082*** 0.097*** 0.062*** 0.059*** 0.067*** admission (0.004) (0.009) (0.010) (0.006) (0.006) (0.008) 3. Drop educ from 0.050*** 0.077*** 0.089*** 0.053*** 0.045*** 0.049*** model (0.004) (0.009) (0.011) (0.006) (0.006) (0.008) 4. Low educ ref 0.043*** 0.088*** 0.100*** 0.060*** 0.074*** 0.076*** (0.005) (0.011) (0.013) (0.007) (0.007) (0.010)
*/**/***Statistically significant at the 10/5/1 percent level. Note: Standard errors are reported in parentheses. Regression coefficients give the change in immigrant‐native differential between 9 and 18 years since entry. Specification 1 is identical to that underlying Figures 6 and 7; specification 2 restricts attainment at pre‐admission levels for immigrants and age 30 for natives; specifications 3 and 4 drop all educational attainment terms from the regression model; and specification 4 further restricts the native reference group to those without completed upper secondary education at age 30.
4In the appendix, we show that the conclusion of this robustness check also holds if we compare changes in employment differentials for other years since entry. Results for family immigrants and social insurance uptake are available upon request.

29
increases by 9.2 percentage points between 9 and 18 years since entry. Next, row A2 shows
the predicted change from an alternative model specification that ignores any post‐
admission educational attainment. Compared to the predictions in Figure 6, the widening of
the employment gap is slightly lower, and more so for women, but the overall patterns are
very similar. Even when we drop any information on educational attainment from the
empirical model, results show a widening employment gap, at least for men (see row A3).
Recall that this exercise focuses on the change in the gap over a nine‐year period, and not
the predicted size of the gap, which grows larger when the specification ignores differences
in educational attainment between immigrants and natives. Finally, in row A4, we report the
estimated change in the employment gap when the native reference group consists of those
without completed upper secondary education. Again, while the estimated change in the
employment gap is attenuated (by approximately one third) for refugees, the predictions are
very similar to those in Figure 6 for other groups. Finally, in Panel B we repeat the same
checks for the social insurance outcome. As the panel shows, the qualitative finding of more
rapid increase in social insurance uptake among refugees and family immigrants, relative to
natives, is not sensitive to specification or model inclusion of educational attainment, nor to
the use of low‐education native control groups.
A general concern in studies of immigrant assimilation is that employment profiles over
years since entry, like those in Figures 6 and 7, may be impacted by selective outmigration.
In our context, one might worry that the widening employment gap is an artifact of
positively selected outmigration, whereby immigrants with better employment prospects
are more likely to leave the country over time. Again, focusing on refugees and family
immigrants, Table 10 reports various checks that all reject the notion that the estimated
decline in employment is caused by selective outmigration.
First, panel A shows that a fairly small fraction (about six percent for most groups) leaves the
country between 9 and 18 years after entry, limiting the scope for bias from selective
outmigration. Second, when we examine the employment careers of outmigrants and
stayers during their first nine years in the country, we find that the probability of staying for
another nine years correlates positively with early employment success (see panel A, row
labelled “Coeff of average employment years 1‐9”). The implication is that any selection is
the exact opposite of what could have generated a declining employment rate in the
30
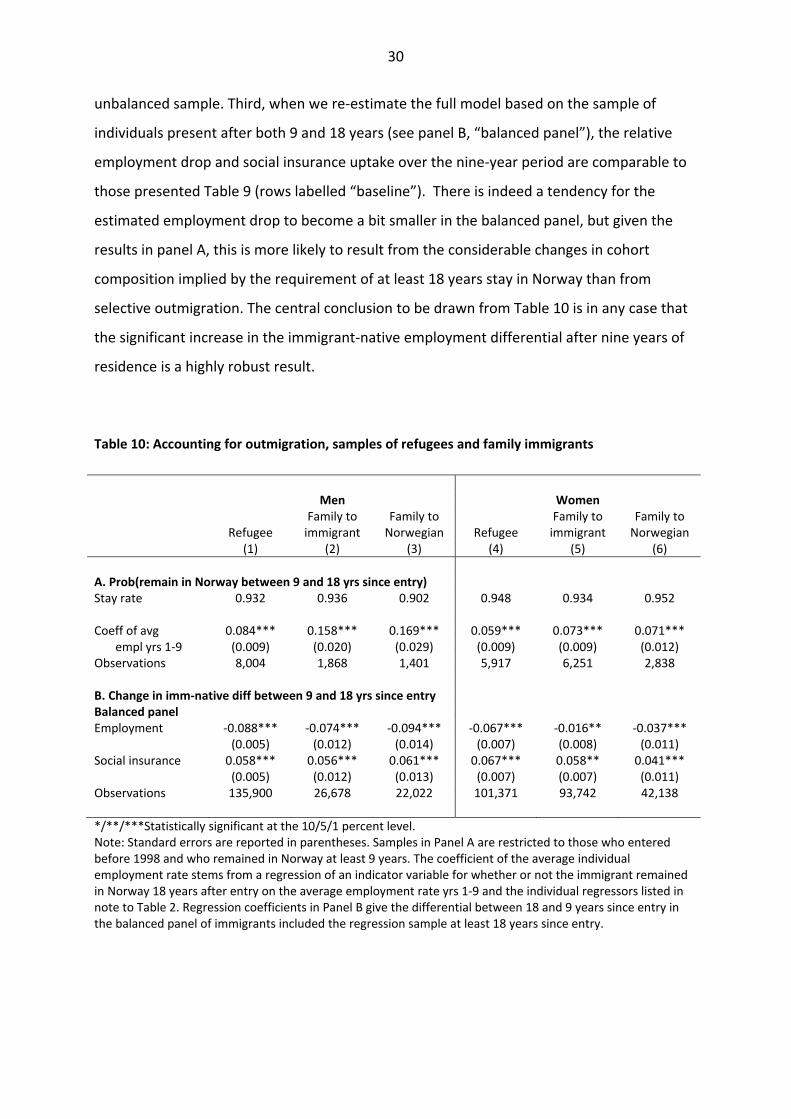
unbalanced sample. Third, when we re‐estimate the full model based on the sample of
individuals present after both 9 and 18 years (see panel B, “balanced panel”), the relative
employment drop and social insurance uptake over the nine‐year period are comparable to
those presented Table 9 (rows labelled “baseline”). There is indeed a tendency for the
estimated employment drop to become a bit smaller in the balanced panel, but given the
results in panel A, this is more likely to result from the considerable changes in cohort
composition implied by the requirement of at least 18 years stay in Norway than from
selective outmigration. The central conclusion to be drawn from Table 10 is in any case that
the significant increase in the immigrant‐native employment differential after nine years of
residence is a highly robust result.
Table 10: Accounting for outmigration, samples of refugees and family immigrants
Men Women
Refugee
Family to immigrant
Family to Norwegian Refugee
Family to immigrant
Family to Norwegian
(1) (2) (3) (4) (5) (6)
A. Prob(remain in Norway between 9 and 18 yrs since entry) Stay rate 0.932 0.936 0.902 0.948 0.934 0.952 Coeff of avg 0.084*** 0.158*** 0.169*** 0.059*** 0.073*** 0.071*** empl yrs 1‐9 (0.009) (0.020) (0.029) (0.009) (0.009) (0.012)Observations 8,004 1,868 1,401 5,917 6,251 2,838 B. Change in imm‐native diff between 9 and 18 yrs since entry Balanced panel Employment ‐0.088*** ‐0.074*** ‐0.094*** ‐0.067*** ‐0.016** ‐0.037*** (0.005) (0.012) (0.014) (0.007) (0.008) (0.011)Social insurance 0.058*** 0.056*** 0.061*** 0.067*** 0.058** 0.041*** (0.005) (0.012) (0.013) (0.007) (0.007) (0.011)Observations 135,900 26,678 22,022 101,371 93,742 42,138
*/**/***Statistically significant at the 10/5/1 percent level. Note: Standard errors are reported in parentheses. Samples in Panel A are restricted to those who entered before 1998 and who remained in Norway at least 9 years. The coefficient of the average individual employment rate stems from a regression of an indicator variable for whether or not the immigrant remained in Norway 18 years after entry on the average employment rate yrs 1‐9 and the individual regressors listed in note to Table 2. Regression coefficients in Panel B give the differential between 18 and 9 years since entry in the balanced panel of immigrants included the regression sample at least 18 years since entry.

31
6. Discussionandconcludingremarks
The main message coming out of our longitudinal analyses is that the labor market
integration of immigrants from low‐income countries tends to lose steam after just a few
years in Norway, and that the integration process then goes into reverse. After five to ten
years of residence, virtually all immigrant groups from low‐income countries – regardless of
gender and admission class – experience declining employment rates and increasing social
insurance dependency rates relative to natives with shared characteristics. At first sight, this
stands in sharp contrast to recent European cross‐sectional evidence suggesting that the
immigrant‐native employment differentials are reduced with years since migration
(Dustmann et al., 2016; Dumont et al., 2016). However, given the large heterogeneity in
integration patterns and employment levels across different immigrant groups, particularly
related to origin country, gender, and admission class, these apparently contradictory results
are not necessarily incompatible. In cross‐sectional data, the empirical association between
labor market success and years since migration will not only capture the impacts of time
spent in the host country, but also any differences in the composition of arrival cohorts. For
example, if – for some reason – cohorts that arrived 10‐20 years ago are more successful
than more recent cohorts, this will show up in a cross‐sectional analysis as a sign of
improved labor market integration over time. Hence, we will argue that it is difficult to
assign a particular causal interpretation to findings based on cross‐sectional data, and that in
order to identify the causal impacts of years since migration, it is necessary with longitudinal
data that follow the same immigrants over time. This general point does of course not rule
out that there are important differences in the labor market integration processes between
Norway and other European countries, and that the disintegration tendencies we have
identified after a few years of residence are specific to Norway.
To the extent that immigrants from low‐income countries really are subjected to a labor
market disintegration process after just a few years in the host country, the big question is
why this happens? While our study cannot provide fully satisfactory answers to this
question, our findings do point us in some specific directions. First, it is clear that business
cycles play a very important role, as the impact of local labor market conditions on individual
employment propensity is an order of magnitude larger for immigrants than for natives. This
is not only a reflection of the fact that newcomers in the labor market in general are more
32
sensitive with respect to labor demand fluctuations. Recent empirical evidence shows that
already employed immigrants from low‐income countries are heavily overrepresented in
precarious firms (firms with a high probability of downsizing or closing down in the near
future), and that the subsequent consequences of job loss in terms of future non‐
employment are also much more severe for immigrants than for their native co‐workers
(Bratsberg et al., 2016a).
Second, we have found that human capital is a very strong predictor for labor market
success, and that additional education acquired in Norway can be of great value, particularly
for refugees and female family immigrants, even when it is below their highest educational
attainment from abroad.
Third, we have shown that declining employment rates are almost fully mirrored by
increasing reliance on social insurance transfers, particularly for male immigrants. Since the
major social program behind this pattern is that of disability insurance, this suggests that
poor and deteriorating health is an important driver behind labor market exit. Alternatively,
it may reflect that immigrants are overrepresented in jobs that are physically and/or
mentally demanding, such that a given health problem become a greater barrier for
immigrants than for natives. Existing empirical evidence from Norway has shown that there
is a considerable grey area between unemployment and disability, and that disability
insurance claims frequently are triggered by job loss (Rege et al., 2009; Bratsberg et al.,
2013). The high and rapidly increasing rates of social insurance dependency among
immigrants from low‐income countries can also to some extent be explained by the fact that
these groups on average have higher social insurance replacement ratios, and respond more
strongly to these incentives than other immigrants and natives (Bratsberg et al., 2016b). The
higher replacement ratios among LDC immigrants result from a combination of a progressive
social insurance system (with a relatively high floor and additional allowances for children)
and poor labor market opportunities (with low wages and presumably also relatively poor
working conditions). The larger behavioral responses result from a higher fraction of
immigrants being in a situation where there is a small overall utility difference between the
states of employment and non‐employment; see Bratsberg et al. (2016b) for a discussion.

33
There is of course no reason to believe that the employment and earnings potentials among
immigrants are exactly the same as those of natives. After all, most of the immigrants from
low‐income countries are admitted on humanitarian grounds, many have poor language
skills and low (marketable) education, and a considerable fraction has been through
traumatic events and arrive in the host country with serious health impediments. There also
exists empirical evidence indicating that there is a tendency for Norwegian employers to
discriminate against job applicants with foreign‐sounding names (Birkelund et al., 2014).
However, while these factors can explain why employment rates may never reach parity
with natives, they cannot readily explain why employment rates decline after just a few
years in the country. This latter finding indicates that potentially productive resources are
underused, and thus that there is scope for policy to improve on the outcomes.
Given the much higher employment levels found among immigrants with secondary or
tertiary education acquired in Norway, more intensive human capital investment is an
obvious policy candidate. Although rapid introduction to the labor market probably is of
great value for many immigrants, our study also illuminates that finding a first job is not
sufficient to ensure labor market participation over the long haul. These first jobs are
apparently often short‐lived, and in order to obtain a more solid foothold in the labor
market, more adaptable human capital may be necessary, including a minimum level of
education and command of the majority language. In fact, steps have already been taken in
this direction, e.g., through the establishment in 2004 of the introduction program targeted
at newly arrived humanitarian immigrants. The program is designed as a two‐year
education/work program, which from 2016 also facilitates full‐time secondary education.
As our study also indicates a major role for social insurance programs, a second policy
candidate is to reform these programs in order to improve work incentives. One possibility is
to make them less attractive by reducing the benefit levels. However, an undesirable side
effect of this strategy could be to increase inequality and raise poverty in immigrant families,
potentially with adverse consequences for the second generation. Alternatively, the social
insurance programs could be designed in a more job‐oriented fashion, e.g., by encouraging
combinations of graded disability insurance and adapted full‐time work; i.e., spending public
money on subsidizing employment rather than non‐employment.
34
References
Barth, E., Bratsberg, B., and Raaum, O. (2004), Identifying Earnings Assimilation of Immigrants under Changing
Macroeconomic Conditions, Scandinavian Journal of Economics, 106 (1), 1‐22.
Birkelund, G. E., Rogstad, J., Heggebø, K., Aspøy, T. M. og Bjelland, H. F. (2014), Diskriminering i arbeidslivet ‐
Resultater fra randomiserte felteksperiment i Oslo, Stavanger, Bergen og Trondheim. Sosiologisk
Tidsskrift, 22(4), 352‐382.
Borjas, G.J. (1982), The Earnings of Male Hispanic Immigrants in the United States, ILR Review 35(3), 343‐353.
Borjas, G.J. (1995), Assimilation and changes in cohort quality revisited: what happened to immigrant earnings
in the 1980s? Journal of Labor Economics, Vol. 13, No. 2, 201–245.
Borjas, G.J. (1999), The Economic Analysis of Immigration. In Handbook of Labour Economics, Vol. 3, edited by
Orley C. Ashenfelter and David Card, pp. 1697‐1760. Amsterdam: Elsevier.
Bratsberg, B., Barth, E., and Raaum, O. (2006), Local Unemployment and the Relative Wages of Immigrants:
Evidence from the Current Population Surveys. Review of Economics and Statistics, Vol. 88, No. 2, 243‐
263.
Bratsberg, B., Fevang, E., and Røed, K. (2013), Job Loss and Disability Insurance. Labour Economics 24, 137–150.
Bratsberg, B., Raaum, O., and Røed, K. (2010), When Minority Labor Migrants Meet the Welfare State, Journal
of Labor Economics, 28(3), 633‐676.
Bratsberg, B., Raaum, O., and Røed, K. (2014), Immigrants, Labour Market Performance, and Social Insurance,
Economic Journal, 124(580), F644‐F683.
Bratsberg, B., Raaum, O., and Røed, K. (2016a), Job Loss and Immigrant Labor Market Performance. IZA
Discussion Paper No. 9729 and CReAM Discussion Paper No 02/16
Bratsberg, B., Raaum, O., and Røed, K. (2016b), Immigrant Responses to Social Insurance Generosity. In
progress.
Bratsberg, B., Raaum, O., and Røed, K. (2016c), Labor market integration of refugees in Norway, in F. Fasani
(ed), Refugees and Economic Migrants: Facts, policies and challenges, VoxEU.org Book, CEPR Press: 37‐52.
Clemens, M.A. (2011), "Economics and Emigration: Trillion‐Dollar Bills on the Sidewalk?" Journal of Economic
Perspectives, Volume 25, Number 3, Summer 2011, pp. 83‐106(24).
Cortes, K.E. (2004), Are Refugees Different from Economic Immigrants? Some Empirical Evidence on the
Heterogeneity of Immigrant Groups in the United States, Review of Economics and Statistics 86(2), 465‐
480.

35
Damas de Matos, A., and Liebig, T. (2014), The qualifications of immigrants and their value in the labour
market: A comparison of Europe and the United States, in OECD/EU, Matching Economic Migration with
Labour Market Needs, OECD Publishing, Paris.
Dustmann, C., Glitz, A., and Vogel, T. (2010), Employment, Wages, and the Economic Cycle: Differences
between Immigrants and Natives. European Economic Review, 54(1), 1‐17.
Dustmann, C., Fasani, F., Frattini, T., Minale, L., and Schönberg, U. (2016), On the Economics and Politics of
Refugee Migration, CreAM, Discussion paper 16/2016, University College London.
Dumont, J‐C, Liebig, T., Peschner, J., Tanay, F., and Xenogiani, T. (2016), How are refugees faring on the labour
market in Europe? A first evaluation based on the 2014 EU LFS. Working Paper 1/2106, EC and OECD.
Husted, L., Nielsen, H. S., Rosholm, M., and Smith, N. (2001), Employment and Wage Assimilation of Male First‐
Generation Immigrants in Denmark, International Journal of Manpower 22(1/2), 39–68.
Kennan, J. (2013) Open borders, Review of Economic Dynamics, Vol. 16(2), L1–13.
Luik, M‐A., Emilsson, H., and Bevelander. P. (2016), Explaining the Male Native‐Immigrant Employment Gap in
Sweden: The role of Human Capital and Migrant Categories, IZA DP No. 9943.
Lundborg, P. (2013), Refugees' Employment Integration in Sweden: Cultural Distance and Labor Market
Performance, Review of International Economics 21(2), 219–232.
Rege, M., Telle, K., and Votruba, M. (2009), The Effect of Plant Downsizing on Disability Pension Utilization.
Journal of the European Economic Association 7(5), 754–785.
Sarvimäki, M. (2011), Assimilation to a Welfare State: Labor Market Performance and Use of Social Benefits by
Immigrants to Finland, Scandinavian Journal of Economics 113(3), 665–688.
Sarvimäki, M. (2017), Labor market integration of refugees in Finland, this volume.
Schultz‐Nielsen, M. L. (2017), Labour Market Integration of Refugees in Denmark, this volume.
Storesletten, K. (2000), Sustaining fiscal policy through immigration, Journal of Political Economy 108, 300–23.
Åslund, O., Forslund, A., and Liljeberg, L. (2017), Labour market entry of refugees–Swedish evidence, this
volume.
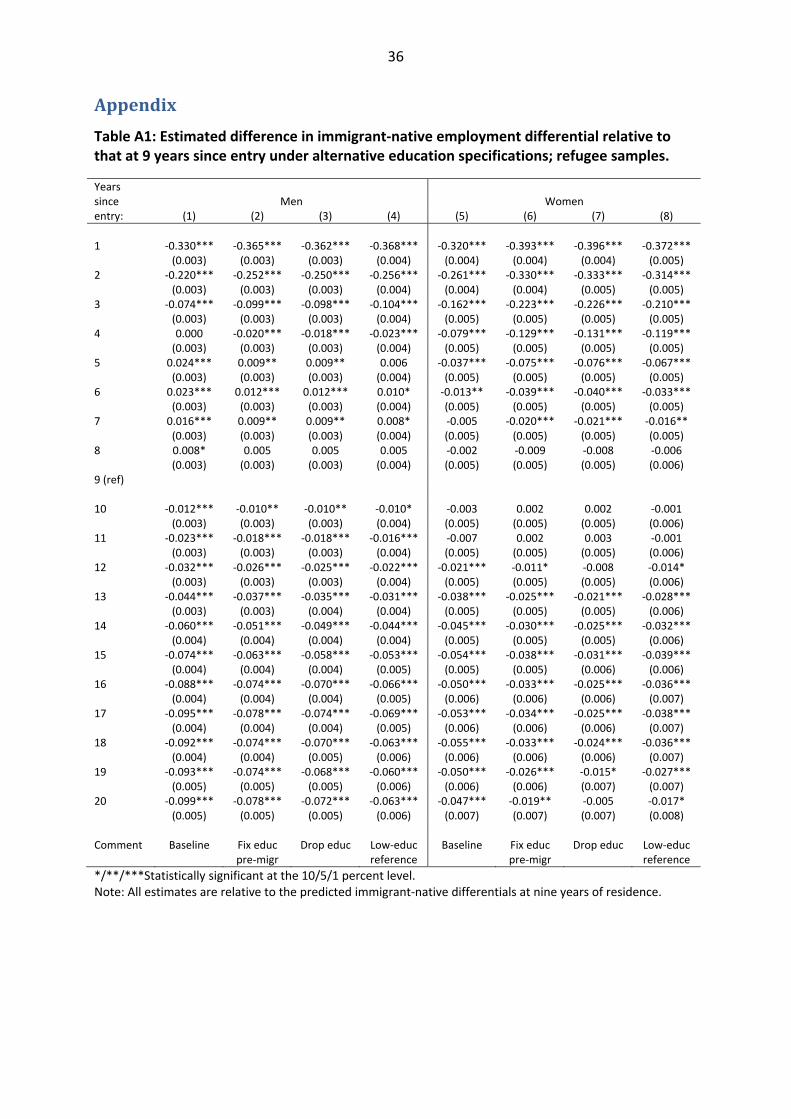
36
Appendix
Table A1: Estimated difference in immigrant‐native employment differential relative to that at 9 years since entry under alternative education specifications; refugee samples.
Years since Men Women entry: (1) (2) (3) (4) (5) (6) (7) (8)
1 ‐0.330*** ‐0.365*** ‐0.362*** ‐0.368*** ‐0.320*** ‐0.393*** ‐0.396*** ‐0.372*** (0.003) (0.003) (0.003) (0.004) (0.004) (0.004) (0.004) (0.005) 2 ‐0.220*** ‐0.252*** ‐0.250*** ‐0.256*** ‐0.261*** ‐0.330*** ‐0.333*** ‐0.314*** (0.003) (0.003) (0.003) (0.004) (0.004) (0.004) (0.005) (0.005) 3 ‐0.074*** ‐0.099*** ‐0.098*** ‐0.104*** ‐0.162*** ‐0.223*** ‐0.226*** ‐0.210*** (0.003) (0.003) (0.003) (0.004) (0.005) (0.005) (0.005) (0.005) 4 0.000 ‐0.020*** ‐0.018*** ‐0.023*** ‐0.079*** ‐0.129*** ‐0.131*** ‐0.119*** (0.003) (0.003) (0.003) (0.004) (0.005) (0.005) (0.005) (0.005) 5 0.024*** 0.009** 0.009** 0.006 ‐0.037*** ‐0.075*** ‐0.076*** ‐0.067*** (0.003) (0.003) (0.003) (0.004) (0.005) (0.005) (0.005) (0.005) 6 0.023*** 0.012*** 0.012*** 0.010* ‐0.013** ‐0.039*** ‐0.040*** ‐0.033*** (0.003) (0.003) (0.003) (0.004) (0.005) (0.005) (0.005) (0.005) 7 0.016*** 0.009** 0.009** 0.008* ‐0.005 ‐0.020*** ‐0.021*** ‐0.016** (0.003) (0.003) (0.003) (0.004) (0.005) (0.005) (0.005) (0.005) 8 0.008* 0.005 0.005 0.005 ‐0.002 ‐0.009 ‐0.008 ‐0.006 (0.003) (0.003) (0.003) (0.004) (0.005) (0.005) (0.005) (0.006) 9 (ref) 10 ‐0.012*** ‐0.010** ‐0.010** ‐0.010* ‐0.003 0.002 0.002 ‐0.001 (0.003) (0.003) (0.003) (0.004) (0.005) (0.005) (0.005) (0.006) 11 ‐0.023*** ‐0.018*** ‐0.018*** ‐0.016*** ‐0.007 0.002 0.003 ‐0.001 (0.003) (0.003) (0.003) (0.004) (0.005) (0.005) (0.005) (0.006) 12 ‐0.032*** ‐0.026*** ‐0.025*** ‐0.022*** ‐0.021*** ‐0.011* ‐0.008 ‐0.014* (0.003) (0.003) (0.003) (0.004) (0.005) (0.005) (0.005) (0.006) 13 ‐0.044*** ‐0.037*** ‐0.035*** ‐0.031*** ‐0.038*** ‐0.025*** ‐0.021*** ‐0.028*** (0.003) (0.003) (0.004) (0.004) (0.005) (0.005) (0.005) (0.006) 14 ‐0.060*** ‐0.051*** ‐0.049*** ‐0.044*** ‐0.045*** ‐0.030*** ‐0.025*** ‐0.032*** (0.004) (0.004) (0.004) (0.004) (0.005) (0.005) (0.005) (0.006) 15 ‐0.074*** ‐0.063*** ‐0.058*** ‐0.053*** ‐0.054*** ‐0.038*** ‐0.031*** ‐0.039*** (0.004) (0.004) (0.004) (0.005) (0.005) (0.005) (0.006) (0.006) 16 ‐0.088*** ‐0.074*** ‐0.070*** ‐0.066*** ‐0.050*** ‐0.033*** ‐0.025*** ‐0.036*** (0.004) (0.004) (0.004) (0.005) (0.006) (0.006) (0.006) (0.007) 17 ‐0.095*** ‐0.078*** ‐0.074*** ‐0.069*** ‐0.053*** ‐0.034*** ‐0.025*** ‐0.038*** (0.004) (0.004) (0.004) (0.005) (0.006) (0.006) (0.006) (0.007) 18 ‐0.092*** ‐0.074*** ‐0.070*** ‐0.063*** ‐0.055*** ‐0.033*** ‐0.024*** ‐0.036*** (0.004) (0.004) (0.005) (0.006) (0.006) (0.006) (0.006) (0.007) 19 ‐0.093*** ‐0.074*** ‐0.068*** ‐0.060*** ‐0.050*** ‐0.026*** ‐0.015* ‐0.027*** (0.005) (0.005) (0.005) (0.006) (0.006) (0.006) (0.007) (0.007) 20 ‐0.099*** ‐0.078*** ‐0.072*** ‐0.063*** ‐0.047*** ‐0.019** ‐0.005 ‐0.017* (0.005) (0.005) (0.005) (0.006) (0.007) (0.007) (0.007) (0.008) Comment Baseline Fix educ
pre‐migr Drop educ Low‐educ
reference Baseline Fix educ
pre‐migr Drop educ Low‐educ
reference
*/**/***Statistically significant at the 10/5/1 percent level. Note: All estimates are relative to the predicted immigrant‐native differentials at nine years of residence.