
Ditch Discovery Doldrums: Unify Silos of Analytics for Self-Service Success
33
© 2016 Ventana Research 1 © 2016 Ventana Research Ditch Discovery Doldrums Mark Smith CEO & Chief Research Officer
-
Upload
information-builders -
Category
Data & Analytics
-
view
540 -
download
0
Transcript of Ditch Discovery Doldrums: Unify Silos of Analytics for Self-Service Success

© 2016 Ventana Research 1 © 2016 Ventana Research
Ditch Discovery Doldrums
Mark Smith CEO & Chief Research Officer

© 2016 Ventana Research 2 © 2016 Ventana Research 2
New Generation of Analytics
© 2016 Ventana Research 3 © 2016 Ventana Research 3
Many Choices Exist for Analytics & BI
© 2016 Ventana Research 4 © 2016 Ventana Research 4
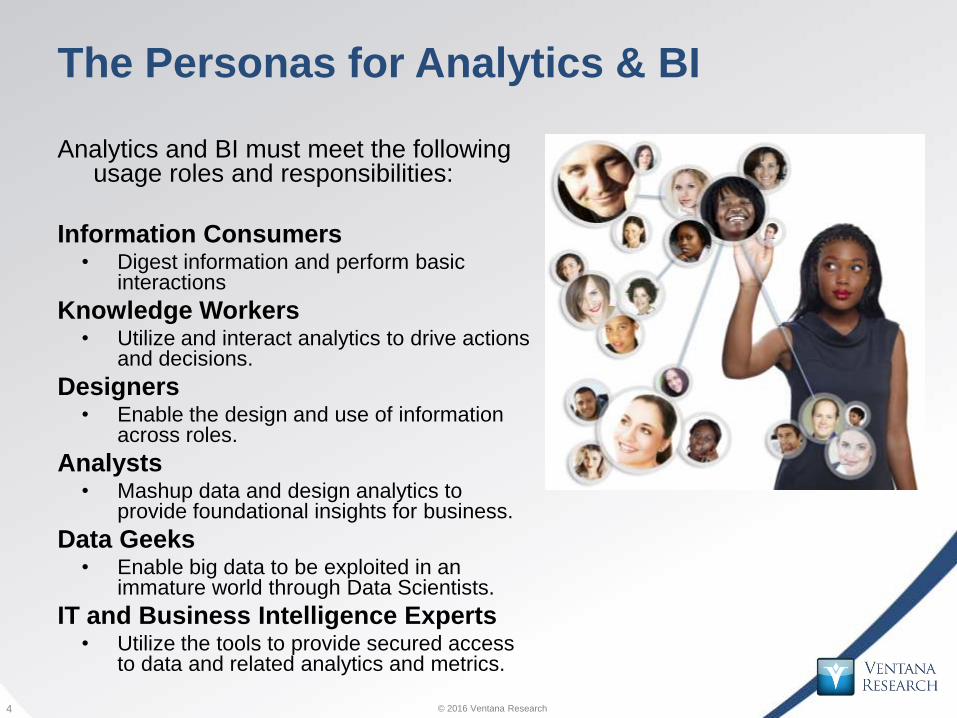
The Personas for Analytics & BI
Analytics and BI must meet the following usage roles and responsibilities:
Information Consumers • Digest information and perform basic
interactions
Knowledge Workers • Utilize and interact analytics to drive actions
and decisions.
Designers • Enable the design and use of information
across roles.
Analysts • Mashup data and design analytics to
provide foundational insights for business.
Data Geeks • Enable big data to be exploited in an
immature world through Data Scientists.
IT and Business Intelligence Experts • Utilize the tools to provide secured access
to data and related analytics and metrics.
© 2016 Ventana Research 5 © 2016 Ventana Research 5
Discovery Helps Analysts not Business

© 2016 Ventana Research 6 © 2016 Ventana Research 6
Use Categories for Evaluation Criteria
Leverage a framework like that
from Ventana Research that
examines vendors and products
across evaluation criteria in
categories that represents how
products are used across roles.
Just focusing on one category
or focusing on non-relevant
categories like vision and
execution could be detrimental
to your organizations use of
products.
Categories
Usability
Functionality
Reliability
Manageability
Adaptability
TCO/ROI
Validation

© 2016 Ventana Research 7 © 2016 Ventana Research 7
Use Categories for Evaluation Criteria
Leverage a framework like that
from Ventana Research that
examines vendors and products
across evaluation criteria in
categories that represents how
products are used across roles.
Just focusing on one category
or focusing on non-relevant
categories like vision and
execution could be detrimental
to your organizations use of
products.
Categories
Usability (63%)
Functionality (50%)
Reliability (50%)
Manageability (42%)
Adaptability (32%)
TCO/ROI (31%)
Validation (20%)
Source: Ventana Research Big Data Analytics Benchmark Research
(Percentages represent very important rating to organizations.)

© 2016 Ventana Research 8 © 2016 Ventana Research 8
Analytics and BI Functionality Criteria
Data
Model
Access
Analytics
Discovery
Integrate
Predict
Communication
Collaborate
Manage
Inform
Act
Automate

© 2016 Ventana Research 9 © 2016 Ventana Research 9
Analytics Require Range of Discovery
Spectrum of Methods:
• Event: Use of streams
of events from applications,
and machine data like IoT.
(49%)
• Data: Utilizing data to better
understand it. (64%)
• Visual: Presenting data in a
for visual interaction. (31%)
• Information: Harvesting
content and text for
interactions. (57%)
(Percentages indicate organizations that
have analytics for big data.)
Source: Ventana Research Big Data Analytics
Benchmark Research

© 2016 Ventana Research 10 © 2016 Ventana Research 10
Visual Discovery Should Clarify not Confuse
© 2016 Ventana Research 11 © 2016 Ventana Research 11
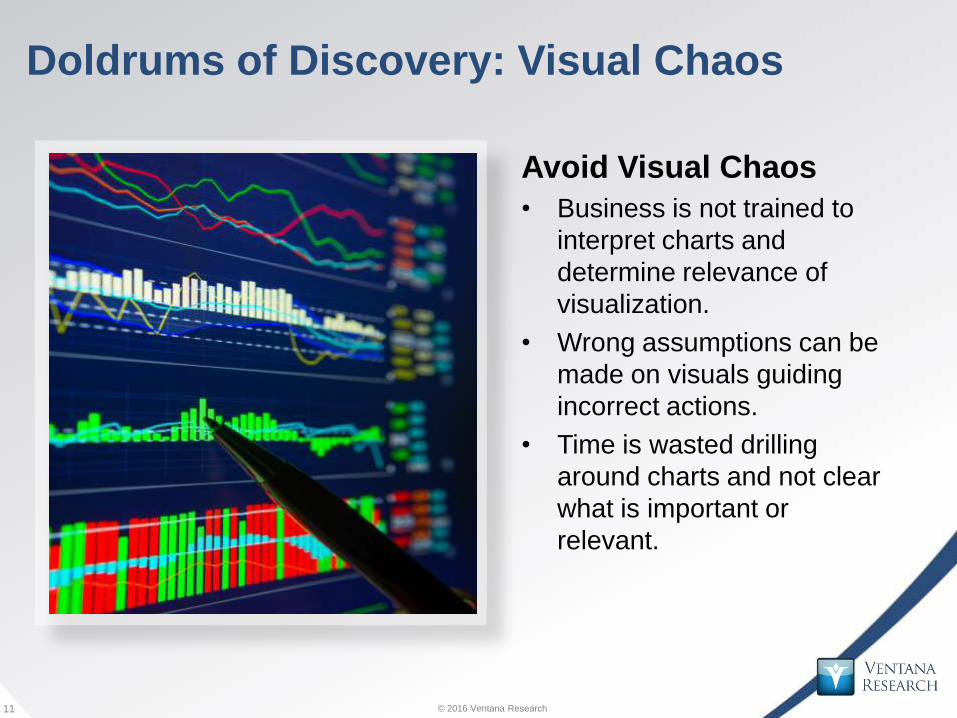
Doldrums of Discovery: Visual Chaos
Avoid Visual Chaos
• Business is not trained to
interpret charts and
determine relevance of
visualization.
• Wrong assumptions can be
made on visuals guiding
incorrect actions.
• Time is wasted drilling
around charts and not clear
what is important or
relevant.

© 2016 Ventana Research 12 © 2016 Ventana Research 12
Doldrums Lead to Frustration

© 2016 Ventana Research 13 © 2016 Ventana Research 13
Analytics Priorities for Organizations
Related research facts:
•Range of analytics are needed
to meet the usage personas.
•Predictive analytics ranks
number five in analytic
capabilities currently available in
the organization (57%), lagging
more descriptive approaches of
query and reporting (74%)
•Visual analytics is used for
contextual understanding (48%)
and root cause analysis (40%)
Source: Ventana Research Big Data Analytics Benchmark Research
18% 47% Advanced /
predictive
26% 13% Descriptive
analytics
20% 16% Real-time
analytics
13% 9% Visual Analytics
In-database
analytics
In-memory
analytics
Second First
Importance
15% 9%
7% 4%

© 2016 Ventana Research 14 © 2016 Ventana Research 14
Where do Analysts Spend (Waste) Time
Largest time spent on data related tasks:
Preparing Data for
Analysis
55%
Reviewing data for quality and
consistency
48%
Determine how
changes impact
business
21%
Trying to determine root
cause of situation
27%
Waiting for data and information
from IT
28%
Source: Ventana Research Data and Analytics in the Cloud Benchmark Research

© 2016 Ventana Research 15 © 2016 Ventana Research 15
Modernize Analytics and BI Effectively
© 2016 Ventana Research 9

© 2016 Ventana Research 16 © 2016 Ventana Research 16
Effective Evaluation of Analytics & BI
Download Executive Summary
http://www.ventanaresearch.com/BIValueIndex/
© 2016 Ventana Research 17 © 2016 Ventana Research 17
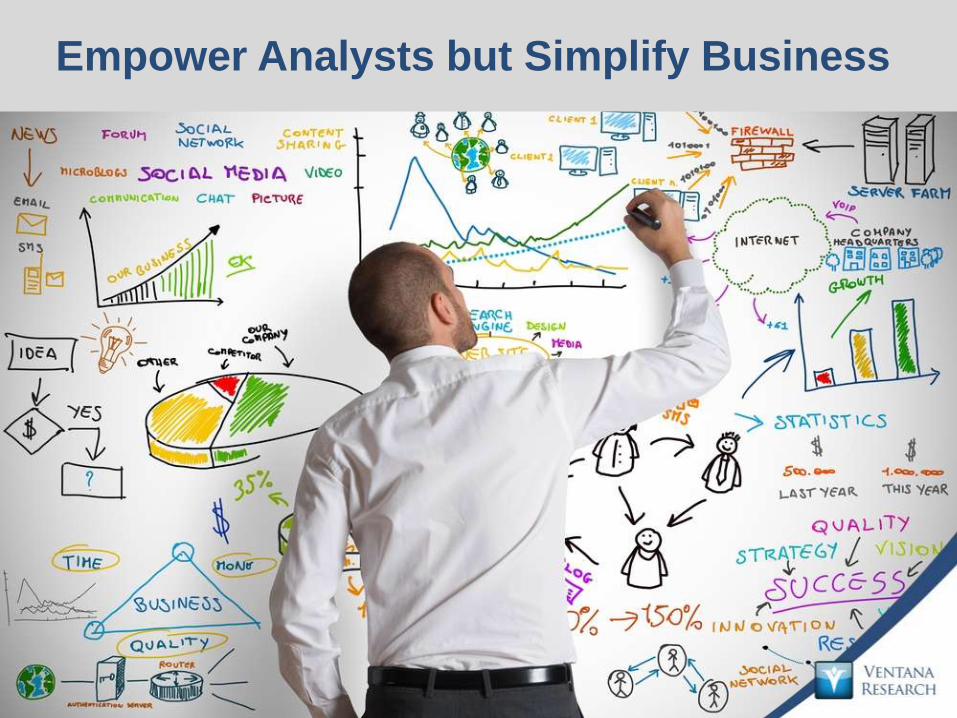
Empower Analysts but Simplify Business

© 2016 Ventana Research 18 © 2016 Ventana Research 18
Simplify Analytics for Business and IT
© 2016 Ventana Research 19 © 2016 Ventana Research 19
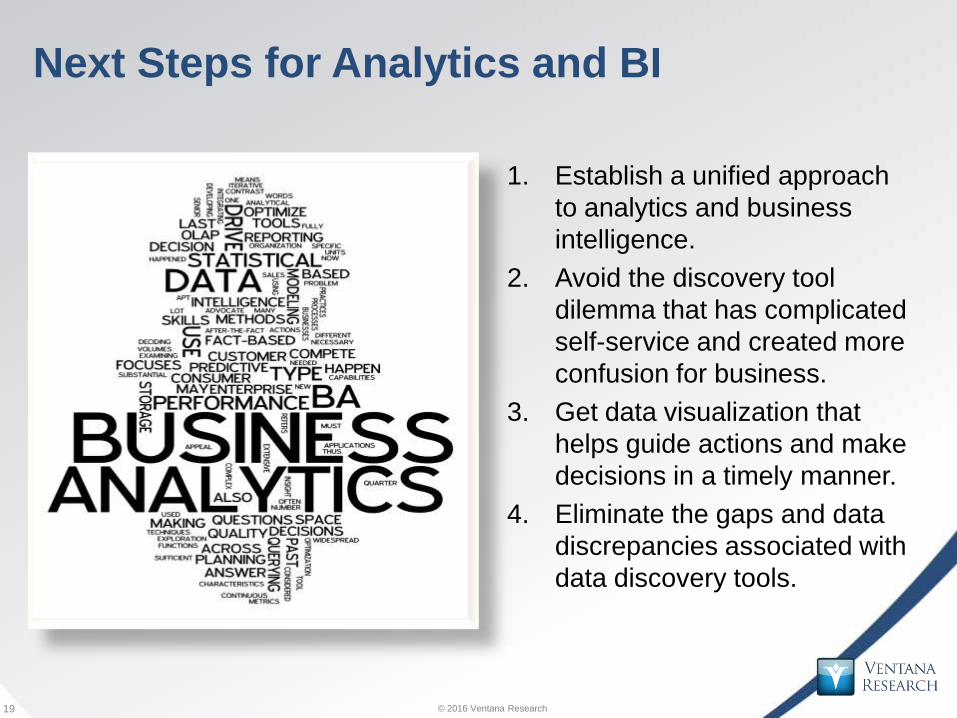
Next Steps for Analytics and BI
1. Establish a unified approach
to analytics and business
intelligence.
2. Avoid the discovery tool
dilemma that has complicated
self-service and created more
confusion for business.
3. Get data visualization that
helps guide actions and make
decisions in a timely manner.
4. Eliminate the gaps and data
discrepancies associated with
data discovery tools.

© 2016 Ventana Research 20 © 2016 Ventana Research 20
Questions?
@marksmithvr and @ventanaresearch
http://www.linkedin.com/company/ventana-research
Analyst Perspectives
http://marksmith.ventanaresearch.com
© 2016 Ventana Research 21 © 2016 Ventana Research
Ditch Discovery Doldrums
Mark Smith CEO & Chief Research Officer
Beyond Data Discovery
Michael Corcoran Sr. Vice President & CMO April 11, 2016
22
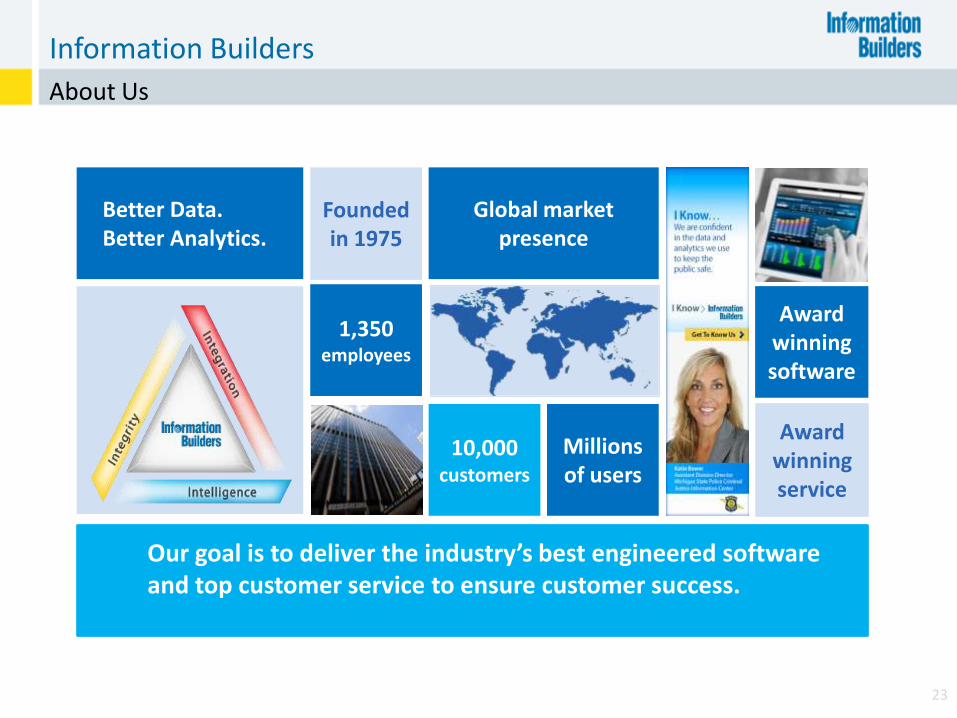
About Us
Information Builders
23
Our goal is to deliver the industry’s best engineered software and top customer service to ensure customer success.
Founded in 1975
1,350 employees
Millions of users
Global market presence
10,000 customers
Better Data. Better Analytics.
Award winning service
Award winning software

Better Data. Better Analytics.
24

Who Needs It?
Business Intelligence & Analytics
Business Analyst Operational Worker
Data Scientist Partners
Customers
Data Mining Statistics
Predictive
Spreadsheets Data Discovery
Query & Analysis
Managers
Mobile Apps Portal
e-Statements In-store Kiosk
Supplier, Distributor,
Retailer Portals
Decision Support Apps Reports
Performance Metrics Event-driven Alerts
Dashboards Scorecards Powerpoint
Production Reports
Back Office Operations, Partners, Customers 22% 78%
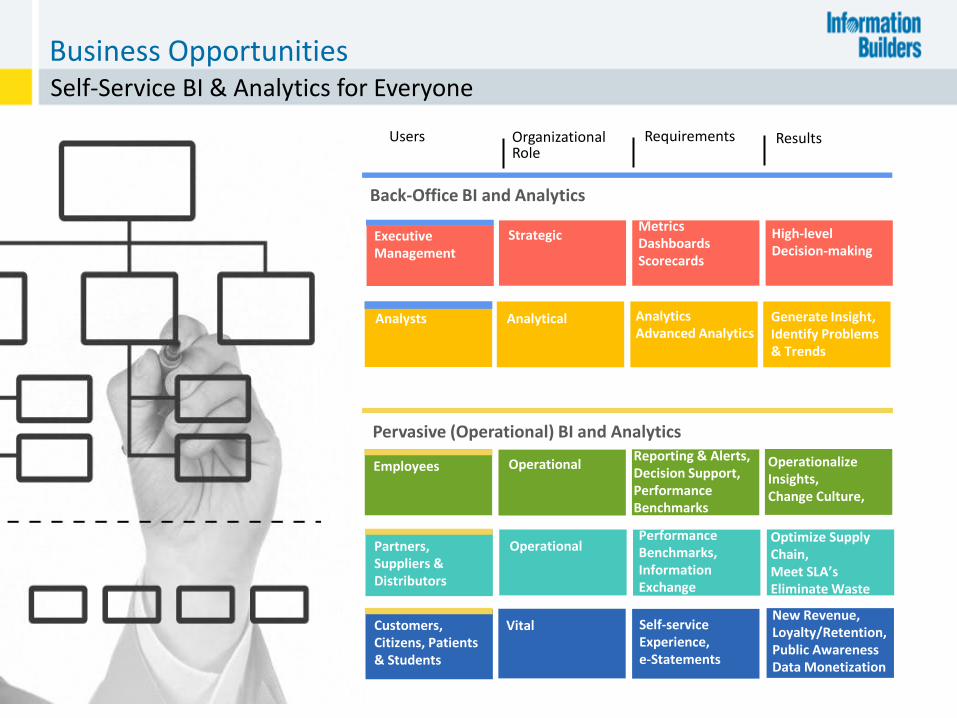
Self-Service BI & Analytics for Everyone
Business Opportunities
Pervasive (Operational) BI and Analytics
Employees Operational Reporting & Alerts, Decision Support, Performance Benchmarks
Operationalize Insights, Change Culture,
Performance Benchmarks, Information Exchange
Partners, Suppliers & Distributors
Operational Optimize Supply Chain, Meet SLA’s Eliminate Waste
Customers, Citizens, Patients & Students
Vital Self-service Experience, e-Statements
New Revenue, Loyalty/Retention, Public Awareness Data Monetization
Back-Office BI and Analytics
Executive Management
Strategic Metrics Dashboards Scorecards
High-level Decision-making
Analysts Analytical Analytics Advanced Analytics
Generate Insight, Identify Problems & Trends
Organizational Role
Requirements Users Results
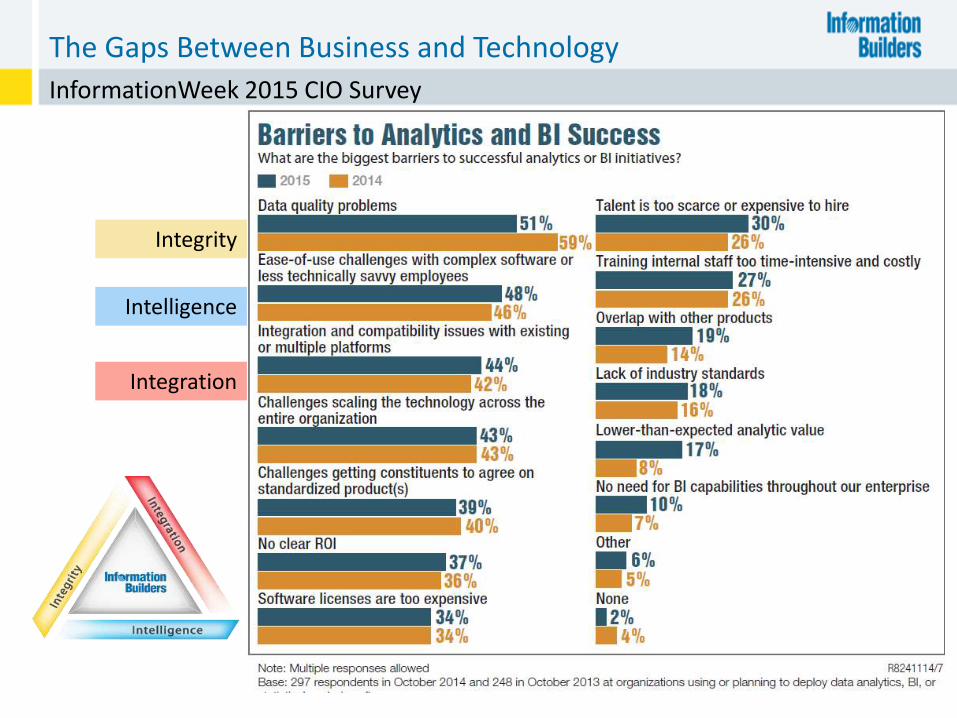
InformationWeek 2015 CIO Survey
The Gaps Between Business and Technology
Integrity
Intelligence
Integration

Information Builders’ 3i Platform Better Data. Better Analytics.
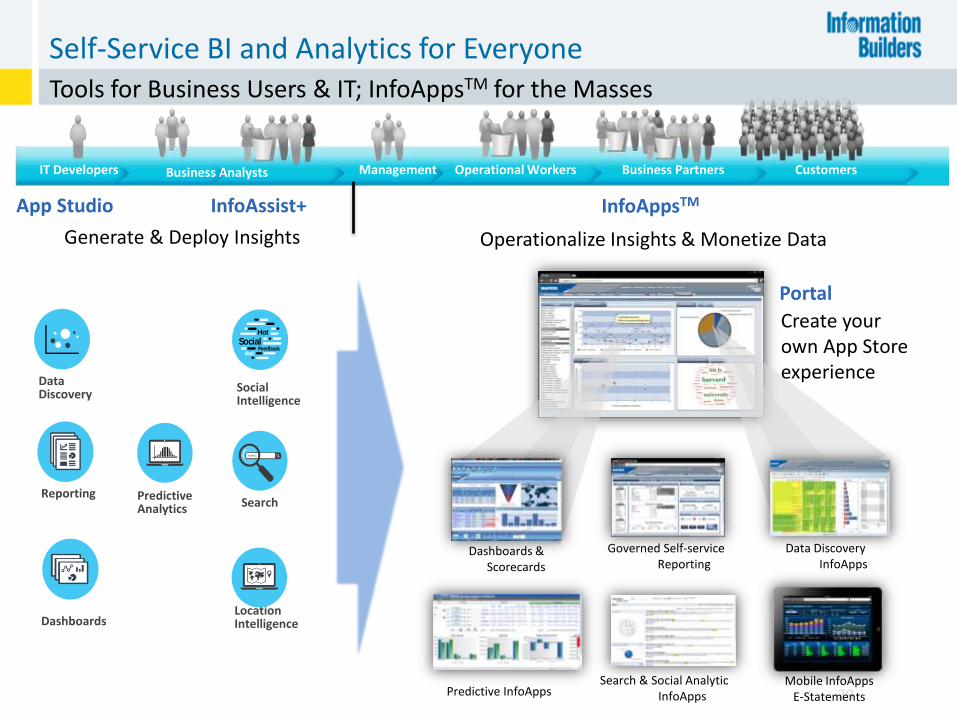
IT Developers Management Operational Workers Business Partners Customers
Tools for Business Users & IT; InfoAppsTM for the Masses
Self-Service BI and Analytics for Everyone
29
InfoAppsTM
Dashboards & Scorecards
Governed Self-service Reporting
Mobile InfoApps E-Statements
Data Discovery InfoApps
Predictive InfoApps Search & Social Analytic
InfoApps
Portal
Create your own App Store experience
Operationalize Insights & Monetize Data
Business Analysts
App Studio InfoAssist+
Data Discovery
Predictive Analytics
Social Intelligence
Search
Location Intelligence
Reporting
Dashboards
Generate & Deploy Insights
SocialHot
BadFeedback
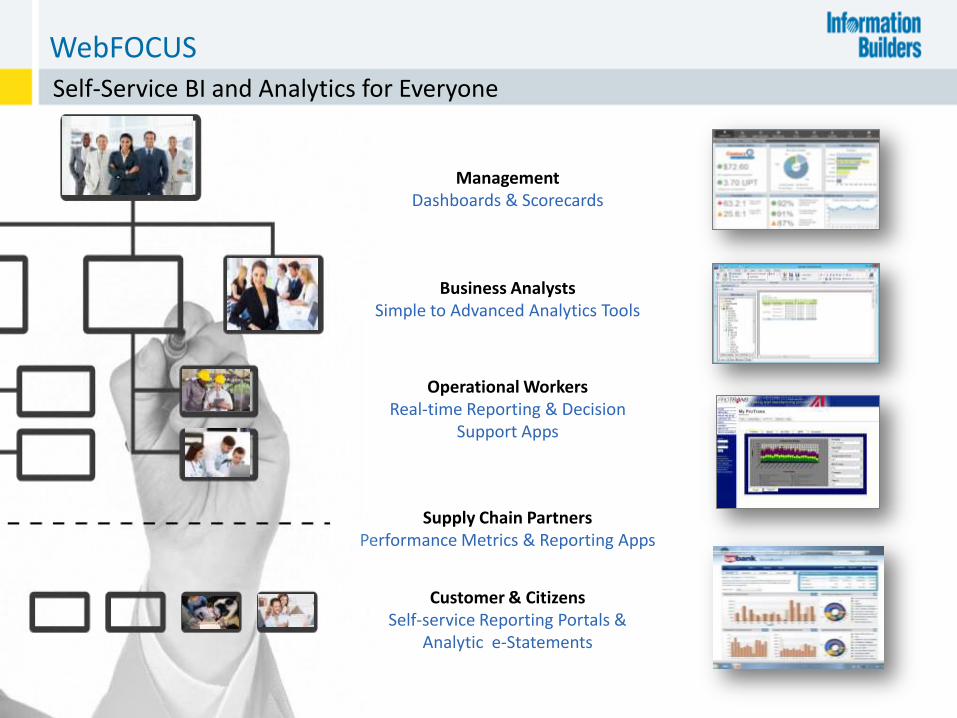
I. Executive Summary Page 10
Management Dashboards & Scorecards
Business Analysts Simple to Advanced Analytics Tools
Operational Workers Real-time Reporting & Decision
Support Apps
Supply Chain Partners Performance Metrics & Reporting Apps
Customer & Citizens
Self-service Reporting Portals & Analytic e-Statements
WebFOCUS Self-Service BI and Analytics for Everyone
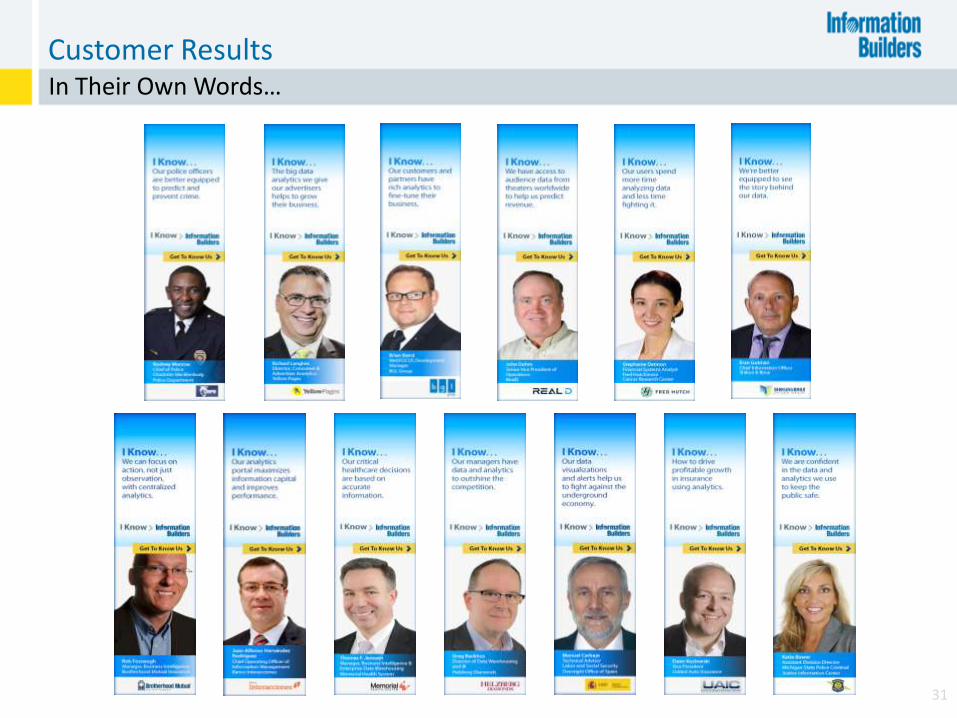
Customer Results
31
In Their Own Words…

Follow us…
32
@mpcorcoran and @infobldrs
www.facebook.com/informationbuilders
www.linkedin.com/company/information-builders

Summary & Discussion
33
Mark Smith CEO & Chief Research Officer
Michael Corcoran Sr Vice President & CMO