A structured college preparatory system working directly with schools and districts
Upload
anastasia-owensCategory
view
34download
2description

Districts and States Working with VARC
MinneapolisMilwaukee
Racine
Chicago
Madison
Tulsa
Atlanta
New York City
Los Angeles
Hillsborough County
NORTH DAKOTA
SOUTH DAKOTA
MINNESOTA
WISCONSIN
ILLINOISDenver
Collier County

The Power of Two
&A more
complete picture of student learning
Achievement Value-AddedCompares students’
performance to a standard
Does not factor in students’ background characteristics
Measures students’ performance at a single
point in time
Critical to students’ post-secondary opportunities
Measures students’ individual academic growth longitudinally
Factors in students’ background characteristics
outside of the school’s control
Critical to ensuring students’ future academic success
Measures the impact of teachers and schools on
academic growth
Adapted from materials created by Battelle for Kids

Design•Quasi-experimental statistical model•Controls for non-school factors
(prior achievement, student and family characteristics)
Output•Productivity estimates for contribution of
educational units (schools, classrooms, teachers) to student achievement growth
Objective•Valid and fair comparisons of school
productivity, given that schools may serve very different student populations
Value-Added Model Description

The Oak Tree Analogy

• For the past year, these gardeners have been tending to their oak trees trying to maximize the height of the trees.
Gardener A Gardener B
Gardener A Gardener B
Explaining Value-Added by Evaluating Gardener Performance
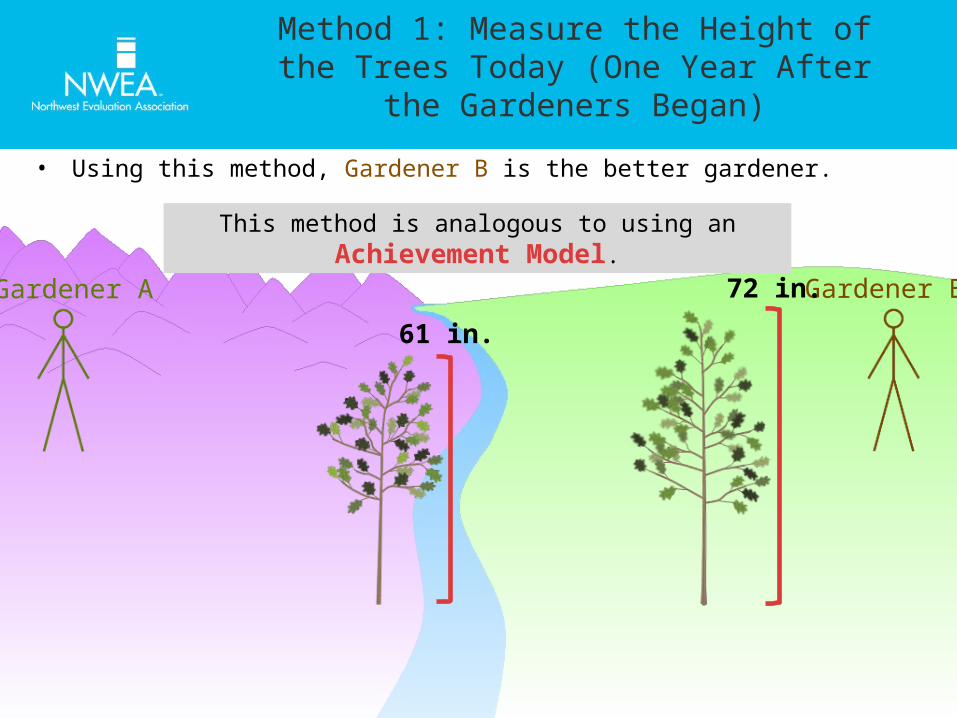
This method is analogous to using an Achievement Model.
• Using this method, Gardener B is the better gardener.
Gardener A Gardener B
61 in.
72 in.
Method 1: Measure the Height of the Trees Today (One Year After the Gardeners Began)

• How is this similar to how schools have been judged in New York?
• What information is missing?
Pause and Reflect

• We need to find the starting height for each tree in order to more fairly evaluate each gardener’s performance during the past year.
61 in.
72 in.Gardener A Gardener B
Oak AAge 4
(Today)
Oak BAge 4
(Today)
Oak AAge 3
(1 year ago)
Oak BAge 3
(1 year ago)
47 in.52 in.
This Achievement Result is not the Whole Story

61 in.
72 in.Gardener A Gardener B
Oak AAge 4
(Today)
Oak BAge 4
(Today)
Oak AAge 3
(1 year ago)
Oak BAge 3
(1 year ago)
47 in.52 in.
This is analogous to a Simple Growth Model, also called Gain.
+14 in. +20 in.
• Oak B had more growth this year, so Gardener B is the better gardener.
Method 2: Compare Starting Height to Ending Height

• This is an “apples to oranges” comparison.• For our oak tree example, three environmental factors we will examine are:
Rainfall, Soil Richness, and Temperature.
Gardener A Gardener B
What About Factors Outside the Gardeners’ Influence?

External condition Oak Tree A Oak Tree B
Rainfall amount
Soil richness
Temperature
High LowLow HighHigh Low
Gardener A Gardener B

Gardener A Gardener B
• We compare the actual height of the trees to their predicted heights to determine if the gardener’s effect was above or below average.
• We need to analyze real data from the region to predict growth for these trees.
How Much Did These External Factors Affect Growth?

In order to find the impact of rainfall, soil richness, and temperature, we will plot the growth of each individual oak in the region compared to its environmental conditions.

Rainfall Low Medium HighGrowth in inches
relative to the average
-5 -2 +3
Soil Richness Low Medium HighGrowth in inches
relative to the average
-3 -1 +2
Temperature Low Medium HighGrowth in inches
relative to the average
+5 -3 -8
Calculating Our Prediction Adjustments Based on Real Data
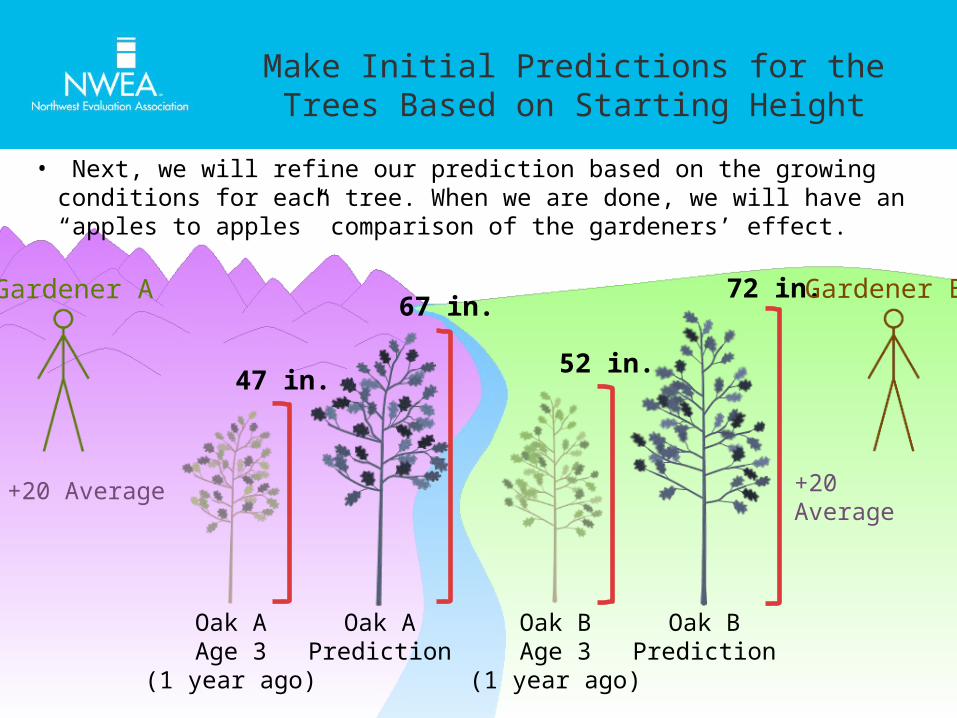
• Next, we will refine our prediction based on the growing conditions for each tree. When we are done, we will have an “apples to apples” comparison of the gardeners’ effect.
Oak AAge 3
(1 year ago)
Oak BAge 3
(1 year ago)
67 in.72 in.Gardener A Gardener B
Oak APrediction
Oak BPrediction
47 in.52 in.
+20 Average+20 Average
Make Initial Predictions for the Trees Based on Starting Height

Similarly, for having low rainfall, Oak B’s prediction is adjusted by -5 to compensate.For having high rainfall, Oak A’s prediction is adjusted by +3 to compensate.
70 in. 67 in.Gardener A Gardener B
47 in.52 in.
+20 Average+20 Average
+ 3 for Rainfall - 5 for Rainfall
Based on Real Data, Customize Predictions for Rainfall

For having rich soil, Oak B’s prediction is adjusted by +2.
For having poor soil, Oak A’s prediction is adjusted by -3.
67 in.69 in.Gardener A Gardener B
47 in.52 in.
+20 Average+20 Average
+ 3 for Rainfall
- 3 for Soil + 2 for Soil
- 5 for Rainfall
Adjusting for Soil Richness

For having low temperature, Oak B’s prediction is adjusted by +5.For having high temperature, Oak A’s prediction is adjusted by -8.
59 in.
74 in.Gardener A Gardener B
47 in.52 in.
+20 Average+20 Average
+ 3 for Rainfall
- 3 for Soil + 2 for Soil
- 8 for Temp + 5 for Temp
- 5 for Rainfall
Adjusting for Temperature

+20 Average+20 Average
+ 3 for Rainfall
- 3 for Soil + 2 for Soil
- 8 for Temp + 5 for Temp_________+12 inchesDuring the year
_________+22 inches During the year
The predicted height for trees in Oak B’s conditions is 74 inches.The predicted height for trees in Oak A’s conditions is 59 inches.
59 in.
74 in.Gardener A Gardener B
47 in.52 in.
- 5 for Rainfall
Our Gardeners are Now on a Level Playing Field

Oak B’s actual height is 2 inches less than predicted. We attribute this below-average result to the effect of Gardener B.
Oak A’s actual height is 2 inches more than predicted. We attribute this above-average result to the effect of Gardener A.
PredictedOak A
PredictedOak B
ActualOak A
ActualOak B
59 in.
74 in.Gardener A Gardener B61 in.
72 in.+2-2
Compare the Predicted Height to the Actual Height
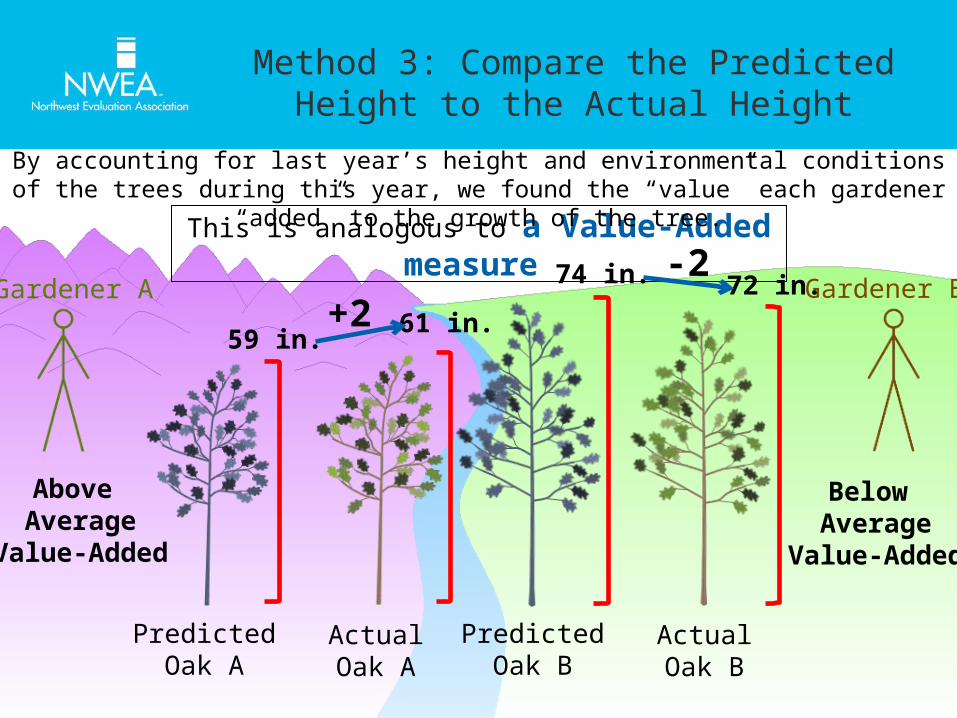
This is analogous to a Value-Added measure.
By accounting for last year’s height and environmental conditions of the trees during this year, we found the “value” each gardener “added” to the growth of the tree.
Above Average
Value-Added
Below Average
Value-Added
PredictedOak A
PredictedOak B
ActualOak A
ActualOak B
59 in.
74 in.Gardener A Gardener B61 in.
72 in.+2
-2
Method 3: Compare the Predicted Height to the Actual Height

Oak Tree Analogy Value-Added in Education
What are we evaluating?
• Gardeners • Districts• Schools• Grades• Classrooms• Programs and Interventions
How does this analogy relate to value added in the education context?
What are we using to measure success?
• Relative height improvement in inches
• Relative improvement on standardized test scores
Sample • Single oak tree • Groups of students
Control factors • Tree’s prior height
• Other factors beyond the gardener’s control:
• Rainfall• Soil richness• Temperature
• Students’ prior test performance (usually most significant predictor)
• Other demographic characteristics such as:
• Grade level• Gender• Race / Ethnicity• Low-Income Status• ELL Status• Disability Status

A Visual Representation of Value-Added
Year 2(Post-test)
Actual student achievement
scale score
Predicted student achievement (Based on observationally
similar students)
Value-AddedStarting student achievement scale score
Year 1(Prior-test)

District Model
Statewide Model
Unified Output and Messaging
Best Reference Point for Relative Growth Measurement
Largest Pool of Data to Refine Predictions
Customized Model Design
Producing a Value-Added Model for New York State

• The Value-Added model typically generates a set of results measured in scale scores.
What do Value-Added Results Look Like?
Teacher Value-Added
Teacher A +10
Teacher B -10
Teacher C 0
This teacher’s students gained 10 more points on the RIT scale
than observationally similar students across the state. (10 points more than predicted)
10 points fewer than predicted
These students gained exactly as many points as predicted

Value-Added in “Tier” Units
Grade 4 30
-2 -1 0 1 2
0.9
In some cases, Value-Added is displayed on “Tier” scale based on standard deviations (z-score) for reporting purposes.
About 95% of estimates will fall between -2 and +2 on the scale.
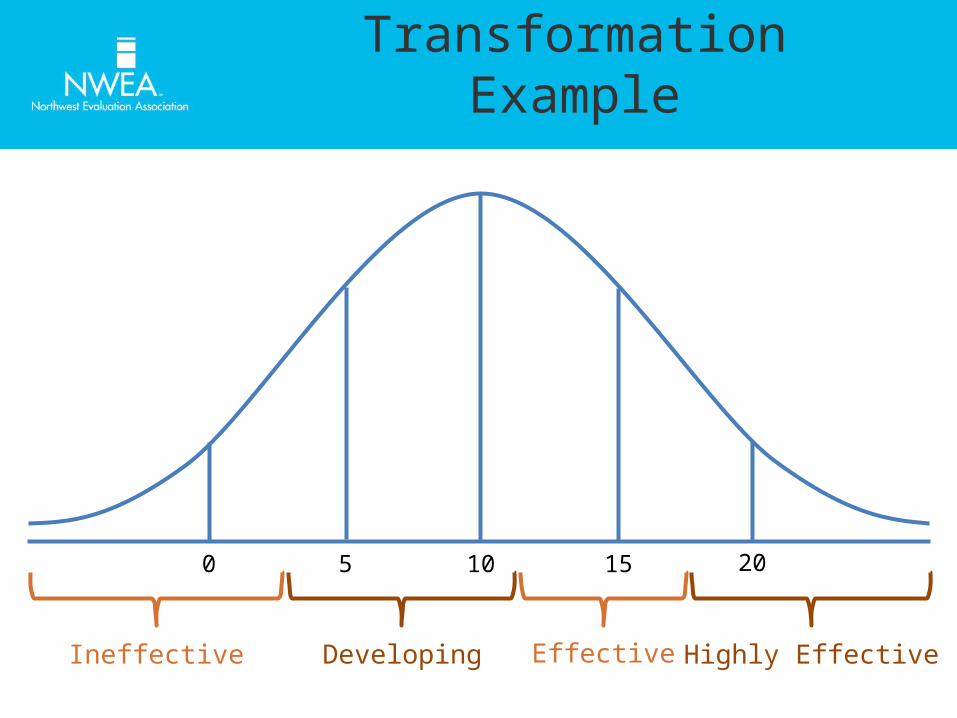
Transformation Example
10 15 200 5
Ineffective Developing Effective Highly Effective

Transformation Example
10 15 200 5
Ineffective Developing Effective Highly Effective

Transformation Example
10 15 200 5
Ineffective Developing Effective Highly Effective

Transformation Example
10 15 200 5
Ineffective Developing Effective Highly Effective

Transformation Example
10 15 200 5
Ineffective Developing Effective Highly Effective

Advisor Group
Value-Added Research
Center
New York BOCES and
Districts
Other New York
Stakeholders
Northwest Evaluation Association
How do we Translate Value-Added into the 0-20 Scale?

Output Formats
VARC Value-Added Output0-20 scale based on advisory group’s
recommended methodology
scale score standard deviations