District Skill Development Plan Thiruvallur
64
1 Skilling for the Future Skill Gap Assessment & Action Plan for Tamil Nadu District Skill Development Plan Thiruvallur November 2019 Tamil Nadu Skill Development Corporation, Integrated Employment Offices Campus (1st Floor) Thiru. Vi .Ka Industrial Estate, Guindy, Chennai-600 032
Transcript of District Skill Development Plan Thiruvallur

1
Skilling for the Future
Skill Gap Assessment & Action Plan for Tamil Nadu
District Skill Development Plan Thiruvallur
November 2019
Tamil Nadu Skill Development Corporation, Integrated Employment Offices Campus (1st Floor) Thiru. Vi .Ka Industrial Estate, Guindy, Chennai-600 032

2

3
Tamil Nadu Skill Development Corporation (TNSDC) Integrated Employment Offices Campus (1st Floor) Thiru. Vi .Ka Industrial Estate, Guindy, Chennai-600 032 T +044 2250 0107 E [email protected] W https://www.tnskill.tn.gov.in Published by TNSDC, Chennai Disclaimer The Report includes projections, forecasts and other predictive statements which are based on assumptions and expectations in the light of currently available information. These projections and forecasts are based on industry trends, circumstances and factors which involve risks, variables and uncertainties. TNSDC disclaims all warranties as to the accuracy, completeness or adequacy of such information. TNSDC and/or its Affiliates and its officers, directors and employees including the analysts/authors/advisors shall not be in any way responsible for any direct, indirect, special or consequential damages that may arise to any person from any inadvertent error in the information or judgement or opinion contained in the report nor do they take guarantee or assume liability for any omissions of the information contained therein. The projections and forecasts described in this report should be evaluated keeping in mind the fact that these are not scientifically proven to guarantee certain intended results and are not published as a warranty and do not carry any evidentiary value. Opinions expressed therein are current opinion as of the date appearing on the report only. Data may be subject to update and correction without notice. Every effort has been made to trace the owners of the copyright material included in this Report. The material in this publication is copyrighted. Reproduction or dissemination, directly or indirectly, either on paper or on electronic media, of the research data and report in any form is prohibited except with the written permission of TNSDC. The user should consult their own advisors before making use of any information or data contained in the report. The publishers would be grateful for any omissions brought to their notice for acknowledgement in future editions of the report

4

5
Acknowledgement
We extend our thanks to District officials of Thiruvallur, youth, employers, industrial associations and training service providers who participated in focus group discussions and survey, for their support in conducting research and drafting this report.

6
Table of Contents
1. Executive Summary ...................................................................................................................................... 11
2. District Profile ................................................................................................................................................ 15
2.1. Demographic Profile .............................................................................................................................. 15
2.2. Economic Profile .................................................................................................................................... 16
2.2.1. Sector Analysis ............................................................................................................................ 17
2.2.2. Investments and key economic drivers ........................................................................................ 22
2.3. Labour Market Profile ............................................................................................................................ 24
2.4. Education and Skill Development Profile ............................................................................................... 26
2.4.1. Education Profile .......................................................................................................................... 26
2.5. Vocational Education Profile .................................................................................................................. 26
3. Youth Perspective ......................................................................................................................................... 32
3.1. Profile of Respondent Youth .................................................................................................................. 32
3.2. Youth’s Educational and Economic Engagement Status ....................................................................... 32
3.3. Economic Engagement of the Youth ..................................................................................................... 33
3.4. Youth under NEET Category ................................................................................................................. 34
3.5. Youth Career Aspiration ........................................................................................................................ 35
3.6. Skill Training Preferences of the Youth ................................................................................................ 39
4. Employers’ and Other Stakeholders’ Perspective ..................................................................................... 40
5. Other Stakeholders’ Perspective ................................................................................................................. 43
6. Skill Gap Analysis ......................................................................................................................................... 45
6.1. Skill Gap Assessment - Incremental Demand for Skilled & Semi Skilled Manpower ............................ 45
7. District Skilling Action Plan ......................................................................................................................... 46
7.1. District Action Plan................................................................................................................................. 46
7.2. Key Recommendations.......................................................................................................................... 58
Appendix ............................................................................................................................................................ 59
A.1 Methodology for Block Selection in Youth Aspiration Survey ................................................................. 59
A.2 Methodology for Present and Future Labour Demand – Supply and Gap Estimation ........................... 61
A.3 List of Stakeholders Consulted............................................................................................................... 0

7
List of Tables
Table 1: Key Demographic Indicators– Thiruvallur vs Tamil Nadu ..................................................................... 15 Table 2: Sector wise- Annual Growth Rate in Thiruvallur (Directorate of Economics and Statistics, TN) ........... 17 Table 3 Profile of Manufacturing Sector from ASI ............................................................................................... 19 Table 4 Handicrafts industries in Cuddalore ....................................................................................................... 21 Table 5: LFPR and Unemployment Rate by gender & Location ......................................................................... 25 Table 6 Institutions of Higher Education in Thiruvallur District ............................................................................ 26 Table 7 Vocational Training under Short Term Skill Development Programs ..................................................... 26 Table 8 Vocational Training under Long Term Skill Development Programs (ITI) .............................................. 30 Table 9 Education Qualification of Respondents and Employment Type ........................................................... 33 Table 10 NEET Category Respondents .............................................................................................................. 34 Table 11 Career Aspiration - Factors, Preparedness and Availability of Jobs .................................................... 35 Table 12 Career Aspiration – Challenges in pursuing desired career * .............................................................. 36 Table 13 Key Requirements to enhance employability and steps to achieve aspirations ................................... 36 Table 14 Sector wise coverage of Industries in Employer Survey ...................................................................... 40 Table 15 Modes and Challenges in Recruitment Process* ................................................................................. 40 Table 16 Growth Prospects and prospective adoption of technology ................................................................. 42 Table 17 Demand for workers by Skill Level and type of training provided to workers ....................................... 42 Table 18: Qualitative findings Thiruvallur ............................................................................................................ 43 Table 19 Sector wise Incremental Demand for Skilled and Semi Semi-Skilled Workers between 2019 and 2025 ............................................................................................................................................................................ 45 Table 20 Summary of Trainings .......................................................................................................................... 46 Table 21 Training in Fabrication Sector .............................................................................................................. 49 Table 22 Training in Auto and Auto Components Sector .................................................................................... 50 Table 23 Training in Tourism and Hospitality Sector .......................................................................................... 51 Table 24 Training in Logistics Sector .................................................................................................................. 52 Table 25 Training in Healthcare Sector ............................................................................................................... 53 Table 26 Training in Iron and Steel Sector .......................................................................................................... 54 Table 27 Training in Retail Sector ....................................................................................................................... 55 Table 28 Training in Construction Sector ............................................................................................................ 56 Table 29 Training Repair and services ............................................................................................................... 57
8
List of Figures
Figure 1 Age-wise Population Pyramid of Thiruvallur (2011 vs 2026) ................................................................ 16 Figure 2 Key Economic Indicators of Thiruvallur District ..................................................................................... 17 Figure 3 Sectoral Snapshot of GVA 2016-2017 .................................................................................................. 17 Figure 4 Share of GSVA by Industry of Origin (2016-2017) ................................................................................ 17 Figure 5 GVA of Agriculture and Allied Sectors (2016-2017) .............................................................................. 18 Figure 6 Industrial Sector GSVA (2016-2017) .................................................................................................... 18 Figure 7 GSVA of Services Sector (2016-2017) ................................................................................................. 21 Figure 8 Sector-specific growth of Credit off Take (2013-17) - RBI .................................................................... 22 Figure 9 Key Labour Market Indicators ............................................................................................................... 24 Figure 10 Distribution of Working status by Qualification: District Level Estimates ............................................ 24 Figure 11 Sector-wise share of Employment ...................................................................................................... 25 Figure 12 GER and Drop-out Rates - DISE ........................................................................................................ 26 Figure 13 Proportion Undergone Vocational training 2015-16, MoLE ................................................................ 31 Figure 14 Respondent Profile of Youth Aspiration Survey .................................................................................. 32 Figure 15 Current Status of Respondent by gender ........................................................................................... 33 Figure 16 Distribution of Respondents across Monthly Income Category across gender ................................. 33 Figure 17 Youth survey findings across categories ............................................................................................ 34 Figure 18 Career Aspiration of Youth .................................................................................................................. 35 Figure 19 Sectors aspired by respondents ......................................................................................................... 37 Figure 20 Aspired monthly salary of respondents by category ........................................................................... 38 Figure 21 Preference for Work Location* ............................................................................................................ 38 Figure 22 Sources for Job Information* .............................................................................................................. 38 Figure 23 Preference on Counselling Services* ................................................................................................. 39 Figure 24 Skill Training type interested in ........................................................................................................... 39 Figure 25 Skill Training type interested in ........................................................................................................... 39 Figure 26 Distribution of Industries by Size ......................................................................................................... 40 Figure 27 Average distribution of workers by Sex ............................................................................................... 41 Figure 28 Distribution of workers-Skill Levels ..................................................................................................... 41 Figure 29 Key causes of Attrition* ....................................................................................................................... 41 Figure 30 Skill Requirement for Workers ............................................................................................................ 42 Figure 31: Blocks Selected for Survey in Thiruvallur .......................................................................................... 59 Figure 32: Steps in Demand Estimation .............................................................................................................. 61 Figure 33: Steps in Supply Estimation ................................................................................................................ 62

9
List of Abbreviations
S.No Abbreviation Expansion
1. ASER Annual Status of Education Report
2. ASI Annual Survey of Industries
3. BFSI Banking, Financial Services and Insurance Sector
4. BPL Below Poverty Line
5. BSNL Bharat Sanchar Nigam Limited
6. BSNL - RGMTTC BSNL-Rajiv Gandhi Memorial Technical Training Center
7. CIFT Central Institute for Footwear Technology
8. CIPET Central Institute for Plastic Engineering and Technology
9. COE Centre of Excellence
10. DDU-SKY Deen Dhayal Upadhyaya Grameen Kaushalya Yojana
11. DES Directorate of Economics and Statistics
12. DIC District Industries Center
13. DISE District Information System For Education
14. GDDP Gross District Domestic Product
15. GoTN Government of Tamil Nadu
16. GSDP Gross State Domestic Product
17. GVA / GSVA Gross Value Added / Gross State Value Added
18. HCSSC Handicrafts and Carpet Sector Skill Council
19. ISDS Integrated Skill Development Scheme for Textiles
20. ITI Industrial Training Institute
21. IT-ITES Information Technology and Information Technology Enabled Services
22. LFPR Labour Force Participation Rate
23. Manuf. Manufacturing
24. NAPS National Apprenticeship Promotion Scheme
25. NASSCOM National Association of Software and Services Companies
26. NEET Not in Education, Employment, or Training
27. NIC National Industrial Classification
28. NSDC National Skill Development Corporation
29. NSQF National Skills Qualification Framework
30. NULM National Urban Livelihood Mission
31. PMKVY Pradhan Mantri Kaushal Vikas Yojana
32. PSU Public Sector Undertaking
33. Pub. Admin. Public Administration
34. QP-NOS Qualification Pack – National Occupational Standards
35. SIDCO Small Industries Development Corporations
36. SIPCOT State Industries Promotion Corporation of Tamil Nadu
37. SIPPO Small Industries Product Promotion Organization
38. SSC Sector Skill Council
39. TANSIDCO Tamil Nadu Small Industries
40. TASMA Tamil Nadu Spinning Mills Association
41. TIDCO Tamil Nadu Industrial Development Corporation
42. TN-GIM Tamil Nadu Global Investors Meet
43. TNSDC Tamil Nadu Skill Development Corporation
44. TNSRLM Tamil Nadu State Rural Livelihood Mission
45. Tr. & Tou. Trade and Tourism Sectors

10
11
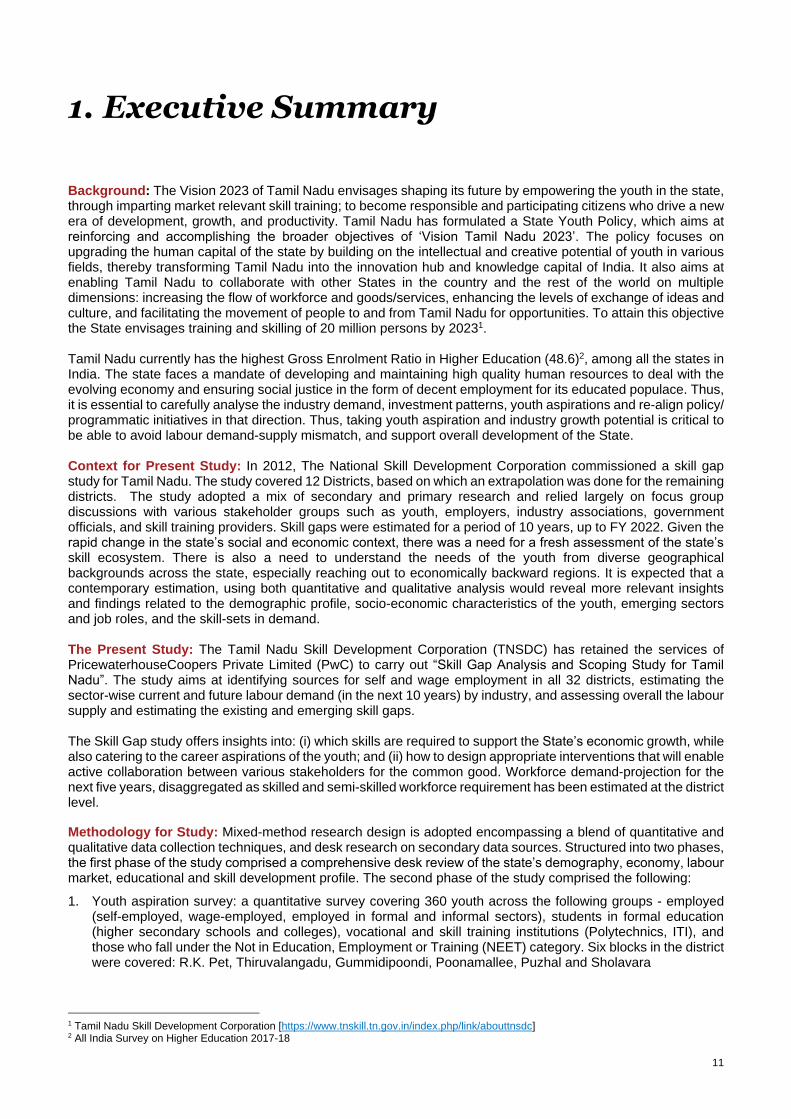
1. Executive Summary
Background: The Vision 2023 of Tamil Nadu envisages shaping its future by empowering the youth in the state, through imparting market relevant skill training; to become responsible and participating citizens who drive a new era of development, growth, and productivity. Tamil Nadu has formulated a State Youth Policy, which aims at reinforcing and accomplishing the broader objectives of ‘Vision Tamil Nadu 2023’. The policy focuses on upgrading the human capital of the state by building on the intellectual and creative potential of youth in various fields, thereby transforming Tamil Nadu into the innovation hub and knowledge capital of India. It also aims at enabling Tamil Nadu to collaborate with other States in the country and the rest of the world on multiple dimensions: increasing the flow of workforce and goods/services, enhancing the levels of exchange of ideas and culture, and facilitating the movement of people to and from Tamil Nadu for opportunities. To attain this objective the State envisages training and skilling of 20 million persons by 20231. Tamil Nadu currently has the highest Gross Enrolment Ratio in Higher Education (48.6)2, among all the states in India. The state faces a mandate of developing and maintaining high quality human resources to deal with the evolving economy and ensuring social justice in the form of decent employment for its educated populace. Thus, it is essential to carefully analyse the industry demand, investment patterns, youth aspirations and re-align policy/ programmatic initiatives in that direction. Thus, taking youth aspiration and industry growth potential is critical to be able to avoid labour demand-supply mismatch, and support overall development of the State. Context for Present Study: In 2012, The National Skill Development Corporation commissioned a skill gap study for Tamil Nadu. The study covered 12 Districts, based on which an extrapolation was done for the remaining districts. The study adopted a mix of secondary and primary research and relied largely on focus group discussions with various stakeholder groups such as youth, employers, industry associations, government officials, and skill training providers. Skill gaps were estimated for a period of 10 years, up to FY 2022. Given the rapid change in the state’s social and economic context, there was a need for a fresh assessment of the state’s skill ecosystem. There is also a need to understand the needs of the youth from diverse geographical backgrounds across the state, especially reaching out to economically backward regions. It is expected that a contemporary estimation, using both quantitative and qualitative analysis would reveal more relevant insights and findings related to the demographic profile, socio-economic characteristics of the youth, emerging sectors and job roles, and the skill-sets in demand. The Present Study: The Tamil Nadu Skill Development Corporation (TNSDC) has retained the services of PricewaterhouseCoopers Private Limited (PwC) to carry out “Skill Gap Analysis and Scoping Study for Tamil Nadu”. The study aims at identifying sources for self and wage employment in all 32 districts, estimating the sector-wise current and future labour demand (in the next 10 years) by industry, and assessing overall the labour supply and estimating the existing and emerging skill gaps. The Skill Gap study offers insights into: (i) which skills are required to support the State’s economic growth, while also catering to the career aspirations of the youth; and (ii) how to design appropriate interventions that will enable active collaboration between various stakeholders for the common good. Workforce demand-projection for the next five years, disaggregated as skilled and semi-skilled workforce requirement has been estimated at the district level. Methodology for Study: Mixed-method research design is adopted encompassing a blend of quantitative and qualitative data collection techniques, and desk research on secondary data sources. Structured into two phases, the first phase of the study comprised a comprehensive desk review of the state’s demography, economy, labour market, educational and skill development profile. The second phase of the study comprised the following:
1. Youth aspiration survey: a quantitative survey covering 360 youth across the following groups - employed (self-employed, wage-employed, employed in formal and informal sectors), students in formal education (higher secondary schools and colleges), vocational and skill training institutions (Polytechnics, ITI), and those who fall under the Not in Education, Employment or Training (NEET) category. Six blocks in the district were covered: R.K. Pet, Thiruvalangadu, Gummidipoondi, Poonamallee, Puzhal and Sholavara
1 Tamil Nadu Skill Development Corporation [https://www.tnskill.tn.gov.in/index.php/link/abouttnsdc] 2 All India Survey on Higher Education 2017-18

12
2. Quantitative employer survey, covering 44 employers with adequate representation from Large, Medium, Small and Micro Industries across the key sectors defining the district economy.
3. Focus Group Discussions (FGD’s) and stakeholder consultations across a wide group of stakeholders including, district-level Industry Associations across priority sectors, officials from various government departments, representatives from various higher education institutions, and training service providers.
Estimation of labour demand and supply were undertaken based on analysis of data from credible sources such as, the Census of India, State and District Income from the Department of Economics and Statistics of Government of Tamil Nadu, data from the Reserve Bank of India and Reports from the National Sample Survey and the Bureau of Labour and Employment. Estimates were further refined based on data on investments, and developments in key sectors, including due consideration to emerging sectors and job roles. The sectors and job roles in demand have been organized into training projects, which are informed by the demand estimations, quantitative survey findings and qualitative consultations. Budgets have been estimated based on the cost categories as defined in the Common Cost Norms released by the Ministry of Skill Development and Entrepreneurship, Government of India3. Key Findings:
Key findings of the study are presented hereunder:
Demographic Analysis
• More than one-third (37%) of the population was between 15-34 years in 2011.
• The median age of the district was 28 years, which is lower than the median age of the state (29 years in 2011), indicating a relatively younger population in the district.
• The population is set to get older with median age in 2026 expected to be around 33.
Economic Analysis
• The economy of Thiruvallur grew at a CAGR of 11% between 2011-12 and 2016-17.
• Livestock (31%) is a major contributor to agriculture and allied sector GVA in the district in 2016-17.
• Industrial sector contribution to the economy was 49% in 2016-17. Manufacturing and Real estate accounted for 69% of the industrial output in 2016-17.
• The key industries include special-purpose machinery, parts and accessories for motor vehicles as per the output and employment of Annual survey of Industries.
• Services sector contributes 48% of the GDDP. The sector grew at a CAGR of 12% between 2011-12 and 2016-17.
Labour Market Analysis
• The district has a lower labour force participation and work participation ratio than the state average (15-29 age group).
• More than two-thirds of the labour force is engaged in manufacturing, trade and repair services, construction and BFSI sectors.
Education & Skill Development
• 5.5% of the district population have undergone any kind of vocational training.
• This is slightly higher than the state (5.1%) and the national average (5.4%).
Findings from Primary Survey
Youth Profile and Aspirations
• 49% of the total respondents are currently engaged in economic activities.
• 98% of the Not in Education Employment or Training (NEET) category respondents wished to work in the future.
• 14% of the respondents aspire for employment in the Public Sector.
• The main factors determining the job aspirations of the youth are salary (wages) / Income (69%), Job Security (51%) Closeness to residence (23%), and Safety and Security (23%).
• 96% of the respondents who were engaged in economic activity perceived that they were completely prepared for requirements related to their job.
• The key factors determining employability of the respondents, were years of work experience (46%), level of education attainment (18%) and soft skills. Team work
3 Common Cost Norms [http://www.minorityaffairs.gov.in/sites/default/files/common%20norms.pdf]

13
(37%), Clear Communication Skills (49%), leadership (21%) and Creativity, originality and initiative (19%) were identified as key skills required to achieve aspired jobs.
Employer & Other Key Stake
holder Perspective
Quantitative Survey
• All the employers used reference from existing employees or known sources as a mode of recruitment.
• More than two third of the industries (80%) surveyed were in operations for more than 10 years.
• The most common challenge faced by employers include the candidate’s disinterest and attitude (84%) followed by high local wages (78%).
• Skilled workers dominated the share of workforce (39%) followed by semi-skilled workers (29%).
• The main causes for the workforce attrition were desire for better job opportunities (65%), worker’s disinterest, and lower wage issues (89%).
Qualitative Inputs
• There is a high shortage of skilled labour to the MSMEs in general and in particular to the industries in the estates.
• Candidates from ITI and polytechnic institutes lack practical skills to work in the shop floor – industries spend around 1-2 months for training the candidates to be industry-ready
• Ambattur Industrial Estate Manufacturers’ Association has training and skill development wing that offers free residential facilities. However, most of the outstation candidates who get trained under AIEMA do not stay for more than a couple of months in the member industries.
• There is a high scope for automation, however, the automation technology must be low cost.
• Present day candidates prefer desk job and supervisory roles rather than shop-floor-level work.
Incremental
Demand
• Estimated Incremental demand of 2.8 Lakh skilled and semi-skilled workers in the district over the next 6 years. Key sub-sectors driving the demand include Manufacturing, Construction, Repair, Healthcare, Tourism among others.
Recommendations: Promotion of skill development in Service sector: Private activity in the service sector can be nurtured to provide local employment to youth at a liveable wage. Construction, trade and tourism, hospitality, retail and logistics can absorb local youth in significant numbers, and provide jobs suited to the needs of youth. Training of trainers: The Training Service Providers should have adequate qualified trainers and upskilling trainings should be given to the trainers about the current industry requirement and technology. Core employability skills to be prioritised: Businesses in the IT-ITES and tourism sectors highlighted the lack of English communication skills among the workers. Skilling interventions must provide foundation course on English communication and basic Information Technology in addition to domain specific training courses. Unified job portal for placements: Youth aspiration findings indicate that youth prefer placement services/ guidance with respect to applying for suitable jobs. A unified job portal for job postings can be developed. Such a portal would enable both employers and candidates to minimize time and effort in finding suitable profiles and vacancies respectively. Creating awareness and conducting counselling sessions: As per youth aspiration survey, only 8 percent of the youth are aware about government run programs and courses. The youth rely on their family and friends for getting information on upcoming job opportunities in the district. Youth are not aware of the industrial estates and the type of sectors employing workforce in the district. There is a need to improve youths’ awareness about the job opportunities through targeted and regular counselling sessions.

14
15
2. District Profile
2.1. Demographic Profile
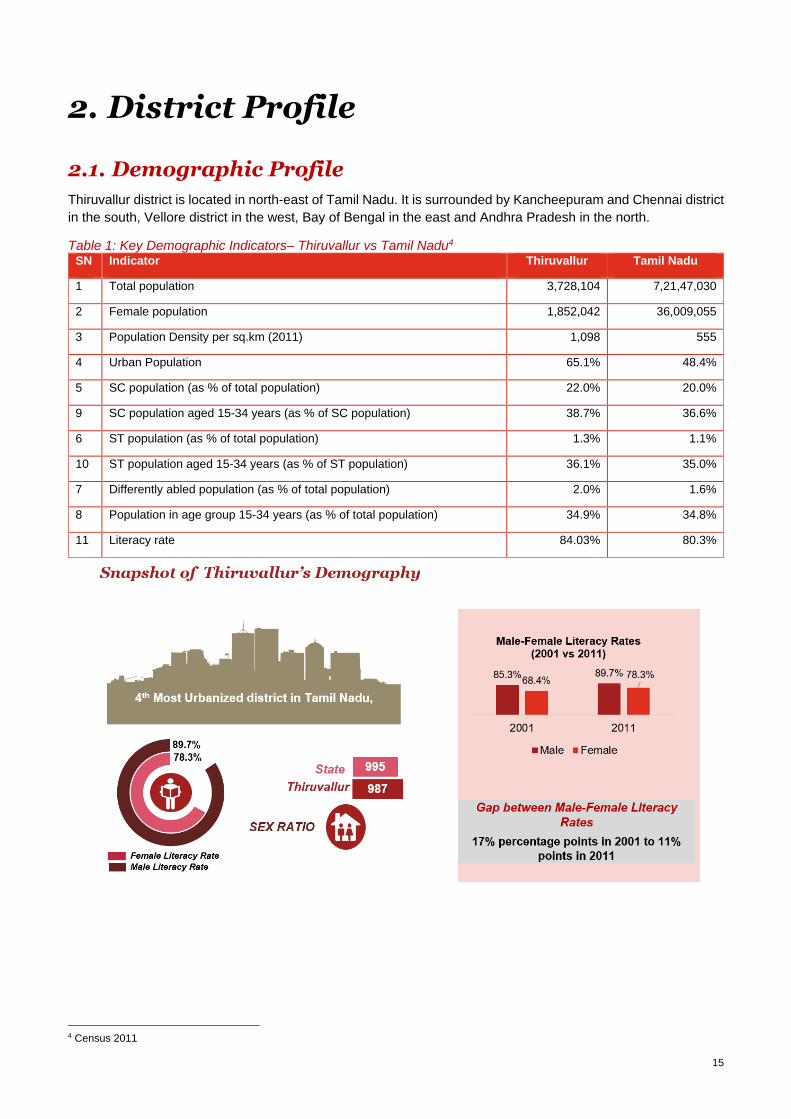
Thiruvallur district is located in north-east of Tamil Nadu. It is surrounded by Kancheepuram and Chennai district
in the south, Vellore district in the west, Bay of Bengal in the east and Andhra Pradesh in the north.
Table 1: Key Demographic Indicators– Thiruvallur vs Tamil Nadu4 SN Indicator Thiruvallur Tamil Nadu
1 Total population 3,728,104 7,21,47,030
2 Female population 1,852,042 36,009,055
3 Population Density per sq.km (2011) 1,098 555
4 Urban Population 65.1% 48.4%
5 SC population (as % of total population) 22.0% 20.0%
9 SC population aged 15-34 years (as % of SC population) 38.7% 36.6%
6 ST population (as % of total population) 1.3% 1.1%
10 ST population aged 15-34 years (as % of ST population) 36.1% 35.0%
7 Differently abled population (as % of total population) 2.0% 1.6%
8 Population in age group 15-34 years (as % of total population) 34.9% 34.8%
11 Literacy rate 84.03% 80.3%
4 Census 2011

16
Key Highlights from the analysis of Census Data:
• Population Growth and Urbanization: The Decadal growth rate of the population in the district was
35.3% between 2001 & 2011, compared to 15.6% at the state level.
• Literacy: The district had a female literacy rate of 78.3% while the male literacy rate of 89.7%. These are
higher than the corresponding literacy rates at the state level. The literacy rates among males increased by
4% while among females it increased by 10%, reducing the gap between them from 17% in 2001 to 11% in
2011.
• Youth Demography: More than one-third (37%) of the population was between 15-34 years in 2011.
The median age during this period was 28 years, which is lower than the median age of the state (29 years
in 2011), indicating a relatively younger population in the district. The population is set to get older with
median age in 2026 expected to be around 33.
Figure 1 Age-wise Population Pyramid of Thiruvallur (2011 vs 2026)5
2.2. Economic Profile Thiruvallur has strong industrial base. The district has many important industries like Madras Refineries, Madras Fertilizers, Manali Petro Chemicals, Madras Rubber Factory (MRF), Ashok Leyland, TI Cycles, Britannia India Ltd, Parry India Ltd and Hindustan Motors. It also boasts of the Ennore Thermal Power Station and the Avadi Tank Factory. The district has 16 Industrial Estates, all in operation, of which 11 were developed by the Government and 5 by private organisations. The district ranks 1st in terms of Per Capita Income and 5th in terms of Purchasing Power.6
5 Age wise Population projected for 2026 based on age group wise life expectancy, birth and death rates 6 PwC Analysis, Household Purchasing Power is calculated from the total purchasing power (disposable income after savings/ investments) of the district, divided by the projected number of households (savings/ investment data calculated from RBI database on savings). A strong correlation exists between the Per Capita GDP, the Banking Sector indicators (adjusted to population) and the consumption expenditure (disposable income) reported under NSSO at the national and state level. This relationship was further verified with data over several years. The state level purchasing power is then further broken down to the district level based on the district level banking data (savings and deposits) and the district level consumption estimates of the NSSO
The rapid rate of urbanisation in Thiruvallur could be a positive force for development of youth and the district when the former is provided with knowledge and opportunities.

17
Figure 2 Key Economic Indicators of Thiruvallur District
2.2.1. Sector Analysis7
Accounting for about 49% of the district output in
2016-2017, the industrial sector dominates the
economy of the district. Thiruvallur is one of the most
prosperous districts with a per capita GDDP being the
highest in the State. This district has seen a decrease
in share of agriculture and allied sector since 2011-
12. The services sector has witnessed a slight growth
from 47.6 % in 2011-12 to 48.5% in 2016-17. The
share of agriculture has gone down by 1.4% between
2011-12 and 2016-17 even when it has grown at a
CAGR of 2%. At sector level, Manufacturing, Real
Estate, Trade and tourism; Construction & BFSI are
the major contributors to the district’s economy.
Table 2: Sector wise- Annual Growth Rate in Thiruvallur (Directorate of Economics and Statistics, TN)
Sector 2012-13 2013-14 2014-15 2015-16 2016-17
CAGR beteen 2011-12 and
2016-17
Agri & Allied 17% 1% 0% 2% -11%
2%
Industry 14% 9% 3% 23% 9%
11%
Services 11% 13% 15% 10% 9%
12%
7 Directorate of Economics and Statistics, Tamil Nadu
3.9% 2.5%
48.5% 49.0%
47.6% 48.5%
2011-12 2016-17
Agri and Allied Industry Services
Figure 3 Sectoral Snapshot of GVA 2016-2017
Figure 4 Share of GSVA by Industry of Origin (2016-2017)

18
Agriculture and Allied Sector
Agriculture and allied sector has grown at a CAGR of 2% between 2011-12 and 2016-17, largely driven by crop cultivation. Major crops grown in the district include rice, cumbu, ragi, green gram, black gram, sugarcane and groundnut. Apart from this, certain horticultural crops like mango, guava and vegetables are also being cultivated. Agriculture accounts for 51% of the agricultural and allied GVA in 2016-17. It is followed by Livestock, which accounts for 31% of the share. Fishing accounted for 12 % of the share of agricultural and allied GVA in 2016-17. There is an increased demand for land for construction due to its close proximity to Chennai metropolitan city and massive urbanisation over the decade. The industrial growth in Thiruvallur district has also created pressure on the land use. The reduction in net area sown 8is attributed to conversion of cultivable land into non-cultivable land for real estate business, as it is an attractive business venture with assured high profits.9
Industrial Sector
Manufacturing (83%) and construction
sectors(15%) account for almost all of the
industrial sector output. This sector is one of the
fastest growing sectors in the district. The sector
has experienced a robust growth with a CAGR of
11% between 2011-12 to 2016-17. The key
manufacturing sectors by output include
Manufacturing of parts and accessories for motor
vehicles, Manufacturing of basic chemicals, fertilizer and nitrogen compounds, plastics and synthetic rubber in
primary forms among others. Manufacturing of wearing apparel, machinery, fabricated metal products and
metalwork employ around 42 % of the workers according to the ASI 2014-15 data.
The industrial development in the district has a fair share of micro and small industries engaged in manufacturing
of various products like leather, textiles and chemicals. The economic activities undertaken by the rural artisans
involve manufacturing of jute, coconut shell products, and palm leaf-based products, paper cups, leather and
Rexene works. Thiruvallur district has a sizeable proportion of people engaged in the handloom sector. Small
and medium size industries engage a large proportion of workers. Following is the list of major factories in
Thiruvallur :-
Major industries
• TVS Motor Company
• Ashok Leyland
• Royal Enfield
• Carborandom Universal
• TI Cycle
• Godrej Company
• Lotto Chocolate Company
• United Breweries Company
• Madras Refineries
• Madras Fertilizers
8 Net sown area is the total area sown with crops and orchards. It represents an area in which total crops are grown only once in a year. 9 https://cdn.s3waas.gov.in/s39431c87f273e507e6040fcb07dcb4509/uploads/2018/05/2018050816.pdf
Figure 5 GVA of Agriculture and Allied Sectors (2016-2017)
Figure 6 Industrial Sector GSVA (2016-2017)
Source: Directorate of Economics and Statistics, TN
83% 15% 2%
Manufacturing Construction Utilities Mining
51% 31% 12% 6%
Agriculuture Livestock Fishing Forestry

19
• Manali Petro Chemicals
• Madras Rubber Factory (MRF)
• Britannia India Ltd, Parry India Ltd
• Hindustan Motors.
Table 3 Profile of Manufacturing Sector from ASI
Industry No. of Units No. of
Employee
Gross Value Added (share in
total GVA)
Share of Employment
Average workers per unit
Manufacture of parts and accessories for motor vehicles
407 52778 18% 22% 130
Manufacture of basic chemicals, fertilizer and nitrogen compounds, plastics and synthetic rubber in primary forms
60 4522 9% 2% 75
Manufacture of basic iron and steel
126 7692 6% 3% 61
Manufacture of bodies (coachwork) for motor vehicles; manufacture of trailers and semi-trailers
23 8694 6% 4% 378
Manufacture of general purpose machinery
201 15546 6% 6% 77
Manufacture of prepared animal feeds
13 4749 6% 2% 365
Manufacture of other fabricated metal products; metalworking service activities
336 10123 4% 4% 30
Manufacture of refined petroleum products
25 5807 3% 2% 232
Manufacture of special-purpose machinery
134 6174 3% 3% 46
Manufacture of wearing apparel, except fur apparel
318 24571 3% 10% 77
Manufacture of non-metallic mineral products
322 7799 3% 3% 24
Manufacture of measuring, testing, navigating and control equipment; watches and clocks
18 2477 2% 1% 138
Manufacture of structural metal products, tanks, reservoirs and steam generators
154 7901 2% 3% 51
Manufacture of beverages 59 2273 2% 1% 39
Manufacture of beverages 59 2273 2% 1% 39
Manufacture of other food products 77 6135 2% 3% 80
Others 1513 77106 27% 32% 51
Auto components cluster in Ambattur
and Gummidipoondi
Leather Cluster in Madhavaram Plastic Cluster in Ambattur
Pharmaceutical Cluster in Alathur Corrugated Box Cluster in Ambatur,
Thiruvallur and Gummidipoondi
Palm Leaves Society in Pulicat,
Key Clusters and Traditional Industries

20
Industry No. of Units No. of
Employee
Gross Value Added (share in
total GVA)
Share of Employment
Average workers per unit
Total 3786 244347 100% 100% 65
Source: Annual Survey of Industries 2014-15
According to the ASI 2014-15, 3786 Industrial units were present in the district, directly employing 2,44,347 workers. The above-mentioned sectors are listed based on their GVA share. Manufacturing of parts and accessories for motor vehicles, manufacturing of basic chemicals, manufacturing of iron and steel, manufacturing of bodies motor vehicles, manufacturing of trailers and semi-trailers, manufacturing of general-purpose machinery and manufacturing of prepared animal feeds were the key industries that contributed overall GVA in the manufacturing sector. Average workers per unit is maximum in manufacturing of coach work for motor vehicles which employs around 378 workers per unit on an average.
Services Sector
Service sector accounted close to half of the sectoral share of the district in 2016-17 period. Real Estate, Trade and Tourism contribute to two-thirds of the total service sector in the district. The sector has grown at a CAGR of 12% during 2011-12 to 2016-17. Real Estate grew at a CAGR of 15% between 2011-12 and 2016-17 while BFSI grew at a CAGR of 11% for the same period. Logistics, Trade and tourism grew at a CAGR of 7% between 2011-12 and 2016-17. Banking and commercial credit network has contributed to the growth of the industrial and services sector in this district with various employment opportunities. Direct financial access with formal banking system has also improved self-employment opportunities, specifically for the women.10 Real estate has boomed due to the rapid urbanisation this district has witnessed over the 2011-12 to 2016-17 period. Other services such as healthcare has also seen a decent growth (9%) as it borders Chennai, which receives huge influx of medical tourist.
10 https://cdn.s3waas.gov.in/s39431c87f273e507e6040fcb07dcb4509/uploads/2018/05/2018050816.pdf
Existing Industrial Estate
• SIDCO Industrial Estate, Tirumazhaisai
• SIDCO Industrial Estate, Kakkalur
• SIDCO Industrial Estate, Ambattur
• SIDCO Industrial Estate, Tirumulaivoyal
• SIDCO Industrial Estate, Gummidipoondi
• SIDCO Industrial Estate, Vichoor
• SIDCO Industrial Estate, R K Pet
• SIPCOT Industrial Estate, Gummidipoondi
• SIPCOT Industrial Estate, Thervaikandigai
• Industrial Estate in Ambattur.
• Industrial Estate in Mugappair
• G.K. Industrial Estate, Porur
• M.M.Industrial Estate, Alapakkam
• Moccaram Industries, Velappan Chavadi Nagappa
• Industrial Estate, Puzhal
• Ekambara Naicker Industrial Estate, Alapakkam
• Mahindra Industrial Park, Gummmidipoondi

21
Figure 7 GSVA of Services Sector (2016-2017)
Traditional sector analysis
Thiruvallur district has got strong base of handicrafts industries. Traditional handicrafts units are spread across the district. Handicraft items such as Embroidery, Gypsy Bead Jewellery, Palm leaf, Stone carving, Cane and Bamboo and Agarbathi have got more recognition outside the district. A total number of 3711 handicrafts units are functioning in the district. Particulars of handicraft units is furnished in the table given below:
Table 4 Handicrafts industries in Cuddalore
SN Handicrafts Artisans
1 Embroidery (various types) 2755
2 Gypsy Bead Jewellery 140
3 Palm leaf 745
4 Stone carving 25
5 Cane and Bamboo 18
6 Agarbathi 28
Source: District Statistical Report Thiruvallur 2016-17
Pulicat Women Palm Leaf Cooperative Society:
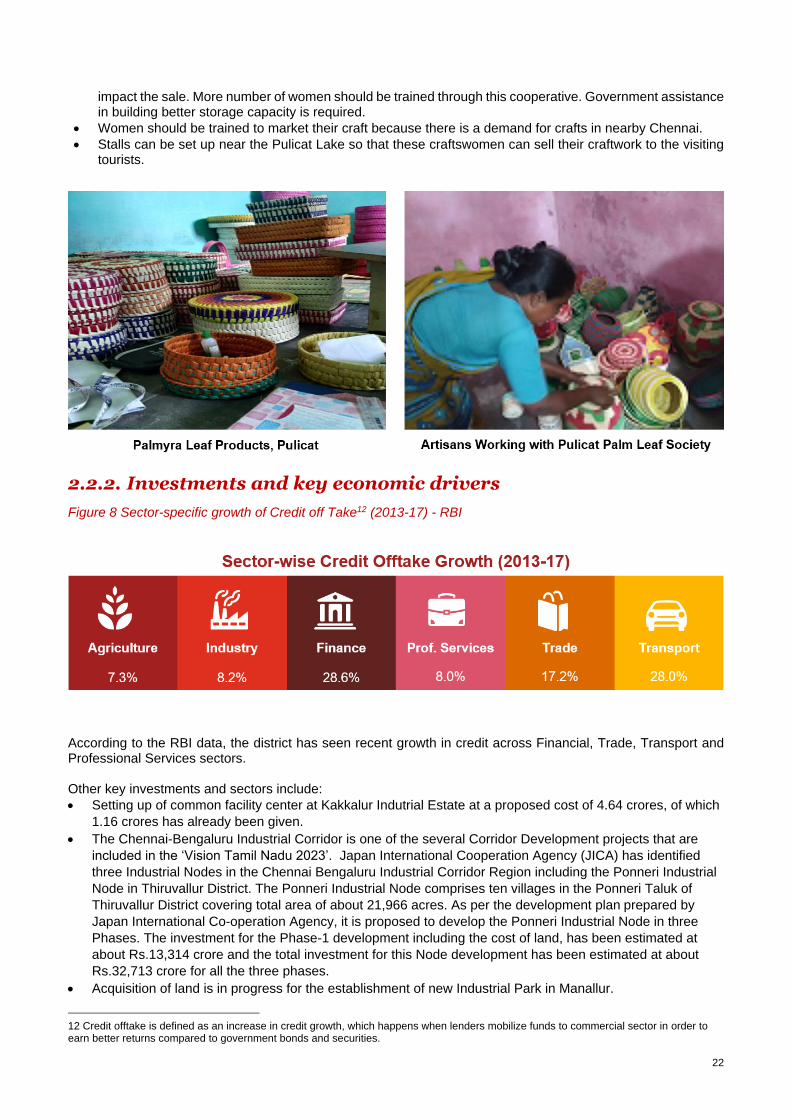
The Pulicat Women Leaf Co-operative Society started in 1958, exports service and beautiful articles made from Palmyra leaves. It is a cottage craft done by women, particularly those of Muslim communities. . The Palm leaves are dried in the sun, their ribs are removed and sorted out, then the leaves are cut into thin strips, dyed in boiling water and again dried. These dried strips are then woven into the desired design. To ensure pliability, the leaves are constantly moisturized during the weaving process. The ribs of the palm leaves are used to provide the framework for the designs11. There are 150-200 women in the cooperative. Craftswomen take order through WhatsApp as well. They make baskets, boxes, Palm and bamboo chests.
Challenges:
• The craftswomen mostly need loans to handle marketing and storage of Palmyra products.
• Raw material required for crafts is available at cheaper prices in Ramanathapuram compared to Thiruvallur. Due to travel as well as monetary constraints, craftswomen buy the raw materials locally at higher prices.
• Travelling for training for most of the women is not possible. Future Scope and Recommendations:
• Crafts are usually made by women in their homes who are part of the Palm Leaf Cooperative. The crafts are sold through cooperatives as they take orders from neighbouring Chennai. The problem occurs when there is an erratic demand for crafts. Lack of proper storage facilities and shortage of craftswomen both
11 http://www.craftcanvas.com/blog/palm-leaf-weavers-from-pulicat
Source: Directorate of Economics and Statistics, TN
58% 14% 11% 8% 5% 2%2%
Real Estate Trade & Tourism Other services Logistics BFSI Communication Public Administration
22
impact the sale. More number of women should be trained through this cooperative. Government assistance in building better storage capacity is required.
• Women should be trained to market their craft because there is a demand for crafts in nearby Chennai.
• Stalls can be set up near the Pulicat Lake so that these craftswomen can sell their craftwork to the visiting tourists.
2.2.2. Investments and key economic drivers
Figure 8 Sector-specific growth of Credit off Take12 (2013-17) - RBI
According to the RBI data, the district has seen recent growth in credit across Financial, Trade, Transport and Professional Services sectors. Other key investments and sectors include:
• Setting up of common facility center at Kakkalur Indutrial Estate at a proposed cost of 4.64 crores, of which
1.16 crores has already been given.
• The Chennai-Bengaluru Industrial Corridor is one of the several Corridor Development projects that are
included in the ‘Vision Tamil Nadu 2023’. Japan International Cooperation Agency (JICA) has identified
three Industrial Nodes in the Chennai Bengaluru Industrial Corridor Region including the Ponneri Industrial
Node in Thiruvallur District. The Ponneri Industrial Node comprises ten villages in the Ponneri Taluk of
Thiruvallur District covering total area of about 21,966 acres. As per the development plan prepared by
Japan International Co-operation Agency, it is proposed to develop the Ponneri Industrial Node in three
Phases. The investment for the Phase-1 development including the cost of land, has been estimated at
about Rs.13,314 crore and the total investment for this Node development has been estimated at about
Rs.32,713 crore for all the three phases.
• Acquisition of land is in progress for the establishment of new Industrial Park in Manallur.
12 Credit offtake is defined as an increase in credit growth, which happens when lenders mobilize funds to commercial sector in order to earn better returns compared to government bonds and securities.

23
• Heavy Engineering Components Manufacturing Hub will be established in an area of about 700 acre in the
Ponneri Taluk of Thiruvallur District. This location will have road connectivity with Kamarajar and Kattupalli
Ports.
• TIDCO and Indian Oil Corporation Ltd have established a Liquefied Natural Gas (LNG) Import, Storage and
Re-gasification Terminal of 5 Million tonne per year capacity at a project cost of Rs.4317 crore in Kamarajar
Port, Thiruvallur District through a joint venture company namely M/s. Indian Oil LNG Private Limited.
• TIDCO is implementing a Polymer Industries Park in Thiruvallur District. TIDCO has taken steps to
establish a Polymer Industries Park through a Special Purpose Company viz., Tamil Nadu Polymer
Industries Park Limited (TPIPL), a Joint Venture of TIDCO and SIPCOT in Voyalur and Kattupalli villages,
Thiruvallur District to accommodate medium and small-scale polymer based manufacturing units under the
Government of India scheme for setting up Plastic Parks. The Department of Chemicals and
Petrochemicals, Government of India has released an amount of Rs.8 crore towards grants-in-aid to TPIPL
out of the total grant of Rs.40 crore sanctioned for this project. TIDCO is also taking steps for establishing a
Heavy Engineering Components Hub in Thiruvallur District.13
• Dawning Developers L P has planned a project titled ‘Thiruvallur Casagrand Crescendo Residential
Project’, a residential construction project in Thiruvallur District.14
• The Government is acquiring land for Northern Port access road for a sum of Rs.951 crores. This is in
process in 15 villages of Ponneri Taluk in Thiruvallur District.15
• Kamarajar Port is developing a Coastal Employment Unit on 315 acres of land, adjacent to the port. This is
being developed under the aegis of Sagarmala Programme.16
• Rs 500 crore project of Yanmar Engine Manufacturing India private limited plant is to be set up in
Gummidipoondi at Mahindra Industrial Park.17
13 http://cms.tn.gov.in/sites/default/files/documents/ind_major_e_pn_2019_20.pdf 14 CAPEX database 15 http://cms.tn.gov.in/sites/default/files/documents/hw_e_pn_2018_19.pdf 16 http://www.ennoreport.gov.in/upload/uploadfiles/files/CEU%20-%20final%2019_10_2017.pdf 17 http://www.newindianexpress.com/cities/chennai/2019/apr/23/26-applications-for-investments-worth-rs-8320-cr-approved-1967735.html

24
2.3. Labour Market Profile18
The overall labour force participation and worker population ratio are lower at the district level compared to the state level. 44% of the workers are wage employed which is significantly higher than the state average. One third of the workers in the district are in casual labour as against the state average of 44%. Youth Unemployment Rate (15-29 years) in the district is less than that of the state average.
Figure 9 Key Labour Market Indicators19
The education-level classification of the district population reveals that the unemployment rate among youth with higher education is very low in the district. Only for people with post-graduate and above education, the unemployment rate is higher with respect to other qualification groups. Close to a third of population with postgraduate and above level of education are not in the labor force. The overall trend suggests a negative correlation between level of education and unemployment levels (except for post-graduates), pointing towards a match between industry demand and supply from the educational institutions in the district.
18 Analysis in this section are based on the District Level Estimates, EUS, 2013-14, Labour Bureau 19 District Level Estimates, EUS, 2013-14, Labour Bureau
Figure 10 Distribution of Working status by Qualification: District Level Estimates
29%
67%
60%
64%
2%
4%
2%
7%
69%
29%
37%
29%
Higher Secondary
Diploma/Certificate
Graduate
Post graduate & above
Employed Unemployed Not in Labour Force
25
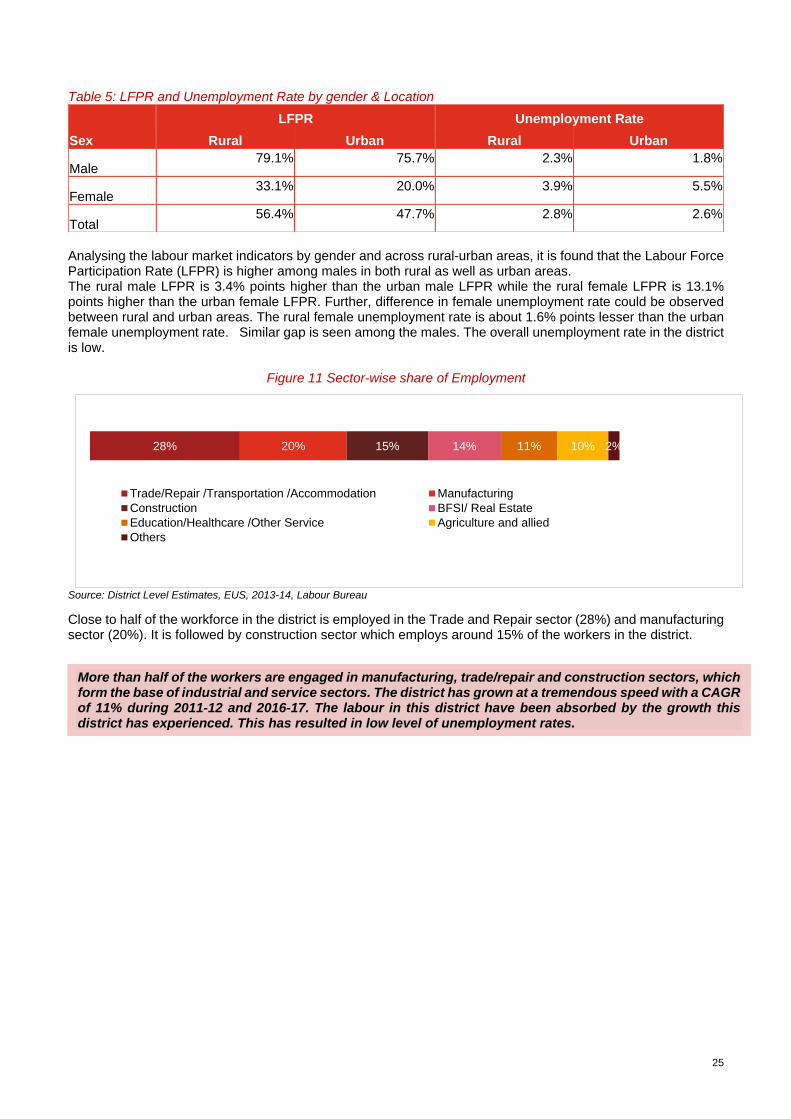
Table 5: LFPR and Unemployment Rate by gender & Location
Analysing the labour market indicators by gender and across rural-urban areas, it is found that the Labour Force Participation Rate (LFPR) is higher among males in both rural as well as urban areas. The rural male LFPR is 3.4% points higher than the urban male LFPR while the rural female LFPR is 13.1% points higher than the urban female LFPR. Further, difference in female unemployment rate could be observed between rural and urban areas. The rural female unemployment rate is about 1.6% points lesser than the urban female unemployment rate. Similar gap is seen among the males. The overall unemployment rate in the district is low.
Figure 11 Sector-wise share of Employment
Source: District Level Estimates, EUS, 2013-14, Labour Bureau
Close to half of the workforce in the district is employed in the Trade and Repair sector (28%) and manufacturing sector (20%). It is followed by construction sector which employs around 15% of the workers in the district.
Sex
LFPR Unemployment Rate
Rural Urban Rural Urban
Male 79.1% 75.7% 2.3% 1.8%
Female 33.1% 20.0% 3.9% 5.5%
Total 56.4% 47.7% 2.8% 2.6%
More than half of the workers are engaged in manufacturing, trade/repair and construction sectors, which form the base of industrial and service sectors. The district has grown at a tremendous speed with a CAGR of 11% during 2011-12 and 2016-17. The labour in this district have been absorbed by the growth this district has experienced. This has resulted in low level of unemployment rates.
28% 20% 15% 14% 11% 10% 2%
Trade/Repair /Transportation /Accommodation Manufacturing
Construction BFSI/ Real Estate
Education/Healthcare /Other Service Agriculture and allied
Others

26
2.4. Education and Skill Development Profile
2.4.1. Education Profile
There are 6 Deemed Universities, 567 Engineering Colleges, 22 Polytechnics and 1447 Schools for General education in Thiruvallur district. There are total of 4,05,627 boys and 3,86,316 girls studying in school for general education.
The Gross Enrolment Ratio20 at both Primary and Upper Primary are higher than the state average. The ratio indicates that the number of students in the district outstrip the expected population in the age cohort by a significant margin. One of the reasons is the presence of several schools, catering to students from the neighbouring district Chennai. The drop-out rates are at 1.9% at the primary level but is quite low at 0.9% at the upper primary level.
Thiruvallur has 22 Polytechnic colleges in the district with a total enrolment of 18,623 students. There are 12 General Arts & Sciences Colleges with an enrolment of 20,672 students. There are four women’s Arts and Science colleges in the district. Apart from this, the district has four Pharmacy colleges, one medical college, one hotel management college and one dental college.
Table 6 Institutions of Higher Education in Thiruvallur District21
S.No Institution Type No of Institutions
Students
Males Females Total
1. Engineering Colleges 567 95,903 48,030 1,43,933
2. Universities 6 14,858 10,067 24,925
3. Polytechnics 22 4,344 358 4,702
4. Industrial Training Institute (ITI) 18 - - 3,276
2.5. Vocational Education Profile
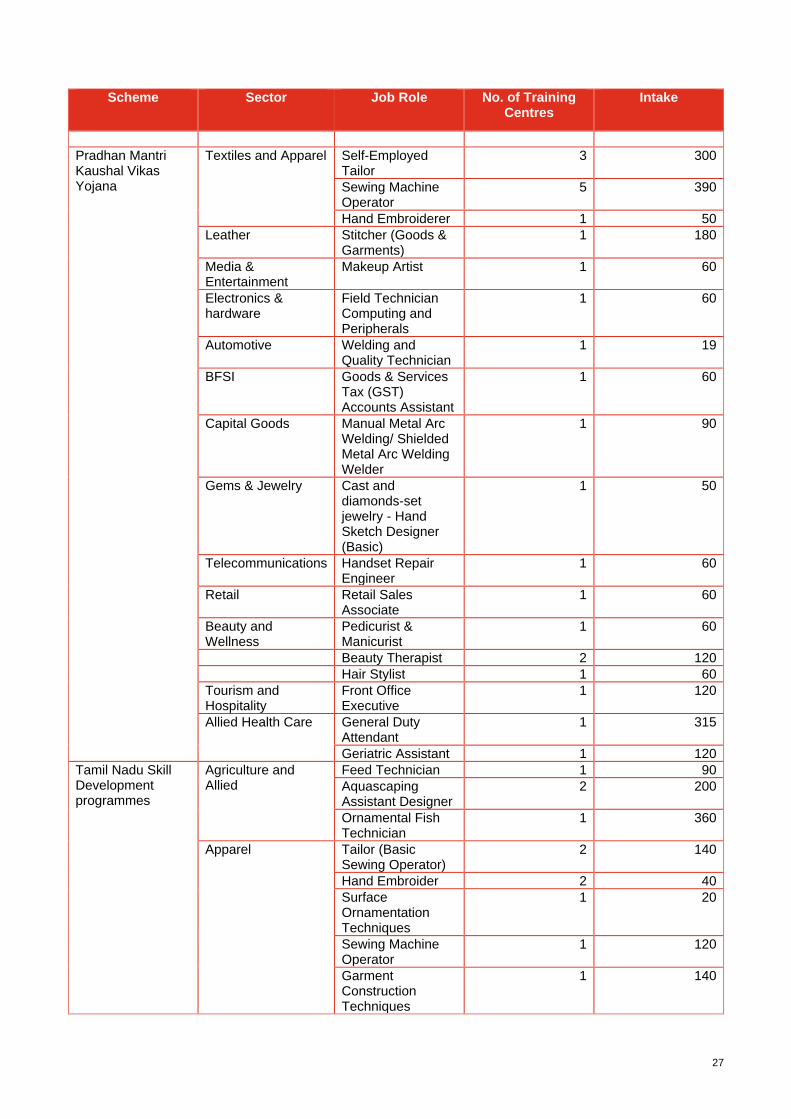
The skill training infrastructures of the district include skill-training centers implementing schemes like TNSDC, Pradhan Mantri Kaushal Vikas Yojana (PMKVY) and Deen Dayal Upadhyay Grameen Kaushal Yojana (DDU-GKY). Under the PMKVY scheme, four training institutes offered courses on sewing machine operator and self-employed tailor.
Table 7 Vocational Training under Short Term Skill Development Programs22
Scheme Sector Job Role No. of Training Centres
Intake
Deen Dayal Upadhyay Grameen Kaushal Yojana
Construction Healthcare Electrical IT/ITeS Retail Apparel Electronics Automotive
- 8 2,311
20 Gross enrolment ratio (GER) is defined as Total enrolment in elementary education, regardless of age, expressed as a percentage of the
official age-group of the population which corresponds to the elementary education in a given school year. The GER shows the general level of participation per stage of school education. 21 District Statistical Handbook, Govt. of Tamil Nadu 22 2017-2018 training year report.
Figure 12 GER and Drop-out Rates - DISE
27
Scheme Sector Job Role No. of Training Centres
Intake
Pradhan Mantri Kaushal Vikas Yojana
Textiles and Apparel Self-Employed Tailor
3 300
Sewing Machine Operator
5 390
Hand Embroiderer 1 50
Leather Stitcher (Goods & Garments)
1 180
Media & Entertainment
Makeup Artist 1 60
Electronics & hardware
Field Technician Computing and Peripherals
1 60
Automotive Welding and Quality Technician
1 19
BFSI Goods & Services Tax (GST) Accounts Assistant
1 60
Capital Goods Manual Metal Arc Welding/ Shielded Metal Arc Welding Welder
1 90
Gems & Jewelry Cast and diamonds-set jewelry - Hand Sketch Designer (Basic)
1 50
Telecommunications Handset Repair Engineer
1 60
Retail Retail Sales Associate
1 60
Beauty and Wellness
Pedicurist & Manicurist
1 60
Beauty Therapist 2 120
Hair Stylist 1 60
Tourism and Hospitality
Front Office Executive
1 120
Allied Health Care General Duty Attendant
1 315
Geriatric Assistant 1 120
Tamil Nadu Skill Development programmes
Agriculture and Allied
Feed Technician 1 90
Aquascaping Assistant Designer
2 200
Ornamental Fish Technician
1 360
Apparel Tailor (Basic Sewing Operator)
2 140
Hand Embroider 2 40
Surface Ornamentation Techniques
1 20
Sewing Machine Operator
1 120
Garment Construction Techniques
1 140

28
Scheme Sector Job Role No. of Training Centres
Intake
Assistant Fashion Designer
1 60
Health Care General Duty Attendant (GDA)
1 180
Medical Equipment Technician
1 40
General Duty Assistant
1 60
Automotive Auto Component Assembly Fitter
1 720
Automotive Service Technician (Two and Three Wheeler)
2 640
Automotive Service Technician Level 3
1 500
Bicycle and Tricycle repair
1 40
Casting Technician Level 3
1 100
CNC Operator / Machining Technician L3
1 2980
Commercial Vehicle Driver Level 4
1 10,000
Customer Relationship Executive
1 180
Forging Operator 1 100
Forklift Operator (Driver)
1 1,550
Spare parts Operations Executive Level 3
1 580
Vehicle Assembly Fitter/ Technician
1 100
Welding Technician Level 3
1 1,800
Beauty and Wellness
Beauty Therapy and Hair Styling level One
1 80
Capital Goods CNC Operator - Turning
2 120
CNC Operator Vertical Machining Centre
1 20
CNC Programmer 1 20
Draughtsman Mechanical
2 60
Construction Excavator Operator 1 60
Wheel Tractor Backhoe Loader Machine Operator
1 120
Logistics Logistics Management Associate
1
30

29
Scheme Sector Job Role No. of Training Centres
Intake
Material Management Associate
1
30
Purchase Management Associate
1
30
Store Management Associate
1 30
Supply Management Associate
1
30
Pick & Carry Crane operator
1 160
Forklift Operator 1 160
Inventory Clerk 1 600
Documentation Assistant
1 600
Warehouse Picker 1 400
Store Attendant 1 20
Electricals and Electronics
DTH Set Top Box Installation & Service Technician
1
150
Field Technician Computing and Peripherals
1
150
Solar Panel Installation Technician
1
150
Field Technician AC
1 80
Field Technician Refrigerator
1 80
Electrician Domestic
1 100
Field Engineer RACW
1 200
Gems and Jewellery Foundation Course for Jewellery
1 30
Jewellery Foundation and Appraisal
1 50
IT/ITEs Customer Care Executive (Call Centre)
1
60
CRM Domestic Non Voice
1 120
Web Developer 1 120
Domestic Data entry Operator
1 40
BFSI Accounts Assistant using Tally
1 40
Production and Manufacturing
CNC Turning 1 300
CNC Milling 1 100
Repair Repair and maintenance of Window and Split A.C
1 80

30
Scheme Sector Job Role No. of Training Centres
Intake
Retail Senior Sales Person ( Retail)
1 30
Sales Person ( Retail)
1 100
Trainee Associate 1 80
Sales Associate 1 1000
The long-term skill development programs are predominantly offered through Industrial Training Institutes, which offer one and two year programs in various sectors and trades. The below table presents the courses offered through ITI, and the number of such institutes offering each trade/ training for job role.
Table 8 Vocational Training under Long Term Skill Development Programs (ITI)
Scheme Sector Job Role No. of Training Centres
Intake
Industrial Training Institutes (Craftsmen Training Scheme)
Automobiles and Auto Components
Mechanic (Motor Vehicle)
8 210
Capital Goods Draughtsman (Civil)
6 156
Draughtsman (Mechanical)
2 0
Instrument Mechanic
2 78
Plastic Processing Operator
1 42
Sheet Metal Worker
1 21
Welder
5 147
Construction
Carpenter
1 26
Electrician
13 273
Mason (Building Constructor)
1 26
Painter General
1 21
Surveyor
1 52
Electronics & Hardware
Wireman 5 84
Mechanic (Refrigeration and Air-Conditioning)
2 0
Mechanic Cum Operator Electronics Communication System
1 0
Mechanic Industrial Electronics
1 0
Infrastructure Equipment
Electronics Mechanic
2 26

31
Scheme Sector Job Role No. of Training Centres
Intake
Mechanic Diesel
2 42
Mechanic Machine Tool Maintenance
1 21
Iron and Steel Machinist 1 16
IT/ ITeS Computer Hardware & Network Maintenance
1 52
Computer Operator and Programming Assistant
3 104
Information Communication Technology System Maintenance
1 26
Mechanic Computer Hardware
1 0
Mining Fitter 14 315
Tourism and Hospitality
Food Production (General)
1 52
Leather Leather Goods Maker
1 0
Plumbing Plumber 1 52
Management and Entrepreneurship & Professional
Secretarial Practice (English)
1 26
Textile and Apparel Sewing Technology 2 21
Figure 13 Proportion Undergone Vocational training 2015-16, MoLE23
Only 5.5% of population aged 15 years and above have undergone vocational training in the district. However, this is higher than the state and national average.
23 Employment and Unemployment Survey 2015-16, Ministry of Labour and Employment
5.5%
5.1%
5.4%
Thiruvallur Tamil Nadu India
32
3. Youth Perspective
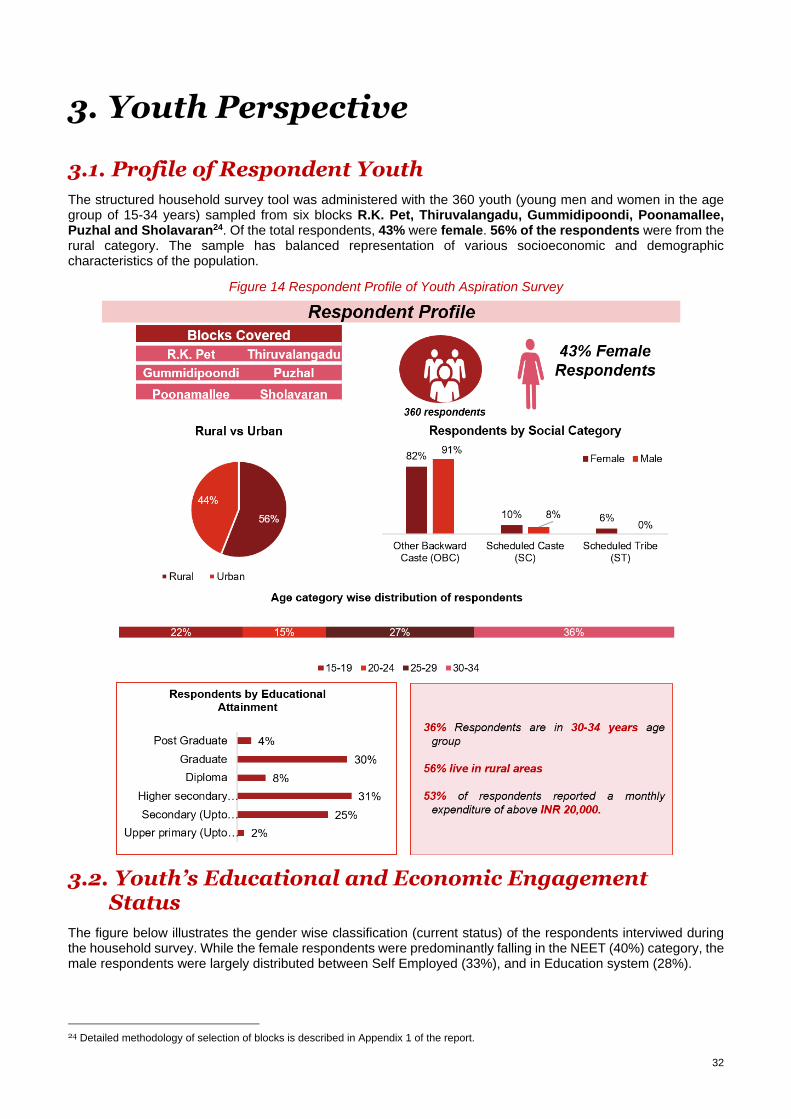
3.1. Profile of Respondent Youth
The structured household survey tool was administered with the 360 youth (young men and women in the age group of 15-34 years) sampled from six blocks R.K. Pet, Thiruvalangadu, Gummidipoondi, Poonamallee, Puzhal and Sholavaran24. Of the total respondents, 43% were female. 56% of the respondents were from the rural category. The sample has balanced representation of various socioeconomic and demographic characteristics of the population.
Figure 14 Respondent Profile of Youth Aspiration Survey
3.2. Youth’s Educational and Economic Engagement Status
The figure below illustrates the gender wise classification (current status) of the respondents interviwed during the household survey. While the female respondents were predominantly falling in the NEET (40%) category, the male respondents were largely distributed between Self Employed (33%), and in Education system (28%).
24 Detailed methodology of selection of blocks is described in Appendix 1 of the report.

33
Figure 15 Current Status of Respondent by gender
3.3. Economic Engagement of the Youth
49% of the total respondents are currently engaged in economic activities.
78% of the respondents who had ever engaged in an economic activity and currently working reported that they were employed in a field related to their education/ training.
Figure 16 Distribution of Respondents across Monthly Income Category across gender
49% of the female respondents reported that they receive less than INR 10,000 monthly. 52% of the male respondents reported that their monthly income is less than INR 15,000. Lower wages have been a major reason for out migration amongst locals in the district. 19% of the male respondent got income more than 20,000 while only 13% of the female respondents got more income for the same category.
Among those with education of higher secondary and above, salaried employment is the most common form of economic activity. It is followed by business/ trade/manufacturing. It is important to note that most of the skilled work for tailor/mason was done by respondents with education levels lower than the higher secondary level.
Table 9 Education Qualification of Respondents and Employment Type
Primary Upper Primary
Secondary Higher secondary
Diploma Graduate Post Graduate
Farm Activities 100% 29% 2% 3% 0% 0% 0%
Unskilled worker 0% 29% 17% 4% 0% 0% 0%
Salaried Employment (teacher, government official, etc.)
0% 0% 13% 36% 69% 59% 88%
Skilled worker (tailor, mason, electrician, plumber etc.)
0% 14% 15% 22% 8% 4% 0%
Petty Business/Trade/ Manufacturing
0% 29% 50% 34% 23% 37% 13%
n=360
n=180
40%
11%
23% 26%
14%
33%28%
25%25% 24% 26% 25%
NEET Self Employed Student Waged/salaried employed
Female Male Total
5%
44%
33%
4%9%
4%2%
12%
40%
27%
11%8%
Less than 5000 5001 - 10,000 10,001-15,000 15,001-20,000 20,001-25,000 Above 25,000
Female Male

34
Major Business/Trade/ Manufacturing
0% 0% 2% 0% 0% 1% 0%
Number of Respondents
2 7 46 67 13 82 8
Figure 17 Youth survey findings across categories
3.4. Youth under NEET Category
25% of the total respondents were neither in employment, nor in education nor in any training.
40% of the NEET category respondents were females. 87% of the NEET respondents reported to have completed their Diploma course and 35% had completed their graduation.
While most of the respondents in NEET category have been in it for more 1 year (92%). 97% of the female respondents in the NEET category have been in the category for more than a year.
98% of the female NEET respondents and 97% of the male NEET respondents, wish to work in the future. 39% of the male respondents and 21% of the female respondents in the NEET category are actively seeking work opportunities.
Table 10 NEET Category Respondents
Duration in NEET Category (n=91)
Wish to Work (n=91)
Female Male Total Female Male Total
Less than 6 months 0% 14% 4%
Yes 98% 97% 98%
6 months- 1 year 3% 7% 4% Total 61 28 89
1- 2 years 24% 45% 31% Actively Seeking Work (n=73)
2- 3 years 34% 7% 25% Female Male Total
3 - 4 years 5% 14% 8%
4 - 5 years 0% 3% 1% Yes 21% 39% 27%

35
More than 5 years 34% 10% 26% Total 13 11 24
3.5. Youth Career Aspiration
The youth in the district have preference for wage / salaried employment (28%) and with the private sector (26%). Both female and male respondents have shown similar interest in the pursuit of wage employment except for public sector employment where we see that females aspire more than males. Males have a substantially higher interest in self-employment than females. Figure 18 Career Aspiration of Youth
The main factors determining the aspiration of the youth are salary (wages) / income (69%), job security (51%) and closeness to residence (23%).
About 96% of the respondents (all excluding NEET and students) feel they are largely prepared for requirements for a job while only one percent of the respondents feel they are unprepared for jobs. Three-fourth of the respondents feel that the availability of job opportunities is not adequate
Table 11 Career Aspiration - Factors, Preparedness and Availability of Jobs
Factors Determining Aspiration* (n=360)
Responses
Perception of Preparedness for Jobs (n=176)
Responses
Salary (wages) / Income 69% Completely Prepared 61%
Gender suitable role 1% Moderately Prepared 35%
Social Status 15% Somewhat prepared 3%
Traditionally Acquired Skills / Family Business
1% Not Prepared
1%
Flexible work arrangements (location, schedule)
4%
Job Security 51% Availability of Job Opportunities (n=360)
Responses
Opportunities for promotion and career development
4% Neither adequate nor inadequate 1%
Closeness to Residence
23%
Somewhat adequate 13%
Somewhat inadequate 49%
Emigration Prospects 0% Very adequate 7%
Retirement Plans 8% Very inadequate 25%
Safety / Security 23%
No Answer/ Don’t Know 5%
Employer provided benefits and perks
1%
n=360
21%26% 26% 26%
39%
26%
5%
29%31%26%
14%
28%
Self employment Wage/Salaried employmentwith Private Sector
Wage/Salaried employmentwith Public Sector
Wage/Salaried employment
Female Male Total

36
*Multiple response question
Lack of sufficient financial strength was the major challenge faced by youth in pursuing their career aspiration. Other factors include pressure of getting married (13%). 11% of the youth highlighted the lack of guidance or information on appropriate job available.
Table 12 Career Aspiration – Challenges in pursuing desired career *
Challenges (n=360) Responses* Challenges (n=360) Responses*
Lack of family support / social acceptance of girls being engaged in economic activity
2% Lack of jobs locally 13%
Pressure related to getting married
13% Low financial strength 19%
Lack of guidance / information on appropriate job available for skill levels
11% Inadequate infrastructure to access work-place
5%
Lack of sufficient education qualification
5% Unsafe working environment 2%
Lack of technical / vocational skills
4% Others 1%
Lack of work experience 10%
*Multiple response question, responses may add up to more than 100%
The key factors determining their employability, according to the respondents, were years of work experience (46%), level of education attainment (18%) and soft skills (17%). Team work (37%), Clear Communication Skills (49%), leadership (21%) and Creativity, originality and initiative (19%) were identified as key skills specific to achieve their aspired jobs. While 21% respondents had already taken steps to meet these requirements, 8% respondents were looking to continue education and 76% were looking for apprenticeships.
Table 13 Key Requirements to enhance employability and steps to achieve aspirations
Key Requirements to enhance employability* (n=360)
Requirements Responses Requirements Responses
Basics and soft skills 17% Performance in Interviews 9%
Certifications of Technical Skill 5% Relevant work experience in similar position or field
6%
Education attainment (level of education) 18% Years of Work Experience 46%
Institution of Education / Skill Training 0%
Key Skills Required for desired job*
Analytical thinking 32% Creativity, originality and initiative 19%
Team work 37% Coordination Skills 10%
Clear communication 49% Attention to detail 1%
Complex problem-solving 1% Time management 1%
Leadership 21% Critical thinking and analysis 3%

37
Active listening 19% Others 1%
New Steps to achieve aspirations*
Steps Responses Steps Responses
Vocational/ Skill Training 0% Already Achieved 21%
Continuing Education 8% Apprenticeship / Gathering Work Experience
76%
*Multiple response question
Career aspiration and preference of sectors varied across the gender group. Education (10%), Textiles (14%) and manufacturing (12%) were the most preferred sectors among the female respondents while the male respondents preferred sectors like Auto and auto components (9%), Construction (9%), Retail (12%) and manufacturing (12%). However, some of these were the least preferred sectors by the female respondents like auto and construction. The figure below details out the gender wise career aspiration for the youth.
Figure 19 Sectors aspired by respondents
The median wage expectation of all respondents is around ₹22,000. Around 24% of the respondents have expectations of monthly income greater than ₹30,000. Male respondents aspired for higher salaries compared to their female counterparts. 41% of the respondents in the NEET category aspired for a monthly salary ranging between INR 20,001 to 30,000.
Compared to respondents in self-employment where 53% aspired for income above INR 10,001, more (65%) respondents in wage employment aspired for the same.
12%
4%
14%
4%
1%
10%
1%
3%
5%
5%
1%
3%
3%
3%
0%
1%
0%
1%
12%
12%
1%
9%
9%
0%
5%
3%
2%
1%
4%
2%
1%
0%
3%
2%
2%
1%
Other manufacturing
Retail
Textile and apparel
Building, Construction Industry
Auto and Auto Components
Education and Skill Development
Food Processing
Furniture and Furnishing
Banking Financial Services and Insurance
Beauty & Wellness
Electronic & IT Hardware
IT & ITES
Agro-business
Healthcare Services
Media and Entertainment
Tourism, Travel, Hospitality
Iron & Steel
Chemical & Pharmaceuticals
Male Female
N=360
38
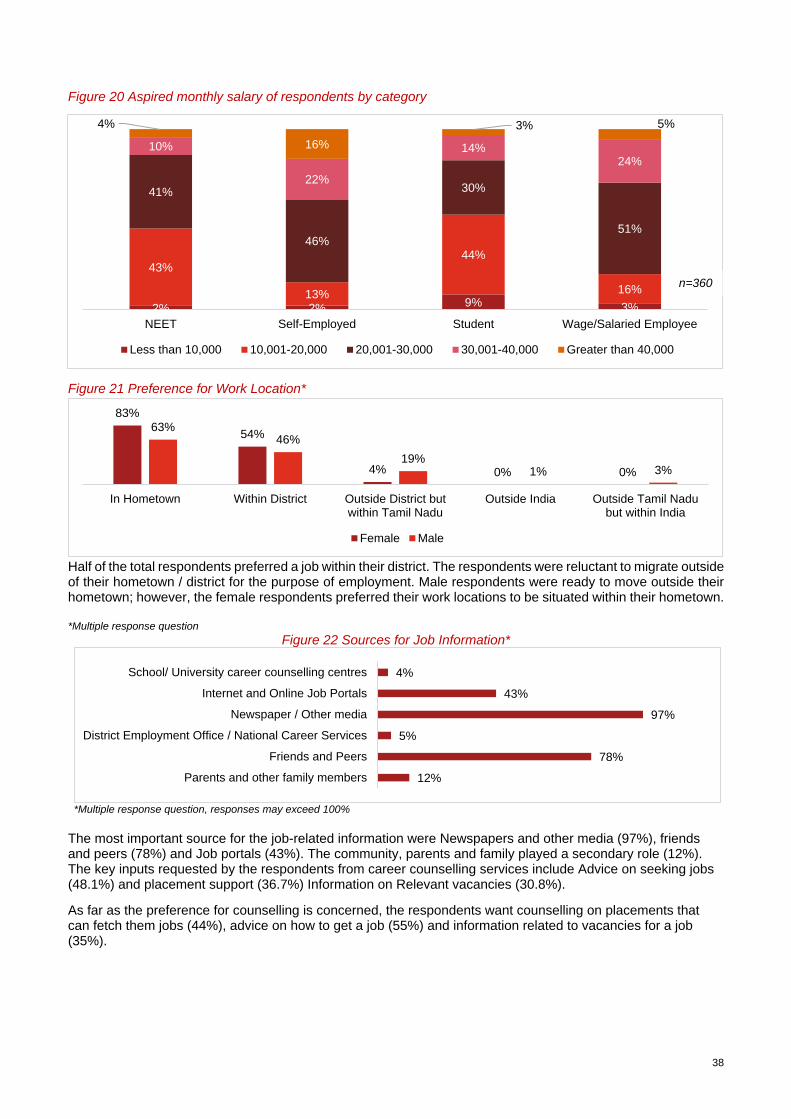
Figure 20 Aspired monthly salary of respondents by category
Figure 21 Preference for Work Location*
Half of the total respondents preferred a job within their district. The respondents were reluctant to migrate outside of their hometown / district for the purpose of employment. Male respondents were ready to move outside their hometown; however, the female respondents preferred their work locations to be situated within their hometown. *Multiple response question
Figure 22 Sources for Job Information*
*Multiple response question, responses may exceed 100%
The most important source for the job-related information were Newspapers and other media (97%), friends and peers (78%) and Job portals (43%). The community, parents and family played a secondary role (12%). The key inputs requested by the respondents from career counselling services include Advice on seeking jobs (48.1%) and placement support (36.7%) Information on Relevant vacancies (30.8%).
As far as the preference for counselling is concerned, the respondents want counselling on placements that can fetch them jobs (44%), advice on how to get a job (55%) and information related to vacancies for a job (35%).
2% 2%9% 3%
43%
13%
44%
16%
41%
46%
30%
51%
10%
22%
14%24%
4%
16%
3% 5%
NEET Self-Employed Student Wage/Salaried Employee
Less than 10,000 10,001-20,000 20,001-30,000 30,001-40,000 Greater than 40,000
12%
78%
5%
97%
43%
4%
Parents and other family members
Friends and Peers
District Employment Office / National Career Services
Newspaper / Other media
Internet and Online Job Portals
School/ University career counselling centres
n=360
83%
54%
4% 0% 0%
63%46%
19%1% 3%
In Hometown Within District Outside District butwithin Tamil Nadu
Outside India Outside Tamil Nadubut within India
Female Male

39
Figure 23 Preference on Counselling Services*
*Multiple response question, responses may exceed 100%
3.6. Skill Training Preferences of the Youth
7.8% of the total respondents had any awareness of Government run vocational programs while around 2.5% had undergone any vocational training previously. Only 8.3% of the respondents were interested in undertaking any vocational training. Of these respondents 60% wanted the trainings to be short term certificate courses and 37% wanted the courses to be part time in nature. Though the respondents weighed most aspects of a training program as being important, they were mostly concerned with on the job training (34.7%), quality of internship/ apprenticeship training (15%) and mentoring (33%).
Figure 25 Skill Training type interested in
35%
55%
21%
28%
44%
8%
Information on relevant vacancies
Advice on how to look for a job
Guidance on applying for training or educational…
Guidance on applying for desirable jobs
Placement for jobs
Placement in educational programmes
Figure 24 Skill Training type interested in
37%
63%
Full-time Part-time
6%
2%
33%
60%
Diploma courses (1 Year to 2 Year duration)
Entrepreneurship/Self-employment specific short termcourses
Short term certificate courses (6 Months to 1 Yearduration)
Short term certificate courses (less than 6 Monthsduration)

40
4. Employers’ and Other Stakeholders’ Perspective
The study covered employers, industrial associations and other key stakeholders to understand the demand side perspectives of skills. The information was collected through quantitative survey. The survey covered 44 Industries from primarily seven sectors, with higher representations from the auto and auto components, machinery equipment and Iron steel and other metals, which are highest contributors to the local economy. 80% of the industries were in operations for more than 10 years. 57% of the industries surveyed reported to be in the medium Industries category. Table 14 Sector wise coverage of Industries in Employer Survey
S.No Sector Number of Industries Surveyed
S.No Sector Number of Industries Surveyed
1. Auto and Auto Components
16 2. Textile and Apparel 1
3. Chemical & Pharmaceuticals
1 4. Machinery Equipment 13
5. Capital Goods 2 6. Plastics 1
7. Iron, Steel and Other Metals
10
Majority of the employers (93%) recruited through employee reference, from either existing employees or known sources as a mode of recruitment. Advertisement in newspaper (53%) was the second most preferred mode of recruitment, followed by campus recruitment (18%). There has been slower uptake of recruitments from Job Melas, social networks or web portals. The most common challenges they face by employers include candidate disinterest and attitude (84%), followed by high local wages (78%) and lack of requisite core skills (11%). Table 15 Modes and Challenges in Recruitment Process*
Key Modes of Recruitment (n=40) Key Challenges faced in Recruitment (n=43)
S.No Particulars % S.No Particulars %
1. Campus recruitment in arts/science/commerce colleges
3% 1. Candidate Disinterest and Attitude 84%
2. Campus recruitment in Engineering Colleges
5% 2. High local wages 78%
3. Campus recruitment in ITIs/Polytechnic
18% 3. Lack of requisite soft skills 3%
4. Employee Reference/ Other Referrals
93% 4. Lack of requisite core skills 11%
5. Recruitment/ Manpower Agencies
10% 5. Lack of Prior Experience 5%
6. Local Community 3% 6. Lack of social acceptance of girls to work in the Community
3%
Figure 26 Distribution of Industries by Size
5%
57%9%
30%
Large Medium Small Micro

41
7. Advertisements in Newspapers
53% 7. Nature of work requires strenuous physical labour
8%
8. Social Networks 5% 8. Work hours 3%
9. Job Melas 5% 9. None 3%
10. Others 10% 10. Others 5%
*Multiple response question
Figure 27 Average distribution of workers by Sex
The surveyed industries were largely dominated by the male workers (86%). 39% of the workers were skilled. Semi-Skilled workers dominated the share of workforce (29%) followed closely by unskilled workers (29%). All the employers stated that they recruited employees from Eastern India. States of Bihar, West Bengal and Odisha were the key sources of migrant workers.
Figure 29 Key causes of Attrition*
*Multiple response question, responses may exceed 100%
Lower wage (89%) and candidates’ disinterests (65%) were the dominant cause of attrition. Better job opportunities, inability to adjust to the work environment were the other causes of attrition in the enterprises.
29% 29%39%
3%
Unskilled Semi-Skilled Skilled Supervisors
Figure 28 Distribution of workers-Skill Levels
86%
14%
Male Female
89%
65%
14%
8%
65%
5%
5%
Lower wage
Better job opportunities
Inability to adjust to work environment
Migrant nature of workforce
Candidate disinterest
Lack of social acceptance of girls to work in the community
Nature of work requires strenuous physical labour

42
Figure 30 Skill Requirement for Workers
The employers stated that domain skill upgradation of the workers need some focus (18%). In addition, 5% employers stated that communication skills trainings are required for the workers. 56% of the employers feel there is high growth prospects in the industries, while 70% of the respondents see some adoption of technology in the future. Among these, only 5% of the respondents have already initiated plans in adoption of technology. Table 16 Growth Prospects and prospective adoption of technology
Growth Prospects of Industry (n=32)
% Level of Technology adoption (n=37)
% Plans to adopt Technology (n=44)
%
High 56% High 5% Yes 5%
Medium 34% Medium 70% No 77%
Low 3% Low 24% Can't Say 18%
Can't Say 6% Can't Say
The employers see a medium to high level demand for both minimally skilled and skilled workers while only 18% of the respondents see medium or high demand for supervisory roles. 90% of the respondents provided some sort of training to their workers. Trainings were largely given for career advancement and domain skills for recruitment and induction.
Table 17 Demand for workers by Skill Level and type of training provided to workers
Demand for Workforce in next 5 years Type of Training Provided for Skilled Workers
Minimally Skilled
Skilled Supervisory Type of Training %
High Demand 16% 19% 6% Induction
6%
Medium Demand
32% 61% 12%
Low Demand 3% 8% 9% Domain Skills on recruitment 6%
None 50% 11% 74% Career Advancement 28%
Others 61%
18%5% 5%
78%
Upgraded Domain Skills Communication Skills Time Management Skills None

43
5. Other Stakeholders’ Perspective
The study also included in-depth interviews of more than 18 stakeholders including District Collector and other line departments involved in the Skill Development, Livelihood and Employment and Industrial development related activities, Industrial Associations, Vocational Education and Skill Development institutions among others. A focus group discussion was conducted with 20 stakeholders from various organizations in sectors such as ceramics, cotton, construction, petro products and auto components.
The following were the key findings from the stakeholder consultations and FGD:
Table 18: Qualitative findings Thiruvallur
S No Topic Responses
1. Awareness of government skill training programs/ jobs/ job melas
• Low level of awareness amongst the workers in the district; they do not know where to search for jobs
• Low level of awareness regarding job fairs that are being conducted locally
• Inadequate awareness of government skill training programs
2. Education- schools, ITI/ Polytechnics/ Engineering colleges in the district
• School curriculum needs to be revised
• Examination and evaluation patterns to be designed such that it can effectively assess the students
• Training institutions do not emphasize practical application of knowledge
3. Manpower – Employment Scale, Status of Migration
• The direct and indirect employment in Ambattur Industrial Estate alone is around 3 Lakh, of which around 60,000 members would be migrant labourers.
• Overall migrant labour in the district is estimated to be around 1.25 lakhs
• At present, the proportion of women workforce in the industries is between 10-20% wherein the employees are engaged in allied activities like packaging, quality control and administrative work.
• Industry associations such as AIEMA are involved in a concerted effort to encourage and increase women employment in the shop-floor.
4. Future Growth Prospects
• Among small-scale industries, around 90% of the companies in the estate are suppliers of auto components to Original Equipment Manufacturers (OEMs) in and around Chennai. There is immense competition – the growth prospects are high; however, there is a pressing need for cost competitiveness.
• In large companies there are considerable growth prospects but large automation is envisaged
5. Skill Gap
• There is a high shortage of skilled labour to the MSMEs in general and in particular to the industries in the estates.
• Candidates from ITI and polytechnic institutes lack practical skills to work in the shop floor – industries spend around 1-2 months for training the candidates to be industry-ready
• AIEMA has in-house training and skill development wing through which candidates are offered residential training (with hostel facility) at free of cost. However, most of the outstation candidates who train under AIEMA do not stay for more than a couple of months in the member industries – there is high labour turnover in the candidates who are trained under through AIEMA
6. Interfacing with training institutions and colleges
• AIEMA is in talks with a leading Chennai-based engineering institution for a unique proposal towards skill development wherein students mandatory project (as a part of the course requirement) shall be done based on the industry requirement – this shall pave way for skilling the students as they would be designing and working on industry-centric projects.

44
S No Topic Responses
7. Pay and Benefits
• A point of concern for the MSMEs in general is the high emphasis on pay by the candidates – this is not in sync with the output of the candidates
• Present day candidates prefer desk-based and supervisory roles rather than shop-floor-level work
8. Scope for women employment
• At present women are engaged in allied activities like packing, quality control
• There is poor response to skilling programmes organised for women – only 23 candidates sign up for such programmes which give skills on welding, fitting.
• Efforts are being made to increase women employment in the shop-floor
9. Automation
• There is high scope for automation, however, the automation technology must be of low cost
10. Regulatory & Policy:
• A pressing concern for the MSMEs in the estate is the requirement of ESI and PF for candidates – since there is uncertainty in the stay of candidates, provision for this is an issue.
11. Emerging sectors
• Logistics, food processing machinery and high-end electricals/electronics are emerging industries in the region. Logistics industry has become more challenging with a number of large companies outsourcing their logistics requirement and now require a number of high-skilled labour in the areas of planning and transport.

45
6. Skill Gap Analysis
6.1. Skill Gap Assessment - Incremental Demand25 for Skilled & Semi Skilled Manpower
As per our methodology for estimating demand and supply, it can be seen that manufacturing, construction, transportation and communication, hotels and restaurants, and trade and repair services show high levels of demand for both skilled and semi-skilled workers. The detailed methodology is described under Appendix 8.2. The table below illustrates the sector wise demand and skill gap for skilled and semi-skilled workers for time period 2019-21 and 2022-25.
Table 19 Sector wise Incremental Demand for Skilled and Semi Semi-Skilled Workers between 2019 and 2025
Sectors
Demand for Skilled Workers
Demand for Semi Skilled Workers
Incremental Total
Demand
2019-21
2022-25 Total 2019-
21 2022-25 Total Total
Allied Activities 144 248 729 1,007 1,736 1,983
Manufacturing 15,574 24,118 39,692 31,149 48,235 79,384 119,076
Electricity, gas, water supply and other utility services
206 293 498 411 586 997
1,495
Construction 3,111 4,838 7,950 7,779 12,096 19,875 27,824
Trade & Repair Services 908 1,284 2,192 3,144 4,445 7,589 9,781
Hotels and restaurants 436 616 1,051 844 1,193 2,037 3,088
Transportation and storage; 1,499 2,126 3,625 3,598 5,103 8,701 12,326
Communication and services related to broadcasting
4,223 6,480 10,703 2,111 3,240 5,351 16,054
Financial and insurance activities
241 329 570 120 164 285 855
Real estate, ownership of dwelling and business services
249 343 592 623 857 1,480 2,073
Public Administration 1,264 1,768 3,032 1,011 1,415 2,426 5,458
Education, Human health & Social Work Activities
5,385 8,256 13,642 4,308 6,605 10,913 24,555
Arts, entertainment and recreation
2,240 3,434 5,674 1,792 2,747 4,539 10,214
Activities of membership organizations; Repair of computers and personal and household goods & Other personal service activities
7,510 11,515 19,025 6,008 9,212 15,220 34,245
Other Services 3,558 5,454 9,012 2,846 4,363 7,210 16,221
Total Demand 46,508
70,998
117,507
66,474
101,268
1,67,742 2,85,249
Total Supply 31,673
42,231
73,904
37,437
49,916
87,353 1,61,257
Total Skill Gap
14,835
28,767
43,602
29,037
51,352
80,389 1,23,992
25 Incremental Demand Estimates the additional stock of workforce that are to be created given the expected Economic Conditions in the
period of study. This may help in estimating requirement for fresh trainings.
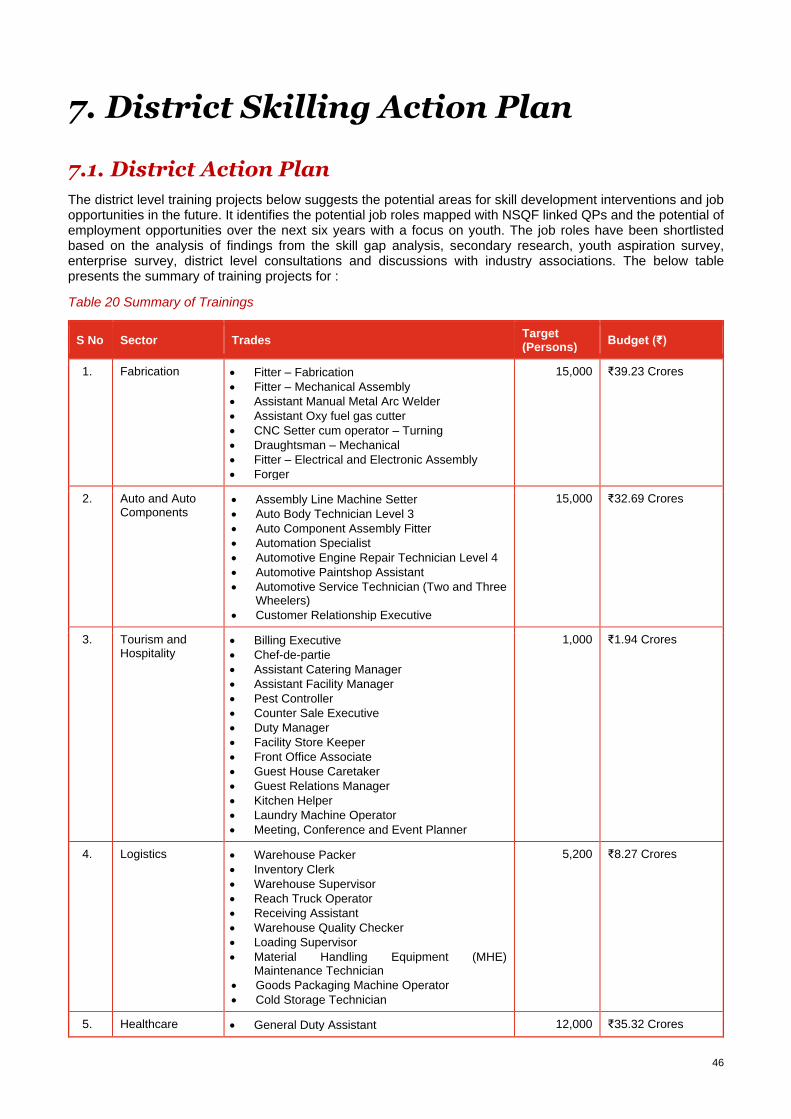
46
7. District Skilling Action Plan
7.1. District Action Plan
The district level training projects below suggests the potential areas for skill development interventions and job opportunities in the future. It identifies the potential job roles mapped with NSQF linked QPs and the potential of employment opportunities over the next six years with a focus on youth. The job roles have been shortlisted based on the analysis of findings from the skill gap analysis, secondary research, youth aspiration survey, enterprise survey, district level consultations and discussions with industry associations. The below table presents the summary of training projects for :
Table 20 Summary of Trainings
S No Sector Trades Target (Persons)
Budget (₹)
1. Fabrication • Fitter – Fabrication
• Fitter – Mechanical Assembly
• Assistant Manual Metal Arc Welder
• Assistant Oxy fuel gas cutter
• CNC Setter cum operator – Turning
• Draughtsman – Mechanical
• Fitter – Electrical and Electronic Assembly
• Forger
15,000 ₹39.23 Crores
2. Auto and Auto Components
• Assembly Line Machine Setter
• Auto Body Technician Level 3
• Auto Component Assembly Fitter
• Automation Specialist
• Automotive Engine Repair Technician Level 4
• Automotive Paintshop Assistant
• Automotive Service Technician (Two and Three Wheelers)
• Customer Relationship Executive
15,000 ₹32.69 Crores
3. Tourism and Hospitality
• Billing Executive
• Chef-de-partie
• Assistant Catering Manager
• Assistant Facility Manager
• Pest Controller
• Counter Sale Executive
• Duty Manager
• Facility Store Keeper
• Front Office Associate
• Guest House Caretaker
• Guest Relations Manager
• Kitchen Helper
• Laundry Machine Operator
• Meeting, Conference and Event Planner
1,000 ₹1.94 Crores
4. Logistics • Warehouse Packer
• Inventory Clerk
• Warehouse Supervisor
• Reach Truck Operator
• Receiving Assistant
• Warehouse Quality Checker
• Loading Supervisor
• Material Handling Equipment (MHE) Maintenance Technician
• Goods Packaging Machine Operator
• Cold Storage Technician
5,200 ₹8.27 Crores
5. Healthcare • General Duty Assistant 12,000 ₹35.32 Crores

47
S No Sector Trades Target (Persons)
Budget (₹)
• Blood Bank Technician
• Cardiac Care Technician
• Diabetes Educator
• Emergency Medical Technician - Basic
• Medical Records & health Information Technician
6. Iron and Steel • Battery Anchorage Regulator
• Battery Operator
• Belt conveyor maintenance
• Cast House Junior Operator
• Conveyor and Other Bulk Material Handling Technician
2,000 ₹4.03 Crores
7. Retail • Cashier
• Retail Sales Associate
• Store Ops Assistant
• Seller Activation Executive
• Digital Cataloguer
• Retail Trainee Associate
4,000 ₹5.32 Crores
8. Construction • Foreman – Electrical Works (Construction)
• Metal Inert Gas/Metal Active Gas/Gas Metal Arc Welder (MIG/MAG/GMAW)
• Mason Marble, Granite and Stone
• Foreman Wet Finishing and Flooring
• Bar Bender and Steel Fixer
• Assistant Electrician
10,000 ₹35.82 Crores
9. Repair • Helper Electrician
• Plumber (General)
• Field Technician – AC
• Field Technician – Refrigerator
• Field Technician - Washing Machine
• Field Technician - Other Home Appliances
2,000 ₹3.74 Crores
Total 66,200 INR 166.36 Crores
Note: 1. The intended target groups are different from the eligibility criteria prescribed as part of the Qualification Pack. Target Group refers to the preferred set of youth who stakeholders have identified are most likely to benefit from the training. This could come from the Aspirations expressed in the Quantitative Survey, feedback from Industry and Govt. Stakeholders. For instance, though a training in handicrafts might require only 5th grade as an eligibility- criteria, the target group would be rural women in a cluster. TNSDC and the TSPs can continue to use the minimum criteria as mentioned in the Qualification Pack; however, qualifications that may constrain an interest-group may appropriately considered on a case- to-case basis (as approved by TNSDC). 2. The QP NOS reference numbers and the training hours have been taken as per the latest QP NOS compilation (as on 17th October 2019). However, in the same compilation, some job roles do not have training hours mentioned. In such cases, we have taken the average training hours for the sector and NSQF level within the sector and applied those as notional hours. We have also used insights from field consultations to arrive at training hour estimates which to reflect the market requirements. 3. An attempt was made to map each proposed job role with a QP NOS reference number. In the cases where accurate mapping has not been possible, we have mapped the job role with the nearest QP NOS reference number. In cases where we have proposed new job roles, we have indicated that a QP NOS reference is to be designed for the same. 4. The Cost of Training has been calculated using the following method: Each job role has training hours, training target (persons), and a cost category. The cost category has been determined by the National Skills Qualification Framework (NSQF) with respect to the level of capital expenditure and operational expenditure for imparting the course aligned to that specific job role. Therefore, each cost category corresponds to a particular cost norm calculated per trainee per hour. The calculations have been done as per the Government order (H-22011/2/2014-SDE-III) issued by MSDE on 4th January 2019. The categories are defined as follows:

48
• INR 42.40 for Category-I
• INR 36.30 for Category -II
• INR 30.30 for Category-III The Cost of training in the project shelves represents the calculation of: (training target × training hours × per hour cost) + (training target × number of days of training × INR 100). Where: Number of days of training = training hours / 8 Transportation costs per trainee per day = INR 100 To the figures arising from the above formula, the training and assessment costs (INR 1,000 per trainee × training target for the whole project) has also been added. The total training cost for each project arrived through such a process has been added to the summary table above.
The training projects are described below:
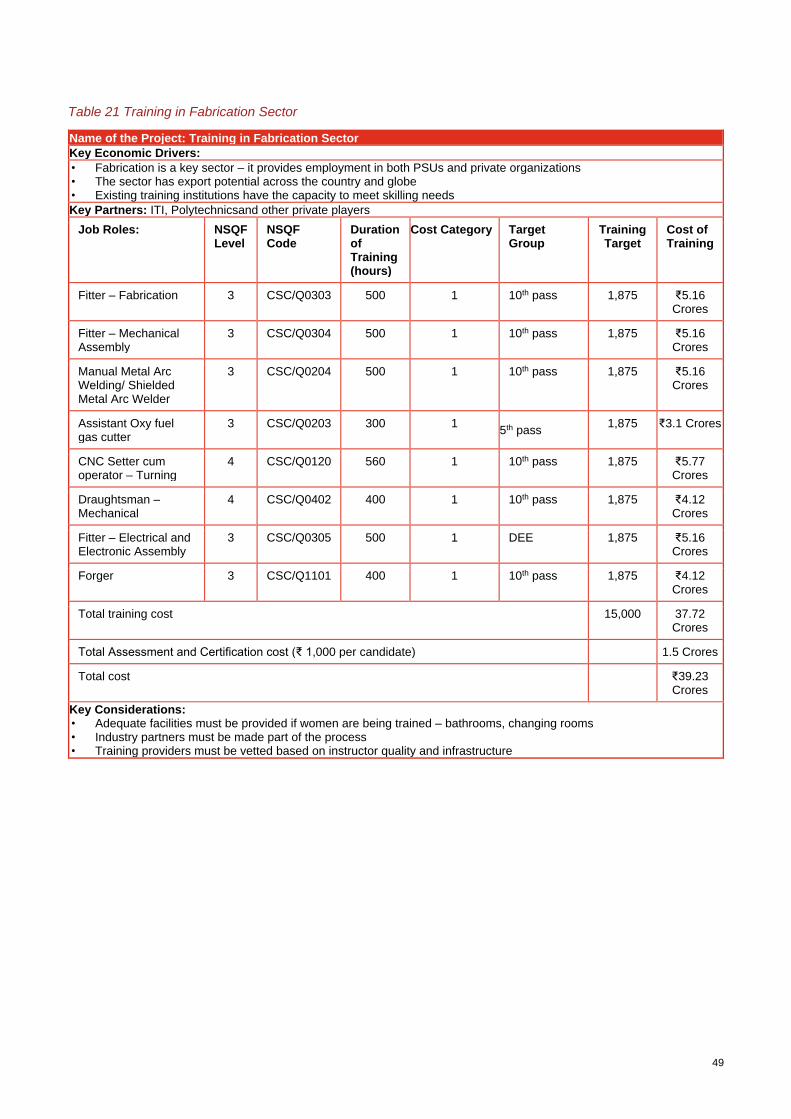
49
Table 21 Training in Fabrication Sector
Name of the Project: Training in Fabrication Sector
Key Economic Drivers:
• Fabrication is a key sector – it provides employment in both PSUs and private organizations • The sector has export potential across the country and globe • Existing training institutions have the capacity to meet skilling needs
Key Partners: ITI, Polytechnicsand other private players
Job Roles: NSQF Level
NSQF Code
Duration of Training (hours)
Cost Category Target Group
Training Target
Cost of Training
Fitter – Fabrication 3 CSC/Q0303 500 1 10th pass 1,875 ₹5.16 Crores
Fitter – Mechanical Assembly
3 CSC/Q0304 500 1 10th pass 1,875 ₹5.16 Crores
Manual Metal Arc Welding/ Shielded Metal Arc Welder
3 CSC/Q0204 500 1 10th pass 1,875 ₹5.16 Crores
Assistant Oxy fuel gas cutter
3 CSC/Q0203 300 1 5th pass
1,875 ₹3.1 Crores
CNC Setter cum operator – Turning
4 CSC/Q0120 560 1 10th pass 1,875 ₹5.77 Crores
Draughtsman – Mechanical
4 CSC/Q0402 400 1 10th pass 1,875 ₹4.12 Crores
Fitter – Electrical and Electronic Assembly
3 CSC/Q0305 500 1 DEE 1,875 ₹5.16 Crores
Forger 3 CSC/Q1101 400 1 10th pass 1,875 ₹4.12 Crores
Total training cost 15,000 37.72 Crores
Total Assessment and Certification cost (₹ 1,000 per candidate) 1.5 Crores
Total cost ₹39.23 Crores
Key Considerations: • Adequate facilities must be provided if women are being trained – bathrooms, changing rooms • Industry partners must be made part of the process • Training providers must be vetted based on instructor quality and infrastructure

50
Table 22 Training in Auto and Auto Components Sector
Name of the Project: Training in Automotive Sector
Key Economic Drivers:
• Auto and auto components sector is a major sector in the district • The sector has growth and export potential
Key Partners: ITI, Polytechnic, TVS , SIDCO, local industry partners
Job Roles: NSQF Level
NSQF Code
Duration of Training (hours)
Cost Category
Target Group Training Target
Cost of Training
Assembly Line Machine Setter
6 ASC/Q3603 450 1 DME/BSc 1,875 ₹4.65 Crores
Auto Body Technician Level 3
3 ASC/Q1410 300 1 10th pass 1,875 ₹3.1 Crores
Auto Component Assembly Fitter
4 ASC/Q3701 400 1 10th pass 1,875 ₹4.12 Crores
Automation Specialist
6 ASC/Q6807 550* 1 Diploma/B.Tech 1,875 ₹5.67 Crores
Automotive Engine Repair Technician Level 4
4 ASC/Q1409 400 1 ITI in Automobile
1,875 ₹4.12 Crores
Automotive Paintshop Assistant
2 ASC/Q3302 250 1 8th pass 1,875 ₹2.59 Crores
Automotive Service Technician (Two and Three Wheelers)
4 ASC/Q1411 450 1 10th pass 1,875 ₹4.65 Crores
Customer Relationship Executive
4 ASC/Q1106 250* 2 12th pass 1,875 ₹2.31 Crores
Total training cost 15,000 31.18 Crores
Total Assessment and Certification cost (₹ 1,000 per candidate) 1.5 Crores
Total cost ₹32.69 Crores
Key Considerations: • Adequate facilities must be provided if women are being trained – bathrooms, changing rooms • Industry partners must be made part of the process • Training providers must be vetted based on instructor quality and infrastructure

51
Table 23 Training in Tourism and Hospitality Sector
Name of the Project: Training in Tourism and Hospitality Sector
Key Economic Drivers:
• The district has a growing hospitality sector due to economic growth and tourism
Key Partners: Hotels in the city, State Institute of Hotel Management and Catering Technology, local colleges
Job Roles: NSQF Level
NSQF Code
Duration of Training (hours)
Cost Category Target Group
Training Target
Cost of Training
Billing Executive 4
THC/Q5801 390* 2 Graduate only
100 ₹0.2 Crores
Chef-de-partie 6
THC/Q0404 285 1 8th pass 100
₹0.16 Crores
Assistant Catering Manager 6
THC/Q5901 475* 2 12th pass 100 ₹0.24 Crores
Assistant Facility Manager 7
THC/Q5707 435 2 DEE 100 ₹0.22 Crores
Pest Controller 4
THC/Q5704 500* 2 8th pass 100 ₹0.25 Crores
Counter Sale Executive 4
THC/Q2903 240 2 12th pass 100 ₹0.12 Crores
Duty Manager 7
THC/Q0106 300* 2 12th pass 100 ₹0.15 Crores
Facility Store Keeper 4
THC/Q5602 475* 2 10th pass 100 ₹0.24 Crores
Front Office Associate 4
THC/Q0102 280 3 12th pass 100 ₹0.12 Crores
Guest House Caretaker 5
THC/Q0501 370 2 10th pass 100 ₹0.19 Crores
Total training cost 1000 1.83 Crores
Total Assessment and Certification cost (₹ 1,000 per candidate) 0.1 Crores
Total cost ₹1.94 Crores
Key Considerations: • Women and college graduates can be targeted • Local employers can provide internships • Language skills can also be imparted

52
Table 24 Training in Logistics Sector
Name of the Project: Training in Logistics Sector
Key Economic Drivers:
• Due to growing trade and manufacturing, logistics (transportation and warehousing) will grow as well
Key Partners: ITI, Polytechnic colleges, engineering and degree colleges
Job Roles: NSQF Level
NSQF Code
Duration of Training (hours)
Cost Category Target Group
Training Target
Cost of Training
Warehouse Packer 3 LSC/Q2303 270 1 8th pass 575 ₹0.86 Crores
Inventory Clerk 3 LSC/Q2108 250 1 12th pass 575 ₹0.8 Crores
Warehouse Supervisor
5 LSC/Q2307 240 1 Diploma/Engg 575 ₹0.76 Crores
Reach Truck Operator
4 LSC/Q2111 300 1 8th pass 575 ₹0.95 Crores
Receiving Assistant 3 LSC/Q2112 290 2 10th pass 575 ₹0.82 Crores
Warehouse Quality Checker
3 LSC/Q2313 300* 3 10th pass 575 ₹0.75 Crores
Loading Supervisor 3 LSC/Q2314 270 2 10th pass 575 ₹0.76 Crores
Material Handling Equipment (MHE) Maintenance Technician
4 LSC/Q2315 280 1 10th pass 575 ₹0.89 Crores
Goods Packaging Machine Operator
4 LSC/Q2216 360* 1 10th pass 600 ₹1.19 Crores
Total training cost 5200 7.74 Crores
Total Assessment and Certification cost (₹ 1,000 per candidate) 0.52 Crores
Total cost ₹8.27 Crores
Key Considerations: • Rural youth can be targeted • Industry partners must be made part of the process

53
Table 25 Training in Healthcare Sector
Name of the Project: Training in Healthcare Sector
Key Economic Drivers:
• Thiruvallur and Chennai is growing and urbanizing, and hence would require an expanded healthcare system • Healthcare sector has scope for young men and women, and career mobility as well • Already well-known for medical tourism.
Key Partners: Hospitals, Nursing Colleges.
Job Roles: NSQF Level
NSQF Code
Duration of Training (hours)
Cost Category
Target Group
Training Target
Cost of Training
General Duty Assistant 4 HSS/ Q5101
240 2 8th pass/10th
pass
2000 ₹2.35 Crores
Blood Bank Technician 4 HSS/ Q2801
1,000 1 12th pass 2000 ₹10.98 Crores
Cardiac Care Technician
4 HSS/ Q0101
840 1 12th pass 2000 ₹9.23 Crores
Diabetes Educator 4 HSS/ Q8701
240 2 12th pass 2000 ₹2.35 Crores
Emergency Medical Technician - Basic
4 HSS/ Q2301
240 1 12th pass 2000 ₹2.64 Crores
Medical Records & health Information Technician
4 HSS/ Q5501
600 1 12th pass 2000 ₹6.59 Crores
Total training cost 12,000 34.11 Crores
Total Assessment and Certification cost (₹ 1,000 per candidate) 1.2 Crores
Total cost ₹35.32 Crores
Key Considerations: • Residential training and part-time training modes should be explored to allow women of all backgrounds to attend

54
Table 26 Training in Iron and Steel Sector
Name of the Project: Training in Iron and Steel Sector
Key Economic Drivers:
• Iron and Steel processing is a significant sector in the district • The Manufacturing Corridor has the potential to give the sector a boost
Key Partners: ITI/ Polytechnic colleges, engineering and degree colleges, local industry players
Job Roles: NSQF Level
NSQF Code
Duration of Training (hours)
Cost Category Target Group
Training Target
Cost of Training
Battery Anchorage Regulator
4 ISC/Q0202 500* 1 ITI/Diploma 400 ₹1.1 Crores
Battery Operator 5 ISC/Q0201 500* 1 ITI/Diploma 400 ₹1.1 Crores
Belt conveyor maintenance
3 ISC/Q0904 390 1 10th pass 400 ₹0.86 Crores
Cast House Junior Operator
2 ISC/Q0406 150 1 8th pass 400 ₹0.34 Crores
Conveyor and Other Bulk Material Handling Technician
3 ISC/Q0103 200 1 10th pass 400 ₹0.44 Crores
Total training cost 2,000 3.83 Crores
Total Assessment and Certification cost (₹ 1,000 per candidate) 0.2 Crores
Total cost ₹4.03 Crores
Key Considerations: • Adequate facilities must be provided if women are being trained – bathrooms, changing rooms • Industry partners must be made part of the process • Training providers must be vetted based on instructor quality and infrastructure
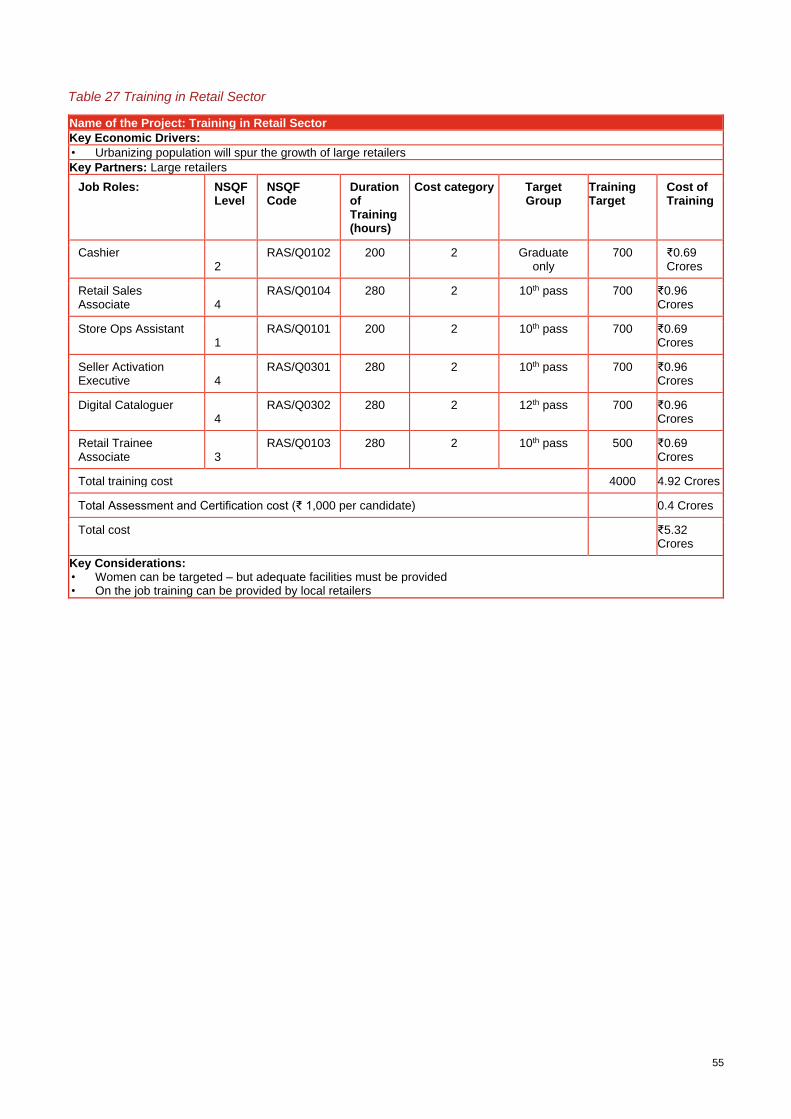
55
Table 27 Training in Retail Sector
Name of the Project: Training in Retail Sector
Key Economic Drivers:
• Urbanizing population will spur the growth of large retailers
Key Partners: Large retailers
Job Roles: NSQF Level
NSQF Code
Duration of Training (hours)
Cost category Target Group
Training Target
Cost of Training
Cashier 2
RAS/Q0102 200 2 Graduate only
700 ₹0.69 Crores
Retail Sales Associate 4
RAS/Q0104 280 2 10th pass 700 ₹0.96 Crores
Store Ops Assistant 1
RAS/Q0101 200 2 10th pass 700 ₹0.69 Crores
Seller Activation Executive 4
RAS/Q0301 280 2 10th pass 700 ₹0.96 Crores
Digital Cataloguer 4
RAS/Q0302 280 2 12th pass 700 ₹0.96 Crores
Retail Trainee Associate 3
RAS/Q0103 280 2 10th pass 500 ₹0.69 Crores
Total training cost 4000 4.92 Crores
Total Assessment and Certification cost (₹ 1,000 per candidate) 0.4 Crores
Total cost ₹5.32 Crores
Key Considerations: • Women can be targeted – but adequate facilities must be provided • On the job training can be provided by local retailers

56
Table 28 Training in Construction Sector
Name of the Project: Training in Construction Sector
Key Economic Drivers:
• Due to urbanization, economics growth and trade, construction sector will also grow
Key Partners: ITI, Polytechnic colleges, engineering colleges
Job Roles: NSQF Level
NSQF Code Duration of Training (hours)
Cost category Target Group
Training Target
Cost of Training
Foreman – Electrical Works (Construction)
5 CON/Q0604 900* 1 10th pass 1800 ₹8.91 Crores
Metal Inert Gas/Metal Active Gas/Gas Metal Arc Welder (MIG/MAG/GMAW)
4 CSC/Q0209 600 1 10th pass 1800 ₹5.93 Crores
Mason Marble, Granite and Stone
4 CON/Q0106 600 1 8th pass 1800 ₹5.93 Crores
Foreman Wet Finishing and Flooring
5 CON/Q0109 800* 1 10th pass 1800 ₹7.91 Crores
Bar Bender and Steel Fixer
4 CON/Q0203 400 1 10th pass 1800 ₹3.96 Crores
Assistant Electrician 3 CON/Q0602 400 1 10th pass 1000 ₹2.2 Crores
Total training cost 10000 34.8 Crores
Total Assessment and Certification cost (₹ 1,000 per candidate) 1. Crores
Total cost ₹35.82 Crores
Key Considerations: • Dropout and rural youth can be targeted • Sustainability can be a focus in training

57
Table 29 Training Repair and services
Name of the Project: Training in Construction,Plumbing, Electronics and Hardware Sector
Key Economic Drivers:
• Repair and service of domestic appliances and personal goods has an incremental demand of around in the district
in the coming years.
Key Partners: ITI
Job Roles: NSQF Level
NSQF Code
Duration of Training
Cost category
Target Group
Training Target
(People)
Cost of Training
(₹)
Helper Electrician 2 CON/Q0601 350 hours 1 10th pass 300 ₹0.5 Crores
Plumber (General) 3 PSC/Q0104 410 hours 1 5th pass 300 ₹0.5 Crores
Field Technician – AC 4 ELE/Q3102 300 hours 2 10th pass 500 ₹1.23 Crores
Field Technician – Refrigerator
4 ELE/Q3103 300 hours 2 10th pass 300 ₹0.45 Crores
Field Technician - Washing Machine
4 ELE/Q3106 300 hours* 2 10th pass 300 ₹0.45 Crores
Field Technician - Other Home Appliances
4 ELE/Q3104 360 hours* 2 8th pass 300 ₹0.45 Crores
Total training cost 2000 3.54 Crores
Total Assessment and Certification cost (₹ 1,000 per candidate) 0.2 Crore
Total cost ₹3.74 Crores
Key Considerations: Youth can be trained to provide services for repair of domestic appliances. ITI and Diploma graduates can also be given in this sector.

58
7.2. Key Recommendations
Recommendation on key interventions that could be considered to foster the participation of youth in the economy are as follows: Promotion of skill development in Service sector: Private activity in the service sector can be nurtured to provide local employment to youth at a liveable wage. Construction, trade and tourism, hospitality, retail and logistics can absorb local youth in significant numbers, and provide jobs suited to the needs of youth. Skill development programs can focus on such sectors, based on consultations with local players and training service providers. Training of trainers: The Training Service Providers should have adequate qualified trainers and upskilling trainings should be given to the trainers about the current industry and technology. There is a need of active professional development intervention for the trainers and a certifying or licensing mechanism should be introduced to ensure that they are adequately updated on the market expertise on a regular basis. Soft-skills and Employability Skills to be prioritised: Across all sectors, employers have identified the lack of inter-personal skills and communication skills among the youth. Businesses in the IT-ITES and tourism sectors representatives have highlighted the particular lack of skills in spoken English. Appropriate skills program including soft skills, communication skills, and spoken English skills need be provided at school / diploma / graduation levels. Unified job portal for placements: Youth aspiration findings indicate that youth prefer placement services/ guidance with respect to applying for suitable jobs. A unified job portal for job postings can be developed. Such a portal would enable both employers and candidates to minimize time and effort in finding suitable profiles and vacancies respectively. To address high wage demand by skilling youth: Low wage is one of the main reasons for candidate’s disinterest towards existing jobs in manufacturing and auto-sector. Work experience is highly valued and pays higher wage. However, this serves as a barrier for youth entering the labour force because they lack experience. In Government ITI and Polytechnics, Industrial visits for students should be made compulsory for the entirety of the course duration. These students should get paid for work each time when they attend these trainings. This will incentivize students to attend these trainings regularly ensuring that these youth get enough experience before they enter the workforce. Creating Awareness and conducting counselling sessions: As per youth aspiration survey, only 8 percent of the youth are aware about government run programs and courses. The youth reply on their family and friends for getting information on upcoming job opportunities in the district. Youth are not aware of the industrial estates and the type of sectors employing workforce in the district. We need to introduce more meaningful awareness drives to bridge this gap. Community engagement through college student volunteers can play an instrumental role in building awareness among both rural and urban clusters of the district. The volunteers can organize awareness camps advocating on various important government schemes and programmes as well as social issues. Career Counselling and awareness campaigns are required across the district and especially in educational institutions. Students of Schools, colleges, polytechnics and training institutions should be exposed to the requirement for skills, economic prospects and career options for progression in a systematic manner through the Dept. of Labour Employment and Training. .

59
Appendix
A.1 Methodology for Block Selection in Youth Aspiration Survey
Sampling Design for Youth Survey A total of 360 youth were surveyed in the District, which included youth in both self-employment and wage-employment, unemployed youth, youth on education system, and youth under NEET category to get a balanced representation of various socioeconomic and demographic characteristics of the population. 1. Students from educational and training institutions: The list of General arts/science/commerce colleges, engineering colleges, polytechnic colleges and Industrial Training Institutions was obtained. A list of educational institutions was randomly sampled from the list. Of the selected institutions, a list of randomly selected students were interviewed. 2. Household Level Survey: In the selected blocks, few villages and wards were randomly selected. After consultation with the head of the village/ward, a sample of households was selected. 3. Self – Employed Youth: To cover Self – Employed Youth in the sample, a roster of beneficiaries from the Pradhan Mantri Employment Generation Programme (PMEGP) shall be randomly selected from the list which will be obtained from the concerned authority at the District level. 4. Employed in the informal sector: The youth from unorganized sector were identified at the cluster-level after obtaining and examining the list of enterprises that are not registered and those workers were doing job-work type of activities Selection of Block The block selection methodology involved the identification of blocks by categorizing them into High development, Medium development and Low development. The adjacent picture shows the blocks in Thiruvallur selected for the survey. The methodology is explained below: To categorize blocks, the following data points were used.
• Count of MSME Clusters (based on DC-MSME Report)
• Number of SIDCO Industrial Estates
• Number of SIPCOT Industrial Estates
• Credit Outstanding, 2017-18 at Centre-level (Annual Data published by the Reserve Bank of India)
The following weights were assigned post award of marks:
• MSME Cluster – 25%
• SIDCO Cluster – 25%
• SIPCOT Industrial Estate – 5%
• Annual Centre-level Credit Data – 45%
Based on the above weights, the total score of each block was calculated. The total score was capped at 100. To classify the block as High/Medium/Low, the total score was converted into percentile values and categorized into three groups – 0-33.33th percentile values, 33.33 to 66.67 percentile value and 66.67 to 100 percentile values. The percentile values are calculated with respect to each district as the base.
Based on the percentile classification obtained, blocks were classified as follows:
• 0 to 33.33 percentile value: Low
• 33.33 to 66.67 percentile value: Medium
Figure 31: Blocks Selected for Survey in Thiruvallur

60
• 66.67 to 100 percentile values: High After deriving the above values for the blocks, two blocks are randomly selected from each category. High- Poonamalle, Gummidipoondi Medium- Sholavaran, Pulal Low- R.K.Pet, Thiruvalangadu
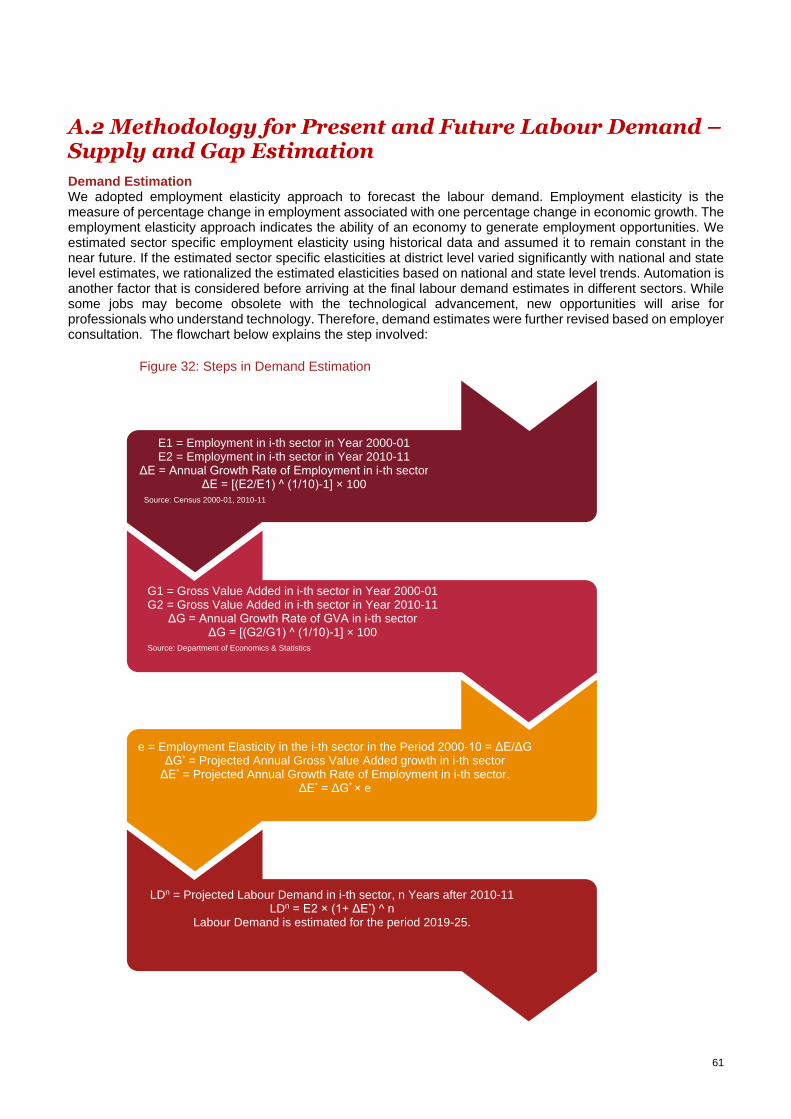
61
A.2 Methodology for Present and Future Labour Demand – Supply and Gap Estimation
Demand Estimation We adopted employment elasticity approach to forecast the labour demand. Employment elasticity is the measure of percentage change in employment associated with one percentage change in economic growth. The employment elasticity approach indicates the ability of an economy to generate employment opportunities. We estimated sector specific employment elasticity using historical data and assumed it to remain constant in the near future. If the estimated sector specific elasticities at district level varied significantly with national and state level estimates, we rationalized the estimated elasticities based on national and state level trends. Automation is another factor that is considered before arriving at the final labour demand estimates in different sectors. While some jobs may become obsolete with the technological advancement, new opportunities will arise for professionals who understand technology. Therefore, demand estimates were further revised based on employer consultation. The flowchart below explains the step involved:
E1 = Employment in i-th sector in Year 2000-01 E2 = Employment in i-th sector in Year 2010-11
ΔE = Annual Growth Rate of Employment in i-th sector ΔE = [(E2/E1) ^ (1/10)-1] × 100
Source: Census 2000-01, 2010-11
G1 = Gross Value Added in i-th sector in Year 2000-01 G2 = Gross Value Added in i-th sector in Year 2010-11
ΔG = Annual Growth Rate of GVA in i-th sector ΔG = [(G2/G1) ^ (1/10)-1] × 100
Source: Department of Economics & Statistics
e = Employment Elasticity in the i-th sector in the Period 2000-10 = ΔE/ΔG ΔG* = Projected Annual Gross Value Added growth in i-th sector
ΔE* = Projected Annual Growth Rate of Employment in i-th sector. ΔE* = ΔG* × e
LDn = Projected Labour Demand in i-th sector, n Years after 2010-11 LDn = E2 × (1+ ΔE*) ^ n
Labour Demand is estimated for the period 2019-25.
Figure 32: Steps in Demand Estimation
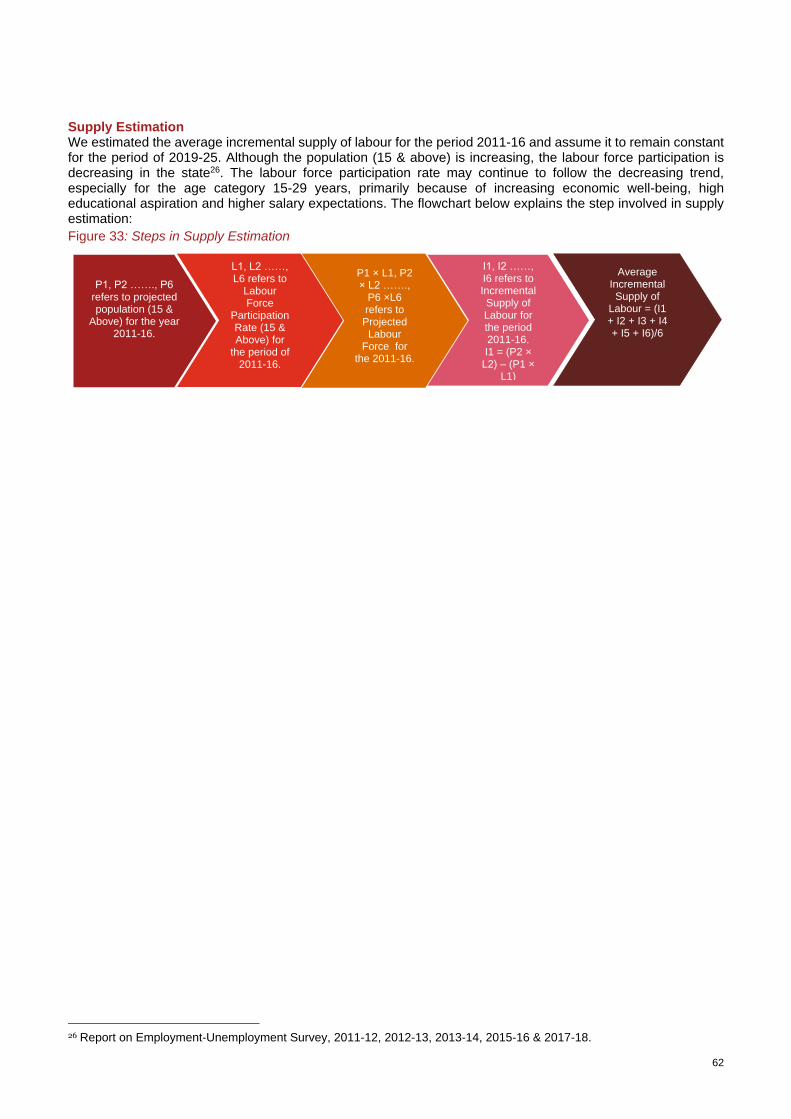
62
Supply Estimation We estimated the average incremental supply of labour for the period 2011-16 and assume it to remain constant for the period of 2019-25. Although the population (15 & above) is increasing, the labour force participation is decreasing in the state26. The labour force participation rate may continue to follow the decreasing trend, especially for the age category 15-29 years, primarily because of increasing economic well-being, high educational aspiration and higher salary expectations. The flowchart below explains the step involved in supply estimation:
26 Report on Employment-Unemployment Survey, 2011-12, 2012-13, 2013-14, 2015-16 & 2017-18.
P1, P2 ……., P6 refers to projected population (15 &
Above) for the year 2011-16.
L1, L2 ……, L6 refers to
Labour Force
Participation Rate (15 & Above) for
the period of 2011-16.
P1 × L1, P2 × L2 …….,
P6 ×L6 refers to Projected Labour
Force for the 2011-16.
I1, I2 ……, I6 refers to Incremental Supply of Labour for the period 2011-16. I1 = (P2 ×
L2) – (P1 × L1)
Average Incremental Supply of
Labour = (I1 + I2 + I3 + I4 + I5 + I6)/6
Figure 33: Steps in Supply Estimation
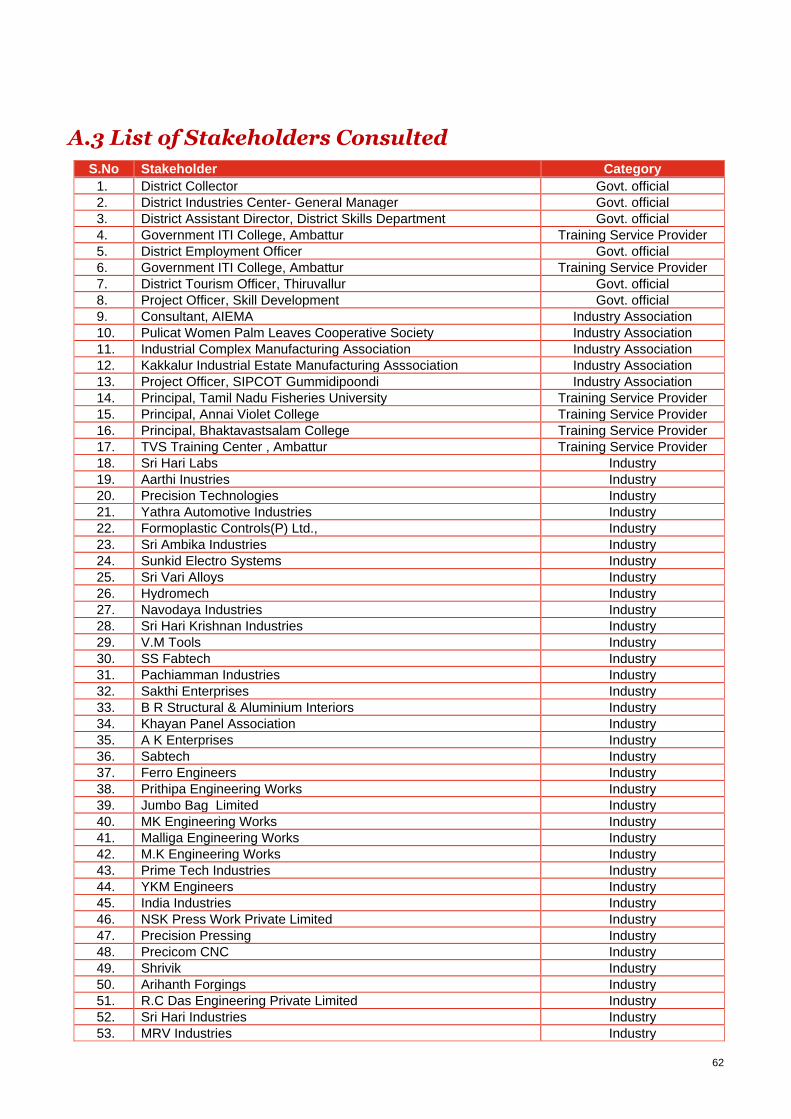
62
A.3 List of Stakeholders Consulted
S.No Stakeholder Category
1. District Collector Govt. official
2. District Industries Center- General Manager Govt. official
3. District Assistant Director, District Skills Department Govt. official
4. Government ITI College, Ambattur Training Service Provider
5. District Employment Officer Govt. official
6. Government ITI College, Ambattur Training Service Provider
7. District Tourism Officer, Thiruvallur Govt. official
8. Project Officer, Skill Development Govt. official
9. Consultant, AIEMA Industry Association
10. Pulicat Women Palm Leaves Cooperative Society Industry Association
11. Industrial Complex Manufacturing Association Industry Association
12. Kakkalur Industrial Estate Manufacturing Asssociation Industry Association
13. Project Officer, SIPCOT Gummidipoondi Industry Association
14. Principal, Tamil Nadu Fisheries University Training Service Provider
15. Principal, Annai Violet College Training Service Provider
16. Principal, Bhaktavastsalam College Training Service Provider
17. TVS Training Center , Ambattur Training Service Provider
18. Sri Hari Labs Industry
19. Aarthi Inustries Industry
20. Precision Technologies Industry
21. Yathra Automotive Industries Industry
22. Formoplastic Controls(P) Ltd., Industry
23. Sri Ambika Industries Industry
24. Sunkid Electro Systems Industry
25. Sri Vari Alloys Industry
26. Hydromech Industry
27. Navodaya Industries Industry
28. Sri Hari Krishnan Industries Industry
29. V.M Tools Industry
30. SS Fabtech Industry
31. Pachiamman Industries Industry
32. Sakthi Enterprises Industry
33. B R Structural & Aluminium Interiors Industry
34. Khayan Panel Association Industry
35. A K Enterprises Industry
36. Sabtech Industry
37. Ferro Engineers Industry
38. Prithipa Engineering Works Industry
39. Jumbo Bag Limited Industry
40. MK Engineering Works Industry
41. Malliga Engineering Works Industry
42. M.K Engineering Works Industry
43. Prime Tech Industries Industry
44. YKM Engineers Industry
45. India Industries Industry
46. NSK Press Work Private Limited Industry
47. Precision Pressing Industry
48. Precicom CNC Industry
49. Shrivik Industry
50. Arihanth Forgings Industry
51. R.C Das Engineering Private Limited Industry
52. Sri Hari Industries Industry
53. MRV Industries Industry

63
54. Super Platers Industry
55. Fabrimac.com Industry
56. Execellent Engineering Industry
57. Devindra Industry
58. Annai Enterprises Industry
59. Globe Components Private Limited Industry
60. Vaasan Engineering Works Industry
61. Sri Vaari Alloys Industry