District of Columbia Tuition Assistance Grant Program ... · Tuition Assistance Grant Program...
18
District of Columbia Tuition Assistance Grant Program (DCTAG) Accomplishments & Facts July 2013
Transcript of District of Columbia Tuition Assistance Grant Program ... · Tuition Assistance Grant Program...

Higher Education Financial Services
DCTAG
District of Columbia Tuition Assistance Grant Program
(DCTAG)
Accomplishments & Facts
July 2013

Higher Education Financial Services
DCTAG
DCTAG Accomplishments
Since DCTAG awarded the first student in 2000 the program:
• helped 19,6641 students enroll in college; • awarded $317.5 2 million to over 600 institutions; and
• celebrated 6,264 3 students’ college graduation.
DCTAG’s: • overall graduation rate4 is 55.5%; and, • six year graduation rate is 48.5%5.
2
1As of April 24, 2013 2 As of academic year 2011/2012 3 As of the 2006/2007 cohort 4 Reflects the 2000/2001 through 2006/2007 cohort 5 As of the 2005/2006 cohort
2

Higher Education Financial Services
DCTAG
1,943
2,944
3,760
4,337 4,759 4,631 4,452 4,580 4,686
5,070 5,103 5,253
DCTAG Enrollment Overall
3
Academic Year 2000/2001 through 2011/2012
The number of students enrolled 2011/2012 increased 1701.4% since 2000/2001. The number of students enrolled 2011/2012 increased 18.0% since 2006/2007.

Higher Education Financial Services
DCTAG
DCTAG Enrollment by High School Type
4
Academic Year 2006/2007 through 2011/2012 (% of Total Across Years)
0.2% 0.6% 1.2% 2.9%
16.0%
27.1%
52.0%
Home School
GED Program
Unknown
Public Outside DC
Charter School
Private
Public

Higher Education Financial Services
DCTAG
DCTAG Enrollment by Ward
5
Academic Year 2006/2007 through 2011/2012 (% of Total Across Years)
* Unknown is primarily Ward of Court students.
Individual years reflects proportions within 1% of all year proportion
6.4%
3.7%
10.0%
20.8%
17.0%
8.6%
18.5%
14.5%
0.4%

Higher Education Financial Services
DCTAG
DCTAG Enrollment by Income
6
Academic Year 2008/2009 through 2011/2012 (% of Total Across Years)
$0.00-$22,000 $22,001-$44,000 $44,001-$63,000 $63,001-$87,000 $87,001 andabove
30.2%
23.1%
12.6%
9.5%
24.6%
Income Range % Change from 2008/2009 to
2011/2012 $0.00-$22,000 34.1%
$22,001-$44,000 -4.2% $44,001-$63,000 -6.2% $63,001-$87,000 -13.4%
$87,001 and above -21.6%

Higher Education Financial Services
DCTAG
DCTAG Enrollment by Income
7
Academic Year 2011/2012 (% of Total)
$0.00-$44,000 $44,001-$63,000 $63,001-$87,000 $87,001 and above
58.0%
11.7% 8.9%
21.4% • The District of Columbia 2011 median household income was $55,2511.
• The U.S. 2011 median household income was $50,0541.
1 U.S. Census Bureau: Median Household Income by State
Higher Education Financial Services
DCTAG
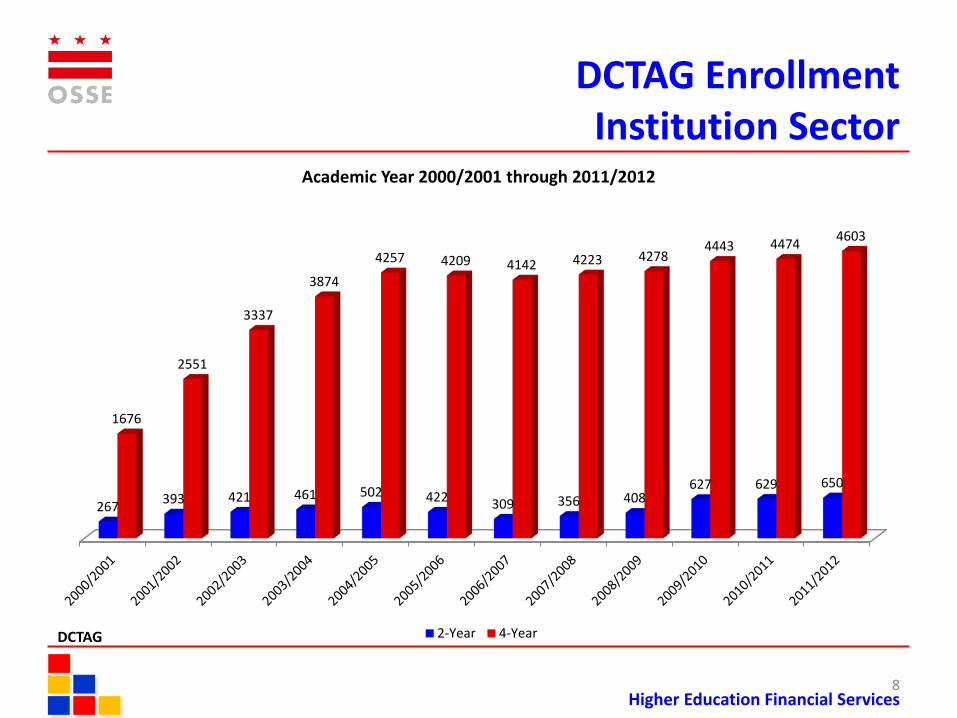
DCTAG Enrollment Institution Sector
8
Academic Year 2000/2001 through 2011/2012
267 393 421 461 502 422 309 356 408 627 629 650
1676
2551
3337
3874
4257 4209 4142 4223 4278 4443 4474 4603
2-Year 4-Year

Higher Education Financial Services
DCTAG
DCTAG Enrollment Institution Type
9
Academic Year 2000/2001 through 2011/2012
465 693
971 1053 1110 960 886 861 944 1033 1084 1103
1478
2251
2789
3284
3649 3670 3566 3719 3742
4037 4019 4150
Private, Non-Profit Public

Higher Education Financial Services
DCTAG
DCTAG Awards
10
Academic Year 2000/2001 through 2011/2012 (Dollars in Millions)
$9.1
$14.7
$20.2
$25.1
$29.0 $30.5
$29.2 $30.5
$30.9 $32.5 $32.4
$33.4
Awards increased 3.4% from 2010/2011 to 2011/2012.

Higher Education Financial Services
DCTAG
DCTAG Awards Average Award Overall
11
Academic Year 2000/2001 through 2011/2012 (Dollars in Thousands)
$4,683
$5,004
$5,362
$5,790
$6,102
$6,580
$6,567 $6,660 $6,590
$6,404 $6,341 $6,368
The 2011/2012 Average award amount increased 0.4% compared to 2010/2011.

Higher Education Financial Services
DCTAG
DCTAG Awards Average Award by Sector
12
Academic Year 2000/2001 through 2011/2012 (Dollars in Thousands)
$2,
816
$2,
905
$2,
951
$3,
098
$3,
259
$3,
505
$2,
084
$2,
121
$2,
121
$2,
175
$2,
034
$2,
083
$4,
968
$5,
320
$5,
670
$6,
097
$6,
424
$6,
872
$6,
896
$7,
037
$7,
012
$6,
993
$6,
940
$6,
973
Avg. 2 Year Avg 4 Year

Higher Education Financial Services
DCTAG
DCTAG Students Paid $10,000 Maximum (per year)
13
Academic Year 2000/2001 through 2011/2012 (Number of Students)
81
202
386
644
922
1,059 1,010
1,223
1,384
1,508 1,518 1,521

Higher Education Financial Services
DCTAG
DCTAG Awards by State
DCTAG Award Range by State (AY 2000/2001 through 2011/2012)
$50M-$67M $30M-$49M $25k-$199k $200k-$1M $0 $1.1M-$29M
74% of DCTAG students cluster close to home attending institutions in: Virginia, Maryland, North Carolina, Pennsylvania, Delaware and the District of Columbia (ranked by awards paid) VI
14

Higher Education Financial Services
DCTAG
DCTAG Awards by State
Academic Year 2011/2012
15
State Students Enrolled
Award Amount State
Students Enrolled
Award Amount State
Students Enrolled
Award Amount
AK 1 $9,656 KY 28 $250,216 OH 146 $1,074,393 AL 39 $233,213 LA 22 $99,674 OK 23 $204,347 AR 13 $35,670 MA 24 $213,040 OR 9 $81,790 AZ 23 $216,160 MD 1161 $6,289,009 PA 527 $4,010,991 CA 33 $260,475 ME 2 $25,000 RI 5 $50,000 CO 31 $283,269 MI 87 $809,830 SC 106 $674,737 CT 5 $50,000 MO 4 $17,963 TN 31 $253,556 DC 548 $1,258,120 MS 6 $50,742 TX 37 $313,496 DE 190 $1,484,611 MT 2 $20,000 UT 3 $20,245 FL 110 $730,000 NC 607 $4,068,245 VA 865 $6,684,731 GA 95 $404,291 NE 1 $10,000 VI 1 $7,980 HI 4 $35,000 NH 13 $99,680 VT 60 $564,888 IA 5 $55,000 NJ 29 $267,910 WA 19 $176,667 IL 4 $33,334 NM 8 $44,080 WI 37 $355,649 IN 22 $181,092 NV 2 $17,435 WV 204 $968,253 KS 7 $48,712 NY 53 $402,390 WY 1 $4,365 Total 5253 $ 33,449,904

Higher Education Financial Services
DCTAG
Academic Year 2011/2012
DCTAG Ten Most Attended States
16
State Students Enrolled
Award Amount
MD 1161 $6,289,009 VA 865 $6,684,731 NC 607 $4,068,245 DC 548 $1,258,120 PA 527 $4,010,991 WV 204 $968,253 DE 190 $1,484,611 OH 146 $1,074,393 FL 110 $730,000 SC 106 $674,737
Higher Education Financial Services
DCTAG
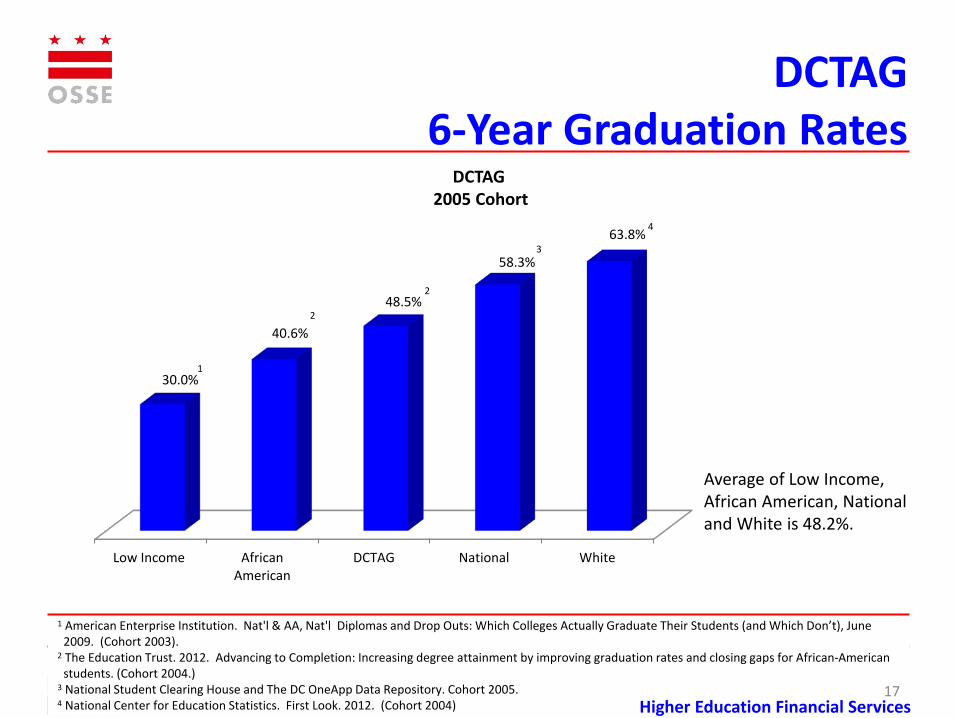
Low Income AfricanAmerican
DCTAG National White
30.0%
40.6%
48.5%
58.3%
63.8%
17
DCTAG 6-Year Graduation Rates
1 American Enterprise Institution. Nat'l & AA, Nat'l Diplomas and Drop Outs: Which Colleges Actually Graduate Their Students (and Which Don’t), June 2009. (Cohort 2003).
2 The Education Trust. 2012. Advancing to Completion: Increasing degree attainment by improving graduation rates and closing gaps for African-American students. (Cohort 2004.)
3 National Student Clearing House and The DC OneApp Data Repository. Cohort 2005. 4 National Center for Education Statistics. First Look. 2012. (Cohort 2004)
17 Higher Education Financial Services
DCTAG 2005 Cohort
1
2
3
4
Average of Low Income, African American, National and White is 48.2%.
2

Higher Education Financial Services
DCTAG
DCTAG Employment
18
DCTAG (graduates and non-
graduates)
National(Bachelor's Degree or
Higher)
National(at Least Some College
Education)
77.7% 73.5%
64.5%
A higher percent of DCTAG survey participants are employed than populations with comparable education levels.
1 Source: Reingold. DCTAG Online Survey. 2 Bureau of Labor Statistics http://www.bls.gov/cps/cpsaat3.pdf
1 2
2