District Human Development Report Kalahandi
220
District Human Development Report Kalahandi Planning Commission Government of India Planning and Coordination Department Government of Odisha
Transcript of District Human Development Report Kalahandi

DistrictHuman Development Report
Kalahandi
Planning CommissionGovernment of IndiaPublished by Planning and Coordination Department, Government of Odisha
Planning and Coordination DepartmentGovernment of Odisha


Planning Commission,Government of India
District Human Development Report
Kalahandi
© 2012
Government of Odisha
Bhubaneswar
Published by:
Poverty and Human Development Monitoring Agency (PHDMA)
Planning and Coordination Department
Government of Odisha
This Report doesn’t necessarily reflect the views of the Government of Odisha, the Planning
Commission, Government of India and the United Nations Development Programme and its
Executive Board.
All rights reserved. No Part of this publication may be reproduced, stored or transmitted in
any form or by any means without the prior permission of the Government of Odisha.
Copy editing, design, lay out and printing by:
New Concept Information Systems Pvt. Ltd.

iii
MESSAGE
I am glad to know that the first District Human Development Report (DHDR) for Kalahandi
district is being brought out by the Planning & Coordination Department, Government of
Odisha in collaboration with the Planning Commission, Government of India and the
United Nations Development Programme (UNDP). This initiative provides a framework
for a people-centric development process. Human Development has been conceived
as a process that enables people to improve their skills, capabilities and choices to live
long, healthy and fulfilled lives.
The first DHDR of Kalahandi attempts to make an independent assessment of the status
of Human Development in that district. It highlights the status of literacy, skills, key health
indicators and livelihood options available to the people of the district and brings
out intra-district variations in respect of identified Human Development indicators. It also
underscores the challenges ahead and offers new opportunities for the people of the district.
It is hoped that this exercise will help in evolving an appropriate development strategy that
ensures effective and efficient use of available resources for furthering wellbeing of the
people and encourages sharing of development benefits and opportunities in an equitable
manner. This joint initiative of the State Government, Government of India and UNDP is a
step in that direction.
I would like to thank the Planning Commission, Government of India and UNDP for their
assistance and support for the preparation of the DHDR of Kalahandi district and look forward
to future cooperation in following up the recommendations of this report.
(NAVEEN PATNAIK)
Message from Chief Minister
NAVEEN PATNAIKCHIEF MINISTER, OdISHa
OdISHa STaTE
Telephone
E. Mail–cmo @ ori.nic.in
D. O. No.
BHUBaNESWaR
Dated ....................................
Fax
(0674) : 2531100 (Off.)(0674) : 2591099 (Res.)(0674) : 2535100 (Off.)(0674) : 2590833 (Res.)

iv
District Human Development Report
Message from Minister, Planning & Coordination Department
MESSAGE
I am glad to know that Planning & Coordination Department, Government of Odisha has
prepared the first District Human Development Report (DHDR) of Kalahandi district with the
support from Planning Commission, Government of India and United Nations Development
Programme (UNDP). It is heartening to note that the District Administration has also taken
keen interest in preparation of the first DHDR of the district.
The major thrust of the DHDR is to prepare a status of "Human Development" in Kalahandi
district, to highlight intra-district variations in key indicators and to set a bench-mark against
which future attainments may be compared. This also identifies gaps in "Human Development"
in the district and draws attention of the decision makers to focus attention on the areas
where further action is required.
I hope the first DHDR of Kalahandi will be well received by different stakeholders and the
decentralized planning process will be suitably reoriented to effectively address the challenges
ahead and meet the reasonable expectations of the people of the district.
(SMT. USHA DEVI)
SMT. USHA DEVI,MINISTER
Handlooms, Textiles & Handicrafts,Planning & Co-ordination, Odisha

v
Message from Chief Secretary
MESSAGE
I am glad that Planning & Coordination Department has prepared the first District Human
Development Report (DHDR) of Kalahandi district. The DHDR aims to provide the current
status of key human development indicators at district and sub-district levels and has, in fact,
given detailed disaggregated analysis of human development indicators.
The report acknowledges the sincere efforts made by the Government to accelerate the
process of development including improving key human development indicators such as
literacy, health status and income levels in Kalahandi. The report has also highlighted several
challenges the district faces in improving human development indicators and accelerating
the process of overall development of its people. This DHDR, which is the outcome of an
interactive process, has provided valuable inputs for preparation of quality district plan. This
report also provides a benchmark against which future attainments may be assessed.
I warmly thank the United Nations Development Programme (UNDP) and Planning Commission,
Government of India for their support and guidance for preparation of this report. I hope
that this report will be well received by the different stakeholders including policy planners,
researchers, people at large and others.
(B. K. Patnaik)
Shri B. K. Patnaik
Chief Secretary and Chief Development Commissioner, Odisha
Phone ( +91 674) 2536700/4300Fax: (+91 674) 2536660
e-mail - [email protected], Jan., 2012

vi
District Human Development Report
Message from Development Commissionercum Additional Chief Secretary
MESSAGE
It gives me immense pleasure to know that the first District Human Development Report
(DHDR) of Kalahandi district is going to be released. This report has been prepared by Planning
and Coordination Department in partnership with the Planning Commission, Government
of lndia and the United Nations Development Programme (UNDP). This report provides
disaggregated data and analysis as regards the current status of key human development
indicators at district and sub-district level.
The concept of “Human Development” is people-centric and a multi-dimensional measure of
the people’s overall well-being based on several socio-economic indicators including income,
literacy, health, reproductive child health, access to safe drinking water and gender issues.
The report captures the efforts made by the Government to improve the delivery of public
services for the people in general and the marginalized groups including the local Scheduled
Tribes, Scheduled Castes and Women in particular. There are, however, several challenges that
need to be tackled for continuously improving human development indicators in the district.
We express gratitude to the Planning Commission, Government of lndia and the United
Nations Development Programme (UNDP) for their support and guidance.
It is sincerely hoped that this report will be of great help to policy makers, researchers and
others. We look forward to constructive comments and suggestions from all concerned who
may find this report useful and have a stake in improving human development conditions in
Kalahandi district and rest of the State.
(Dr. R. N. Senapati)
Dr. Rabinarayan Senapati, IASDevelopment Commissioner-cum-Additional Chief Secretary and Secretary, Planning andCoordination Department,Government of Odisha Bhubaneswar
vii
Message from UNDP
Message
The Government of Odisha is to be commended for preparing the Kalahandi District Human
Development Report, prepared under a partnership between the Planning Commission, the
Government of Odisha and United Nations Development Programme (UNDP) India.
India is a unique example of preparing the maximum number of State and District Human
Development Reports in the world. The experience of India in deepening the understanding
and reporting on human development is highly inspiring for countries across the world.
In very simple terms, human development is defined as the expansion of people’s capability to
lead long, healthy and creative lives and to advance other goals that they cherish. This is, to a
large extent, determined by historical, socio-cultural, institutional, governance, infrastructural,
and geographical or environmental factors.
Kalahandi district presents a pertinent development challenge increasingly being witnessed in
a number of regions across the globe - having human development outcomes commensurate
with the rich endowment that regions have vis-a-vis natural and mineral resources. The
Kalahandi District Human Development Report highlights the inextricable link between human
development outcomes and environmental security. One of the underlying messages of the
District Human Development Report is to promote convergent planning and implementation
to ensure sustainable human development.
One of the highlights of the India experience on human development is the close link
between human development reports and planning processes. The Kalahandi District Human
Development Report provides a sound situation analysis for district planning as well as an
agenda for action which can facilitate progress on human development outcomes. We are
confident that the Kalahandi District Human Development Report will be a strategic document
for district planners.
We once again felicitate the Government of Odisha for preparing the Kalahandi District Human
Development Report and look forward to the key messages of the report being translated into
policy and action that will significantly improve the quality of life for the people of the district.
Caitlin Wiesen
Country Director
Patrice Coeur-Bizot
United Nations Resident Coordinator and
UNDP Resident Representative
United Nations Development Programme
UNDP in India . 55, Lodi Estate, Post Box No.3059, New Delhi 110 003, India. Tel:91-11-2462 8877 Fax: 91-11-2462 7612 www.undp.org.in

viii
District Human Development Report
PREFACE
“Wealth is evidently not the good we are seeking, for it is merely useful for the sake of
something else”. Aristotle said in ancient Greece, which is quite relevant even today when
the Sensex or the GDP of a country has no correlation with the quality of life, its people are
living. This paradox has been solved to quite an extent by Pakistani Economist Mahbub ul
Haq and Indian Nobel laureate Amartya Sen, with the revolutionary concept of ‘The Human
Development Report (HDR)’. It was first launched in 1990 with the single goal of putting
people back at the center of the development process. The goal was both massive and
simple, with far-ranging implications – going beyond income to assess the level of people’s
long-term well-being to bringing about development of the people, by the people, and for
the people, and emphasizing that the goals of development are choices and freedom. The
Human Development reports have been published at national level and state level in past,
however for the first time the district level Human Development Reports are going to be
published for selected five districts in Orissa and Kalahandi being one of them.
Kalahandi is a part of the KBK region of the state i.e., known for its backwardness with
low development indicators. The demographic characteristics of the district reflect that
it is predominantly rural and has a high concentration of weaker sections, i.e., ST and SC
communities. The existing population density is 169 persons per sq.km. though Kalahandi
recorded high population growth in recent times which indicates that the living conditions
in the district have improved because of the several development initiatives taken by the
Government. About 50% of the population in the district is within the working age group
of 15-60 years.
The district is rich in minerals including Bauxite, Graphite, Manganese, Iron and Quartz of which,
only Bauxite and Graphite has been commercially exploited. Other industries include textile,
oil seeds sugar and chemicals. The Upper Indravati hydro power project plays an important
role not only in terms of generating power but also providing irrigation support to farmers.
This has resulted in a shift from mono cropping to multi-cropping patterns in Jayapatna
and its adjacent blocks. The role of this project is immense in changing the food production
scenario of the district from a food deficit to food adequate situation.
Message from District Collector
Smt. Roopa Mishra, IASCollector & District Magistrate Kalahandi

ix
Though, Kalahandi is considered to be one of the severely food insecure districts of the
State, physical availability of food is ensured through local production and support from
the Government through various schematic provisions. A number of schemes have
been implemented in the district like subsidised distribution of food grains through PDS,
supplementary nutritional food through Anganwadis, free food for the aged vulnerable
population under emergency feeding etc. which has contributed significantly in improving
the situation. To ensure food security of the economically poor families, Government of Odisha
has been providing rice at Rs. 2/- per kg.
The District Human Development Report – Kalahandi is prepared with the support of UNDP
and Planning Commission of India with guidance of Planning and Coordination Department,
Government of Odisha. The final shape is the tedious exercise of more than two years as
the process was started during the tenure of Sri R.S. Gopalan, IAS as Collector & District
Magistrate, Kalahandi. The process included a lot of participatory exercises i.e., PRA, FGD etc
along with consultation with PRI representative departmental heads and other development
agencies. The Technical Support Institute, namely C-TRAN played a major role in collecting
and analysing the data of various sector and putting the report in a printable shape. We
would like to thank all the people, departments and agencies, who have contributed to the
preparation of this report.

x
District Human Development Report
Many organizations and individuals have contributed for preparation of the first District
Human Development Report (DHDR) of Kalahandi district. We are grateful to Sj. Naveen
Patnaik, Hon’ble Chief Minister, Odisha, who inspired us to take up the task of preparation of
the first DHDR of Kalahandi. We are also grateful to Sj. A. U. Singh Deo, former Hon’ble Minister,
Planning & Coordination and Excise, and Smt. Usha Devi, Hon’ble Minister, Handlooms, Textiles
& Handicrafts, Planning & Coordination, who lent their wholehearted support for completion
of this assignment.
Shri T. K. Mishra, former Chief Secretary and Chief Development Commissioner and Shri Bijay
Kumar Patnaik, Chief Secretary and Chief Development Commissioner, Odisha both guided
us during the tedious process of preparation of this DHDR. This document would not have
been completed without full support and guidance of Shri S. P. Nanda, former Development
Commissioner-cum-Additional Chief Secretary and Dr. R.N. Senapati, Development
Commissioner-cum-Additional Chief Secretary. Their guidance and support are gratefully
acknowledged.
We sincerely thank the District Administration of Kalahandi for their support. Shri R.S. Gopalan
and Smt. Roopa Mishra, both former Collectors of Kalahandi district and Shri Dukhishyam
Satpathy, Collector, Kalahandi steered the process for completion of this report. They were
ably assisted by Shri Bimbadhar Sethy, Deputy Director and his team at DPMU, Kalahandi.
Various District Level Officers provided their inputs to facilitate this report. The co-operation
and support of all is greatly appreciated and acknowledged.
This exercise would not have been possible without full support and guidance from Planning
Commission, Government of India and United Nations Development Programme (UNDP). In
particular, Ms. Caitlin Wiesen, Country Director, UNDP, Dr. K. Sita Prabhu, Ms. Sumeeta Banerji,
Ms. Ritu Mathur, Dr. Ambika Prasad Nanda and others from UNDP were of great help. We also
thank the United Nations Joint Programme on Convergence team including Ms. Shairose Mawji,
local head of UNICEF and Dr. Hemant Dwivedi, local head of UNFPA, which provided valuable
inputs for preparation of this report. Shri Tuhin K. Pandey, Joint Secretary (Plan Coordination),
Shri Rajat Sachar, Director (RD), Dr. Indu Pattnaik, Joint Adviser, and Shri K. K. Tripathy, Project
Manager (SSPHD), HDRC Unit, all of Planning Commission, Government of India extended their
unstinted support and guidance for this new initiative in Odisha. We gratefully acknowledge
their support and place on record our sincere thanks.
Shri Ashok Kumar Singha and his team from C-TRAN Consulting Limited, Bhubaneswar
took the major responsibility for researching, writing and completing this report. They took
pains and made sincere efforts for collection and analysis of data presented in this report.
M/s New Concept Information System Private Limited helped us in cover lay and layout design,
copy editing, and printing of this document. We sincerely thank them for finalizing and printing
this report.
Acknowledgement

xi
This work would not have been possible without the active co-operation of my colleagues
in Planning & Coordination Department and Poverty and Human Development Monitoring
Agency (PHDMA). They made untiring efforts from the beginning to the end of the entire
process of preparing the DHDR. Shri R. C. Kar, former Director (DF&C)-cum-Additional Secretary
to Govt., Shri A. K. Mishra, Director (DF&C)-cum-Additional Secretary to Govt., Shri B. N. Dash,
and Ms. Neeta Mohanty both Deputy Director (DPC), Shri C.R. Satapathy, Deputy Director, Shri
Niranjan Mishra, CAO, Shri B.K. Sahu, Systems Analyst and other officials from PHDMA assisted
at different stages for completion of this DHDR. Shri Arabinda Acharya, Demographer, Shri
Mainak Sarkar, State Project Officer, Shri Debashish Dash, State Facilitator and Shri Abhisek
Mohanty, former State Facilitator, Dr. J.K. Patnaik, Shri Manoranjan Barik, Ms. Vaibhavi Bhandekar,
and Ms. Srabani Das, all former UNVs, also assisted and expedited the process. Their efforts
and contributions are sincerely appreciated, and acknowledged.
We hope that this report will be well received by all stakeholders. It will be useful to all those,
who intend to use it. We welcome constructive suggestions and comments for further
improvement of this document from all those who find this document useful and who have
a stake in improving human development indicators in Kalahandi and Odisha.
(Dr. R. V. Singh)Officer on Special Duty
Planning & Coordination Departmentand Member Secretary PHDMA
Government of Odisha.

xii
District Human Development Report

xiii
The Human Development Report is a
tool for providing insightful information
to facilitate decentralised planning and
serve as a benchmark against future
attainments. UNDP has been striving to
mainstream human development issues into
a development dialogue and encouraging
different countries and administrative units
to prepare and publish status reports on
human development in their respective
jurisdictions. With support from UNDP and
the Planning Commission, Government of
India, Odisha prepared and published its first
Human Development Report (HDR) in 2004.
Like several other Indian states, Odisha has
attempted to prepare and publish district
level human development reports as a tool
to understand intra-district issues better
and to ascertain the status of various human
development indicators.
Introduction to Kalahandi
Kalahandi is a part of the KBK (Kalahandi,
Bolangir and Koraput) region of the State,
that has been considered as one of the
most backward regions of the country.
Several development initiatives including
a Long Term Action Plan, Biju KBK Plan and
Backward Regions Grant Fund have been
launched by the State Government in this
region with support from Government of
India. Demographic characteristics of the
district reflect that it is predominantly rural
and has a high concentration of weaker
sections, i.e., ST and SC communities. The
district has witnessed several stresses that
have hampered development in the past. In
recent years, Kalahandi has recorded high
population growth, which indicates that the
living conditions in the district have been
improving because of several development
initiatives taken. About 50 percent
Executive Summary
population in the district is in the working
age group of 15-59 year and contributes to
the district growth.
The district is rich in minerals including
Bauxite, Graphite, Manganese, Iron and
Quartz of which, only Bauxite and Graphite
have been commercially exploited. Bauxite
is found in Lanjigarh Block at Niamgiri on
a large scale. Vedanta Aluminium Refinery
has been established in the district. Other
industries include textile, oil seeds, sugar
and chemicals. The Upper Indravati Hydro
Power Project plays an important role not
only in terms of generating power but also
providing irrigation support to farmers. This
has resulted in a shift from mono cropping
to multi-cropping patterns in Jayapatna and
adjacent blocks. The role of this project is
immense in changing the food production
scenario of the district from a food deficit to
food adequate situation.
Poverty and Livelihoods
Kalahandi contributes about three percent of
the Gross State Domestic Product (GSDP) of
Odisha. This is slightly less than the average
district share of 3.33 percent of the State
GSDP. The district economy is dominated
by the primary sector that contributes
roughly half the Gross District Domestic
Product (GDDP). Agriculture and allied
sectors contributed 49.44 percent to the
real GDDP (measured at 1999-2000 prices)
in 1999-2000. The mining and quarrying
sub-sector made a small contribution of
0.11 percent. The share of the primary sector
in the real GDDP of the district has since
come down to 41.99 percent in 2004-05.
The components of the forestry and fisheries
sectors are comparatively small, being about
3.50 percent and 1.20 percent respectively.

xiv
District Human Development Report
Though the share of the primary sector
in GDDP has been declining, the share of
mining and quarrying has increased from
0.11 percent in 1999-2000 to 0.21 percent in
2004-05. The share of the tertiary and service
sectors has increased from 42.36 percent in
1999-2000 to 48.96 percent in 2004-05. The
contribution of the manufacturing sector is
very small at 3.50 percent. The real NDDP per
employed person varied from Rs. 22,216.01
in 1999-2000 to Rs. 24,357.34 in 2004-05. The
lowest real NDDP per employed person was
Rs. 19,992.79 in 2002-03, the year in which the
district suffered a very severe drought. There
are variations in work participation rates in
different blocks ranging from 41.4 percent
in Kalramunda to 54.2 percent in Kalampur.
The share of salaried employees has been
increasing in recent years. Migration to
different parts of the State and other states
has also emerged as an important source of
employment and income.
Families Below the Poverty Line
There are wide variations in the number of
BPL households in different blocks. As per
the 1997 BPL census, Thuamul Rampur block
reported the highest (88.76%) incidence
of BPL households whereas Koksara block
reported the lowest (38.48%) incidence of
BPL households. A total of 34.02 percent ST
households, 23.39 percent SC households,
41.51 percent households of agricultural
labourers and 43.54 percent households of
small and marginal farmers have been reported
as BPL households as per the 1997 BPL census.
ForestsKalahandi has a good forest cover and rich
biodiversity of flora and fauna. Of the total
geographical area, 28.72 percent is covered
by forests which have been a source of
livelihood for many families. Because of
increasing population pressure, demand
for land and diversifying economic activities,
forests of Kalahandi have been shrinking and
have been degraded to varying degrees. In
2007-08, 74,711.32 ha have been identified as
degraded forest area. With a view to improve
forest regeneration, the State has introduced
participatory forest management in the
district through formation of Van Surakshya
Samities (VSS).
Agriculture
Agriculture is the main source of employment
and income for 80 percent of the people of
Kalahandi. The district contributes about
6.51 percent of the Net Sown Area of the
State. The Gross Cropped Area of the district
was reported to be 564,023 ha in 2006-07
with a cropping intensity of 159.59 percent.
Agricultural productivity is lower than the
State average. The net irrigated area of the
district is 36.66 percent of the total net sown
area. Average land holding size in the district
is 1.62 ha per household. Of total farmers,
46.85 percent are marginal farmers with an
average landholding of 0.55 ha and 29.04
percent are small farmers with an average
land-holding of 1.39 ha. Only 16.50 percent
farmers are semi-medium farmers with
an average land-holding of 2.76 ha; 6.93
percent are medium farmers with an
average land-holding of 5.76 ha; and 0.68
percent are large farmers with an average
landholding size of 14.93 ha. Rain-fed
agricultural practices predominate and some
agricultural areas are fed through canals
and other means of irrigation. The 2006-2007
agricultural statistics indicate that the use of
chemical fertilisers in the district is 57.54 kg per
ha which is much below the national average
of 104.50 kg per ha. Many farmers use animal
manure and other forms of organic manure.
Farm mechanisation is progressing at a very
slow pace in the district.
Animal Husbandry Animal husbandry has considerable scope to
provide and create gainful employment and

xv
Executive Summary
income opportunities. Rearing of animals
like goats, sheep, cows and buffalos are not
only the occupations of the poor people;
other families also undertake this activity
for various reasons. Of the total cattle
population of the district in 2006-07, only
4.98 percent were superior cross breeds
and the remaining 95.02 percent were
indigenous variety. So, expected economic
gain from livestock is restricted because of
poor breeding stock. To facilitate animal
husbandry, veterinary services are available
at the ground level in 132 Gram Panchayats
(GPs). The remaining GPs are covered by
nearby centres, which are at a distance of
about 2-3 km.
PiscicultureThe district has 6,492 ponds and 13 reservoirs,
where cultured species including Catla, Rohu,
Migral, Grass Carp and others are reared. At
present, only 3,609 out of 6,492 tanks are
suitable and used for pisciculture. Due to
low water retaining capacity of some tanks,
annual pisciculture is a distant possibility
in areas where such tanks exist. Average
annual fish production from ponds is 10,323
kg and is mostly used in the domestic market.
IndustriesDuring 2000-01, there were only 81 SSI units
in the district. The number of SSIs in 2004-05
increased to 449. The number of agro-based
industries increased and some Large Scale
Industries (LSIs) such as the Vedanta Alumina
Refinery have been established. A total of
36 agro-based and food-based industries
were registered in the district in 2001-02.
Their number grew to 55 in 2007-08. An
investment of Rs.3.87 crore was made in
these industries in 2001-02. The investment
was only Rs.3.71 crore during 2007-08. These
units provided employment to 224 persons
in 2001-02 and 391 persons in 2007-08.
Limited availability of financial resources
and institutional credit at affordable rates
is a major constraint for diversification
and growth of the economy of Kalahandi.
Regional Rural Banks (RRB) and some
Commercial Banks are the main financial
institutions. However, according to people’s
opinion, accessing credit from co-operative
banking institutions is not easy because of
the cumbersome process, less credit capital
base and other inhibitive factors. Around
71,300 households have been linked with
local Commercial Banks through 4,192 SHGs
under the SHG–Bank linkage programme
in the KBK region since 1992. As observed,
15.82 percent families in Kalahandi are
without any credit liability. The remaining
84.18 percent are indebted having taken
loans from informal or formal sources
for their consumption, production and
other needs.
MigrationThe implementation of the National Rural
Employment Guarantee Scheme (NREGS) has
positively impacted on distress migration.
Koksara block, from where 29.95 percent
families migrate to different places to seek
casual labour leads the list of all blocks with
respect to migration. Migration for seasonal
employment is high in Golamunda block,
from where 15.03 percent families migrated
to other places. The State Government
has implemented a number of livelihood
programmes that have reduced migration
to other places in search of casual work.
During 2006-07, 205,248 job card holders
were provided with wage employment
under NREGS and 4,726,084 person days
were created. In 2007-08, wage employment
was provided to 116,052 job card holders
and 2,170,940 person days were created.
Food Security & NutritionKalahandi is considered to be one of the
severely food insecure districts of the State.
However, food production and thus food
availability, e.g., 322 MT, in 1993-94 and
many other years is more than the food

xvi
District Human Development Report
requirement of 273.49 MT. Physical availability
of food is ensured through local production
and support from the Government through
various schematic provisions. Therefore,
the food insecurity of the district is mostly
related to economic access to food. As per the
available information, 40 percent children are
reported normal and the remaining 60 percent
have some form of nutritional deficiency. A
number of schemes have been implemented
in the district like subsidised distribution of
food grains through PDS, supplementary
nutritional food through Anganwadis and
free food for the aged vulnerable population
under emergency feeding. These programmes
have contributed significantly to improving
the situation. In addition, grain banks have
also emerged to cope with food insecurity
situation. To ensure food security of the
economically poor families, Government of
Odisha has been providing rice at Rs.2/- per kg.
Health
Over the years, the district has witnessed
significant improvements in the health
infrastructure and facilities. There are
a number of health institutions, both
Government and private, that cater to the
health needs of the people. Increasing patient
load in the district may be attributed to high
morbidity and also increasing awareness of
health care among the people. A limited
number of health personnel cope with a
heavy patient load, which varies from 15 to 17
lakh a year. In-spite of various Government
measures like special allowances to provide
mandatory rural services, there is shortage
of doctors. The district witnesses a large
number of vacancies (about 20%-35%) of
doctors. This affects the quality of health
service delivery.
In order to address the concern of large
number of vacancies of doctors in the district
and to improve access of the people to health
services, a massive programme of Mobile
Health Units (MHU) has been launched since
1995-96. On an average, an MHU covers
about 16,000-20,000 patients in a year.
Because of such efforts, the health status of
the district has improved in different aspects.
For example, the Infant Mortality Rate (IMR),
which was 76 during 2001, reduced to 59 in
2011, while the Maternal Mortality Ratio of
311 is above the State average. Institutional
deliveries have improved to 50 percent and
home deliveries without trained personnel
have gone down. As per the latest District
Level Household Survey (DLHS) report,
attendance of health personnel during
delivery at home or in other places has
increased from 12.5 percent to 21 percent
at the district level and 8.7 percent to 20.8
percent in rural areas.
The Government of India and State
Government have launched several
initiatives to improve health services. The
most important initiative is the National
Rural Health Mission (NRHM), an umbrella
programme that integrates existing health
services and new schemes. This programme
is implemented in district planning mode
with greater involvement of Panchayati Raj
Institutions. The District Health Action Plan,
Sub-district Health Action Plans and Project
Implementation Plans (PIPs) are developed
in a participatory and consultative mode,
taking into account major district health
priorities, concerns and implementation
strategies. The Zilla Swasthya Samiti (ZSS)
and Rogi Kalyan Samiti (RKS) are important
institutional arrangements at district and
sub-district levels. Other initiatives include
Panchavyadhi, Infant Mortality Reduction
Mission, Maternal and Child Health schemes
and other health programmes.
Education
Even though literacy rate in Kalahandi
has increased from 6.3 percent in 1951 to
60.22 percent in 2011, it is still below the
xvii
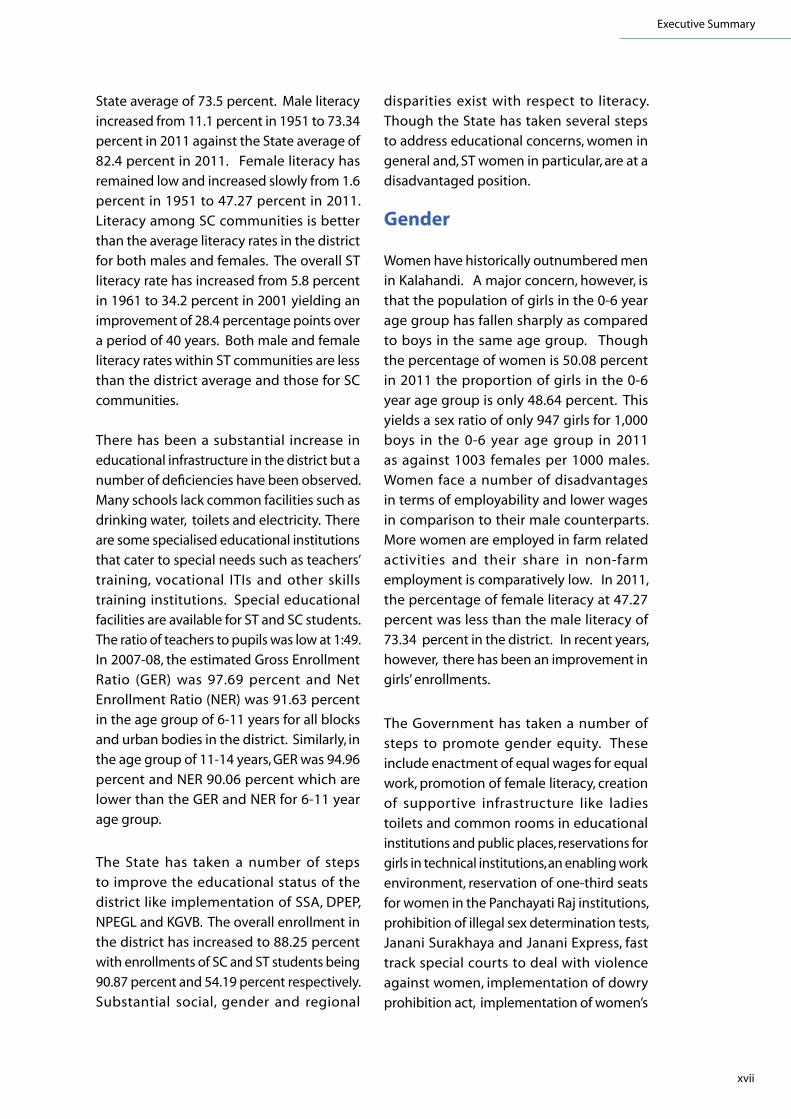
State average of 73.5 percent. Male literacy
increased from 11.1 percent in 1951 to 73.34
percent in 2011 against the State average of
82.4 percent in 2011. Female literacy has
remained low and increased slowly from 1.6
percent in 1951 to 47.27 percent in 2011.
Literacy among SC communities is better
than the average literacy rates in the district
for both males and females. The overall ST
literacy rate has increased from 5.8 percent
in 1961 to 34.2 percent in 2001 yielding an
improvement of 28.4 percentage points over
a period of 40 years. Both male and female
literacy rates within ST communities are less
than the district average and those for SC
communities.
There has been a substantial increase in
educational infrastructure in the district but a
number of deficiencies have been observed.
Many schools lack common facilities such as
drinking water, toilets and electricity. There
are some specialised educational institutions
that cater to special needs such as teachers’
training, vocational ITIs and other skills
training institutions. Special educational
facilities are available for ST and SC students.
The ratio of teachers to pupils was low at 1:49.
In 2007-08, the estimated Gross Enrollment
Ratio (GER) was 97.69 percent and Net
Enrollment Ratio (NER) was 91.63 percent
in the age group of 6-11 years for all blocks
and urban bodies in the district. Similarly, in
the age group of 11-14 years, GER was 94.96
percent and NER 90.06 percent which are
lower than the GER and NER for 6-11 year
age group.
The State has taken a number of steps
to improve the educational status of the
district like implementation of SSA, DPEP,
NPEGL and KGVB. The overall enrollment in
the district has increased to 88.25 percent
with enrollments of SC and ST students being
90.87 percent and 54.19 percent respectively.
Substantial social, gender and regional
disparities exist with respect to literacy.
Though the State has taken several steps
to address educational concerns, women in
general and, ST women in particular, are at a
disadvantaged position.
Gender
Women have historically outnumbered men
in Kalahandi. A major concern, however, is
that the population of girls in the 0-6 year
age group has fallen sharply as compared
to boys in the same age group. Though
the percentage of women is 50.08 percent
in 2011 the proportion of girls in the 0-6
year age group is only 48.64 percent. This
yields a sex ratio of only 947 girls for 1,000
boys in the 0-6 year age group in 2011
as against 1003 females per 1000 males.
Women face a number of disadvantages
in terms of employability and lower wages
in comparison to their male counterparts.
More women are employed in farm related
activities and their share in non-farm
employment is comparatively low. In 2011,
the percentage of female literacy at 47.27
percent was less than the male literacy of
73.34 percent in the district. In recent years,
however, there has been an improvement in
girls’ enrollments.
The Government has taken a number of
steps to promote gender equity. These
include enactment of equal wages for equal
work, promotion of female literacy, creation
of supportive infrastructure like ladies
toilets and common rooms in educational
institutions and public places, reservations for
girls in technical institutions, an enabling work
environment, reservation of one-third seats
for women in the Panchayati Raj institutions,
prohibition of illegal sex determination tests,
Janani Surakhaya and Janani Express, fast
track special courts to deal with violence
against women, implementation of dowry
prohibition act, implementation of women’s
Executive Summary

xviii
District Human Development Report
welfare programmes, steps to deal with
sexual harassment at the work place and
implementation of special projects like
Mission Shakti. Kalahandi was taken up
as a pilot district for the preparation of
the Women’s Component Plan within the
Comprehensive District Plan. This initiative
aims to improve gender equity.
Climate Change and Disasters
Kalahandi is susceptible to natural calamities
like drought and floods. Parts of the
district are also affected by heat waves
and outbursts of epidemics. Kalahandi has
suffered over a long period of time from
serious droughts, floods and other natural
calamities. Deforestation and the collapse
of the traditional tank irrigation system
have affected the total productivity of the
district. Though, the district receives a good
amount of rainfall, the rainwater is not
harvested properly. Tanks are silted and a
slight shortfall in rainfall triggers drought
and causes large-scale crop failure. Floods
were not common in the district, but have
now become a common occurrence due
to deforestation and siltation. From 2000
onwards, as per the available information, 13
floods have been experienced in different
parts of the district.
To arrest the adverse impact of droughts
and floods in the district, focus is on minor
irrigation, crop diversification, soil and
water conservation and comprehensive
watershed development measures. A
number of drought proofing measures
have been undertaken under various
programmes including the Long Term Action
Plan (LTAP) for the KBK districts of which
Kalahandi is a part. Other programmes
include Western Odisha Rural Livelihood
Programme (WORLP) and the Odisha Tribal
Empowerment and Livelihood Programme
(OTELP). The availability of development
funds has substantially increased over the
years. During 2004-05, the district received
Rs. 754.59 lakh for watershed development.
This increased to Rs. 3952.695 lakh in 2008-09.
Similarly, the overall rate of expenditure went
up from 66.99 percent in 2005-06 to 81.28
percent in 2008-09.
Decentralisation
The 73rd and 74th amendments of the
Constitution of India mandate major reforms
in local governance institutions for both rural
and urban areas at district and sub-district
levels. According to this Act, the district
has a three tier structure with elections
being organised for all levels. Different
standing committees support planning and
implementation of different development
programmes. The State has devolved funds,
functions and functionaries to different
tiers of the PRI. A number of initiatives
have been undertaken to strengthen PRIs,
like organising large training programmes
through the State Institute of Rural
Development (SIRD) and other agencies
under project DAKSHYATA. The District
Planning Committee (DPC) has already been
constituted to review the detailed plan of
the district and consolidate district plans.
Annual district plans are approved by the
DPC after due consideration.
- • -

xix
Message from Chief Minister iii
Message from Minister, Planning & Coordination Department iv
Message from Chief Secretary v
Message from Development Commissioner cum Additional Chief Secretary vi
Message from UNDP vii
Preface viii
Acknowledgement x
Executive Summary xiii
Acronyms xxv
Glossary xxix
Chapter One District Background and Profile 11.0 Historical Perspective 4
1.1 Geographic Location & Administrative Set-up 5
1.2 Topography and Climate 5
1.3 Soil 8
1.4 River System 9
1.5 Demography 9
1.6 Language and Culture 13
1.7 Social Structure 13
1.8 Industry and Minerals 13
1.9 District Development Indicators 14
Chapter Two Growth, Poverty and Livelihood 192.0 Structure of the District Economy 22
2.1 Work Participation Rates 23
2.2 Incidence of Poverty 25
2.3 District Income Distribution Patterns 27
2.4 Rural Housing 28
2.5 Livelihood Profile 28
2.6 Forests and Livelihoods 30
2.7 Agriculture 33
2.7.1 Land Capability Classification 33
2.7.2 Land Holding Patterns 34
2.7.3 Land Holdings by Social Groups 35
2.7.4 Income Status of Land Owning Households 36
2.7.5 Irrigation 38
2.7.6 Fertilizer Consumption and Farm Mechanisation 39
2.7.7 Agri-clinic Facilities 39
2.7.8 Area, Production and Yields of Major Crops 40
2.7.9 Shifting Cultivation, Soil Erosion and their Prevention 40
Contents

xx
District Human Development Report
2.8 Horticulture 41
2.9 Animal Husbandry 41
2.10 Fisheries 42
2.11 Small Scale Industries 44
2.12 Financial Services 46
2.12.1 Formal Financial Institution 46
2.12.2 Self Help Approach and Financial Services 46
2.13 Indebtedness 48
2.13.1 Indebtedness by Social Category 49
2.14 Migration 49
2.14.1 Migration in social groups 50
Chapter Three Food Security and Nutrition 533.1 Food Security: A Conceptual Framework 56
3.2 Food Requirement & Availability 57
3.3 Calorie Deprivation in Odisha and Kalahandi 57
3.4 Food Security: Seasonality and Vulnerability 58
3.5 Food Security of SC and ST Households 59
3.6 Nutritional Status 60
3.7 Interventions for Strengthening Food Security 61
3.7.1 Public Distribution System (PDS) 61
3.7.2 Supplementary Nutrition Programme (SNP) 61
3.7.3 Mid Day Meal 61
3.7.4 Emergency Feeding Programme 62
3.7.5 Two-Rupee per Kilogram Rice 62
Chapter Four Health 634.1 Modest Beginnings of Modern Health Practices 66
4.2 Health Infrastructure in Kalahandi 67
4.2.1 Health Personnel and Patient Load 67
4.3 District Health Status 70
4.4 Major Health Programmes & Institutional Reforms 72
4.5 Life Expectancy 74
4.6 Maternal and Child Health 75
4.7 Immunisation Services 78
4.8 Family Planning Services 79
4.9 Public Private Partnership in Health Sector 82
4.10 Sexual and Reproductive Health of Adolescents 82
4.11 Births, Deaths and Other Key Health Indicators 82
4.12 Drinking Water and Sanitation 83
4.12.1 Drinking Water Facilities in Rural Plain Areas 83
4.12.2 Drinking Water Facilities for Rural Hilly Areas 84
4.13 Hygiene and Sanitation Status of Rural Households 85

xxi
Content
Chapter Five Education 895.1 Early Beginnings of Modern Education in Kalahandi 92
5.2 Efforts to Accelerate Development of Education 92
5.2.1 Sarva Shiksha Abhiyan (SSA) 93
5.2.2 District Primary Education Programme (DPEP) 93
5.2.3 National Programme for Education of Girls at Elementary Level (NPEGL) 93
5.2.4 Kasturba Gandhi Balika Vidyalaya 93
5.3 Literacy Levels and Education Standards 93
5.4 Education Infracture 97
5.5 Enrollment Ratio Among Different Age Groups 99
5.6 Major Educational Concerns 101
Chapter Six Gender 1036.1 Women in Kalahandi 106
6.2 Gender Disparities: Some Dimensions 107
6.2.1 Female Literacy Levels 107
6.3 Addressing Gender Disparities 109
6.4 Economic Reforms and Women 110
6.5 Women Welfare 111
Chapter Seven Natural Calamities 1157.1 Droughts in Kalahandi 118
7.2 Floods in Kalahandi 118
7.3 Climate Change 119
7.4 Disaster Management 120
Chapter Eight Decentralised Governance 1238.1 Zilla Parishad 126
8.2 Panchayat Samities 126
8.3 Gram Panchayats 127
8.4 Empowering Panchayati Raj Institutions 129
8.5 District Planning Committee, Kalahandi 129
Chapter Nine Way Forward 131
ANNexureS 137
Annexure 1 139Approach, Process and Methodology 1390.1 Approach and Process 139
0.2 Methodology, Tools and Techniques 139
0.3 Process of DHDR Preparation 140
0.3.1 Study Team Composition 140
0.3.2 Collection of Data 141

xxii
District Human Development Report
Annexure 2 142District Human Development Report Card 142[Paheli Findings] 142
I. Life & Livelihood 142
II. Water & Sanitation 143
III. Health: Mother & Child 144
IV. Education & Literacy 146
V. Villages of the District 147
Annexure 3 148Sector wise Funds Flow 148
Annexure 4 162GP Profile 162
List of Tables
Table 1: Administrative Set-up of Kalahandi District: 2008 6
Table 2: Agro Ecological and Climatic Conditions of Kalahandi 7
Table 3: Block-wise Monthly Rainfall (In mm): 2007 7
Table 4: Month-wise Temperature and Relative Humidity: 2008 8
Table 5: Average Soil Reaction and Nutrient Index 8
Table 6: Distribution of Soils by Block (soil spread as percentage of total area) 9
Table 7: Population of the Re-organised Kalahandi District: 1901-2011 10
Table 8: Population Distribution by Rural & Urban Bodies: 1991-2001 11
Table 9: Distribution of SC & ST Population by Block and Urban Bodies: 2001 12
Table 10: Key Development Indicators for Kalahandi District vis-à-vis Odisha 14
Table 11: Sectoral Composition of Real GDDP of Kalahandi District: 1999-2005
(At 1999-2000 Prices) 23
Table 12: The Work Participation Rates for Kalahandi: 1999-2000 to 2007-2008 24
Table 13: Work Participation Rates by Blocks and Urban Local Bodies: 2001 25
Table 14: Work Force of Kalahandi by Major Occupations: 1971-2001 25
Table 15: BPL Households in Different Blocks: 1992 & 1997 26
Table 16: Distribution of Rural Households of Kalahandi by Monthly Income Levels 27
Table 17: Households Engagement in Different Livelihood Activities: 2002 30
Table 18: Distribution of VSS and Assigned Forest Areas by Block: 2007-2008 32
Table 19: Distribution of Land by their Land Capability Classifications 34
Table 20: Distribution of Farmers By Block and Land Holding Size: 2002 35
Table 21: Households with Land Holdings by Blocks and Social Groups (%) 35
Table 22: Income Status of Land-owning Families by Blocks (%) 36
Table 23: Operational Holdings for Rural SC & ST Households: 2002 37
Table 24: Status of Irrigated Area by Block: 2007-2008 39
Table 25: Livestock Population of Kalahandi by Animal Type and Blocks: 2006-2007 42
Table 26: Current Status of Pond & River Fishing Activities by Block 43
Table 27: Key Agricultural Indicators for Kalahandi: 2000-2001 to 2006-2007 44
Table 28: Small and Large Scale Industries in Western Districts : 2000-2005 45

xxiii
Table 29: Status of Agro and Food-Based Industries by Block: 2001-2008 45
Table 30: Status of Village Covered With SHG-Based Micro Credit: 2008-2009 47
Table 31: Distribution of SHG by Block and Agencies: 2008-2009 47
Table 32: Status of Indebtedness of Rural Households by Purpose, Sources & Blocks 48
Table 33: Food Grain Requirement & Availability: 1993-2001 57
Table 34: Food Security Status of Districts of Odisha as Reflected By FSA: 2008 58
Table 35: Food Status of Selected SC Families by Block: 2002 59
Table 36: Food Status of Selected ST Families by Block: 2002 60
Table 37: Nutritional Status of Children in Kalahandi and KBK Region: 2007 61
Table 38: Distribution of Health Institutions by Blocks / Urban Bodies: 2004-2005 68
Table 39: Distribution of Health Personnel by block / urban bodies: 2004-2005 69
Table 40: District Achievements in Family Welfare and Immunisation 70
Table 41: Epidemiological Status of Malaria in Kalahandi: 2001-2005 73
Table 42: Kalahandi Fact Sheet on Leprosy 74
Table 43: Epidemiological Status of TB in Kalahandi: 2002-2006 74
Table 44: Comparison of DLHS II and DLHS III on Maternal and Child Health 78
Table 45: Comparison of Immunisation; DLHS-II and DLHS-III 79
Table 46: Awareness about Contraceptive Methods in Kalahandi and Odisha 80
Table 47: Performance of Selective Reproductive Health services in
Kalahandi: 2005-2006 81
Table 48: Comparison of DLHS II and DLHS III of Kalahandi on Family Planning 81
Table 49: General Hygiene Status of Households by Blocks 85
Table 50: Installation of Latrines in HH and Public institutions 86
Table 51: Literacy Rates in Kalahandi District: 1951-2011 94
Table 52: Intra-District Disparities in Literacy Levels by Block & Sex: 2001 95
Table 53: Distribution of Adult Population by Education Levels 96
Table 54: Distribution of Schools by Block and School types: 2007-2008 96
Table 55: Primary Schools with Deficient Infrastructure and Without Facilities 97
Table 56: Educational Institutions for Special Needs 98
Table 57: Student Enrolment at Primary School Level by Blocks: 2007-2008 99
Table 58: Population of the Re-Organised Kalahandi District: 190-2011 106
Table 59: The Work Participation Rate for Kalahandi: 1999-2000 to 2007-2008 107
Table 60: Gender Disparities in Literacy, Kalahandi: 1951-2011 108
Table 61: Status of Girls’ Enrolments (6-11 years) in Kalahandi: 2008-2009 108
Table 62: Status of Girls’ Enrolments (11-14 years) in Kalahandi by Block: 2008-2009 109
Table 63: Performance of Mission Shakti Programme in Kalahandi: 2005-2008 112
Table 64: Occurrence and Severity of Droughts in Kalahandi by blocks: 1998-2006 119
Table 65: Occurrence and Severity of Floods in Kalahandi by Blocks: 2000-2007 120
Table 66: A Profile of Membership of Panchayat Samities in Kalahandi 127
Table 67: A Profile of Sarpanches of Gram Panchayats by Block in Kalahandi 128
Table 68: A Profile of Ward Members of all GP by Block, Gender and Social Classes 128
Table 69: Sector Wise Funds Flow in Kalahandi 148
Table 70: Sector Wise Funds Flow in Kalahandi 149
Table 71: Funds Flow in Watershed Development 150
Table 72: Funds Flow to Social Welfare Dept. under Different Schemes 151
Table 73: Funds flow to Lift Irrigation Dept. 151
Table 74: Funds Flow for Sericulture Promotion in Kalahandi 152
Table 75: Funds Flow to Education Sector [DPEP], Kalahandi 153
Content
Table 76: Funds flow to Textile Sector, Kalahandi 153
Table 77: Funds flow for Strengthening Cooperatives, Kalahandi 154
Table 78: Funds flow to Municipality Area, Kalahandi 154
Table 79: Funds flow for Infrastructure Development, R & B Division, Kalahandi 155
Table 80: Funds Flow to Soil Conservation Department, Kalahandi 156
Table 81: Funds flow under Total Sanitation Campaign, Kalahandi 156
Table 82: Funds flow to District Industrial Centre, Kalahandi 156
Table 83: Funds flow for Animal Husbandry Promotion 157
Table 84: Funds flow for Forestry Sector 157
Table 85: Funds flow to ITDA for Tribal Development 158
Table 86: Funds promotion for Ayurveda based health care 158
Table 87: Funds flow to Minor Irrigation Division 158
Table 88: Funds flow to Irrigation Division 159
Table 89: Funds flow under CSP for Health Sector 159
Table 90: Funds flow under MLA LAD, MP LAD & State Schemes 160
Table 91: Funds Flow to Dist. Welfare Office under Different Schemes 160
Table 92: Total Dist. Allocation 161
List of FiguresFigure 1: Structural Composition of Kalahandi 6
Figure 2: Soil Characteristics 9
Figure 3: House Type 28
Figure 4: Year-wise Composition of Worker in Kalahandi District and Odisha 29
Figure 5: Foersted Areas 31
Figure 6: Operational Holding by Social Category 38
Figure 7: Type of Indebtedness by Source and Purpose 48
Figure 8: Families Migrating from the District 49
Figure 9: Health Indices of Various Districts as per State HDR 2004 71
Figure 10: Life Expectancy at Birth Estimates based on RCH Data 75
Figure 11: Some Aspects of RCH: DLHS -2 & DLHS - 3 77
Figure 12: Availability of Safe Drinking Water Facilities: Plain Areas 83
Figure 13: Availability of Safe Drinking Water Facilities: Hill Areas 84
Figure 14: Enrollment Patterns in Kalahandi 99
Figure 15: Status of EGS Centres 100
Figure 16: Population Trends by Male And Female: 1901-2011 107
Figure 17: Structure of Rural & Urban Local Bodies in Kalahandi 125
Figure 18: Membership Profile of Kalahandi ZP 126
List of BoxBox 1: Millenium Development Goals (MDGs) 21
Box 2: MDG 1: Eradicate Extreme Poverty and Hunger 22
Box 3: MDGs on Health Issues 66
Box 4: MDG 3: Promote Gender Equality 105
Box 5: Objective of Mission Shakti 111
Box 6: Way Forward: Livelihoods 134
Box 7: Way Forward: Public Healthcare Services 135
Box 8: Way Forward: Education 136
xxv
AAY Antyodaya Anna Yojana
AFA Amino Folic Acid
AIE Alternative and Innovative Education
AIDS Acquired Immuno Deficiency Syndrome
ANC Ante Natal Care
ANM Auxiliary Nurse Midwife
APL Above Poverty Line
ARTI Acute Respiratory Tract Infection
ARWSP Accelerated Rural Water Supply Programme
ASHA Accredited Social Health Activist
AWC Anganwadi Centre
AY Annapurna Yojana
BCG Bacille Calmette-Guerin
BPL Below Poverty Line
BRGF Backward Region Grant Fund
CC Conventional Contraceptive
CDMO Chief District Medical Officer
CHC Community Health Center
CV Co-efficient of Variation
CWSN Children with Special Needs
DDA Deputy Director, Agriculture
DDT Dichloro Diphenyl Trichloroethane
DES Directorate of Economic & Statistics
DHDR District Human Development Report
DIC District Industry Centre
DISE District Information System for Education
DOTS Directly Observed Treatment Short-Course
DPEP District Primary Education Programme
DPT Diphtheria Pertussis and Tetanus
DSWO District Social Welfare Officer
EGS Education Guarantee Scheme
FFS Farm Field Schools
FGD Focus Group Discussion
Acronyms

xxvi
District Human Development Report
GER Gross Enrolment Ratio
GMFR General Marital Fertility Rate
GP Gram Panchayat
HI Hearing Impaired
HIV Human Immunodeficiency Virus
HHs Households
IAY Indira Awas Yojana
ICDS Integrated Child Development Scheme
ICTC Integrated Counselling and Testing Centre
IFA Iron and Folic Acid
IMR Infant Mortality Rate
INM Integrated Nutrient Management
IPM Integrated Pest Management
ITDA Integrated Tribal Development Agency
IHDS Integrated Handloom Development Scheme
IUD Intra - Uterine Device
IGNOAP Indira Gandhi National Old Age Pension
IGNWP Indira Gandhi National Widowhood Pension
IGNDP Indira Gandhi National Disability Pension
JFM Joint Forest Management
KGBV Kasturba Gandhi Balika Vidyalaya
LAMPS Large Area Multipurpose Societies
LEU Leprosy Elimination Unit
LHV Lady Health Visitor
MTP Medical Termination of Pregnancy
MDG Millennium Development Goal
MDM Mid-Day Meals
MDT Multi-Drug Therapy
ME Middle English
MFP Minor Forest Produces
MGNREGS Mahatma Gandhi National Rural Employment Guarantee Scheme
MLCU Modified Leprosy Care Unit
MHU Mobile Health Unit
MMR Maternal Mortality Ratio
MR Mental Retardation
MT Metric Tons

xxvii
Acronyms
N Nitrogen
NABARD National Bank for Agriculture and Rural Development
NAC Notified Area Council
NACP National AIDS Control Programme
NDDP Net District Domestic Product
NER Net Enrolment Ratio
NGO Non-Government Organisation
NHM National Horticulture Mission
NLEP National Leprosy Elimination Programme
NPCB National Prevention and Control of Blindness
NPEGL National Programme for Education of Girls at Elementary Level
NRHM National Rural Health Mission
NSDP Net State Domestic Product
NTFP Non-Timber Forest Produces
NUEPA National University of Educational Planning Administration
NVBDCP National Vector Borne Disease Control Programme
OBC Other Backward Castes
OH Orthopaedically Handicapped
OP Oral Pill / Out - Patient
OPD Outpatient Department
OPEPA Odisha Primary Education Programme Authority
ORS Oral Re-hydration Salt
PAHELI People’s Audit of Health, Education and Livelihood
Pry Primary
PCCS Primary Co-operative Credit Societies
PDS Public Distribution System
PF Plasmodium Falciparum
PHC Primary Health Center
PHIS Promotion of Handloom Industries Scheme
PIP Program Implementation Plan
PR Prevalence Rate
PRI Panchayati Raj Institutions
PTR Pupil-Teacher Ratio
PWS Piped Water Schemes
RCH Reproductive Child Health
RDAC Rural Development Action Cell

xxviii
District Human Development Report
RNTCP Revised National Tuberculosis Control Programme
RRB Regional Rural Bank
RTI Reproductive Tract Infection
SC Scheduled Caste / Sub - Centre
SD Standard Deviation
SGRY Sampoorna Grameen Rozgar Yojana
SGSY Swarnajayanti Gram Sworozgar Yojana
SHG Self Help Group
SNP Supplementary Nutrition Programme
SRRs Seed Replacement Rates
SSA Sarva Shiksha Abhijan
SSI Small Scale Industry
ST Scheduled Tribe
STI Sexually Transmitted Infections
TB Tuberculosis
TT Tetanus Toxoid
TPDS Targeted Public Distribution System
TRCS Tassar Rearers’ Cooperative Society
TSC Total Sanitation Campaign
TSP Tribal Sub-Plan
UPHC Upgraded Primary Health Centre
UNDP United Nations Development Programme
UP Upper Primary
VI Visually Impaired
VSS Vana Surakhya Samiti
WCS Weavers’ Co-operative Societies
WPR Work Participation Rate
WSHG Women Self Help Group

xxix
Glossary
Crude Death Rate (CDR) Number of deaths per 1000 population in a year
Crude Birth Rate (CBR) Number of births per 1000 population in a year
Elementary School Primary schools and Upper Primary schools taken
together
General Marital Fertility Rate (GMFR) Average number of children born to married
women in a year
Gender Disparity Index (GDI) in Literacy The gap between male and female literacy rates
as a percentage of female literacy rates
Gross Enrolment Ratio (GER) (Total Enrollment in Grade I-V / Population of age
6-11 years)* 100
Infant Mortality Rate (IMR) Number of deaths of infants aged below 1 year
per 1000 live births in a year
Maternal Mortality Ratio (MMR) Number of deaths of women during pregnancy/
child birth or after 42 days of delivery per 1 lakh
live births
Net Enrolment Ratio (NER) [(Enrollment in Grade I-V in 6-11 years age group)/
Population in age 6-11 years age group]* 100
Rural- Urban Disparity Index The difference between urban and rural rates
in respect of a dimension as percentage of
the rural rate
Work Participation Rate (WPR) Total workers as percentage of total population
Gross State Domestic Product (GSDP) The Gross State Domestic Product is defined
as a measure in monetary terms of the volume
of all goods and services produced within the
boundaries of the State during a given period of
time, accounted without duplicate
Malnutrition Is the condition that develops when body doesn’t
get the right amount of vitamins, minerals and
other nutrients it needs to maintain healthy
tissues and organ functions
Nutrition Can be defined as food or nourishment needed
to keep an organism growing, healthy and viable


The contrast between what great things human beings can achieve and what limited lives most women and men end up living is truly remarkable.
-- Amartya Sen
District Background and Profile
Chapter 1

Indicator Value Indicator Value
District Human Development Index (HDI) (2004) rank 11 SC Literacy Rate (2001) ** (%) 47.12
Total Population (2011)* (lakh) 15.73 ST Literacy Rate (2001) ** (%) 34.17
(Male) 7.85 Infant Mortality Rate (2010-11) # 59
Female 7.87 Standard of Living Index (2007-08) ## (%)
ST Population (2001) ** (%) 28.65 Low 93.3
SC Population (2001) ** (%) 17.67 Medium 4.4
Population Density (2011)* (lakh) 199 High 2.2
Sex Ratio (2011)* 1003 Institutional deliveries (2007-08) ## (%) 27.3
Child Sex Ratio (0-6)Yrs (2011)* 947 Contraceptive Prevalence Rate (2007-08) ## (%) 28.9
Literacy Rate (2011)* (%) Unmet needs of Family Planning(2007-08) ## (%) 34.9
(Person) 60.22 Girl marrying before completing 18 years ## (%) 29.9
(Male) 73.34 No. of People infected with HIV 257
(Female) 47.27 *** Real Gross District Domestic Product (Rupees in lakh): 2006 -07 at 1999 -2000 prices 186,272
Sources * Provisional Population Report-2011** Census of India, 2001*** Economic Survey-2010-11# AHS - 2010-11## DLHS - III: 2007-08
Kalahandi at a Glance
Kalahandi at a Glance
KALAHANDI DISTRICT

3
Traditional development debate has often
remained focussed on economic growth.
Several human development issues and
other dimensions of social welfare have
generally not received due attention. The
United Nations Development Programme
(UNDP) has, therefore, attempted to address
this deficiency and focussed attention
on human development issues. Human
Development has been conceived as a
process that is aimed at improving the
people’s skills and capacities, and widening
their choices, to live long, healthy and fulfilled
lives. The concept of human development
encompasses several variables including
income, literacy, skills, health, nutrition, access
to safe drinking water and gender issues.
UNDP has been striving to mainstream
human development issues into the
development dialogue and encouraging
different countries and other administrative
units to prepare and publish status reports
on human development in their respective
jurisdictions. With support from UNDP
and Planning Commission, Government of
India, Odisha prepared and published its
first Human Development Report (HDR)
in 2004. This HDR was very well received
in different quarters. Like several other
Indian States, Odisha has moved to the
next tier and attempted to prepare and
publish district level Human Development
Reports with support from UNDP and
Planning Commission, Government of India.
District Background and Profile

4
District Human Development Report
Initially, four districts including Kalahandi
were identified by the State Government
for preparation and publication of their
first District Human Development Report
(DHDR). This report is the first District Human
Development Report for Kalahandi district.
Kalahandi district is endowed with rich
natural resources including minerals, forests,
fertile soils, surface and ground water
resources and picturesque landscape with
tourist potential. However, the district has
attracted, in the past, wide attention through
adverse publicity for alleged starvation
deaths, high incidence of poverty and
very poor human development indicators.
This prompted the Government of Odisha
and the Government of India to pay
special attention to Kalahandi and its two
neighbouring districts, Bolangir and Koraput
with a view to accelerating the development
process in the KBK (i.e., Kalahandi-Bolangir-
Koraput) region. This region, which has
been divided into eight districts: Kalahandi,
Nuapada, Bolangir, Subarnapur, Koraput,
Malkangiri, Nabarangpur and Rayagada
in 1992-93, has been considered as one
of the most backward regions of the
country. Several development initiatives
including Long Term Action Plan, Biju
KBK Plan and Backward Regions Grant
Fund have been launched by the State
Government in this region with support
from the Government of India. This DHDR
is an attempt to analyse the current status
of key human development indicators in
the new Kalahandi district. This chapter
introduces Kalahandi district to the readers
and is organised as follows. The following
section provides a historical perspective
on Kalahandi district. The next sections
describe physical, climatic and ecological
settings for the district. These sections also
provide a brief analysis of demographic,
socio-cultural and economic dimensions
of the district. The last section summarises
some development Indicators of the district.
1.0 Historical Perspective
Kalahandi was earlier known, in ancient texts,
as Mahakantara1, which means a Great Forest
Tract. It was also known as Karunda Mandal,
which means treasure of precious stones like
Karandam (i.e., Manik), Garnet (i.e., red stone),
Beruz, Neelam (i.e., blue stone), Alexandra
and others. The present district was formerly
a princely State of South Kosal. It was part
of the erstwhile Kalinga-Utkala Empire of the
Gajapati rulers of Odisha. During that time,
Junagarh was the State capital of Kalahandi,
with a well built fort and a number of temples
of the Hindu pantheon, with sculptural
evidences of the rites of sati.
After Independence, Kalahandi was merged
with the State of Odisha on November 1,
1949. In 1962, the area under the jurisdiction
of Kashipur Police Station was taken out from
this district and merged with Koraput district.
For administrative convenience, Kalahandi
district was again divided in 1992-93 into
two districts, i.e., Kalahandi and Nuapada.
The administrative re-organisation of the
district in 1992-93 left Kalahandi with only
13 community development blocks and 273
Gram Panchayats.
Kalahandi has witnessed several natural and
other calamities for over a century. Droughts
had occurred in the district in 1868, 1884 and
1897. The district was severely affected by
the famine of 1899, which is also described
as “Chhapan Sal ra Durbhikshya” that is a
famine of severity not witnessed during the
preceding fifty-six years. The effects of the
famine, according to the District Gazetteers,
were of unprecedented nature and left a
terrible human tragedy and brittle socio-
economic fabric in the area. In 1919-20, there
1 Odisha District Gazette, Kalahandi and State Gazette, 1980

5
District Background and Profile
occurred another drought that was followed
by cholera, influenza and severe malnutrition
due to lack of food. Thereafter, a series of
droughts were witnessed during 1922-1923,
1925-1926, 1929-1930 1954-1955, 1955-56,
1965-66, 1974-75 and 1985. The district has
also suffered from a number of droughts and
floods in recent years.
The economic and social impacts of droughts
and floods on the people of Kalahandi were
very severe. The Kalahandi District Gazetteer
has recorded the impact of the 1965-66
drought as follows:
“The bulk of the population which constituted
the landless agricultural labourer became
unemployed due to suspension of all sorts of
agricultural operations. The worst sufferers
were the landed families, who, because of
the drought, could neither reap a harvest nor
take to manual labour to which they were not
accustomed. The pastures lost the greenery
and the bovine population therefore was
equally starved. Everywhere there was an
acute shortage of water.”
After the severe drought of 1955-56 and
1965- 66, a large number of cultivators
suffered heavy economic losses. Their social
status was also considerably reduced. Many
of them became “Sukhbasis2” (i.e., landless).
Repeated occurrences of droughts along
with irregular rainfall resulted in crop
failure. Many farmers and landless labourers
became poorer and the incidence of poverty
in the district increased. The Directorate
of Economics and Statistics (DES), Odisha
has analysed the rainfall of South Western
Kalahandi and has reported that on an
average there is drought every 3-4 years.
Increased impoverished conditions of a large
number of farmers and labourers forced
them to face exploitation at the hands of a
small number of traders, money lenders and
other businessman. The customary loan and
mortgage systems (i.e., informal financial
services sector) that evolved in the district
over time acquired several forms. Mortgage
included Bandha, Kalantaria, Bandhasaheji,
and Katti. The exploitative labour systems,
that evolved, included goti, halia (i.e., annual
servant), bahabandha, kalibhut and thika.
1.1 Geographic Location & Administrative Set-up
Kalahandi is located in the south-western
part of Odisha, between 19° 3' N to 21°
5' N latitude and 82° 30' E to 83° 74' E
longitude. It is bounded on the north by
Bolangir and Nuapada districts; on the
south by Rayagada district; in the west
by Nawarangpur district and Chhatisgarh
State; and in the east by Kandhamal and
Boudh districts. The District headquarters
is located at Bhawanipatna town which
is situated on the eastern border of the
district. The re-organised Kalahandi district
has an area of 7,920 square kilometres (sq. km).
It occupies 5.09 percent of the State and is
the 7th largest district of Odisha.
The district is divided into two sub-divisions,
nine tehsils, 12 police stations and 13 blocks.
There are three Urban Local Bodies (ULB) and
273 Gram Panchayats (GP) with 2,099 habited
villages. The administrative set-up of the district
is summarised in Table 1. The Block-wise
distribution of GP is given in Figure 1.
1.2 Topography and Climate
The topography of the district is varied
consisting of undulating tracts, high hills,
low valleys and plain lands. The district can
be divided into two physiographical regions:
(i) plain lands and (ii) hill tracts. There are
different types of lands including uplands,
medium types, low lands and plains. Many
2 The daily wage labourers and landless are generally called “sukhbasi” in Kalahandi.

6
District Human Development Report
Table 1: Administrative Set-up of Kalahandi District: 2008
Number of Sub-Division 2 Bhawanipatna, Dharamgarh
Number of Tehsils 9 Bhawanipatna, Dharamgarh, Junagarh, M.Rampur, Th. Rampur, Jaypatna, Kesinga, Koksara, Lanjigarh
Number of Municipality 1 Bhawanipatna
Number of N.A.C. 2 Junagarh, Kesinga
Number of Blocks 13 Bhawanipatna, Dharamgarh, Junagarh, M.Rampur, Th. Rampur, Jaypatna, Kesinga, Koksara, Lanjigarh, Golamunda, Kalampur, Karlamunda, Narla
Number of Police Station 12
Number of Gram Panchayat 273
No. of Inhabited Villages 2,099
No. of Uninhabited Villages 137
Total Number of villages 2,236
Source: District Website and District statistical handbook, Kalahandi
Figure 1: Structural Composition of Kalahandi
KesingaGP-26, Village 106
KarlamundaGP-12, Village 62
M. RampurGP-15, Village 249
NarlaGP-26, Village 173
BhawanipatanaGP-33, Village 283
LanjigarhGP-21, Village 483
Th. RampurGP-16, Village 298
KalampurGP-9, Village 54
JaipatanaGP-18, Village 91
KoksaraGP-20, Village 70
DharnagarhGP-21, Village 72
JunagarhGP-32, Village 168
GolamundaGP-24, Village 127
KalahandiMunicipality–1
NACs–2Blocks 13
Villages–2236
villages are surrounded by hillocks and forest
areas which define local drainage systems
of different areas. Uplands are generally
undulated and uneven with small stone
patches. The average slopes are in the range
of 3-5 percent and the general drainage
pattern is dendritic.
Kalahandi is part of the Eastern Ghats
and generally has dry hot and sub-humid

7
District Background and Profile
climate with a mean maximum temperature
of 450 C in summer and a mean minimum
temperature of 120 C in winter. There are
three seasons, summer (March to June),
monsoon (June- July to September-October)
and winter (November to February). The
climate of the district is more or less extreme
and mostly remains dry except during the
monsoons. It is part of the 7th agro-climatic
zone, eastern plateau and hills zone. The
agro-ecological and climatic conditions of
different parts of the district are summarised
in Table 2.
Normal rainfall in the district is of the order
of 1,330.5 mm, which is in general distributed
over 59-61 rainy days. The average rainfall
of the district is estimated to be 1,365 mm.
The major source of rainfall is the south–west
monsoon. The contribution of the north–
east monsoon is very little. Nearly 87 percent
of the annual rainfall is received during the
monsoon months, i .e. , between June–
September. Maximum rainfall is generally
received in August. There is, however, a
wide variation of rainfall in different parts
Table 3: Block-wise Monthly rainfall (In mm):2007
Sl. No.
Block Jan Feb March April May June July Aug Sept Oct Nov Dec
1 Bhawanipatna NA NA NA NA 35.00 321.00 188.00 592.00 263.00 78.00 NA NA
2 Kesinga NA NA NA NA 37.00 305.00 174.00 402.00 274.00 38.00 NA NA
3 Th. Rampur NA NA NA NA 55.00 894.00 445.00 1550.00 825.00 27.00 NA NA
4 Narla NA NA NA NA 54.00 247.00 140.00 564.00 437.00 25.00 NA NA
5 M. Rampur NA NA NA NA 87.90 291.50 176.40 488.90 408.30 45.60 NA NA
6 Karlamunda NA NA NA NA 80.60 389.00 106.00 366.00 393.00 15.00 NA NA
7 Lanjigarh NA NA NA NA 80.60 411.40 104.00 682.60 284.90 45.00 NA NA
8 Dharamgarh NA NA NA NA 21.30 523.00 414.00 765.00 451.90 33.50 NA NA
9 Junagarh NA NA NA NA 68.40 459.90 445.40 966.70 456.40 68.50 NA NA
10 Kalampur NA NA NA NA 62.50 683.00 196.30 833.00 325.00 NA NA NA
11 Koksara NA NA NA NA 38.00 442.40 215.70 686.00 349.60 35.00 NA NA
12 Golamunda NA NA NA NA 2.00 344.00 364.00 561.00 394.60 26.00 NA NA
13 Jaipatna NA NA NA NA NA 618.00 202.40 508.70 318.00 127.00 NA NA
District Average NA NA NA NA 41.67 456.09 243.94 689.68 396.16 43.35 NA NASource: DDA, Kalahandi, NA- Not Available
Table 2: Agro ecological and Climatic Conditions of Kalahandi
Western Undulating Zone (Kalahandi)
Red soil, medium rainfall, medium elevation
Golamunda
Red soil, high rainfall, medium elevation
M. Rampur
Red soil, high rainfall, high elevation
Koksara, M. Rampur
Red and yellow soil, high rainfall, medium elevation
Koksara, M. Rampur, Bhawanipatna
Black soil, high rainfall, medium elevation
Koksara, Kesinga
Forest soil M. Rampur, Koksara
Source: Macro and Micro Nutrient Status of the Soils of Odisha, OUAT
and DA & FP, Odisha
of the district. The block-wise and month
wise variations of rainfall in the district are
summarised in Table3. It may be observed
from Table 3 that Thuamul Rampur block
that is generally hilly and forested receives

8
District Human Development Report
the highest rainfall and Kesinga, Karlamunda
and Narla blocks receive poor rainfall. The
district normally records wide variations
in day and night temperatures in different
seasons. Table 4 provides month-wise
variations in temperature and monthly
and daily variations in relative humidity.
Agriculture in most parts depends generally
on the rain. Therefore, kharif is the main
crop of the district and most agricultural
operations are undertaken during the rainy
season. With improvement of irrigation
facilities in some blocks such as Dharamgarh,
Rabi crop is also gaining importance in some
parts of the district.
1.3 Soil
Cultivable land in the district can be
classified into four categories. Aatt lands
are mainly un-bounded uplands which
are less fertile and rain-fed. Maal lands are
bounded uplands and terraced to catch
run-off. Berna lands are medium or mid-low
lands with average fertility. Bahal lands are
low lands, which are generally plain fertile
lands suitable for paddy cultivation. Dangar
lands are located on hill slopes and are
occasionally utilized for shifting cultivation
while Bari lands are adjacent to homesteads
and are used generally as kitchen gardens
for cultivation of fruits and vegetables. Areas
along the banks of major rivers including
Udanti, Utei and Sagada rivers are generally
alluvial sandy and sandy loam spills. The
district has about 54 percent clay and sandy
loam soil, 32 percent red soil and 14 percent
black soil.
The soil is mostly acidic to neutral in
reaction with medium level of Nitrogen (N),
Phosphorous (P) and Potash (K). Table 5 and
6 summarise some characteristics of soils
including their nutrient index. The major
soil types of the district are: red soil (alfisol),
laterite and lateritic soils (ultisol and exisol)
and black soil (vertisol) with patches of forest
soils (humults). The distribution of different
soil types by block is given in Table 6, which
reports soil spread as percentage of total
area by block.
It may be observed from Table 6 that
Karlamunda block has the largest area
Table 4: Month-wise Temperature and relative Humidity: 2008
Month Air Temperature in 0C RH %
Kalahandi Kalahandi
Maximum Minimum Morning Evening
Jan 28.90 13.20 62 38
Feb 32.20 17.20 57 36
Mar 36.60 21.20 48 29
Apr 39.70 25.60 44 28
May 40.90 27.10 47 31
Jun 36.30 25.80 66 58
Jul 31.10 24.20 80 75
Aug 30.60 23.90 82 77
Sept 31.50 23.70 79 73
Oct 31.50 21.10 74 64
Nov 29.60 16.80 69 52
Dec 27.90 13.20 65 44
Mean 33.10 21.10 64 50
Source: IMD, GoI 2002
Table 5: Average Soil reaction and Nutrient Index
District pH% Nutrient Index [NI]
Acid Neutral Alkaline Org. C [N] Av. P Av. K
Kalahandi 36 52 12 1.35 1.88 2.00
[N.B: NI less than 1.5 = Low, 1.5 – 2.5 = Medium, > 2.5 = High]
Source: Macro and Micro Nutrient Status of the Soils of Odisha, OUAT and DA & FP, Odisha

9
District Background and Profile
(20%) covered with most fertile alluvial soils
and M. Rampur block has the lowest (2.5%)
area covered with alluvial soil. Golmunda,
Bhawanipatna and Koksara blocks have large
areas of black soil. The red laterite soils and
red and yellow soils are generally spread
all over the district and cover about 38.53
percent and 34.19 percent areas respectively.
Red soil is deficient in Phosphorous and
Nitrogen and is found all over the district,
mostly at the foot hills and on hilly slopes.
The soil is not only poor in nutrients, but are
also characterised by low water retention
capacity, low organic matter content and
poor productivity. Black soil is comparatively
more productive and good for cultivation
of cotton and other crops. Figure 2 shows
percentage composition of soil types.
1.4 River System
The Tel, Indravati and Jonk, key tributaries
of the Mahanadi river basin are major rivers
of the district. The Tel is the longest river,
spreading over a large area and has several
tributaries including Hati, Utei, Moter, Sagada,
Ret and Raul. In spite of a wide river network,
the district normally reels under drought due
to erratic and uneven rainfall, poor water
management and water conservation efforts
and practices.
1.5 Demography
The population of Kalahandi district, after
the re-organisation of Odisha’s districts in
1992-93, is summarised in Table 7. It may
be observed that the population of the
district increased from 326,578 in 1901 to
1,573,054 in 2011. There is an increase of
381.68 percent in the population of the
Table 6: Distribution of Soils by Block (soil spread as percentage of total area)
Block Alluvial Soil Black Soil Red soil Red & yellow soil
Red & Black soil
Bhawanipatna 16.00 32.00 16.00 36.00 NA
Kesinga 8.00 14.00 31.00 26.00 21.00
Th.Rampur NA NA 98.00 2.00 NA
Narla 7.00 NA 21.00 61.00 11.00
M.Rampur 2.50 NA 53.00 42.00 2.50
Lanjigarh 3.00 NA 75.00 22.00 35.00
Karlamunda 20.00 NA 20.00 25.00 35.00
Dharamgarh 10.00 10.00 37.50 32.50 30.00
Junagarh 5.00 5.00 23.00 37.00 NA
Koksara NA 32.00 23.00 31.00 14.00
Jaipatna NA NA 68.00 32.00 NA
Kalampur NA NA 24.00 76.00 NA
Golamunda 15.00 35.00 12.00 12.00 28.00
District average 6.60 9.60 38.53 34.19 10.26Source: Macro and Micro Nutrient Status of the Soils of Odisha, OUAT and DA & FP, Odisha, NA- Not Available
Figure 2: Soil Characteristics
54%
32%
14%
Red Soil
Black Clay
Clay and Sandyloam

10
District Human Development Report
district over the last 110 years from 1901
to 2011 as compared to 307.14 percent
population increase in Odisha for the same
period. Further analysis suggests that the
long term population growth trend for
the district yielded an annual compound
growth rate of 1.42 percent and a decadal
growth rate of 14.18 percent during the last
100 years from 1901 to 2001 as against the
annual compound population growth rate of
1.66 during 1991-2001 and 1.65 during 2001
to 2011. In comparison to Kalahandi, the
State recorded average annual exponential
growth rate of 1.51 between 1991-2001 and
1.32 during 2001-2011. The decadal growth
rate of the district was 18.09 between 1991-
2001 and 17.79 between 2001-2011. The
State recorded a decadal growth rate of
16.25 during 1991-2001 and 13.97 during
2001-2011. Change in the decadal growth
rate in Kalahandi, compared to 1991 is (-)
0.30 while that of the state is (-) 2.28. During
1991-2001, the district contribution to the
State population was 3.98 percent. District
share to the State population increased to
4.62 percent during 2001-11. It may also
be observed that the proportion of females
was higher in the initial decades. Though
the sex ratio in the district is still favourable,
the proportion of females per 1000 males
has declined from the highest (1,035 in
1931-41) to 1,001 in 2001. During 2011, the
district recorded an increase in the sex ratio
to 1003 (Odisha-978). During 2001, the
district was having 6th rank at the State level
in terms of sex ratio. With the improved sex
ratio in other districts during the decade
(2001-2011), the rank of the district at the
state level shifted to 10 with better sex ratio
during 2011 in comparison to 2001. But the
decreased sex ratio is marked in the 0-6 age
group as per 2011 census. During 2001, the
sex ratio of the district, in the 0-6 population,
was 984 (Odisha-953). In line with the
State trend, during 2011, the sex ratio of
the district decreased to 947 (Odisha-934).
In comparison to 0-6 years, a favourable
sex ratio is marked in the 7+ age group at
both district and state level. During 2001,
the sex ratio in the 7+ age group was 1004
(Odisha-976) in the district which increased
to 1013 (Odisha-985) during 2011.
Table 7: Population of the re-organised Kalahandi District: 1901 - 2011
Sl. No. Census Year
Male Female Total Sex Ratio Decadal Variation
(%)
1 1901 162,985 163,593 326,578 1,004
2 1911 194,187 198,819 393,006 1,024 20.34
3 1921 197,083 203,095 400,178 1,031 1.82
4 1931 234,058 242,349 476,407 1,035 19.05
5 1941 266,309 275,625 541,934 1,035 13.75
6 1951 289,639 296,186 585,825 1,023 8.10
7 1961 336,367 343,235 679,602 1,020 16.01
8 1971 410,415 414,560 824,975 1,010 21.39
9 1981 471,058 475,451 946,509 1,009 14.73
10 1991 565,595 565,308 1,130,903 999 19.48
11 2001 667,526 667,968 1,335,494 1,001 18.09
12 2011 785,179 787,875 15,73,054 1,003 17.79
Source: Census of India, 1901- 2001
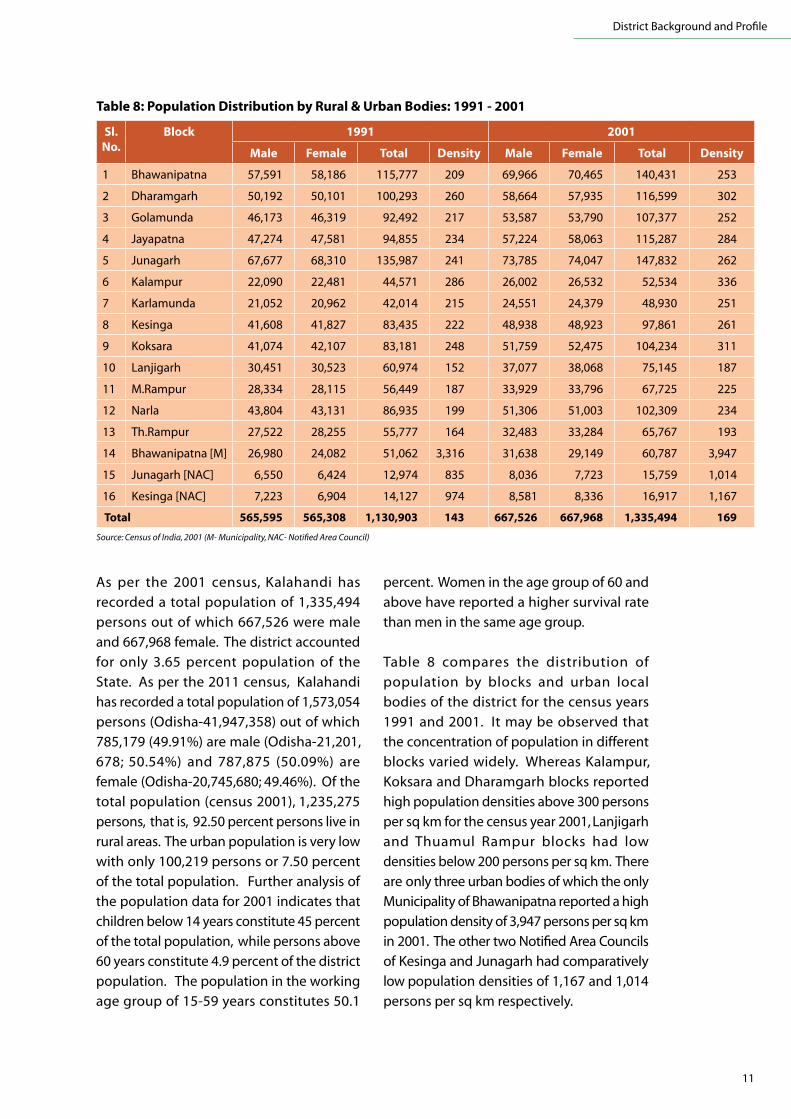
11
District Background and Profile
As per the 2001 census, Kalahandi has
recorded a total population of 1,335,494
persons out of which 667,526 were male
and 667,968 female. The district accounted
for only 3.65 percent population of the
State. As per the 2011 census, Kalahandi
has recorded a total population of 1,573,054
persons (Odisha-41,947,358) out of which
785,179 (49.91%) are male (Odisha-21,201,
678; 50.54%) and 787,875 (50.09%) are
female (Odisha-20,745,680; 49.46%). Of the
total population (census 2001), 1,235,275
persons, that is, 92.50 percent persons live in
rural areas. The urban population is very low
with only 100,219 persons or 7.50 percent
of the total population. Further analysis of
the population data for 2001 indicates that
children below 14 years constitute 45 percent
of the total population, while persons above
60 years constitute 4.9 percent of the district
population. The population in the working
age group of 15-59 years constitutes 50.1
percent. Women in the age group of 60 and
above have reported a higher survival rate
than men in the same age group.
Table 8 compares the distribution of
population by blocks and urban local
bodies of the district for the census years
1991 and 2001. It may be observed that
the concentration of population in different
blocks varied widely. Whereas Kalampur,
Koksara and Dharamgarh blocks reported
high population densities above 300 persons
per sq km for the census year 2001, Lanjigarh
and Thuamul Rampur blocks had low
densities below 200 persons per sq km. There
are only three urban bodies of which the only
Municipality of Bhawanipatna reported a high
population density of 3,947 persons per sq km
in 2001. The other two Notified Area Councils
of Kesinga and Junagarh had comparatively
low population densities of 1,167 and 1,014
persons per sq km respectively.
Table 8: Population Distribution by rural & urban Bodies: 1991 - 2001
Sl. No.
Block 1991 2001
Male Female Total Density Male Female Total Density
1 Bhawanipatna 57,591 58,186 115,777 209 69,966 70,465 140,431 253
2 Dharamgarh 50,192 50,101 100,293 260 58,664 57,935 116,599 302
3 Golamunda 46,173 46,319 92,492 217 53,587 53,790 107,377 252
4 Jayapatna 47,274 47,581 94,855 234 57,224 58,063 115,287 284
5 Junagarh 67,677 68,310 135,987 241 73,785 74,047 147,832 262
6 Kalampur 22,090 22,481 44,571 286 26,002 26,532 52,534 336
7 Karlamunda 21,052 20,962 42,014 215 24,551 24,379 48,930 251
8 Kesinga 41,608 41,827 83,435 222 48,938 48,923 97,861 261
9 Koksara 41,074 42,107 83,181 248 51,759 52,475 104,234 311
10 Lanjigarh 30,451 30,523 60,974 152 37,077 38,068 75,145 187
11 M.Rampur 28,334 28,115 56,449 187 33,929 33,796 67,725 225
12 Narla 43,804 43,131 86,935 199 51,306 51,003 102,309 234
13 Th.Rampur 27,522 28,255 55,777 164 32,483 33,284 65,767 193
14 Bhawanipatna [M] 26,980 24,082 51,062 3,316 31,638 29,149 60,787 3,947
15 Junagarh [NAC] 6,550 6,424 12,974 835 8,036 7,723 15,759 1,014
16 Kesinga [NAC] 7,223 6,904 14,127 974 8,581 8,336 16,917 1,167
Total 565,595 565,308 1,130,903 143 667,526 667,968 1,335,494 169
Source: Census of India, 2001 (M- Municipality, NAC- Notified Area Council)

12
District Human Development Report
According to census 2001, the Scheduled
Tribe (ST) population of the district was
385,273 i.e., 28.84 percent as against 22.13
percent ST population at the State level.
he Scheduled Caste (SC) population of the
district was about 17.67 percent as against
16.53 percent SC population at the State
level. The district thus has 46.51 percent
population of ST and SC communities as
against 38.66 percent at the State level.
Table 9 reports the distribution of ST and
SC population of the district by blocks and
ULB for 2001. There is a wide variation of ST
and SC communities in different blocks and
urban local bodies. Whereas 57.55 percent
of the population of Thuamul Rampur block
was reported as ST population, Karlamunda
block had the lowest ST population of only
15.18 percent out of 13 blocks, seven had ST
population below the district average. Only
three blocks including Thuamul Rampur
(25.65%), Lanjigarh (24.08%) and Narla
(18.42%) reported SC population above the
district average. M. Rampur block had the
lowest SC population of 13.94 percent.
This demographic analysis of Kalahandi has
thrown up several interesting observations.
Firstly, the district is predominantly rural and
has a high concentration of weaker sections
that is ST and SC communities. Secondly, it
has a population density of only 199 (census
2001-169) persons per sq km as against 269
(census 2001-236) for the State as per the
2011 census. If it is argued that those areas
with higher population density offer better
living conditions than those areas with lower
density, thus implying that Kalahandi offers
more difficult living conditions as compared
to many other parts of the State. Thirdly, the
population of Kalahandi has been growing
Table 9: Distribution of SC & ST Population by Block and urban Bodies: 2001
Name of The Block
SC Population % of SC Population
to Total Population
ST Population % of ST Population
to Total Population
Male Female Total Male Female Total
Bhawanipatana 13,616 13,475 27,091 24,103 24,864 48,967 34.87
Dharamgarh 10,256 10,219 20,475 17.56 10,169 10,364 20,533 17.61
Golamunda 9,047 9,292 18,339 17.08 13,566 13,979 27,545 25.65
Jaipatna 8,608 8,928 17,536 15.21 20,511 21,292 41,803 36.26
Junagarh 12,375 12,378 24,753 16.74 12,721 12,981 25,702 17.39
Kalampur 4,158 4,286 8,444 16.07 6,576 6,849 13,425 25.55
Karlamunda 4,001 4,084 8,085 16.52 3,706 3,721 7,427 15.18
Kesinga 7,573 7,573 15,146 15.48 13,146 13,388 26,534 27.11
Koksara 8,430 8,508 16,938 16.25 17,804 18,457 36,261 34.79
Lanjigarh 8,912 9,185 18,097 24.08 17,994 18,699 36,693 48.83
M.Rampur 4,730 4,714 9,444 13.94 13,213 13,211 26,424 39.02
Narla 9,324 9,520 18,844 18.42 13,575 13,806 27,381 26.76
Th. Rampur 8,417 8,455 16,872 25.65 18,543 19,307 37,850 57.55
Bh.Patana [M] 5,250 5,250 10,500 17.27 1,800 1,602 3,402 5.60
Junagarh [NAC] 1,195 1,377 2,572 16.32 281 367 648 4.11
Kesinga [NAC] 1,452 1,431 2,883 17.04 938 1,040 1,978 11.69
Kalahandi 117,344 118,675 236,019 17.67 188,646 193,927 382,573 28.65Source: Census of India, 2001 (M- Municipality, NAC- Notified Area Council)

13
District Background and Profile
at a faster rate, particularly in the recent
decades, than the State average. We have
also observed a higher long term annual
and decadal compound population growth
rate for the district than for the State. If it
is argued that an increasing population
trend signifies improving living conditions
and increasing social welfare, it implies that
the living conditions in Kalahandi district
have been improving because of several
development initiatives taken by the State
Government in recent years. Fourthly, though
the sex ratio in the district is still favourable,
the proportion of females per 1000 males has
been declining over the years. The sex ratio
declined sharply from the highest (1,035 in
1931-41) to 1,003 in 2011. Like other parts
of the State, urban areas still have lower sex
ratios than the rural areas. Fifthly, 45 percent
of the population of the district is very
young, i.e., under 15 years. Only 4.9 percent
of the population is above 60 years. About
50 percent of the population is within the
working age group of 15-59 years. Though
life expectancy at birth (LEB) has not been
systematically studied for the district, it is
expected to be lower than the State average.
1.6 Language and Culture
The major population segment of the
district speaks an Odiya dialect called
Sambalpuri with minor modifications in
pronunciation. Odiya language is preferred
for writing and official communication.
Different tribal communities like the
Kondhas, Mundas and others use their
own tribal dialects. Increasing economic
activities and development initiatives have
accelerated the process of integration of
tribal communities with the mainstream
population. As a result of this, many tribal
communities have started speaking Odiya.
Due to the proximity to Chhattisgarh, people
of some blocks have a good understanding
of Hindi. As in other parts of Odisha, people
of Kalahandi celebrate a number of festivals.
Nuakhai is a very important festival, not only
of Kalahandi district but in Western Odisha.
Tribal communities also observe a number
of festivals and rituals. The annual official
festival of the district, Ghumura, derives its
name from a well known folk dance form of
Western Odisha, of which Kalahandi is a part.
1.7 Social Structure
The social composition of the district is not
uniform. There are wide variations across
the district. The main castes / sub-castes
of the district include Bairagi, Bangti, Bhulia,
Brahmin, Dosi, Gaura, Karan, Kosta, Kshyatria,
Kulta, Kurmi, Mali, Paik, Sampuas, Sunari and
Sundhi. As reported earlier, there is a high
concentration of SC and ST communities
(46.51%). Out of the total 36 Scheduled
Castes recorded in the district, the most
numerous are the Dom, Ganda, Chamar,
Ghasi, Dhoba, Mehera, Beldar and Panika.
The ST population in the district comprises
28.6 percent of the total population. Of the
46 tribes found in this district, the important
ones are Banjara, Bhottada, Bhunjia, Binjhal,
Dal, Gond, Kandha, Mirdha, Munda, Paroja
and Shabar. These 12 tribes account for 97
percent of the tribal population of the district.
1.8 Industry and Minerals
A number of minerals including Bauxite,
Graphite, Manganese, Iron and Quartz
are available in the district. Of these, only
Bauxite and Graphite has been commercially
exploited. Bauxite is found in Lanjigarh block
at Niamgiri on a large scale. Vedanta has
acquired mining rights for bauxite and has
established the Vedanta Alumina Refinery
at Lanjigarh. The district also has few other
industries which include Konark Growers
Cooperative Spinning Mills Ltd, Kesinga,
Odisha Regional Cooperative Oil Seed
Growers Union Ltd. at Bhawanipatna, and
Western Sugar & Chemical Industries Ltd,
Bhawanipatna.

14
District Human Development Report
1.9 District Development Indicators
Education, health and income are
important indicators that decide the
human development of a Nation, State or
District. According to the first State Human
Development Report, 2004, the value of
the Human Development Index (HDI)
for Kalahandi district is 0.606 as against
Odisha’s overall HDI of 0.579. The district
had an HDI above the State average and
was ranked 11th among in the State. Of the
three components of the district HDI, the
education index was 0.585, the health index
0.763 and the income index 0.471. This
Unit Kalahandi Odisha
Total Literates (2011) Number 818,396 27,112,376
Male Literates (2011) Number 495,187 15,326,036
Female Literates (2011) Number 323,209 11,786,340
Literacy Rate % 60.22 73.45
Male Literacy Rate (2011) % 73.34 82.40
Female Literacy Rate (2011) % 47.27 64.36
S C Literacy Rate [2001]Male [2001]Female [2001]Total [2001]
%63.7630.8047.12
70.4740.3355.53
S T Literacy RateMale FemaleTotal
%51.7017.1534.17
51.4823.3733.37
Educational Level Attained
Without Education Level Number 21,295 3,346,157
Below Primary Level Number 174,170 4,090,028
Primary Level Number 156,321 NA
Middle Level Number 67,866 NA
Matric/Higher Secondary/Diploma Number 75,827 1,252,635
Graduate and above Number 17,904 NA
Type of House
Permanent % 29.30 27.60
Semi-Permanent % 63 25.00
Temporary % 7.70 NA
Number of BPL Families Number 193,054 4,504,765
Number of SC/ST BPL Families Number 111,884 NA
Percentage of BPL Families % 62.71 66.37
Per Capita Income Rs. 0.471 0.545
Human Development Index Rank HDI Rank 11 11
Total Workers Number 620,950 14,276,488
Main Workers Number 382,050 9,589,269
Marginal Workers Number 238,900 4,687,219
Non-workers Number 714,544 22,528,172
Total Workers to Total Population % 46.50 38.79
Cultivators to Total Workers % 29.63 29.75
Agriculture Labourers to Total Workers % 50.33 35.02
Table 10: Key Development Indicators for Kalahandi District vis-à-vis Odisha

15
District Background and Profile
Unit Kalahandi Odisha
Workers in Household Industry to Total Workers % 2.87 4.91
Main Workers to Total Population % 28.61 26.05
Marginal Workers to Total Population % 17.89 12.74
Non-Workers to Total Population % 53.50 61.21
Drinking Water Facilities Village 2,082 NA
Safe Drinking Water Village 2,012 NA
Electricity [Power Supply] As on 31.3.2009 Village 1,014 28,871
Electricity [domestic] Village 618 NA
Electricity [Agriculture] Village 159 NA
Primary School [2010-11] No 2,234 50,387
Middle Schools [2010-11] No 761 21,656
Secondary/Sr. Secondary Schools [2010-11] No 305 7,974
Junior Colleges [2010-11] No 43 1293
Senior Colleges [2010-11] No 19 653
Medical Facility NA NA
Primary Health Centre [2010-11] No 43 1,227
Primary Health Sub-Centre No 198 NA
Post, Telegraph and Telephone Facility [2010-11] No 307 8,161
Bus Services Village 449 NA
Paved Approach Road Village 828 NA
Mud Approach Road Village 1,802 NA
Average size of Operational Holding 2000-01 Ha. 1.62 1.25
Variation in Rainfall % [+]62.8 [+]13
Yield Rate of Rice [Kg/Ha] [2010-11]KharifRabiTotal
Kg/Ha 32.3038.431,119
2,3281,557
Production of Wheat [2010-11] Quintals 164 41740
Production of Maize [2010-11] Quintals 34,141 2,988,106
Production of Ragi [2010-11] Quintals 7,840 469,038
Production of Groundnut [2010-11] Quintals 42,416 856,645
Net Area Sown to Total Reported Area % 62.67 63.10
Cropping Intensity % 169 163
Net Irrigated Area to Net area Sown % 36.66 35.41
Gross Irrigated Area to Gross Cropped Area % 38.71 35.15
Rate of Fertilizer Consumption[Kg/Ha] [2011-12] Kg/Ha 77.22 NA
Forest Area of Geographical area % 32.05 37.34
Share of forest Area to State Forest Area % 4.37 100
Govt. Medical Institutions per lakh of Population Number 6 7
Govt. Medical Institutions per '000 sq.km of Area [2010-11]
Number 10 11
No. of Hospital Beds per lakh of Population [2010-11]
Number 33 37
No. of Primary Schools per lakh of Population [2011]
Number 142 120
No. of Upper Primary Schools per lakh of Population
Number 41 47
No. of Primary Schools per lakh of Population Number 18 20

16
District Human Development Report
Unit Kalahandi Odisha
Road Length per '000 sq.km. Area Km 1,627 1,480
Road Length per lakh of Population Km 965 626
No of Banks per lakh of Population Number 6 7
Average Coverage of Area per Bank Sq. km 100 65
Credit Deposit Ratio of all Scheduled Commercial Banks
% 87.85 64.00
No. of Post Offices per lakh of Population Number 20 19
Average Coverage of Area per Post Office Sq. Km 26 19
Per Capita Consumption of Fish Kg 9.30 9
Per Capita Consumption of Milk Lt 19 36
Per Capita Consumption of Egg [no] Number 33 35
% of Villages Electrified % 64 81
Infant Mortality Rate[2010-11] 59.00 62.00
Human Development Index, 2004 0.606 0.579Source: Census of India, 2001,1997 BPL Census, Odisha survey-2005-2006
HMIS, NRHM 2008
suggests that though the district has done
reasonably well in terms of health indicators,
it has not done well with respect to education
and income generation. The district reported
an overall literacy rate of 45.94 percent with
a male literacy rate of 62.66 percent and a
female literacy rate of only 29.28 percent as
per the 2001 census. This was much lower
than the State average of 63.10 percent for
the 2001 census. It may be observed that at
present the National Sample Survey (NSS)
methods for poverty estimate are not good
enough to estimate poverty at the district
level. Hence, poverty estimation is made at
a regional level. Kalahandi district is a part of
the KBK region that has a very high incidence
of poverty with 87.10 percent living below
the poverty line in 1999-2000 as per the 55th
round of NSS estimations. As per the Ministry
of Rural Development’s methodology for
identification of BPL households, Kalahandi
reported 62.71 percent families Below the
Poverty Line in the 1997 BPL census. The
district has reported 620,950 workers of
which 382,050 are main workers and 238,900
are marginal workers. These and other key
development indicators for the district are
summarised in Table 10. Some of these
development indicators shall be studied in
greater details in the following chapters.
Even though it is richly endowed with
natural resources, Kalahandi has in the
recent past attracted adverse publicity for
alleged starvation deaths, heavy incidence
of poverty and poor development. It is
one of the four districts that have been
identified by the State Government to
prepare and publish the first District
Human Development Report (DHDR).
During the previous century, the district
experienced recurrent droughts of varying
intensities at least once in every 3-4
years. It is predominantly rural and has a
sizable population (46.51%) of ST and SC
communities. Though the population
density of 169 persons per sq km, as per the
2001 census, is lower than the State average
of 236, its population is growing in recent
years at a rate faster than the State growth
rate. Though sex ratio is rapidly declining,
it is still favourable having 1,003 females
per 1,000 males. Only about half of the
population of the district is in the working
age group of 15-59 years.
As part of the Eastern Ghats, the district
has a varied topography and a number of
rivers. Its soil is generally acidic and often
of poor productive potential. Its major soil
types include red soil, lateritic soil, black

17
District Background and Profile
- • -
soil, alluvial soil and forest soil. It is located
in the Western undulating agroclimatic
zone. Kharif is the main crop for the district
though in some parts where irrigation
facilities have improved, the Rabi crop is
gaining importance. The Vedanta Alumina
Refinery at Lanjigarh is a large industry
in the district that in general is poorly
industrialised. Agriculture and allied sectors
including forests still play a major role in the
economic life of the people. As a result of
several recent initiatives taken by the State
Government and Government of India, the
development process in the district has
been accelerated.
The last section of this chapter summarises
key development indicators for the district.
Though the district has done reasonably
well in terms of health indicators, it lags
considerably behind several other districts
in terms of education and income indicators.
It offers limited livelihood options and has
a very high incidence of poverty. The next
chapter analyses economic growth, poverty
and livelihood issues in the district.

Growth, Poverty and Livelihood
Chapter 2
“Life is not a continuum of pleasant choices, but of inevitable problems that call for strength, determination, and hard work.”
- Indian Proverb
“Life is not a continuum of pleasant choices, but of inevitable problems that call for strength, determination, and hard work.”
- Indian Proverb


21
Growth, Poverty and Livelihood
Goal 1 : Eradicate extreme poverty and hunger
Goal 2 : Achieve universal primary education
Goal 3 : Promote gender equality and empower women
Goal 4 : Reduce child mortality
Goal 5 : Improve maternal health
Goal 6 : Combat HIV/AIDS, malaria and other diseases
Goal 7 : Ensure environmental sustainability
Goal 8 : Develop a Global Partnership for Development
The MDGs: l Synthesise, in a single package, many of the most important commitments made
separately at international conferences and summits during the 1990s;
l Recognise explicitly the interdependence between growth, poverty reduction and
sustainable development;
l Acknowledge that development rests on the foundations of democratic governance,
the rule of law, respect for human rights, peace and security;
l Are based on time-bound and measurable targets accompanied by indicators for
monitoring progress; and
l Bring together, in the eighth Goal, the responsibilities of developing countries with those
of developed countries, founded on a global partnership endorsed at the International
Conference on Financing for Development in Monterrey, Mexico in March 2002, and
again at the Johannesburg World Summit on Sustainable Development in August 2002.
Box 1: Millenium Development Goals (MDGs)

22
District Human Development Report
3 The primary sector includes agriculture, animal husbandry, fisheries, forestry, mining and quarrying4 Agriculture and allied sectors include agriculture, animal husbandry, fisheries and forestry.
The concept of Human Development, as
conceived by UNDP, focuses on several
variables including income and sustainable
employment and livelihoods that are
necessary for living healthy and fulfilled
lives. In order that the main development
challenges are adequately addressed
by the World Community, the United
Nations Millennium Summit adopted eight
Millennium Development Goals (MDGs) in
September 2000. These MDGs are listed in
Box 1 below and need to be realised in a time-
bound manner. The Summit also articulated
21 quantifiable targets and 60 measurable
indicators to track progress on the MDGs
from time to time. The first MDG pertained
to the eradication of extreme poverty and
hunger. The following three quantifiable
targets and nine monitorable indicators were
prescribed to track the progress of the first
MDG which is summarised in Box 2.
This chapter analyses the status of, and
issues pertaining to the diversification and
growth of the district’s economy, incidence
of extreme poverty and employment and
livelihood options available in Kalahandi.
The next section gives a brief account of the
major sectors of the district economy, work
participation rates, incidence of poverty
and distribution of household incomes. A
livelihood profile of the district has been
discussed in the next section. The status of
various economic sectors including forests,
agriculture, horticulture, animal husbandry,
fisheries and other sources of employment
and income are discussed in the subsequent
sections. The growth of financial services,
indebtedness and migration are dealt with
in the end.
2.0 Structure of the District Economy
Kalahandi contributes about three percent
of the Gross State Domestic Product (GSDP)
of Odisha that is slightly less than the average
district share of 3.33 percent. The district
economy is dominated by the primary sector3
that contributes roughly half of the Gross
District Domestic Product (GDDP). Table 11
summarises sectoral contributions to GDDP
for Kalahandi from 1999-2000 to 2004-05. The
agriculture and allied sectors4 contributed
49.44 percent to the real GDDP (measured
in 1999-2000 pr ices) in 1999-2000. The
mining and quarrying sub-sector made a
small contribution of 0.11 percent. The
share of the primary sector in the real GDDP
of the district has come down from 49.44
percent in 1999-2000 to 41.99 percent in
2004- 05. The components of the forestry
and fisheries sectors are comparatively very
Box 2: MDG 1: eradicate extreme Poverty and Hunger
l To reduce extreme poverty by half by
2015 and to be periodically measured
by the proportion of people below
the poverty line (BPL), poverty gap
ratio and the share of poorest quintile
in national consumption.
l To achieve full and productive
employment and decent work for
all, including women and young
people and to be tracked by way
of the growth rate of GDP per
person employed, employment
to- population ratio, proportion of
employed BPL and proportion of
own account and contributing family
workers in total employment.
l To reduce the proportion of people
who suffer from hunger by half
by 2015 and to monitor by way of
proportion of underweight children
under-five years of age and proportion
of population below the minimum
level of dietary energy consumption.

23
Growth, Poverty and Livelihood
Odisha has grown from Rs.10,567 in 1999-
2000 to Rs.13,329 in 2004-05 at a compound
annual rate of 3.95 percent. This analysis
suggests that the district economy and per
capita district income have been growing
at rates much slower than those for the
State economy and per capita State income.
The district economy has been diversifying
slowly. It may be observed from Table 11
that there are wide fluctuations in the GDDP
from year to year mainly because of adverse
impacts of natural calamities such as floods
and droughts in 2000-01 and 2002-03. The
district economy registered negative growth
rates of -2.44 percent in 2000-01 and -6.06
percent in 2002-03 and positive growth rates
of 20.07 percent in 2003-04, 4.02 percent in
2004-05 and 2.37 percent in 2001-02.
2.1 Work Participation Rates
Out of a total population of 13.35 lakh persons
(6.67 lakh male and 6.68 lakh female) as per
the 2001 census, 6.21 lakh persons (3.81 lakh
male and 2.40 lakh female) were termed
as employed. The work participation rate
was 46.52 percent, with the male work
5 For the purpose of this analysis, the tertiary and services sectors include utilities, trade, construction and real estate services, banking and
finance and all other services.
Table 11: Sectoral Composition of real GDDP of Kalahandi District: 1999-2005 (At 1999-2000 Prices)
Sector Real GDDP (%)
1999-20 2000-01 2001-02 2002-03 2003-04 2004-05
Agriculture & A.H. 44.94 42.23 42.57 34.84 40.94 37.44
Forestry 3.54 3.72 3.64 4.12 3.27 3.16
Fisheries 0.95 1.19 1.26 1.37 1.26 1.17
Mining & Quarrying 0.11 0.08 0.10 0.16 0.19 0.21
Manufacturing 3.84 3.58 2.58 3.53 3.08 3.30
Utilities 4.25 4.15 4.10 3.72 4.91 5.76
Construction-Real Estate 12.12 12.91 12.62 14.62 11.77 12.50
Banking & Finance 2.19 2.45 2.69 3.29 2.73 2.84
Trade 6.83 7.30 7.21 7.90 7.82 8.72
Services 21.21 22.38 23.24 26.46 24.03 24.90
Real GDDP (Rs. crore) 1,359.62 1,326.39 1,357.88 1,275.54 1,531.48 1,592.97
Source: Odisha Economic Survey
small, being about 3.50 percent and 1.20
percent respectively. Though the share of
agriculture and allied sectors in GDDP has
been declining, the share of mining and
quarrying has increased from 0.11 percent
in 1999-2000 to 0.21 percent in 2004-05.
The tertiary and service sectors5 have been
growing and their contribution to the GDDP
is of the same order as that of the primary
sector. The share of the tertiary and service
sectors has increased from 42.36 percent in
1999- 2000 to 48.96 percent in 2004-05. The
contribution of the manufacturing sector is
very small (3.50%).
The real GDDP of Kalahandi has grown at
a simple average rate of 3.59 percent per
annum and compound annual growth rate
of 2.68 percent from 1999-2000 to 2004-05
against a simple average growth rate of 6.48
percent per annum and compound annual
growth rate of 5.21 percent for Odisha for the
same period. The per capita real Net District
Domestic Product (NDDP) has grown from
Rs.9,569 in 1999-2000 to Rs.10,319 in 2004-05
at a compound annual rate of 1.27 percent.
In contrast, the per capita real NSDP for

24
District Human Development Report
participation rate of 57.12 percent and the
female work participation rate of 35.93 percent
in 2001. Table 12 analyses work participation
rates for Kalahandi district from 1999-2000 to
2007-08 based on projected population and
employed persons for 1999-2000, 2004-05 and
2007-08. The work participation rates have
varied in a narrow range from 46.75 percent
in 1999-2000 to 46.78 percent in 2004-05, the
male work participation rates being about 57
percent and the female work participation
rates of 35 percent.
The real NDDP per employed person
varied from Rs. 22,216.01 in 1999-2000 to
Rs. 24,357.34 in 2004-05 in Kalahandi. The
lowest real NDDP per employed person was
Rs.19,992.79 in 2002-03, the year in which
the district suffered a very severe drought.
Table 13 summarises work participation rates
for different blocks and ULB of Kalahandi
district for 2001. It may be observed from
Table 13 that there are wide variations
in work participation rates in different
blocks and urban local bodies. The work
participation rate of 41.4 percent was the
lowest for Karlamunda block and the highest
in Kalampur block at 54.2 percent. Seven out
of thirteen blocks including Bhawanipatna,
Golamunda, Jaipatna, Kalampur, Koksara,
Lanjigarh and Thuamul Rampur reported
higher work participation rates than the
district average (46.5%) in 2001. Three ULBs
of Bhawanipatna, Junagarh and Kesinga
reported work participation rates of 29.5
percent, 32.9 percent and 33.5 percent
respectively. There are also wide variations
in the work participation rates for males and
females in different blocks and urban bodies.
The work force of Kalahandi has also been
studied from the perspective of their major
occupations as per census data available
from 1971 to 2001. Following the census
methodology, the work force has been
classified as cultivators, agricultural labourers
persons engaged in household industry and
persons engaged in other service sectors.
Table14 provides the classification of the
work force of Kalahandi district by major
occupations for the period 1971-2001. It
may be observed from Table 14 that the
proportion of the population that directly
depended on agriculture and allied activities
has declined from 85.66 percent in 1971 to
80.00 percent in 2001 and the proportion
of the workforce engaged in the non-farm
sector has increased from 14.34 percent in
1971 to 20.00 percent. The percentage of
cultivators has declined by 23.89 percent
from 53.57 percent in 1971 to 29.68 percent
in 2001 and that of agricultural labourers
has increased by 18.23 percent from 32.09
percent in 1971 to 50.32 percent in 2001.
It is encouraging to note that the work
force has been diversifying from the farm
sector to non-farm sectors, albeit at a
very slow rate. It also seems that about
18.23 percent cultivators, mainly small and
marginal farmers, have got reduced to the
status of agricultural labourers perhaps
because of repeated fragmentations of
Table 12: The Work Participation rates for Kalahandi: 1999-2000 to 2007-2008Year Population
(lakh)Employed Persons
(lakh)Work Participation
Rate (%)
Total Male FemaleTotal
Total Male Female Total Male Female
1999-00* 13.09 6.54 6.55 6.12 3.76 2.36 46.75 57.49 35.03
2001 13.35 6.67 6.68 6.21 3.81 2.40 46.52 57.12 35.93
2004-05* 13.98 6.99 6.99 6.54 4.02 2.52 46.78 57.51 36.05
2007-08* 14.50 7.25 7.25 6.78 4.16 2.61 46.76 57.38 36.00
Source: Census 2001 * DES, Odisha projections

25
Growth, Poverty and Livelihood
their holdings and other factors. Though
these trends are not much different than
the ones elsewhere in Odisha, this aspect
needs to be carefully studied and factors
that have caused conversion of cultivators
into agricultural labourers need be
carefully evaluated. Further analysis of
main occupations of different households
of Kalahandi district shall be discussed in
subsequent sections.
Table 13: Work Participation rates by Blocks and urban Local Bodies: 2001Block/Urban Bodies
Population (lakh)
Persons Employed (lakh) Work Participation Rate (%)
Male Female Total Male Female Total Male Female Total
Blocks
Bhawanipatna 0.70 0.70 1.40 0.41 0.27 0.68 58.30 39.10 48.70
Dharamgarh 0.59 0.58 1.17 0.33 0.21 0.54 56.50 35.70 46.20
Golamunda 0.53 0.54 1.07 0.31 0.20 0.51 57.50 36.70 47.10
Jaipatna 0.57 0.58 1.15 0.35 0.27 0.62 60.80 47.00 53.80
Junagarh 0.74 0.74 1.48 0.43 0.26 0.69 57.70 35.20 46.40
Kalampur 0.26 0.27 0.53 0.15 0.13 0.28 60.30 48.20 54.20
Karlamunda 0.25 0.24 0.49 0.14 0.06 0.20 56.50 26.20 41.40
Kesinga 0.49 0.49 0.98 0.28 0.15 0.43 57.70 30.00 43.90
Koksara 0.52 0.52 1.04 0.30 0.21 0.51 58.60 40.00 49.20
Lanjigarh 0.37 0.38 0.75 0.21 0.16 0.37 55.70 43.70 49.60
M. Rampur 0.34 0.34 0.68 0.19 0.10 0.29 57.20 30.80 44.00
Narla 0.51 0.51 1.02 0.30 0.15 0.45 58.10 28.90 43.60
Th. Rampur 0.32 0.33 0.65 0.17 0.16 0.33 53.80 49.10 51.40
Urban Local Bodies
Bhawanipatna [M] 0.32 0.29 0.61 0.15 0.03 0.18 47.30 10.20 29.50
Junagarh [NAC] 0.08 0.08 0.16 0.04 0.01 0.05 52.30 12.80 32.90
Kesinga [NAC] 0.09 0.08 0.17 0.05 0.01 0.06 53.80 12.70 33.50
Kalahandi 6.67 6.68 13.35 3.81 2.40 6.01 57.10 35.90 46.52Source: Census 2001
2.2 Incidence of Poverty
The NSS estimates for extreme poverty,
measured as Head Count Ratio (HCR), are
available only for states and NSS regions. The
NSS estimates for poverty are not available at
the district level. Kalahandi district is a part
of the Southern NSS region for Odisha and
considered as one of the poorest regions of
the country. The incidence of rural poverty
Table 14: Work Force of Kalahandi by Major Occupations: 1971-2001Occupation Category Total Work Force: Kalahandi
(%)Total Work Force: Odisha
(%)
1971 1981 1991 2001 1971 1981 1991 2001
Cultivators 53.57 50.80 42.84 29.68 49.16 47.00 44.38 29.70
Agricultural Labourers 32.09 35.29 41.10 50.32 28.28 27.65 28.76 35.04
Household Industry 2.82 2.65 2.70 2.87 3.63 3.47 3.17 4.83
Other Services 11.52 11.26 13.36 17.13 18.93 21.88 23.69 30.43
Total 100.00 100.00 100.00 100.00 100.00 100.00 100.00 100.00
Source: District Statistical Abstract of Kalahandi 1970–1971, 1980–1981, 1993 and 2001
Directorate of Economics & Statistics, Odisha.

26
District Human Development Report
in this region was estimated at 87.10 percent
in 1999- 2000 (55th round of NSS) and 62.50
percent in 2004-05 (61st round of NSS) as
against 48.10 percent in 1999-2000 and
35.50 percent in 2004-05 for Odisha. It is
heartening to note that the southern NSS
region registered an impressive poverty
reduction of 24.60 percentage points from
1999-2000 to 2004-05 because of several
development programmes initiated by the
State Government and Government of India
in the KBK region. Though NSS estimates for
poverty for Kalahandi are not available, it may
be argued that the district has had a very
high incidence of poverty in 1999-2000 and
2004-05. It is also expected that Kalahandi
had similar levels of poverty reduction as
the southern region during that period. The
poverty levels in the southern region as well
as in Kalahandi are still very high.
A methodology for identification of
Below Poverty Line (BPL) households has
been prescribed by the Ministry of Rural
Development, Government of India from
time to time. Following this methodology,
the State Panchayati Raj Department has
mounted BPL censuses in 1992, and 1997
to identify rural BPL households. The BPL
census for 1992 returned 85.77 percent BPL
households and the BPL census for 1997
reported 62.71 percent BPL households in
the district. Table 15 compares the extent
of BPL households in different blocks on the
basis of 1992 and 1997 BPL censuses.
It may be observed from Table 15 that there
are wide variations in the extent of BPL
households in different blocks. As per the
1997 BPL census, Thuamul Rampur block
has reported the highest (88.76%) incidence
of BPL households and Koksara block has
returned the lowest (38.48%) incidence of
BPL households. An analysis suggests that
34.02 percent of ST households, 23.39 percent
SC households, 41.51 percent households
Table 15: BPL Households in Different Blocks: 1992 & 1997Blocks BPL HH
1992 (%)
BPL HH1997(%)
SC & ST BPL HH 1997
(% out of total BPL)
BPL HH By Occupations 1997
(% out of total BPL)
SC ST Small Farmers
Marginal Farmers
Artisans Agricultural Labourers
Bhawanipatna 75.56 55.68 25.41 40.98 15.49 25.39 1.81 39.56
Kisinga 86.08 70.01 24.54 27.78 11.83 28.51 1.73 48.57
Karlamunda 84.85 49.51 23.83 17.90 20.17 31.60 1.87 41.73
M. Rampur 86.55 80.23 20.64 43.37 21.92 27.52 1.57 44.44
Narla 83.88 54.89 14.34 18.76 10.06 19.06 0.83 20.81
Lanjigarh 87.05 75.81 28.37 46.37 19.53 17.26 0.87 44.15
Th. Rampur 93.81 88.76 29.14 55.35 19.85 21.04 1.47 40.12
Dharamgarh 86.22 64.26 23.84 19.51 24.70 30.95 1.66 36.23
Junagarh 95.40 61.38 22.02 19.36 16.48 14.38 2.95 40.00
Kalampur 87.45 51.77 17.26 27.48 16.03 8.44 2.20 57.13
Jaipatna 85.34 66.59 23.19 38.70 18.30 18.04 1.90 47.00
Koksara 90.97 38.48 22.67 35.00 29.09 22.37 1.86 39.34
Golamunda 88.43 62.77 21.21 32.72 20.83 26.46 2.03 42.33
Kalahandi 85.77 62.71 23.39 34.02 19.59 23.95 1.80 41.51Source: District Rural Development Agency, Kalahandi, Odisha.

27
Growth, Poverty and Livelihood
of agricultural labourers and 43.54 percent
households of small and marginal farmers
have been reported as BPL households as per
the 1997 BPL census. An analysis of income
distribution patterns of different types of
households of Kalahandi, as per the BPL
Census conducted by the State Panchayati Raj
Department, is presented in the next section.
2.3 District Income Distribution Patterns
Table 16 summarises the distribution of rural
households (HH) of Kalahandi by blocks
and monthly income classes. It may be
observed from Table 16 that 32.46 percent
rural HH have a monthly income of less than
Rs.250, 44.11 percent rural HH are within the
monthly income class of Rs. 250-499, 17.23
percent in the monthly income class of Rs.
500-1499, and only 5.95 percent rural HH
have monthly incomes above Rs.1500.
It may be observed from Table 16 that there
are wide variations across blocks as regards
distribution of rural HH by monthly income
classes. Thuamul Rampur block has 77.15
percent rural HH in the monthly income
class of Rs. 250 followed by Lanjigarh block
that has 49.31 percent rural HH. About 95.96
percent rural HH in Thuamul Rampur block
and 88.09 percent rural HH in Lanjigarh
blocks have monthly incomes less than
Rs.500. Clearly these two blocks that have
very high concentrations of ST communities
are very poor blocks. On the other hand,
Kalampur block has only 11.76 percent HH
with monthly incomes less than Rs.250 and
52.50 percent HH with monthly incomes
less than Rs. 500. M. Rampur block has the
highest proportion (10.65%) of HH with
monthly incomes above Rs.1500. Kalampur
block has 10.03 percent HH with monthly
incomes above Rs.1,500 and the highest
proportion of 5.13 percent HH with monthly
incomes above Rs. 2,500. Most ST and SC
households in the district have monthly
incomes less than Rs. 500. In Thuamul
Rampur block, more than 80 percent ST
families and 75 percent SC families have
Table 16: Distribution of rural Households of Kalahandi by Monthly Income LevelsSl. No.
Block Total HH(Number)
Less than Rs. 250
Between Rs.251-
499
Between Rs.500-
1499
Between Rs.1500-
2500
More than Rs.2500
1 Bhawanipatna 39,250 38.36 38.91 17.84 2.05 2.77
2 Dharamgarh 29,415 21.55 50.47 20.06 2.97 4.76
3 Golamunda 31,635 26.24 56.02 14.15 1.54 1.77
4 Jayapatna 30,000 43.17 35.47 13.95 2.47 4.73
5 Junagarh 42,060 24.26 47.82 20.42 2.80 4.08
6 Kalampur 14,365 11.76 40.74 37.45 4.90 5.13
7 Karlamunda 14,119 29.35 50.84 13.98 2.29 3.46
8 Kesinga 28,170 28.82 47.22 17.43 2.25 4.21
9 Koksara 28,230 30.52 47.95 15.33 2.50 3.68
10 Lanjigarh 20,649 49.31 38.78 8.37 1.48 1.77
11 M.Rampur 19,800 13.66 45.34 30.31 5.98 4.67
12 Narla 30,042 32.39 46.22 15.78 2.28 3.28
13 Th.Rampur 18,736 77.15 18.81 2.60 0.38 0.27
Kalahandi 346,471 32.46 44.11 17.23 2.50 3.45
Source: BPL Census, 2002

28
District Human Development Report
monthly incomes less than Rs. 250. This
implies that there are acute inequalities in
income distribution in Kalahandi district.
2.4 Rural Housing
Housing is one of the basic needs for a human
being and the quality of house represents
the socio-economic status of a family. This
section attempts an analysis of housing types
in the district. Available data indicates that
of all Below Poverty Line (BPL) households
(HH), about 4.5 percent are without any
house of their own and 70.6 percent HH
have kuccha houses. About 21 percent
HH have semi-pucca houses and only a
small proportion of about 3.6 percent HH
have pucca and urban type houses. Figure
3 explains the types of house available to the
population of the district.
Jaipatna block has reported the highest
(7.9%) houseless families followed by Th.
Rampur block with 6.2 percent houseless
HH and Koksara block with 5.90 percent
houseless families. Golmunda block
reported the lowest percentage (1.4%) of
houseless families followed by Dharamgarh
block with 2.2 percent HH without houses
of their own. Thuamul Rampr block has
the highest proportion (84.16%) of HH
with kuccha houses followed by Lanjigarh
block with 83.9 percent HH with kuccha
houses. Karlamunda and Kalampur blocks
have highest percentages of rural HH
(5.6% and 5.0% respectively) with pucca
houses. ST and SC households have a
relatively large number of families without
houses or with kuccha houses. In Thuamul
Rampur and Lanjigarh blocks, which are
scheduled areas, about 43.35 percent and
44.55 percent HH respectively have been
reported without houses.
In order to improve housing facilities for
BPL households, the State Government
has launched two schemes: (i) “Vasundhara"
which aims at providing government land
upto four decimal to those HH which do
not own any homestead land, and (ii) “Mo Kudia” to assist BPL HH to have their own
houses. With support from Government
of India, Indira Awas Yojana (IAY) has been
implemented to provide support to BPL
families to construct pucca houses. About
11.2 percent HH without houses or with kutcha
houses have been assisted under IAY.
2.5 Livelihood Profile
Livelihood consists of a set of economic
activities which individuals or households
are engaged in with a view to meet their
multiple requirements for sustained living.
A livelihood is a function of capabilities and
assets possessed, and activities pursued, by
individuals or HH to secure means for their
living. A livelihood is sustainable when it
is capable of coping with, and recovering
from, stresses and shocks that it faces from
time to time. In order that livelihoods
continue to be sustainable, it is desirable
that people’s capabilities continue to
improve and productivities of their assets
are maintained and improved over time
without impairing the underlying natural
resource base. Sustainable livelihoods and
livelihood security are prerequisites for
fulfilled lives. Individuals and HH exploit
available resources and are engaged in
Figure 3: House Type
Houseless Kutcha
Semi Pucca Pucca
Urban Type
71% 21%
3%0%
5%
Rural Household

29
Growth, Poverty and Livelihood
multiple economic activities to meet their
livelihood needs. This section examines
how people of Kalahandi are economically
engaged and secure their livelihoods.
Table 17 reveals the distribution of workers
into different classes including cultivators,
agricultural labourers, workers engaged
in household industries and persons
engaged in other services based on census
data from 1971 to 2001. The distribution
of main workers into different classes has
been shown in Figure 4. As per the 2001
census, about 80.00 percent of the working
population is engaged in agriculture and
allied activities. Of these, 29.68 percent
workers have been reported as cultivators
and 50.32 percent as agricultural labourers.
About 17.13 percent workers are engaged
in other services and the rest 2.87 percent
in household industries. This implies that
agriculture and allied sectors (i.e., animal
husbandry, fisheries and forestry) are still
the main sources of livelihoods for the
people of Kalahandi though the share
of workers in non-farm sectors has been
increasing over the years.
This analysis needs to be further refined to
seek the contributions of small scale and
large industries as well as the financial,
insurance and banking sectors in terms
of employment and income generation
opportunities. In fact, the share of salaried
employees has been increasing in recent
years. Migration to different parts of the
State and other states has also emerged as
an important source of employment and
incomes. Therefore, the working population
has also been analysed by the following
categories: farmers, casual labourers, salaried
employees, artisans and persons engaged
in other segments. Table 17 summarises the
outcome of this analysis for households of
all groups including, ST and SC communities
as revealed by the BPL census, 2002. It
may be observed from Table 17 that in the
category of “All HH Groups”, 64.74 percent
HH are engaged as casual labourers, 24.71
percent HH as farmers, 3.65 percent HH as
salaried employees, 3.61percent HH as other
activities and 1.38 percent HH as artisans. In
the “ST HH Category”, 66.39 percent HH are
engaged as casual labourers, 26.22 percent as
farmers, 1.75 percent as salaried employees,
Figure 4 : Year-wise Composition of Worker in Kalahandi District and Odisha
1971 1981 1991 2001 1971 1981 1991 2001
Kalahandi Odisha
Cultivators Agricultural Labourers Workers in household industry Other Workers
60
50
40
30
20
10
0
Worker Composition in Kalahandi and Odisha
Per
cen
tag
e
53.5
7
32.0
92.
82
11.5
2
11.2
6
13.3
6
17.1
3
18.9
3
21.8
8
23.6
9 30.4
3
2.65
2.7
2.87
3.63
3.47
3.17 4.83
35.2
9 41.1
50.3
2
28.2
8
27.6
5
28.7
6 35.0
4
50.8
42.8
4
29.6
8
49.1
6
47
44.3
8
29.7

30
District Human Development Report
4.74 percent as other activities and 0.90
percent as artisans. Of the “SC HH Category”,
73.36 percent HH are employed as casual
labourers, 16.21 percent as farmers, 3.34
percent as salaried employees, 5.61 percent
as other professions and 1.48 percent as
artisans. Table 17 also provides inter-block
comparison of HH engaged in different
livelihood activities for all groups and ST
and SC categories. The status of different
sectors including forests, agriculture, animal
husbandry, fisheries, industries and other
sources in contributing to livelihoods and
incomes of different HH is analysed below.
2.6 Forests and Livelihoods
Kalahandi has a good forest cover and rich
biodiversity of flora and fauna. An area of
2,275 sq km (i.e., 28.72%) is covered with
Table 17: Households engagement in Different Livelihood Activities: 2002(Percent)
Blocks Casual Labour Farming Artisan Salary Others Total
ALL GROUPS
Bhawanipatna 71.28 20.96 1.37 3.16 3.03 100
Dharamgarh 59.34 27.38 1.55 5.01 6.43 100
Golamunda 66.27 27.12 1.25 2.39 2.71 100
Jayapatna 61.55 27.02 1.38 4.00 6.00 100
Junagarh 68.14 20.11 1.92 4.17 3.88 100
Kalampur 70.15 21.34 1.63 4.18 2.68 100
Karlamunda 61.76 30.91 1.08 4.21 2.02 100
Kesinga 69.84 21.25 1.15 4.60 3.12 100
Kokasara 68.44 23.10 1.57 3.79 3.02 100
Lanjigarh 48.53 21.11 1.00 2.49 2.61 100
M. Rampur 60.02 30.41 1.34 4.32 3.84 100
Narla 66.12 25.57 1.14 3.67 3.44 100
Th. Rampur 59.99 32.97 1.09 0.96 2.23 100
Kalahandi 64.74 24.71 1.38 3.65 3.61 100
MARGINAL GROUPS: ST
Blocks Casual Labour Farming Artisans Salary Others Total
Bhawanipatna 76.18 19.50 0.80 1.50 2.01 100
Dharamgarh 65.02 25.62 0.90 4.14 4.31 100
Golamunda 69.73 26.42 1.14 0.81 1.91 100
Jayapatna 61.35 33.46 0.66 1.65 2.88 100
Junagarh 73.40 17.87 1.46 1.98 5.28 100
Kalampur 76.89 18.42 1.43 1.83 1.43 100
Karlamunda 62.55 30.68 1.15 4.38 1.24 100
Kesinga 78.94 16.64 0.69 2.36 1.37 100
Kokasara 67.07 26.63 1.21 2.72 2.37 100
Lanjigarh 48.47 23.83 0.73 1.00 25.97 100
M.Rampur 61.32 35.19 0.53 1.47 1.49 100
Narla 72.02 23.82 0.84 1.82 1.50 100
Th. Rampur 55.25 39.11 0.79 0.39 4.46 100
Kalahandi 66.39 26.22 0.90 1.75 4.74 100Source: BPL Census, 2002

31
Growth, Poverty and Livelihood
Figure 5: Foersted Areas
REFERENCES
KALAHANDI DISTRICT
forests. About 1,156 sq km of forests are
dense and 1,119 sq km of forests are open
and degraded to varying degrees. Some of
the most common species found in these
forests are sahaj, dhaura, kendu, sisoo,
harida, mahua, char, rohan, sal, teak, khair
and chantoo. Figure 5 provides a ready
reference for forest areas in the district.
The forests of Kalahandi are a major source
of timber, fuel, non timber forest produces
(NTFP), medicines, animal feed and other
values. NTFP mainly includes kendu leaves,
bamboo, lac, char, broom-grass, mahua
MARGINAL GROUPS: SC
Blocks Casual Labour Farming Artisans Salary Others Total
Bhawanipatna 79.06 12.90 2.17 3.11 2.77 100
Dharamgarh 69.56 15.69 1.60 5.54 7.61 100
Golamunda 73.93 19.57 1.02 2.76 2.71 100
Jayapatna 71.43 19.52 1.35 3.67 4.04 100
Junagarh 73.40 14.79 2.11 3.77 5.93 100
Kalampur 77.87 14.49 1.93 4.52 1.19 100
Karlamunda 74.85 18.91 0.48 4.19 1.57 100
Kesinga 81.80 9.28 1.60 3.83 3.49 100
Kokasara 75.76 15.50 1.15 4.31 3.29 100
Lanjigarh 55.67 16.13 0.98 1.73 25.48 100
M. Rampur 76.88 14.73 1.75 3.71 2.94 100
Narla 76.34 17.12 1.11 2.50 2.94 100
Th. Rampur 68.01 23.78 1.22 1.27 5.71 100
Kalahandi 73.36 16.21 1.48 3.34 5.61 100Source: BPL Census, 2002
flower and sal seeds. The marginal sections
of the population including ST communities
depend on forests to a large extent for their
multiple requirements such as timber for
construction of houses, fuel wood, NTFP
and other needs. Most HH that depend on
forests use this sector mainly to supplement
their livelihoods and incomes. Though
National Income Accounting practices
record the contribution of the forestry
sector to the real GDDP of Kalahandi to be
about 3.16 (2004-05) percent (see Table
11 for reference), the actual contribution
of forests to the local district economy
is far greater. Many contributions of the
forestry sector have not been adequately
captured by the national income accounting
practices. For example, forests play a major
role in conserving the soil and water and
also act as a rich source of gene pool. Their
ecological roles are not fully captured by the
National Income Accounting methodology.
The forests of Kalahandi have been shrinking
and getting degraded to varying degrees
because of increasing pressures of rising
population and diversifying economic
activities. Mounting pressures on forest

32
District Human Development Report
resources undermine productive and
ecological roles of forests, particularly on soil
and water bases, which are essential for food
production. The continued degradation of
forests also threatens the present and future
availability of many forest plants, wildlife, and
multiple forest products. This also affects the
households’ food security. Forests become
an important source of livelihoods for many
households in times of distress. Access to
these resources is important in terms of
supplementing incomes from other sources
by filling seasonal shortfalls in food and
income and smoothening consumption in
periods of distress.
With a view to involving people in forest
protection and conservation and improving
livelihoods from the forestry sector, the
State Government has taken a number
of initiatives to actively involve people in
forest protection and conservation. The
Joint Forest Management (JFM) programme
under which local communities are involved
in forest protection and conservation was
launched in 1988. Under this programme, a
large number of Vana Samrakshyana Samitis
(VSS) have been constituted in the State as
well as in Kalahandi. The State Forest Policy
allows increased benefits including several
usufruct rights from assigned forests to
local communities engaged in the JFM
Programme. Various forest development
activities including entry point activities
are implemented through VSS. Around 898
VSSs have been organised in the district
by 2007-08. The block-wise distribution of
VSS and forest areas assigned to them are
summarised in Table 18.
A Minor Forest Policy was introduced in the
State in 2000 to transfer ownership of 70 non
timber forest products to gram Panchayats
so that full benefits of the specified forest
products are realized by local communities.
Kendu leaf is harvested departmentally in
accordance with a separate Government
Policy and is a major source of employment
and income for the local people during the
lean period from March to June every year. In
order to arrest forest degradation, to improve
forest conservation and to increase livelihood
Table 18: Distribution of VSS and Assigned Forest Areas by Block: 2007-2008Blocks Vana Samrakshyan
Samities (Number)
Assigned Forest Area (ha)
Average Forest Area per VSS (ha)
Lanjigarh 102 1,550 15.20
Bhawanipatna 10 585 58.50
Junagarh 107 37,646 351.83
Th. Rampur 28 1,734 61.93
Dharamgarh 74 3,551 47.99
Koksara 21 1,376 65.52
Jaipatana 7 585 83.57
Golamunda 49 3,442 70.24
Narla 42 1,926 45.86
Kesinga 162 10,447 64.49
Kalampur 129 8,473 65.68
M. Rampur 82 7,741 94.40
Karlamunda 85 7,463 87.80
Kalahandi 898 86,519 96.35Source: Forest Division N&S, 2007-2008

33
Growth, Poverty and Livelihood
opportunities for local people, the State has
implemented a number of programmes in
the district. These programmes include
Revised Long Term Action Plan (RLTAP),
Western Odisha Rural Livelihood Programme
(WORLP), Odisha Tribal Empowerment
and Livelihood Programme (OTELP) and
Odisha Forestry Sector Development
Project (OFSDP). Afforestation and natural
regeneration programmes are also
undertaken in Kalahandi. There is, however,
need to substantially increase productivity
of forest areas and develop agro-forestry
models to raise the incomes of farmers.
Kalahandi needs to enrich its forests for
its people to benefit more and more from
them.
2.7 Agriculture
Agriculture is the main source of employment
and income for the people of the district.
About 80 percent HH are engaged in
agricultural activities as per the 2001 census.
As per the 2006-07 report on Agricultural
Statistics of the district, its Net Area Sown
is reported as 368,313 ha, i.e., 46.50 percent
of the total area of the district. Kalahandi
contributes about 6.51 percent of the Net
Area Sown of the State. Other land-use
patterns include: 21,117 ha (2.67%) cultivable
wasteland, 22,497 ha (2.84%) fallow lands,
23,130 ha (2.92%) permanent pastures,
8,080 ha (1.02%) miscellaneous tree crops
and groves, 227,000 ha (28.72%) forests and
121,475 ha (15.34%) non-agricultural and
other uses. The gross cropped area of the
district was reported as 564,023 ha in 2006-
07 and cropping intensity was of the order
of 159.59 percent, which is slightly higher
than the State average of 158.48 percent.
Both kharif and rabi crops are grown in the
district. Agricultural productivities of kharif
and rabi crops at 1,043 kg/ ha and 1,524 kg/
ha are lower than the State averages of 1,498
kg/ ha for kharif and 2,328 kg/ha for rabi. The
main agricultural crops of the district are
rice, wheat, maize, ragi, pulses, groundnuts
and other oil seeds, cotton and sugarcane.
The net irrigated area of the district is 36.66
percent of the total net area sown.
Agriculture is progressing well in the plains,
where many farmers are adopting modern
agricultural practices including use of high
yielding varieties of seeds, fertilisers, farm
mechanisation and advanced agronomic
practices. Farmers in the irrigated Upper
Indravati command area use fertilisers and
pesticides for higher yields and generally
harvest better economic benefits. In these
areas, food production and the productivity
scenario has changed due to adaptation of
new technologies, use of HYV and increased
use of fertilisers. In hilly areas that are
generally inhabited by tribals, agricultural
practices are primitive and agriculture
productivity is very low. Shifting cultivation
is also prevalent in these areas. For example,
farmers of Lanjigarh and Thuamul Rampur
blocks hardly use fertilisers and modern
agricultural practices.
2.7.1 Land Capability ClassificationKalahandi has about 18.57 percent land
which is very good for cultivation and can
be accorded class-I status. Other lands
yield varying productivities and as per their
productive potential are classed as follows;
30.40 percent, are class-II that are good for
cultivation, 30.17 percent lands are class-III,
6.16 percent lands are class-IV, 5.11 percent
lands are class-V, 5.10 percent are class VI
and 4.48 percent land are class-VII. Better
off blocks such as Junagarh, Karlamunda
and Kesinga have high proportions of
class I lands; Junagarh (23,938 ha, 59.18%),
Karlamunda (4,522 ha, 30.44%) and Kesinga
(8,103 ha, 27.35%). On the other hand, blocks
such as Thuamul Rampur, Dharamgarh and
Koksara have very small areas of class-I lands.
Class-II lands dominate in Narla (15,324 ha,
47.77%), Kesinga (14,088 ha, 47.55%) and
Karlamunda (6,616 ha, 44.53%). On the

34
District Human Development Report
other hand, the poor quality class-VII lands
are found in Kalampur (14,500 ha, 14.29%),
Jaipatna (1,256 ha, 4.58%) and Koksara (1,200
ha, 3.86%). Thuamul Rampur, Lanjigarh and
Jaipatna blocks have generally poor quality
lands. Junagarh, Karlamunda and Kesinga
have generally very good quality lands. Table
19 describes a distribution of lands by land
capability6 classifications in different blocks.
2.7.2 Land Holding PatternsThere are 175,908 farm households in
Kalahandi as per the 2002 BPL census.
Together they own 285,091 ha of land. An
average land holding is 1.62 ha per HH. Of
all households, 82,406 or 46.85 percent are
marginal farmers with land-holding of less
than one ha and average land-holdings of 0.55
ha; 55,077 or 29.04 percent are small farmers
with land-holdings of more than one ha and
less than 2.5 ha and average land-holding
size of 1.39 ha; 29,028 or 16.50 percent are
semi-medium farmers with land-holding of
Table 19: Distribution of Land by their Land Capability ClassificationsS.N. Block Class-I Class-II Class-III Class-IV Class-V Class-VI Class-VII
1 Bhawanipatna 12,054 20,615 15,231 1,100 603 183 85
2 Kesinga 8,103 14,088 7,030 309 64 21 11
3 Th. Rampur 2,080 7,327 5,593 2,047 2,118 1,832 625
4 Narla 6,210 15,324 9,558 528 410 30 20
5 M. Rampur 3,306 10,125 8,104 852 812 640 412
6 Karlamunda 4,522 6,616 3,615 77 14 8 4
7 Lanjigarh 2,946 11,060 7,353 1,296 2,308 1,764 528
8 Dharamgarh 2,326 5,450 21,882 987 728 1,253 1,174
9 Junagarh 23,938 9,460 6,133 460 234 60 165
10 Kalampur 14,500 14,500 14,500 14,500 14,500 14,500 14,500
11 Koksara 2,991 11,210 11,911 1,419 1,240 1,125 1,200
12 Golamunda 5,270 7,654 24,238 1,125 690 1,043 1,300
13 Jaipatna NA 11,040 8,202 4,588 582 1,776 1,256
Kalahandi 88,246 144,469 143,350 29,288 24,303 24,235 21,280
Source: DDA, Kalahandi, NA-Not Available
more than 2.5 ha and less than 3.99 ha and
average land-holding size of 2.76 ha; 12,192
or 6.93 percent HH are medium farmers with
land-holding sizes of more than four ha and
less than 9.99 ha and average land-holding
size of 5.76 ha; and 1,205 or 0.68 percent HH
are large farmers with land-holdings of more
than 9.99 ha and average land-holding size
of 14.93 ha. Table 20 gives a distribution of
farmers by block and land-holding sizes.
Further analysis of land-holding patterns
suggests that 82,046 or 46.85 percent
marginal farmers own only 45,715 ha or
16.04 percent of the total cultivable land of
the district. Next 55,077 or 29.04 percent
small farmers own 71,146 ha or 24.96 percent
of the total cultivable land. Another 29,028
or 16.50 percent semi-medium farmers own
80,068 ha or 28.09 percent of land and 12,192
or 6.93 percent medium farmers own 70,177
ha or 24.62 percent of land. Only 1,205 or 0.68
percent large farmers own 17,985 ha or 6.31
6 Land Capability Classification is as follows: class I means very good quality cultivable land, class II lands are good cultivable lands, class III lands
are moderately good for cultivation, class IV lands are suited for occasional cultivation, class V lands are stony, nearly level lands, not suitable for
cultivation, class VI lands have steep slopes, erosion prone with shallow soils and class VII lands have steep slopes, severely eroded, stony and
very shallow lands.

35
Growth, Poverty and Livelihood
Table 20: Distribution of Farmers By Block and Land Holding Size: 2002 Farmers’ Classification by Land-holding Sizes (Number)
Sl. No
Block Marginal Farmers
SmallFarmers
Semi medium
MediumFarmers
Large Farmers
TotalFarmers
1 Bhawanipatna 9,560 5,928 3,369 1,418 140 20,415
2 Dharamgarh 7,291 4,519 2,568 1,078 107 15,563
3 Golamunda 7,765 4,812 2,734 1,149 114 16,574
4 Jayapatna 6,282 3,894 2,219 929 92 13,416
5 Junagarh 9,565 5,929 3,369 1,415 140 20,418
6 Kalampur 2,624 1,626 924 388 38 5,600
7 Karlamunda 4,050 2,510 1,426 599 59 8,644
8 Kesinga 6,611 4,097 2,328 978 97 14,111
9 Koksara 6,524 4,043 2,297 965 95 13,924
10 Lanjigarh 5,352 3,318 1,885 792 78 11,425
11 M.Rampur 4,315 2,675 1,520 638 63 9,211
12 Narla 6,641 4,115 2,338 982 97 14,173
13 Th. Rampur 5,826 3,611 2,051 861 85 12,434
Kalahandi 82,406 51,077 29,028 12,192 1,205 175,908
Source: BPL Census, 2002
percent land. This analysis indicates that
there are gross inequalities in land holdings
in the district. Of all rural households,
about 46 percent families do not posses
any land and depend upon other means for
livelihoods, while the remaining 54 percent
own lands of different sizes.
2.7.3 Land Holdings by Social GroupsOf all land owning families, 29.43 percent
are ST households, 20.42 percent SC
households, 45.82 percent OBC households
and 4.33 percent other households. Table 21
summarises the distribution of land owning
families by social classes and by block. It
Table 21: Households with Land Holdings by Blocks and Social Groups (%)Block ST SC OBC Others Total
Bhawanipatna 32.30 23.37 41.27 3.06 100
Dharamgarh 17.74 19.75 58.17 4.34 100
Golamunda 25.32 18.54 52.94 3.20 100
Jayapatna 36.43 19.08 38.05 6.44 100
Junagarh 16.92 18.85 58.46 5.76 100
Kalampur 26.27 16.96 49.04 7.73 100
Karlamunda 16.00 16.22 65.88 1.91 100
Kesinga 28.29 17.98 49.89 3.84 100
Kokasara 33.17 18.83 44.34 3.65 100
Lanjigarh 45.14 26.26 23.71 4.89 100
M.Rampur 38.93 16.49 40.38 4.20 100
Narla 25.05 23.18 47.47 4.30 100
Th.Rampur 53.86 29.33 14.06 2.74 100
Kalahandi 29.43 20.42 45.82 4.33 100
Source: BPL Census, 2002

36
District Human Development Report
may be observed from Table 21 that there
are wide variations in different blocks with
respect to the distribution of land owning
families by social classes. Thuamul Rampur
block has reported the highest proportion of
53.86 percent ST families and 29.33 percent
SC families owning lands and Karlamunda
block has the smallest proportion of 16.00
percent ST families and 16.22 percent SC
families owning land. Karlamunda block has
the maximum percentage of 65.88 percent
OBC families who own land, and Thuamul
Rampur has the lowest percentage of
14.06 percent OBC families, owning lands.
Kalampur has reported maximum families
(7.73%) and Karlamunda block minimum
families (1.91%) of other categories, who
own land.
2.7.4 Income Status of Land Owning HouseholdsThe income status of a land-owning
household depends on a number of
factors including the size of land-holding,
land quality, productive potential of land,
cultivation practices and investment. We
have already seen that many marginal
and small farmers, particularly in Thuamul
Rampur, Lanjigarh and other blocks have
poor quality lands. Many of them, therefore,
earn small incomes from these lands or find
cultivation of lands highly uneconomical.
Table 22 summarises the income status of
land owning families in different blocks. It
may be observed from Table 22 that 32.47
percent HH are in the monthly income class
of less than Rs. 250, 44.12 percent HH are in
the next monthly income class of Rs.250-499,
17.23 percent HH are in the next monthly
income class of Rs. 500-1499, 2.51 percent HH
are in the monthly income class of Rs.1500-
2500 and only 3.45 percent HH are in the
highest income class. Thus only 5.96 percent
HH owning lands have monthly incomes
above Rs.1500. Block-wise analysis indicates
that Thuamul Rampur reports the highest
percentage (77.15%), and Kalampur block the
lowest percentage (11.76%) of land owning
families in the lowest monthly income class
of less than Rs. 250. On the other hand,
Kalampur block has reported the highest
percentage (3.45%), and Thuamul Rampur
block the lowest percentage (0.27%) of land
owning families in the highest monthly
Table 22: Income Status of Land-owning Families by Blocks (%)Block Rs. <250 Rs. 250-
499Rs. 500-
1499Rs. 1500-
2500More than
Rs. 2500Total
Bhawanipatna 38.36 38.91 17.84 2.05 2.77 100.00
Dharamgarh 21.55 50.47 20.06 2.97 4.76 100.00
Golamunda 26.24 56.02 14.15 1.54 1.77 100.00
Jayapatna 43.17 35.47 13.95 2.47 4.73 100.00
Junagarh 24.26 47.82 20.42 2.80 4.08 100.00
Kalampur 11.76 40.74 37.45 4.90 5.13 100.00
Karlamunda 29.35 50.84 13.98 2.29 3.46 100.00
Kesinga 28.82 47.22 17.43 2.25 4.21 100.00
Kokasara 30.52 47.95 15.33 2.50 3.68 100.00
Lanjigarh 49.31 38.78 8.37 1.48 1.77 100.00
M.Rampur 13.66 45.34 30.31 5.98 4.67 100.00
Narla 32.39 46.22 15.78 2.28 3.28 100.00
Th.Rampur 77.15 18.81 2.60 0.38 0.27 100.00
Kalahandi 32.47 44.12 17.23 2.51 3.45 100.00
Source: BPL Census, 2002

37
Growth, Poverty and Livelihood
income class of more than Rs.2500. In the
second monthly income class of Rs.250-
499, Golmunda block reports the highest
percentage (56.02%), and Thuamul Rampur
block the lowest percentage (18.81%) of
land owning families. In the third monthly
income class of Rs. 500-1499, Kalampur block
reports the highest percentage (37.45%),
and Thuamul Rampur block the lowest
percentage (2.60%) of land owning families.
In the next monthly income class of Rs.1500-
2500, M. Rampur block reports the highest
percentage (5.98%), and Thuamul Rampur
block the lowest percentage (0.38%) of land
owning families.
The overall picture of landholding in
Kalahandi district is not very uniform as a
high number of families do not have their
own land.
Among ST families in the district, the highest
percentages of families (44.35%) do not
posses any land while 30.64 percent have
Table 23: Operational Holdings for rural SC & ST Households: 2002Blocks Owner Tenant Both Owner
& TenantNone Total
ST SC ST SC ST SC ST SC ST SC
Bhawanipatna 3,023 1,666 2,302 1,483 1,106 632 6,248 5,393 12,679 9,174
Dharamgarh 2,663 2,394 501 565 385 357 1,669 2,492 5,218 5,808
Golamunda 4,663 2,848 615 535 143 95 2,589 2,387 8,010 5,865
Jayapatna 4,132 1,576 1,338 481 776 281 4,683 3,385 10,929 5,723
Junagarh 1,693 1,795 1,351 1,232 855 789 3,218 4,114 7,117 7,930
Kalampur 1,118 736 286 187 112 59 2,258 1,454 3,774 2,436
Karlamunda 251 237 741 530 396 373 871 1,150 2,259 2,290
Kesinga 1,613 789 803 375 1,193 544 4,360 3,358 7,969 5,066
Koksara 3,656 1,654 1,852 974 516 141 3,340 2,548 9,364 5,317
Lanjigarh 1,214 404 2,319 1,312 883 289 4,905 3,418 9,321 5,423
M. Rampur 3,696 1,090 555 140 382 94 3,076 1,941 7,709 3,265
Narla 783 539 1,377 1,133 1,058 900 4,308 4,392 7,526 6,964
Th. Rampur 2,736 1,143 1,924 966 1,732 638 3,700 2,749 10,092 5,496
Total 31,241 16,871 15,964 9,913 9,537 5,192 45,225 38,781 101,967 70,757
[%] 30.64 23.84 15.66 14.01 9.35 7.34 44.35 54.81 100.00 100.00Source: BPL Census, 2002
land. In the remaining families, 15.66 percent
are tenants and 9.35 percent are land owners
and also act as tenants. The percentage of ST
households who are owners of land is highest
in Golmunda block (58.21%). Karlamunda is
home to the highest percentage (32.80%) of
rural ST household tenants. The figure for
both owners and tenants is significantly low
in all other blocks except Narla, where 14.06
percent of the rural ST households are both
tenants and owners. Around 60 percent of
the rural ST households in Kalampur block
don’t have any land. This is highest among
all other blocks. In spite of this, the monthly
income of rural ST households in Kalampur
block is better than in other blocks. This is
due to their engagement in various other off-
farm and non-farm activities including wage
and other means of livelihood.
In Kalahandi, around 55 percent rural SC
households do not own land nor are they
tenants. The district average for both
owners and tenants is the lowest (7.26%)

38
District Human Development Report
among all four categories. Of the total SC
households in the district, only 23.84 percent
possess land of different quantum and 7.34
percent not only possess land but also act
as tenants. In the remaining households,
54.81 percent can be considered as landless
as they do not have agricultural land under
their possession and 14.01 percent families
are tenants, i.e., they normally cultivate
others’ lands adopting various local means
like share cropping. ST groups own 30
percent of operational holdings whereas SCs
occupy the least percentage of operational
holdings. On an average 45 percent of total
rural OBC households in Kalahandi district
don’t have land, neither are they tenants.
Figure 6 shows operational holding by social
category. Around 50 percent of the rural OBC
households own land in M. Rampur block.
This is the highest among all blocks.
2.7.5 Irrigation Large parts of many blocks are rain-fed
and depend on the rains for cultivation.
Cultivation is confined in such pockets
mainly to the Kharif season. Up to 1967-77,
there was no major irrigation project in the
district. At present, some major and medium
irrigation projects have come up in the
district. The Upper Indravati Project, a multi-
purpose project, has created an irrigation
potential of 98,300 ha in Dharamgarh tahasil.
The Uttei medium irrigation project has
been providing irrigation to 9,300 ha during
the Kharif season and 120 ha during the
Rabi season.
Tanks and wells are also important sources
of irrigation. Most tanks are, however, in
derelict condition and need repair and
renovation as the water available there does
not last beyond December. Wells irrigate only
small areas but suffer from paucity of water
supply and become dry in summer. Other
minor sources of irrigation include tube
wells, bore wells, lift irrigation and flow minor
irrigation facilities. Some major, medium and
minor irrigation projects are distributed as
follows: one major project in Jaipatna block,
one medium project in Karlamunda block,
46 minor irrigation projects covering all
blocks except Karlamunda and Kalampur
and 601 lift irrigation points (372 owned by
Government and 229 privately owned) are
spread in all blocks except Thuamul Rampur.
The total irrigable area in the district, as per
2006-2007 estimates, is 146,921 ha during
the Kharif season and 91,830 ha during Rabi
season. About 36.87 percent of cultivated
land is irrigated in Kalahandi though there
are wide variations in different blocks in
terms of irrigated land. Only five blocks, i.e.,
Junagarh, Kalampur, Karlamunda, Jaipatna
and Dharamgarh have irrigable land
exceeding 35 percent and the remaining
eight blocks have an irrigated area of less
than 35 percent. The State Government has
recently taken a policy decision to provide
assured irrigation to all blocks to the extent
of 35 percent within the 11th Five Year Plan.
There is, therefore, a need to expedite
the creation of irrigation potential in the
remaining eight blocks and to increase the
scope of irrigation further in all blocks. Table
24 provides the distribution of irrigated areas
by blocks.
Figure 6: Operational Holding by Social Category
30%
ST SC
OBC Others
20%46%
4%
Operational Holding by Social Category

39
Growth, Poverty and Livelihood
2.7.6 Fertilizer Consumption and Farm MechanisationAgricultural statistics for 2006-07 indicate
that the use of chemical fertilizers in the
district is much below the national average.
Many farmers use animal manure and other
forms of organic manure. Kalahandi uses
fertilisers at the rate of 57.54 kg per ha
against the State average of 46.00 kg per ha
and the national average of 104.50 kg per
ha. During 2006-2007, the district consumed
21,851 tons of urea, 7,805 tons of DAP, 4,023
tons of MOP and 1,101 tons of SSP. There
is considerable scope for increasing the use
of fertilizers in irrigated and other areas to
increase land productivity and yields. At the
same time, there is also need to promote
organic manures and vermi-composts to
increase land productivity and yields.
Farm mechanisation is progressing in the
district at a very slow pace. There are 98
tractors, 32 S.P paddy reapers, 815 power
tillers, two hand tillers and 13 axis flow
threshers in the district. In all, 959 farmers
have some farm implements as per reports
available from the office of Deputy Director,
Agriculture, Kalahandi.
2.7.7 Agri-clinic FacilitiesThe district has only one static Government
owned soil testing laboratory. The annual
analysis capacity of the only laboratory rests
at 7,453 samples, but number of samples
analysed in the laboratory is 10,563, i.e., the
laboratory is functioning beyond its capacity.
This indicates that the demand for soil
testing services has been increasing. There
is, therefore, need to introduce more mobile
soil testing laboratories so that farmers can
access such services at GP level. This will help
farmers plan appropriate soil treatments and
raise suitable crops.
Each block, except Jaipatna, has an agri-
clinic. There are 12 agri-clinics in the district.
Different clinics have different facilities for
providing appropriate services to farmers.
All clinics have facilities for farmers’ training,
but demonstration facilities are not available
in six agri-clinics. The facilities for diagnosis
of pest and plant diseases are available in
Table 24: Status of Irrigated Area by Block: 2007-2008Sl. No Block Total Agriculture
Land (ha)Irrigated Land
(%)Un-irrigated Land
(%)
1 Bhawanipatna 48,084 9.93 90.07
2 Dharamgarh 32,295 44.36 55.64
3 Golamunda 37,172 19.46 80.54
4 Jaipatna 28,581 58.74 41.26
5 Junagarh 39,715 95.50 4.50
6 Kalampur 14,170 76.32 23.68
7 Karlamunda 14,469 63.19 36.81
8 Kesinga 28,874 28.33 71.67
9 Koksara 35,384 22.16 77.84
10 Lanjigarh 21,274 16.73 83.27
11 M. Rampur 21,208 18.20 81.80
12 Narla 31,208 26.63 73.37
13 Th. Rampur 14,879 14.83 85.17
Kalahandi 367,313 36.87 63.13Source: DDA, Kalahandi

40
District Human Development Report
six clinics. The clinics where demonstration
facilities are not available are also devoid
of pest and disease diagnostic facilities.
Vermi-compost production facilities through
various means are available in four clinics and
greenhouse facilities only in two clinics, i.e., in
Koksara and Golamunda. The district also has
547 agro-service centres covering six blocks.
There are 216 service centres (39.49%)
operated by private bodies. Farm equipment
and machinery services are available in
eight service centres of Dharamgarh block.
Agricultural extension services are provided
by local Government agencies at block
and village level. There is clearly a need
for creating more multi-purpose and well
equipped agri-clinics and agri-service centres
all over the district.
2.7.8 Area, Production and Yields of Major CropsOn an average about 280,640 ha area is
utilised during the Kharif season. Of this,
90,590 ha, i.e., 32.23 percent area is irrigated
and the rest 190,050 ha, i.e., 67.77 percent
area depends on rains. The irrigated area
(32.23%) contributes about 46.40 percent
of total production of all crops and the
remaining un-irrigated area (67.77%) adds
only 53.60 percent to the total production of
the district. About 87,316 ha area of the total
irrigated area, i.e., about 55.25 percent of the
cultivated area used for paddy production
and contributes 61.56 percent of total annual
paddy production of the district. Only 44.75
percent area of the remaining un-irrigated
area is used for cultivating paddy and
contributes 38.44 percent of total paddy
production in the district. The yield rates
under rain-fed conditions are generally low.
The yield rates in the district vary widely
from the lowest of 13.6 quintals per ha in
T. Rampur block to 36 quintals per ha in
Koksara. The productivity in irrigated areas
is generally higher than that in rain-fed areas
and varies from 16.25 to 42 quintals per ha
in different parts of the district. The average
rate of production per ha is estimated to
be 28.30 quintals/ha for irrigated areas and
21.44 quintals/ha for rain-fed areas.
Pulses are cultivated in all parts of the district,
particularly under rain-fed conditions. Arhar
is cultivated over an area of about 11,436 ha
in 10 blocks. Its annual production is 108,691
quintals. The average yield varies by block
from 7.42 quintals per ha in Bhawanipatna
block to 12.7 quintals per ha in Golamunda
block. Black gram (Biri) is cultivated over
an area of 29,997 ha (1,033 ha in irrigated
conditions and 28,964 ha under rain-fed
conditions) in 10 blocks.
2.7.9 Shifting Cultivation, Soil erosion and their Prevention Shifting cultivation, which is variously
known as podu chasa, dongar chasa, kudki
chasa or kudu chasa is widely practiced by
tribals and others in hilly areas of the district.
This is an age old practice that is deeply
rooted in the tribal cultures and traditions.
Vegetation on hill tops and slopes are cut
during the months of January and February
and are left there to dry. Towards the
end of April or the beginning of May, dry
vegetation is burnt and ash is spread over
the cleared land. As the rains approach, the
cleared lands are ploughed if the slopes are
moderate or worked by manual labour with
the help of spades, if the slopes are steep.
Various crops, often mixed, are grown on
the cleared and prepared lands. Generally,
crops such as maize, jower, finger millet,
tur and minor millets are grown in these
areas. As the productivity of these lands
continues to decline over time, these lands
are left to recover after three crops and
farmers move to fresh patches and repeat
the process. Though it does provide limited
livelihoods to the people so engaged, the
practice is socio-economically wasteful.
This has caused acute soil erosion in the

41
Growth, Poverty and Livelihood
affected areas and has depleted valuable
forest wealth. Because of legal sanctions,
the shifting farming system has, however,
reduced, though it is difficult to completely
stop this practice, which is very old and
deeply rooted in tribal culture and traditions.
The problem of soil erosion is acute,
particularly in hilly areas due to undulating
topography, intense rainfall and harmful
effects of the practice of shifting cultivation
prevalent in hilly tracts. This causes loss of
productive potential of soils, which take
different forms of rills and gullies. There is
an urgent need to promote sound soil and
water conservation practices in affected hilly
tracts and other areas. The State Government
has taken a number of anti-erosion measures,
such as, contour bunding, gully control, and
other soil and water conservation measures.
These measures need be popularised among
land owners. The State Forest Department
should also practice watershed development
programmes in forested hilly tracts. Un-
cultivable wastelands, severely affected
by soil erosion, need be brought under
miscellaneous fruit tree plantations with
species like cashew nut, mango, jack-fruit,
tamarind, ber, sisal and other soil binding
species. Sisal plantations have been
undertaken on a large scale to check soil
erosion in some parts of the district. Coffee
plantations have also been undertaken in
Thuamul Rampur with a view to control
soil erosion and provide additional
income to poor tribals and others. The
Soil Conservation Department has also
undertaken land reclamation and land
development work on lands allotted to
landless persons in this area. Half the cost
of soil reclamation is borne by the I.T.D.P.
as a subsidy to beneficiaries and the rest is
borne by land owners by way of bank loans.
During the last five years, about 18,454 ha
Government waste lands have been leased
out to 21,925 landless persons.
2.8 Horticulture
Major horticultural crops grown in the
district are mango, okra, brinjal, tomato
and radish under both irrigated and rain
fed conditions. Only banana is grown in
irrigated areas in over 1,576 ha whereas
many other horticultural crops are grown
under rain-fed conditions. Wherever
possible, irrigation is provided by different
means for vegetable crops. Estimated
banana production in the district was 59,500
MT whereas the production of mango, K.
lime and papaya is of the order of 31,724 MT,
9,125 MT and 4,397 MT respectively. Brinjal
is produced in large quantities, i.e., 88,737
MT whereas tomato, cauliflower, radish and
okra are produced in the order of 35,084
MT, 20,150 MT, 39,470 MT and 45,250 MT
per year respectively. There is considerable
scope to promote horticulture in different
parts of the district, particularly in hilly tracts
where traditional cultivation practices are
not economically rewarding.
2.9 Animal Husbandry
Animal husbandry has considerable
scope to provide, and does create, gainful
employment and income opportunities.
Rearing of animals like goats, sheep, cows
and buffalos are not only the occupations of
the poor, other families also undertake them
for various reasons and purposes. Tribals rear
goats and other small ruminantus for fulfilling
their livelihoods and other requirements.
Rearing of milching animals including cows
and buffaloes is also becoming popular
because of the efforts of OMFED to promote
dairying, marketing of milk and other dairy
products. Many families in the district
practice some kind of animal husbandry
mainly to supplement their income and
rear cattle to support agricultural activities.
Table 25 reports livestock population of main
species in different blocks of the district. It

42
District Human Development Report
may be observed from Table 25 that total
cattle population of the district in 2006-07
was recorded as 445,750, of which only 4.98
percent were of superior cross breeds and
the remaining 95.02 percent of indigenous
variety. The buffalo population was estimated
to be 122,931. The total population of sheep
was 94,788 and that of goats was 235,579.
Poultry has been one of the preferences of
the people and total broiler stock has been
estimated to be 999,845.
The district has a limited network of
veterinary institutions of different categories
at different levels to cater to multiple needs
of the livestock population. Veterinary
services are available in 132 Gram Panchayats
(GP) while the remaining 51.65 percent GPs
have no veterinary institution. There are
only 139 veterinary institutions including
three veterinary hospitals, 17 veterinary
dispensaries, 113 purposive veterinary
centres, 121 Artificial Insemination (AI)
centres and two diagnostic labs in the
district. There is a need for more veterinary
Table 25: Livestock Population of Kalahandi by Animal Type and Blocks: 2006-2007Sl. No. Block Cattle Buffalo Sheep Goat Poultry
Cross Indigenous Total Broiler
1 Karlamunda 1,043 19,297 20,340 2,885 4,436 9,581 54,138
2 M.Rampur 690 31,686 32,376 8,828 2,739 22,366 65,597
3 Narla 1,743 7,277 9,020 40,723 5,209 20,125 82,746
4 Lanjigarh 972 45,103 46,075 13,584 5,602 30,614 71,008
5 Bhawanipatna 3,958 62,946 66,904 11,342 11,604 42,580 162,914
6 Kesinga 3,473 33,092 36,565 8,493 9,164 17,124 131,696
7 Th.Rampur NA 34,742 34,742 233 2,973 15,830 46,614
8 Dharamgarh 2,332 35,088 37,420 5,594 10,977 10,377 70,094
9 Kalampur 745 10,862 11,607 2,531 2,381 2,594 25,653
10 Koksara 2,087 27,487 29,574 3,983 8,737 12,786 90,334
11 Jaipatna 1,027 33,235 34,262 3,823 7,291 8,574 57,626
12 Golamunda 446 41,259 41,705 8,705 10,797 23,182 57,610
13 Junagarh 3,685 41,475 45,160 12,207 12,878 19,846 83,815
Kalahandi 22,201 423,549 445,750 122,931 94,788 235,579 999,845Source: Department of Animal Husbandry, District Statistical Hand Book, 2005, NA-Not Available
institutions and professional services to
promote animal husbandry in the district in
a big way as a major source of livelihoods. It
could also reduce the impact of distress on
rural HH during drought. Mobile veterinary
services may also be introduced to serve
large segment of the population in different
parts of the district.
2.10 Fisheries
Fisheries add to livelihoods of the local
people in a limited manner. The contribution
of this sub-sector to the real GDDP of the
district is about one percent and varied
from 0.95 percent to 1.37 percent per annum
from 1999- 2000 to 2004-05. It has been
estimated that per capita per day supply of
fish from local sources is only 27 grams and
much of the local demand is met by external
sources. There is, therefore, considerable
scope to promote fisheries in the district to
substantially improve the incomes of local
families and provide additional high quality
nutrition to the local population.

43
Growth, Poverty and Livelihood
The district has 6,492 ponds and 13
reservoirs, where cultured species include
Catla, Rohu, Migral, Grass Carp and others
are grown. At present, only 3,609 out of 6,492
tanks are used for fishery activities, while
the remaining ones are unsuitable. Many
of them are derelict and cannot be utilised
for pisciculture. Secondly, due to low water
retaining capacity of some tanks, annual
pisciculture is a distant possibility in the areas
where such tanks are found. Some rivers are
also used for fishing. Table 26 provides the
current status of pond and river fisheries in
different blocks of Kalahandi district. The
average annual fish production from ponds
is 10,323 kg.
In addition to ponds and rivers, there are
78 reservoirs, which could be fully utilised,
and in fact, some of which are partially
utilised, for fishing. As per the 2006-2007
estimates, the average catch per boat
varied from 2.12 kg in Koksara to 101.9 kg
Table 26: Current Status of Pond & river Fishing Activities by BlockInland Ponds Rivers
Sl. No.
Block Units(No.)
Species Cultured
Average Yield (kg)
Reasons for Yield
Gap
Boat & Net Units
Species harvested
Average Catch (kg/
boat)
Reasons for Yield
Gap
1 Bhawanipatna 521
Cat
la, R
oh
u, M
igra
l Cy.
carp
io, G
rass
car
p
1,040.10
Mo
st o
f th
e ta
nks
are
ow
ned
by
GP,
LTL
is n
ot
app
rove
d in
tim
e. G
oo
d q
ual
ity
fing
erlin
g is
no
t st
ock
ed in
ten
sive
cu
ltu
re p
ract
ice
is n
ot
ado
pte
d
NA
Min
or c
arp
s, Fe
w m
ajo
r car
ps
and
wee
d fi
shes
9.00
Bo
at &
net
s ar
e n
ot
pro
vid
ed fr
om
an
y d
epar
tmen
tal s
ou
rce
2 Kesinga 281 1,045.70 NA 13.40
3 Narla 385 1,108.90 NA 7.20
4 M.Rampur 192 721.00 NA 4.50
5 Karlamunda 220 648.00 NA 4.50
6 Lanjigarh 72 103.40 NA 3.00
7 Th.Rampur NA NA NA NA
8 Dharamgarh 405 1,326.00 NA 16.50
9 Junagarh 379 1,351.00 NA 11.00
10 Koksara 438 1,014.00 NA 5.00
11 Jaipatna 428 1,011.00 NA 6.40
12 Golamunda 288 955.20 NA 4.00
13 Kalampur 343 1,008.00 NA 26.05
Kalahandi 3,609 10,323.00 NA NASource: Department of Fisheries, Kalahandi, NA- Not Available
in Th. Rampur blocks. Major constraints in
improving the catch from reservoirs include:
non availability of quality boats and nets to
fishermen, over-exploitation of reservoirs
for fishing, no systematic efforts to increase
fish production and regulated fishing in
various reservoirs. The average yield can
be easily improved by about 10 percent if
fishery activities are systematically promoted
and fish are scientifically cultivated. The
existing reservoirs and some rivers where
fishermen use boats could be utilised for
promoting pisciculture. Derelict tanks need
be renovated. The knowledge, skills and
awareness of people including fishermen
could be substantially improved through
training, demonstrations and exposure visits
to more advanced areas. Fishermen and
others could be encouraged by appropriate
incentives to have good quality boats and
nets. Key climatic and agricultural indicators
for the district from 2000-01 to 2006-07 are
summarised in Table 27.
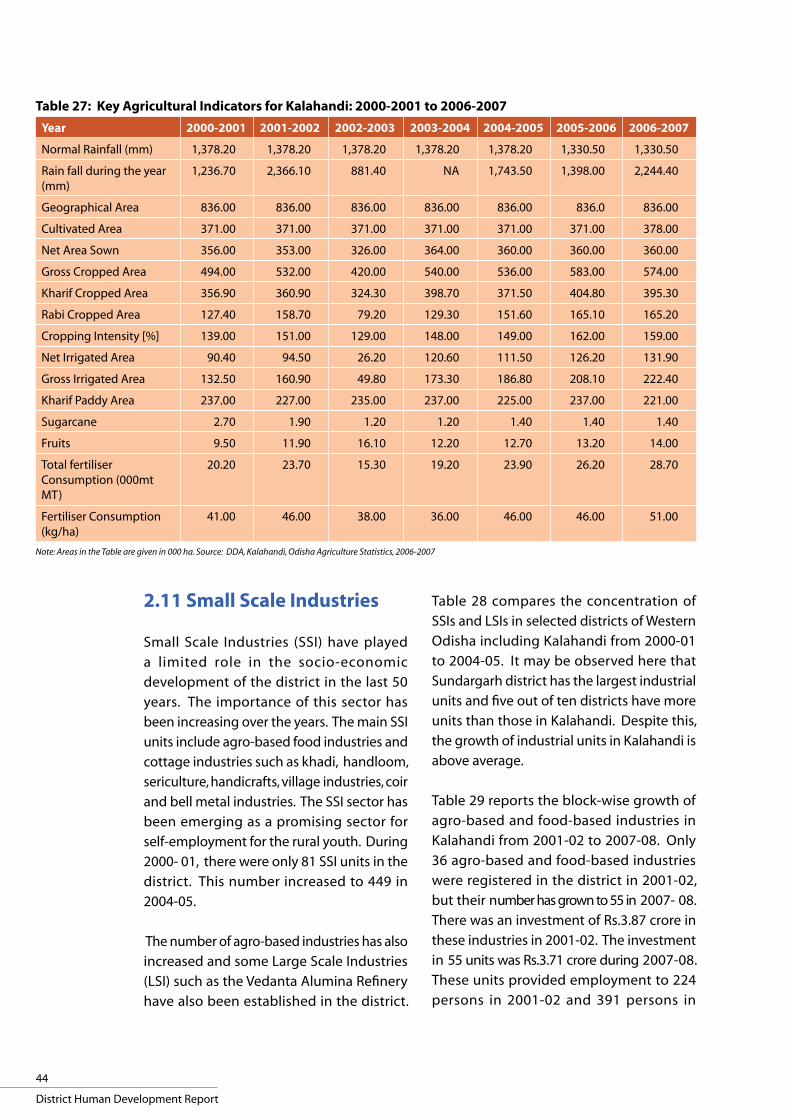
44
District Human Development Report
2.11 Small Scale Industries
Small Scale Industries (SSI) have played
a limited role in the socio-economic
development of the district in the last 50
years. The importance of this sector has
been increasing over the years. The main SSI
units include agro-based food industries and
cottage industries such as khadi, handloom,
sericulture, handicrafts, village industries, coir
and bell metal industries. The SSI sector has
been emerging as a promising sector for
self-employment for the rural youth. During
2000- 01, there were only 81 SSI units in the
district. This number increased to 449 in
2004-05.
The number of agro-based industries has also
increased and some Large Scale Industries
(LSI) such as the Vedanta Alumina Refinery
have also been established in the district.
Table 27: Key Agricultural Indicators for Kalahandi: 2000-2001 to 2006-2007Year 2000-2001 2001-2002 2002-2003 2003-2004 2004-2005 2005-2006 2006-2007
Normal Rainfall (mm) 1,378.20 1,378.20 1,378.20 1,378.20 1,378.20 1,330.50 1,330.50
Rain fall during the year (mm)
1,236.70 2,366.10 881.40 NA 1,743.50 1,398.00 2,244.40
Geographical Area 836.00 836.00 836.00 836.00 836.00 836.0 836.00
Cultivated Area 371.00 371.00 371.00 371.00 371.00 371.00 378.00
Net Area Sown 356.00 353.00 326.00 364.00 360.00 360.00 360.00
Gross Cropped Area 494.00 532.00 420.00 540.00 536.00 583.00 574.00
Kharif Cropped Area 356.90 360.90 324.30 398.70 371.50 404.80 395.30
Rabi Cropped Area 127.40 158.70 79.20 129.30 151.60 165.10 165.20
Cropping Intensity [%] 139.00 151.00 129.00 148.00 149.00 162.00 159.00
Net Irrigated Area 90.40 94.50 26.20 120.60 111.50 126.20 131.90
Gross Irrigated Area 132.50 160.90 49.80 173.30 186.80 208.10 222.40
Kharif Paddy Area 237.00 227.00 235.00 237.00 225.00 237.00 221.00
Sugarcane 2.70 1.90 1.20 1.20 1.40 1.40 1.40
Fruits 9.50 11.90 16.10 12.20 12.70 13.20 14.00
Total fertiliser Consumption (000mt MT)
20.20 23.70 15.30 19.20 23.90 26.20 28.70
Fertiliser Consumption (kg/ha)
41.00 46.00 38.00 36.00 46.00 46.00 51.00
Note: Areas in the Table are given in 000 ha. Source: DDA, Kalahandi, Odisha Agriculture Statistics, 2006-2007
Table 28 compares the concentration of
SSIs and LSIs in selected districts of Western
Odisha including Kalahandi from 2000-01
to 2004-05. It may be observed here that
Sundargarh district has the largest industrial
units and five out of ten districts have more
units than those in Kalahandi. Despite this,
the growth of industrial units in Kalahandi is
above average.
Table 29 reports the block-wise growth of
agro-based and food-based industries in
Kalahandi from 2001-02 to 2007-08. Only
36 agro-based and food-based industries
were registered in the district in 2001-02,
but their number has grown to 55 in 2007- 08.
There was an investment of Rs.3.87 crore in
these industries in 2001-02. The investment
in 55 units was Rs.3.71 crore during 2007-08.
These units provided employment to 224
persons in 2001-02 and 391 persons in

45
Growth, Poverty and Livelihood
Table 28: Small and Large Scale Industries in Western Districts : 2000-2005Sl. No.
Name of the District
2000-01 2001-02 2002-03 2003-04 2004-05
SSI LSI SSI LSI SSI LSI SSI LSI SSI
1 Bargarh 116 7 242 7 368 7 503 10 645
2 Jharsuguda 52 10 112 10 172 10 236 11 604
3 Sambalpur 92 4 205 4 315 4 445 13 581
4 Deogarh 11 1 28 1 45 1 62 0 79
5 Sundargarh 425 55 755 55 1,180 55 1,635 83 2,117
6 Boudh 32 0 67 0 206 0 140 0 175
7 Sonepur 59 0 122 0 102 0 229 2 277
8 Bolangir 105 5 225 5 170 5 555 9 726
9 Nuapada 20 1 40 1 382 1 81 0 105
10 Kalahandi 81 2 171 2 60 2 352 3 449
Source: www.navratnanews.com
Table 29: Status of Agro and Food-Based Industries by Block: 2001-2008Block 2001 – 02 2007-08
Units (Number)
Total Investment
(Rs. 000)
Persons Employed(Number)
Units(Number)
Total investment
(Rs. 000)
Persons Employed(Number)
Bhawanipatna 9 1,048 28 9 3,125 55
Dharamgarh 1 313 4 5 4,039 40
Golamunda 1 104 3 2 720 9
Jaipatna 3 18,883 51 1 4,625 45
Junagarh 2 4,163 28 10 15,264 113
Kalampur 1 107 2 NA NA NA
Karlamunda 1 82 2 2 990 13
Kesinga 6 11,432 53 1 148 2
Koksara 3 1,690 32 3 1,080 11
Lanjigarh 4 433 8 6 1,760 24
M.Rampur 3 250 7 2 780 6
Narla 2 234 6 9 3,395 59
Th.Rampur NA NA NA 5 1,160 14
Kalahandi 36 38,739 224 55 37,086 391Source: www.navr atnanews.com, NA- Not Available
2007-08. Bhawanipatna block registered
the highest number of units (9) in 2001-02.
The number has remained the same in
2007-08. The number of units in Koksara
blocks has also stayed the same. The
number of units has increased in seven
blocks including Dharamgarh, Golmunda,
Junagarh, Karlamunda, Lanjigarh, Narla and
Thuamul Rampur from 2001-02 to 2007-08
but it decreased in four blocks (Jaipatna,
Kalampur, Kesinga and M. Rampur) during
the same period.

46
District Human Development Report
2.12 Financial Services
2.12.1 Formal Financial InstitutionEasy access to financial resources and
credit is an essential requirement for
economic diversification and growth.
Liberal provisioning of institutional credit
at affordable rates helps improve access
to financial resources for investment,
consumption and other purposes. Limited
availability of financial resources and
institutional credit at affordable rates is
a major constraint for diversification and
growth of the economy of Kalahandi.
Regional Rural Banks (RRB) and some
Commercial Banks at selected locations are
the main financial institutions. There are
42 branches of RRB and 36 branches of six
commercial banks in the district. In addition,
the district also has 11 branches of the
Central Cooperative Bank and 70 affiliated
Primary Agricultural Cooperatives (PACs).
However, accessing credit from cooperative
banking institutions is not easy. It is often
time consuming, inefficient and beset with
corruption. Full benefits of soft interest
rates, as per public policies, are not available
to most loan seekers for whom the effective
costs of credit are very high. This forces many
loan seekers to approach money lenders and
other informal sources for their credit needs.
2.12.2 Self Help Approach and Financial ServicesWith a view to increasing penetration of
financial services and easy credit in rural
areas, National Bank for Agriculture & Rural
Development (NABARD) has for some time
been promoting semi-formal means for
delivery of financial services to rural people.
The strategy was to shift the focus from
household financial services, especially
credit, to group based lending. To this
effect, the self-help group approach was
adopted all over the country including in
Odisha and Kalahandi. The basic objectives
of such informal associations are: minimising
transaction costs, making lending affordable
and reducing risks of defaults. Rural people
generally require small amounts of credit
at short intervals. This raises the cost of
accessing credit from formal financial
institutions. The modified approach has
attempted to deal with peculiarity at
affordable costs. Rural households in general
and marginalised groups such as women
are organised into Self-Help Groups (SHGs)
which are served by the State agencies
such as DRDA, NGOs and Micro Finance
Institutions. The State Government has
also launched Mission Shakti with a view to
empowering women and helping them in
accessing easy credit at affordable rates. The
programme gathered momentum only after
2001-02 when Mission Shakti was launched.
About 71,300 households have been linked
with local Commercial Banks through
4,192 SHG under the SHG–Bank linkage
programme in the KBK region since 1992.
With continued emphasis on this region,
NABARD has planned to link more SHGs with
Commercial Banks in order to uplift the poor
in a sustained manner. Through micro-credit,
non-farm activities like dairying, poultry
farming, food processing, and creating small
and micro enterprises are being supported
to increase employment and income
opportunities. Out of 2,099 inhabited
villages, 2,039 villages have already been
covered through women SHG and 1,771
villages have been linked with formal credit
sources through the SHG movement. Table
30 gives a status of villages covered with
SHG-based micro credit in different blocks
of Kalahandi.
Table 31 gives the distribution of Self Help
Groups (SHG) formed by different agencies in
different blocks. About 10,395 Self Help Groups
(SHG) have so far been formed in Kalahandi
district with a total membership of 121,269

47
Growth, Poverty and Livelihood
Table 30: Status of Village Covered With SHG-Based Micro Credit: 2008-2009S. No.
Blocks InhabitedVillages
(Number)
Villages Covered
with WSHG (Number)
Villages Covered
with WSHG (%)
Villages Credit Linked
(Number)
Villages Credit Linked
(%)
1 Bhawanipatna 268 254 94.80 220 86.61
2 Dharamgarh 71 71 100.00 71 100.00
3 Golamunda 124 117 94.30 105 89.74
4 Jaipatna 90 90 100.00 90 100.00
5 Junagarh 162 159 98.14 159 100.00
6 Kalampur 54 54 100.00 42 77.78
7 Karlamunda 60 60 100.00 60 100.00
8 Kesinga 99 99 100.00 99 100.00
9 Koksara 69 69 100.00 69 100.00
10 Lanjigarh 429 370 86.24 343 92.70
11 M Rampur 229 227 99.10 215 94.71
12 Narla 166 164 99.80 164 100.00
13 Th. Rampur 278 78 100.00 78 100.00
Kalahandi 2,099 1,812 97.88 1,771 95.50Source: DSW, Kalahandi
Table 31: Distribution of SHG by Block and Agencies: 2008-2009Block ICDS Block NGO Others Total
SHG No.
Member(No.)
SHG No.
Member(No.)
SHG No.
Member(No.)
SHG No.
Member(No.)
SHGNo.
Members(No.)
Bhawanipatna 546 5,887 6 71 504 5,460 45 471 1,101 11,889
Dharamgarh 397 4,408 20 222 287 3,387 31 436 735 8,453
Golamunda 219 2,678 20 253 489 6,261 41 362 769 9,554
Jaipatna 481 5,959 20 299 133 1,719 170 2,000 804 9,977
Junagarh 444 5,058 3 30 380 4,155 2 22 829 9,265
Kalampur 343 3,936 15 77 46 514 20 220 424 4,747
Karlamunda 268 3,993 0 0 62 706 4 42 334 4,741
Kesinga 488 5,643 70 910 188 2,544 0 0 746 9,097
Koksara 264 2,898 2 25 639 7,980 23 256 928 11,159
Lanjigarh 406 4,715 181 992 162 1,793 85 1,023 834 8,523
M Rampur 181 2,018 91 935 563 7,599 32 330 867 10,882
Narla 347 3,969 0 0 688 7,723 48 520 1,083 12,212
Th. Rampur 415 4,557 0 0 232 2,775 12 150 659 7,482
Kalahandi 4,984 57,972 448 4,024 4,450 53,441 513 5,832 10,395 121,269
Source: DSW Kalahandi
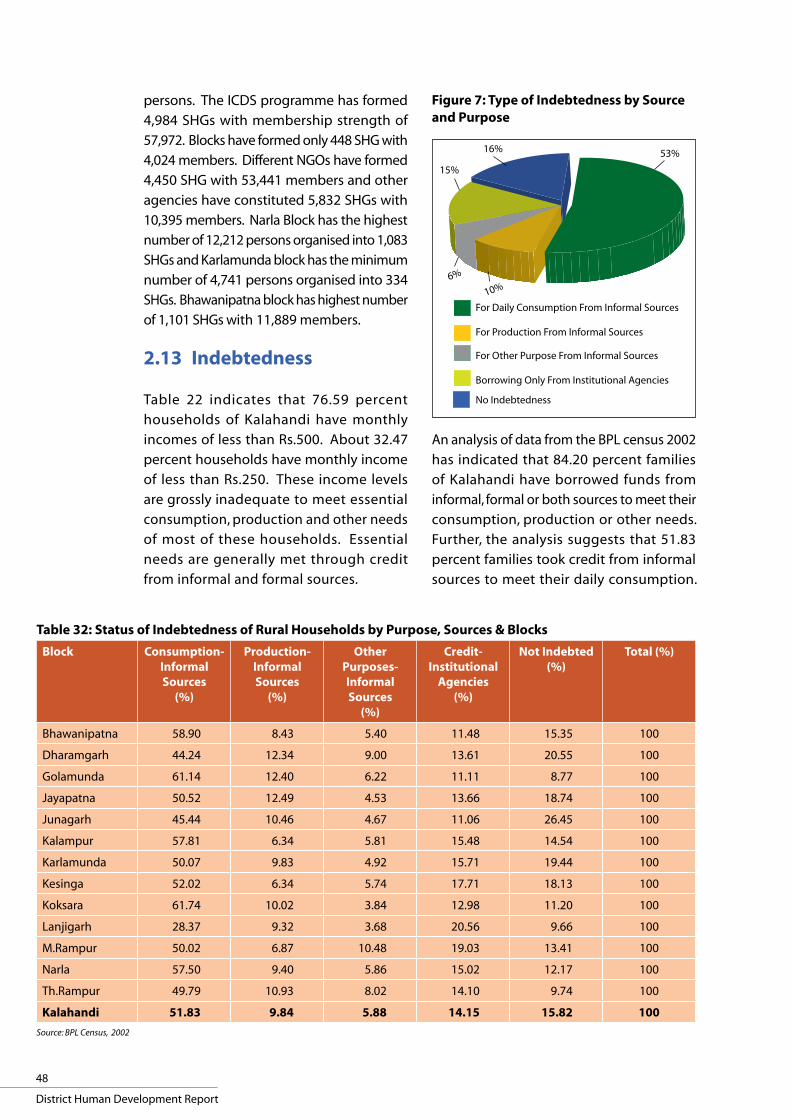
48
District Human Development Report
persons. The ICDS programme has formed
4,984 SHGs with membership strength of
57,972. Blocks have formed only 448 SHG with
4,024 members. Different NGOs have formed
4,450 SHG with 53,441 members and other
agencies have constituted 5,832 SHGs with
10,395 members. Narla Block has the highest
number of 12,212 persons organised into 1,083
SHGs and Karlamunda block has the minimum
number of 4,741 persons organised into 334
SHGs. Bhawanipatna block has highest number
of 1,101 SHGs with 11,889 members.
2.13 Indebtedness
Table 22 indicates that 76.59 percent
households of Kalahandi have monthly
incomes of less than Rs.500. About 32.47
percent households have monthly income
of less than Rs.250. These income levels
are grossly inadequate to meet essential
consumption, production and other needs
of most of these households. Essential
needs are generally met through credit
from informal and formal sources.
An analysis of data from the BPL census 2002
has indicated that 84.20 percent families
of Kalahandi have borrowed funds from
informal, formal or both sources to meet their
consumption, production or other needs.
Further, the analysis suggests that 51.83
percent families took credit from informal
sources to meet their daily consumption.
Table 32: Status of Indebtedness of rural Households by Purpose, Sources & BlocksBlock Consumption-
Informal Sources
(%)
Production- Informal Sources
(%)
Other Purposes- Informal Sources
(%)
Credit- Institutional
Agencies(%)
Not Indebted(%)
Total (%)
Bhawanipatna 58.90 8.43 5.40 11.48 15.35 100
Dharamgarh 44.24 12.34 9.00 13.61 20.55 100
Golamunda 61.14 12.40 6.22 11.11 8.77 100
Jayapatna 50.52 12.49 4.53 13.66 18.74 100
Junagarh 45.44 10.46 4.67 11.06 26.45 100
Kalampur 57.81 6.34 5.81 15.48 14.54 100
Karlamunda 50.07 9.83 4.92 15.71 19.44 100
Kesinga 52.02 6.34 5.74 17.71 18.13 100
Koksara 61.74 10.02 3.84 12.98 11.20 100
Lanjigarh 28.37 9.32 3.68 20.56 9.66 100
M.Rampur 50.02 6.87 10.48 19.03 13.41 100
Narla 57.50 9.40 5.86 15.02 12.17 100
Th.Rampur 49.79 10.93 8.02 14.10 9.74 100
Kalahandi 51.83 9.84 5.88 14.15 15.82 100Source: BPL Census, 2002
Figure 7: Type of Indebtedness by Source and Purpose
30%
20%
46%
4%
53%16%
15%
6%
10%
For Daily Consumption From Informal Sources
For Production From Informal Sources
For Other Purpose From Informal Sources
Borrowing Only From Institutional Agencies
No Indebtedness

49
Growth, Poverty and Livelihood
Around 9.84 percent households have taken
loans from informal sources to meet their
production costs. Further 5.9 percent families
have borrowed money from informal sources
for other purposes. Around 14.1 percent
households have borrowed funds only from
institutional agencies to meet their multiple
needs including consumption, production
and other needs. Only 15.82 percent
households that have different productive
assets have no credit liabilities. Figure 7
depicts the results of this analysis. The status
of indebtedness of all families of different
blocks of Kalahandi district has also been
analysed in Table 32. It may be observed
from Table 32 that 15.82 percent families
of Kalahandi are with no credit liability, the
highest percentage of households (26.45%)
are in Junagarh block and the lowest (8.77%)
families are in Golmunda block, that have no
credit liability. The remaining 84.16 percent
families in different blocks are indebted
having taken loans from informal or formal
sources for their consumption, production
and other needs. Only 14.15 percent families
have taken loans from formal sources. The
maximum numbers (20.56%) are in Lanjigarh
block and the minimum (11.06%) are in
Junagarh block. The rest of the families
(70.01%) of different blocks have borrowed
funds from informal sources to meet their
multiple needs. Koksara block has the highest
percentage of 61.74 percent families, and
Lanjigarh has the lowest percentage of 28.37
percent families, that have taken loans from
informal sources for consumption purposes.
Jaipatna block has highest proportion of
12.49 percent households, and Kalampur and
Kesinga blocks have the lowest proportion of
6.34 percent families, which have borrowed
funds from informal sources to meet their
production needs. M Rampur block has the
highest percentage of families (10.48%), and
Lanjigarh has lowest percentage (3.68%) of
households, that have borrowed funds from
informal sources to meet other needs.
2.13.1 Indebtedness by Social CategoryIndebtedness is very high among rural ST and
SC households. About 61.75 percent rural
ST households and 55.78 percent SC families
have taken credit from informal sources to
meet their daily consumption needs. About
21.13 percent rural ST families have accessed
credit from institutional sources. About 27.10
percent of the other households have no
debt liability.
2.14 Migration
Migration has many facets and most
prominent among them is economic
migration. People migrate to other areas
when no work opportunities are available
in their own localities. People also migrate
to other areas to seek opportunities better
than those available in their own localities.
Some migrate for short durations and others
for long durations. Many migrate for medium
durations. Some migrate permanently
while some others migrate under distress
conditions to seek any work of casual nature.
Some seek seasonal employment when
Figure 8: Families Migrating from the District
Casual Work
65%20%
9%
5%
1%
Seasonal Employment
Other Forms of Livelihood
Non-Migrant
Other Purposes
Percentage of families migrating by reasons
50
District Human Development Report
no employment is available in their own
areas. Available data indicates that 19.44
percent families from the district migrate
to seek regular casual labour work. While
8.47 percent families migrate for seasonal
employment, 5.40 percent households for
other forms of livelihoods and only 1.20
percent families migrate for other purposes
which are not necessarily economic in
nature. The remaining 63.77 percent families
normally do not migrate for economic
purposes. Figure 8 gives the percentage of
families migrating with reasons for them
doing so.
Koksara block, from where 29.95 percent
families migrate to different places for
casual labour, leads the list of all blocks.
Migration for seasonal employment is high
in Golamunda block, from where 15.03
percent families migrate to other places.
The State Government has implemented
a number of livelihood programmes that
have reduced migration to other place for
seeking casual work. The implementation
of National Rural Employment Guarantee
Scheme (NREGS) has also positively
impacted in reducing distress migration to
other places.
2.14.1 Migration in social groupsAvailable data indicates that SC families
lead the pack of migrants. Around 41.44
percent SC families migrate to other places
in search of casual labour. ST families are
generally reluctant to migrate to other places.
However, 37.40 percent ST families have been
reported to have migrated to other places in
search of work. Among OBCs, 33.71 percent
families migrate to other places in search of
employment. Only 30.66 percent families
of other categories migrate for economic
engagement.
This chapter has been inspired by the first
Millennium Development Goal and has
focused on poverty reduction and livelihood
promotion efforts in Kalahandi. The district
economy is still dominated by the primary
sector, though the share of agriculture and
allied sectors in the GDDP has come down
from 44.94 percent in 1999-2000 to 37.44
percent in 2004-05. About 80 percent
households depend on agriculture and allied
sectors for their livelihoods. The real GDDP
has been slowly increasing at an annual
compound growth rate of 2.68 percent. The
real per capita NDDP has increased from
Rs.9,569 in 1999-2000 to Rs.10,319 in
2004-05 at an annual compound growth
rate of 1.27 percent. The work participation
rate is 46.7 percent, and the male and female
work participation rates are 57 percent and
35 percent respectively. The real NDDP per
employee has grown from Rs.22,216.01 in
1999-2000 to Rs.24,357.34 in 2004-05. As
per the BPL census in 1992 and 1997, the
incidence of poverty in the district though
still high has come down from 85.77 percent
in 1992 to 62.71 percent in 1997. The ST and
SC communities have very high proportions
of the poor. Around 76.57 percent HH of the
district have monthly income levels of less
than Rs.500.
This chapter has also mapped a livelihoods
profile of the district. The status of
agriculture, animal husbandry, forestry and
fisheries sectors has also been analysed
from the perspective of their contributions
and potential to provide employment and
income opportunities to the local people.
Farmers’ households are about 24.71
percent, ST and SC HH engaged in farming
being 26.22 percent and 16.21 percent
respectively. However, 64.74 percent families
are engaged in casual labour and ST and SC
families engaged as casual labourers are
66.39 percent and 73.36 percent respectively.
About 175,908 farmers’ HH own 285,091 ha
land with an average land holding of 1.62
ha per HH. About 76 percent families are

51
Growth, Poverty and Livelihood
- • -
marginal and small farmers. Large farmers
constitute only 0.68 percent of the total.
Around 46.50 percent of the total area of
the district is the net sown area, whereas
the net irrigated area is only 36.66 percent.
The average agricultural productivity of
1,043 kg per ha for Kharif and 1,524 kg/ha
for the Rabi crop is much below the State
average. However, the cropping intensity
of 159.98 percent is slightly above the State
average. A large number of families (84.20%)
are indebted, their borrowing being mainly
from informal sources and for consumption
purposes. Migration is also an important
source of livelihoods in the district.
There was a time when the district was
known for poverty and hunger. But with
focused intervention, the situation has
changed dramatically in many parts of the
district. Percentage of families living below
the poverty line has declined from 85.77
percent (BPL census, 1992) to 62.71 percent
(BPL census, 1997). With the growth of
different sectors and emerging scope of
employment, the real GDDP of Kalahandi
has grown at the rate of 3.59 percent per
annum with a compound annual growth rate
of 2.68 percent from 1999-2000 to 2004-05.
The per capita real NDDP has also grown
from Rs.9,569 in 1999-2000 to Rs.10,319
in 2004-05 at a compound annual rate of
1.27 percent. This indicates that the district
economy and per capita district income have
been growing, though the pace of growth is
relatively slow. The real NDDP per employed
person shows an increasing trend compared
to 1999-2000. Looking at the emerging
trend, it is apparent that the district economy
has been diversifying slowly. Secondly, the
work participation rate shows an increasing
trend with regard to participation of females
in different sectors of growth. With the
exploration of growth potential in other
sectors, the proportion of the population
that directly depended on agriculture and
allied activities has declined from 86.66
percent in 1971 to 80.00 percent in 2001.
Along with that, the proportion of the work-
force engaged in the non-farm sector has
increased from 14.34 percent in 1971 to 20.00
percent. This indicates that the work force
has been diversifying from the farm sector
to non-farm sectors. With the improved
financial services, availability of credit
for enterprise and growth of production
sectors, scope of employment and income
generation has increased in the district. Due
to the increasing scope of investment, private
players have started entering the District. It
is expected that with the sector growth and
increased investment, unemployment will
reduce in the district and so will extreme
poverty and hunger. Various development
interventions have significantly contributed
to poverty reduction and employment
generation. The increasing scope of irrigation
and Government Policy of at least 35 percent
irrigation in all the blocks is further going
to contribute to higher production growth
and thereby availability of foodstuff. With
better scope of employment, Government
Sponsored PDS, special discounted rice at
Rs.2/- per kg and increased pension for the
vulnerable segment, the district is expected
to minimise the incidences of malnutrition.
After an analysis of poverty and livelihood
issues, the next chapter is devoted to the
second part of the first MDG that focuses on
hunger and food security aspects of human
development in Kalahandi district.


53
Chapter 3
Food Security and Nutrition
“There are people in the world so hungry, that God cannot appear to them except in the form of bread.”
Mahatma Gandhi


Food Security and Nutrition
Hunger and food insecurity have drawn,
and continue to draw, the attention of the
World Development Community. Eradication
of hunger is a part of the first Millennium
Development Goal. The following quantifiable
targets and monitorable indicators were
prescribed to track the progress of this
component of the first MDG:
Odisha has been perceived as a food insecure
State, where economic access to food for
many households remains restricted mainly
due to poor economic conditions. Kalahandi
district has attracted wide attention because
of frequent press reports of alleged starvation
deaths and acute conditions of poverty.
The conditions pertaining to the incidence
of poverty and livelihoods in Kalahandi
have been studied in detail in the previous
chapter. This chapter aims at analysing
various aspects of food security and nutrition
in the district and is organised as follows.
The next section develops a conceptual
framework which is employed to study food
security and nutritional issues that impact
Kalahandi. Subsequent sections are devoted
To reduce the proportion of people who suffer from hunger by half by 2015 and to monitor by way of proportion of underweight children under-five years of age and proportion of population below minimum level of dietary energy consumption.
55

56
District Human Development Report
to analyse food requirement, availability,
calorie deprivation of different categories
of households, seasonality, vulnerability
and nutritional status of children, women
and others in Kalahandi and Odisha. The
last section discusses main interventions
implemented by the State to address food
insecurity concerns.
3.1 Food Security: A Conceptual Framework
The World Food Summit 1996 articulated
the concept of “food security” as “a
situation that exists when all people, at all
times, have physical, social and economic
access to sufficient, safe and nutritious food
that meets their dietary needs and food
preferences for an active and healthy life”.
Hunger and food insecurity are distinct and
yet related. Hunger may not necessarily be
the consequence of food insecurity. Similarly,
malnutrition may be a potential result of food
insecurity, but is also influenced by several
other factors including capacity for food
absorption and poor eating habits. Broadly
speaking, livelihood security and livelihood
access are important determinants of food
access. If people have access to decent
and sustainable livelihoods, they would, in
general, have assured access to food and
nutrition7. Those who are unemployed or
employed on a causal basis would have
limited access to food. Food security issues
may be studied from the perspective of an
individual, a household, a community or a
nation. Food insecurity exists when there
is no food security. Food insecurity may be
chronic or transitory or cyclic.
Food security may also be analysed in terms
of “food requirement” to ensure sufficient
calories needed for an active and healthy
life, “food availability” based on local or
imported supplies, “food access” both from
physical and economic perspectives, and
“food absorption” to get required nutrition
for an active and healthy life. Food security
also has seasonal dimensions. For example,
farmers and other groups have enough food
at times when crops mature, but may have
inadequate food availability in lean times.
When individuals or households face the risk
of their entitlement failures, they become
vulnerable. These are the perspectives from
which various issues pertaining to food
security and nutrition levels in Kalahandi
are discussed8.
The requirement of food may be assessed
on the basis of a number of assumptions
and available facts. An active and
healthy body requires 2400 kilocalories
(kcal) per day in rural areas and 2100
kcal in urban areas. On the basis of per
capita consumption data available from
different rounds of NSS, levels of per
capita consumption per day and calorie
deprivations may be assessed. The food
requirement may then be assessed keeping
in view the actual consumption levels
and requirement of food to compensate
calorie deprivation. The food availability in
a geographical unit may be assessed keeping
in view the actual production of food grains,
exports and imports of food grains from the
geographical unit, requirements of seeds
and wastage in storage and handling of food
grains. Physical access to food would be a
function of food availability and economic
access to food would be a function of
income levels of individuals or households.
Food absorption is a function of the
individuals’ metabolism and health status.
7 See Food Insecurity Atlas, 2001: M.S. Swaminathan Research Foundation & World Food Programme8 The methodology suggested in this and subsequent paragraphs has also been drawn from the Poverty Task Force Report
“Seasonality and Food Security: A Programme for Ensuring Food Security for All” of Government of Odisha, Planning & Co-ordination
Department, 2003. The report was prepared by Damodar Tripathy and J.K. Mishra, DJRC, Bhubaneswar.

57
Food Security and Nutrition
9 ibid10 See Damodar Tripathy and J.K. Mishra, 2003: PTF report on seasonality and food security.
3.2 Food Requirement & Availability
Following the methodology discussed in the
preceding paragraph, the requirement and
availability of food grains has been estimated
for Odisha and Kalahandi from 1993-94 to
2000-019. Table 33 reports the requirement
and availability of food grains for Kalahandi
and Odisha from 1993-94 to 2000-01. The
availability of food grains has been generally
less than the requirement of food grains in
the State from 1993-94 to 2000-01. This
mismatch between the food availability and
food requirement is one of the factors that
render Odisha a food insecure State. Heavy
incidence of poverty, particularly among ST
and SC communities also contributes to food
insecurity in the State.
It is, however, interesting to observe from
Table 33 that food availability in Kalahandi
has been more than the food requirement of
the district from 1993-94 to 2000-01 except in
1996-97 and 1998-99, when food availability
was less than the food requirement. It may
be inferred that physical access to food is
comfortable in Kalahandi district.
3.3 Calorie Deprivation in Odisha and Kalahandi
As per the available data for 1999-2000
(55th round of NSS), it has been estimated
that 74.6 percent people and 35.40 percent
households in Odisha consumed less than
2,400 kcal per day. The average per capita
per day calorie intake was 2,119 kcal and
the median calorie intake was 2,051 kcal
per capita per day. About 10.40 percent
households consumed less than 1,890 kcal
per capita per day. Those individuals or
households who consume less than 1,800
kcal per capita per day are considered
vulnerable. Very poor households,
particularly those who are 40 percent below
the poverty line, consume 1,383 kcal per
capita per day and are considered highly
vulnerable. They suffer from chronic calorie
deprivation10. About 21.61 percent ST,
12.92 percent SC and 9.55 percent general
households in Odisha are considered
vulnerable. Around 17.41 percent HH of
agricultural labourers and 14.60 percent
HH of cultivators are also in the vulnerable
category. Further, 17.39 percent women-
headed HH are also considered vulnerable.
Table 33: Food Grain requirement & Availability: 1993-2001
Year Kalahandi Odisha
Requirement(000 MT)
Availability(000 MT)
Requirement(000 MT)
Availability(000 MT)
1993-94 273.49 322.00 7,394.84 7,394.31
1994-95 277.99 342.85 7,502.81 7,187.25
1995-96 282.57 372.20 7,612.66 7,130.62
1996-97 287.22 212.95 7,724.42 4,812.06
1997-98 291.96 360.39 7,838.12 6,580.13
1998-99 296.77 189.05 7,953.82 5,740.45
1999-00 301.66 348.38 8,071.56 5,639.16
2000-01 306.63 382.04 8,191.37 4,981.32
Source: Govt. of Odisha, P & C Dept. PTF Report on “Seasonality and Food Security for Odisha”, 2003

58
District Human Development Report
The district-wise distribution of food
insecure and vulnerable population is not
readily available11. However, 18 percent of
the population of the Kalahandi-Bolangir-
Koraput (KBK) region is very vulnerable. Lack
of sustainable livelihoods and inadequate
income levels of individuals and households
contribute to economic vulnerability that
significantly affects the food security status
of the people in the district. The status of
districts in terms of Food Security Index (FSI),
as given in the Food Security Atlas for Odisha,
is given in Table 34. Kalahandi is one of the
severely food insecure districts of the State,
with a FSI value of 0.399 and 16th in rank. It
may be recalled that the availability of food
is generally more than the requirement of
food in the district, that is, physical access
to food is not an issue here. Therefore, the
“severely food insecure” status of this district
can be explained on the basis of the problem
of economic access to food. About 76.59
percent households of the district have
monthly income levels less than Rs. 500 and
32.47 percent households have monthly
income levels less than Rs. 250.
3.4 Food Security: Seasonality and Vulnerability
Food security is also a function of seasons12.
About a quarter of the ultra poor (i.e., those
who are 40 percent below the poverty line)
in the KBK region, of which Kalahandi is a
part, face food distress round the year.
June-September is generally the most critical
Table 34: Food Security Status of Districts of Odisha as reflected By FSA: 2008
Extremely Insecure Severely Insecure Moderately Insecure
District FSI Rank District FSI Rank District FSI Rank
Kandhamal 0.247 30 Koraput 0.336 26 Dhenkanal 0.420 14
Gajapati 0.304 29 Sundargarh 0.343 25 Jharsuguda 0.446 13
Rayagada 0.313 28 Mayurbhanj 0.351 24 Ganjam 0.456 12
Nabarangpur 0.322 27 Malkangiri 0.353 23 Sonepur 0.458 11
Sambalpur 0.362 22 Nayagarh 0.461 10
Deogarh 0.366 21
Baudh 0.379 20
Keonjhar 0.389 19
Angul 0.390 18
Nuapada 0.392 17
Kalahandi 0.399 16
Balangir 0.409 15
Moderately Secure Secure
District FSI Rank District FSI Rank
Kendrapara 0.516 9 Bhadrak 0.594 3
Jajpur 0.518 8 Puri 0.596 2
Balasore 0.528 7 Jagatsinghpur 0.624 1
Bargarh 0.529 6
Khurdha 0.538 5
Cuttack 0.553 4
Source: Food Security Atlas of Odisha, 2008
11 Given the sample size and distribution of NSS samples across districts, NSS estimation are not reliable at district level. The NSS estimates are
valid only at State and NSS region levels.12 See Damodar Tripathy & J.K. Mishra, 2003: PTF Report on Seasonality and Food Security

59
Food Security and Nutrition
for a large number of the ultra poor. Serious
food shortages are observed in July-August,
when more than 80 percent of the ultra poor
experience severe food shortages. In June
and September, more than 65 percent of
the ultra poor face food shortages. In these
periods, food supply is low and food prices are
very high. This increases their vulnerability.
It also impairs coping capacities of the poor
and vulnerable.
3.5 Food Security of SC and ST Households
An analysis of households with food
shortages has revealed that those
households with no houses or only kutcha
houses experience greater food insecurity
of varying degrees. Table 35 provides food
status of SC families with no houses (HL)
and with kutcha houses (KH) by block. It
may be observed from Table 35 that 12.73
percent families (9.60% with no houses and
3.13 percent with kutcha houses) have less
than a meal per day for most parts of the year.
About 21.64 percent families (13.05% with
no houses and 8.59% with kutcha houses)
have only one meal a day with occasional
hunger and 24.91 percent families (14.67%
houseless and 10.24% with kutcha houses)
have only one meal throughout the year.
Only 4.43 percent families (2.13% houseless
and 2.3% with kutcha houses) have enough
food throughout the year.
Table 36 provides the food status of ST
families with no houses (HL) and with kutcha
houses (KH) by block. It may be observed
from Table 36 that 14.72 percent families
(11.67% with no house and 3.05% with
kutcha houses) have less than a meal per
day for most part of the year. About 21.12
Table 35: Food Status of Selected SC Families by Block: 2002
Name of Blocks
Less than One Meal / day
- Major Part of the Year
One Meal / day- With Occasional
Hunger
One Meal throughout
the Year
Two Meals / day with
Occasional Shortage
Enough Food throughout
the Year
HL KH HL KH HL KH HL KH HL KH
Percentage of Households with or without Meals
Bhawanipatna 13.01 2.43 8.79 4.86 18.28 11.56 59.05 79.89 0.88 1.24
Dharamgarh 2.89 0.66 6.36 6.47 12.72 5.89 73.99 81.67 3.47 5.28
Golamunda 2.29 0.37 1.53 0.34 6.87 4.48 87.02 92.89 2.29 1.67
Jayapatna 8.33 2.38 4.96 2.97 6.56 6.16 77.30 86.39 2.84 2.07
Junagarh 12.91 3.49 11.16 4.21 7.88 6.26 65.86 83.07 1.97 2.82
Kalampur 3.54 1.27 8.85 5.02 9.73 8.35 76.99 82.80 0.88 2.55
Karlamunda 7.95 0.50 5.68 4.15 13.64 12.69 70.45 80.25 2.27 2.35
Kesinga 3.90 2.02 9.09 5.52 16.10 12.95 67.27 76.83 3.64 2.66
Koksara 10.86 4.32 20.67 14.11 20.46 15.05 45.51 63.95 2.51 2.53
Lanjigarh 7.33 3.18 25.67 22.35 19.33 15.15 40.67 53.80 0.33 1.92
M. Rampur 3.13 1.63 4.69 8.58 19.27 6.99 65.10 80.01 7.81 2.79
Narla 11.69 3.57 16.95 10.16 19.33 11.69 50.36 72.74 1.67 1.82
Th. Rampur 15.96 10.57 25.72 17.61 14.86 13.69 43.24 56.34 0.22 1.47
Kalahandi 9.60 3.13 13.05 8.59 14.67 10.24 60.03 75.33 2.13 2.30
Note: HL-Houseless, KH-Kutcha House
Source: BPL Census, 2002
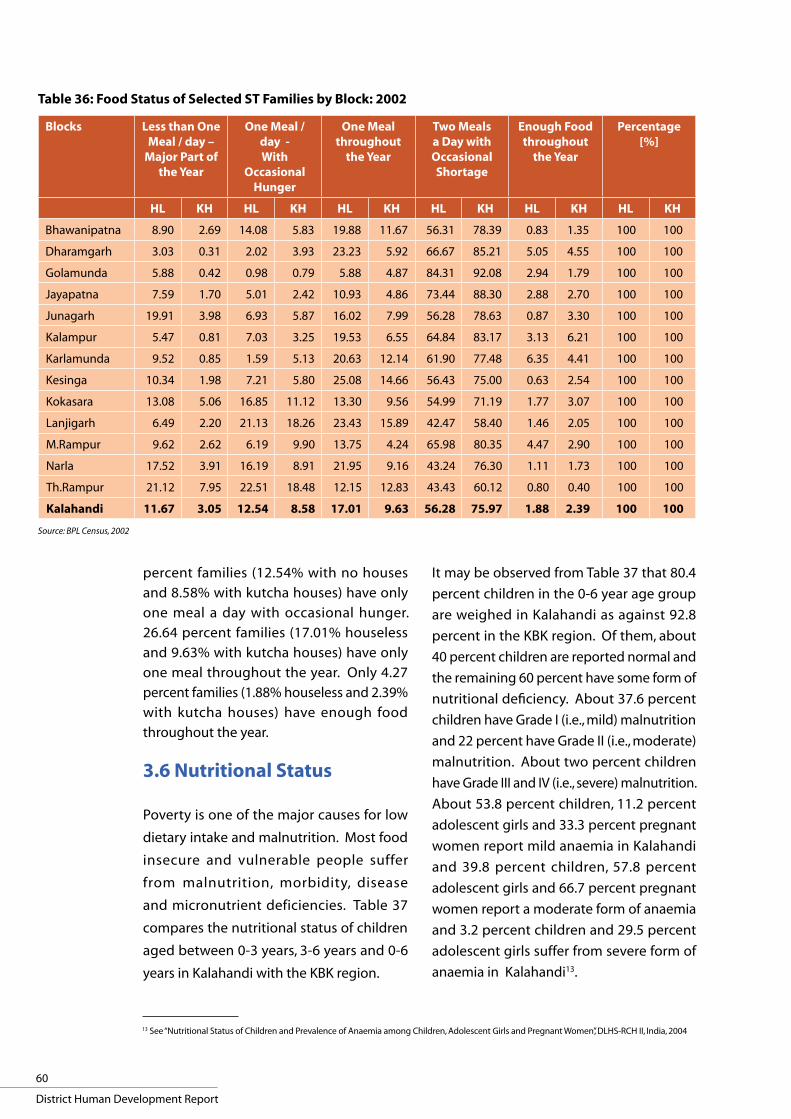
60
District Human Development Report
percent families (12.54% with no houses
and 8.58% with kutcha houses) have only
one meal a day with occasional hunger.
26.64 percent families (17.01% houseless
and 9.63% with kutcha houses) have only
one meal throughout the year. Only 4.27
percent families (1.88% houseless and 2.39%
with kutcha houses) have enough food
throughout the year.
3.6 Nutritional Status
Poverty is one of the major causes for low
dietary intake and malnutrition. Most food
insecure and vulnerable people suffer
from malnutrition, morbidity, disease
and micronutrient deficiencies. Table 37
compares the nutritional status of children
aged between 0-3 years, 3-6 years and 0-6
years in Kalahandi with the KBK region.
Table 36: Food Status of Selected ST Families by Block: 2002
Blocks Less than One Meal / day –
Major Part of the Year
One Meal / day -With
Occasional Hunger
One Meal throughout
the Year
Two Meals a Day with Occasional Shortage
Enough Food throughout
the Year
Percentage [%]
HL KH HL KH HL KH HL KH HL KH HL KH
Bhawanipatna 8.90 2.69 14.08 5.83 19.88 11.67 56.31 78.39 0.83 1.35 100 100
Dharamgarh 3.03 0.31 2.02 3.93 23.23 5.92 66.67 85.21 5.05 4.55 100 100
Golamunda 5.88 0.42 0.98 0.79 5.88 4.87 84.31 92.08 2.94 1.79 100 100
Jayapatna 7.59 1.70 5.01 2.42 10.93 4.86 73.44 88.30 2.88 2.70 100 100
Junagarh 19.91 3.98 6.93 5.87 16.02 7.99 56.28 78.63 0.87 3.30 100 100
Kalampur 5.47 0.81 7.03 3.25 19.53 6.55 64.84 83.17 3.13 6.21 100 100
Karlamunda 9.52 0.85 1.59 5.13 20.63 12.14 61.90 77.48 6.35 4.41 100 100
Kesinga 10.34 1.98 7.21 5.80 25.08 14.66 56.43 75.00 0.63 2.54 100 100
Kokasara 13.08 5.06 16.85 11.12 13.30 9.56 54.99 71.19 1.77 3.07 100 100
Lanjigarh 6.49 2.20 21.13 18.26 23.43 15.89 42.47 58.40 1.46 2.05 100 100
M.Rampur 9.62 2.62 6.19 9.90 13.75 4.24 65.98 80.35 4.47 2.90 100 100
Narla 17.52 3.91 16.19 8.91 21.95 9.16 43.24 76.30 1.11 1.73 100 100
Th.Rampur 21.12 7.95 22.51 18.48 12.15 12.83 43.43 60.12 0.80 0.40 100 100
Kalahandi 11.67 3.05 12.54 8.58 17.01 9.63 56.28 75.97 1.88 2.39 100 100
Source: BPL Census, 2002
It may be observed from Table 37 that 80.4
percent children in the 0-6 year age group
are weighed in Kalahandi as against 92.8
percent in the KBK region. Of them, about
40 percent children are reported normal and
the remaining 60 percent have some form of
nutritional deficiency. About 37.6 percent
children have Grade I (i.e., mild) malnutrition
and 22 percent have Grade II (i.e., moderate)
malnutrition. About two percent children
have Grade III and IV (i.e., severe) malnutrition.
About 53.8 percent children, 11.2 percent
adolescent girls and 33.3 percent pregnant
women report mild anaemia in Kalahandi
and 39.8 percent children, 57.8 percent
adolescent girls and 66.7 percent pregnant
women report a moderate form of anaemia
and 3.2 percent children and 29.5 percent
adolescent girls suffer from severe form of
anaemia in Kalahandi13.
13 See “Nutritional Status of Children and Prevalence of Anaemia among Children, Adolescent Girls and Pregnant Women”, DLHS-RCH II, India, 2004

61
Food Security and Nutrition
3.7 Interventions for Strengthening Food Security
The State Government and Government
of India have implemented a number of
programmes to improve food and nutrition
provisioning to different classes of people
in Odisha as well as in Kalahandi. These
interventions include: (a) subsidised
distribution of food grains, (b) nutrition
provisioning through anganwadis, and
(c) food for work programme. In addition,
grain banks have also emerged as people’s
interventions to cope with food insecurity.
The objective is to ensure easy availability
of food to households at affordable prices.
Major food interventions are summarised
as follows.
3.7.1 Public Distribution System (PDS)I t ensures availabil ity of essential
commodities like rice, wheat, sugar, edible
oils and kerosene at subsidised rates to
identified consumers through a network
of outlets or Fair Price Shops (FPS). A large
section of the district has accessibility to
PDS commodities.
3.7.2 Supplementary Nutrition Programme (SNP) This programme is implemented in
Kalahandi at 1,263 centres under 14 ICDS
projects serving 165,071 beneficiaries.
Under SNP, ready to eat food called “Orimix”,
which is composed of wheat, soya bean and
sugar in the ratio of 65:15:20 and fortified
with vitamins and minerals is provided to
beneficiaries consisting of pregnant, nursing
mothers and children aged between 0-6
years. Under the programme, 80 grams of
Orimix is provided to the beneficiaries for 25
days in a month along with oil provided by
CARE India. Severely malnourished children,
pregnant and nursing mothers are given
double rations.
3.7.3 Mid Day Meal Under this programme, cooked food is
provided to students in Classes I-V at 2,198
primary schools. This programme serves two
objectives: (i) encouraging more enrollments,
and retention of students in primary schools,
and (ii) improving nutritional status of
students. It is implemented in primary
schools and EGS centres of the district
Table 37: Nutritional Status of Children in Kalahandi and KBK region: 2007
District Children Normal Children with Nutritional Deficiencies
Total Weighed % Total(000)
% Gr. I(000)
% Gr.II
(000)
% Gr.III & IV
(000)
% Gr.II-IV %
Children in 0-3 Year Age Group
Kalahandi 106,647 100,758 94.50 41.10 40.80 36.10 35.90 20.00 19.90 2.50 2.50 22.30
KBK Area 604,072 585,571 95.30 219.20 36.70 211.40 36.70 131.80 22.90 11.60 2.00 24.90
Children in 3-6 Year Age Group
Kalahandi 98,163 63,918 65.10 23.90 37.40 25.90 40.60 13.00 20.40 0.80 1.20 21.60
KBK Area 488,061 428,365 87.70 156.40 36.50 168.30 39.30 98.50 23.00 2.50 0.60 23.60
Children in 0-6 Year Age Group
Kalahandi 204,810 164,676 80.40 65.00 39.50 62.00 37.60 33.00 20.00 3.30 2.00 22.00
KBK Area 1,092,133 1,013,936 92.80 375.60 37.00 379.70 37.40 230.30 22.70 14.90 1.50 24.20
Source: Annual Action Plan for KBK Districts, 2007-2008, Govt. of Odisha

62
District Human Development Report
covering 170,019 students in primary schools
and 27,381 students in EGS centres. This
programme also covers the National Child
Labour Project (NCLP) schools of the district.
3.7.4 emergency Feeding ProgrammeUnder this, cooked food is provided to
aged persons, who do not have any social
security system at the family level. About
37,200 (17,281 male and 19,919 female) old,
infirm and indigent persons in Kalahandi
district, who have no one to support
them, are covered under the emergency
feeding programme. The programme is
implemented only in the KBK region.
3.7.5 Two-rupee per Kilogram rice With a view to improving food security of
the people of Odisha, the State Government
launched a new initiative in 2008-09. All
households of the KBK region including
Kalahandi district and BPL families of other
parts of the State were assured supply of rice
to the extent of 25 kg per household per month
at a highly subsidised rate of Rs. 2 /- per kg.
This chapter has also been inspired by the
first MDG and has focused on food security
and nutrition issues, which are crucially
important for Odisha and Kalahandi. ST,
SC and agricultural labourers’ HH are most
food insecure in Kalahandi which has a
food security index of 0.366 and ranks 16th
in the State in terms of food insecurity and
vulnerability. July and August are very
difficult months for the most food insecure
and vulnerable households of the district.
The limited economic access to food, low
dietary intake and malnutrition are matters
of serious concern for the district. With
a view to addressing food insecurity and
raising nutritional status of children, women,
the old and other affected households,
the State Government has implemented
several interventions including the Public
Distribution Scheme, Supplementary
Nutrition Programme for children and
women, Emergency Feeding Programme
for indigent and destitute old people and
two rupees a kg rice for all households of
Kalahandi. The chapter also notes that
health conditions of the people affect
their livelihoods, food security and food
absorption capacities. Therefore, the next
chapter is devoted to study health conditions
in Kalahandi district.
- • -

“Without health life is not life; it is only a state of languor and suffering - an image of death.”
- Gautama Buddha
Health
Chapter 4


65
Health
This chapter examines health conditions,
and key health concerns, in Kalahandi
district and assesses the status of key health
targets and indicators that contribute to
achieving Millennium Development Goals.
It is organised as follows. The next two
sections describe the health infrastructure
in Kalahandi. Major health programmes,
institutional reforms and status of maternal
and child health, immunisation services,
family planning services, sexual and
reproductive health for adolescents in the
district are discussed in the subsequent
sections. The last section is devoted to safe
drinking water and sanitation programmes.
The World Health Organisation (WHO)
conceives health as a “State of complete
physical, mental and social well-being
and not merely the absence of disease or
infirmity”14. Good health enables a person
to engage in gainful economic activities, to
earn a living and to meaningfully participate
in social and cultural life. On the other hand,
a sick person is constrained from enjoying a
full economic, social and cultural life. Health
is, therefore, an important requirement for
human development. Three Millennium
14 See also Odisha Human Development Report 2004

66
District Human Development Report
Development Goals (MDGs 4, 5 and 6) focus
on key health issues. Their quantifiable
targets and monitorable indicators that
have been prescribed to track progress are
summarised in Box 3.
4.1 Modest Beginnings of Modern Health Practices
The former State of Kalahandi was
widely spread and had large rural and
tribal populations. The region had poor
connectivity and means of communications.
The reach of systematic health services
was not very deep. Most interior areas
had no access to modern health services
because of poor connectivity, lack of
health infrastructure and limited awareness
among local people about hygienic and
modern health practices. Owing to their
educational backwardness and lack of
awareness, rural people in general and
the tribal population in particular do not
readily accept modern medical system and
practices. They rely generally on traditional
systems of healing. Tribal people have their
own beliefs and methods of treatment. For
them, any system of healing was inseparable
from their religious beliefs and superstitions.
Traditional healers, variously known as Gunias
MDG 4: Reduce child mortalityl To reduce by two thirds the mortality rate among children under five
l To track under-five mortality rate, infant mortality rate, and proportion of one year-
old children immunised against measles
MDG 5: Improve maternal health
l To reduce by three quarters the maternal mortality ratio
l To track maternal mortality ratio, and proportion of births attended by skilled health
personnel
l To achieve, by 2015, universal access to reproductive health
l To monitor contraceptive prevalence rate, adolescent birth rate, antenatal care
coverage, and unmet need for family planning
MDG 6: Combat HIV /AIDS, malaria and other diseasesl To halt and begin to reverse the spread of HIV / AIDS
l To track HIV prevalence among population aged 15-24 years, condom use at last
high-risk sex, proportion of population aged 15-24 years with comprehensive
correct knowledge of HIV/AIDS, and ratio of school attendance of orphans to school
attendance of non-orphans aged 10-14 years
l To achieve, by 2010, universal access to treatment for HIV/AIDS for all needy
l To monitor the proportion of population with advanced HIV infection with access
to antiretroviral drugs
l To halt and begin to reverse the incidence to malaria and other major diseases
To track incidence and death rates associated with malaria, proportion of children under
five sleeping under insecticide-treated bed nets, proportion of children under five with
fever who are treated with appropriate anti-malarial drugs, incidence, prevalence and
death rates associated with tuberculosis, and proportion of tuberculosis cases detected
and cured under directly observed treatment short course.
Box 3: MDGs on Health Issues

67
Health
or disharies or by other names, were well
respected members of tribal communities.
Medicinal herbs have been widely used for
curing common ailments.
The official records indicate that in
1907-08, there were only five dispensaries
in the former State of Kalahandi to cater
to the health needs of the people. These
dispensaries were situated at Bhawanipatna,
Junagarh and at the headquarters of the
Thuamul-Rampur, Kashipur and Mahulpatna
Zamindaris. These were under the charge
of Civil Hospital Assistants and the former
State Medical Department was under the
charge of a qualified Medical Officer. At the
headquarters, there was a separate female
dispensary with a lady doctor in charge.
Vaccination was free and thoroughly carried
out, although it was not popular then.
Collection of vital statistics was started in
the ex-State of Kalahandi sometime in the
beginning of the last century. A systematic
collection of vital statistics, however, began
only from the early 1950s, under the Bengal
Births and Deaths Registration Act 1873.
The village chowkidar was responsible for
reporting births and deaths at village level.
The Thana Officer consolidated the reports of
village chowkidars and sent monthly reports
to the District Health Officer. However, this
system did not always work well and there
were frequent break downs. There was no
mechanism to cross-check the veracity of
information provided by village chowkidars.
The collection of vital statistics in urban
areas began in 1954. The health officer of
the Municipality or NAC used to collect and
report vital statistics to the District Health
Officer who compiled the reports of Thana
Officers and Municipal Health Officers and
submitted a consolidated report to the
Director of Health Services, Odisha. Pursuant
to the Registration of Births and Deaths Act,
1969 and the Odisha Registration of Births
& Deaths Rules, 1970, the designated Health
Officers, or in their absence, the Executive
Officer of a Municipality or NAC, and Thana
Officers in rural areas, have been designated
as Registrars for registration of births and
deaths. Under these rules, the Chief District
Medical Officer acts as the District Registrar
while the Director of Health Service, Odisha
acts as the Chief Registrar.
4.2 Health Infrastructure in Kalahandi
After the merger of the former Kalahandi
State with Odisha, there has been
a significant improvement in health
infrastructure in the district. There are 72
allopathic medical institutions, including one
newly coming up Medical College at Jaring,
two hospitals, one at the district headquarters
and a sub-divisional hospital at Dharamgarh,
seven dispensaries, six Community Health
Centres (CHC), 42 Primary Health Centres
(PHC) and 14 Mobile Health Units (MHU).
The Medical College at Jaring has come up
under public-private partnership mode and
has a 300 bedded hospital, three operation
theatres, a seven bedded ICU and causality
outdoor facilities. In addition, there are 242
sub-centres, one ANM training school,18
homeopathic and 20 ayurvedic dispensaries.
The distribution of health institutions in
different blocks and urban bodies is given
in Table 38.
4.2.1 Health Personnel and Patient LoadThe sanctioned strength of health personnel
of different categories in Kalahandi is
as follows: 155 allopathic doctors, 16
homeopathic doctors, 17 ayurvedic doctors,
83 nurses, 11 homeopathic assistants and
10 ayurvedic assistants. In addition, 10
additional contractual doctors have been
engaged to deal with heavy patient load in
the district. There are 426 beds available in
different health institutions in the district.

68
District Human Development Report
The health personnel have to cope with a
heavy patient load, which varies from 15
to 17 lakh patients a year. In 2004-05, the
total number of patients treated in all health
institutions of the district were 1,565,702.
The distribution of health personnel by block
and urban bodies is given in Table 39. On an
average, there is one doctor for every 7,105
persons in the district. There are, however,
wide variations in availability of doctors and
other health personnel in different blocks
and urban bodies. In urban bodies, there
is one doctor for every 1,700 persons on
an average. There is one doctor, for every
13,440 persons in Junagarh block, and for
every 6,156 persons in M. Rampur block. The
proportion of female doctors is generally
low and ranges between 10-15 percent. In
the absence of female doctors, rural and
Table 38: Distribution of Health Institutions by Blocks / urban Bodies: 2004-2005Block / Urban Body(Health Institutions)
Allopathic Health Institutions Homeo. Disp.
Ayur. Disp.Hospital Disp. CHC PHC MHU Sub-
Centre
Number
Bhawanipatna (35) NA NA 1 4 1 26 2 1
Dharamgarh (30) 1 NA NA 5 1 20 2 1
Golamunda (27) NA NA 1 3 1 20 1 1
Jaypatna (28) NA 1 NA 2 1 22 1 1
Junagarh (37) 1* NA NA 5 1 26 1 3
Kalampur (14) NA NA NA 2 1 9 1 1
Karlamunda (15) NA 1 NA 2 1 10 NA 1
Kesinga (26) NA NA 1 3 1 17 3 1
Koksara (27) NA NA NA 4 1 19 1 2
Lanjigarh (32) NA 1 NA 3 1 24 1 2
M.Rampur (20) NA 1 NA 3 1 12 1 2
Narla (27) NA NA 1 4 1 19 1 2
Th.Rampur (27) NA NA 1 2 2 18 2 2
Bhawanipatna Mu. (4) 1 2 NA NA NA NA 1 NA
Junagarh NAC (1) NA NA 1 NA NA NA NA NA
Kesinga NAC (1) NA 1 NA NA NA NA NA NA
Kalahandi District (352) 3 7 6 42 14 242 18 20
Notes: Disp. – dispensary, CHC – community health centre, PHC – primary health centre,
MHU – mobile health unit, Homeo. Disp. – homeopathic dispensary, Ayur. Disp. –ayurvedic dispensary
*Medical College, Jaring, Junagarh
Source: District Statistical Handbook, Kalahandi, 2005, NA- Not Available
tribal women usually remain reluctant to
share various details of their ailments with
male doctors. This constrains their access
to various health services. Another serious
concern is the large number of vacancies
(about 20-35%) of doctors at any given
point of time. This is a binding constraint in
supplying adequate health services.
There is also one Auxiliary Nurse Midwife
(ANM) for every sub-centre. Additional ANMs
have also been engaged under the National
Rural Health Mission (NRHM) programme
with a view to give a greater thrust to the
Reproductive Child Health (RCH) programme.
There are 275 ANMs in Kalahandi. With a
view to improving the community health
and generating greater awareness among
people about various diseases and health

69
Health
concerns along with improving institutional
delivery rates, one Accredited Social Health
Activist (ASHA) has been engaged per village
of about 1000 population. In all 1,383 ASHAs
have been engaged in Kalahandi district for
2,099 villages. ASHA has been entrusted
with multiple responsibilities including
escorting pregnant women of her assigned
villages to the nearest health institution for
periodical check-ups and promoting safe
institutional deliveries, administering rapid
diagnostic tests for detecting malaria and
other specified diseases, assisting TB patients
to undergo DOT treatment, promoting family
planning measures and accelerating the
pace of implementation of other maternity
related programmes. Her remuneration
is performance based. In order to create
awareness among people on various
health related issues and their remedial
measures; the State Health Education Bureau
Table 39: Distribution of Health Personnel by block / urban bodies: 2004-2005Block / Urban Body
Allopathic Personnel
BedsAvail.
Homeopathic Personnel
Ayurvedic Personnel
Patients Treated
Doctor Nurse Doctor Help. Doctor Help.
Number
Bhawanipatna 8 1 16 2 1 1 NA 75,630
Dharamgarh 6 8 55 2 1 1 1 121,519
Golamunda 7 5 6 1 1 1 1 84,826
Jaipatna 9 7 36 1 NA 1 1 67,250
Junagarh 7 NA 6 1 1 3 1 149,581
Kalampur 3 NA 6 1 1 NA 1 52,431
Karlamunda 4 NA 12 NA NA 1 1 39,589
Kesinga 5 NA 6 3 3 1 1 91,106
Koksara 7 4 22 1 NA 1 2 77,160
Lanjigarh 11 4 22 1 NA 2 NA 87,591
Narla 8 NA 6 1 NA 2 1 101,943
M. Rampur 10 8 22 1 NA 2 NA 104,811
Th. Rampur 6 5 6 1 NA 1 NA 40,837
Bhawanipatna [M.] 47 26 145 NA 3 NA NA 367,389
Junagarh [NAC] 8 8 30 NA NA NA NA 43,096
Kesinga [NAC] 9 7 30 NA NA NA NA 60,943
Kalahandi District
155 83 426 16 11 17 10 1,565,702
Source: District Statistical Handbook, Kalahandi, 2005, NA- Not Available
prepares and disseminate health education
materials such as posters and pamphlets
on communicable diseases, public health
activities, and sanitary and hygienic principles.
The District Family Welfare Bureau also
implements the mass awareness programmes
with special focus on family health, maternity
and child health schemes.
In order to address the chronic concern of a
large number of vacancies of doctors in the
district and extend health services to the rural
and tribal populations of the remote villages,
a massive programme of Mobile Health Units
(MHUs) has been mounted in the district
since 1995-96. There are, at present in the
district, 14 MHUs that provide health services
to needy people in an outreach mode. An
MHU consists of a doctor, a pharmacist, a
health worker and a driver and operates for
24 days in a month as per a pre-determined

70
District Human Development Report
route chart well advertised among the target
Gram Panchayats. On an average, an MHU
covers about 500 villages, and extends health
services to about 16,000-20,000 patients in
a year. These efforts to improve primary
health infrastructure and to extend health
services in rural areas in an outreach mode
have considerably improved health services
in the district. The district has achieved good
success in leprosy control, malaria, MMR,
IMR, and other health services. As per the
Odisha Human Development Report 2004,
the district had a Health Index of 0.606
against 0.579 for the State.
4.3 District Health Status
Health is a prerequisite for human
development and is an essential component
for the well being of mankind. Over a period
of time, the health status of the district has
improved significantly in different aspects
due to concerted effort of Government
and non-Government agencies. The Infant
Mortality Rate (IMR), which was 76 during
2001, has reduced to 59 (2011) while the
Maternal Mortality Ratio of the district (311)
is above the State average. Institutional
delivery has improved to 50 percent and
home delivery without trained personnel
has gone down. Deaths due to malaria
have reduced in many parts of the district
due to improved awareness and improved
sanitary practices. Incidences of death due
to diarrhoea have decreased significantly
except in occasional outbursts. Immunisation
coverage has increased with antenatal
check up percentages. The district could
control and reduce the incidence of leprosy
with increased awareness and preventive/
curative measures. Achievement of the
district in family welfare and immunisation
is presented in the table 40.
The District Level Household Survey-2004
conducted by the International Institute for
Population Sciences under Reproductive and
Child Health-II (RCH -II) highlights certain
Table 40: District Achievements in Family Welfare and ImmunisationSl. No. Activities Year 2008-09
Assessment Achievements Achievement (%)
1 Sterilisation 5,771 4,675 81
2 IUD / CUI [Intra Uterine Device] 4,231 2,657 63
3 CC users 6,747 4,396 65
4 OP users 5,702 4,550 80
5 TT [Pregnant women] 41,350 32,928 80
6 DPT 37,592 28,836 77
7 OPV [Oral Polio Vaccination] 37,592 30,544 81
8 BCG 37,592 31,176 83
9 Measeals 37,592 28,545 76
10 DT 41,902 28,923 69
11 TT-10 years 42,105 29,932 71
12 TT-16 years 39,096 24,362 62
13 IFA – Mothers 60,366 34,012 56
14 IFA-Children 41,902 30,934 74
15 Vitamin-A, Infants 37,592 28,545 76
16 Vitamin-A, Children 147,467 142,612 97
17 ANC Registration 41,350 36,694 89
Source: CDMO Office, Kalahandi & NRHM Kalahandi

71
Health
key features of the district. The mean age at
marriage for boys and girls who got married
since January 1, 2001 was 24 years and 20
years respectively. The average annual
crude birth rate was estimated to be 21.7
per thousand, with 49 percent births of
order three and above (during the period
three years preceding the survey). The Total
Fertility Rate (TFR) was 2.6. The average
annual crude death rate of the district is
9.7 per thousand population (three years
preceding the survey period). The Infant
Mortality Rate of the district was 76.1 per
1000 live births and under five mortality
rate was 86.8. The study identifies blindness,
tuberculosis and malaria as the common
diseases and their prevalence is higher in
rural areas as compared to urban areas.
Figure 9 gives a comparision of the health
indices of the State and all the districts as per
the State HDR 2004.
Figure 9: Health Indices of Various Districts as per State HDr 2004
Kandhamal
Malkangiri
Gajapati
Koraput
Rayagada
Jagatsinghpur
Jajpur
Keonjhar
Nabarangpur
Ganjam
Boudh
Sambalpur
Balasore
Bargarh
Nayagarh
Odisha
Dhenkanal
Balangir
Sonepur
Angul
Kendrapara
Puri
Jharsuguda
Bhadrak
Cuttack
Sondargarph
Nuapada
Khurda
Kalahandi
Deogarh
Mayurbhanj
0.000 0.100 0.200 0.300 0.400 0.500 0.600 0.700 0.800 0.900
0.006
0.122
0.173
0.218
0.250
0.288
0.333
0.340
0.340
0.404
0.423
0.436
0.442
0.449
0.462
0.468
0.468
0.468
0.474
0.481
0.596
0.622
0.635
0.673
0.686
0.692
0.692
0.724
0.763
0.776
0.782
Health Indices of Various Districts as per State HDR 2004
Health Index
Dis
tric
ts

72
District Human Development Report
4.4 Major Health Programmes & Institutional Reforms
The Government of India and State
Government have launched several initiatives
to improve the structure, implementation
strategies and reach of rural health services.
The most important initiative is the National
Rural Health Mission (NRHM) an umbrella
programme that integrates existing health
services and new schemes. The programme
is implemented in a district planning mode
with greater involvement of Panchayati Raj
Institutions (PRI). The District Health Action
Plan, Sub-District Health Action Plans and
Project Implementation Plan (PIP) are
developed in a participatory and consultative
mode and reflect major district health
priorities, concerns and implementation
strategies. The Zilla Swasthya Samiti (ZSS)
and Rogi Kalyan Samiti (RKS) are important
institutional arrangements at district and
sub-district levels. Other initiatives include
Panchavyadhi, Infant Mortality Reduction
Mission, maternal and child health schemes
and other health programmes.
NRHM seeks to provide effective healthcare
mainly to rural areas and has the following
implementation strategies: (i) information
dissemination with a view to generating
greater awareness, (ii) participatory
planning and programme implementation,
(iii) protecting the rights and entitlements of
vulnerable communities including women
and children and developing workable
strategies for action to realise them, (iv)
taking concrete measures to undertake
human resource development for health
service providers, (v) providing adequate
quantities of desired medicines free or at
affordable prices for the needy, (vi) taking
initiatives to fill vacant posts of health
personnel at all levels, and (vii) continuous
monitoring of the implementation of
different health services.
Zilla Swasthya Samiti is a district level society
headed by the Zilla Parishad President that
directs and supports implementation of rural
health programmes. Rogi Kalyan Samitis
have been formed at district and sub-district
levels to facilitate provisioning of quality care
with accountability, people’s participation
and greater transparency in utilisation
of funds.
The State Government has identified five
major diseases, called panchvyadhi: malaria,
diarrhoea, acute respiratory infections,
leprosy and scabies that affect a large
number of poor people and account for
70 percent of patient load in primary
health institutions. The Panchavyadhi Chikitsa
scheme launched in 2001 prescribes specific
clinical protocols to be followed by health
personnel and includes free treatment and
free medicines for patients, particularly for
the poor.
Morbidity, as an incidence of ill health
that affects people’s work and social life, is
measured in various ways. It is measured
as a probability that a randomly selected
individual in the population at some date
and location would become seriously ill at
a given period. The National Sample Survey
(NSS) provides estimates of prevalence of
morbidity as the proportion of ailing persons
and measured as the number of persons
reporting ailments during a 15-day period
per 1000 persons for a broad range of age
groups. Mortality due to cholera, chickenpox,
fever and malaria has been generally higher
in the district than the State average.
Malaria is endemic in several pockets of
the district, particularly in tribal dominated
areas of Th. Rampur, Lanjigarh, M. Rampur
and other pockets. It is a major public health
problem in Kalahandi and other parts of the
State. The State Government has planned, to
reduce mortality due to malaria by 50 percent

73
Health
by 2010, and to eliminate lymphatic filariasis
by 2015. In 42 PHCs of the district, there are 36
trained microscopists. About 19 Microscopic
Centres are working well in the district and
cater to various needs of patients. The Health
Department regularly provides need based
training to field functionaries at various levels
with a view to raise their knowledge and
skills. Awareness programmes and malaria
prevention campaigns are also organised
at village level from time to time. Table
41 analyses the epidemiological status of
malaria in the district. Deaths due to malaria
have been declining despite the fact that the
number of patients found positive has been
still increasing.
Diarrhoea and acute respiratory infections
are major killers of children aged under
five. The high incidence of dysentery and
diarrhoea in Kalahandi are largely due to
unhygienic and unhealthy living conditions
and habits of people. About 51.5 percent
children who suffered from diarrhoea and
54 percent children who suffered from
acute respiratory infections and fever were
treated in the two week period of the survey
mounted to ascertain the prevalence of
these ailments. Cholera that used to affect
large areas, many people and cause huge
mortalities in the past, has been effectively
Table 41: epidemiological Status of Malaria in Kalahandi: 2001-2005
Year Population BSC BSE +ve PF Death ABER SPR PF % API
2001 1,334,372 212,129 212,129 17,836 14,718 10 15.90 8.41 82.52 13.37
2002 1,364,134 250,617 250,617 24,666 19,313 12 18.37 9.84 78.30 18.08
2003 1,386,891 249,459 249,459 25,310 20,942 8 17.99 10.15 82.74 18.25
2004 1,409,081 252,614 252,614 27,220 23,066 2 17.93 10.78 84.74 19.32
2005 1,431,627 272,294 272,294 27,108 22,633 3 19.02 9.96 83.49 18.94
Note: BSC-Blood Sample Collected; BSE-Blood Sample Examined; + Ve – Malaria Positive; PF-Plasmodium falciparum; ABER-Annual Blood Examination Rate, SPR-Slide
Positive Rate, API-Annual Parasite Index
Source: Directorate of Health Service, Govt. of Odisha
checked owing to preventive measures
taken against the epidemic in recent times.
Typhoid also receives the attention of the
local health authorities.
The Nat ional Leprosy Eradicat ion
Programme (NLEP) is under implementation
in the district since 1982-83 and aims at
eliminating leprosy through Multi Drug
Therapy. Due to successful implementation
of this programme, the prevalence rate has
been drastically reduced to one or below
one case per 10,000 people. Bhawanipatna
and Karlamunda blocks have shown
excellent results whereas some blocks
such as Thuamul Rampur still need greater
attention. Table 42 gives the district fact
sheet on leprosy.
The prevalence of Tuberculosis (TB) in
Odisha at 418 per 100,000 persons is below
the National average of 445 per 100,000
persons. At the State level, the prevalence
of TB among men at 516 is higher than that
among women at 323. It is higher in rural
areas than in urban areas, and particularly
among people above 60 years of age.
The Revised National Tuberculosis Control
Programme (RNTCP) began in Kalahandi in
2002. It was initially started in two PHCs in

74
District Human Development Report
Table 42: Kalahandi Fact Sheet on LeprosySl. No. Indicator Indicator Value
1 Population (lakh) 14
2 Total patients registered for treatment 2,099
3 Annual total case detection rate per lakh 148
4 New smear +ve patients registered for treatment 1,136
5 Annual new SM + case detection rate per lakh (%) 94
6 New sputum + out of total new pulmonary cases (%) 72
7 New smear - ve patients registered for treatment 446
8 New EP cases registered for treatment 278
9 New EP cases out of New cases (%) 15
10 Treatment cases out of all smear + cases (%) 14
11 Paediatric cases out of all new cases (%) 3
12 Cure rate of new SM+ patients (%) 69
13 Success rate of new SM+ patients (%) 82
Source: CDMO, Kalahandi and NRHM, Kalahandi
Table 43: epidemiological Status of TB in Kalahandi: 2002-2006Year Sputum’s
Examined (No.)
Detection of NSP
(No.)
DOTS (NSP) (No.)
Cured (%)
Treatment Completion
(%)
Deaths (%)
Failures (%)
Defaulter (%)
Transfer to
Another District
2002 4,828 1,139 734 86.9 0.1 4.9 1.1 7.0 NA
2003 7,937 1,632 1,347 85.0 1.3 3.6 0.7 9.4 NA
2004 8,996 1,449 1,160 68.5 13.6 5.0 0.6 12.3 NA
2005 7,904 1,557 1,136 70.7 10.8 6.3 1.5 10.1 0.6
2006 7,268 1,425 1,117 66.4 15.1 5.9 1.3 9.4 1.9
Note: DOTS: Directly Observed Therapy, NSP: National Surveillance Programme
Source: NRHM, Kalahandi, NA- Not Available
Bhawanipatna and Kesinga. Gradually, 23
microscopic centres also started functioning.
For quality service delivery, the district
was divided into two different TB Units,
one at Bhawanipatna with 16 Designated
Microscopy Centres (DMC) and the other
at Dharamgarh with eight DMCs. Currently,
the district has four TB units at Bhawanipatna,
Dharamgarh, Jayapatna and M. Rampur.
Table 43 gives the epidemiological status of
TB in Kalahandi from 2002 to 2006. Although
case detection has substantially increased
during the reference period, successes have
been mixed. This calls for more focused
efforts to deal with TB.
4.5 Life Expectancy
Life expectancy is defined as the average
number of additional years a person could
expect to live if current mortality trends
were to continue for that person's life. Life
expectancy at birth is similarly defined as
the average number of years a newborn
infant would live if prevailing patterns of
mortality at the time of her/his birth was to
stay the same throughout her/his life. From
2001-06, the life expectancy of females and
males at birth in Odisha was 60.05 and 59.71
years respectively which is lower than the
country average of 66.91 and 63.87 years

75
Health
for females and males respectively. The life
expectancy at birth for Kalahandi district is
similar to that for Odisha. Figure 10 depicts
life expectancy at birth, as estimated on the
basis of RCH - DLHS-II data, for Odisha and
its 30 districts. The life expectancy value
of 18 districts of the State is higher than
Kalahandi and in case of 10 other districts
it is lower.
4.6 Maternal and Child Health
As a part of the overall health strategy,
the Government of India and the State
Government have been emphasising
upon improving maternal and child health
through various measures in all districts
including Kalahandi. The Reproductive Child
Health (RCH) programme aims at improving
Figure 10: Life expectancy at Birth estimates based on rCH Data
Odisha
Gajapati
Malkangiri
Balangir
Rayagada
Kendrapada
Keonjhar
Kandhamal
Jagatsinghpur
Sundergarh
Ganjam
Kalahandi
Baudh
Koraput
Jajapur
Nuapada
Anugul
Khordha
Nabrangpur
Sonepur
Mayurbhanj
Bargarh
Baleswar
Nayagarh
Bhadrak
Sambalpur
Deogarh
Jharsuguda
Dhenkanal
Cuttack
Puri
0 10 20 30 40 50 60 70 80
61
52
53
55
56
57
58
59
59
60
60
61
61
62
63
64
64
65
65
66
66
66
67
68
68
62
62
62
63
63
63
In Years
Dis
tric
ts

76
District Human Development Report
child health and reproductive health of men
and women, ensuring safe motherhood and
greater survival of new born children and
promoting family planning methods. Several
improvements have been effected for better
implementation of these programmes. The
capacities of ANMs, ASHAs and Anganwadi
Workers (AWWs) who are responsible for
implementing these programmes at village
levels have been, and are being continuously,
upgraded. Their incentives have been
linked to performance to ensure effective
implementation of the programmes. For
improving access to health facilities, an
emergency referral transport scheme,
“Janani Express” has been introduced in
selected health institutions. The focused
implementation of Janani Surakshya Yojana
(JSY) has raised general awareness of the
people and given encouraging results.
The First Referral Units (FRUs) have been
strengthened and round the clock facilities
have been made operational under NRHM.
District level Household Survey (DLHS-III)
findings indicate that 41.7 percent (DLHS-III)
pregnant mothers got registered in the first
trimester and this proportion being only
40.9 percent for rural areas. More and more
pregnant women have been availing three
ante-natal check-up facilities. Their number
has risen from 40.7 percent (DLHS-II) to
61.4 percent (DLHS-III) at district level, the
increase being from 29.7 percent (DLHS-II)
to 61.6 percent (DLHS-III) in rural areas. This
positive change may be attributed to various
promotional measures taken up by the State
Government. The number of women who
receive TT injections has increased from 85.3
percent (DLHS-II) to 96.4 percent (DLHS-III).
Even in rural areas, the growth has been
impressive from 82.8 percent (DLHS-II) to
96.1 percent (DLHS-III).
It is, however, a matter of concern that the
district as a whole has recently shown a
slight decrease in institutional deliveries,
i.e., from 30.6 percent (DLSH-II) to 27.3
percent (DLHS-III) while there is an increase
in institutional births in rural areas, i.e.,
from 19.5 percent (DLHS-II) to 24.8 percent
(DLHS-III). Moreover, attendance of health
personnel during delivery at home or in
health institutions has increased from 12.5
percent (DLHS-II) to 21 percent (DLHS-III)
at district level and 8.7 percent (DLHS-II)
to 20.8 percent (DLHS-III) in rural areas.
About 96.6 percent mothers, 96.2 percent
in rural area, have received post natal
care within 48 hours of delivery of their
last child (DLHS-III). Another matter of
concern is the inter-district disparity as
regards institutional deliveries and other
maternal and child health programmes.
More advanced coastal and other districts
have reported more than 80 percent
institutional deliveries, whereas tribal and
interior districts including Kalahandi and
other KBK districts have reported less than
30 percent institutional deliveries. There
may be several reasons for these observed
inter-district disparities. Firstly, there are
a large number of vacancies of doctors in
tribal and interior districts. Secondly, tribal
and interior districts have poor connectivity,
which limits the access of the poor people
to health institutions. Thirdly, there is still a
lack of awareness among people in remote
areas about various health programmes and
other public services.
According to the DLHS survey 2004, nearly
74 percent women accessed antenatal
check-ups (ANC) from different health
institutions (55% from Government health
facilities, 19 percent from private facilities
and 5% at home). Nearly 41 percent women
had a minimum of three ANC visits and 36
percent had their first ANC visit in the first
trimester. About 73 percent of women had
a daily dose of at least one IFA tablet and
72 percent had two or more TT injections
during ANC visits. Further, half the women
had check-ups for blood pressure, weight
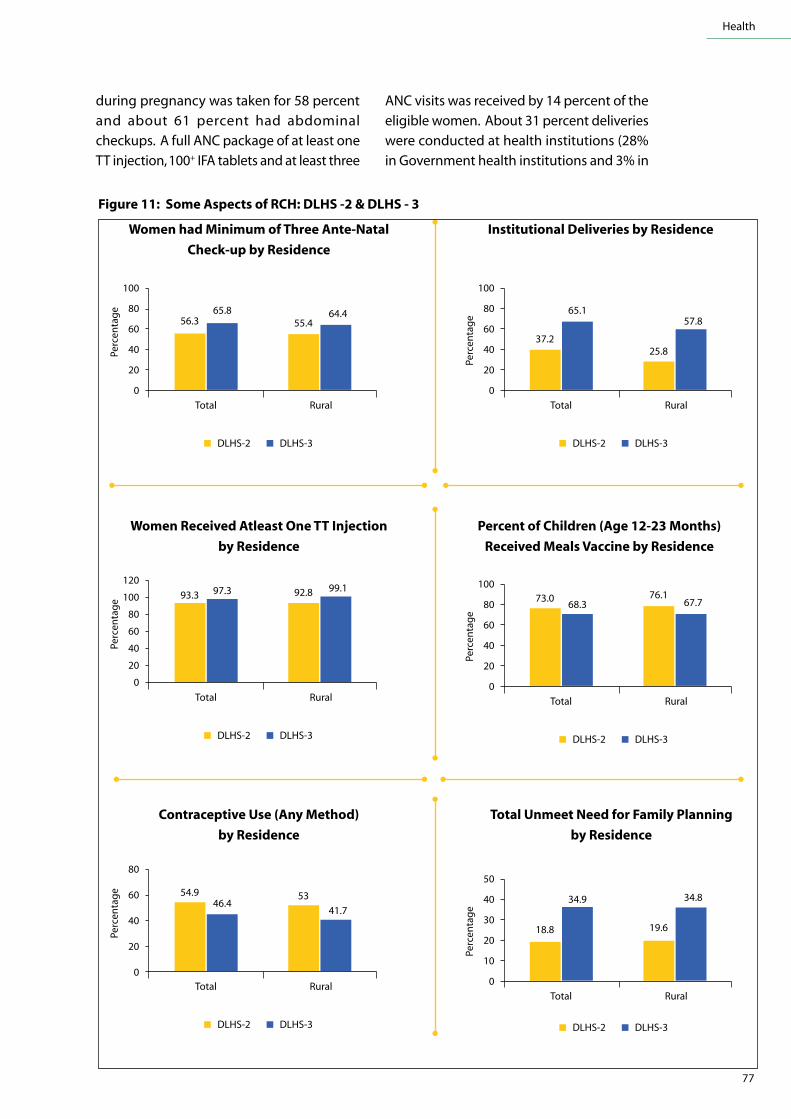
77
Health
during pregnancy was taken for 58 percent
and about 61 percent had abdominal
checkups. A full ANC package of at least one
TT injection, 100+ IFA tablets and at least three
ANC visits was received by 14 percent of the
eligible women. About 31 percent deliveries
were conducted at health institutions (28%
in Government health institutions and 3% in
100
80
60
40
20
0
Perc
enta
ge
Total Rural
56.365.8
55.464.4
DLHS-2 DLHS-3
100
80
60
40
20
0
Perc
enta
ge
Total Rural
37.2
65.1
25.8
57.8
DLHS-2 DLHS-3
120
100
80
60
40
20
0
Perc
enta
ge
Total Rural
93.3 97.3 92.8 99.1
DLHS-2 DLHS-3
100
80
60
40
20
0
Perc
enta
ge
Total Rural
73.068.3
76.167.7
DLHS-2 DLHS-3
50
40
30
20
10
0
Perc
enta
ge
Total Rural
18.8
34.9
19.6
34.8
DLHS-2 DLHS-3
80
60
40
20
0
Perc
enta
ge
Total Rural
54.946.4
53
41.7
DLHS-2 DLHS-3
Women had Minimum of Three Ante-Natal
Check-up by Residence
Women Received Atleast One TT Injection
by Residence
Contraceptive Use (Any Method)
by Residence
Total Unmeet Need for Family Planning
by Residence
Percent of Children (Age 12-23 Months)
Received Meals Vaccine by Residence
Institutional Deliveries by Residence
Figure 11: Some Aspects of rCH: DLHS -2 & DLHS - 3

78
District Human Development Report
private health institutions). Trained health
personnel conducted 69 percent of the home
deliveries. On the whole in this district, 42
percent were safe deliveries. Pregnancy
related complications were experienced
by 47 percent of the women of which 36
percent had complications during delivery
and 50 percent had at least one post delivery
complication.
Comparison of findings of DLHS II and DLHS
III indicates that in some cases, there has
been significant improvement in maternal
and child health care, while in some other
cases the trend is not so encouraging. A
comparison of DLHS II and DLHS III is
presented in Figure 11 and Table 44.
With a view to address the issues of
inter-district disparities in institutional
deliveries and maternal and child health
programmes, the State has launched a new
initiative, called “Matru Smruti Yojana” in
seven tribal districts including Kalahandi,
Koraput, Rayagada, Nawarangpur, Malkangiri,
Nuapada and Gajapati, where institutional
deliveries are less than 40 percent. The
objective of this scheme is to promote safe
institutional deliveries and to encourage
families to access public health facilities
available for this purpose. The scheme also
provides support for the up-keep of a child
in case its mother dies during delivery or
soon thereafter. It offers a National Saving
Certificate or Kisan Vikas Patra of Rs. 4,000 in
the name of the child, which is handed over
to the father or the legal guardian.
4.7 Immunisation Services
The National Rural Health Mission aims at
achieving full immunisation coverage of
children against six vaccine-preventable
diseases including poliomyelitis, diphtheria,
pertussis, tetanus, tuberculosis and measles,
and pregnant women against tetanus.
These are major preventable causes of
Table 44: Comparison of DLHS II and DLHS III on Maternal and Child HealthMaternal & Child Health Components DLHS III DLHS II
Total Rural Total Rural
Marriage and Fertility, (Jan 2004 to 2007-08)
Percentage of girl's marrying before completing 18 years 29.90 30.80 25.90 36.80
Percentage of Births of Order 3 and above 41.80 41.80 48.50 49.60
Sex Ratio at birth 115 114 NA NA
Percentage of women age 20-24 reporting birth of order 2 & above. 51.70 50.30 NA NA
Percentage of births to women during age 15-19 out of total births 4.20 4.60 NA NA
Maternal Health:
Mothers registered in the first trimester when they were pregnant with last live birth/still birth (%)
41.70 40.90 NA NA
Mothers who had at least 3 Ante-Natal Care visits during the last pregnancy (%)
61.40 61.60 40.70 29.70
Mothers who got at least one TT injection when they were pregnant with their last live birth / still birth (%) #
96.40 96.10 85.30 82.80
Institutional births (%) 27.30 24.80 30.60 19.50
Delivery at home & other places assisted by a doctor/nurse /LHV/ANM (%)
21.00 20.80 12.50 8.70
Mothers who received post natal care within 48 hours of delivery of their last child (%)
96.60 96.20 NA NA
Source: DLHS II and DLHS III Report, NA- Not Available
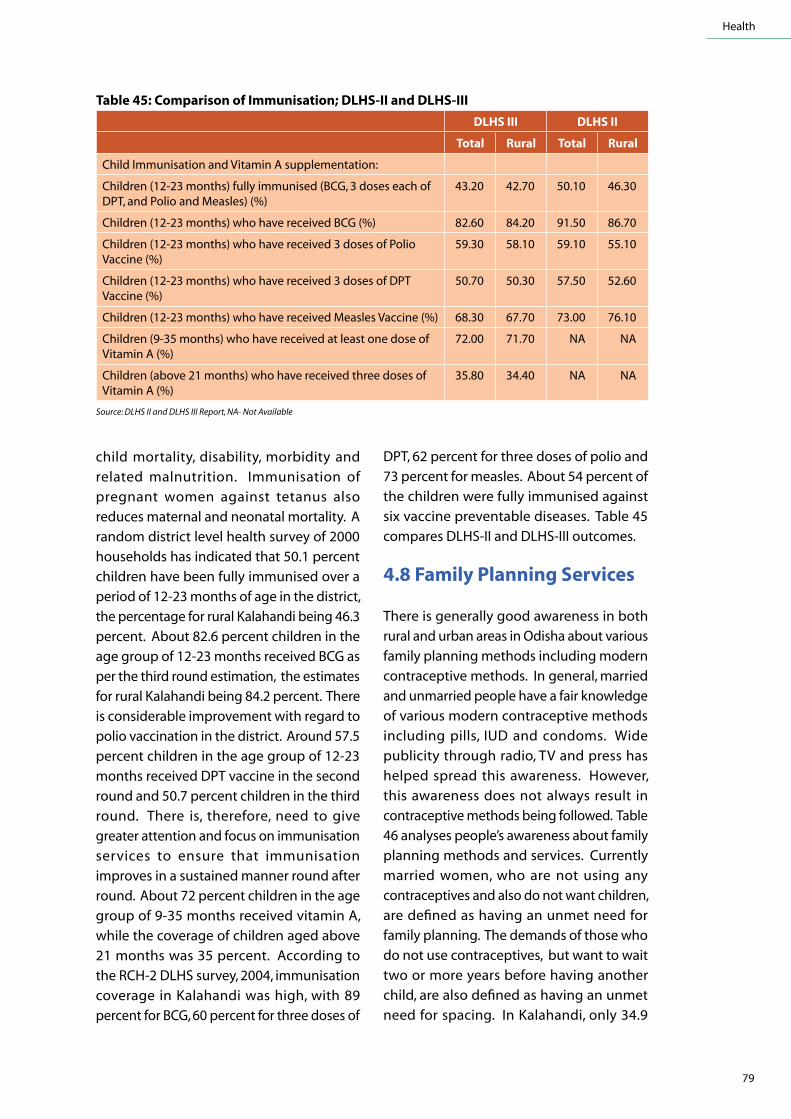
79
Health
child mortality, disability, morbidity and
related malnutrition. Immunisation of
pregnant women against tetanus also
reduces maternal and neonatal mortality. A
random district level health survey of 2000
households has indicated that 50.1 percent
children have been fully immunised over a
period of 12-23 months of age in the district,
the percentage for rural Kalahandi being 46.3
percent. About 82.6 percent children in the
age group of 12-23 months received BCG as
per the third round estimation, the estimates
for rural Kalahandi being 84.2 percent. There
is considerable improvement with regard to
polio vaccination in the district. Around 57.5
percent children in the age group of 12-23
months received DPT vaccine in the second
round and 50.7 percent children in the third
round. There is, therefore, need to give
greater attention and focus on immunisation
services to ensure that immunisation
improves in a sustained manner round after
round. About 72 percent children in the age
group of 9-35 months received vitamin A,
while the coverage of children aged above
21 months was 35 percent. According to
the RCH-2 DLHS survey, 2004, immunisation
coverage in Kalahandi was high, with 89
percent for BCG, 60 percent for three doses of
DPT, 62 percent for three doses of polio and
73 percent for measles. About 54 percent of
the children were fully immunised against
six vaccine preventable diseases. Table 45
compares DLHS-II and DLHS-III outcomes.
4.8 Family Planning Services
There is generally good awareness in both
rural and urban areas in Odisha about various
family planning methods including modern
contraceptive methods. In general, married
and unmarried people have a fair knowledge
of various modern contraceptive methods
including pills, IUD and condoms. Wide
publicity through radio, TV and press has
helped spread this awareness. However,
this awareness does not always result in
contraceptive methods being followed. Table
46 analyses people’s awareness about family
planning methods and services. Currently
married women, who are not using any
contraceptives and also do not want children,
are defined as having an unmet need for
family planning. The demands of those who
do not use contraceptives, but want to wait
two or more years before having another
child, are also defined as having an unmet
need for spacing. In Kalahandi, only 34.9
Table 45: Comparison of Immunisation; DLHS-II and DLHS-IIIDLHS III DLHS II
Total Rural Total Rural
Child Immunisation and Vitamin A supplementation:
Children (12-23 months) fully immunised (BCG, 3 doses each of DPT, and Polio and Measles) (%)
43.20 42.70 50.10 46.30
Children (12-23 months) who have received BCG (%) 82.60 84.20 91.50 86.70
Children (12-23 months) who have received 3 doses of Polio Vaccine (%)
59.30 58.10 59.10 55.10
Children (12-23 months) who have received 3 doses of DPT Vaccine (%)
50.70 50.30 57.50 52.60
Children (12-23 months) who have received Measles Vaccine (%) 68.30 67.70 73.00 76.10
Children (9-35 months) who have received at least one dose of Vitamin A (%)
72.00 71.70 NA NA
Children (above 21 months) who have received three doses of Vitamin A (%)
35.80 34.40 NA NA
Source: DLHS II and DLHS III Report, NA- Not Available

80
District Human Development Report
percent use family planning methods to fulfill
their unmet needs. This includes 14.2 percent
for spacing and 20.7 percent for limiting the
family size. Both in rural and urban areas,
newly married couples have greater demand
for limiting the family size than for spacing
for children. The ST communities generally
have higher unmet needs to the extent of 17.8
percent as against their demand for family
planning (52.9%). The case for other low
and middle income groups who have higher
unmet needs for family planning is 17 percent.
The Contraceptive Prevalence Rate (CPR)
is defined as the percentage of currently
married women of the age group of 15-49
year, who are currently using a contraceptive
method or whose husbands are using a
contraceptive method. This is one of the
principal determinants of fertility. The current
use of modern contraceptive methods by
residence indicates that 59.4 percent of the
married people in the age group of 15-49
year use modern methods of contraceptives
in urban areas. In rural areas, the current use
of contraceptives stands at 43.6 percent. The
Table 46: Awareness about Contraceptive Methods in Kalahandi and Odisha Women and Men by Categories
Total Rural Urban
Modern Method
Mean Number of Methods - Known to Persons in 15-49 Year
Age
Modern Method
Mean Number of Methods - Known to Persons in 15-
49 Year Age
Modern Method
Mean Number of Methods - Known to Persons in
15-49 Year Age
All Women 98.40 4.90 98.10 4.70 99.60 6.10
Currently Married Women
99.50 5.30 99.40 5.00 99.90 6.70
Never Married Women
94.70 3.80 93.70 3.60 98.70 4.80
All Men 99.10 5.60 99.00 5.30 99.80 6.40
Currently Married Men
99.50 6.00 99.50 5.80 99.60 7.10
Never Married Men
98.40 4.80 97.80 4.50 100.00 5.60
Source: NRHM, Kalahandi
female sterilisation method is widely adopted
in a large number of cases irrespective of
their various attributes including caste
groups, residence, education and wealth
quintiles. The female sterilisation method,
adopted by ST groups, is the lowest at 23.3
percent. The male sterilisation method is
one of the most unpopular methods. The
use of pills by married women aged between
15-49 years is the second most popular
method of contraceptives in Odisha. An
inter-district analysis of the use of modern
contraceptives indicates that there are only
three districts including Kalahandi where the
use of modern contraceptives is lower than
30 percent. Table 46 provides some statistics
on awareness of contraceptive methods in
urban and rural parts of Kalahalndi district.
Table 47 compares the progress of family
planning efforts and Reproductive Health
(RH) Services in Kalahandi with respect to
selected indicators including ante-natal care,
immunisation and institutional deliveries
in 2005 and 2006. Despite several gaps in
provisioning of, and achievements about,
various health services including selected

81
Health
reproductive health services in Kalahandi,
the conditions in the district are slowly
improving. For example, the status of
antenatal care improved from 31 percent in
2005 to 46 percent in 2006 and institutional
deliveries improved from 11.5 percent in
2005 to 18.6 percent in 2006. Family planning
services improved from 24.5 percent in 2005
to 41 percent in 2006. Similarly, the status of
immunisation improved from 56.5 percent
to 71 percent from 2005 to 2006.
According to the (RCH-DLHS-II, 2004)
knowledge of family planning is universal in
Kalahandi. About 26 percent of husbands
have knowledge of no-scalpel vasectomy.
The Contraceptive Prevalence Rate (CPR)
in this district is estimated to be 44 percent
with 34 percent CPR due to modern methods
and 11 percent due to traditional methods.
Table 47: Performance of Selective reproductive Health services in Kalahandi: 2005-2006Reproductive Health Services Performance – 2005 Performance- 2006
Anti-Natal Check ups 31.0% 46.0%
Institutional delivery 11.5% 18.6%
Family Planning Services 24.5% 41.0%
Immunisation 56.5% 71.0%
Source: NRHM, Kalahandi
Among the methods adopted, female
sterilisation predominates in the district
as men fear that they will not be able to
work after sterilisation. About 15 percent of
the women had an unmet need for family
planning, of which 13 percent was for
limiting and the remaining two percent for
spacing births. However, DLHS-III observed
that there has been a decline in the use of
family planning methods, irrespective of
its nature, i.e., from 44.4 percent during
DLHS-II to 28.9 percent during DLHS-III.
While female sterilisation has decreased
from 25.7 percent (DLHS-II) to 19.8 percent
(DLHS-III), male sterilisation has changed
very insignificantly from 0.0 (DLHS-II) to 0.2
(DLHS III). A comparative analysis of DLHS-II
and DLHS-III is presented below. Table 48
compares some outcomes of DLHS-III with
DLHS-II.
Table 48: Comparison of DLHS II and DLHS III of Kalahandi on Family PlanningFamily planning (currently married women, age 15-49) DLHS III DLHS II
Total Rural Total Rural
Current Use :
Any Method (%) 28.90 28.60 44.40 34.80
Any Modern method (%) 27.80 27.70 33.90 25.30
Female Sterilization (%) 19.80 19.50 25.70 21.60
Male Sterilization (%) 0.20 0.30 0.00 0.00
IUD (%) 0.40 0.40 0.40 0.00
Pill (%) 6.80 6.80 5.40 3.50
Condom (%) 0.60 0.60 2.40 0.30
Unmet Need for Family Planning:
Total unmet need (%) 34.90 34.80 18.80 19.60
For spacing (%) 14.20 14.30 5.60 5.80
For limiting (%) 20.70 20.50 13.20 13.80
Source: Report of DLHS II and DLHS III

82
District Human Development Report
4.9 Public Private Partnership in Health Sector
Odisha has taken pioneering steps to
involve the voluntary sector in health service
delivery. The State has involved 143 NGOs
with a view to providing RCH service delivery
in the underserved sub-centres identified by
the State Government. Their main role is to
address the gaps in the RCH service delivery
and to enable such districts and blocks to
achieve RCH goals.
4.10 Sexual and Reproductive Health of Adolescents
Early marriages in the district have reduced
to some extent because of awareness
generated through various public health
services. There is also a felt need to create
awareness among adolescents as regards
anaemia, adverse consequences of
teen-age pregnancies, unsafe abortions
and unsafe sex, knowledge about sexually
transmitted infections (STIs), reproductive
tract infections (RTIs), HIV/AIDS and an
appropriate health seeking behaviour. To
achieve these objectives and to empower
adolescent girls in particular, the State
has implemented a new scheme, the
“Kishori Shakti Yojana” that is implemented
through the ICDS programme. Girls in the
age group of 11-18 year are organised
into appropriate groups, called Balika
Mandals. They undertake a number of
learning activities at Anganwadi centres
through role plays and other methods.
They are given Iron and Folic Acid (IFA)
supplementation along with de-worming
interventions and appropriate health
education. The State Department of School
& Mass Education and National AIDS
Control Organisation (NACO) have jointly
undertaken the Adolescent Education
Programme (AEP) in high schools and
junior colleges of the district. Under NACP-III,
AEP Peer Educator Clubs and Red Ribbon
Clubs have been formed in high schools
to provide youth oriented counselling,
life skill education, recreation and health
related programmes.
4.11 Births, Deaths and Other Key Health Indicators
An analysis of data available from district
level indicates that the Infant Mortality Rate
(IMR) in Kalahandi has reduced from 76 in
2001 to 63 in 2007-08 whereas the State IMR
has reduced from 83 in 2003 to 71 in 2007-
08. The crude death rate of 9.2 in Odisha
in 2007 was much higher than the all India
average of 7.4. The death rate for rural Odisha
at 9.5 was still higher in 2007. However, the
death rate for urban Odisha was only 7.0 in
2007. About 64 percent infant deaths are
attributed to neonatal mortality. Premature
deliveries result in 38.5 percent infant deaths.
Very high IMR may be attributed to mainly
three factors: poor availability of professional
attendance during birth, high percentage
of low birth weight babies and lack of
professional pre-natal and post- natal care.
There are, however, wide variations in IMR
and under five mortality rates for different
social classes in the district. For example,
the under five mortality for ST groups was
reported to be very high at 136.3 per 1000
live births as compared to 91.8 among SCs,
83.5 among OBCs and 64.2 among other
castes in 2007. Evidence also suggests that
economic conditions and education status
affect infant and child mortality. The poor
and uneducated households generally
report higher infant and child mortality rates
than economically better off and educated
households. There is, however, general

83
Health
unanimity that MMR in the district is high.
Three factors that contribute to this are high
vulnerable mass having poor accessibility
to institutional health care, low institutional
deliveries, and low intake of prescribed
vitamins / iron and nutritional diets during
pregnancy coupled with inadequate number
of check-ups.
With a view of generating reliable estimates
for various health indicators that impact
reproductive and child health (RCH), a
District Level Health Survey (DLHS) was
mounted by the Government of India in
2004. As per the estimates available from
DLHS 2004, the crude birth rate, crude death
rate and total fertility in Kalahandi have been
reported as at 21.7, 9.7 and 2.6 respectively.
4.12 Drinking Water and Sanitation
The State Rural Development Department is
responsible for implementing programmes
for safe water supply sources and sanitation.
As per the available information, the district
has 12,130 running tube wells in 13 blocks
and 273 GPs, i.e., on an average, 933 tube
wells per block and 44 tube wells per GP.
On an average, one tube well caters to the
needs of 102 people and 20 families. The
district also has 506 working sanitary wells
and 63 rural piped water supply schemes.
An additional 94 rural piped water supply
schemes are under implementation. Twenty
two schools and 247 AWCs also have safe
sources of drinking water.
4.12.1 Drinking Water Facilities in rural Plain AreasThe majority of rural habitations in the
plains of Kalahandi have safe sources of
drinking water within 0.5 km though there
are variations across blocks. In general,
M. Rampur, Kalampur and Jayapatna blocks
have very high coverage (80% or more).
Some other blocks such as Th. Rampur
and Lanjigarh have low coverage of 10
Source: BPL Census, 2002
Figure 12: Availability of Safe Drinking Water Facilities: Plain Areas
No Source of Drinking Water within 1.6 Km
Source of Drinking Water at distance 1.00-1.59 km
Source of Drinking Water at distance 0.50-0.99 km
Source of Drinking Water at distance less than 0.5 km
No Source of Drinking Water within house
90.00
80.00
70.00
60.00
50.00
40.00
30.00
20.00
10.00
0.00
Bh
awan
ipat
na
Dh
aram
gar
h
Go
lam
un
da
Jaya
pat
na
Jun
agar
h
Kal
amp
ur
Kar
lam
un
da
Kes
ing
a
Ko
ksar
a
Lan
jigar
h
M. R
amp
ur
Nar
la
Th. R
amp
ur
Blocks
Perc
enta
ge
10.4
3
69.6
1
69.9
6
60.1
1
81.7
7
41.2
3
82.9
1
80.4
9
69.7
3
78.9
8
8.07
83.0
5
68.5
6
4.26
11.8
6
15.9
1
18.4
9
10.3
7
38.8
4
12.7
1
11.4
9
20.8
2
13.0
8
23.2
4
9.88
17.7
1
27.6
6
1.36
1.30
1.07 3.
12
1.78
1.83
1.04 2.09
2.14
12.7
0
2.67 3.42 6.
38
8.29
17.0
5
3.23
12.6
7
1.53
2.75
4.26
4.45
27.5
6
1.92
6.52
29.7
96.75
4.55
3.28
1.50
5.48
1.02 3.
79
3.09
1.34
28.4
3
2.47 3.
78
31.9
1

84
District Human Development Report
percent households with a safe drinking
water source within 0.5 km and 30 percent
households within one to 1.59 km distance.
The main reason for poor coverage of these
blocks is that they have hilly terrain, rocky
topography and are difficult to approach.
Installation of tube wells in these regions
is difficult and often not feasible. In many
pockets, people still depend upon streams
or stagnated pond water which normally
remains contaminated. Figure 12 gives
inter-block comparison of availability of safe
drinking water facilities in plain areas.
4.12.2 Drinking Water Facilities for rural Hilly AreasDrinking water is available in 42 percent
rural households in Golmunda block. This
is highest among all blocks of Kalahandi,
which have a hilly terrain. Variations exist
across blocks. For example, in the hilly areas
of Dharamgarh block, only 0.14 percent
households have access to safe drinking
water. About 55 percent rural households
in Narla block do not have a drinking water
source within an elevation of 100 meters. In
Kalampur block, about 90 percent of the rural
households have a drinking water source
within an elevation of less than 50 meters. On
an average, 35.65 percent rural households
in Kalahandi have drinking water within an
elevation of less than 50 meters and 34.29
percent have a drinking water source within
an elevation of 50-100 meters. About 12.52
percent additional HH have drinking water
sources within their premises and 17.54
percent have drinking water sources within
an elevation of 100 meters. Availability of
water sources at household level is not so
extensive especially in rural areas. Families
that have such sources of safe drinking
water within their boundary are normally
treated as “well off”. As per a study, it has
been observed that only 3.3 percent families
have in-house safe drinking water facilities.
Of these families, 30.43 percent have pucca
houses and another 40.58 percent have
mixed houses. Figure 13 graphs different
Figure 13: Availability of Safe Drinking Water Facilities: Hill Areas
100.00
90.00
80.00
70.00
60.00
50.00
40.00
30.00
20.00
10.00
0.00
Bh
awan
ipat
ma
Dh
aram
gar
h
Go
lam
un
da
Jaya
pat
na
Jun
agar
h
Kal
amp
ur
Kar
lam
un
da
Kes
ign
a
Ko
kasa
ra
Lan
jigar
h
M. R
amp
ur
Nar
la
Th. R
amp
ur
No Source of Drinking Water within elevation of 100 meter
Drinking Water within elevation of 50-100 meter
Drinking Water within elevation of less than 50 meter
Drinking Water within house
Blocks
Perc
enta
ge
Source: BPL Census, 2002
9.95
61.7
426
.03
2.28
14.7
60.
14
15.1
8
52.4
921
.77
16.7
412
.48
88.7
5
31.7
531
.25
8.24
12.9
4 18.7
13.
53
58.7
4
36.4
60.
58
32.4
6
63.6
671.5
9
33.9
3
41.9
6
9.58
39.8
5
67.0
6
12.5
0
58.9
4
5.18
29.1
6
45.4
2
8.67
30.0
2
13.5
1
8.93
16.1
7
30.8
9
7.50
1.25 2.50
25.0
0
11.7
6 18.8
2
6.92
17.5
5
55.3
6
5.70
3.51
0.62

85
Health
households of various blocks with regard to
availability of safe drinking water.
While access to drinking water has improved
over the years, proper use and maintenance
of water systems, acceptable standards of
water quality and sustainability of sources are
urgent priorities. Water quality problems due
to faecal and bacteriological contamination
have not been rigorously addressed. Our
study suggests that only 5.7 percent families
have sanitary toilets while bathroom facilities
are available with only 3.7 percent families.
Many families who have toilet facilities
usually depend upon external sources of
water for various uses.
Consumption of safe drinking water, proper
sanitation and adoption of correct hygiene
practices have a significant impact on the
health of the people. Diarrhoea, which is one
of the five diseases with a very high patient
load and a major cause for high infant and
child mortality, is caused mainly because
of consumption of contaminated water. It
was in this context that the Government
launched the Central Rural Sanitation
Programme (CRSP) in 1986 primarily with
an objective of improving rural hygiene
and sanitation. Though there is some
improvement in situation, less than 25
percent rural households have toilets.
4.13 Hygiene and Sanitation Status of Rural Households
The Total Sanitation Campaign (TSC) in the
district has been introduced in 2002-03.
However, the progress of this programme has
not been very satisfactory. People continue to
have a poor sense of hygiene and sanitation.
Around 95.24 percent families resort to
open defecation due to various factors
including lack of household or community
Table 49: General Hygiene Status of Households by BlocksBlocks General Hygiene Status, and Sanitation Facilities, at HH Level Total
OpenDefecation
Group Latrines With
Irregular Water Supply
Group Latrines
With Regular Water
Supply
Clean Group Latrines With Regular Water
Supply and Regular Sweeper
PrivateLatrines
Bhawanipatna 97.50 0.61 0.15 0.05 1.60 100.00
Dharamgarh 96.57 0.99 0.44 0.04 1.88 100.00
Golamunda 97.32 0.82 0.13 0.13 1.38 100.00
Jayapatna 93.79 1.17 0.75 1.52 2.73 100.00
Junagarh 95.61 1.14 0.39 0.11 2.30 100.00
Kalampur 94.04 0.79 0.30 0.17 4.68 100.00
Karlamunda 96.71 0.93 0.16 0.06 2.12 100.00
Kesinga 97.32 0.40 0.13 0.17 1.96 100.00
Koksara 96.40 1.54 0.33 0.05 1.64 100.00
Lanjigarh 75.11 0.33 0.13 0.09 0.74 100.00
M. Rampur 96.02 0.45 0.08 0.02 3.41 100.00
Narla 97.42 0.70 0.16 0.03 1.60 100.00
Th. Rampur 99.24 0.13 0.10 0.01 0.15 100.00
Kalahandi 95.24 0.81 0.27 0.20 1.94 100.00
Source: BPL Census, 2002

86
District Human Development Report
toilet facilities and low priority accorded by
household to hygiene and sanitation. Only
0.81 percent family use group latrines where
regular piped water supply facilities are not
available. About 0.27 percent families use
group latrines which are equipped with
regular piped water supply. Private latrines
exist in only 1.94 percent households in
the district. Table 49 summarises the
block-wise status of implementation of TSC
and general behaviour of households with
regard to hygiene and sanitation attributes.
Open defecation is a very common practice
among all social groups and in all blocks.
T. Rampur block has reported that 99.24
percent families resort to open defecation.
Table 49 analyses the general hygiene
status of households by blocks.
The State Rural Development Department
has made efforts to popularise installation
of latrines at household level. In addition,
toilet facilities are also created at schools
and Anganwadi centres. Table 50 provides
Table 50: Installation of Latrines in HH and Public institutionsBlocks Target Achievement during
the month of June 2008
No. of Units of school
Toilet sanctioned
Achievements No. of Units
of AWC Toilet
sanction
Achievements
BPL APL Total BPL APL Total
Bhawanipatna 20,011 15,929 35,940 3,117 227 3,344 242 54 52 26
Kesinga 12,343 12,587 24,930 3,734 467 4,201 187 42 52 16
Narla 18,242 7,814 26,211 1,823 221 2,044 189 28 46 14
M.Rampur 13,150 4,358 17,508 2,183 249 2,432 202 38 54 12
Karlamunda 6,762 5,557 12,319 2,855 653 3,508 144 31 53 16
Lanjigarh 14,652 3,611 18,263 2,143 247 2,390 185 23 92 13
Th.Rampur 15,226 1,928 17,154 1,320 138 1,458 214 27 80 12
Dharamgarh 19,063 10,604 29,833 2,136 288 2,424 224 31 58 16
Junagarh 20,484 12,887 33,371 1,350 209 1,559 184 39 32 14
Jaipatna 13,785 12,840 26,625 1,543 240 1,783 126 26 40 18
Koksara 16,913 8,485 25,398 3,293 421 3,714 180 46 36 16
Kalampur 4,853 7,759 12,612 1,892 540 2,432 127 28 41 22
Golamunda 17,570 10,422 27,992 2,988 392 3,380 126 49 40 18
District Total 193,054 114,781 308,156 30,377 4,292 34,669 2,330 462 676 213
Source: BPL Census, 2002
a status of installation of latrines at
household level and in public institutions
such as schools and Anganwadis in
different blocks.
Up to the end of 2007-08, 34,669 households
have installed latrines with or without
Government support. This includes 30,377
BPL households and 4,292 APL households.
Toilet facilities have also been created in 462
schools and 213 Anganwadi centres. The
coverage of individual household latrines
is only 15.78 percent of the target for BPL
households. The coverage of schools and
Anganwadis for establishment of toilets
was 19.83 percent and 31.51 percent of
the target that was fixed for institutions
category-wise.
This chapter has taken stock of the health
infrastructure in Kalahandi, where the
number of health institutions increased
from five dispensaries in 1907-08 to 72
health institutions in 2007-08. The current

87
Health
health institutions include two hospitals,
one newly coming up Medical College and
Hospital, seven dispensaries, six community
health centres, 42 primary health centres, 18
homeopathic and 20 ayurvedic dispensaries,
426 beds, 14 mobile health units and 242
sub-centres. There are 198 doctors including
homeopathic and ayush doctors, 105 nurses
and helpers, 275 ANMs and 1,383 ASHAs.
They treat about 15-17 lakh patients a year.
Six major diseases, malaria, diarrhoea, acute
respiratory infection, leprosy and scabies
and tuberculosis account for more than
70 percent patient load. The district has,
however, made good progress in respect of
leprosy, malaria control and in reduction of
IMR and MMR that are still very high. One of
the main constraints is shortage of doctors
and large numbers of vacancies of doctors in
the district. It is estimated that at any time,
the number of vacancies of doctors may vary
from 20 percent to 30 percent . The State has
promoted a number of health programmes
and institutional reforms in Kalahandi and
other districts. These interventions include
implementation of NRHM, creation of Zilla
Swasthiya Samitis and Rogi Kalyan Samitis,
implementation of Janani Surakshya Scheme
and Matru Smruti Scheme. Immunisation
services, family planning services and
sexual and reproductive health services
including Kishori Shakti Yojana, RTI/STI
and administration of Iron and Folic Acid
(IFA) to young girls have been undertaken
in different blocks and urban bodies
through existing health institutions. The
introduction of mobile health units (MHU)
is an innovative intervention in the face of
serious shortage of doctors and to extend
health services in an outreach mode
to rural people of remote areas. A MHU
follows a prescribed route that is well
advertised and sent to concerned GPs in
advance. It remains operative for 24 days
in a month, covers about 500 villages and
treats 16,000 -20,000 patients in a year.
The extent of institutional deliveries and
immunisations is improving, but there is a
need to substantially increase them. It is
expected that recently engaged ASHAs may
bring substantial improvement in this regard.
The coverage of various habitations under
the safe drinking water scheme has been
gradually improving. However, hygiene and
sanitation habits of local people are still
poor and substantial efforts are needed to
popularize total sanitation campaign and
improve general hygiene and sanitation
in different parts of the district. There is a
need to educate people and enhance their
awareness. The next chapter, therefore,
studies the status of education in the district.
The basic health indicators are the reflection
of the progress the district has made in
order to ensure better health care for the
people in order to achieve the Millennium
Development Goal (Goal 4, 5 & 6). The infant
mortality, which was 76 during 2001, has
come down to 59 during 2011 (AHS-2011).
The neonatal mortality rate has reduced to
32 and post neonatal mortality remains at
27 (AHS-2011). The district has been taking
several steps to reduce under five mortality
rate from the present level of 77 (AHS-2011)
through effective implementation of existing
Government schemes. Apart from reduction
in IMR, the Maternal Mortality Ratio of
the district has above the State average.
Further, so as to minimise the maternal
and child mortality rate, special care has
been taken to improve the immunisation
coverage. The number of women who
receive TT injections has increased from 85.3
percent (DLHS-II) to 96.4 percent (DLHS-III).
Even in rural areas, the growth has been
substantial, i.e., from 82.8 percent (DLHS-II)
to 96.1 percent (DLHS-III). Ante-natal care
(at least 3 check-ups) coverage also shows
a remarkable improvement from 40.7
percent (DLHS-II) to 61.4 percent (DLHS-

88
District Human Development Report
III) with a higher increment in rural area
from 29.7 percent (DLHS-II) to 61.6 percent
(DLHS-III). Institutional birth also has gone
up in rural area from 19.5 percent (DLHS-
II) to 24.8 percent (DLHS-III) where assisted
(assisted by trained person) home delivery
also recorded a growth from 12.5 percent
(DLHS-II) to 21 percent (DLHS-III). Post-natal
care coverage of women within 48 hours
of delivery also shows an increasing trend.
Death due to malaria has also reduced due
to vector borne disease control programme,
community level sanitary measures and in-
time identification and treatment. Special
measures have been taken for collection
and examination of blood for which Annual
Blood Examination Rate (ABER) has gone up
from 15.9 during 2001 to 19.02 during 2005
with increased blood sample collection.
So, in view of the aforementioned health
indicators, it is noteworthy that sincere
efforts have been made to provide better
health care services to the people through an
institutional framework to achieve the MDGs.
- • -

Education
Chapter 5
“If you educate a man, you educate a person; But if you educate a woman you educate a family”.
- Unknown


91
Education
Education is an indicator of human as well
as socio-economic development. Education
is also an instrument of development in the
sense that the spread of quality education
helps accumulate human capital; raises labour
productivity; and is an important determinant
of economic growth and socio-economic
development15. The UN Millennium Summit
2000, therefore, accorded a very high priority,
and devoted the 2nd Millennium Development
Goal (MDG), to education. The 2nd MDG seeks
to achieve universal primary education.
The quantifiable targets and monitorable
indicators that have been prescribed to track
the progress of the 2nd MDG are summarised
as follows:
This chapter analyses the growth, and current
status of education in Kalahandi district. The
chapter is organised as follows. The following
two sections trace the early beginnings of
modern education in this district and provide
an account of main programmes that have
been launched to popularise and promote
education. The next section analyses the
growth in literacy rates both for male and
female in the district from 1951 to 2001. This
section also studies the changes in literacy
levels among ST and SC communities from
1961 to 2001. The subsequent sections
examine the school infrastructure and
enrolment status at different levels and
for var ious social groups over t ime.
15 See also Odisha Human Development Report 2004

92
District Human Development Report
The last section lists major educational
concerns in the district.
5.1 Early Beginnings of Modern Education in Kalahandi
The traditional mode of imparting education,
through village schools called Chatasalis
under the indigenous system, in the district
was age old. The traditional schools were
supervised and managed by village headmen
and focused mainly on three skills of reading,
writing and simple arithmetic. Modern
education in the district, however, began in
the year 1860, when four primary schools were
started by the former rulers of the ex-State of
Kalahandi. The number of primary schools
in Kalahandi rose to 15 by the end of 1881.
One Middle English School was established
at Bhawanipatna in 1871. In 1907, there were
58 schools including 10 private schools. The
number of pupils on the rolls during the year
was 4,860 of which 393 were girls and the
ex-State spent about Rs.10,000 a year on
education. The ex-State enjoyed the services
of the Agency Inspector of Schools.
There was gradual improvement in the spread
of education in the district. By 1914-15, the
total number of schools rose to 74, which
included one Middle English school, 20 Upper
Primary Boys’ Schools, one Upper Primary Girls’
School, 47 Lower Primary Boys’ Schools, three
Lower Primary Girls’ Schools, one Teacher
Training school and one Sanskrit Tol. Out of
total number of 74 schools, 49 schools were
maintained by the ex-State, 22 schools by the
Zamindaris, and two elementary schools or
pathasalas received grants -in-aid from the
ex-State. The Sanskrit Tol was maintained
entirely by private subscriptions. The total
number of pupils in rolls during the year was
7,598 including 1,185 girls. On an average,
there was one school for every 29 villages
and the percentage of male pupils to the
population of school-going age was about
20.5 percent. Total expenditure on education
during the year 1914-15 was about Rs.15,137.
By 1922-23, the number of schools increased
to 82 and the number of pupils increased to
8,350 of whom 7,163 were boys and 1,187
girls. Total amount spent on education in
1929-30 was around Rs 40,768. In 1935-36
the number of pupils increased to 8,481 of
whom 7,240 were boys and 1,241 girls. The
spending on education during the year was
Rs.38,132 including Rs.31,598 spent by the
ex-State and the rest by its Zamindaris, which
maintained the schools in their jurisdictions.
One English High School was also started
at Khariar by 1944. Despite the efforts by
the ex-State, Kalahandi, for promotion of
education, literacy in the district remained
very low. As per 1951 census, when the
ex-princely State of Kalahandi was already
merged with Odisha, the literacy rate was
very low at 6.3 percent with overall male
literacy of 11.1 percent and female literacy
of merely 1.6 percent.
5.2 Efforts to Accelerate Development of Education
After independence, both Government of
India and States have made continuous
efforts to popularise education and improve
literacy levels. The National Education
Policies were enunciated in 1968, 1986 and
1992. The 42nd amendment of Constitution
of India brought education to the concurrent
list and 93rd amendment made education a
fundamental right. Following the mandate of
the 93rd amendment, the Central Government
has already enacted a law on education as a
fundamental right. The Third Five Year Plan
introduced free and compulsory primary
education. The subsequent Five Year Plans
have continued to stress on promoting
and popularising education and liberally
supporting a number of programmes
including Sarva Shiksha Abhiyan (SSA),
National Programme for Education of Girls at

93
Education
Elementary Level (NPEGEL), District Primary
Education Programme (DPEP), Kasturba
Gandhi Balika Vidyalaya (KGBV) that have
aimed at improving literacy.
In line with the National approach to
popularise and promote education, Odisha
formulated its strategies for: (i) universalising
elementary education by 2007 and eight years
elementary education by 2010, (ii) achieving
universal literacy – literacy of at least 88
percent by 2011 and total literacy by 2015,
(iii) improving functional skill development in
adult education, and (iv) developing language
to foster unity and integrity of the country.
The Das Committee also laid emphasis
on: (i) universal access and enrolment, (ii)
universal retention of children up to 14 years
of age, and (iii) substantial improvement in
the quality of education to enable children
to achieve essential levels of learning. Odisha
aims at Universalising Elementary Education
(UEE) by 2010 and has implemented several
education programmes including those
launched by Government of India from
time to time. Efforts have been directed to
increase enrolments; to reduce drop-outs; to
enhance quality of curriculum; to undertake
capacity building of various functionaries
including teachers; and to deploy Information
and Communication Technology (ICT) for
generating awareness, building capacities at
various levels and ensuring quality delivery of
education to the target groups. Some major
initiatives are summarised as follows.
5.2.1 Sarva Shiksha Abhiyan (SSA)This is a central sponsored scheme to
universalise education up to class VIII and to
provide useful and quality education to all
children in 6-14 year age group. This scheme
that is currently jointly funded by the centre
and State is implemented in all 30 districts
of Odisha. The salient features of the scheme
are: (a) all children in 6-14 year age group
in school or EGS by 2003, (b) all children
to complete f ive years of schooling
by 2008 and eight years of schooling
by 2010, (c) universal retention by 2010,
(d) emphasis on elementary education of
satisfactory quality with focus on education
for life, (e) bridge gender and social gaps at
primary stage by 2007 and at upper primary
stage by 2010.
5.2.2 District Primary education Programme (DPeP) This is a centrally sponsored programme
jointly funded in the ratio of 85:15 by the
Centre and State. The programme focuses on
eight districts of the State that lag behind in
achieving the State objectives on education.
This programme has been implemented in
Kalahandi with a view to opening new primary
schools, creating additional class rooms and
increasing enrolments in primary schools.
5.2.3 National Programme for education of Girls at elementary Level (NPeGL) This central scheme targets promotion
of girl's education in 143 educationally
backward districts of the country and has
been implemented in Kalahandi to improve
education of girls' of all classes in general and
ST and SC girls in particular.
5.2.4 Kasturba Gandhi Balika VidyalayaThis scheme is aimed at providing
schooling facilities for out-of-school girls
in educationally most backward blocks.
Under this scheme, residential schools are
created or boarding facilities are improved
to facilitate enrolment of girls of ST, SC, OBC
and minority communities at primary level.
This scheme has also been implemented in
Kalahandi.
5.3 Literacy Levels and Education Standards
The levels of literacy and standards of
education in Kalahandi remained, and
continue to remain, very low. Table 51
summarises levels of literacy in Kalahandi

94
District Human Development Report
Table 51: Literacy rates in Kalahandi District: 1951 -2011
Year Population (000) Literates (000) Literacy Rates (percent)
Total Male Female Total Male Female Total Male Female
1951 585.80 289.60 296.20 36.90 32.20 4.70 6.30 11.10 1.60
1961 679.60 336.40 343.20 75.40 65.90 9.50 11.10 19.60 2.70
1971 824.90 410.40 414.50 115.10 96.00 19.10 13.90 23.40 4.60
1991 1130.90 565.60 565.30 351.50 259.50 92.00 31.10 45.90 16.30
2001 1335.50 667.50 668.00 613.50 418.00 195.50 45.94 62.66 29.28
2011 1573.05 785.18 787.87 818.39 495.18 323.21 60.22 73.34 47.27
Literacy Rates among ST and SC Communities
1961 2001
Total Male Female Total Male Female
ST Literacy Rates (%) 5.80 11.10 0.60 34.20 51.70 17.20
SC Literacy Rates (%) 7.20 13.50 1.10 47.10 63.80 30.80
Note: Figures of the district till 1991 is for undivided Kalahandi
Source: Kalahandi District Gazette, Census, 1951-2011
from 1951 to 2011. It may be observed from
Table 51 that overall literacy in Kalahandi has
increased from 6.3 percent in 1951 to 60.2
percent in 2011, which is far below the State
average of 73.5 percent in 2011. The male
literacy in Kalahandi has increased from
11.1 percent in 1951 to 73.3 percent in 2011
against the State average of 82.4 percent in
2011. The female literacy has remained very
low and has increased at a very slow pace
from 1.6 percent in 1951 to 47.3 percent in
2011, which is much lower than the State
average of 64.4 percent in 2011. As many
as 23 districts of Odisha performed better
than Kalahandi on literacy front in 2001.
There is a wide disparity in male and female
literacy rates in the district. The gap of 32.38
percentage points between male and female
literacy rates in 2001 was indeed very wide
and has reduced to 26 percentage points in
2011. The female literacy was less than half
of the male literacy in the district in 2001
though situation some what improved in
2011. The poor performance of the district
on literacy front and in particular very low
levels of the female literacy and painfully
slow rate of growth in female literacy in the
district are matters of serious concern. These
issues require immediate attention.
Table 51 also compares literacy rates among
ST and SC communities from 1961 to 2001.
It may be observed that literacy among SC
communities is better than the average
literacy rates for the district for both male and
female. The overall SC literacy has grown from
7.2 percent in 1961 to 47.1 percent in 2001.
There is an improvement of 40 percentage
points over a period of 40 years yielding a rate
of one percentage point improvement per
year. The SC female literacy rate has improved
from 1.1 percent in 1961 to 30.8 percent in
2001. The SC female literacy at 30.8 percent in
2001 is better than the district average female
literacy rate of 29.3 percent in 2001. The
performance of tribal communities is, however,
far from satisfactory. The overall ST literacy
rate has increased from 5.8 percent in 1961 to
34.2 percent in 2001 yielding an improvement
of 28.4 percentage points over a period of 40
years. Both male and female literacy rates
of ST communities at 51.7 percent and 17.2
percent in 2001 are much less than the district
average and those for SC communities. The

95
Education
poor literacy levels among ST communities
in general and ST female literacy in particular
are also matters of serious concern. There is
a need to pay focused attention to improve
ST female literacy.
The intra-district disparities in literacy levels
both for male and female are significant.
Table 52 compares male and female literacy
levels across blocks and urban bodies in
Kalahandi for 2001 census. There are also
acute gender disparities at district and sub-
district levels. Narla block reported highest
overall literacy rate of 55.13 percent and
Thuamul Rampur block the lowest rate of
28.08 percent, there being a wide gap of
27.05 percentage points. Thuamul Rampur
block has almost half of Narla block literacy
levels. Narla block also had highest male
literacy rate of 71.30 percent and Lanjigarh
block the lowest rate of 43.16 percent
leaving a gap of 27.14 percentage points.
The female literacy rate was highest for
Karlamunda block at 39.34 percent and
lowest for Thuamul Rampur block at 12.09
percent. There is a gap of 27.25 percentage
points between two literacy rates. The
female literacy rate in Karlamunda block
is more than three times higher than that
in Thuamul Rampur block. It is also worth
mentioning that both Thuamul Rampur and
Lanjigarh blocks that are tribal dominated
blocks have very low levels of literacy. It
may be argued that the observed disparities
in literacy levels may be attributed to a
number of factors such as income levels of
households, lack of connectivity, remoteness
of habitations, attitudes of households
towards education, gender and ST status.
In addition, poor school infrastructure,
teacher abstinence and uninspiring syllabus
are also some factors that affect enrollment
and retention of students in schools. There
is, therefore, need to pay great attention to
Table 52: Intra-District Disparities in Literacy Levels by Block & Sex: 2001
Sl. No. Block/Urban Bodies Literacy Rates (%)
Total Male Female
1 Kalampur 46.22 62.84 28.14
2 M.Rampur 52.81 69.31 36.33
3 Kesinga 44.73 54.73 37.05
4 Narla 55.13 71.30 38.93
5 Dharamgarh 42.85 61.12 24.39
6 Koksara 42.58 61.58 23.93
7 Bhawanipatna 41.43 58.41 24.65
8 Golamunda 37.95 54.72 21.32
9 Jaypatna 42.89 60.56 25.54
10 Junagarh 42.39 59.95 25.02
11 Karlamunda 55.09 70.82 39.34
12 Lanjigarh 28.85 43.16 14.95
13 Th.Rampur 28.08 44.38 12.09
14 Bhawanipatna Municipality 78.94 87.89 69.16
15 Junagarh NAC 64.34 76.28 51.74
16 Kesinga NAC 64.21 76.65 51.29
Kalahandi 45.94 62.66 29.28
Source: Census India, 2001

96
District Human Development Report
increase male and female literacy rates in
these and other blocks and to bridge the
intra-district and gender gaps in literacy
levels for the district.
The adult literacy rates among different
classes of households are comparatively
lower than total literacy rate, both in rural
and urban areas. However, adult literacy
is relatively better in urban areas than
that in rural areas. Gender disparity is also
observed in case of adult literacy. Women
have not benefited from various adult
literacy programmes in the same manner
as men have benefited. As per 2001 census,
513,383 adults are literate. The proportion
of adult population completing any level of
education that include: without level, middle,
matric, higher secondary, diploma, graduates
or post-graduate is also on the lower side.
About four percent adults have received
instructions without level or at graduate
level. Additional 13 percent have qualified
middle level and 15 percent have qualified
matric, higher secondary or diploma levels.
About 34 percent have remained below
primary level. Table 53 gives a distribution
of adult population by education levels.
About 330,491 adults have attained primary
or below primary levels.
Table 54: Distribution of Schools by Block and School types: 2007-2008
Sl. No.
Block Primary School
UP School Pry with UP
Pry with UP & HS
UP with HS
High School
Total
1 Bhawanipatna 166 10 60 2 0 22 260
2 Dharamgarh 86 12 56 3 0 19 176
3 Golamunda 122 22 42 1 0 23 210
4 Jaipatna 119 5 43 3 2 14 186
5 Junagarh 139 21 45 2 1 20 228
6 Kalampur 68 2 27 1 2 6 106
7 Karlamunda 67 6 26 1 0 10 110
8 Kesinga 117 6 39 0 3 16 181
9 Koksara 78 14 52 2 1 18 165
10 Lanjigarh 92 2 50 3 1 9 157
11 M. Rampur 117 1 46 2 2 7 175
12 Narla 142 13 49 0 1 20 225
13 Th. Rampur 104 1 36 3 2 0 146
14 Bhawanipatna Mu. 33 3 12 5 3 4 60
15 Junagarh [NAC] 8 0 7 2 1 1 19
16 Kesinga [NAC] 13 0 3 3 1 1 21
Kalahandi 1,471 118 593 33 20 190 2,425
Source: SSA, Kalahandi 2007-2008
*Total Schools included SME, TRW, Aided, Un-aided, Unrecognized and others
Notes: Pry refers to primary up to 5th standard; UP – upper primary (up to 7th standard, HS – high schools up to 10th standard
Table 53: Distribution of Adult Population by education Levels
Educational Level Status during 2001
Without Level 21,295
Below Primary 174,170
Primary 156,321
Middle 67,866
Matric/Higher Secondary/Diploma
75,827
Graduate and above 17,904
All Levels 513,383
Source: BPL Census Kalahandi, 2002

97
Education
5.4 Education Infrastructure
There were only 118 primary schools in
Kalahandi in 1947-48. Thereafter, there has
been substantial increase in the number of
schools in the district. The number of primary
schools was 916 with 37,016 male students
and 9,094 female students in 1960-61. The
strength of teachers also increased to 1,367
including 697 trained teachers. The area and
population served by one primary school in
the district worked out to 5.5 square miles
and 1,102 persons respectively against the
State averages of 2.9 square miles and 850
persons. The number of primary schools
increased to 1,865 in 1975-76 with total
enrolment of 111,082 students (i.e., 77,788
boys and 33,284 girls) and 3,796 teachers.
In 2007-08, Kalahandi had 2,425 schools of
various descriptions including 1,471 primary
schools, 118 upper primary (UP) schools, 593
primary and UP schools, 33 primary and up
to high school levels, 20 UP and high school
levels and 190 high schools16. Table 54 gives
a distribution of schools by blocks and school
types in 2007-08. It may be observed from
Table 54 that the number of school varies from
106 in Kalampur block to 260 in Bhawanipatna
block. In addition, Bhawanipatna Municipality
has 60 schools of various descriptions.
Karlamunda block has lowest number of 67
primary schools and Bhawanipatna block
has highest number of 166 primary schools.
This does not include 33 primary schools in
Table 55: Primary Schools with Deficient Infrastructure and Without Facilities
Block/ Urban Body
Schools (No.)
Schools without
Own Building
(%)
Pucca Class-rooms(No.)
Schools without
Drinking Water
(%)
Schools without Toilets
(%)
Schools without
Play Ground
(%)
Schools without Kitchen
(%)
Bhawanipatna 161 9.94 290 17.39 69.57 90.68 81.99
Dharamgarh 90 6.67 208 14.44 64.44 95.56 74.44
Golamunda 116 14.66 189 17.24 64.66 98.28 87.07
Bhawanipatna [M] 29 3.45 52 34.48 55.17 82.76 89.66
Junagarh 132 11.36 263 12.88 87.12 98.48 76.52
Junagarh [N] 8 0.00 14 25.00 75.00 100.00 100.00
Jaipatna 111 5.41 209 20.72 76.58 99.10 69.37
Kalampur 61 4.92 108 11.48 72.13 100.00 85.25
Karlamunda 65 20.00 124 21.54 55.38 86.15 83.08
Kesinga 109 14.68 193 21.10 51.38 88.99 75.23
Kesinga [N] 9 11.11 17 22.22 44.44 100.00 77.78
Koksara 84 5.95 128 14.29 69.05 95.24 85.71
Lanjigarh 88 37.50 89 19.32 86.36 97.73 86.36
M. Rampur 106 27.36 142 36.79 70.75 94.34 70.75
Narla 139 4.32 256 8.63 61.15 89.21 71.94
Th. Rampur 81 37.04 73 37.04 90.12 100.00 95.06
Kalahandi 1,389 14.18 2,355 19.37 70.12 94.46 79.70
Source: DISE, 2007-2008
16 Kalahandi district has been divided two times. Kashipur region of the district was merged with Koraput district and in 1993-94, Kalahandi
was again divided into two districts: Kalahandi and Nuapada. Therefore, the current statistics on numbers of schools, students and teachers
cannot be readily compared with the similar statistics for years up to 1993-94. Therefore, inter-temporal comparisons should be undertaken
with great caution.

98
District Human Development Report
Bhawanipatna Municipality. Thuamul Rampur
block has no high school whereas Golmunda
block has highest number of 23 high schools.
The lack of schools of various types in deficient
blocks restricts the opportunities for children
to seek education.
A number of deficiencies have been observed
in school infrastrtucture. Many schools lack
common facilities such as drinking water
supply, toilets and electricity. Table 55 gives
block-wise distribution of primary schools,
which are deficient in infrastructure and
or lack common facilities such as drinking
water, toilets, play ground and kitchen. About
14 percent primary and 0.64 percent upper
primary schools have no school building of
their own, 19.37 percent primary and 12.94
percent upper primary schools have no
drinking water facility, and 70.12 percent
primary and 48.24 percent upper primary
schools have no toilet facility. More than
85 percent primary schools have no play
ground. Only 17 percent primary schools,
36 percent primary with upper primary, four
percent primary with upper primary and
secondary, nine percent upper primary, 10
percent upper primary with secondary and
26 percent high schools are electrified. There
are kitchen facilities for mid day meal only in
282 primary schools. Only 142 primary and
87 upper primary schools have boundary wall.
Kalahandi also has 24 colleges, eight
government and 16 non-government
colleges, which impart higher education.
In addition, Kalahandi has 699 other
educational institutions in different blocks.
These institutions cater to special needs such
as teachers’ training, vocational, ITI and other
skill training institutions, special schools for
ST and SC students, schools for blind, deaf ,
dumb and others. The distribution of these
institutions is given in Table 56.
In 2006-07, the district had a total enrolment
of 2.04 lakh students (i.e., 1.05 lakh boys and
0.99 lakh girls) in primary schools with 3,224
male and 974 female teachers. This yields a
very adverse teacher-student ratio of 1:49.
The number of ST and SC students was 0.66
lakh (i.e., 0.34 lakh boys and 0.32 lakh girls)
and 0.42 lakh (i.e., 0.21 lakh boys and 0.21
lakh girls) respectively. It is interesting to
observe that there is no gap in enrollment
of boys and girls of SC communities. The
gaps in enrollments of boys and girls of ST
communities are also narrowing down. In
all, 63,000 students with break-up of 37,000
boys and 26,000 girls, 15,000 ST and 14,000
SC students were enrolled in middle schools
with 1,044 teachers having teacher-student
ratio of 1:60 in the year 2006-07 and 38,000
students (i.e., 25,000 boys, 13.000 girls, 6,000
ST and 7,000 SC students) were enrolled in
high schools having 1,036 teachers and
Table 56: educational Institutions for Special Needs
Educational Institutions Number of Institutions
S.T. School 1
D.I.E.T. 1
Vocational Higher Secondary Schools
6
Saraswati Bidya Mandir 2
Saraswati Sishu Mandir 6
Aurobindo Integral Schools 4
Kanya Ashram 1
Jawahar Navodaya Vidyalaya 1
B.Ed. Training College 1
Law College 1
Deaf & Dumb School 1
Blind School 1
English Medium Public School 3
Sunday Art School 1
Sanskrit Tol 1
Prathamic (Primary) 618
Madhyamic (Middle) 48
ITI (one Govt. and one non-Govt)
2
Kalahandi 699
Source: Department of Education, Kalahandi

99
Education
teacher-student ratio of 1:37 in the year 2006-
07. Out of 10,296 students (i.e., 6,712 boys
and 3,584 girls) who appeared in matriculate
examination in 2006-07, total 6,603 students
with break-up of 4,243 boys and 2,360 girls
passed the examination. The total pass result
was 64 percent, with 63 percent boys and
66 percent girls passing the examination in
2006-07.
5.5 Enrollment Ratio Among Different Age Groups
In Odisha, the number of students at primary
level increased more than 19 times between
1947-48 and 2003-04. Currently, about 4.9
million children are enrolled in primary
schools, nearly one million in upper primary
schools and 1.3 million in secondary schools.
Table 57: Student enrolment at Primary School Level by Blocks: 2007-2008
Sl. No.
Block /Urban Body
Number of Students Enrolled
Total Boys Girls SC ST
1 Bhawanipatna 13,473 6,922 6,551 3,129 4,982
2 Dharamgarh 11,351 5,896 5,455 2,501 2,038
3 Golamunda 10,974 5,740 5,234 2,245 2,878
4 Jaypatna 10,177 5,293 4,884 1,940 3,885
5 Junagarh 16,092 8,135 7,957 3,196 3,172
6 Kalampur 4,659 2,464 2,195 1,088 1,277
7 Karlamunda 3,950 2,030 1,920 668 642
8 Kesinga 6,770 3,464 3,306 1,643 1,392
9 Koksara 8,961 4,775 4,186 1,909 3,072
10 Lanjigarh 6,622 3,743 2,879 1,933 2,777
11 M.Rampur 6,023 3,106 2,917 1,136 2,798
12 Narla 8,888 4,479 4,409 1,993 2,523
13 Th.Rampur 5,139 2,884 2,255 1,539 2,927
14 B.Patna[M] 2,904 1,478 1,426 558 430
15 Junagarh[NAC] 1,504 799 705 288 190
16 Kesinga[NAC] 1,081 503 578 208 373
Kalahandi 118,568 61,711 56,857 25,974 35,356
Source: Dept. of Education, Kalahandi
More or less similar enrolment growth trends
have been marked in Kalahandi. Table 57
gives distribution of student enrolments
at primary school level by block and urban
bodies and by gender and ST and SC
categories. It may be observed from Table 57
that out of total 118,568 students enrolled at
primary level, 61,711 were boys, 56,857 girls,
25,974 SC and 35,356 ST students.
It may be observed from Table 57 that
highest contribution to total student
enrolment was made by Junagarh with
Figure 14: enrollment Patterns in Kalahandi
88.2
5
90.8
7
54.1
9
Primary School Upper Primary High School
Total Enrolment SC ST
Perc
enta
ge
78.4
8
84.0
5
75.5
5
37.2
1
38.7
2
36.8
3
School Categories

100
District Human Development Report
13.18 percent enrolment of boy and 13.99
percent of girl students in primary schools
and that Kesinga NAC contributed the least
with 0.82 percent enrolment of boy and 1.02
percent of girl students in primary schools in
2007-08. Junagarh also contributed the most
for enrolment of 12.80 percent SC students.
Bhawanipatna block contributed most for
enrolement of 12.30 percent ST students
at primary level. Figure 14 indicates that
total enrolmenmt at primary school level
was 88.25 percent, the enrolment of SC and
ST students being 90.87 percent and 54.19
percent respectively. Total enrolements
at upper primary level were of the order
of 78.48 percent, with 84.05 percent and
75.55 percent for all SC and ST students
respectively. Total enrolements at high
school level have been 37.21 percent with
38.72 percent and 36.83 percent for SC and
ST students respectively.
According to the 2005 Odisha Child Census,
11 districts contributed about 80 percent of
Enrolment Ratio (NER) was 91.63 percent
in the age group of 6-11 year for all blocks
and urban bodies in the district. Similarly, in
the age group of 11-14 year, GER was 94.96
percent and NER 90.06 percent, which are
lower than the GER and NER for 6-11 year
age group.
Though the GER and NER in the 6-11 year
and 11-14 year age groups have improved in
the recent years, many children in age groups
of 6-11 year have failed to enrol themselves
in schools. The school dropout rate is high
among both boys and girls in the age group
of 11-14 year due to various reasons. With a
view to attracting the out-of-school children
to schooling, the State Government has
established 783 Education Guarantee School
(EGS) centres at appropriate locations in
the district. About 24,357 students were
enrolled into Education Guarantee School at
different locations during 2007-08. Lanjigarh
enrolled highest number of students in
143 Education Guarantee School centres
followed by Th. Rampur and Koksara while,
student enrolment in 11 existing Education
Guarantee School centres of Kesinga still
remained low. This may be mainly because
of availability of accessible and better schools
in Kesinga and other more developed blocks.
In any case, Education Guarantee School
centres have contributed significantly in
improving the enrolment of out-of-school
children to schooling fold. In the mean time
Government has upgraded selected EGS
centres to formal Educational Institutions.
Figure 15 represents the status of EGS
Centres in the district.
The high drop-out rates at school level have
been attributed to several factors, which
include poverty, lack of interest, poor access,
engaging children of school-going age in
household works, child labour, migration,
teacher absenteeism, socio-cultural
orientations and infrastructural inadequacies.
Figure 15: Status of eGS Centres
9,(1%)11,(1%)22,(3%)
74,(9%)
63,(8%)
62,(8%)61,(8%)
26,(3%)
65,(8%)
143,(18%)
82,(11%)
74,(10%)91,(12%)
Bhawanipatna
Dharamgarh
Golamunda
Jaipatna
Junagarh
Kalampur
Karlamunda
Kesinga
Koksara
Lanjigarh
M. Rampur
Narla
Th. Rampur
the total out-of-school children during 2005.
Kalahandi had 13,608 out-of-school children
and occupied 7th position in the State. In
2007-08, the estimated Gross Enrolment
Ratio (GER) was 97.69 percent and Net

101
Education
The drop-out rates are high among ST
children, who perhaps also have difficulty
following instructions in Odiya. Introduction
of the medium of instructions in tribal dialects
and languages may help increase enrolments
and retention in schools. The District Primary
Education Programme (DPEP) has been
directed to address these issues. That is
to improve the enrolment status, reduce
drop-out rates, increase access of children
to primary education, foster learning habits
among young students, minimise gender
gap, and increase participation and retention
of differentially abled children in regular
educational institutions. As per the 2005
Child Labour Survey, 41,651 child labourers
(i.e., 48.24 percent male and 51.76 percent
female) were identified in the district. For
them, 50 special learning centres have been
started from December 2005 onward.
The rate of repetition of students in primary
schools in Kalahandi is fairly high. There may be
two types of reasons for high repetition rates:
one, lack of interest and efforts on the part
of first generation learners, and the second,
teaching deficiencies. The State has taken
some steps to check the repetition, particularly
in DPEP districts. These steps include: (i)
continuous evaluation and provision of
remedial teaching in schools where repetition
is high, (ii) provision of special coaching during
holidays to such children who are prone to
repeat, (iii) involvement of parents / community
members to improve the progress of children
in difficult areas, and (iv) organisation
of one-month special summer camps for
repeaters at block and cluster levels.
5.6 Major Educational Concerns
There are a number of educational concerns
that need immediate attention. First, though
several educational programmes have been,
and are being, implemented in Kalahandi,
the literacy levels are still far below the
State average. There is a huge gap of 13.3
percentage points is the district literacy rate
vis-a-vis the State in 2011. There is, therefore,
a need for greater attention with a view to
achieving the State objectives of literacy
levels. Second, there are substantial social,
gender and regional disparities in terms of
literacy. ST communities in general, and tribal
female in particular, have much lower levels
of literacy than those for other communities.
The female literacy for the district as a
whole is also far below the district male
literacy. Thuamul Rampur and Lanjigarh
block also have very low levels of literacy.
These disparities need to be addressed
expeditiously. Third, the drop-out rates in
the district are still very high, particularly
among ST children, girls and pupils of remote
areas. The number of out-of-school children
in the district is also very high. The rate of
repetition of students in primary schools in
Kalahandi is fairly high. Greater efforts are
needed to improve enrolments, to reduce
drop-out rates, to increase access of children
to primary education, and to foster learning
habits among young students. Fourth, there
is also a need to improve quality of education
in the district and to bring down the high rate
of repetition of students. Fifth, secondary
and technical education also need be
accelerated and substantially improved with
a view to increase employability of youths.
Sixth, the absentism of teachers in remote
areas should also be checked through
periodical inspections and activating
parent-teachers interactions. The quality of
teachers should be continuously improved.
Seventh, connectivity in the district should
also be substantially improved to increase
access to schools.
The district reflects a positive trend of
progress in order to achieve Goal 2 of the
MDG i.e. universal primary education. With
the initiative of SSA and special state focus
in the KBK region for educational promotion,

102
District Human Development Report
- • -
the district may be able to achieve the gross
enrolment ratio of 101.29 (Boys-101.33;
Girls-101.25) and net enrolment ratio of
93.8 (Boys-93.9; Girls-93.7) during the year
2011-12 in primary education. The GER
in the elementary education remains at
100.76 (Boys-100.79; Girls-100.72). On the
other hand, the district reflects an overall
growth in literacy from 45.9 percent in 2001
to 60.22 percent in 2011. The male literacy
has increased from 62.7 percent in 2001 to
73.34 percent in 2011. The female literacy
also recorded a growth from 29.3 percent in
2001 to 47.27 percent in 2011. In order to
promote primary education, Government
has been creating required infrastructural
facilities which includes provision of toilet
in the school, installing drinking water
facility, expansion of school building with
more number of classrooms, increasing
teacher strength, etc. Implementation of
Mid-day meal programme has supported in
the initiative of achieving universal primary
education in the district. Other factors that
have been instrumental in achieving better
outcome in primary education are, increased
awareness among people and educational
support by Government to the students.
This chapter traced early beginnings of
modern education in the Kalahandi ex-
State. The district had a literacy rate of only
6.3 percent in 1951, that is, soon after the
Kalahandi ex-State merged with Odisha. The
next section examined several efforts that
have been made by the State to accelerate
educational development in the district.
The major programmes that have been
implemented in the district include SSA,
DPEP, NPEGL and KGVB. The subsequent
sections have described the growth of
literacy levels and increase in educational
infrastructure. The literacy rate in Kalahandi
increased to 45.9 percent in 2001 with male
literacy rate of 62.6 percent and female
literacy rate of 29.2 percent. There are 2,425
schools including 1,471 primary schools
in the district. The enrolment levels and
drop-out rates have been studied in the
next section. The overall enrolment in the
district has increased to 88.25 percent,
enrolments of SC and ST students being
90.87 percent and 54.19 percent. The last
section lists major education concerns.
There are substantial social, gender and
regional disparities in terms of literacy.
The literacy levels of ST communities are
very low and their drop-out rates are very
high, which may be attributed to various
factors including lack of instructions in
their own dialects. Though the State has
taken several steps to address educational
concerns, women in general and, ST female
in particular, are at serious disadvantage.
The next chapter is, therefore, devoted to
discuss the gender question.

Gender
Chapter 6
“In the Vedas and Upanishads, women taught the highest truths and received the same veneration as men.”
Swami Vivekananda


105
Gender
Gender is a complex social construct based
on biology. The manifested differences
between men and women, which the
concept “gender” signifies, are culture
specific social constructs. In addition to
having a socio-cultural base, “gender” also
has psychological underpinning. In most
societies, women have faced, and continue
to face, disadvantages in many respects. In
order to address issues pertaining to gender
disparities, the United Nations Millennium
Summit 2000 assigned the third Millennium
Development Goal (MDG) to address
gender issues and aimed at promoting
gender equality and empowering women.
The following quantifiable targets and
monitorable indicators were also specified
to track the progress on the 3rd MDG:
Box 4: MDG 3: Promote Gender equality
l To eliminate gender disparity in
primary and secondary education
preferably by 2005, and at all levels
by 2015
l To track ratios of girls to boys in
primary, secondary and tertiary
education; share of women in wage
employment in the non-agricultural
sector; and proportion of seats held
by women in national parliament.
This chapter examines some dimensions of
gender disparities in Kalahandi district and is
organised as follows. The next section studies
the relative numerical strength of women
and declaining sex ratio in the district. Some
gender disparities in work participation rates

106
District Human Development Report
and education are studied in the following
sections which also describe efforts made by
the State and Civil Society Organisations to
address gender disparities.
6.1 Women in Kalahandi
Women have historically outnumbered
men in Kalahandi. Table 58, which is a
reproduction of Table 7 from the first
Chapter of this report, gives male and female
population distribution for the last 110 years
from 1901 to 2011 and indicates that women
have been the majority in the district from
1901 to 2011 except in 1991 when their
number was less than men by only 287. The
sex ratio has remained mostly favourable.
However, the proportion of females per 1000
males has been declining over the years. The
sex ratio declined sharply from the highest
1,035 in 1931-41 to 999 in 1991 and 1,001 in
2001. Table 58 depicts the declining share
of female population. Like other parts of the
State, urban areas have still lower sex ratios
than rural areas. A major concern, however,
is that the population of girls in the 0-6 year
age group has fallen sharply as compared to
that of boys in the same age group as per
the 2001 and 2011 census. The proportion
of women to the total population in the 2001
census has been 50.02 percent whereas the
proportion of girls in the 0-6 year age group
is only 49.60 percent. This yields a sex ratio
of only 984 girls for 1,000 boys in the 0-6
year age group in 2001 as against 1,001
females per 1,000 males. A similar trend is
marked in the 0-6 age group in the 2011
census. In 2011, the sex ratio of the district
in the 0-6 age group further decreased to
947 (Odisha-934; census 2011) from 984
(Odisha-953; census 2001). But in the 7+ age
group, a favourable sex ratio is marked at
both district and state level. During 2001,
the sex ratio in the 7+ age group was 1004
(Odisha-976) in the district which increased
to 1013 (Odisha-985) during 2011. Looking
at the sex ratio in the 0-6 age group, it is likely
that the sex ratio will worsen in Kalahandi in
times to come. Current trends lead one to
hypothesise that as development proceeds,
and as urbanisation increases, the sex ratio
worsens. Therefore, efforts are needed
to ensure that a favourable sex ratio is
maintained at all times. Figure 16 represents
Table 58: Population of the re-Organised Kalahandi District: 1901 - 2011Sl. No. Census Year Male Female Total Sex Ratio
1 1901 162,985 163,593 326,578 1,004
2 1911 194,187 198,819 393,006 1,024
3 1921 197,083 203,095 400,178 1,031
4 1931 234,058 242,349 476,407 1,035
5 1941 266,309 275,625 541,934 1,035
6 1951 289,639 296,186 585,825 1,023
7 1961 336,367 343,235 679,602 1,020
8 1971 410,415 414,560 824,975 1,010
9 1981 471,058 475,451 946,509 1,009
10 1991 565,595 565,308 1,130,903 999
11 2001 667,526 667,968 1,335,494 1,001
12 2011 785,179 787,875 1,573,054 1,003
0-6 Year Age Group
13 2001 109,807 108,082 217,889 984
14 2011 109,977 104,134 214,111 947
Source: Census, 1901-2011

107
Gender
2001 2011
male and female population trends in
Kalahandi from 1901 to 2011.
6.2 Gender Disparities: Some Dimensions
Though women were in majority, with a
50.02 percent share in population of the
district, in 2001, only about 36 percent
women were employed as against 57
percent men. Table 59, a reproduction of
Table12 from the second chapter, gives
work participation rates among males
and females. Women face a number of
disadvantages in terms of employability.
First, lesser women are employed than men.
Second, they are paid much lower wages
than their male counterparts. Third, a large
number of employed women are engaged
mainly in farm related activities. These
gender-related disparities need be addressed
expeditiously and in a fair manner.
6.2.1 Female Literacy Levels The levels of female literacy are very low in
the district. It may be observed from Table
60, which has been reproduced below from
the five Chapter (Table 51) that the female
literacy at 47.27 percent (Odisha 64.36%) is
less than the male literacy of 73.3 percent
(Odisha-82.40) in the district in 2011. The
female literacy in Kalahandi is also much
lower than that for Odisha (Odisha-64.36%)
in 2011. The ST literacy rates are also very low
at 34.2 percent for the district in 2001 and the
ST female literacy rate was only 17.2 percent
in 2001. This is substantially less than the
overall female literacy in the district. There
are, therefore, wide gender disparities in the
district as regards literacy levels.
Source: Census, 1901-2011
Figure 16: Population Trends by Male And Female: 1901-2011
800000
700000
600000
500000
400000
300000
200000
100000
01901
Male Female
1911 1921 1931 1941 1951 1961 1971 1981 1991
Table 59: The Work Participation rate for Kalahandi: 1999-2000 to 2007-2008Year Population (lakh) Employed Persons (lakh) Work Participation Rate (%)
Total Male Female Total Male Female Total Male Female
1999-00* 13.09 6.54 6.55 6.12 3.76 2.36 46.75 57.49 35.03
2001 13.35 6.67 6.68 6.21 3.81 2.40 46.52 57.12 35.93
2004-05* 13.98 6.99 6.99 6.54 4.02 2.52 46.78 57.51 36.05
2007-08* 14.50 7.25 7.25 6.78 4.16 2.61 46.76 57.38 36.00
Source: Census, 2001, *DES, Odisha Projections
Years
Nu
mb
ers
2241
50
2249
87
2734
33
2793
13
3332
98
3790
63
4066
97
4781
08 5849
40 6685
68
5653
08 6679
68
7851
7978
7875
2670
62
2710
45
3218
96
3662
50
3989
78
4687
66 5789
29 6612
12
5655
95 6675
26

108
District Human Development Report
With a view to increasing literacy among
women, the State has been making concerted
efforts to promote education among girls of
all communities. It is heartening to note that
the enrollment of girls has been increasing
Table 61: Status of Girls' enrolments (6-11 years) in Kalahandi: 2008-2009Sl. No.
Block/ Urban Bodies
6 - 11 Year Age Group
All Communities SC ST Minority
Total Girls (%) Total Girls (%) Total Girls (%) Total Girls (%)
1 Bhawanipatna 24,990 49.32 5,623 48.09 8,745 49.74 41 41.46
2 Dharamgarh 22,223 48.31 4,299 48.55 4,161 48.28 31 41.94
3 Golamunda 17,922 48.49 3,459 48.83 4,639 49.99 85 58.82
4 Jaipatna 25,192 48.75 4,437 51.84 10,047 49.10 32 53.13
5 Junagarh 19,637 49.05 3,630 48.48 3,717 49.83 75 66.67
6 Kalampur 8,973 49.67 1,593 50.72 2,198 50.27 30 73.33
7 Karlamunda 8,021 48.47 1,486 48.52 2,204 49.32 12 50.00
8 Kesinga 17,779 49.28 3,278 47.86 6,147 49.72 41 53.66
9 Koksara 15,093 49.59 2,421 52.09 2,509 49.02 41 60.98
10 Lanjigarh 14,565 45.18 3,930 45.75 7,007 43.88 9 33.33
11 M. Rampur 12,350 48.49 2,220 48.29 5,098 47.59 33 54.55
12 Narla 15,979 48.54 3,546 49.63 4,386 48.75 14 50.00
13 Th. Rampur 14,895 46.96 4,096 46.90 8,142 46.51 7 28.57
14 Bhawanipatna [M] 8,417 47.53 1,762 49.60 900 47.11 250 53.20
15 Junagarh [NAC] 2,844 51.41 497 55.33 258 76.74 40 45.00
16 Kesinga [NAC] 2,682 50.37 545 50.28 407 50.37 21 47.62
Kalahandi 231,562 48.53 46,822 48.85 70,565 48.46 762 54.20Source: District Education, DPEP, SSA
in recent years. In 2007-08, out of a total of
118,568 students enrolled in the 6-11 age
group, 56,857 enrolled girls accounted for
47.95 percent and boys for 52.05 percent.
Table 61 gives the status of girls’ enrolment
Table 60: Gender Disparities in Literacy, Kalahandi: 1951 -2011
Year Population (000) Literates (000) Literacy Rates (percent)
Total Male Female Total Male Female Total Male Female
1951 585.80 289.60 296.20 36.90 32.20 4.70 6.30 11.10 1.60
1961 679.60 336.40 343.20 75.40 65.90 9.50 11.10 19.60 2.70
1971 824.90 410.40 414.50 115.10 96.00 19.10 13.90 23.40 4.60
1991 1130.90 565.60 565.30 351.50 259.50 92.00 31.10 45.90 16.30
2001 1335.50 667.50 668.00 613.50 418.00 195.50 45.94 62.66 29.28
2011 1573.05 785.18 787.87 818.39 495.18 323.21 60.22 73.34 47.27
Literacy Rates among ST and SC Communities
1961 2001
Total Male Female Total Male Female
ST Literacy Rates (%) 5.80 11.10 0.60 34.20 51.70 17.20
SC Literacy Rates (%) 7.20 13.50 1.10 47.10 63.80 30.80
Note: Figures of the district till 1991 is for undivided Kalahandi
Source: Kalahandi District Gazette, Census, 1951-2011
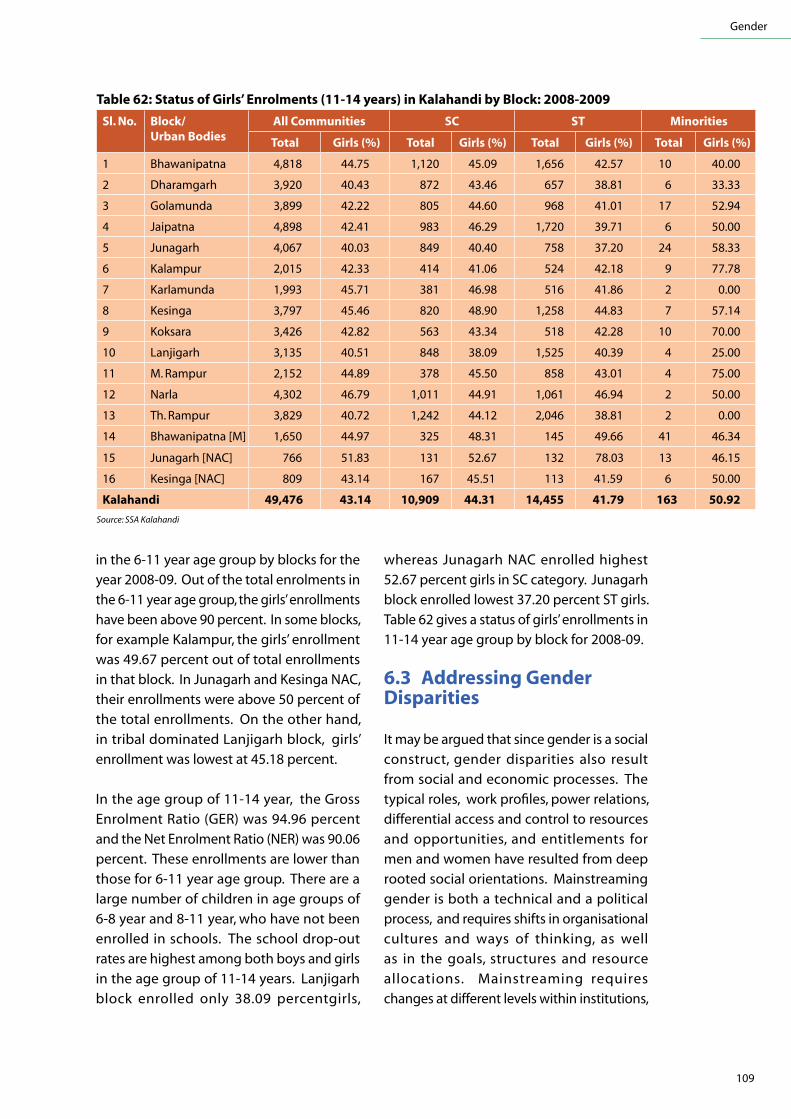
109
Gender
Table 62: Status of Girls’ enrolments (11-14 years) in Kalahandi by Block: 2008-2009Sl. No. Block/
Urban BodiesAll Communities SC ST Minorities
Total Girls (%) Total Girls (%) Total Girls (%) Total Girls (%)
1 Bhawanipatna 4,818 44.75 1,120 45.09 1,656 42.57 10 40.00
2 Dharamgarh 3,920 40.43 872 43.46 657 38.81 6 33.33
3 Golamunda 3,899 42.22 805 44.60 968 41.01 17 52.94
4 Jaipatna 4,898 42.41 983 46.29 1,720 39.71 6 50.00
5 Junagarh 4,067 40.03 849 40.40 758 37.20 24 58.33
6 Kalampur 2,015 42.33 414 41.06 524 42.18 9 77.78
7 Karlamunda 1,993 45.71 381 46.98 516 41.86 2 0.00
8 Kesinga 3,797 45.46 820 48.90 1,258 44.83 7 57.14
9 Koksara 3,426 42.82 563 43.34 518 42.28 10 70.00
10 Lanjigarh 3,135 40.51 848 38.09 1,525 40.39 4 25.00
11 M. Rampur 2,152 44.89 378 45.50 858 43.01 4 75.00
12 Narla 4,302 46.79 1,011 44.91 1,061 46.94 2 50.00
13 Th. Rampur 3,829 40.72 1,242 44.12 2,046 38.81 2 0.00
14 Bhawanipatna [M] 1,650 44.97 325 48.31 145 49.66 41 46.34
15 Junagarh [NAC] 766 51.83 131 52.67 132 78.03 13 46.15
16 Kesinga [NAC] 809 43.14 167 45.51 113 41.59 6 50.00
Kalahandi 49,476 43.14 10,909 44.31 14,455 41.79 163 50.92Source: SSA Kalahandi
in the 6-11 year age group by blocks for the
year 2008-09. Out of the total enrolments in
the 6-11 year age group, the girls’ enrollments
have been above 90 percent. In some blocks,
for example Kalampur, the girls’ enrollment
was 49.67 percent out of total enrollments
in that block. In Junagarh and Kesinga NAC,
their enrollments were above 50 percent of
the total enrollments. On the other hand,
in tribal dominated Lanjigarh block, girls’
enrollment was lowest at 45.18 percent.
In the age group of 11-14 year, the Gross
Enrolment Ratio (GER) was 94.96 percent
and the Net Enrolment Ratio (NER) was 90.06
percent. These enrollments are lower than
those for 6-11 year age group. There are a
large number of children in age groups of
6-8 year and 8-11 year, who have not been
enrolled in schools. The school drop-out
rates are highest among both boys and girls
in the age group of 11-14 years. Lanjigarh
block enrolled only 38.09 percentgirls,
whereas Junagarh NAC enrolled highest
52.67 percent girls in SC category. Junagarh
block enrolled lowest 37.20 percent ST girls.
Table 62 gives a status of girls’ enrollments in
11-14 year age group by block for 2008-09.
6.3 Addressing Gender Disparities
It may be argued that since gender is a social
construct, gender disparities also result
from social and economic processes. The
typical roles, work profiles, power relations,
differential access and control to resources
and opportunities, and entitlements for
men and women have resulted from deep
rooted social orientations. Mainstreaming
gender is both a technical and a political
process, and requires shifts in organisational
cultures and ways of thinking, as well
as in the goals, structures and resource
allocations. Mainstreaming requires
changes at different levels within institutions,
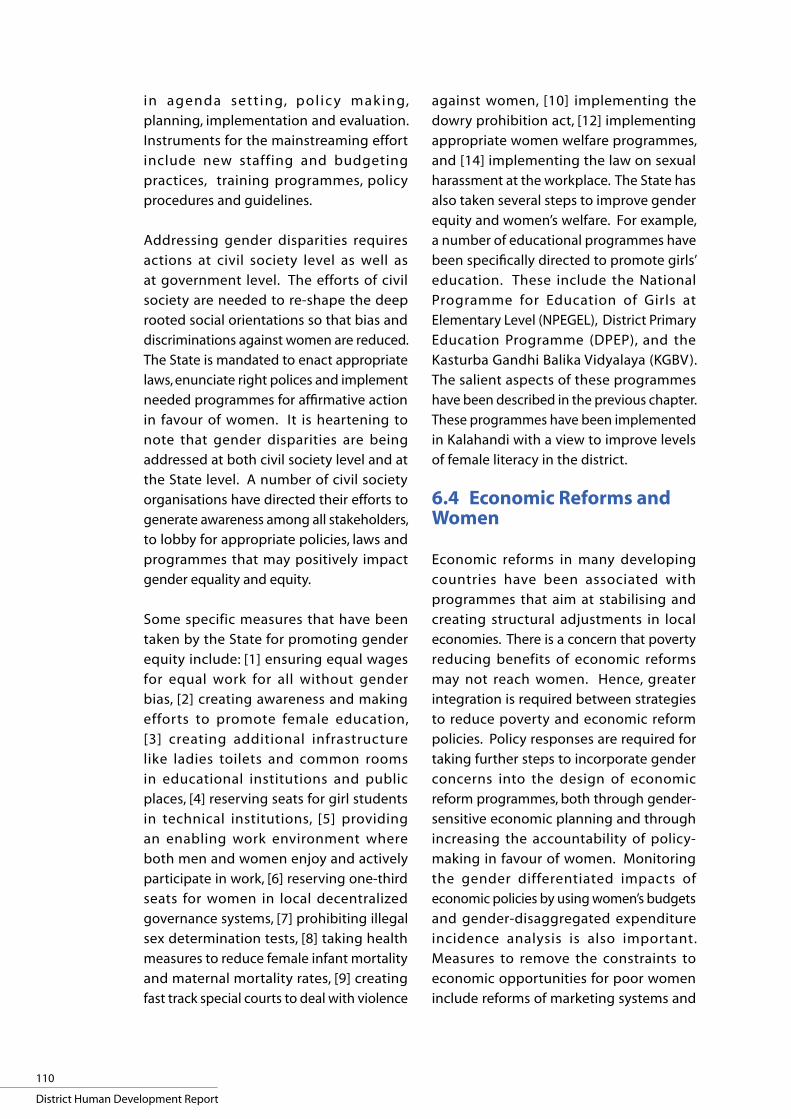
110
District Human Development Report
in agenda sett ing, pol ic y mak ing,
planning, implementation and evaluation.
Instruments for the mainstreaming effort
include new staffing and budgeting
practices, training programmes, policy
procedures and guidelines.
Addressing gender disparities requires
actions at civil society level as well as
at government level. The efforts of civil
society are needed to re-shape the deep
rooted social orientations so that bias and
discriminations against women are reduced.
The State is mandated to enact appropriate
laws, enunciate right polices and implement
needed programmes for affirmative action
in favour of women. It is heartening to
note that gender disparities are being
addressed at both civil society level and at
the State level. A number of civil society
organisations have directed their efforts to
generate awareness among all stakeholders,
to lobby for appropriate policies, laws and
programmes that may positively impact
gender equality and equity.
Some specific measures that have been
taken by the State for promoting gender
equity include: [1] ensuring equal wages
for equal work for all without gender
bias, [2] creating awareness and making
efforts to promote female education,
[3] creating additional infrastructure
like ladies toilets and common rooms
in educational institutions and public
places, [4] reserving seats for girl students
in technical institutions, [5] providing
an enabling work environment where
both men and women enjoy and actively
participate in work, [6] reserving one-third
seats for women in local decentralized
governance systems, [7] prohibiting illegal
sex determination tests, [8] taking health
measures to reduce female infant mortality
and maternal mortality rates, [9] creating
fast track special courts to deal with violence
against women, [10] implementing the
dowry prohibition act, [12] implementing
appropriate women welfare programmes,
and [14] implementing the law on sexual
harassment at the workplace. The State has
also taken several steps to improve gender
equity and women’s welfare. For example,
a number of educational programmes have
been specifically directed to promote girls’
education. These include the National
Programme for Education of Girls at
Elementary Level (NPEGEL), District Primary
Education Programme (DPEP), and the
Kasturba Gandhi Balika Vidyalaya (KGBV).
The salient aspects of these programmes
have been described in the previous chapter.
These programmes have been implemented
in Kalahandi with a view to improve levels
of female literacy in the district.
6.4 Economic Reforms and Women
Economic reforms in many developing
countries have been associated with
programmes that aim at stabilising and
creating structural adjustments in local
economies. There is a concern that poverty
reducing benefits of economic reforms
may not reach women. Hence, greater
integration is required between strategies
to reduce poverty and economic reform
policies. Policy responses are required for
taking further steps to incorporate gender
concerns into the design of economic
reform programmes, both through gender-
sensitive economic planning and through
increasing the accountability of policy-
making in favour of women. Monitoring
the gender differentiated impacts of
economic policies by using women’s budgets
and gender-disaggregated expenditure
incidence analysis is also important.
Measures to remove the constraints to
economic opportunities for poor women
include reforms of marketing systems and

111
Gender
infrastructure and of financial markets
and institutions. Reforms of social security
provisions are also needed to take account
of changes in household relations and
strengthening coping mechanisms of poor
people themselves.
Gender affects vulnerability to poverty
in periods of insecurity and women are
likely to find it more difficult to escape
poverty. Poor women may be particularly
vulnerable to deepening poverty under
adjustment. Any poverty reducing effect,
which adjustment may bring, e.g., through
renewed stimulus to small scale agriculture,
may not reach women directly, due to their
lack of command over productive resources
and control over outputs.
An inclusive economic reform programme is
likely to affect men and women differently.
First, economic reforms aimed at moving from
central planning to a market economy, are
associated with feminisation of employment.
Second, if women have less education than
men, the gender gap in labour earnings may
increase due to economic reforms. Third,
economic reforms, particularly downsizing
of the public sector, may also hurt women
more than men because the public sector
usually offers benefits that are highly valued
by women, such as maternity leave, more
flexible working hours, child care facilities,
as well as reservation of certain posts for
women. These types of benefits are less
common in the private sector and are
generally not offered in the informal sector.
Fourth, women are more likely than men to
withdraw from the organised labour force
after downsizing of the public sector during
economic reforms.
6.5 Women Welfare
Mission Shakti, a mission for empowerment
of women through Self Help Groups (SHG)
has been launched by the State in 2001.
This Mission works towards the formation
and strengthening of existing Self Help
Groups as well as organising new ones. Its
objectives are summarised in Box 5. As a part
of women’s empowerment every year new
SHGs have been formed in the district with
emphasis on uncovered areas. The Mission
is carrying out its mandate in collaboration
with a number of local NGOs. Apart from
that, formal financial institutions, Regional
Rural Banks and Micro Finance Institutions
are also in the process of promoting women
SHGs not only to achieve the mandate
1. To facilitate creation of conducive environment through Self Help act.2. To expand the Self Help Movement in Odisha and Kalahandi.3. To develop quality SHG in the State and district.4. To strengthen the quality of the existing SHG in Odisha.5. To build cluster association at block level, federation of clusters at the district level and
net work of federation at the state level.6. To provide institutional capacity building support to strengthen the SHG movement in
the state.7. Capacity building at every level in the state.8. developing a built-in monitoring system right from the SHG level9. Establishing and setting of a supportive MIS at every level.10. Identifying agencies in each area /region as nodal agency responsible for overall
SHG strengthening process and accountable for the desirable result to the Self Help Mission
Box 5: Objective of Mission Shakti
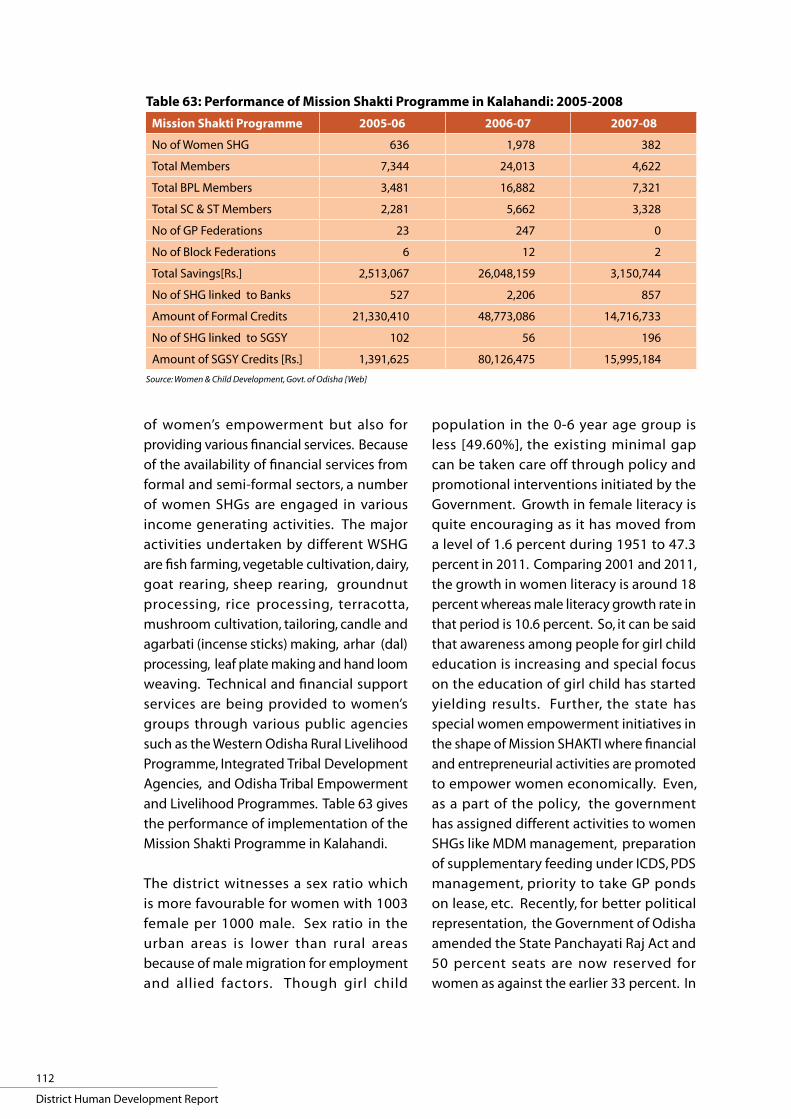
112
District Human Development Report
of women’s empowerment but also for
providing various financial services. Because
of the availability of financial services from
formal and semi-formal sectors, a number
of women SHGs are engaged in various
income generating activities. The major
activities undertaken by different WSHG
are fish farming, vegetable cultivation, dairy,
goat rearing, sheep rearing, groundnut
processing, rice processing, terracotta,
mushroom cultivation, tailoring, candle and
agarbati (incense sticks) making, arhar (dal)
processing, leaf plate making and hand loom
weaving. Technical and financial support
services are being provided to women’s
groups through various public agencies
such as the Western Odisha Rural Livelihood
Programme, Integrated Tribal Development
Agencies, and Odisha Tribal Empowerment
and Livelihood Programmes. Table 63 gives
the performance of implementation of the
Mission Shakti Programme in Kalahandi.
The district witnesses a sex ratio which
is more favourable for women with 1003
female per 1000 male. Sex ratio in the
urban areas is lower than rural areas
because of male migration for employment
and allied factors. Though girl child
population in the 0-6 year age group is
less [49.60%], the existing minimal gap
can be taken care off through policy and
promotional interventions initiated by the
Government. Growth in female literacy is
quite encouraging as it has moved from
a level of 1.6 percent during 1951 to 47.3
percent in 2011. Comparing 2001 and 2011,
the growth in women literacy is around 18
percent whereas male literacy growth rate in
that period is 10.6 percent. So, it can be said
that awareness among people for girl child
education is increasing and special focus
on the education of girl child has started
yielding results. Further, the state has
special women empowerment initiatives in
the shape of Mission SHAKTI where financial
and entrepreneurial activities are promoted
to empower women economically. Even,
as a part of the policy, the government
has assigned different activities to women
SHGs like MDM management, preparation
of supplementary feeding under ICDS, PDS
management, priority to take GP ponds
on lease, etc. Recently, for better political
representation, the Government of Odisha
amended the State Panchayati Raj Act and
50 percent seats are now reserved for
women as against the earlier 33 percent. In
Table 63: Performance of Mission Shakti Programme in Kalahandi: 2005-2008Mission Shakti Programme 2005-06 2006-07 2007-08
No of Women SHG 636 1,978 382
Total Members 7,344 24,013 4,622
Total BPL Members 3,481 16,882 7,321
Total SC & ST Members 2,281 5,662 3,328
No of GP Federations 23 247 0
No of Block Federations 6 12 2
Total Savings[Rs.] 2,513,067 26,048,159 3,150,744
No of SHG linked to Banks 527 2,206 857
Amount of Formal Credits 21,330,410 48,773,086 14,716,733
No of SHG linked to SGSY 102 56 196
Amount of SGSY Credits [Rs.] 1,391,625 80,126,475 15,995,184
Source: Women & Child Development, Govt. of Odisha [Web]

113
Gender
- • -
the health sector, there has been substantial
focus on adolescent and maternal health
care including minimisation of maternal
death rate. In the work participation front,
percentage of women as main workers
is still less than that of males due to
various reasons including their domestic
engagement. But with the increment
in educational standards and acquiring
employable skill (imparted through
vocational education), it is expected that
their participation will increase. Overall,
it can be concluded that with improved
achievement in women empowerment
areas, the district is moving in the right
direction to meet the MDG target.
This chapter has analysed some dimensions
of gender disparities by observing the
declining sex ratio over time. Though the
overall sex ratio in Kalahandi is still favourable,
the sex ratio for the 0-6 year age group of
the population has, however, considerably
worsened. This chapter has also noted
disparities in work opportunities, wage rates,
literacy rates and several other aspects. The
State and various civil society organisations
have made concerted efforts to address
gender disparities, particularly in the arena
of literacy, income opportunities and dignity
for women in all facets of life. The focus of
this report shifts to natural calamities in the
district, which are studied in the next chapter.


Natural Calamities
Chapter 7
"Mata bhumih putro aham prithivyaha"- The Earth is our mother and we are her children
Atharva Veda


117
Odisha has been prone to natural calamities,
i.e., calamities triggered by natural factors
such as cyclones, droughts, and floods. More
recently, abnormally high temperatures
have also been included to this list. These
are being attributed to increasing ecological
imbalance and climate change. The term
“disaster” has been defined by the United
Nations as “a serious disruption of the
functioning of a society, causing widespread
human, material or environmental losses,
which exceed the ability of the affected
society to cope using its own resources”17.
Natural disasters are those disasters,
including droughts, floods and cyclones that
a society finds difficult to deal with on their
own. Natural disasters cause heavy losses of
human lives and property and pose serious
environmental threats.
Kalahandi is susceptible to natural calamities
like drought and floods. In addition, the
district is also affected by heat waves and
outbursts of epidemics in some parts. Some
droughts, floods and other calamities may be
classified as disasters. This chapter discusses
occurrences of droughts and floods that
have affected the district. The last section is
17 See Odisha Human Development Report 2004
Natural Calamities

118
District Human Development Report
devoted to efforts made to deal with these
natural calamities.
7.1 Droughts in Kalahandi
Kalahandi's more than 100 years tryst with
drought is also a chronicle of the destruction
of a sustainable and participatory ecology.
Deforestation and collapse of the traditional
tank irrigation has increased the dryness of
this area. Kalahandi receives a good amount
of rainfall, but rainwater is not harvested
properly as tanks are silted. A slight shortfall
in rainfall triggers drought and causes large-
scale crop failure. So agriculture is a difficult
prospect for survival of more than 50 percent
population of the district.
Kalahandi has witnessed a large number
of droughts and other natural calamities
over centuries. For example, droughts had
occurred in Kalahandi in 1868, 1884 and
1897. Several droughts could be considered
disasters. The district was severely affected
by the famine of 1899, which is also described
as “Chhapan Sal ra Durbhikshya” that is a
famine of severity not witnessed during the
preceding fifty-six years. The effects of the
famine, according to the District Gazetteers,
were of unprecedented nature and left a
terrible human tragedy and brittle socio-
economic fabric in this area. The severity
of this famine still haunts the memory of
many people in the district. There was rain
deficiency of 60 percent and crop losses were
estimated to be 50 percent. It reportedly cost
the district Rs 642.89 crore. In 1919-20, there
occurred another drought that was followed
by cholera, influenza and severe malnutrition
due to lack of foodstuff. Thereafter, a series of
droughts were witnessed during 1922-1923,
1925-1926, 1929-1930 1954-1955, 1955-56,
1965-66, 1974-75 and 1985.
The economic and social impacts of these
droughts and floods on the people of
Kalahandi have been very severe. The
Kalahandi District Gazetteer has recorded
the impact of the 1965-66 drought as follows:
“The bulk of the population which constituted
the landless agricultural labourers became
unemployed due to suspension of all sorts of
agricultural operations. The worst sufferers
were landed families, who, because of the
drought, neither could reap a harvest nor
could they take up manual labour to which
they were not accustomed. The pastures
lost the greenery and the bovine population
therefore was equally starved. Everywhere
there was an acute shortage of water.” After
the severe droughts of 1955-56 and 1965-
66, a large number of cultivators suffered
heavy economic losses. The Directorate of
Economics and Statistics, Odisha has analysed
the rainfall of South Western Kalahandi and
has reported that on an average there is a
drought year in every 3-4 years.
The impact of droughts in the district is of
varied nature affecting either the entire
district or few blocks. For example, the
drought of 1996-97 affected 85 percent
blocks, 63 percent gram panchayats and
46 percent villages of the district. In 2000-
01, drought affected 62 percent blocks, 50
percent gram panchayats and 27 percent
villages. Table 64 gives the occurrence
and severity of some recent droughts from
1998 to 2006 and analyses the intensity and
spread of 17 droughts from 1996 to 2006.
Some areas, for example, a large portion
of Bhawanipatna sub-division has been
identified as a chronic drought prone zone.
7.2 Floods in Kalahandi
Floods which were earlier not common
in Kalahandi have become a common
occurrence. In recent years, the district has
also become prone to flash floods, caused
by heavy rainfall. Table 65 looks at the
occurrence and intensity of floods in the

119
Natural Calamities
district during the last ten years. Thirteen
floods occurred in different parts of the
district from 2000 onwards. In 2000 and
2006, floods of mild intensity affected two
blocks of Dharamgarh and Golmunda. In
2001, Junagarh block was severely affected
by floods though losses of crops and
property were not significant. The floods
of 2004 affected three blocks of the district,
i.e., Dharamgarh, Golmunda and Kalampur.
The crop losses in different blocks varied
from 43 percent to 70 percent. The floods of
2007 affected three blocks of the district, i.e.,
Golmunda, Junagarh and Koksara and caused
crop losses varying from 50 percent to 70
percent. The floods of 2004, 2006 and 2007
also affected more than 70 percent families of
farmers and caused heavy mortality of cattle
and other animals. Table 65 also indicates
increasing frequency of floods, particularly
in Dharamgarh, Golmunda and Junagarh
blocks.
7.3 Climate Change
Though the impacts of global warming and
climate change have not been systematically
studied at district level in Odisha, some
effects of global warming and climate
change are being already experienced. For
example, the State and the district witnessed
very high temperatures in 1999 and 2009.
Annual rainfalls have also become erratic
over the years and the period of rainfall
appears to be shifting from June-September
to July-October. Drought-like situations are
being witnessed with more frequency. This
has been affecting farmers and other poor
whose livelihoods are adversely affected.
If temperatures rise by two percent as the
climate change experts have projected, soil
moisture regimes shall further worsen. This
would impact very adversely the livelihoods
of famers, agriculture labourers and other
poor and would also increase poverty.
Table 64: Occurrence and Severity of Droughts in Kalahandi by blocks: 1998-2006Sl. No.
Block Occurrence of Drought
Year Severity Crop Area Affected (%)
Farm Families Affected (%)
1 Bhawanipatna Drought 2002 S 41 56
2 Kesinga Drought 2002 S 45 62
3 Th. Rampur Drought 2002 M 31 40
4 Narla Drought 2002 S 44 52
5 M. Rampur Drought 2002 S 40 48
6 Karlamunda Drought 2002 S 60 73
7 Lanjigarh Drought 2002 S 24 32
8 Koksara Drought 2002 VS 79 100
9 Koksara Drought 2006 S 34 100
10 Junagarh Drought 1998 VS 45 20
11 Junagarh Drought 2000 S 25 20
12 Junagarh Drought 2002 VS 40 18
13 Jaipatna Drought 2003 M 35 28
14 Dharamgarh Drought 2005 M 49 53
15 Kalampur Drought 1998 VS 42 15
16 Kalampur Drought 2000 S 25 15
17 Golamunda Drought 2005 M 60 65
Note: VS-Very Severe, S-Severe, M-Mild Severity
Source: DRDA, Kalahandi and Meteorological information

120
District Human Development Report
7.4 Disaster Management
A disaster management strategy includes
emergency operations, relief and rehabilitation
measures, health services support, and repair
and reconstruction of infrastructure facilities.
Since floods have become a common calamity
in the district, disaster management activities
have become expensive.
Kalahandi receives rainfall of 1,200 mm. Its
forest cover that was once 67 percent has
reduced drastically due to various factors.
Many denuded hills and barren areas add
to acceleration of flow of rain water. As a
result, top soil erosion has become a serious
concern of this region. Deforestation
also silts up tanks and reduces their
irrigation potential. This in turn affects the
productivity of agricultural fields. Every
year, five to 10 percent agricultural land
is covered by soil from high lands and
soil erosion is estimated to be 48 metric
tons per ha in the district. According to a
study conducted by the district authorities,
Kalahandi loses Rs. 8,473 crore each year due
to loss of natural bio-fertilizers and Rs 8,000
crore due to soil erosion.
With a view to arresting the adverse impacts
of droughts and floods in the district, stress
is being given on minor irrigation, crop
diversification, soil and water conservation
and comprehensive watershed development
programmes including rainwater harvesting.
A number of drought proofing measures
have been undertaken under various
programmes including Long Term Action
Plan (LTAP) for the KBK districts of which
Kalahandi is a part. Other main programmes
that are implemented in Kalahandi following
the watershed development plus approach
are Western Odisha Rural Livelihood
Programme (WORLP) and Odisha Tribal
Empowerment and Livelihood Programme
(OTELP). Such programmes include creation
of water harvesting structures, undertaking
other watershed development measures,
construction of irrigation structures and
systems, subsidy for installation of irrigation
structures and other measures. These
measures are aimed at: (i) massive soil and
Table 65: Occurrence and Severity of Floods in Kalahandi by Blocks: 2000-2007Sl. No.
Block Occurrence of Flood
Year Severity Crop Area Affected(%)
Livestock Mortality (No.)
Farm Families Affected (%)
1 Koksara Flood 2007 S 50 NA NA
2 Junagarh Flood 2001 S 8 23 15
3 Junagarh Flood 2007 S 7 NA 5
4 Dharamgarh Flood 2000 M 35 102 40
5 Dharamgarh Flood 2004 S 68 248 72
6 Dharamgarh Flood 2006 M 30 NA 45
7 Dharamgarh Flood 2007 S 70 206 72
8 Kalampur Flood 2004 S 43 NA 16
9 Kalampur Flood 2007 S 28 NA 15
10 Golamunda Flood 2000 M 50 100 46
11 Golamunda Flood 2004 S 70 265 70
12 Golamunda Flood 2006 M 30 NA 78
13 Golamunda Flood 2007 S 66 245 70
Note: S-Severe, M-Mild, NA- Not Available
Source: DRDA, Kalahandi and Meteorological data

121
Natural Calamities
water conservation measures to improve
substantially soil moisture regime, (ii)
developing natural resource base with a
view to increasing livelihood options, and (iii)
creating awareness among rural people and
building their coping capacities to better deal
with natural calamities and expected adverse
impacts of climate change. These measures
are implemented in close co-operation with,
and active participation of, local people and
Panchayati Raj Institutions (PRIs).
This chapter has studied the nature, extent
and intensity of natural calamities that affect
Kalahandi district such as droughts, floods
and flash floods. Some aspects of climate
change that are likely to impact Kalahandi
have also been briefly discussed. The last
section has described some measures that
have made a part of the overall development
strategy for this backward district for its
accelerated development and to deal with
adverse impacts of natural calamities. It
is, therefore, desirable that the strengths
and weaknesses of local governance
institutions are also examined. The next
chapter, therefore, discusses decentralised
governance.
- • -


Decentralised Governance
Chapter 8
“Before you start some work, always ask yourself three questions-Why am I doing it? What the results might be? and Will I be successful? Only when you think deeply and find satisfactory answers to these questions, go ahead.”
Chanakya
“Before you start some work, always ask yourself three questions-Why am I doing it? What the results might be? and Will I be successful? Only when you think deeply and find satisfactory answers to these questions, go ahead.”
Chanakya


125
The 73rd and 74th amendments of the
Constitution of India mandate major reforms
in local level governance institutions for
both rural and urban areas at district and
sub-district levels. The amendments provide
for a three tier Panchayati Raj System at the
village, intermediate and district levels. The
73rd amendment thus envisages the Gram
Sabha as the foundation of the Panchayat
Raj System. Panchayati Raj Institutions (PRIs)
are the vehicles of socio-economic and
political empowerment of the people at the
grass root level for shaping their own destiny
and transformation in rural India. The 74th
amendment has made similar provisions for
strengthening Urban Local Bodies (ULBs) as
institutions of local governance. Effective and
meaningful functioning of these bodies would
depend on active involvement, contribution
and participation of its citizens both male
and female. The aim of every village being
a republic and panchayats having powers
has been translated into reality with the
introduction of the three-tier Panchayati Raj
System to enlist people’s participation in rural
reconstruction. The structure of local level
institutions for both rural and urban areas of
Kalahandi is depicted in Figure 17.
Figure 17: Structure of rural & urban Local Bodies in Kalahandi
District-Kalahandi
RLB ULB
Zila-Parishad President
1 Municipality Chairman
2 NACs Chairman
13 Blocks Panchayat Samiti-Chairman
Wards Wards
273 Gram Panchayat Sarpanch (2099 Villages)
Decentralised Governance

126
District Human Development Report
8.1 Zilla Parishad
In line with the 73rd and 74th Constitutional
amendments,Odisha has adopted the
three tier system of local governance in
Kalahandi and other districts. The district
level institution is called Zilla Parishad
(ZP). At the block level, the second tier
of the panchayati system, the Panchayat
Samiti (PS), is also an elected body. At the
village level, that is the third level of the
panchayati system, there is the institution
of the Gram Panchayat (GP). Similarly, there
are urban local bodies for administering
municipalities or notified area councils,
which have elected representatives. One
third of the seats in every tier are reserved
for women.
The Kalahandi Zilla Parishad (ZP) at the
district level has 36 elected representatives,
out of which 66.7 percent are males and 33.3
percent female as per the reservation norms.
The ZP has constituted various standing
committees to support planning and
implementation of different development
and governance activities. The chairperson
of a standing committee is elected by, and
from among, the elected members of the ZP.
Different standing committees of the ZP deal
with subject matters assigned to them. The
chairpersons of various panchayat samities of
the district are members of the ZP by virtue
of their official positions in PS. Moreover, all
Members of Parliament (MP) and Members of
the Legislative Assembly (MLA) of the district
are also ex-officio members of the ZP. The
District Magistrate and Collector, Kalahandi
is the Executive Officer of the ZP. Various
development works carried out at the
village, gram panchayat, block and district
level are planned and monitored by the ZP.
The ZP at the district level is responsible
for development and welfare works carried
out through different budget sources. The
ZP also supervises the works of panchayat
samities as well as gram panchayats within
its operational scope. Figure 18 shows the
membership profile of the ZP.
8.2 Panchayat Samities
The district has 13 Panchayat Samities (PSs),
one for each block. A Panchayat Samiti is
headed by a Chairperson, duly elected in
the prescribed manner. Each PS consists of
elected and official members. The official
members are the Block Development
Officer, who is also the Executive Officer
of PS, and other officers, representing
various state government departments at
PS level. The elected members include the
elected Panchayat Samiti Members and the
Sarpanches of Gram Panchayats of the block.
The chairperson is elected directly by the PS
members in the prescribed manner. Table
66 provides a profile of membership of PS
by blocks in Kalahandi.
The total strength of a Panchayat Samiti varies
by block depending upon a number of factors
like number of GPs, villages and population
of the block. Bhawanipatna and Junagarh
blocks have very large number 33 and 32
members respectively in their PS whereas
Kalampur and Karlamunda have nine and 12
members in their PS. Out of 273 members of
all PS, 94 are women (34.5%). The proportion Source: Census, 1901-2001, DES Projections for 2008*
Figure 18: Membership Profile of Kalahandi ZP
100
80
60
40
20
0SC
% of Female % of Male
ST OBC UR
Perc
enta
ge
ZP members Status of Kalahandi District
Caste
33.3
66.7
63.6
60
77.8
36.4 40
.0
22.2

127
Decentralised Governance
of male members is 65.5 percent. The main
functions of the Panchayat Samiti include
planning, execution and supervision of various
developmental programmes in the block. It
also supervises the works of gram Panchayats
within its jurisdiction.
8.3 Gram Panchayats
A Gram Panchayat (GP) is the primary unit
of the Panchayati Raj Institution. Kalahandi
has 273 gram panchayats, each of which
has a number of revenue villages and
hamlets under its jurisdiction. The election
of the Sarpanch, Naib Sarpanch and Ward
Members are conducted in the prescribed
manner as per the provisions of the Odisha
Panchayat Election Rules which also provide
for reservation for women for posts of
sarpanches and naib sarpanches.
Table 67 gives a profile of sarpanches of 273
GPs in the district. Out of 273 sarpanches, 66
percent are male and 34 percent are female.
Female sarpanch position is to some extent
attributed to the provision of reservation of
one-third seats for women. Out of 180 male
sarpanches, 22 are SC, 64 ST and 41 Other
Backward Castes (OBC). The remaining 53
are unreserved and open for all castes. Out
of 93 women sarpanches, 17 are SC, 39 ST, 26
OBC and 11 unreserved for general castes.
Each GP is divided into a prescribed number
of wards depending upon the population
and number of villages covered. The ward
representatives are called ward members
and also elected in the prescribed manner.
The district has in all 3,377 ward members in
273 GPs, of which 37.55 percent are female
and the remaining 62.45 percent are male.
Table 68 provides a profile of ward members
by block, gender and social classes. The
highest number of 409 ward members is in
Bhawanipatna block and the lowest number
of 113 ward members is in Kalampur block.
Of 2,109 male ward members, 310 are SC, 643
ST, 520 OBC and 636 unreserved. Of 1,268
female ward members, 290 are SC, 459 ST,
343 OBC and 176 unreserved.
Table 66: A Profile of Membership of Panchayat Samities in KalahandiBLOCK A PROFILE OF MEMBERSHIP OF PS BY GENDER & SOCIAL CLASSES Total PS
Members(No.)
Total Men
Social Category Total Women
Social Category
SC ST OBC UR SC ST OBC UR
Bhawanipatna 22 4 8 6 4 11 2 4 3 2 33
Dharamgarh 14 2 2 4 6 7 2 2 2 1 21
Golamunda 16 2 4 4 6 8 2 2 3 1 24
Jaipatna 12 2 4 3 3 6 1 3 2 0 18
Junagarh 21 3 4 6 8 11 2 2 3 4 32
Kalampur 6 0 1 2 3 3 1 1 1 0 9
Karlamunda 8 1 1 2 4 4 1 1 2 0 12
Kesinga 17 2 4 4 7 9 2 3 3 1 26
Koksara 13 2 4 4 3 7 1 3 2 1 20
Lanjigarh 13 3 8 2 0 8 2 4 2 0 21
M. Rampur 10 1 4 2 3 5 1 2 2 0 15
Narla 17 3 4 4 6 9 2 3 3 1 26
Th. Rampur 10 2 6 2 0 6 2 3 1 0 16
Total 179 27 54 45 53 94 21 33 29 11 273Note: ST – Scheduled Tribes, SC – Scheduled Castes, OBC – Other Backward Castes, UR – Unreserved
Source: District Panchayat Office, Kalahandi

128
District Human Development Report
Table 67: A Profile of Sarpanches of Gram Panchayats by Block in KalahandiBLOCK A profile of sarpanches of gp by gender & social classes Total
Sarpanch(Number)Total
MenSocial Category Total
WomenSocial Category
SC ST OBC UR SC ST OBC UR
Bhawanipatna 22 4 8 6 4 11 2 4 3 2 33
Dharamgarh 14 2 2 4 6 7 2 2 2 1 21
Golamunda 16 2 4 4 6 8 2 2 3 1 24
Jaipatna 12 2 4 3 3 6 1 3 2 0 18
Junagarh 21 3 4 6 8 11 2 2 3 4 32
Kalampur 6 0 1 2 3 3 1 1 1 0 9
Karlamunda 8 1 1 2 4 4 1 1 2 0 12
Kesinga 17 2 4 4 7 9 2 3 3 1 26
Koksara 13 2 4 4 3 7 1 3 2 1 20
Lanjigarh 14 0 14 0 0 7 0 7 0 0 21
M. Rampur 10 1 4 2 3 5 1 2 2 0 15
Narla 17 3 4 4 6 9 2 3 3 1 26
Th. Rampur 10 0 10 0 0 6 0 6 0 0 16
Total 180 22 64 41 53 93 17 39 26 11 273Note: ST – Scheduled Tribes, SC – Scheduled Castes, OBC – Other Backward Castes, UR – Unreserved
Source: District Panchayat Office, Kalahandi
Table 68: A Profile of Ward Members of all GP by Block, Gender and Social ClassesBLOCK A profile of ward members of GP by gender & social classes Total
Ward MemberTotal
MenSocial Category Total No.
of WomenSocial Category
SC ST OBC UR SC ST OBC UR
Bhawanipatna 253 43 90 60 60 156 35 62 48 11 409
Dharamgarh 181 31 29 52 69 101 22 24 25 30 282
Golamunda 182 22 40 48 72 101 24 31 28 18 283
Jaipatna 162 20 59 40 43 93 19 41 27 6 255
Junagarh 232 29 36 63 104 140 32 38 37 33 372
Kalampur 73 11 16 19 27 40 9 13 12 6 113
Karlamunda 91 11 8 24 48 52 12 13 15 12 143
Kesinga 196 19 45 53 79 109 26 36 29 18 305
Koksara 151 21 50 41 39 92 20 36 28 8 243
Lanjigarh 152 34 95 22 1 106 24 59 23 0 258
M. Rampur 122 13 48 34 27 75 15 26 18 16 197
Narla 201 29 51 54 67 121 30 36 37 18 322
Th. Rampur 113 27 76 10 0 82 22 44 16 0 195
District Total 2,109 310 643 520 636 1,268 290 459 343 176 3,377
Note: ST – Scheduled Tribes, SC – Scheduled Castes, OBC – Other Backward Castes, UR – Unreserved
Source: District Panchayat Office, Kalahandi

129
Decentralised Governance
8.4 Empowering Panchayati Raj Institutions
The State Panchayati Raj Department has
made concerted efforts to ensure that the
prescribed functions, functionaries and
funds are transferred by the concerned
state departments to PRIs so that they are
enabled to successfully discharge their
constitutional responsibilities. The State
also appoints from time to time the State
Finance Commission to devise modalities
for devolution of untied funds to PRIs at
different levels and urban local bodies. The
Central Finance Commission also earmarks
funds to be devolved to rural and urban
local bodies. In addition, a number of
development programmes such as National
Rural Employment Guarantee Scheme
(NREGS) are being directly implemented by
PRIs in a prescribed manner.
8.5 District Planning Committee, Kalahandi
PRIs and Urban Local Bodies (ULBs) have
also been mandated to prepare and
consolidate District Plans by incorporating
development plans prepared at district and
sub-district levels. In accordance with the
73rd and 74th Constitutional Amendments
and Article 243 ZD of the Constitution of
India, District Planning Committee (DPC)
has been formulated in each district for
preparation and consolidation of District
Plans. Eighty percent of their members are
elected in the prescribed manner out of
the elected members of the Zilla Parishad
and Urban Local Bodies in proportion
to the rural and urban population of
the district. The remaining 20 percent
members are nominated by the state
government. The DPC for Kalahandi has
already been constituted. District Plans
have been prepared since 2008-09 in a
participatory and consultative manner
and have been approved by the Kalahandi
DPC. The State Government has earmarked
about 35 percent of Plan funds to district
sector schemes. Such earmarked funds
are required to be distributed by the
line departments to different districts in
accordance with well defined criteria. The
DPC has also been mandated to monitor
programme implementation.
PRIs in Kalahandi are nascent institutions
and therefore face several constraints. The
major constraints are that some elected
representatives are uneducated and have no
or limited awareness of functioning of various
public institutions, policies and development
programmes. There is generally no or limited
secretarial support to PRIs at GP level. ZP
also has a limited secretarial support. The
secretariat support is, however, available
at PS level. The State has taken a number
of initiatives to strengthen PRIs. Massive
training programmes have been conceived
and are being implemented through the
State Institute of Rural Development (SIRD)
and other agencies. With support from UNDP,
the State has implemented Project Dakshyta
to strengthen the training capacities of the
State institutions to build PRI capacity. The
State has also provided secretarial support
to PRIs at GP level. The Panchayat Secretary
and Gram Sahayak have been already made
available to GPs to extend secretarial support
to them.
This chapter gives a brief account of
structure, composition and functions of
Panchayati Raj Institutions at various levels.
PRIs are being strengthened as institutions
of local governance. The State has taken
steps to transfer functions, functionaries and
funds to PRIs and build their capacities for
local governance and development planning.
The District Planning Committee has also
been constituted to prepare and consolidate
district plans for development.
- • -


131
Way Forward
Way ForwardChapter 9
Way ForwardChapter 9
"It's not what if, it's what now."
- Unknown


133
Way Forward
Kalahandi is a part of the KBK region
(Koraput-Bolangir-Kalahandi region) and was
perceived as one of the most backward and
underdeveloped districts of Odisha. The State
Government has made concerted efforts to
accelerate the development process in the
KBK region including Kalahandi district. The
Government of India has also supported
the initiatives of the State. The Long Term
Action Plan that was launched in 1995-96
was substantially revised and scaled up in
1998-99. The Biju KBK Plan was launched in
the year 2006-07. Some central development
programmes such as Backward Regions
Grant Fund (BRGF), Integrated Action Plan,
Mahatma Gandhi National Rural Employment
Guarantee Scheme (MGNREGS), Pradhan
Mantri’s Gram Sadak Yojana (PMGSY) and
others have also been implemented in the
district. As a result, the development process
in the district has been expedited and human
development indicators have substantially
improved in recent years. However, the
district still faces several challenges. Human
development indicators of the district are
still far below the State averages. There are
acute gender, regional and social disparities
within the district. Greater efforts are,
therefore, needed to further improve human
development indicators of the district and to
bridge the gender, social and regional gaps.
The district has very limited livelihood
opportunities. The district economy is
dominated by the primary sector, agriculture
and forests being main sources of sustenance.
About 80 percent households still depend
on agriculture and allied sectors for their
livelihoods. The real gross district domestic
product (GDDP) has grown at a very slow rate
of 2.68 percent per annum and the real per
capita annual income has increased at 1.27
percent. It is no wonder that the incidence
of poverty in the district was very high at

134
District Human Development Report
62.7 percent as per the 1997 BPL census.
Though the cropping intensity at about 160
percent is higher than the State average,
the average land-holding is only 1.62 ha per
household and about 76 percent farming
families are marginal and small farmers. Land
distribution in the district is skewed. About
0.68 percent large farmers own 6.31 percent
land, their average per household land-
holding being 14.93 ha. Farm productivity
is generally low. Indebtedness is very high,
particularly among rural ST and SC families.
Migration including distress migration out of
the district is also very high. About one-fifth
families migrate out of district to seek regular
wage income. It is heartening to note that
programmes such as MGNREGS and RLTAP
have very positively impacted the district and
the extent of poverty has come down in the
last ten years. However, greater efforts are
required to improve livelihood and income
generating opportunities for the local
people within the district. A massive drive
is needed to retrain people and to improve
their employable skills. Farmers need to be
exposed to improved agronomic practices
and new ways to supplement their incomes
from allied activities such as dairy farming,
fishing, poultry and other activities. The
district economy needs to be diversified
and expanded at rates much higher than
the current ones. Some suggestions for
improving livelihoods from the agriculture
sector are summarised in Box 6.
• Planning better land use at village / gram panchayat level keeping land types and capabilities in
view and using participatory micro planning exercises.
• Using available fallow / barren lands for remunerative agro-forestry / economic tree based crops.
• Strengthening the support infrastructure like assured irrigation facilities through check dams, deep
borewells, massive efforts directed at watershed development plus programmes, construction of
water channels, canals, market yards, and rural godowns.
• Altering the situation by making agriculture remunerative through enhanced productivity, product
value additions at cluster level, infrastructure and marketing support, farm mechanisation, application
of scientific knowledge and package of practices, improving farmers knowledge base, popularising
agro-enterprises, revamping / introducing GP level input supply systems, easy availability of credit
for farmers and others engaged in agro-enterprises.
• Promoting agri-research for improving indigenous varieties, organic ways of cultivation and transfer
of appropriate technology to agriculture and post-harvest technology.
• Promoting animal husbandry as a viable source of income and nutrition through improved genetic
stock, improved livestock management practices, promoting animal husbandry as commercial
enterprise, insurance coverage and timely credit support.
• Promoting fishery as income generating and nutrition improving activity through de-silting /
renovation of tanks, improved seeds and hatcheries, dry fish processing units, cold chain systems.
• Adding value to non-timber forest products to become a major source of livelihood for forest
dependent families, infrastructure support for storage and further add value, minimum support
prices, scientific practices for NTFP collection, processing and storage and discouraging destructive
practices such as cutting of trees for NTFP collection.
• Supporting micro and small scale enterprises such as agro-processing and other similar value
addition activities, encouraging private investment.
• Enhancing employable skills of, and creating more employment opportunities for, the people.
Box 6: Way Forward: Livelihoods

135
Way Forward
The district has recorded significant
improvements in terms of health
infrastructure and people’s reach to various
health services. There is visible improvement
in various health indicators. The district has
made good progress in controlling leprosy
and malaria and reducing infant mortality
and maternal mortality rates. However,
large number of vacancies of doctors and
paramedical staff are a serious challenge
and needs to be effectively addressed. The
intra-district disparities in the status of health
services and access to health services by
social and gender classes are still very high
and needs be taken care off in a time bound
manner. The State intervention of mobile
health units has proved very beneficial in
reaching out to patients in interior pockets.
This intervention need to be further scaled
up. Better quality of health services and
increased outreach through mobile health
units is expected to go a long way in
improving health indicators in the district.
Continuous efforts are needed to encourage
people, particularly pregnant women to
avail public healthcare facilities and resort
to institutional deliveries. Awareness
programmes may also be taken up to
encourage more and more people to avail
modern healthcare services. Box 7 enlists
some suggestions to further improve health
services in the district.
Though the district literacy has increased
substantially from a mere 6.3 percent in
1951 to 60.2 percent in 2011, the literacy
levels are below the State averages. There
is 13.3 percentage points gap. The male
literacy at 73.34 percent is 9.1 percentage
points less than the State male literacy in
2011. The female literacy at 47.3 percent is
17.1 percentage points lower than the State
female literacy in 2011. The literacy levels of
ST and SC communities are even lower than
those for the general classes within the district.
There are also wide variations in literacy levels
across blocks. These gaps need to be bridged
expeditiously.
It is heartening to note that the State
Government has established 100-seated
hostels for ST and SC girls. This measure is
• Reducing patient load per doctor by way of appointing and retaining doctors and
paramedical staff in remote rural pockets.
• Creating more residential clusters and improving facilities for doctors and paramedical
staff in remote areas of the district.
• Appropriate policy measures to improve incentives, and fair and effective transfer
policy, for doctors and paramedical staff to encourage them to stay in rural areas.
• Substantially augmenting public and private investments in the healthcare sector.
• Improving healthcare facilities in existing health institutions
• Special healthcare measures in scheduled blocks which are dominated by ST and SC
communities.
• Regular capacity building and motivational inputs for making ANM and ASHA more
effective.
• Social marketing of family planning instruments.
• Health care management services in community participation mode and in associa-
tion with private bodies.
• Effective implementation of medical waste management at PHC and CHC levels.
Box 7: Way Forward: Public Healthcare Services

136
District Human Development Report
in the right direction and would improve
female ST and SC literacy levels.
Though educational infrastructure in the
district has improved significantly in recent
years, there is, however, need to improve
basic amenities like drinking water supply,
electricity, toilets, desks, chairs and other
facilities. Quality of education is also a
major challenge and need to be addressed
quickly. The district has limited number of
ITI / vocational training facilities, which are
needed to improve technical education in
the district. Inculcating employable skills in
students at various stages would go a long
way in making them productive citizens of the
State. Box 8 summarises some suggestions
to further improve education in the district.
The district is deficient in infrastructure. The
road connectivity needs to be improved
substantially. With a view to ensuring all
weather connectivity, unconnected villages
and habitations should be connected to
growth and service centres through culverts,
causeways, and bridges. All habitations
should have safe drinking water supply. The
villages and habitations which have not yet
been electrified need to be electrified soon.
Irrigation facilities should be augmented in
a time bound manner. It is heartening to
note that the State Government has given
a very high priority to bijli (energy), sadak
(road connectivity) and pani (water supply
and irrigation) and has been allocating
higher funds to improve infrastructure. It is
hoped that infrastructure in the district shall
improve considerably. This will link villages to
growth and service centres and help propel
rural growth.
The district is prone to droughts and flash
floods and should, therefore, continue
to focus on comprehensive watershed
development programmes to deal effectively
with such natural calamities. Kalahandi’s
forests are in process of degradation due
to various reasons. There is a need to
improve the forest cover and density with
active support from local people. The
State Government has conceived a Climate
Change Action Plan and Green Odisha
programme. These initiatives need be
effectively implemented in the district.
Kalahandi looks forward to be one of the
developed districts. The State Government
with support from Government of India
has made concerted efforts for expeditious
development of the district. However, the
key is how effectively such development
programmes are implemented at local
level. This calls for an effective monitoring
and evaluation mechanism so that desired
outcomes of different development
programmes are better realised.
- • -
• Special focus on tribal girls’ education.
• Improving teacher-student ratio.
• Required number of classrooms with joyful learning environment
• Provisioning basic facilities in schools like separate girls’ toilets, drinking water sup-
ply, electricity and other amenities.
• Strengthening Village Education Committees and making teachers and parents
functionally accountable
• Residential facilities for teachers and staff in interior pockets
• Output based planning by schools and its effective monitoring.
• Involving PRI in monitoring the school educational process
Box 8: Way Forward: education

Annexures


139
In order to understand the human
development situation and to make it a
measuring tool for future development,
the Government of Odisha’s Planning
and Coordination Department initiated
the preparation of the District Human
Development Report (DHDR) as the second
level of mapping of human development
after the State human development
situation analysis. In association with
UNDP, this Department has initiated the
process for preparing DHDR by engaging
different. Technical Support Institutions
[TSIs]. This initiative is in line with earlier
experiences in other states such as West
Bengal. The Government of Odisha
has taken this initiative to analyse and
understand disaggregated picture of human
development at the district level.
0.1 Approach And Process
In Kalahandi, the approach followed was
basically consultative and participatory
in nature. Emphasis was laid upon both
qualitative and quantitative dimensions of
the district human development situation.
The process adopted was multi-fold in
nature and encompassed organising
consultative meetings, collection of primary
and secondary information, information
triangulation and other activities. Review
of secondary literature provided a detailed
insight into the overall situation in the
district. Apart from this consultation,
meetings were organised with the Planning
& Coordination Department, and UNDP on
methodology and approaches, with other
Government agencies and local PRI bodies
in addition to discussions with academicians,
and community level interactions. During
the process of collection and analysis of
data and preparation of the report, different
matters having district importance were
discussed with PRI members, district level
government departments, local extension
workers and community members.
0.2 Methodology, Tools and Techniques
Purposive stratified random sampling
method was adopted for collection of
primary data. The sampling frame covered
all 13 blocks of the district and 10 percent
GPs in each block were selected on a
random basis. All villages of the identified
28 sampled GP were covered for the purpose
of collecting primary and secondary data.
Primary data was collected from village and
household level while secondary data was
collected from GPs and extension wings
of various line departments such as ICDS,
Health, Agriculture and other district level
offices.
In order to capture data at primary and
secondary levels, structured and semi-
structured formats were designed keeping
in mind the overall objective of mapping the
district human development situation. Three
tools were executed: household schedule,
guideline for Focus Group Discussions
(FGDs) and a format for secondary data
and response recording. The last helped in
capturing statistical backups on various areas
of human development.
The household information tool examined
various dimensions of human development
indicators at family level. Components
covered included: [1] Family background
Annexure 1
Approach, Process and Methodology
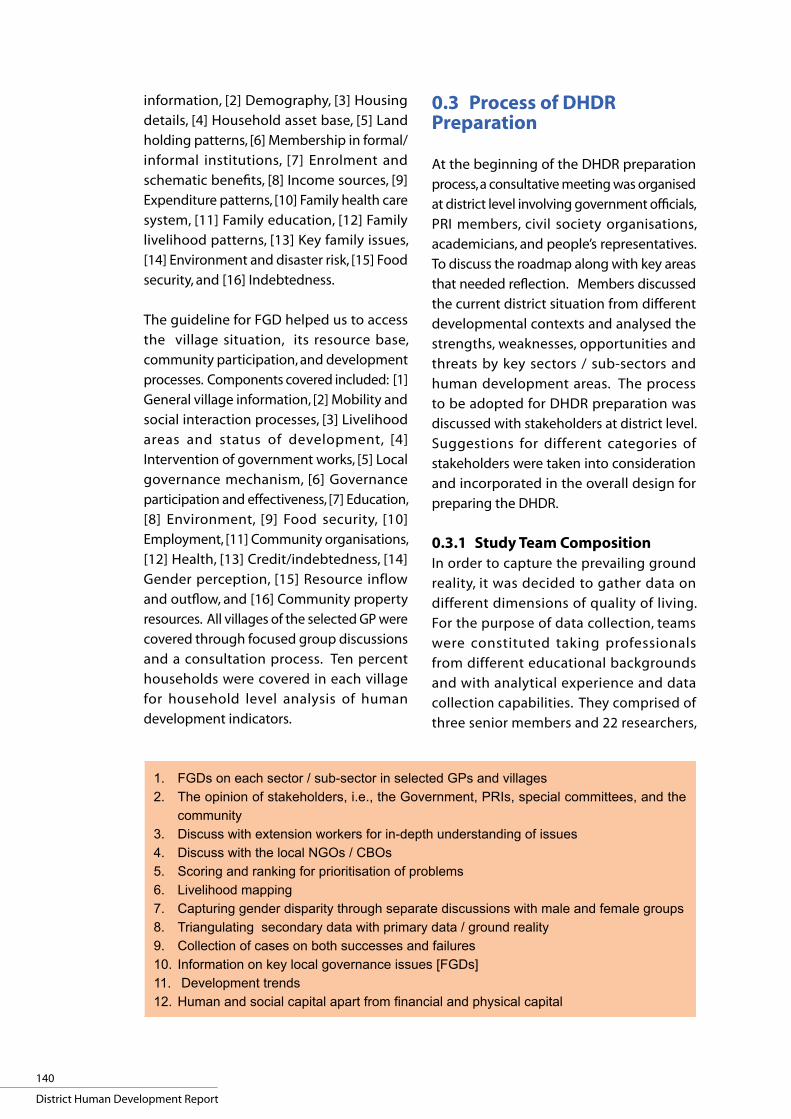
140
District Human Development Report
information, [2] Demography, [3] Housing
details, [4] Household asset base, [5] Land
holding patterns, [6] Membership in formal/
informal institutions, [7] Enrolment and
schematic benefits, [8] Income sources, [9]
Expenditure patterns, [10] Family health care
system, [11] Family education, [12] Family
livelihood patterns, [13] Key family issues,
[14] Environment and disaster risk, [15] Food
security, and [16] Indebtedness.
The guideline for FGD helped us to access
the village situation, its resource base,
community participation, and development
processes. Components covered included: [1]
General village information, [2] Mobility and
social interaction processes, [3] Livelihood
areas and status of development, [4]
Intervention of government works, [5] Local
governance mechanism, [6] Governance
participation and effectiveness, [7] Education,
[8] Environment, [9] Food security, [10]
Employment, [11] Community organisations,
[12] Health, [13] Credit/indebtedness, [14]
Gender perception, [15] Resource inflow
and outflow, and [16] Community property
resources. All villages of the selected GP were
covered through focused group discussions
and a consultation process. Ten percent
households were covered in each village
for household level analysis of human
development indicators.
0.3 Process of DHDR Preparation
At the beginning of the DHDR preparation
process, a consultative meeting was organised
at district level involving government officials,
PRI members, civil society organisations,
academicians, and people’s representatives.
To discuss the roadmap along with key areas
that needed reflection. Members discussed
the current district situation from different
developmental contexts and analysed the
strengths, weaknesses, opportunities and
threats by key sectors / sub-sectors and
human development areas. The process
to be adopted for DHDR preparation was
discussed with stakeholders at district level.
Suggestions for different categories of
stakeholders were taken into consideration
and incorporated in the overall design for
preparing the DHDR.
0.3.1 Study Team CompositionIn order to capture the prevailing ground
reality, it was decided to gather data on
different dimensions of quality of living.
For the purpose of data collection, teams
were constituted taking professionals
from different educational backgrounds
and with analytical experience and data
collection capabilities. They comprised of
three senior members and 22 researchers,
1. FGds on each sector / sub-sector in selected GPs and villages2. The opinion of stakeholders, i.e., the Government, PRIs, special committees, and the
community3. discuss with extension workers for in-depth understanding of issues4. discuss with the local NGOs / CBOs5. Scoring and ranking for prioritisation of problems6. Livelihood mapping7. Capturing gender disparity through separate discussions with male and female groups8. Triangulating secondary data with primary data / ground reality9. Collection of cases on both successes and failures10. Information on key local governance issues [FGds]11. development trends12.Humanandsocialcapitalapartfromfinancialandphysicalcapital

141
Annexures
who were directly associated with the
process of data collection and were
placed at the district level. Members were
oriented and acquainted with the process
of DHDR preparation, data collection,
quality check and consultative procedures
to be adopted. Different aspects of human
development were discussed in detail with
standardised benchmarks and quality
indicators. In this contexts, state and
district perspectives were also discussed
with the team members.
0.3.2 Collection of DataThe process of primary and secondary data
collection was taken up in a participatory
mode adopting suitable methodologies like
meetings with PRI members, consultations
with other stakeholders and focused group
discussions with the community. The latter
were organised separately with female
groups and common community members,
i.e., in each village, two FGDs were organised.
In total, 102 FGD each were organised with
both male and female groups. Household
data creates immense scope of arriving
at a conclusion with respect to certain
dimensions of human development. A total
of 10 percent of household samples were
collected from each village from the sample
GPs and blocks. A total of 2,074 households
were, therefore, covered in the process. All
primary data gathered from various sources,
was scrutinised for analysis. The semi-
structured FGD formats were compiled by
different parameters.
- • -

142
District Human Development Report
[PAHELI Findings]
Total HH refers to the total no. of households surveyed in the district.
All other numbers in boxes represent the % of total households surveyed.
I. LIFE & LIVELIHOOD
Adult women were asked questions regarding the household.
Sets of clothing owned by the woman of the house
Total HH 2 or fewer More than 2 sets
588 43.5 56.5
Type of house
Total HH No house Kutcha Semi-Pucca Pucca
597 1.5 55.3 34.2 9
Source of household fuel for cooking food
Total HH Firewood Coal Kerosene Gas
597 90.6 8.3 0.3 0.8
Ownership of animals for the household
Total HH No animal Goat Cow Others
494 52.8 6.5 30.4 10.3
Assets owned
Total HH Yes No
511 77.5 22.5
Loans & Types of Loans
Total HH With any kind of loan
Of families with loans, those with bank loan
596 57.0 19.5
Use of iodized salt during cooking
Total HH Iodine No Iodine
558 74.7 25.3
Migration
Total HH HH who did not migrate
582 76.3
District Human Development Report Card
Annexure 2
In Percent
In Percent
In Percent
In Percent
In Percent
In Percent
In Percent
In Percent
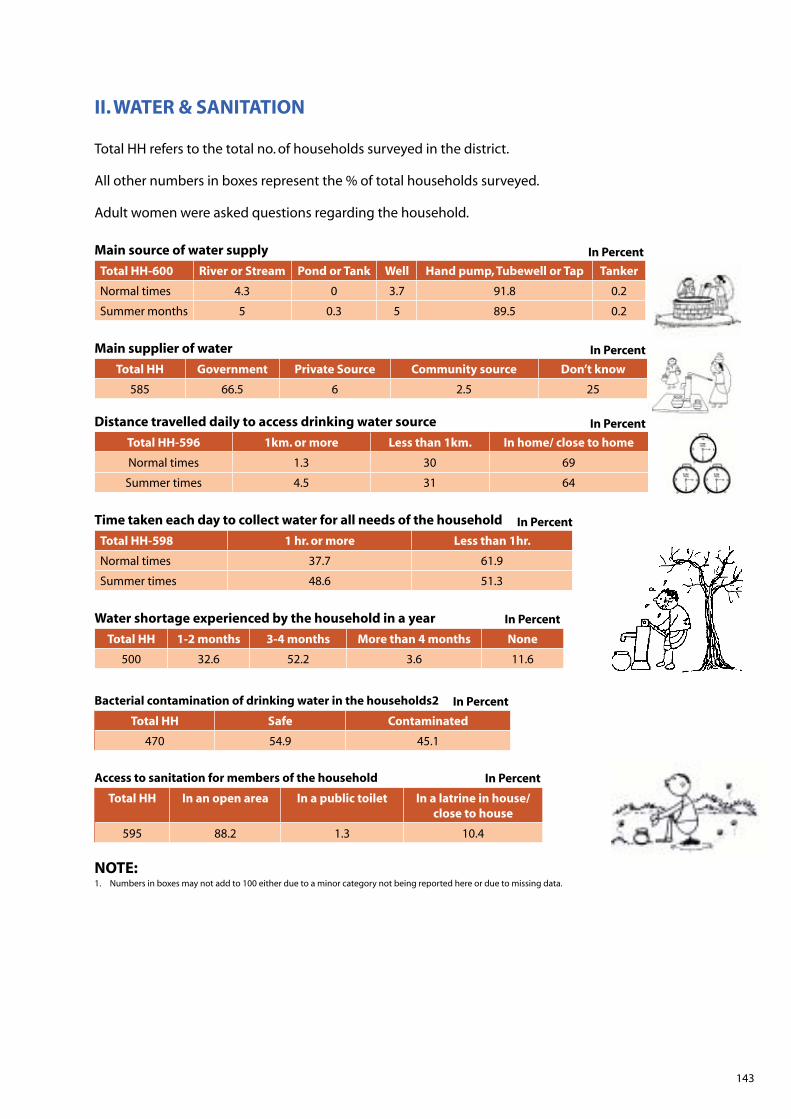
143
II. WATER & SANITATION
Total HH refers to the total no. of households surveyed in the district.
All other numbers in boxes represent the % of total households surveyed.
Adult women were asked questions regarding the household.
Main source of water supply
Total HH-600 River or Stream Pond or Tank Well Hand pump, Tubewell or Tap Tanker
Normal times 4.3 0 3.7 91.8 0.2
Summer months 5 0.3 5 89.5 0.2
Main supplier of water
Total HH Government Private Source Community source Don’t know
585 66.5 6 2.5 25
Distance travelled daily to access drinking water source
Total HH-596 1km. or more Less than 1km. In home/ close to home
Normal times 1.3 30 69
Summer times 4.5 31 64
Time taken each day to collect water for all needs of the household
Total HH-598 1 hr. or more Less than 1hr.
Normal times 37.7 61.9
Summer times 48.6 51.3
Water shortage experienced by the household in a year
Total HH 1-2 months 3-4 months More than 4 months None
500 32.6 52.2 3.6 11.6
Bacterial contamination of drinking water in the households2
Total HH Safe Contaminated
470 54.9 45.1
Access to sanitation for members of the household
Total HH In an open area In a public toilet In a latrine in house/close to house
595 88.2 1.3 10.4
NOTE:1. Numbers in boxes may not add to 100 either due to a minor category not being reported here or due to missing data.
In Percent
In Percent
In Percent
In Percent
In Percent
In Percent
In Percent

144
District Human Development Report
III. HEALTH: MOTHER & CHILD
Total refers to the children and mothers surveyed in district.
All other numbers in boxes represent the % of the total referred to in the above sentence.
Mothers were asked these questions.
Intake of Iron tablets while pregnant
Total Mothers Yes No Don’t know
228 90.8 8.8 0.4
Minimum of one Pre-natal check up undertaken
Total Mothers Yes No
195 72.5 27.5
Birth place of child
Total children At home In govt. hospital In Pvt. hospital
232 52.2 44.8 3
Child visited by a health worker one month prior to the survey
Total children Yes No
198 76.3 23.7
Babies breastfed colostrums
Total children Yes No
217 83.4 16.6
Commencement of regular breast feeding practices for the child
Total children First day Second day After two days
222 87.4 88.3 87.5
Breast feed given to child for the first 6 months
Total children Yes No
49 47.1 52.9
Number of months after birth child is given solid foods
Total children 0-6 months 0-9months After 10 months
153 52.9 37.2 36.6
In Percent
In Percent
In Percent
In Percent
In Percent
In Percent
In Percent
In Percent

145
Annexures
Child immunisation card
Total children Yes No
210 91.4 8.6
Child suffering from diarrhoea one month prior to survey
Total children Diarrhoea No diarrhoea
203 59.1 37.4
ORS treatment
Of children who had diarrhoea, those which were treated with ORS 78.8
Adult Nourishment based on height and weight
Total Below normal Normal Above normal
Men-357 13.4 42.6 44
Women-355 22.8 42.2 34.9
NOTE:1. Numbers in boxes may not add to 100 either due to a minor category not being reported here or due
to missing data.
In Percent
In Percent
In Percent
In Percent
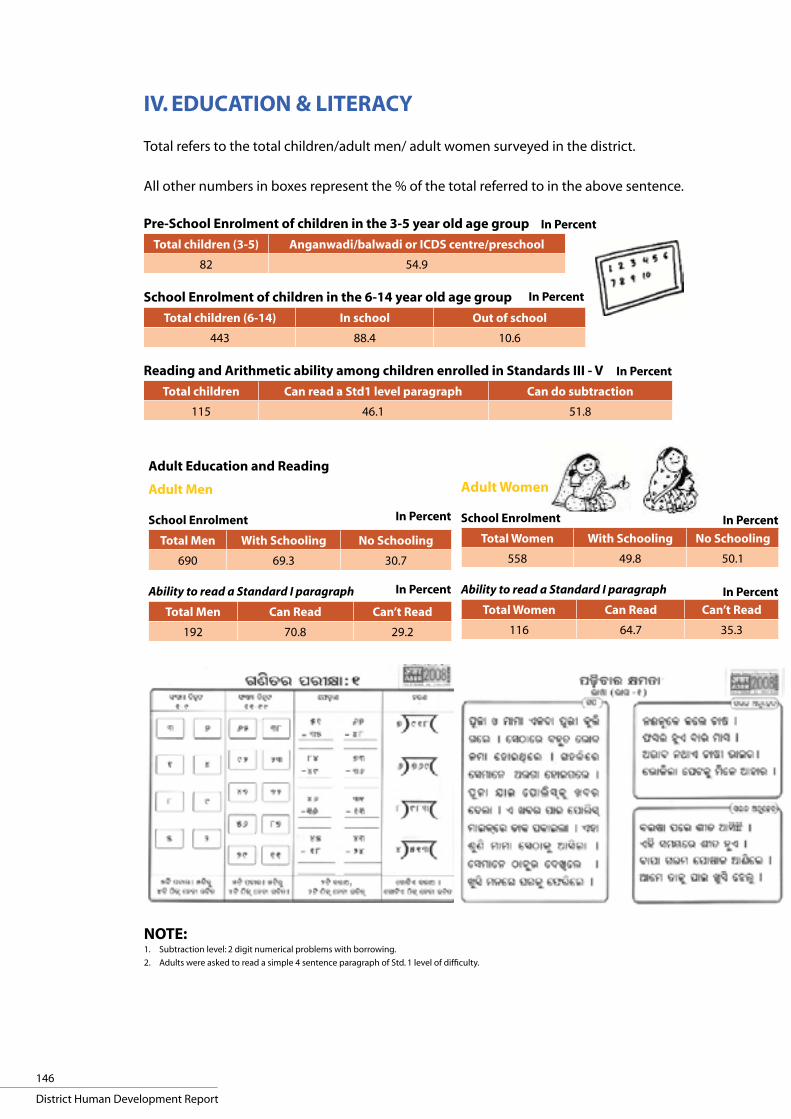
146
District Human Development Report
IV. EDUCATION & LITERACY
Total refers to the total children/adult men/ adult women surveyed in the district.
All other numbers in boxes represent the % of the total referred to in the above sentence.
Pre-School Enrolment of children in the 3-5 year old age group
Total children (3-5) Anganwadi/balwadi or ICDS centre/preschool
82 54.9
School Enrolment of children in the 6-14 year old age group
Total children (6-14) In school Out of school
443 88.4 10.6
Reading and Arithmetic ability among children enrolled in Standards III - V
Total children Can read a Std1 level paragraph Can do subtraction
115 46.1 51.8
Adult Education and Reading
Adult Men
School Enrolment
Total Men With Schooling No Schooling
690 69.3 30.7
Ability to read a Standard I paragraph
Total Men Can Read Can’t Read
192 70.8 29.2
Adult Women
School Enrolment
Total Women With Schooling No Schooling
558 49.8 50.1
Ability to read a Standard I paragraph
Total Women Can Read Can’t Read
116 64.7 35.3
NOTE:1. Subtraction level: 2 digit numerical problems with borrowing.
2. Adults were asked to read a simple 4 sentence paragraph of Std. 1 level of difficulty.
In Percent
In Percent
In Percent
In Percent
In Percent
In Percent
In Percent

147
Annexures
V. VILLAGES OF THE DISTRICT
Total villages visited: 30.
All figures represent the total number of villages surveyed
This section is based on observations by the survey team and on responsesfrom member of the Panchayat.
Access to electricity Presence of electricity at the time of the survey
Yes No Yes No
70 30 57 43
Transport related facilities
Villages with Yes No
Tar Road 27 73
Bus Stop 10 90
Communication related facilities
Villages with Yes No
Post Office 40 60
Few Cell Phones 37 63
STD Booth 23 77
Internet Access 7 93
Other facilities
Villages with Yes No
Bank 10 90
PDS Shop 13 87
Education related facilities
Villages with Yes No
Private Primary School 50 50
Government Primary School 7 93
Government Middle School 63 37
Government Secondary School 30 70
Private Secondary School 10 90
Medical related facili ties
Villages with Yes No
Medicine Shop 10 90
Ambulance 7 93
Government Hospital 10 90
Private Doctor 23 77
Private Hospital 10 90
National Schemes
Villages with Exists Does not exist
Sampoorna Gramina Rozgar Yojana 40 60
Indira Awas Yojana 50 50
Pradhan Mantri Gram Sadak Yojana 27 73
In Percent
In Percent
In Percent
In Percent
In Percent
In Percent

148
District Human Development Report
As, the district of Kalahandi is a part of the
KBK region of the State, the district receives
special assistance from both central and
state Governments for development of the
people and district. Being a BRGF district, it
received additional central assistance apart
from RLTAP and other schemes. Details of
funds receipt and expenditure are reflected
in Table 69 by year and departments. As is
evident, there was significant growth in the
fund receipt situation at the district level
during 2008-09 in comparison to 2007-08, i.e.,
a growth of 32.82 percent. But fund receipt
situation during 2007-08 in comparison to
2006-07 was comparatively poor. Annual
expenditure percentage to total annual
receipt has been comparatively low during
2008-09 (63.48%) while during 2004-05 to
2006-07 it was more than 90 percent and
during 2007-08, the fund utilisation was more
than 85 percent of the receipt. So, in most years,
fund utilisation rate remained good. This has
helped to improve the status of the district in
different human development spheres.
Sector-wise Funds Flow
Annexure 3
Table 69: Sector Wise Funds Flow in KalahandiSl. No. Departments 2004-2005 2005-2006 2006-2007 2007-2008 2008-2009
Amt Received in Lakh
Expenditure in Lakh
Amt Received in Lakh
Expenditure in Lakh
Amt Received in Lakh
Expendi- ture in Lakh
Amt Received in Lakh
Expendi- ture in Lakh
Amt Received in Lakh
Expendi- ture in Lakh
1 Lift Irrigation NA NA NA NA 304.36 304.36 129.94 129.94 170.28 93.220
2 Sericulture NA NA NA NA 59.62 50.64 38.58 35.14 45.61 39.41181
3 SSA NA NA NA NA 543.66 554.56 649.80 420.96 450.71 425.493
4 Text tile NA NA NA NA 15.22 15.22 0.00 0.00 26.55 12.400
5 DRCS NA NA NA NA 20.44 17.38 20.93 20.54 32.36 29.66570
6 Agriculture NA NA NA NA 165.32 146.69 160.87 134.56 262.89 221.5502
7 Municipality Bhpatna NA NA NA NA 263.35 218.74 269.21 249.36 237.89 223.54
8 EE R & B NA NA NA NA 1506.92 1506.92 2177.01 2177.01 2088.05 2088.05
9 Soil Conservation NA NA NA NA 144.96 144.96 150.51 150.51 223.25 223.25
10 T SC 421.92 6.69 42.55 14.71 0.64 98.65 0.00 203.35 820.30 41.70
11 GM DIC NA NA NA NA 2.71 2.71 4.34 4.18 19.60 8.59
12 CDVO NA NA NA NA 30.75 27.68 5.61 5.61 66.56 40.52
13 DFO South NA NA NA NA 319.31 319.31 248.78 248.78 253.46 253.46
14 ITDA NA NA NA NA 527.36 517.55 461.46 433.80 364.12 317.19
15 Watershed 754.59 672.53 1399.16 937.23 1273.51 1526.56 2373.11 2115.98 3952.70 3212.82
16 Ayurveda NA NA NA NA 6.08 6.08 2.13 2.13 2.75 2.75
17 Minor Irrigation NA NA NA NA 612.61 609.36 1028.95 855.00 1029.93 989.65
18 Irrigation Division NA NA NA NA 2419.56 2659.55 3865.65 3406.91 5349.49 4522.41
19 CDMO NA NA NA NA 943.28 872.94 792.20 751.88 1064.67 1009.77
20 DRDA 3691.79 3691.79 5427.15 5427.15 12084.79 12094.79 7514.10 6451.77 9664.35 3627.32
21 Dist Planning Office 8492.54 8463.50 12149.53 12122.25 26896.55 26750.20 5211.57 3985.10 7006.22 4009.72
22 DWO NA NA 18975.84 18486.63 44763.74 45037.03 21249.17 18002.57 28434.22 17691.62
Total 13360.84 12834.51 37994.24 36987.98 92904.73 93481.86 46353.91 39785.06 61565.96 39084.09
Growth NA NA 24633.40 NA 54910.49 NA -46550.82 NA 15212.05 NA
Growth % NA NA 184.37 NA 144.52 NA -50.11 NA 32.82 NA
Base Growth % NA NA 184.37 NA 595.35 NA 246.94 NA 360.79 NA
Exp % to Allot NA 96.06 NA 97.35 NA 100.62 NA 85.83 NA 63.48
Note: NA- Not Available

149
Annexures
Higher allocation and receipt of funds by
the district during 2006-07 is influenced by
a number of factors. Certain new schemes
were introduced and piloted / implemented
in the district along with a financial hike in
the current schemes based on the district
requirements. During the year, allocations
under Special Central Assistance under
Special KBK Plan implemented under District
Window on a pilot basis during 2006-07 in
Kalahandi resulted in extra flow of funds.
Government also launched a new initiative
called “Biju KBK Plan” under State Plan with
a view to augment funding for special
plan towards KBK districts. This Plan was
implemented during 2006-07 on pilot basis in
Kalahandi. Apart from that, during this year,
the district witnessed flash floods in major
rivers which caused 'widespread' damage. As
per the preliminary reports, 712 roads were
badly damaged, while breaches occurred at
593 bridges and culverts following heavy
rains triggered by a low pressure area over
the Bay of Bengal. A total of 9508 houses
including 932 Government buildings were
damaged, while 127 lift irrigation points and
77 minor irrigation projects were affected.
Similarly, initial reports said 8403 hectares of
farm land was affected due to sand casting
because of rivers like Tel, Hati, Udanti, Suktel
and others. Due to the devastating nature
of the flash flood, the district under different
departments received higher amount of fund
during 2006-07.
During the year 2006-07, the pilot project
National Nutrition Mission (NNM) was
launched in the district and provided 6 kg
of rice free of cost to adolescent girls whose
body weight was less than 35 kg and to
pregnant and lactating mothers whose
body weight was less than 40 kg. Similarly,
the district received additional allocations
during the year like that for development of
Sports Infrastructure.
Total allocation of funds to DRDA under
different schemes, including BRGF and
Table 70: Sector Wise Funds Flow in Kalahandi
DRDA, Kalahandi
Name of the Scheme
2004-2005 2005-2006 2006-2007 2007-2008 2008-2009
Allot (Rs in Lakh)
Exp. Allot (Rs in Lakh)
Exp. Allot (Rs in Lakh)
Exp. Allot (Rs in Lakh)
Exp. Allot (Rs in Lakh)
Exp.
SGSY NA NA NA NA 391.84 391.84 598.05 598.50 706.98 706.98
i IAY(NORMAL) 760.89 760.89 533.96 533.96 567.66 567.66 772.62 772.62 1103.71 1103.55
ii PMGY(GA) 14.77 14.77 NA NA NA NA NA NA NA NA
iii Mo-KUDIA NA NA NA NA NA NA NA NA 233.45 157.80
iv NFFW 1390.57 1390.57 1548.26 1548.26 NA NA NA NA NA NA
v NREGA NA NA 1548.25 1548.25 10825.29 10835.29 2750.00 2750.00 5559.57 505.01
vi BRGF NA NA NA NA NA NA 1698.00 1183.44 1129.00 912.23
vii Biju KBK NA NA NA NA 300.00 300.00 1695.44 1147.22 931.65 241.75
viii RLTAP 48.75 39.45 81.25 68.86 NA NA NA NA NA NA
ix SGRY 1525.56 1525.56 1796.69 1796.69 NA NA NA NA NA NA
Sub-Total 3740.54 3731.24 5508.40 5496.01 12084.79 12094.79 7514.10 6451.77 9664.35 3627.32
Ann. Growth NA NA 1767.86 1764.77 6576.39 6598.78 -4570.69 -5643.02 2150.25 -2824.45
Ann. Growth % NA NA 47.26 47.30 119.39 120.06 -37.82 -46.66 28.62 -43.78
Base Growth % NA NA 47.26 NA 223.08 NA 100.88 NA 158.37 NA
Exp % to Allot
NA 99.75 NA 99.78 NA 100.08 NA 85.86 NA 37.53
Note: NA- Not Available
Source: District Planning Office, Kalahandi

150
District Human Development Report
Table 71: Funds Flow in Watershed DevelopmentWatershed, Kalahandi
Name of the Scheme
2004-2005 2005-2006 2006-2007 2007-2008 2008-2009
Allot (Rs in Lakh)
Exp. Allot (Rs in Lakh)
Exp. Allot (Rs in Lakh)
Exp. Allot (Rs in Lakh)
Exp. Allot (Rs in Lakh)
Exp.
i DPAP-1st NA NA NA NA NA NA NA NA NA NA
ii DPAP-6th 60.66 30.75 20.26 59.34 25.00 43.97 NA 0.36 141.66 89.09
iii DPAP-7th 176.46 201.13 179.89 167.89 NA 55.40 NA 0.39 178.57 157.49
iv DPAP-8th NA 54.64 178.61 65.27 NA 112.87 NA 0.64 314.32 193.18
v DPAP-9th 45.00 168.50 300.13 203.55 59.56 145.12 NA 19.21 492.32 359.40
vi DPAP-10th 135.00 0.30 45.00 114.19 267.49 91.45 90.00 316.49 269.62 203.37
vii DPAP-11th NA NA 155.25 32.77 51.75 134.86 413.80 367.12 324.68 322.85
viii DPAP-12th NA NA NA NA 158.63 23.61 370.09 195.89 421.32 450.72
ix RLTAP 87.20 57.01 98.72 89.28 140.63 194.99 49.17 47.29 33.09 35.62
x Special plan RLTAP NA NA NA NA NA NA NA NA 50.00 8.18
xi WORLP 171.00 NA 256.50 77.27 427.50 599.95 598.50 665.97 684.00 389.00
xii WORLP (Phase-II) NA NA NA NA NA NA 761.30 366.36 888.13 868.57
S Total 754.59 672.53 1399.16 937.23 1273.51 1526.56 2373.11 2115.98 3952.70 3212.82
Growth NA NA 644.57 264.70 -125.65 589.33 1099.60 589.43 1579.58 1096.84
Growth % NA NA 85.42 39.36 -8.98 62.88 86.34 38.61 66.56 51.84
Base Growth % NA NA 85.42 NA 68.77 NA 214.49 NA 423.82 NA
Exp % to Allot NA 89.12 NA 66.99 NA 119.87 NA 89.16 NA 81.28
NREGA, shows an overall increasing trend
considering 2004-05 as the base year. But,
in total, amount of fund allocation during
2007-08 is comparatively lower than that of
2006-07. The fund utilisation pattern reflects
that till 2006-07, rate of fund utilisation to
allocation is more than 99 percent which
declined to around 85 percent during
2007-08. But during 2008-09, the rate of
funds utilisation is much below that of the
previous year which may be because
of non-receipt of funds in time by the
concerned departments.
Implementation of watershed projects, in an
integrated manner for the promotion of local
livelihood and environment, has been one
of the focus areas of the State Government.
A number of watershed projects are under
implementation in the district in feasible
areas. Overall, a positive growth trend is
marked in the funds flow under watershed
with an average utilisation of around 80
percent of the total allocation. Excluding
2006-07, where there is a slight decline in
the fund allocation, in most years, there is an
increasing funds flow situation. Expenditure
to allocation is more than 80 percent in most
of the years excluding 2005-06. The livelihood
component, under Western Odisha Rural
Livelihood Project (WORLP) has been of
immense support to the people of six blocks
because of its livelihood support frame. This
project provides entrepreneurial support to
the people in terms of capital fund, capacity
building, business management guidance
and business development services.
A number of schemes are under
implementation under social welfare like
old age pension, supplementary nutrition
programme, national family benefit scheme,
etc. Fund allocation, in total reflects a positive
growth trend till 2007-08 while during 2008-
09, the allocated amount was relatively less in
comparison to the previous year. But, during
the same year, expenditure is more than
100 percent to the allocation which means,
because surplus funds were available under
different scheme heads and attempts were
Note: NA- Not Available

151
Annexures
Table 72: Funds Flow to Social Welfare Dept. under Different SchemesName of the Department
Name of the Scheme
2005-2006 2006-2007 2007-2008 2008-2009
Allot (Rs in Lakh)
Exp. Allot (Rs in Lakh)
Exp. Allot (Rs in Lakh)
Exp. Allot (Rs in Lakh)
Exp.
Social Welfare, Kalahandi
i. NOAP 313.08 313.08 564.92 564.92 885.93 885.93 706.22 706.22
iii ODP 627.93 627.93 949.63 949.63 148.22 148.22 NA NA
iv MBPY NA NA NA NA NA NA 141.58 141.58
v EFP 366.59 366.59 366.60 366.60 381.30 381.30 NA NA
vi MDM 522.21 235.99 444.44 322.35 1287.89 610.48 659.70 1021.38
vii SNP NA NA 1280.82 1280.82 1866.21 1866.21 921.98 678.35
viii NFBS 15.40 15.40 46.35 46.35 47.30 47.30 42.40 42.40
Sub-Total 2375.78 2089.56 4713.89 4591.80 5677.99 5000.58 1812.18 2589.93
Growth 2338.11 2502.24 964.09 408.77 -3865.80 -2410.64
Growth % 98.41 119.75 20.45 8.90 -68.08 -48.21
Base Growth %
98.41 NA 138.99 NA -23.72 NA
Exp % to Allot
87.95 NA 97.41 NA 88.07 NA 142.92
Table 73: Funds flow to Lift Irrigation Dept.OLIC, Kala- handi
Name of the Scheme
2006-2007 2007-2008 2008-2009
Allot (Rs in Lakh)
Exp. Allot (Rs in Lakh)
Exp. Allot (Rs in Lakh)
Exp.
i RIDF/New 34 LI Point
214.20 214.20 NA NA NA NA
ii RLTAP/New LIP 83.16 83.16 NA NA NA NA
iii WODC/New LIP 01 No
7 7 NA NA NA NA
iv WODC/New LIP 3Nos
NA NA 26.50 26.50 NA NA
v WODC/Revival of 1 Defunct LIP
NA NA 3.44 3.44 NA NA
vi Biju KBK/Restoration of 50 No LIP
NA NA 100 100 NA NA
Vii ACA(BKVY)/New LIP 01 No
NA NA NA NA 8.28 2.57
Viii State Plan(BKVY)/ New LIP 18 No
NA NA NA NA 162.00 90.65
S Total 304.36 304.36 129.94 129.94 170.28 93.22
Growth -174.43 40.35
Growth % -57.31 31.05
Base Growth % -57.31 -44.05
Exp % to Allot 100 100 54.75
Note: NA- Not Available
Note: NA- Not Available

152
District Human Development Report
made to utilise available funds and further
allocation was restricted accordingly.
Lift Irrigation has been one of the supportive
irrigation systems in the district and special
funds are allocated under this head and
placed with Odisha Lift irrigation Corporation
(OLIC). During 2006-07, the amount of
allocation to the district was comparatively
higher than the subsequent years but funds
Table 74: Funds Flow for Sericulture Promotion in KalahandiSericulture Kalahandi
Name of the Scheme
2006-2007 2007-2008 2008-2009
Allot (Rs in Lakh)
Exp. Allot (Rs in Lakh)
Exp. Allot (Rs in Lakh)
Exp.
Staff Salary/Non- Plan
21.00 20.85 NA NA NA NA
i Catalic Division Scheme/ Central Plan
6 .00 5.51 NA NA NA NA
ii RLTAP/State Plan 24.24 15.00 NA NA NA NA
iii Promotion Seri Industries
9.00 9 .00 NA NA NA NA
iv Staff Salary/Non-Plan NA NA 24.51 24.25 NA NA
v CDS/CP NA NA 1.56 NA NA NA
vi Promotion Seri Industries /SS Of CSP
NA NA 8.76 7.14 NA NA
vii Promotion Seri Industries /SP
NA NA 3.75 3.75 NA NA
viii Staff Salary/Non-Plan NA NA NA NA 39.41 39.41
ix Catalic Division Scheme /Central Plan
NA NA NA NA 3.56 NA
x Promotion Seri Industries/ SS Of CSP
NA NA NA NA 2.32 NA
xi Promotion Seri Industries /SP
NA NA NA NA 0.32 NA
Sub-Total 59.61 50.64 38.59 35.14 45.61 39.41
Growth -21.03 7.02
Growth % -35.28 18.21
Base Growth % -35.28 -23.49
Exp % to Allot 84.94 91.08 86.41
flow figure reflects that during 2008-09, the
allocation has improved by 31.05 percent
as compared to the preceding year, i.e.,
2007-08 but expenditure was comparatively
lower than the previous years. Under lift
irrigation, measures are being taken not
only to install new LI points but also to
repair and restore the old LI points so that
more area can be covered under assured
irrigation.
Note: NA- Not Available

153
Annexures
Sericulture has been one of the promising
livelihood areas for the people of the district
but is confined to a few pockets like Th.
Rampur, M. Rampur and Lanjigarh. Though,
in comparison to major sectors, the amount
of allocation is comparatively less, 2008-09
fund allocation shows a increasing trend
in comparison to 2007-08. Overall, fund
allocation percentage is lower during 2007-08
and 2008-09. Expenditure to allocation is
more than 80 percent in the last three years
and spending is basically directed towards
establishing a cluster of sericulture and
building the capacity of the farmers with
support provision.
In the education sector, funds allocation
reflects an increasing trend during 2007-08 in
comparison to its preceding year but during
2008-09, fund allocation declined by 30.64
percent but rate of utilisation increased
from 64.78 percent to 94.41 percent. So, as
it appears, increased utilisation of available
funds was focused during 2008-09 rather
than increasing allocation as it happened
during 2007-08.
Table 75: Funds Flow to education Sector [DPeP], KalahandiDPEP Kalahandi
Name of the Scheme
2006-2007 2007-2008 2008-2009
Allot (Rs in Lakh)
Exp. Allot (Rs in Lakh)
Exp. Allot (Rs in Lakh)
Exp.
SSA 3004.90 2882.54 4218.98 3029.67 2677.01 3447.33
i NPEGL 411.81 422.61 442.00 267.73 NA 154.13
ii Kasturba Gandhi Valika Vidyalaya
131.85 131.96 207.80 153.23 450.71 271.36
Sub-Total 543.66 554.56 649.80 420.96 450.71 425.49
Growth 106.14 -199.09
Growth % 19.52 -30.64
Base Growth % 19.52 -17.10
Exp % to Allot 102.01 64.78 94.41
Table 76: Funds flow to Textile Sector, KalahandiTextiles Kalahandi
Name of the Scheme
2006-2007 2007-2008 2008-2009
Allot (Rs in Lakh)
Exp. Allot (Rs in Lakh)
Exp. Allot (Rs in Lakh)
Exp.
RLTAP(State Plan) 12.32 12.32 NA NA NA NA
i Flood Assistance
(Non-plan)
2.90 2.90 NA NA NA NA
ii POHI(Plan) NA NA NA NA 5.80 NA
Group Approach (plan) NA NA NA NA 8.35 NA
Work shed cum Housing (State
Plan)
NA NA NA NA 4.50 4.50
iii Dist Exhibition (Central Plan) NA NA NA NA 2.00 2.00
iv Flood Assistance (Non-plan) NA NA NA NA 5.90 5.90
Sub-Total 15.22 15.22 NA NA 26.55 12.40
Growth
Growth %
Base Growth %
Exp % to Allot 100 46.70
Note: NA- Not Available
Note: NA- Not Available
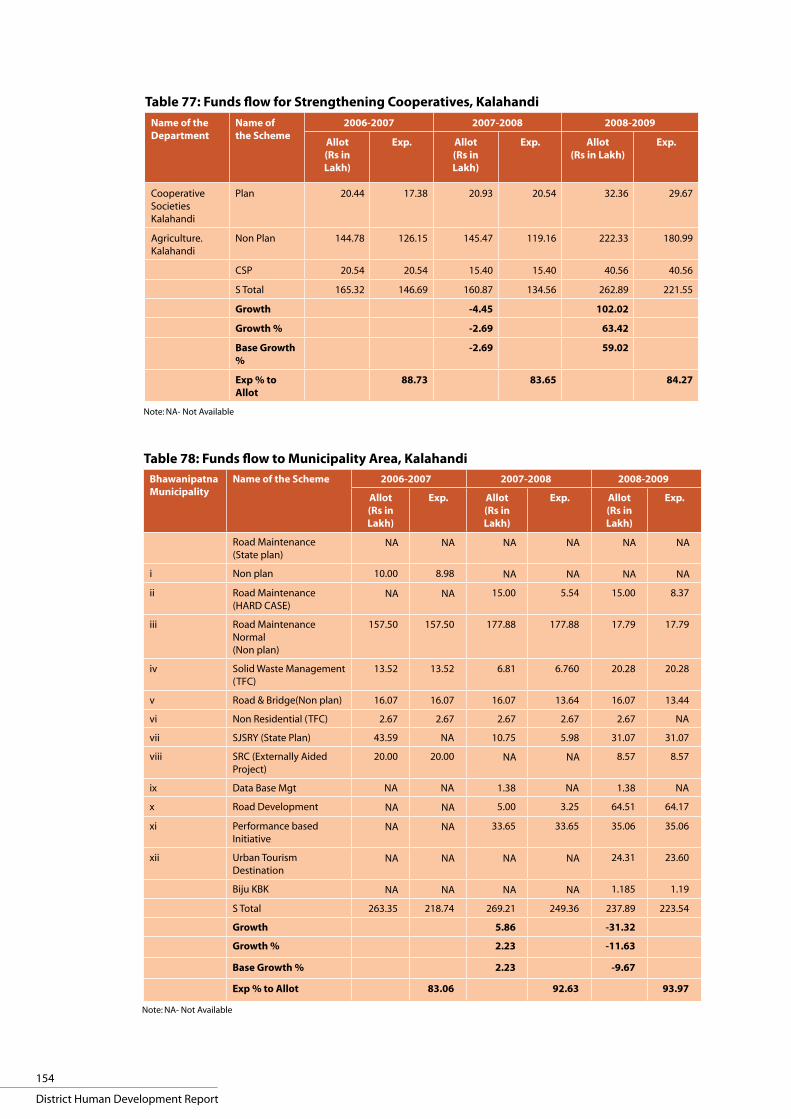
154
District Human Development Report
Table 77: Funds flow for Strengthening Cooperatives, KalahandiName of the Department
Name of the Scheme
2006-2007 2007-2008 2008-2009
Allot (Rs in Lakh)
Exp. Allot (Rs in Lakh)
Exp. Allot (Rs in Lakh)
Exp.
Cooperative Societies Kalahandi
Plan 20.44 17.38 20.93 20.54 32.36 29.67
Agriculture. Kalahandi
Non Plan 144.78 126.15 145.47 119.16 222.33 180.99
CSP 20.54 20.54 15.40 15.40 40.56 40.56
S Total 165.32 146.69 160.87 134.56 262.89 221.55
Growth -4.45 102.02
Growth % -2.69 63.42
Base Growth %
-2.69 59.02
Exp % to Allot
88.73 83.65 84.27
Note: NA- Not Available
Table 78: Funds flow to Municipality Area, KalahandiBhawanipatna Municipality
Name of the Scheme 2006-2007 2007-2008 2008-2009
Allot (Rs in Lakh)
Exp. Allot (Rs in Lakh)
Exp. Allot (Rs in Lakh)
Exp.
Road Maintenance (State plan)
NA NA NA NA NA NA
i Non plan 10.00 8.98 NA NA NA NA
ii Road Maintenance (HARD CASE)
NA NA 15.00 5.54 15.00 8.37
iii Road Maintenance Normal (Non plan)
157.50 157.50 177.88 177.88 17.79 17.79
iv Solid Waste Management (TFC)
13.52 13.52 6.81 6.760 20.28 20.28
v Road & Bridge(Non plan) 16.07 16.07 16.07 13.64 16.07 13.44
vi Non Residential (TFC) 2.67 2.67 2.67 2.67 2.67 NA
vii SJSRY (State Plan) 43.59 NA 10.75 5.98 31.07 31.07
viii SRC (Externally Aided Project)
20.00 20.00 NA NA 8.57 8.57
ix Data Base Mgt NA NA 1.38 NA 1.38 NA
x Road Development NA NA 5.00 3.25 64.51 64.17
xi Performance based Initiative
NA NA 33.65 33.65 35.06 35.06
xii Urban Tourism Destination
NA NA NA NA 24.31 23.60
Biju KBK NA NA NA NA 1.185 1.19
S Total 263.35 218.74 269.21 249.36 237.89 223.54
Growth 5.86 -31.32
Growth % 2.23 -11.63
Base Growth % 2.23 -9.67
Exp % to Allot 83.06 92.63 93.97
Note: NA- Not Available

155
Annexures
In agriculture, there is overall growth in funds
allocation for providing credit support to the
cooperative members along with promotion
and strengthening of cooperatives. But,
overall there is a growth of 59.02 percent
in funds allocation in comparison to
2006-07. Funds are allocated under different
schematic heads as per state and centrally
sponsored schemes.
Fund a l locat ion to Bhawanipatna
municipality under different heads cover
promotion of urban tourism, urban solid
waste management, maintenance of roads
etc. While 2007-08 marked a growth in funds
allocation in comparison to its preceding
year, during 2008-09, there is a decline of
11.63 percent from its preceding year and
by 9.67 percent from the year 2006-07.
Table 79: Funds flow for Infrastructure Development, r & B Division, KalahandiR & B, Bh.Patna
Name of the Scheme
2006-2007 2007-2008 2008-2009
Allot (Rs in Lakh)
Exp. Allot (Rs in Lakh)
Exp. Allot (Rs in Lakh)
Exp.
Regular Establishment (Non Plan) 86.30 86.30 101.22 101.22 139.88 139.88
i Wage establishment 168.40 168.40 175.10 175.10 275.76 275.76
ii RLTAP (State Plan) 241.14 241.14 NA NA 100.00 100.00
iii Road Work at CRF 30.01 30.01 300.00 300.00 135.51 135.51
iv Road Work under RDP 18.00 18.00 16.86 16.86 NA NA
v Civil Aviation Airport 7.34 7.34 NA NA NA NA
vi TASP( Finance Dept) 16.84 16.84 NA NA NA NA
vii Major Finance (C.T Organisation) 30.00 30.00 74.57 74.57 NA NA
viii Housing (State Plan) 12.00 12.00 8.00 8.00 NA NA
ix Road work Maintenance 87.00 87.00 92.50 92.50 74.50 74.50
x Road work Maintenance & Repair 77.50 77.50 369.90 369.90 179.00 179.00
xi Maintenance & improvement of Road 44.00 44.00 NA NA 116.43 116.43
xii Maintenance of critical Road 27.00 27.00 50.00 50.00 72.00 72.00
xiii Maintenance of R & B (TFC) 230.00 230.00 250.00 250.00 404.00 404.00
xiv Barricading Wok 11.00 11.00 5.00 5.00 4.00 4.00
xv Civil Aviation Airport 0.50 0.50 0.50 0.50 0.50 0.50
xvi Flood & Cyclone (Road) 218.02 218.02 441.33 441.33 204.00 204.00
xvii Critical Building (M & R) 20.00 20.00 29.50 29.50 49.40 49.40
xviii housing Major work grant (State Plan) 3.31 3.31 0.34 0.34 1.00 1.00
xix Residential Building (M & R) 21.45 21.45 49.39 49.39 54.29 54.29
xx Minor Work Grant 4.22 4.22 NA NA NA NA
xxi Maintenance of Non Residential Build 51.77 51.77 121.18 121.18 124.28 124.28
xxii Maintenance of Non Residential Build (TFC)
75.12 75.12 38.60 38.60 96.50 96.50
xxiii Maintenance of Non Residential Build (Prestigious)
10.00 10.00 10.00 10.00 16.00 16.00
xxiv Maintenance of Critical Building 8.00 8.00 10.00 10.00 31.00 31.00
xxv Flood & Cyclone (Repair & Restoration) 8.00 8.00 NA NA NA NA
xxvi Gen Edn Sports, Arts (TASP Cnst Build) NA NA 11.02 11.02 10.00 10.00
xvii VHS Allopathic NA NA 22.00 22.00 NA NA
S Total 1506.92 1506.92 2177.01 2177.01 2088.05 2088.05
Growth 670.09 -88.96
Growth % 44.47 -4.09
Base Growth % 44.47 -4.09
Exp % to Allot 100 100 100
Note: NA- Not Available

156
District Human Development Report
Table 80: Funds Flow to Soil Conservation Department, KalahandiName of the Department
Name of the Scheme
2006-2007 2007-2008 2008-2009
Allot (Rs in Lakh)
Exp. Allot (Rs in Lakh)
Exp. Allot (Rs in Lakh)
Exp.
Soil Conservation Kalahandi
Hqrs Non Plan 29.28 29.28 28.55 28.55 42.67 42.67
i Dist Admn Non Plan 47.98 47.98 55.26 55.26 55.05 55.06
ii Soil Survey & Testing 11.67 11.67 13.03 13.03 23.73 23.73
iii WSM 5.50 5.50 8.22 8.22 10.57 10.57
iv Sisal Farm 0.79 0.79 1.14 1.14 1.58 1.58
v CB Land 1.02 1.02 1.20 1.20 1.70 1.70
vi SEDC 1.95 1.95 2.11 2.11 3.25 3.25
vii Machha Kund Catchment 0.29 0.29 2.02 2.02 2.86 2.86
viii Rengali Catchment 0.92 0.92 1.10 1.10 2.08 2.08
ix NWDPRA ( Cental Plan) 45.55 45.55 37.88 37.88 79.17 79.17
x River Valley Project NA NA NA NA 0.60 0.60
S Total 144.96 144.96 150.50 150.50 223.25 223.25
Growth 5.55 72.74
Growth % 3.83 48.33
Base Growth % 3.83 54.01
Exp % to Allot 100 100 100
Note: NA- Not Available
Note: NA- Not Available
Note: NA- Not Available
Table 81: Funds flow under Total Sanitation Campaign, KalahandiName of the Department
Name of the Scheme
2004-2005 2005-2006 2006-2007 2007-2008 2008-2009
Allot (Rs in Lakh)
Expdt. Allot (Rs in Lakh)
Expdt. Allot (Rs in Lakh)
Expdt. Allot (Rs in Lakh)
Expdt. Allot (Rs in Lakh)
Expdt.
T SC GOI 347.42 6.69 NA 11.26 0.64 73.15 NA 151.11 803.77 32.90
GOO 74.50 NA 42.55 3.45 NA 25.50 NA 52.24 16.53 8.80
S Total 421.92 6.69 42.55 14.71 0.64 98.65 NA 203.35 820.30 41.70
Growth NA NA -379.37 NA -41.91 NA -0.64 NA 820.30 NA
Growth % NA NA -89.92 NA -98.50 NA -100 NA NA NA
Base Growth %
-89.92 NA -99.85 NA -100 NA 94.42 NA
Exp % to Allot 1.59 34.57 15414.06 5.08
Table 82: Funds flow to District Industrial Centre, KalahandiName of the Department
Name of the Scheme 2006-2007 2007-2008 2008-2009
Allot (Rs in Lakh)
Expdt. Allot (Rs in Lakh)
Expdt. Allot (Rs in Lakh)
Expdt.
DIC, Kalahandi Handicraft ( RHA) 1.50 1.50 NA NA 1.50 1.50
i Kalahandi Utsav 1.21 1.21 2.00 2.00 2.35 2.35
ii Craft Village NA NA 2.34 2.18 13.27 2.34
iii Employment Mission NA NA NA NA 2.48 2.40
S Total 2.71 2.71 4.34 4.18 19.60 8.59
Growth 1.63 15.26
Growth % 60.15 351.61
Base Growth % 60.15 623.25
Exp % to Allot 100.00 96.27 43.83
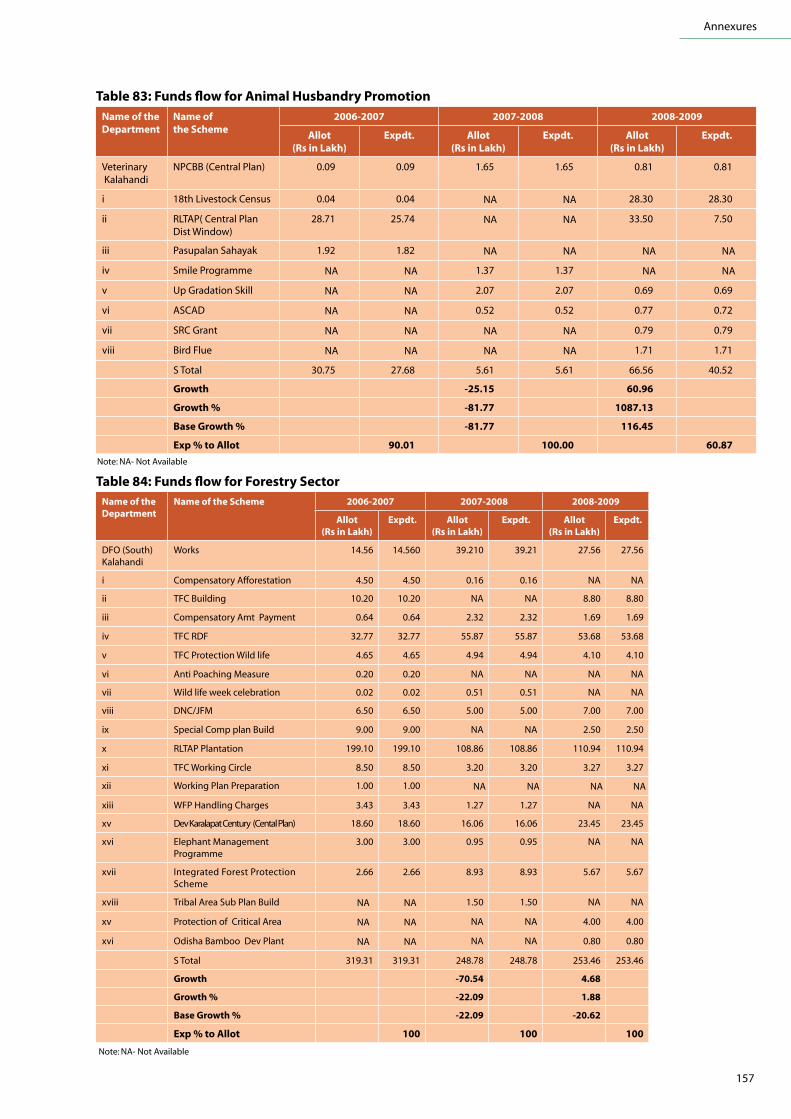
157
Annexures
Table 83: Funds flow for Animal Husbandry PromotionName of the Department
Name of the Scheme
2006-2007 2007-2008 2008-2009
Allot (Rs in Lakh)
Expdt. Allot (Rs in Lakh)
Expdt. Allot (Rs in Lakh)
Expdt.
Veterinary Kalahandi
NPCBB (Central Plan) 0.09 0.09 1.65 1.65 0.81 0.81
i 18th Livestock Census 0.04 0.04 NA NA 28.30 28.30
ii RLTAP( Central Plan Dist Window)
28.71 25.74 NA NA 33.50 7.50
iii Pasupalan Sahayak 1.92 1.82 NA NA NA NA
iv Smile Programme NA NA 1.37 1.37 NA NA
v Up Gradation Skill NA NA 2.07 2.07 0.69 0.69
vi ASCAD NA NA 0.52 0.52 0.77 0.72
vii SRC Grant NA NA NA NA 0.79 0.79
viii Bird Flue NA NA NA NA 1.71 1.71
S Total 30.75 27.68 5.61 5.61 66.56 40.52
Growth -25.15 60.96
Growth % -81.77 1087.13
Base Growth % -81.77 116.45
Exp % to Allot 90.01 100.00 60.87
Table 84: Funds flow for Forestry SectorName of the Department
Name of the Scheme 2006-2007 2007-2008 2008-2009
Allot (Rs in Lakh)
Expdt. Allot (Rs in Lakh)
Expdt. Allot (Rs in Lakh)
Expdt.
DFO (South) Kalahandi
Works 14.56 14.560 39.210 39.21 27.56 27.56
i Compensatory Afforestation 4.50 4.50 0.16 0.16 NA NA
ii TFC Building 10.20 10.20 NA NA 8.80 8.80
iii Compensatory Amt Payment 0.64 0.64 2.32 2.32 1.69 1.69
iv TFC RDF 32.77 32.77 55.87 55.87 53.68 53.68
v TFC Protection Wild life 4.65 4.65 4.94 4.94 4.10 4.10
vi Anti Poaching Measure 0.20 0.20 NA NA NA NA
vii Wild life week celebration 0.02 0.02 0.51 0.51 NA NA
viii DNC/JFM 6.50 6.50 5.00 5.00 7.00 7.00
ix Special Comp plan Build 9.00 9.00 NA NA 2.50 2.50
x RLTAP Plantation 199.10 199.10 108.86 108.86 110.94 110.94
xi TFC Working Circle 8.50 8.50 3.20 3.20 3.27 3.27
xii Working Plan Preparation 1.00 1.00 NA NA NA NA
xiii WFP Handling Charges 3.43 3.43 1.27 1.27 NA NA
xv Dev Karalapat Century (Cental Plan) 18.60 18.60 16.06 16.06 23.45 23.45
xvi Elephant Management Programme
3.00 3.00 0.95 0.95 NA NA
xvii Integrated Forest Protection Scheme
2.66 2.66 8.93 8.93 5.67 5.67
xviii Tribal Area Sub Plan Build NA NA 1.50 1.50 NA NA
xv Protection of Critical Area NA NA NA NA 4.00 4.00
xvi Odisha Bamboo Dev Plant NA NA NA NA 0.80 0.80
S Total 319.31 319.31 248.78 248.78 253.46 253.46
Growth -70.54 4.68
Growth % -22.09 1.88
Base Growth % -22.09 -20.62
Exp % to Allot 100 100 100
Note: NA- Not Available
Note: NA- Not Available

158
District Human Development Report
Table 85: Funds flow to ITDA for Tribal DevelopmentName of the Department
Name of the Scheme
2006-2007 2007-2008 2008-2009
Allot (Rs in Lakh)
Expdt. Allot (Rs in Lakh)
Expdt. Allot (Rs in Lakh)
Expdt.
ITDA, Bhawanipatna
i. State Plan 42.70 42.70 40.06 39.37 97.33 58.40
iii Non-Plan 117.85 108.04 125.12 101.27 13.33 5.33
iii Central Plan NA NA NA NA NA NA
iv Centrally Sponsored Plan 47.50 47.50 47.50 44.38 NA NA
S Total 527.36 617.55 346.74 533.80 350.06 417.19
Growth -180.62 3.32
Growth % -34.25 0.96
Base Growth % -34.25 -33.62
Exp % to Allot 117.10 153.95 119.18
Table 86: Funds promotion for Ayurveda based health careName of the Department
Name of the Scheme 2004-2005 2005-2006 2006-2007 2007-2008 2008-2009
Allot (Rs in Lakh)
Expdt. Allot (Rs in Lakh)
Expdt. Allot (Rs in Lakh)
Expdt. Allot (Rs in Lakh)
Expdt. Allot (Rs in Lakh)
Expdt.
Ayurveda, Kalahandi Office NA NA NA NA 0.48 0.48 0.43 0.43 0.49 0.49
i Spl Assist for District (NPR) NA NA NA NA 1.60 1.60 1.70 1.70 2.26 2.26
iii RLTAP( Dist Window) NA NA NA NA 4.00 4.00 NA NA NA NA
S Total NA NA NA NA 6.08 6.08 2.13 2.13 2.75 2.75
Growth -3.95 0.62
Growth % -64.97 28.87
Base Growth % -64.97 -54.85
Exp % to Allot 100 100 100
Table 87: Funds flow to Minor Irrigation DivisionName of the Department
Name of the Scheme
2006-2007 2007-2008 2008-2009
Allot (Rs in Lakh)
Expdt. Allot (Rs in Lakh)
Expdt. Allot (Rs in Lakh)
Expdt.
M.I Division Bhawanipatna AIBP 302.11 302.11 361.46 361.46 551.11 551.11
i RIDF 5.00 5.00 53.00 53.00 173.12 173.12
ii Critical 45.00 45.00 127.00 127.00 95.00 95.00
iii TFC 21.00 21.00 22.50 22.50 23.70 23.70
iv WODC 21.00 21.00 164.99 122.04 107.00 146.72
v RLTAP 100.00 100.00 0.00 NA NA NA
vi Biju KBK NA NA 200.00 100.00 80.00 NA
vii NREGA 118.50 115.25 100.00 69.00 NA NA
S Total 612.61 609.36 1028.95 855.00 1029.93 989.65
Growth 416.34 0.98
Growth % 67.96 0.10
Base Growth %
67.96 68.12
Exp % to Allot 99.47 83.09 96.09
Note: NA- Not Available
Note: NA- Not Available
Note: NA- Not Available
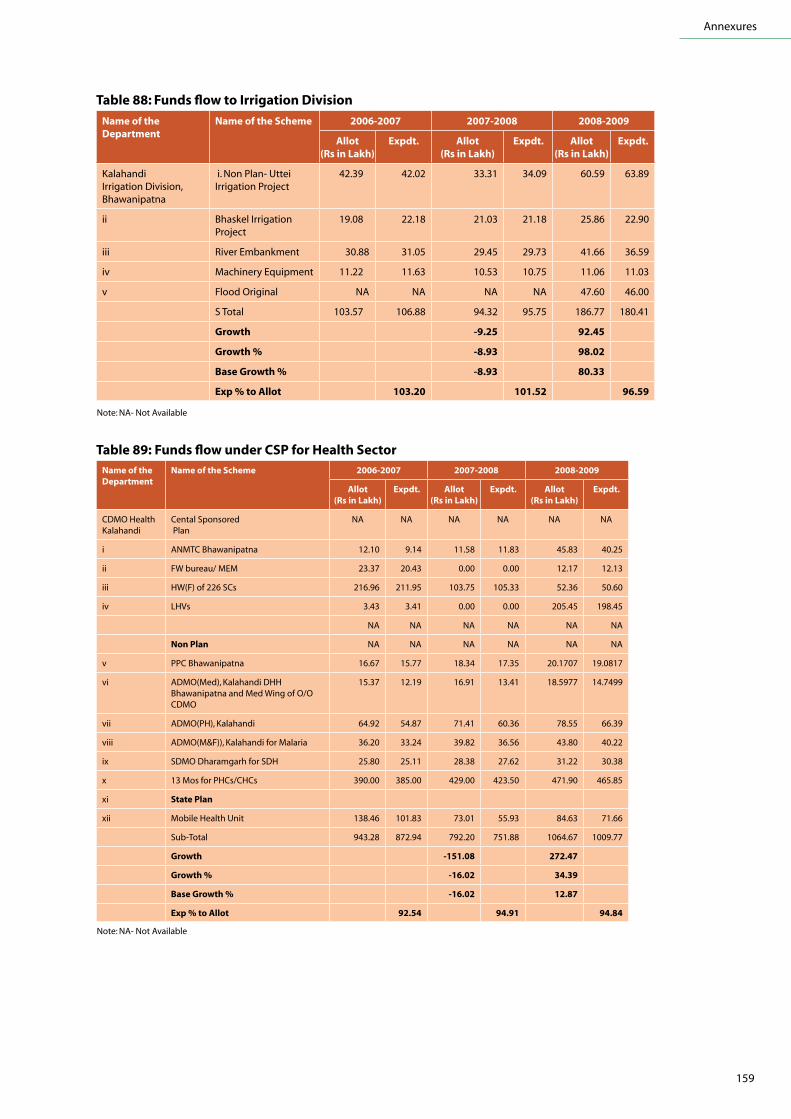
159
Annexures
Table 88: Funds flow to Irrigation Division
Name of the Department
Name of the Scheme 2006-2007 2007-2008 2008-2009
Allot (Rs in Lakh)
Expdt. Allot (Rs in Lakh)
Expdt. Allot (Rs in Lakh)
Expdt.
Kalahandi Irrigation Division, Bhawanipatna
i. Non Plan- Uttei Irrigation Project
42.39 42.02 33.31 34.09 60.59 63.89
ii Bhaskel Irrigation Project
19.08 22.18 21.03 21.18 25.86 22.90
iii River Embankment 30.88 31.05 29.45 29.73 41.66 36.59
iv Machinery Equipment 11.22 11.63 10.53 10.75 11.06 11.03
v Flood Original NA NA NA NA 47.60 46.00
S Total 103.57 106.88 94.32 95.75 186.77 180.41
Growth -9.25 92.45
Growth % -8.93 98.02
Base Growth % -8.93 80.33
Exp % to Allot 103.20 101.52 96.59
Table 89: Funds flow under CSP for Health SectorName of the Department
Name of the Scheme 2006-2007 2007-2008 2008-2009
Allot (Rs in Lakh)
Expdt. Allot (Rs in Lakh)
Expdt. Allot (Rs in Lakh)
Expdt.
CDMO Health Kalahandi
Cental Sponsored Plan
NA NA NA NA NA NA
i ANMTC Bhawanipatna 12.10 9.14 11.58 11.83 45.83 40.25
ii FW bureau/ MEM 23.37 20.43 0.00 0.00 12.17 12.13
iii HW(F) of 226 SCs 216.96 211.95 103.75 105.33 52.36 50.60
iv LHVs 3.43 3.41 0.00 0.00 205.45 198.45
NA NA NA NA NA NA
Non Plan NA NA NA NA NA NA
v PPC Bhawanipatna 16.67 15.77 18.34 17.35 20.1707 19.0817
vi ADMO(Med), Kalahandi DHH Bhawanipatna and Med Wing of O/O CDMO
15.37 12.19 16.91 13.41 18.5977 14.7499
vii ADMO(PH), Kalahandi 64.92 54.87 71.41 60.36 78.55 66.39
viii ADMO(M&F)), Kalahandi for Malaria 36.20 33.24 39.82 36.56 43.80 40.22
ix SDMO Dharamgarh for SDH 25.80 25.11 28.38 27.62 31.22 30.38
x 13 Mos for PHCs/CHCs 390.00 385.00 429.00 423.50 471.90 465.85
xi State Plan
xii Mobile Health Unit 138.46 101.83 73.01 55.93 84.63 71.66
Sub-Total 943.28 872.94 792.20 751.88 1064.67 1009.77
Growth -151.08 272.47
Growth % -16.02 34.39
Base Growth % -16.02 12.87
Exp % to Allot 92.54 94.91 94.84
Note: NA- Not Available
Note: NA- Not Available

160
District Human Development Report
Table 90: Funds flow under MLA LAD, MP LAD & State SchemesName of the Department
Name of the Scheme
2004-2005 2005-2006 2006-2007 2007-2008 2008-2009
Allot (Rs in Lakh)
Expdt. Allot (Rs in Lakh)
Expdt. Allot (Rs in Lakh)
Expdt. Allot (Rs in Lakh)
Expdt. Allot (Rs in Lakh)
Expdt.
Dist Planning Office, Kalahandi
i. MLA LAD 285.00 279.78 285.00 283.75 427.50 426.00 427.50 411.26 427.50 397.55
ii Biju Gram Jyoti Yojana
NA NA NA NA NA NA 650.00 302.65 650.00 400.00
iii MP LAD 220.73 220.73 192.13 192.13 228.10 190.50 169.87 143.00 192.00 27.97
iv RLTAP 505.73 500.51 477.13 475.88 1598.88 1581.98 1699.76 1665.31 2664.50 2421.56
v WODC NA NA 178.47 178.47 172.50 172.50 314.44 306.20 1122.22 520.89
vi Biju KBK NA NA NA NA 300.00 282.19 1950.00 1156.68 1950.00 241.75
Sub-Total 1011.46 1001.02 1132.73 1130.23 2726.98 2653.17 5211.57 3985.10 7006.22 4009.72
Growth 121.27 1594.25 2484.59 1794.65
Growth % 11.99 140.74 91.11 34.44
Base Growth %
11.99 169.61 415.25 592.68
Exp % to Allot 98.97 99.78 97.29 76.47 57.23
Table 91: Funds Flow to Dist. Welfare Office under Different SchemesName of the Department
Name of the Scheme
2005-2006 2006-2007 2007-2008 2008-2009
Allot (Rs in Lakh)
Expdt. Allot (Rs in Lakh)
Expdt. Allot (Rs in Lakh)
Expdt. Allot (Rs in Lakh)
Expdt.
District Welfare Office, Kalahandi
i. Post Matric Scholarship ( Cental Plan)
NA NA 46.51 46.52 29.44 29.44 14.06 14.06
ii Post Matric Scholarship ( Non Plan)
NA NA 9.00 9.00 40.18 40.18 24.51 24.51
iii ASHRAM/RESIDENTIAL SCHOOL ( Pre-Matric Scholarship-State Plan)
3.72 3.72 NA NA NA NA NA NA
iv ASHRAM/RESID ENTIAL SCHOOL( Pre-Matric Scholarship-Non Plan)
NA NA 48.54 48.54 39.67 39.67 89.82 89.82
v 1000 ST Girls Hostel Pre Matric Scholarship-State Plan
NA NA NA NA 95.20 95.20 NA NA
vi 1000 ST Girls Hostel Pre Matric Scholarship-Non Plan
NA NA NA NA 1.93 1.93 55.60 55.60
vii 40 SEATED K.B.K. GIRLS HOSTEL( State Plan-Pre Matric Scholarship)
32.50 32.50 39.31 39.31 42.50 42.50 47.75 47.75
viii Upgradation Girls High School
NA NA 3.01 3.01 21.60 21.60 42.63 42.63
ix Special Programme for KBK Maintenance
1.15 1.15 35.19 35.19 3.95 3.95 NA NA
Sub-Total 37.37 37.37 181.56 181.56 274.47 274.47 274.36 274.36
Growth 144.20 92.91 -0.11
Growth % 385.90 51.17 -0.04
Base Growth % 385.90 634.54 634.26
Exp % to Allot 100 100 100 100
Note: NA- Not Available
Note: NA- Not Available

161
Annexures
Table 92: Total Dist. AllocationName of the Department
Name of the Scheme
2004-2005 2005-2006 2006-2007 2007-2008 2008-2009
Allot ( Rs in Lakh)
Exp. Allot (Rs in Lakh)
Exp. Allot (Rs in Lakh)
Exp. Allot (Rs in Lakh)
Exp. Allot (Rs in Lakh)
Exp.
All
Total District Allocation
5928.51 5411.48 10458.62 9667.74 26126.38 26256.04 26682.32 23361.55 29419.77 19427.08
Growth 4530.11 15667.76 555.94 2737.45
Growth % 76.41 149.81 2.13 10.26
Base Growth %
76.41 340.69 350.07 396.24
Exp % to Allot 91.28 92.44 100.50 87.55 66.03
In comparison to 2004-05, there is a growth
in allocation percentage in different
sectors / sub-sectors. Overall, growth in
fund allocation has gone up by 396.24
percent during 2008-09 in comparison to
2004-05. Year wise allocation trend also
reflects a positive growth from a minimum
of 2.13 percent to a maximum of 149.81
percent from its preceding year. So, it can
be concluded that the district has received
higher fund allocation over the years under
different sectors / sub-sectors though there
is fluctuation in different years in different
sectors.
- • -
Note: NA- Not Available

162
District Human Development Report
An
nex
ure
4
G. P
. Pro
file
1. B
haw
anip
atna
Sl.
No.
Nam
e o
f GP
Ad
min
stra
tio
n d
ata
Pap
ula
toin
Edu
cati
on
Ir
rig
atio
n
No. of villages
Total HH
Average family size
Total population
Total Male
Total female
Total SC
Total ST
Primary
UP School
Secondary School
Total no. of Teacher in PR/UP School
No. of school with D.water facility in (PR/UP)
Separate latrine for boys & girls
No. of pond
No. of Minor Irrigation Project
No. of Lift irrigation projects
No. of watershed projects
1A
rtal
717
453.
76,
389
3,11
73,
272
1,11
038
12
51
207
043
22
4
2B
orb
hat
a2
809
3.3
2,66
81,
333
1,33
532
341
02
11
132
019
0N
A1
3B
ord
a4
1,40
13.
54,
851
2,40
82,
443
1002
801
62
224
40
150
72
4C
hah
agao
n7
1,30
63.
34,
294
2,18
22,
112
750
819
52
220
60
270
6N
A
5C
han
cher
1561
53.
92,
384
1,17
51,
209
484
1,83
85
20
213
01
06
4
6C
hh
elia
mal
41,
072
4.6
4,88
82,
433
2,45
51,
301
1,88
74
21
195
013
14
2
7D
adp
ur
71,
396
3.6
4,97
32,
443
2,53
076
21,
534
53
132
50
321
NA
18
Dey
pu
r11
1,15
63.
54,
079
2,07
92,
000
973
1,46
59
31
368
030
21
1
9D
uar
sun
i15
1,42
63.
95,
515
2,79
72,
718
1,44
82,
200
102
158
80
262
1N
A
10D
um
uri
a7
1,15
43.
84,
399
2,17
22,
227
981
1,07
34
41
211
018
07
NA
11G
and
Bar
ajh
ola
695
33.
23,
063
1,55
01,
513
567
1,24
64
10
234
05
11
1
12G
ud
ialip
adar
141,
494
3.7
5,49
42,
752
2,74
297
11,
853
94
059
60
171
NA
2
13G
urj
un
g6
981
3.2
3,15
91,
548
1,61
152
773
54
10
153
013
05
2
14Ju
gsa
ipat
na
2697
23.
23,
106
1,52
81,
578
321
2,32
28
20
186
02
0N
AN
A
15K
alam
81,
489
3.4
5,04
72,
562
2,48
51,
091
2,14
74
41
257
012
08
3
16K
amth
ana
61,
668
4.1
6,85
73,
415
3,44
21,
230
2,09
06
41
565
131
01
2
17K
arla
gu
da
478
13.
72,
860
1,45
71,
403
493
1,16
22
31
234
012
0N
AN
A
18K
arla
pad
a7
1,51
41.
92,
847
2,63
721
01,
721
1,73
82
51
285
028
24
2
19K
end
up
ati
381
82.
82,
284
1,10
41,
180
507
733
31
010
30
40
3N
A
20Ku
liam
al6
714
3.5
2,49
11,
239
1,25
259
71,
359
51
017
50
122
NA
NA
21Ku
tru
kham
ar6
1,10
13.
43,
770
1,87
51,
895
743
991
52
130
50
140
NA
2
22M
adig
ud
a3
1,02
22.
62,
628
1,30
91,
319
488
378
33
013
50
170
NA
NA
23M
alg
aon
71,
076
4.0
4,35
52,
199
2,15
668
81,
899
52
135
60
170
NA
3
24M
atia
468
03.
62,
442
1,25
21,
190
198
466
32
111
50
170
NA
NA
25M
edin
ipu
r18
2,59
94.
010
,301
5,23
95,
062
2,00
52,
581
124
188
111
216
NA
NA
26Pa
lna
61,
724
3.2
5,45
52,
678
2,77
71,
075
1,38
95
21
215
019
01
NA
27Pa
lsijh
aran
684
63.
63,
048
1,49
31,
555
484
2,05
44
21
214
019
0N
A2
28R
isig
aon
151,
209
3.6
4,34
22,
116
2,22
665
91,
458
92
244
90
202
12
29Sa
gad
a25
1,27
33.
74,
685
2,28
92,
396
851
3,64
816
31
435
04
12
4
30Se
inp
ur
41,
134
3.5
3,96
41,
970
1,99
462
168
44
11
133
013
01
NA
31Ta
lbel
gao
n14
664
3.8
2,53
11,
259
1,27
247
21,
567
42
023
40
200
NA
NA
32Th
uap
adar
71,
704
3.8
6,43
93,
162
3,27
71,
165
2,36
14
21
373
051
0N
A4
33U
dey
pu
r9
754
3.6
2,69
91,
331
1,36
826
,826
46,9
785
21
104
011
0N
AN
A
34Bh
awan
i Pat
na
289
39,2
503.
513
8,30
770
,103
68,2
0453
,434
94,2
4717
881
2792
716
62
603
6144
(Con
td...
)

163
Annexures
Sl.
No.
Nam
e o
f GP
San
itat
ion
Hea
lth
ICD
S Se
rvic
eFo
od
Sec
uri
tySo
cial
Sec
uri
ty
No. of village having pipe water facility
No. of existing tube well
Sanitary HH Lartine
ANM Sub-centre
Sub-centre having pucca building
ANM in position
No. of AWC
No. of AWC having pucca building
No. of AWC having d.water
No. of AWC having toilet facilities
Total BPL Families
No. of Antodaya card holder
No. of Annapurna Card holder
No. of EGS/Job card holder
Madhubabu pension holder
IGNOAP
IGNWP
IGNDP
National Family benefit scheme (Beneficiary)
No. of IAY Beneficiary( within last 3 years)
Mo Kudia( 2008-09 to 2010-11)
1A
rtal
NA
581
11
110
76
074
226
76
2,09
917
427
070
90
636
2B
orb
hat
aN
A35
31
11
54
11
295
103
166
713
110
232
43
255
3B
ord
aN
A65
751
12
74
42
612
189
51,
060
308
217
358
048
4
4C
hah
agao
nN
A52
381
11
73
00
383
118
61,
131
189
154
262
142
5
5C
han
cher
NA
420
10
19
32
042
665
1266
415
712
228
11
325
6C
hh
elia
mal
NA
430
10
17
42
050
016
24
1,67
018
113
941
63
5310
7D
adp
ur
NA
7229
11
17
53
043
713
76
1,29
320
810
725
152
504
8D
eyp
ur
NA
8626
11
16
23
042
113
69
941
200
114
3411
042
3
9D
uar
sun
iN
A96
101
01
94
22
699
185
141,
433
239
131
7612
260
10
10D
um
uri
aN
A46
31
11
74
10
694
218
81,
386
304
212
2822
145
3
11G
and
Bar
ajho
laN
A56
30
00
52
20
255
685
1,00
423
271
167
031
4
12G
ud
ialip
adar
NA
9334
11
18
62
244
713
612
1,58
423
213
231
61
573
13G
urj
un
gN
A40
00
00
53
20
225
805
1,05
618
812
816
41
282
14Ju
gsa
ipat
na
NA
300
11
112
35
037
113
212
876
9810
830
10
3610
15K
alam
NA
451
10
19
42
058
817
95
1,35
918
022
537
102
5211
16K
amth
ana
NA
8019
11
19
54
069
818
27
1,23
135
417
326
21
708
17K
arla
gu
da
NA
402
11
26
30
034
389
379
517
582
44
129
5
18K
arla
pad
aN
A64
291
11
75
22
760
223
61,
170
149
218
336
156
6
19K
end
up
ati
NA
240
00
03
10
126
613
44
807
8914
820
40
232
20Ku
liam
alN
A42
90
00
53
20
255
753
715
100
101
4111
028
221
Kutr
ukh
amar
NA
4920
11
26
33
017
187
594
722
410
532
50
364
22M
adig
ud
aN
A29
11
11
62
10
523
154
61,
082
178
190
122
130
6
23M
alg
aon
NA
6510
10
28
32
037
412
95
1,14
719
512
526
110
557
24M
atia
NA
197
00
04
21
118
053
393
112
759
174
023
2
25M
edin
ipu
rN
A11
318
82
13
178
80
734
223
141,
646
363
245
392
310
35
26Pa
lna
NA
391
11
19
51
335
712
25
1,66
819
612
041
61
569
27Pa
lsijh
aran
NA
380
00
06
31
144
610
00
887
152
248
258
335
6
28R
isig
aon
NA
7819
11
210
42
048
211
810
1,12
122
422
09
32
449
29Sa
gad
aN
A77
11
11
204
10
785
212
251,
491
276
161
323
356
5
30Se
inp
ur
NA
3817
11
18
33
124
610
36
1,02
219
295
255
138
3
31Ta
lbel
gao
nN
A44
60
00
51
00
288
110
1264
794
134
4012
631
532
Thu
apad
arN
A73
131
11
85
30
515
122
61,
259
283
184
407
668
3
33U
dey
pu
rN
A40
610
00
41
30
287
797
653
132
8217
50
292
34Bh
awan
i Pat
na
NA
1,81
162
626
2032
254
119
7416
14,8
054,
490
237
37,4
426,
524
4,92
21,
004
218
46N
AN
A

164
District Human Development Report
2. D
hara
mga
rh
Sl.
No.
Nam
e o
f GP
Ad
min
stra
tio
n d
ata
Pap
ula
toin
Edu
cati
on
Ir
rig
atio
n
No. of villages
Total HH
Average family size
Total population
Total Male
Total female
Total SC
Total ST
Primary
UP School
Secondary School
Total no. of Teacher in PR/UP School
No. of school with D.water facility in
(PR/UP)
Separate latrine for boys & girls
No. of pond
No. of Minor Irrigation Project
No. of Lift irrigation projects
No. of watershed projects
1B
adb
asu
l3
1,02
83.
63,
699
1876
1823
959
1,33
42
31
204
16
0N
AN
A
2B
eher
a2
1,42
83.
54,
948
2,46
22,
486
926
946
91
122
95
150
3N
A
3 B
od
en6
2,58
53.
59,
110
4,54
84,
562
1,25
567
07
41
4610
228
13
NA
4 B
r. C
hh
end
ia5
1,92
84.
68,
856
4,58
74,
269
1,41
797
74
51
367
222
11
NA
5 C
hh
. Bah
ali
286
75.
04,
368
2,16
42,
204
511
310
42
116
30
350
NA
2
6 C
hh
ilip
a5
1,90
53.
77,
083
3,60
73,
476
1,18
486
24
41
367
218
02
NA
7 D
han
arp
ur
180
43.
62,
915
1,40
71,
508
352
1,16
23
31
125
014
0N
A4
8 D
har
amg
arh
252
719
.610
,307
5,15
95,
148
1,89
969
08
43
5512
512
1N
AN
A
9 D
um
erg
ud
a6
1,95
93.
16,
047
3,08
52,
962
1,01
71,
076
44
126
70
91
NA
1
10 G
adia
jore
62,
311
3.4
7,91
13,
974
3,93
71,
219
1,37
78
42
449
024
01
NA
11 J
ayan
tpu
r1
820
3.8
3,11
31,
561
1,55
244
91,
137
52
121
64
60
NA
NA
12 K
anag
aon
295
53.
23,
102
1,61
51,
487
795
153
32
117
45
280
111
13 K
anka
ri1
971
2.8
2,74
91,
385
1,36
476
246
76
11
144
212
03
4
14 K
hai
rpad
ar3
1,18
23.
94,
649
2,34
92,
300
831
748
52
127
66
101
NA
NA
15 N
and
agao
n4
1,42
84.
36,
169
3,03
83,
131
1,36
22,
141
63
130
78
120
NA
NA
16 P
arla
42,
195
3.3
7,19
33,
658
3,53
51,
361
353
74
125
87
350
2N
A
17 S
. Ku
lihar
i1
704
3.0
2,10
41,
066
1,03
833
712
61
11
72
110
03
NA
18 T
amb
ach
had
a5
1,44
53.
24,
661
2,32
02,
341
1,20
654
73
32
305
212
02
NA
19 T
arap
ur
41,
909
3.5
6,65
03,
313
3,33
71,
076
2,57
96
51
319
217
14
NA
20 T
end
apal
i5
968
4.2
4,09
92,
021
2,07
870
21,
645
45
121
83
82
NA
NA
21 T
ipig
ud
a4
1,54
63.
85,
834
2,93
62,
898
759
1,18
27
41
3010
328
1N
AN
A
22To
tal
Dh
arm
agar
h72
29,4
6592
.711
,556
7 58
,131
57,4
3620
,379
20,4
8210
666
2556
614
260
361
935
12
(Con
td...
)

165
Annexures
Sl.
No.
Nam
e o
f GP
San
itat
ion
Hea
lth
ICD
S Se
rvic
eFo
od
Sec
uri
tySo
cial
Sec
uri
ty
No. of village having pipe water facility
No. of existing tube well
Sanitary HH Lartine
ANM Sub-centre
Sub-centre having pucca building
ANM in position
No. of AWC
No. of AWC having pucca building
No. of AWC having d.water
No. of AWC having toilet facilities
Total BPL Families
No. of Antodaya card holder
No. of Annapurna Card holder
No. of EGS/Job card holder
Madhubabu pension holder
IGNOAP
IGNWP
IGNDP
National Family benefit scheme (Beneficiary)
No. of IAY Beneficiary( within last 3 years)
Mo Kudia( 2008-09 to 2010-11)
1Ba
db
asul
143
566
11
16
43
052
416
76
589
166
108
2421
243
NA
2Be
hera
055
916
11
110
32
066
218
910
957
6129
613
521
849
NA
3 B
oden
076
1,29
42
12
148
40
1,06
036
614
1,50
248
623
826
627
81N
A
4 B
r. C
hhen
dia
277
1,21
22
12
115
40
888
316
151,
316
379
214
3149
681
NA
5 C
hh. B
ahal
i1
4588
81
11
84
30
578
201
695
720
915
30
298
40N
A
6 C
hhili
pa
166
1,10
01
01
95
31
915
300
1271
932
730
442
534
69N
A
7 D
hana
rpur
031
404
00
05
32
014
111
81
876
5658
1511
333
NA
8 D
hara
mga
rh1
115
1,40
40
00
167
33
1,15
140
215
1,10
857
026
633
746
95N
A
9 D
umer
gud
a1
7192
72
12
115
40
872
263
181,
611
275
232
3630
760
NA
10 G
adia
jore
081
867
21
214
86
164
332
312
1,63
619
725
044
424
78N
A
11 J
ayan
tpur
131
441
11
25
22
035
812
77
968
162
170
1823
634
NA
12 K
anag
aon
131
531
00
05
31
045
812
44
880
156
151
2528
330
NA
13 K
anka
ri0
2450
31
11
63
10
410
129
945
214
293
275
429
NA
14 K
hairp
adar
143
569
11
26
43
046
617
99
900
242
929
353
46N
A
15 N
and
agao
n0
651,
035
11
111
52
087
325
810
987
431
171
429
470
NA
16 P
arla
161
1,12
31
12
118
50
947
286
101,
359
474
216
353
866
NA
17 S
. Kul
ihar
i1
2441
60
00
42
20
354
107
445
010
063
318
320
NA
18 Ta
mba
chha
da0
4875
61
01
94
40
621
212
121,
135
145
195
8320
547
NA
19 T
arap
ur0
611,
048
11
213
53
089
027
39
942
241
287
3724
874
NA
20 T
end
apal
i0
3833
40
00
84
30
476
161
687
414
511
842
144
46N
A21
Tip
igud
a0
771,
076
11
112
54
092
326
216
1,52
137
318
137
577
57N
A
22To
tal
Dha
rmag
arh
121,
163
17,4
1020
1424
194
9764
514
,210
4,76
320
521
,739
5,33
73,
856
702
688
110
1,14
8N
A

166
District Human Development Report
3. G
olam
unda
Sl.
No.
Nam
e o
f GP
Ad
min
stra
tio
n d
ata
Pap
ula
toin
Edu
cati
on
Ir
rig
atio
n
No. of villages
Total HH
Average family size
Total population
Total Male
Total female
Total SC
Total ST
Primary
UP School
Secondary School
Total no. of Teacher in PR/UP School
No. of school with D.water facility in
(PR/UP)
Separate latrine for boys & girls
No. of pond
No. of Minor Irrigation Project
No. of Lift irrigation projects
No. of watershed projects
1 D
ham
anp
ur
81,
469
3.8
5,57
12,
739
2,83
262
73,
025
94
140
110
251
22
2Fa
ran
g5
1,04
94.
04,
151
2,03
42,
117
896
732
52
118
70
82
12
3 F
un
da
378
33.
72,
874
1,39
81,
476
521
721
22
011
30
60
22
4D
asp
ur
41,
581
4.3
6,76
73,
387
3,38
075
670
65
41
308
00
04
2
5 B
org
ud
a4
1,09
43.
74,
000
1,89
82,
102
888
488
12
110
20
140
04
6 R
eng
sap
ali
81,
146
3.9
4,44
32,
182
2,26
187
01,
907
104
131
80
00
20
7G
and
amer
363
04.
22,
643
1,30
41,
339
209
690
61
018
80
10
02
8N
akti
kan
i8
869
3.8
3,33
81,
642
1,69
623
71,
512
72
021
50
192
02
9 K
h. H
ald
i5
1,35
74.
05,
382
2,75
22,
630
1,50
41,
210
83
133
80
90
81
10 C
hic
hia
498
73.
83,
727
1,67
62,
051
1,15
526
24
21
214
04
05
2
11 K
hal
iaka
ni
355
83.
51,
927
930
997
240
431
31
111
40
121
00
12 G
ola
mu
nd
a1
1,15
93.
94,
479
2,33
52,
144
433
2,07
67
31
298
018
22
0
13 U
chh
ala
51,
100
3.9
4,28
82,
140
2,14
891
51,
649
42
013
60
150
53
14 N
uag
aon
894
43.
53,
271
1,55
61,
715
519
1,29
88
20
248
04
20
3
15 S
inap
ali
388
13.
73,
279
1,62
61,
653
643
652
41
110
40
130
02
16 K
egao
n3
987
3.8
3,73
31,
859
1,87
471
952
35
21
194
011
10
017
Bad
cher
gao
n10
1,52
04.
16,
217
2,90
93,
308
1,35
81,
573
72
119
70
82
74
18 C
hah
aka
674
94.
23,
170
1,55
31,
617
425
968
32
113
50
210
01
19 C
hap
ri4
1,20
53.
84,
616
2,23
72,
379
1,43
777
06
11
177
06
011
0
20 B
run
dab
ahal
41,
276
5.0
6,44
33,
636
2,80
755
893
38
31
298
010
00
1
21M
ahal
ing
82,
323
3.4
7,83
23,
911
3,92
170
91,
067
75
133
100
380
60
22Ku
hu
ra6
1,46
73.
65,
209
2,61
02,
599
1,48
42,
654
63
123
60
230
20
23M
anjh
ari
62,
017
3.9
7,90
43,
924
3,98
090
21,
254
104
139
90
212
43
24K
hal
iap
ali
887
33.
83,
346
1,74
01,
606
425
921
70
122
70
300
42
25G
ola
mu
nd
a To
tal
NA
NA
NA
NA
NA
NA
NA
NA
142
5719
534
157
031
615
6538
(Con
td...
)

167
Annexures
Sl.
No.
Nam
e o
f GP
San
itat
ion
Hea
lth
ICD
S Se
rvic
eFo
od
Sec
uri
tySo
cial
Sec
uri
ty
No. of village having pipe water facility
No. of existing tube well
Sanitary HH Lartine
ANM Sub-centre
Sub-centre having pucca building
ANM in position
No. of AWC
No. of AWC having pucca building
No. of AWC aving d.water
No. of AWC having toilet facilities
Total BPL Families
No. of Antodaya card holder
No. of Annapurna Card holder
No. of EGS/Job card holder
Madhubabu pension holder
IGNOAP
IGNWP
IGNDP
National Family benefit scheme (Beneficiary)
No. of IAY Beneficiary( within last 3 years)
Mo Kudia( 2008-09 to 2010-11)
1 D
ham
anp
ur
392
163
11
19
55
089
431
510
1083
341
162
378
064
52
Fara
ng
260
621
11
53
20
480
202
869
613
220
04
30
393
3 F
un
da
142
560
00
43
20
426
166
469
321
011
821
30
273
4D
asp
ur
271
621
01
95
50
761
330
1112
1532
820
421
90
533
5 B
org
ud
a0
3742
10
13
12
040
818
67
726
8121
814
40
353
6 R
eng
sap
ali
154
171
01
94
40
605
267
911
7421
217
514
50
513
7G
and
amer
137
830
00
42
12
265
121
467
417
277
10
025
38
Nak
tika
ni
057
308
00
08
44
058
324
27
931
202
171
100
036
49
Kh
. Hal
di
275
256
10
19
54
367
125
07
1173
221
164
135
057
310
Ch
ich
ia0
4572
10
15
55
045
722
27
124
193
959
83
293
11 K
hal
iaka
ni
231
357
10
14
11
129
812
33
541
139
113
61
018
312
Go
lam
un
da
185
198
10
18
33
350
321
913
1131
333
298
106
050
313
Uch
hal
a1
4324
11
27
44
240
519
48
947
181
114
60
045
314
Nu
agao
n0
444
10
19
21
139
318
54
1045
238
112
54
036
315
Sin
apal
i0
3425
00
05
22
031
513
93
1010
212
114
21
032
216
Keg
aon
043
571
12
53
20
452
178
1012
5135
413
613
30
353
17 B
adch
erga
on0
6917
21
27
23
353
124
27
1486
228
192
140
063
418
Ch
ahak
a0
4229
00
05
31
131
613
84
962
110
103
160
030
319
Ch
apri
149
130
10
16
45
036
818
35
1095
223
9812
00
474
20 B
run
dab
ahal
073
196
10
19
43
158
327
87
994
240
197
397
049
5
21M
ahal
ing
279
112
11
112
73
010
9145
214
2044
489
283
3711
681
4
22Ku
hu
ra1
5613
21
01
95
20
722
284
1315
6429
716
031
120
514
23M
anjh
ari
587
913
10
112
57
091
339
013
2329
439
263
3310
068
4
24K
hal
iap
ali
048
171
10
15
21
035
714
28
984
189
108
111
132
3
25G
ola
mu
nd
a To
tal
251,
353
3,48
620
622
168
8472
1712
,797
5,44
818
625
,872
5,76
43,
875
379
101
1010
5381

168
District Human Development Report
4. Ja
ipat
na
Sl.
No.
Nam
e o
f GP
Ad
min
stra
tio
n d
ata
Pap
ula
toin
Edu
cati
on
Ir
rig
atio
n
No. of villages
Total HH
Average family size
Total population
Total Male
Total female
Total SC
Total ST
Primary
UP School
Secondary School
Total no. of Teacher in PR/UP School
No. of school with D.water facility in
(PR/UP)
Separate latrine for boys & girls
No. of pond
No. of Minor Irrigation Project
No. of Lift irrigation projects
No. of watershed projects
1A
inla
bh
at7
1,34
93.
74,
956
2,39
12,
565
1,04
22,
588
74
023
70
221
03
2B.
P g
ud
a3
1,12
93.
74,
131
2,01
92,
112
623
2,00
47
21
226
019
00
03
B.K
ko
te4
1,33
43.
74,
977
2,41
52,
562
698
2,96
59
11
280
022
20
04
Ban
dig
aon
92,
293
3.7
8,54
24,
248
4,29
41,
091
2,22
79
41
420
050
00
0
5B
hai
nri
pal
i5
1,59
13.
75,
949
2,87
23,
077
1,04
61,
831
72
123
80
211
20
6D
han
suli
101,
524
3.5
5,33
02,
656
2,67
41,
084
2,08
19
22
2810
011
00
17
Hir
apu
r1
710
4.0
2,82
01,
408
1,41
242
51,
806
51
117
00
120
02
8Ja
ipat
na
32,
879
4.0
11,3
865,
755
5,63
11,
168
1,65
110
42
4314
320
00
09
Kuch
agao
n2
1,20
34.
04,
764
2,37
72,
387
599
2,45
95
31
186
017
03
1
10M
ang
alp
ur
51,
785
3.6
6,44
13,
160
3,28
11,
215
1,92
27
21
239
019
00
1
11M
ukh
igu
da
41,
821
4.8
8,66
64,
583
4,08
31,
405
1,22
37
21
339
08
00
012
P.K
Mu
nd
i8
1,32
63.
54,
637
2,26
82,
369
470
1,82
16
21
218
014
10
0
13Pr
atap
pu
r1
774
4.1
3,14
21,
567
1,57
547
91,
325
42
121
60
120
00
14R
anm
al7
2,72
43.
710
,200
5,07
65,
124
2,40
62,
377
86
242
140
410
00
15R
eng
alp
ali
31,
162
3.7
4,35
62,
219
2,13
775
31,
383
81
119
90
160
42
16Sa
rgig
ud
a5
1,51
04.
06,
106
3,02
43,
082
625
3,95
27
20
198
021
03
217
Uch
hal
a5
1,88
84.
17,
770
3,73
24,
038
928
3,25
09
43
2511
030
00
0
18B
anar
102,
998
3.7
11,1
285,
488
5,64
01,
479
4,93
812
42
370
036
01
0
19Ja
ipat
na
Tota
lN
AN
AN
AN
AN
AN
AN
AN
A13
648
2248
412
5N
A39
15
1312
(Con
td...
)

169
Annexures
Sl.
No.
Nam
e o
f G
P
San
itat
ion
Hea
lth
ICD
S Se
rvic
eFo
od
Sec
uri
tySo
cial
Sec
uri
ty
No. of village having pipe water facility
No. of existing tube well
Sanitary HH Lartine
ANM Sub-centre
Sub-centre having pucca building
ANM in position
No. of AWC
No. of AWC having pucca building
No. of AWC having d.water
No. of AWC having toilet facilities
Total BPL Families
No. of Antodaya card holder
No. of Annapurna Card holder
No. of EGS/Job card holder
Madhubabu pension holder
IGNOAP
IGNWP
IGNDP
National Family benefit scheme (Beneficiary)
No. of IAY Beneficiary ( within last 3 years)
Mo Kudia( 2008-09 to 2010-11)
1A
inla
bh
at0
540
21
210
51
064
221
614
1,47
120
816
870
91
57N
A
2B.
P g
ud
a0
4414
10
16
41
352
517
17
760
162
223
231
346
NA
3B.
K k
ote
054
01
11
75
20
323
134
141,
088
200
146
285
159
NA
4B
and
igao
n1
6810
92
12
135
20
351
251
141,
571
271
273
243
184
NA
5B
hai
nri
pal
i1
479
11
18
41
073
427
010
1,45
721
232
546
23
64N
A
6D
han
suli
054
92
12
95
11
691
248
181,
173
170
210
108
92
59N
A
7H
irap
ur
032
11
11
53
01
5890
371
440
8931
10
33N
A8
Jaip
atn
a1
100
311
11
212
84
599
336
010
1,43
335
143
570
2117
103
NA
9Ku
chag
aon
042
350
00
72
20
219
135
41,
156
222
189
91
153
NA
10M
ang
alp
ur
067
111
11
95
33
546
213
121,
510
264
265
688
770
NA
11M
ukhi
gud
a0
4012
61
01
53
11
355
151
101,
068
125
127
361
183
NA
12P.
K M
un
di
056
392
02
84
33
535
182
81,
288
144
181
341
248
NA
13Pr
atap
pu
r0
291
00
04
20
014
810
23
767
6195
241
035
NA
14R
anm
al0
8278
21
214
92
097
530
014
1,24
636
835
480
65
105
NA
15R
eng
alp
ali
052
111
12
72
10
351
114
794
414
323
949
150
45N
A
16Sa
rgig
ud
a1
561
10
110
54
058
918
814
1,23
917
021
342
142
73N
A
17U
chh
ala
067
11
11
125
10
943
309
141,
426
200
318
634
483
NA
18B
anar
110
173
21
214
84
059
825
318
2,70
438
232
657
22
123
NA
19Ja
ipat
na
Tota
l5
1,04
582
922
1224
160
8433
179,
576
3,68
719
423
,015
NA
NA
NA
NA
NA
NA
NA

170
District Human Development Report
Cont
...
5. Ju
naga
rh
Sl.
No.
Nam
e o
f GP
Ad
min
stra
tio
n d
ata
Pap
ula
toin
Edu
cati
on
Ir
rig
atio
n
No. of villages
Total HH
Average family size
Total population
Total Male
Total female
Total SC
Total ST
Primary
UP School
Secondary School
Total no. of Teacher in PR/UP School
No. of school with D.water facility in (PR/UP)
Separate latrine for boys & girls
No. of pond
No. of Minor Irrigation Project
No. of Lift irrigation projects
No. of watershed projects
1A
tig
aon
41,
754
3.4
5,93
129
3229
9991
751
06
11
248
039
04
1
2B
ald
iam
al2
873
4.1
3,59
71,
838
1,75
935
36
31
116
31
40
4N
A
3B
anka
pal
s5
494
3.2
1,59
378
081
312
61,
151
61
019
60
40
NA
1
4B.
Tu
lsip
ali
788
93.
93,
494
1,74
01,
754
721
615
32
117
90
120
NA
NA
5B
anija
ra6
1,48
73.
75,
438
2,71
62,
722
828
745
72
119
90
120
1N
A
6B
hai
nri
gu
da
102,
090
3.1
6,54
43,
313
3,23
179
590
56
21
308
014
111
NA
7B
ud
hid
ar13
1,49
43.
35,
003
2,48
82,
515
746
2,65
57
10
137
023
33
2
8C
har
bah
al3
2,18
03.
47,
329
3,64
03,
689
1,87
684
510
41
3513
049
1N
AN
A
9C
har
bh
ati
693
84.
03,
763
1,86
91,
894
425
1,10
34
30
186
012
0N
AN
A
10C
hh
ori
agar
h2
1,30
23.
74,
774
2,42
52,
349
335
114
31
016
40
201
NA
NA
11C
hic
hig
ud
a5
1,40
13.
65,
104
2,59
52,
509
825
203
52
121
80
390
3N
A
12D
asig
aon
51,
823
3.7
6,81
23,
346
3,46
61,
602
1,40
46
31
2110
022
22
NA
13D
eyd
ar9
1,19
83.
44,
054
2,00
02,
054
389
2,74
57
11
247
021
21
5
14D
un
del
mal
81,
097
4.0
4,36
72,
137
2,23
061
52,
317
31
020
40
60
35
15G
ou
dch
hen
dia
51,
865
3.4
6,30
33,
127
3,17
61,
048
1,13
87
31
248
018
11
NA
16H
abas
pu
r5
2,19
72.
96,
327
3,15
53,
172
1,47
645
46
32
208
113
12
NA
17K
alei
gao
n6
921
3.5
3,19
71,
611
1,58
644
428
12
10
83
012
0N
AN
A
18K
alia
kun
dal
82,
047
3.7
7,61
83,
850
3,76
81,
614
480
63
129
90
510
2N
A
19K
alo
pal
a2
1,46
93.
44,
939
2,47
72,
462
1,36
81,
289
31
218
41
550
NA
NA
20K
end
up
ati
41,
207
3.3
4,03
01,
996
2,03
499
873
73
31
236
127
04
NA
21M
ahic
hal
a2
1,22
83.
64,
419
2,21
92,
200
955
840
41
110
50
351
NA
NA
22M
alig
ud
a5
1,38
93.
65,
012
2,47
92,
533
735
543
42
118
60
140
1N
A
23M
atig
aon
77,
726
0.9
6,95
53,
417
3,53
864
446
24
31
328
023
15
NA
24M
eria
ban
dh
li7
864
3.8
3,24
81,
617
1,63
130
364
61
31
184
018
0N
AN
A
25M
un
dra
gu
da
41,
093
3.6
3,89
01,
960
1,93
084
467
04
21
147
014
0N
AN
A
26N
akti
gu
da
287
63.
93,
450
1,75
61,
694
748
460
22
021
40
270
NA
NA
27N
and
ol
379
13.
42,
703
1,32
21,
381
359
283
31
113
40
210
5N
A
28Pa
lash
31,
200
3.7
4,45
12,
266
2,18
565
962
22
120
52
350
6N
A29
Raj
pu
r5
1,29
43.
34,
206
2,11
12,
095
445
743
42
019
50
120
NA
130
S.Ku
nd
amal
287
43.
53,
021
1,51
91,
502
445
523
22
020
50
80
NA
NA
31Ta
laja
rin
g9
895
2.9
2,56
81,
282
1,28
665
775
54
00
214
011
03
1
32Ta
lmal
a3
1,10
43.
33,
646
1,78
21,
864
718
233
10
164
020
07
NA
33Ju
nag
arh
To
tal
167
48,0
603.
114
,778
673
,765
74,0
2125
,013
25,7
07N
AN
AN
AN
AN
AN
AN
AN
AN
AN
A
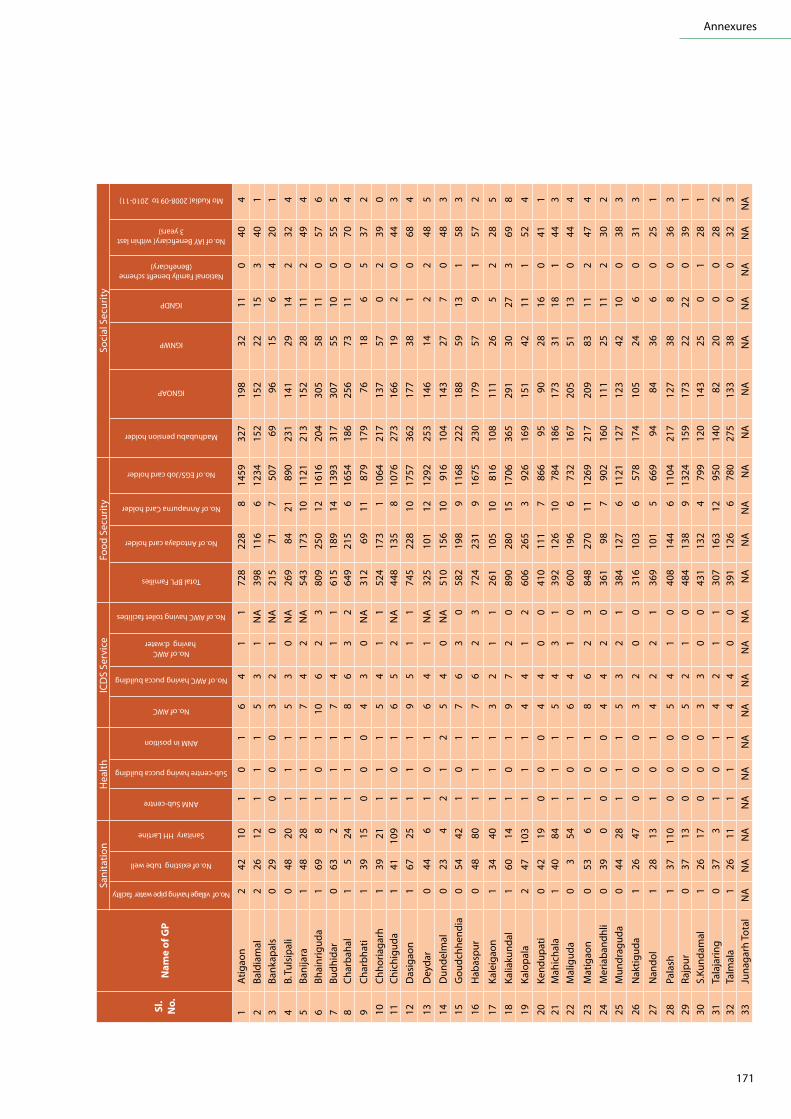
171
Annexures
Sl.
No.
Nam
e o
f GP
San
itat
ion
Hea
lth
ICD
S Se
rvic
eFo
od
Sec
uri
tySo
cial
Sec
uri
ty
No. of village having pipe water facility
No. of existing tube well
Sanitary HH Lartine
ANM Sub-centre
Sub-centre having pucca building
ANM in position
No. of AWC
No. of AWC having pucca building
No. of AWC having d.water
No. of AWC having toilet facilities
Total BPL Families
No. of Antodaya card holder
No. of Annapurna Card holder
No. of EGS/Job card holder
Madhubabu pension holder
IGNOAP
IGNWP
IGNDP
National Family benefit scheme (Beneficiary)
No. of IAY Beneficiary( within last 3 years)
Mo Kudia( 2008-09 to 2010-11)
1A
tig
aon
242
101
01
64
11
728
228
814
5932
719
832
110
404
2B
ald
iam
al2
2612
11
15
31
NA
398
116
612
3415
215
222
153
401
3B
anka
pal
s0
290
00
03
21
NA
215
717
507
6996
156
420
1
4B.
Tu
lsip
ali
048
201
11
53
0N
A26
984
2189
023
114
129
142
324
5B
anija
ra1
4828
11
17
42
NA
543
173
1011
2121
315
228
112
494
6B
hai
nri
gu
da
169
81
01
106
23
809
250
1216
1620
430
558
110
576
7B
ud
hid
ar0
632
11
17
41
161
518
914
1393
317
307
5510
055
58
Ch
arb
ahal
15
241
11
86
32
649
215
616
5418
625
673
110
704
9C
har
bh
ati
139
150
00
43
0N
A31
269
1187
917
976
186
537
2
10C
hh
ori
agar
h1
3921
11
15
41
152
417
31
1064
217
137
570
239
0
11C
hic
hig
ud
a1
4110
91
01
65
2N
A44
813
58
1076
273
166
192
044
3
12D
asig
aon
167
251
11
95
11
745
228
1017
5736
217
738
10
684
13D
eyd
ar0
446
10
16
41
NA
325
101
1212
9225
314
614
22
485
14D
un
del
mal
023
42
12
54
0N
A51
015
610
916
104
143
277
048
3
15G
ou
dch
hen
dia
054
421
01
76
30
582
198
911
6822
218
859
131
583
16H
abas
pu
r0
4880
11
17
62
372
423
19
1675
230
179
579
157
2
17K
alei
gao
n1
3440
11
13
21
126
110
510
816
108
111
265
228
5
18K
alia
kun
dal
160
141
01
97
20
890
280
1517
0636
529
130
273
698
19K
alo
pal
a2
4710
31
11
44
12
606
265
392
616
915
142
111
524
20K
end
up
ati
042
190
00
44
00
410
111
786
695
9028
160
411
21M
ahic
hal
a1
4084
11
15
43
139
212
610
784
186
173
3118
144
3
22M
alig
ud
a0
354
10
16
41
060
019
66
732
167
205
5113
044
4
23M
atig
aon
053
61
01
86
23
848
270
1112
6921
720
983
112
474
24M
eria
ban
dh
li0
390
00
04
42
036
198
790
216
011
125
112
302
25M
un
dra
gu
da
044
281
11
53
21
384
127
611
2112
712
342
100
383
26N
akti
gu
da
126
470
00
32
00
316
103
657
817
410
524
60
313
27N
and
ol
128
131
01
42
21
369
101
566
994
8436
60
251
28Pa
lash
137
110
00
05
41
040
814
46
1104
217
127
388
036
3
29R
ajp
ur
037
130
00
52
10
484
138
913
2415
917
322
220
391
30S.
Kun
dam
al1
2617
00
03
30
043
113
24
799
120
143
250
128
1
31Ta
laja
rin
g0
373
10
14
21
130
716
312
950
140
8220
00
282
32Ta
lmal
a1
2611
11
14
40
039
112
66
780
275
133
380
032
3
33Ju
nag
arh
To
tal
NA
NA
NA
NA
NA
NA
NA
NA
NA
NA
NA
NA
NA
NA
NA
NA
NA
NA
NA
NA
NA

172
District Human Development Report
6. K
alam
pur
Sl.
No.
Nam
e o
f GP
Ad
min
stra
tio
n d
ata
Pap
ula
toin
Edu
cati
on
Ir
rig
atio
n
No. of villages
Total HH
Average family size
Total population
Total Male
Total female
Total SC
Total ST
Primary
UP School
Secondary School
Total no. of Teacher in PR/UP School
No. of school with D.water facility in
(PR/UP)
Separate latrine for boys & girls
No. of pond
No. of Minor Irrigation Project
No. of Lift irrigation projects
No. of watershed projects
1 K
alam
pu
r8
1,76
73.
56,
256
3,13
73,
119
733
1,26
06
51
259
320
02
0
2 P
and
igao
n6
1,17
73.
64,
268
2,11
82,
150
796
1,36
26
21
245
119
0N
A0
3 M
and
el9
2,47
03.
68,
953
4,45
74,
496
1,98
32,
004
124
136
104
400
NA
0
4 B
ijmar
a4
1,87
34.
07,
445
3,71
93,
726
973
2,47
711
42
382
421
0N
A0
5 B
adKu
tru
495
33.
53,
312
1,64
01,
672
766
630
42
114
41
370
10
6 D
eyp
ur
71,
934
3.6
6,98
73,
430
3,55
71,
189
979
91
233
63
140
20
7 H
arm
al7
1,19
63.
84,
493
2,19
52,
298
645
1,52
26
311
235
227
01
0
8 M
ing
ur
61,
794
3.5
6,36
83,
128
3,24
01,
088
1,69
710
151
328
453
03
0
9B
and
hak
ana
31,
201
3.7
4,44
32,
178
2,26
526
91,
494
513
116
52
151
NA
0
10To
tal K
alam
pu
rN
AN
AN
AN
AN
AN
AN
AN
A69
2711
241
5424
246
19
0
Sl.
No.
Nam
e o
f GP
San
itat
ion
Hea
lth
ICD
S Se
rvic
eFo
od
Sec
uri
tySo
cial
Sec
uri
ty
No. of village having pipe water facility
No. of existing tube well
Sanitary HH Lartine
ANM Sub-centre
Sub-centre having pucca building
ANM in position
No. of AWC
No. of AWC having pucca building
No. of AWC having d.water
No. of AWC having toilet facilities
Total BPL Families
No. of Antodaya card holder
No. of Annapurna Card holder
No. of EGS/Job card holder
Madhubabu pension holder
IGNOAP
IGNWP
IGNDP
National Family benefit scheme (Beneficiary)
No. of IAY Beneficiary( within last 3 years)
Mo Kudia( 2008-09 to 2010-11)
1 K
alam
pu
r1
9113
30
01
87
34
357
300
91,
198
453
160
318
458
4
2 P
and
igao
n0
6635
11
17
52
223
117
49
1,02
634
417
842
72
441
3 M
and
el2
106
101
00
211
82
045
734
714
1,45
132
628
661
84
883
4 B
ijmar
a2
7393
11
29
52
047
935
912
1,25
135
882
1016
075
1
5 B
adKu
tru
141
271
11
44
23
208
174
872
213
012
024
110
351
6 D
eyp
ur
172
512
12
86
63
340
296
131,
524
409
281
614
164
13
7 H
arm
al1
6047
00
06
50
020
316
85
1,19
315
012
225
51
477
8 M
ing
ur
173
741
11
95
20
310
270
1110
6218
524
037
50
705
9B
and
hak
ana
153
111
11
16
43
014
310
310
854
239
9429
21
451
10To
tal K
alam
pur
1063
567
27
611
6849
2212
2,72
82,
191
9110
,281
2,59
41,
563
237
8613
526
36
(Con
td...
)

173
Annexures
7. K
arla
mun
da
Sl.
No.
Nam
e o
f GP
Ad
min
stra
tio
n d
ata
Pap
ula
toin
Edu
cati
on
Ir
rig
atio
n
No. of villages
Total HH
Average family size
Total population
Total Male
Total female
Total SC
Total ST
Primary
UP School
Secondary School
Total no. of Teacher in PR/UP School
No. of school with D.water facility in
(PR/UP)
Separate latrine for boys & girls
No. of pond
No. of Minor Irrigation Project
No. of Lift irrigation projects
No. of watershed projects
1 R
isid
a4
1,00
64.
04,
030
2,08
51,
945
974
502
61
218
71
50
13
2 B
arp
adar
111,
432
3.3
4,72
02,
319
2,40
158
384
612
21
3010
06
02
0
3 R
inja
491
63.
53,
226
1,60
81,
618
435
406
22
19
40
70
10
4 T
eres
ing
a3
1,24
43.
94,
890
2,45
32,
437
756
311
52
119
70
120
10
5 S
. Mal
pad
a3
1,05
43.
33,
435
1,75
41,
681
711
185
42
115
50
50
40
6 R
ajp
ur
51,
108
3.7
4,05
42,
035
2,01
937
632
15
31
227
05
1N
A0
7 P
ou
rkel
a6
1,16
13.
54,
102
2,05
92,
043
882
1,58
35
31
217
18
02
0
8 J
ora
do
bra
71,
583
3.3
5,27
62,
667
2,60
975
91,
087
84
131
111
121
74
9 R
egd
a5
999
3.4
3,42
41,
690
1,73
459
452
35
21
156
06
013
0
10 K
arla
mu
nd
a3
1,13
23.
43,
833
1,89
61,
937
559
317
32
113
50
50
120
11 G
ajb
ahal
91,
625
3.6
5,82
82,
935
2,89
31,
146
1,08
29
51
2713
121
16
012
Sap
lah
ara
285
93.
22,
741
1,37
21,
369
316
213
22
110
20
60
50
13Ka
rlam
und
a To
tal
6214
,119
42.1
49,5
5924
,873
24,6
868,
091
7,37
666
3013
230
844
983
547
Sl.
No.
Nam
e o
f GP
San
itat
ion
Hea
lth
ICD
S Se
rvic
eFo
od
Sec
uri
tySo
cial
Sec
uri
ty
No. of village having pipe water facility
No. of existing tube well
Sanitary HH Lartine
ANM Sub-centre
Sub-centre having pucca building
ANM in position
No. of AWC
No. of AWC having pucca building
No. of AWC having d.water
No. of AWC having toilet facilities
Total BPL Families
No. of Antodaya card holder
No. of Annapurna Card holder
No. of EGS/Job card holder
Madhubabu pension holder
IGNOAP
IGNWP
IGNDP
National Family benefit scheme (Beneficiary)
No. of IAY Beneficiary( within last 3 years)
Mo Kudia( 2008-09 to 2010-11)
1 R
isid
a2
5066
00
04
33
224
994
874
719
314
124
43
381
2 B
arp
adar
376
150
11
15
55
243
714
58
1,15
418
211
844
133
441
3 R
inja
141
102
00
03
33
235
114
08
707
202
148
354
731
64
Ter
esin
ga
151
731
11
55
51
563
186
697
830
122
353
104
391
5 S
. Mal
pad
a0
3998
10
13
33
137
214
68
816
188
169
4312
231
46
Raj
pu
r0
5316
11
11
44
43
275
119
586
922
910
623
62
343
7 P
ou
rkel
a1
449
11
16
36
029
812
010
792
227
107
247
145
68
Jo
rad
ob
ra2
9162
01
11
65
60
552
210
91,
501
227
224
6110
151
29
Reg
da
150
81
01
32
20
344
101
670
218
511
520
104
330
10 K
arla
mun
da
162
128
10
14
44
232
012
26
830
202
145
3010
535
411
Gaj
bah
al1
7825
11
17
77
163
624
59
991
253
212
4112
157
112
Sap
lah
ara
131
311
11
32
30
324
115
372
615
399
227
624
013
Karla
mun
da T
otal
1466
61,
471
107
1053
4651
144,
721
1,74
386
10,8
132,
542
1,80
742
010
539
462
29
(Con
td...
)

174
District Human Development Report
8. K
esin
ga
Sl.
No.
Nam
e o
f GP
Ad
min
stra
tio
n d
ata
Pap
ula
toin
Edu
cati
on
Ir
rig
atio
n
No. of villages
Total HH
Average family size
Total population
Total Male
Total female
Total SC
Total ST
Primary
UP School
Secondary School
Total no. of Teacher in PR/UP School
No. of school with D.water facility in
(PR/UP)
Separate latrine for boys & girls
No. of pond
No. of Minor Irrigation Project
No. of Lift irrigation projects
No. of watershed projects
1A
dh
om
un
da
272
23.
32,
376
1193
1183
367
1096
12
114
3N
A9
00
1
2B
alsi
41,
425
3.3
4,71
72,
378
2,33
953
877
56
22
188
NA
250
04
3B
elkh
and
i2
601
3.7
2,23
41,
119
1,11
527
029
53
21
125
NA
40
91
4B
ori
a4
1,03
83.
53,
637
1,79
31,
844
804
815
42
117
6N
A14
09
2
5C
han
cher
41,
312
3.5
4,59
72,
198
2,39
970
82,
330
62
226
6N
A27
10
1
6D
eog
aon
41,
245
3.3
4,14
42,
022
2,12
243
52,
956
43
117
7N
A15
15
1
7G
aig
aon
81,
264
3.4
4,26
32,
141
2,12
267
72,
362
43
124
7N
A13
11
2
8G
oku
lesw
ar3
868
3.2
2,75
91,
362
1,39
741
696
43
21
124
NA
81
0N
A
9H
atik
ho
j4
1,15
53.
23,
732
1,91
31,
819
461
718
72
121
9N
A13
00
2
10K
and
el5
1,49
03.
45,
060
2,52
82,
532
489
1,01
76
21
168
NA
132
25
11K
ante
sir
41,
359
3.4
4,65
22,
347
2,30
585
797
94
21
216
NA
151
21
12K
asru
pad
a7
1,44
74.
05,
754
2,85
72,
897
1,16
384
57
01
157
NA
174
42
13K
ikia
380
03.
52,
823
1,40
41,
419
562
829
41
114
5N
A10
10
4
14Ku
nd
aban
dh
489
93.
63,
203
1,58
01,
623
448
604
32
114
5N
A16
03
NA
15La
itar
a5
1,45
53.
55,
039
2,50
62,
533
1,02
01,
061
62
118
8N
A12
06
4
16N
asig
aon
279
43.
12,
486
1,22
31,
263
432
992
41
112
4N
A10
00
2
17N
un
mat
h5
694
3.7
2,53
91,
305
1,23
437
549
25
21
167
NA
131
8N
A
18Pa
rals
ing
a6
1,49
23.
14,
643
2,34
72,
296
703
1,14
67
11
168
NA
181
02
19Pa
stik
ud
i3
1,04
83.
43,
560
1,84
11,
719
805
756
41
119
4N
A10
10
3
20Pa
thar
la3
1,03
73.
83,
914
1,98
11,
933
705
765
41
112
5N
A15
08
2
21Ph
atka
mal
382
84.
73,
909
1,96
51,
944
187
1,34
23
11
174
NA
140
0N
A
22Si
rjap
ali
391
53.
43,
087
1,55
71,
530
187
259
31
012
4N
A6
07
2
23Si
rol
31,
123
3.3
3,66
71,
849
1,81
856
176
72
21
103
NA
230
01
24Tu
nd
la5
881
3.7
3,24
81,
619
1,62
962
062
34
11
125
NA
101
41
25Tu
rlak
ham
an2
664
2.9
1,95
895
21,
006
324
11
11
92
NA
71
61
26U
tkel
a4
1,60
83.
65,
840
2,93
92,
901
1,11
41,
503
101
228
10N
A25
11
1
27K
esin
ga
Tota
l28
,164
90.5
97,8
4148
,919
48,9
2214
,907
26,5
3211
542
2842
215
0N
A36
218
7545 (Con
td...
)

175
Annexures
Sl.
No.
Nam
e o
f GP
San
itat
ion
Hea
lth
ICD
S Se
rvic
eFo
od
Sec
uri
tySo
cial
Sec
uri
ty
No. of village having pipe water facility
No. of existing tube well
Sanitary HH Lartine
ANM Sub-centre
Sub-centre having pucca building
ANM in position
No. of AWC
No. of AWC having pucca building
No. of AWC having d.water
No. of AWC having toilet facilities
Total BPL Families
No. of Antodaya card holder
No. of Annapurna Card holder
No. of EGS/Job card holder
Madhubabu pension holder
IGNOAP
IGNWP
IGNDP
National Family benefit scheme (Beneficiary)
No. of IAY Beneficiary( within last 3 years)
Mo Kudia( 2008-09 to 2010-11)
1A
dh
om
un
da
130
11
11
33
33
241
116
552
354
8333
82
25
2B
alsi
156
41
11
73
72
600
263
81,
184
240
138
1732
22
63
Bel
khan
di
037
171
11
72
72
208
118
351
011
710
33
82
22
4B
ori
a1
6125
00
08
68
431
117
66
650
106
155
5317
22
7
5C
han
cher
153
190
00
55
53
3318
39
928
173
8023
55
51
6D
eog
aon
142
40
00
55
53
201
210
898
317
411
028
5014
148
7G
aig
aon
053
61
01
75
73
298
200
81,
031
104
190
370
55
28
Go
kule
swar
129
51
11
43
43
7711
52
570
6596
120
22
1
9H
atik
ho
j1
7010
00
015
69
735
521
18
888
154
219
2017
00
2
10K
and
el1
5424
11
17
57
429
425
68
1,12
419
679
50
33
2
11K
ante
sir
145
301
01
74
74
623
268
791
918
413
145
2712
128
12K
asru
pad
a1
6025
11
19
55
449
627
018
1,11
833
010
918
193
36
13K
ikia
140
61
11
64
64
134
114
561
794
866
171
15
14Ku
nd
aban
dh
139
310
00
54
52
284
162
472
712
312
333
224
46
15La
itar
a1
6082
11
110
55
446
726
44
864
264
121
120
88
6
16N
asig
aon
124
200
00
63
46
5514
73
542
114
715
01
11
17N
un
mat
h0
4611
11
16
46
338
014
24
576
181
654
06
64
18Pa
rals
ing
a1
523
11
15
45
355
925
811
1,48
221
898
160
66
11
19Pa
stik
ud
i1
4925
11
15
45
312
112
24
594
161
647
02
21
20Pa
thar
la1
360
10
16
46
222
412
87
934
9310
610
05
51
21Ph
atka
mal
158
00
00
43
42
282
190
61,
071
147
132
110
22
1
22Si
rjap
ali
150
160
00
83
82
374
183
589
012
614
920
124
42
23Si
rol
132
70
00
64
62
467
155
586
397
172
486
33
4
24Tu
nd
la1
5814
11
16
46
333
316
910
793
145
8629
70
07
25Tu
rlak
ham
an0
292
00
05
25
229
510
14
576
7914
123
100
03
26U
tkel
a1
8616
41
11
105
106
124
218
91,
035
201
9718
02
24
27K
esin
ga
Tota
l22
1,24
955
116
1316
172
105
155
867,
836
4,73
917
121
,992
3,42
32,
525
430
192
8888
86

176
District Human Development Report
9. K
oksa
ra
Sl.
No.
Nam
e o
f GP
Ad
min
stra
tio
n d
ata
Pap
ula
toin
Edu
cati
on
Ir
rig
atio
n
No. of villages
Total HH
Average family size
Total population
Total Male
Total female
Total SC
Total ST
Primary
UP School
Secondary School
Total no. of Teacher in PR/UP School
No. of school with D.water facility in (PR/UP)
Separate latrine for boys & girls
No. of pond
No. of Minor Irrigation Project
No. of Lift irrigation projects
No. of watershed projects
1A
mp
ani
61,
268
3.9
4,93
32,
425
2,50
878
33,
267
93
226
100
120
00
2B
adap
od
agu
da
11,
517
3.7
5,57
32,
748
2,82
557
02,
100
45
122
80
103
00
3B
ora
do
ng
a4
1,16
63.
94,
503
2,22
42,
279
621
1,89
25
21
195
110
10
0
4D
ahag
aon
31,
646
3.6
6,00
62,
983
3,02
369
71,
889
64
124
83
500
00
5D
alg
um
a2
1,40
82.
94,
149
2,07
72,
072
390
785
13
113
31
220
00
6D
ud
kath
eng
a3
862
4.3
3,67
01,
811
1,85
941
01,
669
63
118
90
121
00
7G
ota
mu
nd
a5
2,00
33.
87,
565
3,78
93,
776
1,01
52,
636
75
127
51
332
00
8G
amb
har
igu
da
51,
824
3.3
6,05
93,
022
3,03
71,
041
1,74
73
41
216
016
07
0
9K
hu
nti
a3
844
4.0
3,40
31,
713
1,69
057
11,
524
71
119
72
190
20
10K
oks
ara
31,
169
3.6
4,25
52,
131
2,12
487
151
46
31
266
317
12
0
11K
aud
ola
21,
484
3.7
5,48
22,
695
2,78
71,
111
1,47
06
21
197
229
24
0
12K
asib
ahal
31,
588
4.4
6,98
63,
431
3,55
51,
458
2,62
48
42
2810
042
20
0
13La
du
gao
n5
2,57
13.
99,
978
4,99
74,
981
1,91
32,
935
94
130
130
250
60
14M
ahim
a3
1,23
73.
64,
450
2,21
82,
232
773
2,25
06
30
198
037
01
0
15M
ajh
igu
da
11,
128
3.3
3,71
61,
900
1,81
640
937
54
21
154
224
00
0
16M
usa
pal
i3
985
3.3
3,28
61,
629
1,65
783
266
11
31
123
015
11
0
17M
ote
r5
1,49
94.
26,
268
3,15
13,
117
892
2,33
02
41
217
015
00
0
18Ph
up
gao
n4
1,26
93.
54,
416
2,12
92,
287
784
2,44
65
21
197
020
02
0
19R
eng
alp
ali
61,
425
3.4
4,88
82,
395
2,49
379
51,
695
34
123
70
140
50
20Te
mer
a4
1,34
03.
74,
923
2,44
12,
482
999
1,76
23
41
198
129
10
0
21K
oks
ara
Tota
l10
165
2142
014
116
451
1430
0
(Con
td...
)

177
Annexures
Sl.
No.
Nam
e o
f GP
San
itat
ion
Hea
lth
ICD
S Se
rvic
eFo
od
Sec
uri
tySo
cial
Sec
uri
ty
No. of village having pipe water facility
No. of existing tube well
Sanitary HH Lartine
ANM Sub-centre
Sub-centre having pucca building
ANM in position
No. of AWC
No. of AWC having pucca building
No. of AWC having d.water
No. of AWC having toilet facilities
Total BPL Families
No. of Antodaya card holder
No. of Annapurna Card holder
No. of EGS/Job card holder
Madhubabu pension holder
IGNOAP
IGNWP
IGNDP
National Family benefit scheme (Beneficiary)
No. of IAY Beneficiary( within last 3 years)
Mo Kudia( 2008-09 to 2010-11)
1A
mp
ani
164
371
12
85
20
481
185
131,
027
9811
077
142
61N
A
2Ba
dap
odag
uda
164
91
11
88
40
646
237
121,
013
9114
213
635
159
NA
3B
ora
do
ng
a0
4910
10
17
32
040
812
64
853
6110
410
018
449
NA
4D
ahag
aon
067
31
01
95
10
704
244
81,
223
180
9070
261
60N
A
5D
alg
um
a0
3415
00
05
42
247
916
43
912
164
130
5033
239
NA
6D
ud
kath
eng
a1
4013
10
17
63
045
726
10
740
114
110
8716
040
NA
7G
ota
mu
nd
a0
904
10
214
88
083
428
712
1,54
415
015
012
845
079
NA
8G
amb
harig
uda
154
422
02
86
12
796
263
171,
241
8425
018
044
463
NA
9K
hu
nti
a0
330
10
17
34
043
114
68
771
6890
6617
038
NA
10K
oks
ara
266
671
12
53
22
406
145
967
114
211
111
015
041
NA
11K
aud
ola
146
601
11
97
30
603
214
111,
119
411
8051
180
58N
A
12K
asib
ahal
155
41
01
107
30
806
283
71,
238
253
9079
226
78N
A
13La
du
gao
n3
9752
11
113
62
01,
135
341
181,
842
473
267
220
431
103
NA
14M
ahim
a1
5018
10
18
66
464
617
48
989
161
150
116
220
52N
A
15M
ajh
igu
da
139
120
00
54
22
589
151
578
918
150
127
290
32N
A
16M
usa
pal
i1
335
10
15
33
042
313
64
735
9112
010
419
134
NA
17M
ote
r1
5846
11
17
00
068
822
511
1,10
920
224
320
013
266
NA
18Ph
up
gao
n1
5130
11
17
64
155
019
22
943
215
4440
182
51N
A
19R
eng
alp
ali
160
181
01
75
51
810
239
91,
129
179
150
113
321
52N
A
20Te
mer
a1
3818
11
18
65
464
120
49
1,01
224
015
313
027
153
NA
21K
oks
ara
Tota
l18
1,08
846
319
822
157
101
6218
12,5
334,
217
170
20,9
00N
AN
AN
AN
AN
A1,
108
NA

178
District Human Development Report
(Con
td...
)
10. L
anjig
arh
Sl.
No.
Nam
e o
f GP
Ad
min
stra
tio
n d
ata
Pap
ula
toin
Edu
cati
on
Ir
rig
atio
n
No. of villages
Total HH
Average family size
Total population
Total Male
Total female
Total SC
Total ST
Primary
UP School
Secondary School
Total no. of Teacher in PR/UP School
No. of school with D.water facility in
(PR/UP)
Separate latrine for boys & girls
No. of pond
No. of Minor Irrigation Project
No. of Lift irrigation projects
No. of watershed projects
1 B
and
hap
ari
401,
490
3.6
5,38
82,
625
2763
1,99
32,
396
54
127
112
110
54
2 B
ater
lima
1043
33.
31,
448
702
746
831,
252
20
16
11
40
3N
A
3 B
eng
aon
2892
24.
23,
853
1,91
01,
943
1,22
12,
369
72
016
150
60
NA
2
4 B
hat
ang
pad
ar34
516
4.0
2,05
81,
032
1,02
650
01,
547
81
028
82
20
NA
NA
5 B
hu
rtig
arh
2664
04.
02,
564
1,29
11,
273
345
1,86
64
21
156
17
0N
A4
6 B
ijep
ur
3599
83.
63,
639
1,75
11,
888
975
2,26
111
10
232
23
0N
AN
A
7 B
isw
anat
hp
ur
912
043.
64,
324
2,20
22,
122
747
964
83
131
80
91
NA
NA
8 C
ham
pad
eip
ur
151,
339
3.4
4,58
42,
270
2,31
41,
119
1,24
66
30
247
216
112
NA
9 C
hh
atra
pu
r13
1,16
43.
54,
055
1,94
92,
106
1,00
31,
629
84
125
93
101
4N
A
10 G
ob
ard
han
pu
r9
1,22
63.
34,
062
1,96
72,
095
639
1,39
03
62
409
619
112
1
11 G
un
dri
4986
43.
83,
244
1,60
71,
637
903
2,10
98
11
305
19
1N
A2
12 K
amar
da
161,
039
3.7
3,87
41,
977
1,89
755
82,
205
74
132
87
101
53
13 K
anku
tru
2483
93.
62,
996
1,46
91,
527
934
1,47
58
30
232
16
01
3
14 L
akh
abah
li21
926
4.1
3,78
21,
839
1,94
31,
135
2,22
29
10
178
06
1N
A1
15 L
anje
e29
1,14
03.
74,
200
2,06
82,
132
964
2,54
23
30
244
04
1N
A2
16 L
anjig
arh
231,
820
3.9
7,11
33,
601
3,51
21,
630
2,74
910
22
325
816
14
NA
17 L
.Ro
ad26
1,57
63.
35,
260
2,60
12,
659
1,26
51,
582
115
256
182
142
NA
NA
18 M
aliju
ban
ga
2459
64.
22,
519
1,22
31,
296
406
1,63
213
20
104
04
0N
AN
A
19Pa
had
pad
ar11
687
3.2
2,20
21,
096
1,10
650
61,
469
52
010
40
10
NA
NA
20Po
khar
iban
dh
a27
791
3.1
2,43
61,
211
1,22
568
481
45
11
202
37
2N
A3
21 T
rilo
chan
pu
r29
379
3.6
1,35
265
569
717
988
75
01
102
02
0N
AN
A
22To
tal L
anjig
arh
498
20,5
8976
.774
,953
37,0
4637
,907
17,7
8936
,606
146
5015
499
138
4116
613
4625

179
Annexures
Sl.
No.
Nam
e o
f GP
San
itat
ion
Hea
lth
ICD
S Se
rvic
eFo
od
Sec
uri
tySo
cial
Sec
uri
ty
No. of village having pipe water facility
No. of existing tube well
Sanitary HH Lartine
ANM Sub-centre
Sub-centre having pucca building
ANM in position
No. of AWC
No. of AWC having pucca building
No. of AWC having d.water
No. of AWC having toilet facilities
Total BPL Families
No. of Antodaya card holder
No. of Annapurna Card holder
No. of EGS/Job card holder
Madhubabu pension holder
IGNOAP
IGNWP
IGNDP
National Family benefit scheme (Beneficiary)
No. of IAY Beneficiary ( within last 3 years)
Mo Kudia( 2008-09 to 2010-11)
1 B
and
hap
ari
111
32
21
316
41
NA
734
269
101,
613
300
152
9119
366
8
2 B
ater
lima
024
01
01
54
21
277
996
375
9848
347
011
66
3 B
eng
aon
087
01
11
97
12
537
187
41,
179
200
103
4412
251
5
4 B
hat
ang
pad
ar0
390
11
14
2N
AN
A19
682
067
611
810
867
112
271
5 B
hu
rtig
arh
045
01
12
73
11
223
116
478
381
104
3211
132
4
6 B
ijep
ur
071
21
11
103
21
438
221
91,
211
100
136
01
145
2
7 B
isw
anat
hp
ur
374
251
11
74
13
605
245
394
722
920
951
62
456
8 C
ham
pad
eip
ur1
626
11
29
66
175
922
86
820
157
245
4330
048
1
9 C
hh
atra
pu
r1
691
11
210
53
158
229
53
1,19
622
020
059
221
144
4
10 G
ob
ard
han
pu
r2
5313
11
18
68
854
221
18
1,15
826
527
454
317
431
11 G
un
dri
062
21
01
53
1N
A49
619
410
1,01
017
621
363
143
426
12 K
amar
da
264
31
11
118
NA
249
820
49
1,39
913
118
653
210
453
13 K
anku
tru
042
01
01
65
NA
NA
486
169
389
619
412
358
210
353
14 L
akh
abah
li0
560
11
18
32
NA
543
191
680
111
312
037
141
482
15 L
anje
e0
702
11
18
4N
AN
A68
424
35
1,36
721
016
890
240
512
16 L
anjig
arh
111
220
21
214
6N
A1
977
567
121,
303
149
215
9819
194
16
17 L
.Ro
ad3
130
762
13
118
24
612
260
91,
650
273
202
7118
853
1
18 M
aliju
ban
ga
033
01
11
62
31
318
148
786
985
8963
70
311
19Pa
had
pad
ar0
260
11
16
14
NA
376
148
379
011
014
648
80
281
20Po
khar
iban
dha
161
11
11
52
11
382
140
669
811
793
4213
227
521
Tri
loch
anp
ur
046
01
11
51
1N
A12
810
12
440
104
8242
100
174
22To
tal L
anjig
arh
15
1,3
39
15
32
41
82
91
70
87
39
27
10,3
934
,31
81
25
21
,18
13
,43
03
,21
61,
140
31
93
41
,08
88
2

180
District Human Development Report
(Con
td...
)
11. M
. ram
pur
Sl.
No.
Nam
e o
f GP
Ad
min
stra
tio
n d
ata
Pap
ula
toin
Edu
cati
on
Ir
rig
atio
n
No. of villages
Total HH
Average family size
Total population
Total Male
Total female
Total SC
Total ST
Primary
UP School
Secondary School
Total no. of Teacher in PR/UP School
No. of school with D.water facility in
(PR/UP)
Separate latrine for boys & girls
No. of pond
No. of Minor Irrigation Project
No. of Lift irrigation projects
No. of watershed projects
1 A
lata
ra7
937
3.5
3247
1625
1622
568
580
62
114
62
20
42
2 B
amak
61,
101
2.8
3,09
71,
514
1,58
335
71,
039
42
113
62
80
01
3 B
arab
and
ha
351,
675
3.3
5,55
62,
765
2,79
180
23,
758
163
141
130
103
48
4 D
. Kar
lakh
un
ta16
913
3.7
3,41
51,
678
1,73
760
11,
547
83
124
81
60
73
5 G
och
had
eng
en20
1,76
33.
05,
273
2,61
12,
662
768
2,49
012
41
3212
218
17
1
6 M
adan
pu
r6
826
3.7
3,08
61,
563
1,52
343
223
94
21
145
29
11
27
Man
iker
a33
1,04
63.
63,
763
1,87
31,
890
472
2,58
210
41
229
15
08
78
Mo
han
gir
i40
2,45
13.
78,
953
4,43
04,
523
1,37
24,
141
154
148
92
182
110
9 M
ud
ing
61,
772
2.9
5,09
82,
577
2,52
177
81,
934
64
127
82
110
13
10 M
. Ram
pu
r10
2,51
13.
69,
125
4,73
64,
389
1,31
11,
322
85
138
115
102
192
11 N
un
pu
r13
877
3.5
3,10
11,
577
1,52
433
490
44
21
165
19
00
2
12 P
and
kam
al5
877
3.4
2,94
21,
477
1,46
561
838
15
21
207
25
02
1
13 U
rlad
ani
401,
484
3.5
5,23
12,
685
2,54
626
43,
950
113
129
101
80
05
14 S
alep
ali
774
83.
52,
631
1,30
91,
322
378
782
52
118
72
50
151
15Sa
idal
ang
a5
977
3.3
3,18
61,
559
1,62
739
761
04
21
166
25
00
0
16To
tal M
. Ram
pu
r24
919
,958
3.4
67,7
0433
,979
33,7
259,
452
26,2
5911
844
1537
212
227
129
969
48
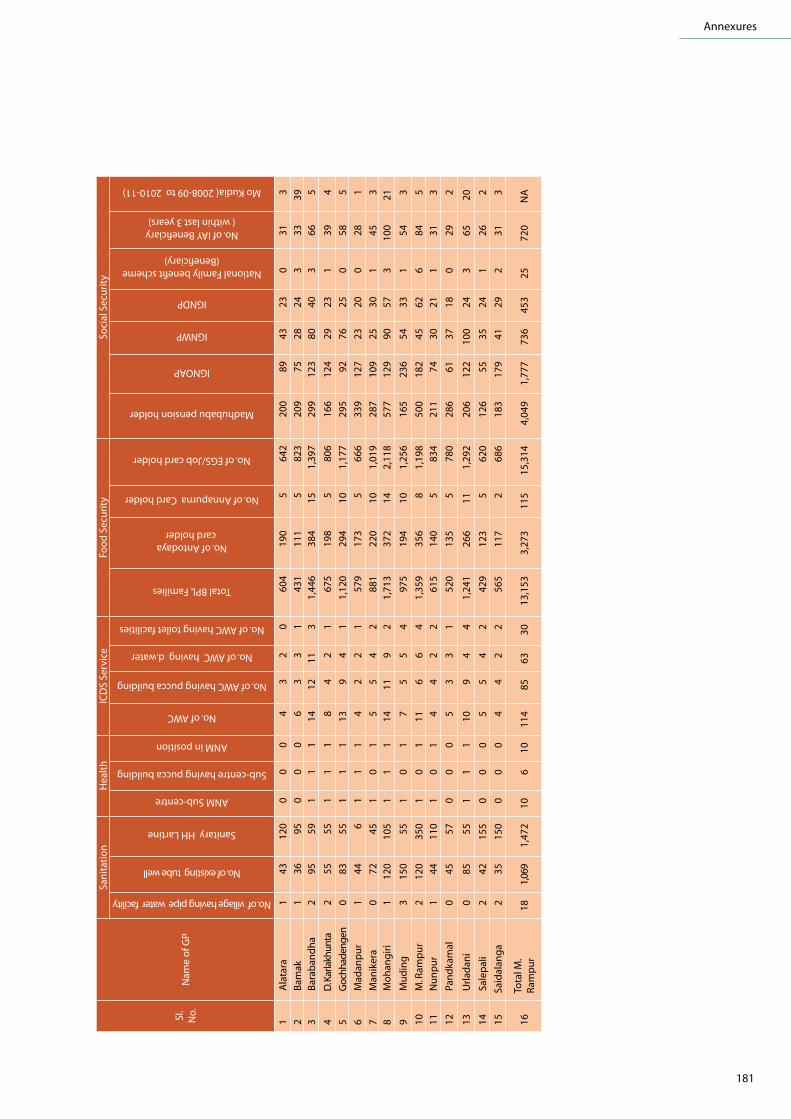
181
Annexures
Sl.
No.
Nam
e o
f GP
San
itat
ion
Hea
lth
ICD
S Se
rvic
eFo
od
Sec
uri
tySo
cial
Sec
uri
ty
No. of village having pipe water facility
No. of existing tube well
Sanitary HH Lartine
ANM Sub-centre
Sub-centre having pucca building
ANM in position
No. of AWC
No. of AWC having pucca building
No. of AWC having d.water
No. of AWC having toilet facilities
Total BPL Families
No. of Antodaya card holder
No. of Annapurna Card holder
No. of EGS/Job card holder
Madhubabu pension holder
IGNOAP
IGNWP
IGNDP
National Family benefit scheme (Beneficiary)
No. of IAY Beneficiary( within last 3 years)
Mo Kudia( 2008-09 to 2010-11)
1 A
lata
ra1
4312
00
00
43
20
604
190
564
220
089
4323
031
3
2 B
amak
136
950
00
63
31
431
111
582
320
975
2824
333
393
Bar
aban
dh
a2
9559
11
114
1211
31,
446
384
151,
397
299
123
8040
366
5
4 D
. Kar
lakh
unta
255
551
11
84
21
675
198
580
616
612
429
231
394
5 G
ochh
aden
gen
083
551
11
139
41
1,12
029
410
1,17
729
592
7625
058
5
6 M
adan
pu
r1
446
11
14
22
157
917
35
666
339
127
2320
028
1
7 M
anik
era
072
451
01
55
42
881
220
101,
019
287
109
2530
145
38
Mo
han
gir
i1
120
105
11
114
119
21,
713
372
142,
118
577
129
9057
310
021
9 M
ud
ing
315
055
10
17
55
497
519
410
1,25
616
523
654
331
543
10 M
. Ram
pu
r2
120
350
10
111
66
41,
359
356
81,
198
500
182
4562
684
5
11 N
un
pu
r1
4411
01
01
44
22
615
140
583
421
174
3021
131
3
12 P
and
kam
al0
4557
00
05
33
152
013
55
780
286
6137
180
292
13 U
rlad
ani
085
551
11
109
44
1,24
126
611
1,29
220
612
210
024
365
20
14 S
alep
ali
242
155
00
05
54
242
912
35
620
126
5535
241
262
15Sa
idal
ang
a2
3515
00
00
44
22
565
117
268
618
317
941
292
313
16To
tal M
. R
amp
ur
181,
069
1,47
210
610
114
8563
3013
,153
3,27
311
515
,314
4,04
91,
777
736
453
2572
0N
A
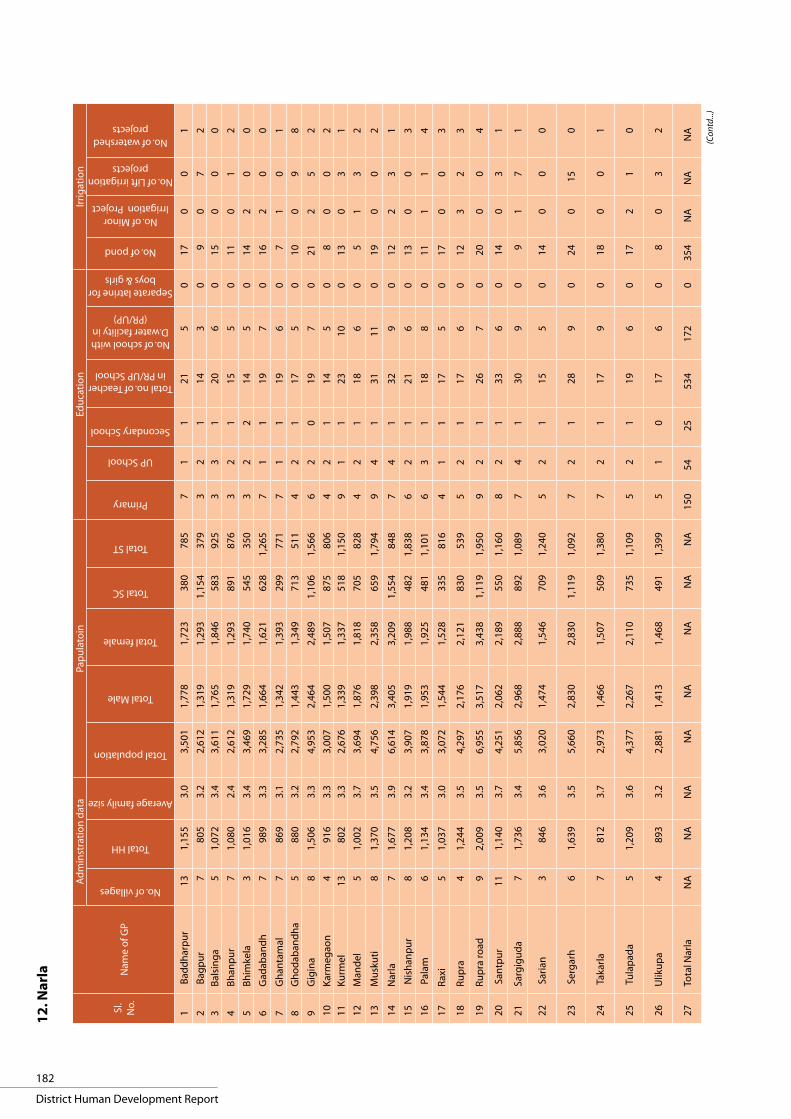
182
District Human Development Report
12. N
arla
Sl.
No.
Nam
e o
f GP
Ad
min
stra
tio
n d
ata
Pap
ula
toin
Edu
cati
on
Ir
rig
atio
n
No. of villages
Total HH
Average family size
Total population
Total Male
Total female
Total SC
Total ST
Primary
UP School
Secondary School
Total no. of Teacher in PR/UP School
No. of school with D.water facility in
(PR/UP)
Separate latrine for boys & girls
No. of pond
No. of Minor Irrigation Project
No. of Lift irrigation projects
No. of watershed projects
1 B
add
har
pu
r13
1,15
53.
03,
501
1,77
81,
723
380
785
71
121
50
170
01
2 B
agp
ur
780
53.
22,
612
1,31
91,
293
1,15
437
93
21
143
09
07
2
3B
alsi
ng
a5
1,07
23.
43,
611
1,76
51,
846
583
925
33
120
60
150
00
4B
han
pu
r7
1,08
02.
42,
612
1,31
91,
293
891
876
32
115
50
110
12
5B
him
kela
31,
016
3.4
3,46
91,
729
1,74
054
535
03
22
145
014
20
0
6G
adab
and
h7
989
3.3
3,28
51,
664
1,62
162
81,
265
71
119
70
162
00
7G
han
tam
al7
869
3.1
2,73
51,
342
1,39
329
977
17
11
196
07
10
1
8G
ho
dab
and
ha
588
03.
22,
792
1,44
31,
349
713
511
42
117
50
100
98
9G
igin
a8
1,50
63.
34,
953
2,46
42,
489
1,10
61,
566
62
019
70
212
52
10K
arm
egao
n4
916
3.3
3,00
71,
500
1,50
787
580
64
21
145
08
00
2
11Ku
rmel
1380
23.
32,
676
1,33
91,
337
518
1,15
09
11
2310
013
03
1
12M
and
el5
1,00
23.
73,
694
1,87
61,
818
705
828
42
118
60
51
32
13M
usk
uti
81,
370
3.5
4,75
62,
398
2,35
865
91,
794
94
131
110
190
02
14N
arla
71,
677
3.9
6,61
43,
405
3,20
91,
554
848
74
132
90
122
31
15 N
ish
anp
ur
81,
208
3.2
3,90
71,
919
1,98
848
21,
838
62
121
60
130
03
16 P
alam
61,
134
3.4
3,87
81,
953
1,92
548
11,
101
63
118
80
111
14
17R
axi
51,
037
3.0
3,07
21,
544
1,52
833
581
64
11
175
017
00
3
18Ru
pra
41,
244
3.5
4,29
72,
176
2,12
183
053
95
21
176
012
32
3
19Ru
pra
road
92,
009
3.5
6,95
53,
517
3,43
81,
119
1,95
09
21
267
020
00
4
20 S
antp
ur
111,
140
3.7
4,25
12,
062
2,18
955
01,
160
82
133
60
140
31
21Sa
rgig
ud
a7
1,73
63.
45,
856
2,96
82,
888
892
1,08
97
41
309
09
17
1
22 S
aria
n3
846
3.6
3,02
01,
474
1,54
670
91,
240
52
115
50
140
00
23 S
erg
arh
61,
639
3.5
5,66
02,
830
2,83
01,
119
1,09
27
21
289
024
015
0
24 T
akar
la7
812
3.7
2,97
31,
466
1,50
750
91,
380
72
117
90
180
01
25 T
ula
pad
a5
1,20
93.
64,
377
2,26
72,
110
735
1,10
95
21
196
017
21
0
26U
liku
pa
489
33.
22,
881
1,41
31,
468
491
1,39
95
10
176
08
03
2
27To
tal N
arla
NA
NA
NA
NA
NA
NA
NA
NA
150
5425
534
172
035
4N
AN
AN
A
(Con
td...
)

183
Annexures
Sl. N
o.N
ame
of G
P
San
itat
ion
Hea
lth
ICD
S Se
rvic
eFo
od
Sec
uri
tySo
cial
Sec
uri
ty
No. of village having pipe water facility
No. of existing tube well
Sanitary HH Lartine
ANM Sub-centre
Sub-centre having pucca building
ANM in position
No. of AWC
No. of AWC having pucca building
No. of AWC having d.water
No. of AWC having toilet facilities
Total BPL Families
No. of Antodaya card holder
No. of Annapurna Card holder
No. of EGS/Job card holder
Madhubabu pension holder
IGNOAP
IGNWP
IGNDP
National Family benefit scheme (Beneficiary)
No. of IAY Beneficiary( within last 3 years)
Mo Kudia( 2008-09 to 2010-11)
1 B
add
har
pu
rN
il52
205
Nil
Nil
Nil
53
369
719
17
999
269
135
5111
034
3
2 B
agp
ur
141
251
11
43
32
486
128
965
310
013
726
92
301
3B
alsi
ng
aN
il38
9N
ilN
ilN
il5
33
NA
444
148
988
324
212
250
90
363
4B
han
pu
r1
4541
1N
il1
63
31
747
169
871
017
517
577
244
383
5B
him
kela
139
311
11
52
2N
A67
818
28
669
201
154
3019
231
3
6G
adab
and
h0
4625
40
00
42
2N
A54
715
56
970
221
110
4812
137
4
7G
han
tam
al0
4950
11
19
31
NA
985
153
575
029
810
210
102
283
8G
ho
dab
and
ha
136
220
00
52
3N
A58
213
19
604
201
169
219
028
6
9G
igin
a0
5717
10
12
11
NA
549
235
111,
095
175
191
3210
155
2
10K
arm
egao
n0
3110
00
04
22
NA
566
135
457
618
697
348
031
1
11Ku
rmel
045
41
11
42
22
478
158
877
975
197
617
131
3
12M
and
el1
3414
10
14
22
NA
600
157
581
612
017
856
203
385
13M
usk
uti
057
221
11
64
33
903
237
91,
192
210
215
3014
052
6
14N
arla
199
159
11
17
33
11,
100
338
111,
118
360
267
5626
664
7
15 N
ish
anp
ur
149
116
11
15
21
NA
735
196
992
331
714
960
101
434
16 P
alam
141
481
11
63
3N
A55
912
98
714
130
8250
221
404
17R
axi
036
119
00
04
21
NA
397
125
270
613
577
429
729
2
18Ru
pra
154
119
11
16
44
NA
730
235
575
721
314
125
91
413
19Ru
pra
road
389
209
11
17
41
NA
1,12
427
510
1,19
725
522
444
171
693
20 S
antp
ur
257
110
11
16
55
467
818
34
764
155
9067
70
435
21Sa
rgig
ud
a1
8210
51
11
95
5N
A75
221
85
1,07
120
215
366
121
574
22 S
aria
n1
40
25
31
11
51
1N
A5
38
13
37
71
57
51
52
51
23
23
45
23 S
erg
arh
06
12
81
11
95
5N
A1
,10
12
74
61
,31
03
10
15
14
38
15
66
24 T
akar
la0
47
27
00
05
22
36
09
13
23
67
51
13
14
24
41
21
34
425
Tu
lap
ada
04
13
81
11
64
3N
A7
85
19
89
76
71
97
15
84
29
24
61
26U
liku
pa
13
42
29
11
15
22
NA
52
81
39
17
17
19
61
18
24
82
32
2
27To
tal N
arla
NA
NA
NA
19
16
19
14
37
46
61
6N
A4
,75
4N
AN
AN
AN
AN
AN
AN
A1
,05
7N
A

184
District Human Development Report
13. T
h. r
ampu
r
Sl.
No.
Nam
e o
f GP
Ad
min
stra
tio
n d
ata
Pap
ula
toin
Edu
cati
on
Ir
rig
atio
n
No. of villages
Total HH
Average family size
Total population
Total Male
Total female
Total SC
Total ST
Primary
UP School
Secondary School
Total no. of Teacher in PR/UP School
No. of school with D.water facility in
(PR/UP)
Separate latrine for boys & girls
No. of pond
No. of Minor Irrigation Project
No. of Lift irrigation projects
No. of watershed projects
1B
adch
hat
ran
g16
1,78
63.
15,
624
2,73
12,
893
1,89
22,
770
84
130
80
33
NA
3
2D
um
erp
adar
131,
372
3.6
4,99
22,
600
2,39
21,
842
2,20
56
20
170
00
1N
A1
3G
op
alp
ur
131,
304
4.2
5,42
22,
606
2,81
61,
451
2,96
411
40
290
03
0N
A1
4G
op
inat
hp
ur
141,
094
3.0
3,30
11,
603
1,69
81,
186
1,57
03
50
151
02
0N
A3
5G
un
pu
r21
1,42
43.
95,
522
2,85
62,
666
826
3,31
69
20
223
00
0N
AN
A
6K
anig
um
a30
1,59
13.
55,
529
2,73
92,
790
900
3,50
213
51
390
01
0N
A7
7K
arla
pat
311,
244
3.4
4,22
22,
105
2,11
773
62,
454
94
133
73
33
NA
13
8K
erp
ai32
978
4.0
3,91
41,
898
2,01
649
43,
382
131
134
00
00
NA
NA
9M
ahu
lpat
na
91,
020
3.4
3,51
41,
718
1,79
61,
332
1,66
77
11
200
00
0N
A3
10M
allig
aon
1369
53.
52,
426
1,19
71,
229
588
1,34
23
31
151
00
0N
A5
11N
akru
nd
i31
904
3.9
3,53
71,
725
1,81
266
32,
583
72
121
00
00
NA
512
Ad
ri10
870
3.4
2,97
71,
434
1,54
371
81,
420
42
117
00
00
NA
3
13Pa
dep
adar
890
42.
92,
661
1,31
31,
348
972
1,34
34
11
131
00
0N
A3
14Si
ndhi
pad
ar18
892
3.7
3,28
21,
590
1,69
262
72,
333
71
125
00
00
6N
A
15Ta
lnag
i23
826
3.3
2,74
91,
283
1,46
650
81,
939
42
010
20
00
312
16Th
. Ram
pur
171,
832
2.8
5,08
62,
981
2,10
52,
105
3,06
611
40
365
03
07
NA
17To
tal T
h. R
amp
ur25
714
,274
NA
48,7
2024
,442
24,2
7811
,655
29,9
1711
943
10N
A28
3N
AN
AN
AN
A
(Con
td...
)

185
Annexures
Sl.
No.
Nam
e o
f GP
San
itat
ion
Hea
lth
ICD
S Se
rvic
eFo
od
Sec
uri
tySo
cial
Sec
uri
ty
No. of village having pipe water facility
No. of existing tube well
Sanitary HH Lartine
ANM Sub-centre
Sub-centre having pucca building
ANM in position
No. of AWC
No. of AWC having pucca building
No. of AWC having d.water
No. of AWC having toilet facilities
Total BPL Families
No. of Antodaya card holder
No. of Annapurna Card holder
No. of EGS/Job card holder
Madhubabu pension holder
IGNOAP
IGNWP
IGNDP
National Family benefit scheme (Beneficiary)
No. of IAY Beneficiary ( within last 3 years)
Mo Kudia( 2008-09 to 2010-11)
1B
adch
hat
ran
g0
540
11
112
41
01,
128
392
81,
849
350
187
4510
603
2D
um
erp
adar
048
00
00
124
30
705
249
81,
416
284
9550
252
73
Go
pal
pu
r3
650
11
114
74
591
032
79
1,51
340
215
843
261
24
Go
pin
ath
pu
r2
390
11
18
22
063
124
54
1,08
325
778
383
501
5G
un
pu
r2
559
10
213
64
375
729
910
1,01
422
569
29N
il55
06
Kan
igu
ma
367
01
11
175
44
996
345
91,
437
292
9726
259
17
Kar
lap
at4
640
11
112
53
378
930
19
967
202
7315
555
18
Ker
pai
549
01
11
81
00
807
270
1192
527
068
5N
il58
09
Mah
ulp
atn
a0
399
11
18
10
061
323
35
979
232
8316
Nil
351
10M
allig
aon
028
00
00
81
00
352
141
668
617
926
14N
il39
011
Nak
run
di
240
31
11
71
00
497
291
1190
421
610
65
Nil
400
12A
dri
641
11
11
51
00
526
148
493
822
560
30N
il35
113
Pad
epad
ar0
330
10
112
20
041
313
85
867
215
524
Nil
311
14Si
ndhi
pad
ar3
281
12
72
10
623
228
288
826
686
30N
il51
515
Taln
agi
014
00
09
31
058
122
55
823
168
427
Nil
381
16Th
. Ram
pur
288
32
315
33
01,
146
428
82,
117
430
178
657
644
17To
tal T
h.
Ram
pur
3275
2N
AN
AN
AN
A16
748
2615
11,4
744,
260
114
18,4
064,
213
1,45
842
231
783
28


Published by Planning and Coordination Department, Government of Odisha