
DISTRICT CENSUS HANDBOOK - 2011 Census of · PDF fileThe District Census Handbook ... non...
172
Census of India 2011 JHARKHAND SERIES-21 PART XII-B DISTRICT CENSUS HANDBOOK SIMDEGA VILLAGE AND TOWN WISE PRIMARY CENSUS ABSTRACT (PCA) DIRECTORATE OF CENSUS OPERATIONS JHARKHAND
Transcript of DISTRICT CENSUS HANDBOOK - 2011 Census of · PDF fileThe District Census Handbook ... non...
Census of India 2011
JHARKHAND
SERIES-21 PART XII-B
DISTRICT CENSUS HANDBOOK
SIMDEGA
VILLAGE AND TOWN WISE
PRIMARY CENSUS ABSTRACT (PCA)
DIRECTORATE OF CENSUS OPERATIONS
JHARKHAND


CENSUS OF INDIA 2011
JHARKHAND SERIES-21 PART XII - B
DISTRICT CENSUS HANDBOOK
SIMDEGA
VILLAGE AND TOWN WISE PRIMARY CENSUS ABSTRACT (PCA)
Directorate of Census Operations JHARKHAND

Motif
Kelaghag dam
The Kelaghag dam, constructed across the Chhinda River, is at a distance of 4 km. from the town of Simdega. The dam is surrounded by hills and park. The district administration provides motor boating and parasailing facilities.

Pages
1 1
2 3
3 6
4 8
5 10
6 12
7 14
8 16
9
(i) 20
(ii) 25
(iii) 33
(iv) 37
(v) 45
(vi) 53
(vii) 139
10 Section –II Tables based on Households Amenities and Assets (Rural/Urban) at District and Sub-District level.
(i) Table -1: Households by Ownership status and by Number of Dwellingrooms occupied in the District, 2011 149
History and Scope of the District Census Handbook
Urban PCA-Town wise Primary Census Abstract
Section - I Primary Census Abstract (PCA)
Brief note on Primary Census Abstract
District Primary Census Abstract
Appendix to District Primary Census Abstract Total, Scheduled Castes andScheduled Tribes Population - Urban Block wise
Primary Census Abstract for Scheduled Castes (SC)
Rural PCA-C.D. blocks wise Village Primary Census Abstract
Contents
Primary Census Abstract for Scheduled Tribes (ST)
Administrative Setup
Important Statistics
District Highlights - 2011 Census
Brief History of the District
Foreword
Preface
Acknowledgement

(ii) Table -2: Percentage distribution of Households living in Permanent,Semi permanent and Temporary houses, 2011 150
(iii) Table -3: Number and Percentage of Households by main source ofDrinking water, 2011 152
(iv) Table -4: Number and Percentage of Households by main source ofLighting, 2011 154
(v) Table -5: Number and Percentage of Households by type of Latrinefacility, 2011 156
(vi) Table -6: Number and Percentage of Households by type of Drainageconnectivity for waste water outlet, 2011 158
(vii) Table -7: Number and Percentage of Households by availability ofKitchen facility, 2011 159
(viii) Table -8: Number and Percentage of Households by type of fuel used forCooking, 2011 160
(ix) Table -9:Number and Percentage of Households availing Bankingservices and number of Households having each of thespecified Assets, 2011
162
1
FOREWORD
The District Census Handbook (DCHB) is an important publication of the CensusOrganization since 1951. It contains both Census and non Census data of urban and rural areas for each District. The Census data provide information on demographic and socio-economic characteristics of population at the lowest administrative unit i.e. of each Village and Town and ward of the District. The Primary Census Abstract (PCA) part of this publication contains Census data including data on household amenities collected during 1st.phase of the Census i.e. House Listing and Housing Census. The non Census data presented in the DCHB is in the form of Village Directory and Town Directory contain information on various infrastructure facilities available in the village and town viz; education, medical, drinking water, communication and transport, post and telegraph, electricity, banking, and other miscellaneous facilities. Later on, the Telegraph Services were closed by the Government of India on 15th. July, 2013. The data of DCHB are of considerable importance in the context of planning and development at the grass-root level.
2. In the 1961 Census, DCHB provided a descriptive account of the District,administrative statistics, Census tables and Village and Town Directory including Primary Census Abstract. This pattern was changed in 1971 Census and the DCHB was published in three parts: Part-A related to Village and Town Directory, Part-B to Village and Town PCA and Part-C comprised analytical report, administrative statistics, District Census tables and certain analytical tables based on PCA and amenity data in respect of Villages. The 1981 Census DCHB was published in two parts: Part-A contained Village and Town Directory and Part-B the PCA of Village and Town including the SCs and STs PCA up to Tahsil/Town levels. New features along with restructuring of the formats of Village and Town Directory were added. In Village Directory, all amenities except electricity were brought together and if any amenity was not available in the referent Village, the distance in broad ranges from the nearest place having such an amenity, was given.
3. The pattern of 1981 Census was followed by and large for the DCHB of 1991Census except the format of PCA. It was restructured. Nine-fold industrial classification of main workers was given against the four-fold industrial classification presented in the 1981 Census. In addition, sex wise population in 0-6 age group was included in the PCA for the first time with a view to enable the data users to compile more realistic literacy rate as all children below 7 years of age had been treated as illiterate at the time of 1991 Census. One of the important innovations in the 1991 Census was the Community Development Block (CD Block) level presentation of Village Directory and PCA data instead of the traditional Tahsil/Taluk/PS level presentation.
4. As regards DCHB of 2001 Census, the scope of Village Directory was improved byincluding some other amenities like banking, recreational and cultural facilities, newspapers & magazines and `most important commodity’ manufactured in a Village in addition to prescribed facilities of earlier Censuses. In Town Directory, the statement on Slums was modified and its coverage was enlarged by including details on all slums instead of ‘notified slums’.

2
5. The scope and coverage of Village Directory of 2011 DCHB has been widened byincluding a number of new amenities in addition to those of 2001. These newly added amenities are: Pre-Primary School, Engineering College, Medical College, Management Institute, Polytechnic, Non-formal Training Centre, Special School for Disabled, Community Health Centre, Veterinary Hospital, Mobile Health Clinic, Medical Practitioner with MBBS Degree, Medical Practitioner with no degree, Traditional Practitioner and faith Healer, Medicine Shop, Community Toilet, Rural Sanitary Mart or Sanitary Hardware Outlet in the Village, Community Bio- gas, Sub Post Office, Village Pin Code, Public Call Office, Mobile Phone Coverage, Internet Cafes/ Common Service Centre, Private Courier Facility, Auto/Modified Autos, Taxis and Vans, Tractors, Cycle-pulled Rickshaws, Carts driven by Animals, Village connected to National Highway, State Highway, Major District Road, and Other District Road, Availability of Water Bounded Macadam Roads in Village, ATM, Self-Help Group, Public Distribution System(PDS) Shop, Mandis/Regular Market, Weekly Haat, Agricultural Marketing Society, Nutritional Centers (ICDS), Anganwadi Centre, ASHA (Accredited Social Health Activist), Sports Field, Public Library, Public Reading Room, Assembly Polling station, Birth & Death Registration Office. In the Town Directory, seven Statements containing the details and the data of each Town have been presented viz.; (i)-Status and Growth History of Towns,(ii)- Physical Aspects and Location of Towns, (iii)-Civic and other Amenities, (iv)-Medical Facilities, (v)-Educational, Recreational & Cultural Facilities, (vi)- Industry & Banking, and (vii)- Civic & other amenities in Slums respectively. CD Block wise data of Village Directory and Village PCA have been presented in DCHB of 2011 Census as presented in earlier Census.
6. The data of DCHB 2011 Census have been presented in two parts, Part-A containsVillage and Town Directory and Part-B contains Village and Town wise Primary Census Abstract. Both the Parts have been published in separate volumes in 2011 Census.
7. The Village and Town level amenities data have been collected, compiled andcomputerized under the supervision of Sh. Sunil Kumar Baranwal, Director of Census Operation, Jharkhand. The task of Planning, Designing and Co-ordination of this publication was carried out by Dr. Pratibha Kumari, Assistant Registrar General (SS) under the guidance & supervision of Dr. R.C.Sethi, Ex-Addl. RGI and Shri Deepak Rastogi present Addl.RGI. Shri A.P. Singh, Deputy Registrar General, (Map) provided the technical guidance in the preparation of maps. Shri A.K. Arora, Joint Director of Data Processing Division under the overall supervision of Shri M.S.Thapa, Addl. Director (EDP) provided full cooperation in preparation of record structure for digitization and validity checking of Village and Town Directory data and the programme for the generation of Village Directory and Town Directory including various analytical inset tables as well as Primary Census Abstract (PCA). The work of preparation of DCHB, 2011 Census has been monitored in the Social Studies Division. I am thankful to all of them and others who have contributed to bring out this publication in time.
(C.Chandramouli) Registrar General &
Census Commissioner, India New Delhi. Dated:- 16-06-2014

3
Preface he history of the publication of District Census Handbooks goes back to
the 1951 Census and since then these are printed after every Census because of their wide ranging utility. Census after Census much innovations/modifications have taken place in the District Census Handbooks in terms of coverage and contents of population data. This is the very useful and valuable district level publication brought out by the Census Organisation on behalf of the State Government. It, inter-alia, provides data/information on some of the basic demographic and socio-economic characteristics and availability of certain important civic amenities/facilities in each village and town of the respective districts. This publication has, proved to be of immense utility to the planners, administrators, academicians and researchers. It is hoped that this publication will serve the purpose of the ever increasing demand for the micro-level data in this era for planning development. The present volume of the District Census Handbook Part –A (village and town directories amenities) and Part-B (Primary Census Abstract) of 2011 Census has been made more informative and exhaustive in terms of coverage and content. The content of Village Directory has been broadened by including a number of new amenities in addition to those of 2001. These newly added amenities are: Pre-Primary School, Engineering College, Medical College, Management Institute, Polytechnic, Non-formal Training Centre, Special School for Disabled, Community Health Centre, Veterinary Hospital, Mobile Health Clinic, Medical Practitioner with MBBS Degree, Medical Practitioner with no degree, Traditional Practitioner and faith Healer, Medicine Shop, Community Toilet, Rural Sanitary Mart or Sanitary Hardware Outlet in the Village, Community Bio- gas, Sub Post Office, Village Pin Code, Public Call Office, Mobile Phone Coverage, Internet Cafe/ Common Service Centre, Private Courier Facility, Auto/Modified Autos, Taxis and Vans, Tractors, Cycle-pulled Rickshaws, Carts driven by Animals, Village connected to National Highway, State Highway, Major District Road, and Other District Road, Availability of Water Bounded Macadam Roads in Village, ATM, Self-Help Group, Public Distribution System(PDS) Shop, Mandis/Regular Market, Weekly Haat, Agricultural Marketing Society, Nutritional Centers (ICDS), Anganwadi Centre, ASHA/SAHIYA in Jharkhand, Sports Field, Public Library, Public Reading Room, Assembly Polling station, Birth & Death Registration Office. In the Town Directory, seven Statements containing the details and the data of each Town have been presented viz.; (i)-Status and Growth History of Towns,(ii)- Physical Aspects and Location of Towns, (iii)-Civic and other Amenities, (iv)-Medical Facilities, (v)-Educational, Recreational & Cultural Facilities, (vi)- Industry & Banking, and (vii)- Civic & other amenities in Slums respectively. CD Block wise data of Village Directory and Village PCA have been presented in DCHB of 2011 Census as presented in earlier Census. The various basic amenities available in the villages and towns are analysed in depth with the help of a number of cross-classified inset tables and statements.
T

4
It is worthwhile to mention that the District Census Handbooks of the Census of India, 2011 are being made available in electronic format also in addition to printed volumes keeping in view the demand of data users.
The District Census Handbooks are brought out in two parts, viz. (i) part A containing the village and town directories and (ii) part B – village and town-wise primary Census Abstracts pertaining to general population. It also contains the District Primary Census Abstracts for Scheduled Castes and the Scheduled Tribes Population.
The village and town level amenity data have been collected through the Block Development Officers and the Vice Chairmen/Executive Officers of the Municipalities and Notified Area Committees who functioned as Charge Officer under the District/Sub-divisional level Officers.
The analytical note has been prepared on the basis of the inset tables generated from the computerized data of Village Directory, Town Directory and Village/Urban Primary Census Abstract. It takes note of the social, economic and demographic changes which have taken place in the districts during the decade. District and C.D. Block Maps containing useful information on many items have also been included in this volume.
This publication is a joint venture of the State Government and the Census organisation. We are grateful to the State Government agencies for their co-operation in collection of such a huge volume of data. We would like to make a special mention of the warm and whole hearted co-operation which was throughout extended by the Deputy Commissioner, the Sub-divisional Officers, the District Census Officers and the Block Development Officers.
In this office Shri Subhash Chandra Tripathi, Joint Director, Shri Priyatosh Amist, Deputy Director, Shri Dinesh Kumar, Deputy Director, Dr. Satyendra Kumar Gupta, Assistant Director, Dr. Bhim Raj Hansdah, Assistant Director and Shri Sant Ram, Assistant Director supervised the project at different stages. In this voluminous job valuable assistance was rendered by Shri Pradeep Kumar, Ram Bhaskar Dwivedi, Manoj Kumar and Birendra Prasad Singh, Statistical Investigators Grade-II, who were responsible for supervision from beginning to end under guidance of Shri Sant Ram, Assistant Director. Dr. Bhim Raj Hansdah, Assistant Director has also been associated to monitor the digitization, scrutiny and validity work of Village Directory and Town Directory data. Shri Pradeep Kumar, Ram Bhaskar Dwivedi, Manoj Kumar and Birendra Prasad Singh, Statistical Investigators Grade-II, prepared the analytical notes on inset tables based on the data of Village Directory, Town Directory and Primary Census Abstracts under the guidance of Shri Priyatosh Amist, Deputy Director, Dr. Satyendra Kumar Gupta, Assistant Director, Dr. Bhim Raj Hansdah, Assistant Director and Shri Sant Ram, Assistant Director as teams were formed for validity and final preparation of District Census Hand Book of Census of India 2011 and over all monitoring work was under the guidance of Shri Priyatosh Amist, Deputy Director under the supervision of Dr. Prathiba Kumari, Assistant Registrar General (SS), India. Districts and C.D. Blocks Maps were prepared in Map Section under the supervision of Sri Mukut Guria Research officer (Map) with help of Sri Jitendra Saini, Geographer and Sri Indra Kant Mishra Sr. Drawing Assistant. Sri Niraj Kumar Sahu and Sri Tanwir Anjum, Compilers typed the manuscript and prepared the tables.
5
Printing In-charge of RGI and DCO helped in getting the volume printed in-house. This Directorate is highly indebted to Sri C. Chandramouli, Registrar General and Census Commissioner, India under whose guidance it has been rare privilege to strive for results. We are equally indebted to Dr. Prathiba Kumari, Assistant Registrar General (SS) for spontaneous help and encouragement at different stages of the work of this project with guidance. We are also thankful to Sri M.S. Thapa, Additional. Director, Sri A.K. Arora, Joint Director and Sri Ramesh Kumar, Deputy Director of EDP Division, who scrutinized the manuscript and database of PCA data as well as village and town directory and guided for release of DCHB Part-A & B in electronic form.
Sh.Sunil Kumar Barnwal
Directorate of Census Operations, Ranchi Jharkhand

6
Acknowledgement
List of Officers/Officials involved in preparation of DCHB’s Census of 2011 in the
Directorate of Census Operations, Jharkhand, Ranchi
Name Designation Sri Subhash Chandra Tripathi Joint Director Sri Priyatosh Amist Deputy Director Sri Dinesh Kumar Deputy Director Dr. Satyendra Kumar Gupta Assistant Director Dr. Bhim Raj Hansdah Assistant Director Sri Sant Ram Assistant Director Sri P. Behra Assistant Director (DCC) Sri M. Guria Research Officer (Map) Smt. Beena Kujur Statistical Investigator Grade I
D.C.H.B. Section Sri Ram Bhaskar Dwivedi Statistical Investigator Grade II Sri Pradeep Kumar Statistical Investigator Grade II Sri Manoj Kumar Statistical Investigator Grade II Sri Birendra Prasad Singh Statistical Investigator Grade II Sri Niraj Kumar Sahu Compiler Sri Santhosh Prasad Compiler Sri Nandlal Pd. Raut Compiler Sri Satendra Kumar Compiler
Name Designation Sri Ashutosh Kumar Bisi Statistical Investigator Grade II Sri Murari Mohan Statistical Investigator Grade II Sri Akhilesh Kumar Statistical Investigator Grade II Sri Chandra Bhushan Kumar Statistical Investigator Grade II Sri Rajeshwar Prasad Statistical Investigator Grade II Sri Naval Kishor Prasad Sr. Compiler Sri Sashi Bhusan Prasad Sr. Compiler Sri Harendra Prasad Sinha Sr. Compiler Sri Bhaiya Girish Kumar Sr. Compiler Sri Anil Choudhary Compiler Sri Jagarnath Choudhary Compiler Sri Vijay Kumar Compiler Sri Sadique Hussain Compiler Sri Deepak Kumar Compiler Sri Mulchand Mehta Compiler Sri Tanwir Anjum Compiler

7
Sri Rajnish Kumar Compiler Sri Baijnath Kumar Compiler
Map Section
Sri Jitendra Saini Geographer Sri Indrakant Mishra Senior Drawing Assistant
DCC Section
Sri Pyarelal Khandait DEO Mrs. Kiran Tigga DEO Mrs. Sushma Manjula Minz DEO Sri Ashish Kumar Sr. Consultant Sri Uttam Kumar Sr. Consultant Sri Pankaj Kumar Sr. Consultant Sri Gyan Kr. Mahto Jr. Consultant
ORGI- Data Processing Division
Shri Jaspal Singh Lamba DD(EDP) Ms. Usha AD(EDP) Shri Anurag Gupta DPA Grade ‘A’ Shri Mukesh Kumar Mahawar DPA Grade ‘A’ Ms. Shagufta Nasreen Bhat DPA Grade ‘A’ Ms. Shashi Seth Sr. Supervisor Shri Khem Verma Jadon Sr. Consultant Shri Yashwant Singh Jr. Consultant Ms. Neha Tuli Software Developer
--------------------------------------

8
HISTORY AND SCOPE OF THE DISTRICT CENSUS HANDBOOK
The need of data at the grass root level for the administrative and planning purposes at sub micro level as well as academic studies prompted the innovation of District Census Handbook. District Census Handbook is a unique publication from the Census organization which provides most authentic details of census and non-census information from village and town level to district level. The District Census Handbook was firstly introduced during the 1951 Census. It contains both census and non census data of urban as well as rural areas for each district. The census data contain several demographic and socio-economic characteristics of the lowest administrative unit i.e. of each village and town and ward of the district. The non census data comprise of data on availability of various civic amenities and infrastructural facilities etc. at the town and village level which constitute Village Directory and Town Directory part of the DCHB. The data of DCHB are of considerable importance in the context of planning and development at grass-root level.
In 1961 census DCHB provided a descriptive account of the district, administrative statistics, census tables and village and town directory including Primary Census Abstract. This pattern was changed in 1971 Census and the DCHB was published in three parts: Part-A related to village and town directory, Part-B to village and town PCA and Part-C comprised analytical report, administrative statistics, district census tables and certain analytical tables based on PCA and amenity data in respect of villages. The 1981 census DCHB was published in two parts: Part-A contained village and town directory and Part-B the PCA of village and town including the SCs and STs PCA up to tahsil/town levels. New features along with restructuring of the formats of village and town directory were added into it. In Village Directory, all amenities except electricity were brought together and if any amenity was not available in the referent village, the distance in broad ranges from the nearest place having such an amenity, was given.
The pattern of 1981 census was followed by and large for the DCHB of 1991 Census except the format of PCA. It was restructured. Nine-fold industrial classification of main workers was given against the four-fold industrial classification presented in the 1981 census. In addition, sex wise population in 0-6 age group was included in the PCA for the first time with a view to enable the data users to compile more realistic literacy rate as all children below 7 years of age had been treated as illiterate at the time of 1991 census. One of the important innovations in the 1991 census was the Community Development Block (CD Block) level presentation of village directory and PCA data instead of the traditional tahsil/taluk/PS level presentation.
As regards DCHB of 2001 Census, the scope of Village Directory was improved by including some other amenities like banking, recreational and cultural facilities, newspapers & magazines and `most important commodity’ manufactured in a village in addition to prescribed facilities of earlier censuses. In Town Directory, the statement on Slums was modified and its

9
coverage was enlarged by including details on all slums instead of ‘notified slums’.
The scope and coverage of Village Directory of 2011 DCHB has been widened by including a number of new amenities in addition to those of 2001. In the Town Directory, seven Statements containing the details and the data of each town have been presented viz.; (i)-Status and Growth History of towns,(ii)- Physical Aspects and Location of Towns, (iii)-Civic and other Amenities, (iv)-Medical Facilities, (v)-Educational, Recreational & Cultural Facilities, (vi)- Industry & Banking, and (vii)- Civic & other amenities in Slums respectively. CD Block wise data of Village Directory and Village PCA have been presented in DCHB of 2011 census as presented in earlier census. The data of DCHB 2011 Census have been presented in two parts, Part-A contains Village and Town Directory and Part-B contains Village and Town wise Primary Census Abstract. Both the Parts have been published in separate volumes in 2011 Census.
--------------------------------------------------------

10
Brief History of the district
Simdega District is situated in the southwestern part of the state of Jharkhand. The borders of Simdega touch with Orissa and Chhattisgarh states borders. It comprises of the area, which was erstwhile the Simdega Subdivision of the district Gumla and was created on 30th April 2001. The district is situated between 20.10° to 20.40° north latitude and 84.0° to 84.34° east longitude. It consists of ten blocks/Circles namely Simdega, Kurdeg, Bolba, Thethaitangar, Kolebira, Bano, Jaldega, Pakartanr, Bansjore and Kersai. There are 450 revenue villages and 94 gram panchayats.
As far as its border is concerned it is surrounded by Gumla district in the North, Khunti and West Singhbhum in the east, Jashpur district of Chattisgarh in the west and district Sundargrah of Orissa in the South.
In the ancient days Simdega was known by the name of Biru-Kaishalpur pargana, which was reigned by Raja Katangadeo. After his demise Maharaja Shivakarna subjugated it. Munda and Kharia tribes entered into this part in 1441 A.D and Oraon tribe settled here in about 1503 A.D from Rohtas. For some time it was part of the Kalinga Empire and subsequently in 1336 A.D Harideo of Gang dynasty (Ganga Vanshi Gajapati Royal Family of Kalinga-Utkala Empire, Orrissa) was made king of Biru. The Ancestors of Royal family still resides at Biru. At present Biru is situated at a distance of about 11 km from District headquarter, Simdega. Ganga Bishun Rohilla was famous freedom fighter from Simdega.
The history of Simdega district is inseparable from the history of parent district of Gumla.
Early History
Owing to Kol rising in 1881-82 the South-West non-regulation frontier was created after which Lohardaga district came into existence which owned present Gumla district- in 1899 the name of the district was changed from Lohardaga to Ranchi.
In ancient times the area of the district along with neighboring west tract was under the undisputed possession of Mundas and Oraons. To Aryans the area was known as Jharkhand or forest territory. It was beyond the pale of Hindu influence, possibly, the area came under Magadhan empire during the reign of Ashoka, the great (273-232 B.C.).
With the decline of Mauryan power, king Kharavela of Kalinga led an army through Jharkhand and ransacked Rajgriha and Pataliputra. Later, Samudra Gupta (335-380 AD.) must have passed through the area on his expedition to the Deccan. The Chinese traveller Itsing is believed to have

11
journeyed through the Chotanagpur Plateau in course of his travels to Nalanda and Bodh Gaya. The Chotanagpur Raj is believed to have been set up in fifth century A.D. after the fall of the imperial Guptas. Phanimukut was elected the first king. It is said that he was found by the side of a tank under the protection of a Nag (snake). Hence the dynasty founded by him was named the Nag Dynasty. Muslim Period
It was only Akbar who could extend the Muslim influence in the area. As per Ain-i-Akbari Chotanagpur was reduced to the position of tributary by the force of Akbar by Shahbaz Khan and was included to the Subeh of Bihar.
After the death of Akbar in 1605 the area presumably got independence. In 1616 Fateh Jang captured Durjan Sal, the 46th King of Chotanagpur. In 1632, Chotanagpur was given as Jagir to the Governor at Patna against annual payment of Rs.1,36,000. But this arrangement could not last long. In the time of Muhammad Shah (1719-1748) Sar Buland Khan, the Governor of Bihar defeated the Raja of Chotanagpur. It is believed that district enjoyed almost peace from 1624 when Durjan Sal was released till the appearance of the British in 1772. British Period
Emperior Shah Alam-II granted the Diwani of Bengal, Bihar and Orissa to the East India Company in 1765. Chotanaagpur was included within Bihar. Prompted by internecin quarrels captain camac in December,1771 attacked Palamu. Captain Camac was succeeded by Chapman, the first Civilian administrator of Chotanagpur.
Agrarian discontent against the begari coupled with enhancement of rent by the thikedars or intermediaries caused Sardari agitation. The agitation was led by Sardars. By 1887 the movement got momentum and many Munda and Oraon cultivators refused to pay rent to the landlords. With the appearance of Birsa Munda, believed to be manifestation and incarnation of God, the agitation was at its height in 1895. He declared that the land belonged to the people who reclaimed it from forests and thus there was no need to pay rent. Birsa Munda had far-reaching influence on cultivators and people of Gumla as well. A local leader Jatra Oraon of Bishunpur police station led a religious movement known as Tana Bhagat movement in 1914. The non-co-operation movement led by Jatra soon spread over Palamu and Hazaribagh districts. Advises also Played an active role in freedom-movement. A large number of Tana Bhagats attended the Gaya session of the congress Presided over by Deshbandhu Chitranjan Das in December 1922. It was their combined efforts with rest of countrymen, which blossomed after independence in 1947.

12
Administrative Set up
Simdega town is the district head quarter, where the office of Deputy Commissioner, Suprintendent of police and a district Court is located. Most of the departments have their divisional headquarter at the district headquarter. Since, Simdega district has only one Sub-division, therefore, its Sub-divisional headquarter is also located at Simdega district headquarter, which is headed by Sub Divisional Officer. Below Sub-division there are 10 community development Blocks. The area of Community development Blocks, Revenue Circles and Police Stations coincide with each other.
The responsibility of General Administration of the District lies with the Deputy Commissioner. He is the Executive Head and has three fold roles as:
Deputy Commissioner District Collector and District Magistrate.
He is assisted by the following officers for carrying out day to day work in various fields:
Deputy development Commissioner(DDC) Additional Collector (AC) MESO Project Officer Executive Magistrates District Revenue Officer District Transport Officer District Panchayati Raj Officers Treasury Officer Executing Officer, Nagar Panchayat etc.
The Deputy Commissioner is the Chief Revenue Officer as District Collector and is responsible for collection of Revenue and other Govt. dues recoverable as arrears of Land Revenue. He deals with the Natural Calamities like draught, unseasonal rains, hailstorms, floods and fire etc.
Under the Registration Act the District Collector exercise the Powers of Registrar of the District and he controls and supervises the work of Registration of deeds. He also function as Marriage Officer under the Special Marriage Act, 1954. Further under the Cinematograph Act, the District Magistrate is the Licencing Authority in his jurisdiction. District Magistrate is thus responsible for the maintenance of Law & Order within the limit of his jurisdiction. He is conferred with very wide powers by the law, which if used prudently can be very effective in maintaining peace and tranquility. The police force is mainly an instrument provided by Law for the
13
District Magistrate. He can impose restriction on the movement of unlawful Assembly under Section 144 Cr. P.C. and can also impose curfew keeping in view the situation.
He is authorised to inspect the Offices/Courts of Sub Divisional Officers
(Civil), Circle Offices, Treasuries, Sub Treasuries, Jails, Hospitals, Dispenseries, Schools, Blocks, Police Stations etc. In this way, he has effective control over the Administration.
It consists of ten blocks/Circles namely Simdega, Kurdeg, Bolba,
Thethaitangar, Kolebira, Bano, Jaldega, Pakartanr, Bansjore and Kersai and only one statutory town Simdega. There are 450 revenue villages and 94 gram panchayats.
--------------------------------

14
District Highlights – 2011 Census
Simdega ranks 22nd in terms of population (5,99,578) and 8th in terms ofarea (3774 sq.km.) in the state of Jharkhand.
In terms of population per sq.km. Simdega is the 24th densely populateddistrict in the state with 159 persons per sq.km as against the state’s414.
Simdega ranks 2nd in terms of sex-ratio (997) against the state’s 949.
There are 1 uninhabited villages (out of 450 total villages) in the districtof Simdega.
Taisar (under Kersai C.D. Block) is the most populated village (7,574)and Dhauraanjan (under Jaldega C.D. Block) is the least populatedvillage (25) in the district.
15
The economy of the district mainly depends on cultivation or related
work. More than 86% of the total workers are engaged in Primary sector.
C.D. Block Bano has the highest number of villages (93) in the district and C.D. Block Bansjor has the lowest number of villages (19).
Taisar (under Kersai C.D. Block) has the largest area (6,582 hectare) and Patrapali (under Bansjor C.D. Block) has the smallest area (23 hectare) among the villages in the district.
50.09% and 36.9 % of Households of main source of drinking water are from uncovered- well and handpump respectively of the villages.
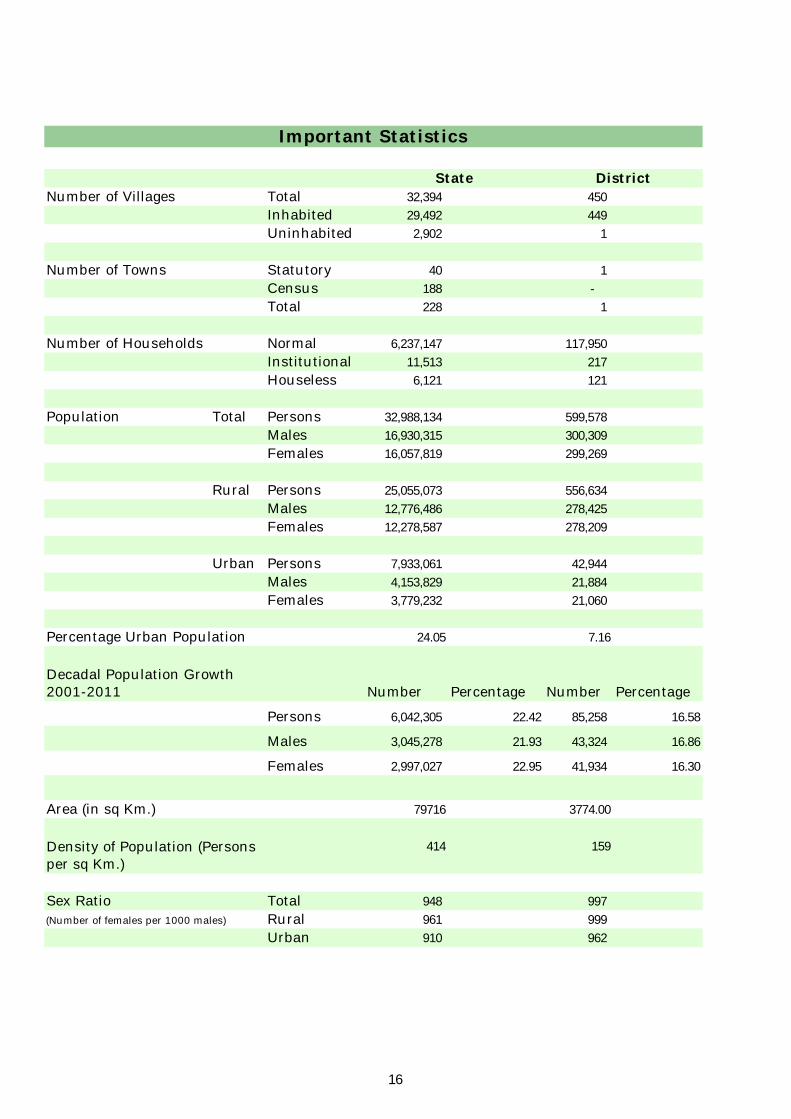
Number of Villages Total 32,394 450
Inhabited 29,492 449
Uninhabited 2,902 1
Number of Towns Statutory 40 1
Census 188 -
Total 228 1
Number of Households Normal 6,237,147 117,950
Institutional 11,513 217
Houseless 6,121 121
Population Total Persons 32,988,134 599,578
Males 16,930,315 300,309
Females 16,057,819 299,269
Rural Persons 25,055,073 556,634
Males 12,776,486 278,425
Females 12,278,587 278,209
Urban Persons 7,933,061 42,944
Males 4,153,829 21,884
Females 3,779,232 21,060
Percentage Urban Population 24.05 7.16
Number Percentage Number Percentage
Persons 6,042,305 22.42 85,258 16.58
Males 3,045,278 21.93 43,324 16.86
Females 2,997,027 22.95 41,934 16.30
Area (in sq Km.) 79716 3774.00
414 159
Sex Ratio Total 948 997
(Number of females per 1000 males) Rural 961 999
Urban 910 962
District
Important Statistics
Decadal Population Growth 2001-2011
Density of Population (Persons per sq Km.)
State
16
Important Statistics
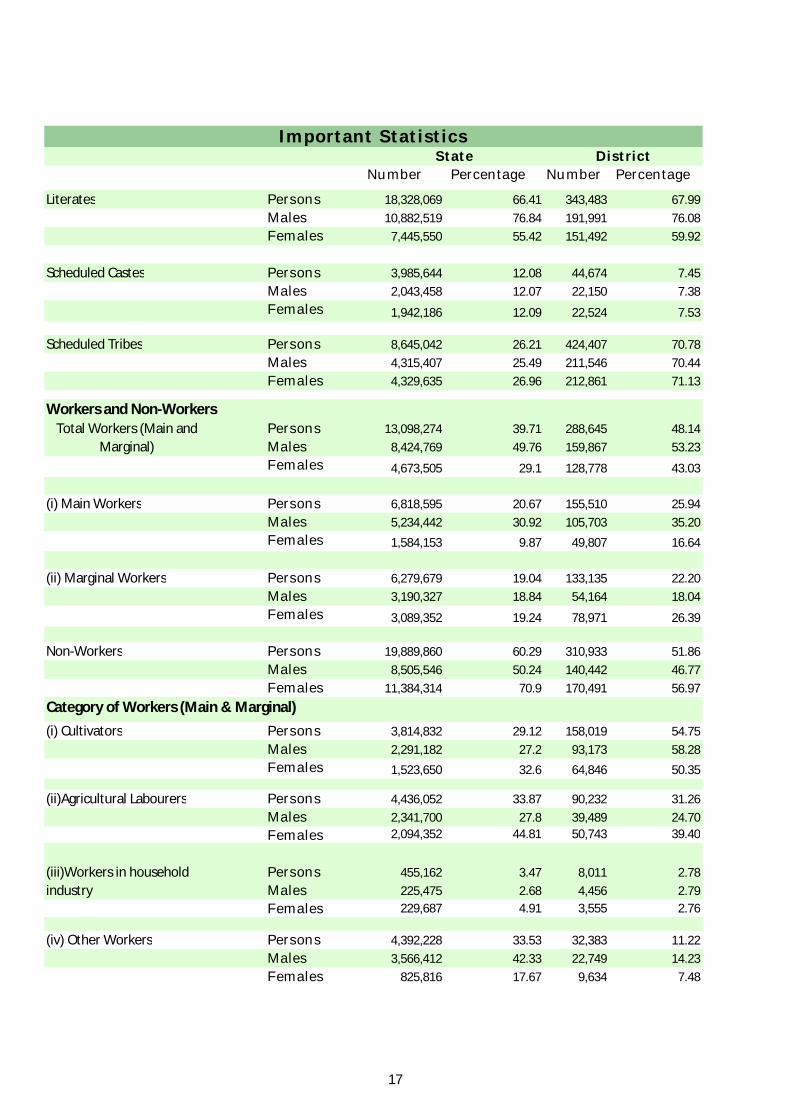
Number Percentage Number Percentage
Literates Persons 18,328,069 66.41 343,483 67.99
Males 10,882,519 76.84 191,991 76.08
Females 7,445,550 55.42 151,492 59.92
Scheduled Castes Persons 3,985,644 12.08 44,674 7.45
Males 2,043,458 12.07 22,150 7.38
Females 1,942,186 12.09 22,524 7.53
Scheduled Tribes Persons 8,645,042 26.21 424,407 70.78
Males 4,315,407 25.49 211,546 70.44
Females 4,329,635 26.96 212,861 71.13
Workers and Non-WorkersPersons 13,098,274 39.71 288,645 48.14
Males 8,424,769 49.76 159,867 53.23
Females 4,673,505 29.1 128,778 43.03
(i) Main Workers Persons 6,818,595 20.67 155,510 25.94
Males 5,234,442 30.92 105,703 35.20
Females 1,584,153 9.87 49,807 16.64
(ii) Marginal Workers Persons 6,279,679 19.04 133,135 22.20
Males 3,190,327 18.84 54,164 18.04
Females 3,089,352 19.24 78,971 26.39
Non-Workers Persons 19,889,860 60.29 310,933 51.86
Males 8,505,546 50.24 140,442 46.77
Females 11,384,314 70.9 170,491 56.97
(i) Cultivators Persons 3,814,832 29.12 158,019 54.75
Males 2,291,182 27.2 93,173 58.28
Females 1,523,650 32.6 64,846 50.35
(ii)Agricultural Labourers Persons 4,436,052 33.87 90,232 31.26
Males 2,341,700 27.8 39,489 24.70
Females 2,094,352 44.81 50,743 39.40
Persons 455,162 3.47 8,011 2.78
Males 225,475 2.68 4,456 2.79
Females 229,687 4.91 3,555 2.76
(iv) Other Workers Persons 4,392,228 33.53 32,383 11.22
Males 3,566,412 42.33 22,749 14.23
Females 825,816 17.67 9,634 7.48
Total Workers (Main and Marginal)
Category of Workers (Main & Marginal)
(iii)Workers in household industry
State District
17


Section - I
Primary Census Abstract (PCA)

20
Brief Note on Primary Census Abstract
Introduction:
The Indian Census has the reputation of being one of the best in the world. The first Census in India was conducted in the year 1872. This was conducted at different points of time in different parts of the country. In 1881 a Census was taken for the entire country simultaneously. Since then, Census has been conducted every ten years, without a break. Thus, the Census of India 2011 was the fifteenth in this unbroken series since 1872, the seventh after independence and the second census of the third millennium and twenty first century. The census has been uninterruptedly continued despite several adversities like wars, epidemics, natural calamities, political unrest, etc.
The Census of India is conducted under the provisions of the Census Act 1948 and the Census Rules, 1990. In Censuses until 1931, a synchronous de-facto method was adopted wherein the Census was conducted throughout the country on a single night. This being a very costly affair and involved the deployment of very large force at one point of time was given up in 1941. Since then the same methodology has been followed in all the Censuses. It is a gigantic operation and considered to be the single largest, complex, peace time administrative exercise in the world.
The Census Operation in India is carried out in two distinct but inter connected phases - the House listing and Housing Census followed by the Population Enumeration. During the first phase of Census 2011 i.e.,House listing and Housing Census, the buildings, census houses and households were identified and systematically listed in the House Listing and Housing Census Schedule during the periodApril to September, 2010 in different States/Union Territories. Apart from listing of houses,some useful data on the amenities available to the households was also collected for assessingcondition of human settlements, housing deficits etc.
Censuses prior to Census 2001 had the system of collecting the information through Individual Slip which was a key schedule for every individual. The information collected through slip was then compiled for a household. Some information was also collected in addition to this for the household. During 2001 Census a comprehensive Household Schedule was adopted replacing the individual slip concept. In 2011 Census also similar household schedule was used for canvassing. The scope of demographic, socio-economic parameters has been widened in every census.
2.Population Enumeration - Census 2011:
The field work of the second phase i.e. Population Enumeration was carried out during February-March, 2011. One of the essential features of Population Enumeration in the second phase was that each person was

21
enumerated and her/his individual particulars were collected at a well-defined point of time.
The Census moment and the reference date for the Census of India 2011 was 00:00 hours of 1st March, 2011. The enumeration was conducted from 9th February to 28th February, 2011 alongwith a revisional round from 1st March, 2011 to 5th March, 2011 synchronously all over the country except for few specific areas of the Jammu & Kashmir, Himachal Pradesh and Uttarakhand states that remain snowbound in February. In these locations the population enumeration was done from 11th September, 2010 to 30th September, 2010 along with a revisional round from 1st October, 2010 to 5th October, 2010. The reference date for the census in snow bound non-synchronous areas of these states was 00.00 hours of the first day of October, 2010. In addition to the coverage during House listing& Housing Census, the enumeration of the Houseless population was carried out on the night of 28th February, 2011, as has been the usual practice. For the purpose of Census, certain areas where the access of the civilian enumerators was not permissible due to security reasons termed as ‘Special Charges’ such as the Defence and strictly Military/Para-Military areas, including operational areas were also covered. Such areas were not covered during the House listing& Housing Census. In addition to the defence/para-military areas, Special Charges also included certain factory areas, certain colonies, sensitive areas, scientific establishments, etc. These also formed Special Charges as these were not accessible by the usual census enumerator.
3. Quality Assurance:
A Task Force for Quality Assurance (TFQA) functioned under the chairmanship of the RG & CCI. Experienced officers of the different divisions of the organization i.e. Heads and senior officers of the Census Division, Data Processing Division, Map Division, Demography Division and Social Studies Division comprised the TFQA. The Directors of Census Operations were co-opted as members whenever the TFQA discussed the data for their States/Union territories. The main objective of constituting the TFQA was to subject the data to stringent validation checks and ensure its quality before release as it was expedient to be satisfied itself about the quality of data before putting the same in public domain.
The Directors and their senior officers were involved at all levels with respect to the quality and the coverage of their States/UTs. The TFQA intensively scrutinized coverage and content parameters including edit and imputation logic. The most important aspect of the data quality was to ensure complete coverage of all geographical areas especially for the population enumeration phase where the data is disseminated right up to the village level in the rural areas and the ward level in the urban areas. Thus ensuring the complete coverage and correct geographical linkage of each enumeration block was one of the major planks of the quality control, especially for small area population statistics. The content was scrutinized mainly through the process of internal consistency, comparison with similar data in the past and also through validation with likewise data if available, from external sources. Quite often the local knowledge and perception was looked at to understand both the

22
existing and the new emerging trends of population distribution and characteristics. A very comprehensive check and edit mechanism was put in place to objectively examine the preliminary Census 2011 Population Enumeration results and finally clear them for use. The population data was cleared only after the full possible satisfaction of the TFQA.
The entire work relating to the data validation and scrutiny was completed by all the States/Union territories under the overall supervision and monitoring of the Census Division of the Office of the Registrar General, India with active cooperation and support of the Social Studies Division, Data Processing Division, Data Dissemination Division and Map Division.
4. Primary Census Abstract:
The Primary Census Abstract which is an important publication of 2011 Census gives basicinformation on Area, Total Number of Households, Total Population, Scheduled Castes, Scheduled TribesPopulation, Population in the age group 0-6, Literates, Main Workers and Marginal Workers classified by thefour broad industrial categories, namely, (i) Cultivators, (ii) Agricultural Labourers, (iii) Household Industry Workers, and (iv) Other Workers and also Non-Workers. The characteristics of the Total Population includeScheduled Castes, Scheduled Tribes, Institutional and Houseless Population and are presented by sex andrural-urban residence.
In 1981 census main workers were presented into four categories. As regards 1991 Census, the nine-fold industrialclassification of main workers has been given in the Primary Census Abstract. One of the important features of the Primary Census Abstract of 1991 Census was the presentation of population of the age group 0-6 which is continued in 2001 and 2011 Census.All the children of age 6 years or less have been treated as illiterate even if the child is going to a school and may have picked up reading and writing. This will help the data users in better analysis and understanding of the literacy data as the literacy rate is calculated with 7 years and above population and it is referred as effective literacy rate.In 2001 and 2011 census four categories of main workers have been given in the Primary Census Abstract.
5. Level of Presentation of PCA data in District CensusHandbooks:
The format of Primary Census Abstract (PCA) adopted in the DCHB of 2001 Census has been continued for 2011 Census as the data on four categories of works have been presented similar to 2001 census. The Primary Census Abstract data in different PCAs are presented at different levels. The level of presentation of Primary Census Abstracts in DCHB is as under:
1.District Primary Census Abstract -District/C.D. Block/Town.2. Primary Census Abstract for Scheduled Castes- District/C.D. Block/Town.3.Primary Census Abstract for Scheduled Tribes -District/C.D. Block/Town.4. Village Primary Census Abstract -C.D. Block/Village wise.5. Urban Primary Census Abstract- Town/Ward level.

23
The PCA Data for villages was presented C.D. Block wise for the first time in 1991 Census. Thispractice is continued in 2001 and 2011 Census. The term ‘Total Population’ includes the Scheduled Castes, the Scheduled Tribes, the Institutional and the Houseless populations. An appendix to District Primary Census Abstract has also been furnished showing urban enumeration block-wise particulars on Total Population, the Scheduled Castes Population and the Scheduled Tribes Population for each town.
6. Area Figures:
The area figures supplied by local revenue authorities of the district in respect of tahsils, Police Stations and by the local bodies in respect of towns are given in square kilometers. The area figures of the villages supplied by the Tahsildars in acres have been converted and shown in hectares. The area figures of the C.D. Block are the total of the village areas coming under each C.D. Block. The area figures for the district are the same as adopted by the Surveyor General of India to maintain uniformity at the national level.
-----------------------------------------------------------------


District Primary Census Abstract

DISTRICT CENSUS HANDBOOK : SIMDEGA
DISTRICT PRIMARY
Persons Males Females Persons Males Females1 2 3 4 5 6 7 8 9 10 11
367 Simdega - District Total 3,774.00 118,288 599,578 300,309 299,269 94,414 47,962 46,452 Rural 3,738.00 110,036 556,634 278,425 278,209 88,993 45,218 43,775 Urban 36.00 8,252 42,944 21,884 21,060 5,421 2,744 2,677
0224 Simdega Total 425.07 13,925 72,131 36,093 36,038 11,248 5,680 5,568 Rural 425.07 13,925 72,131 36,093 36,038 11,248 5,680 5,568 Urban 0.00 - - - - - - -
0225 Pakar Tanr Total 286.82 7,357 37,507 19,065 18,442 5,845 3,065 2,780 Rural 286.82 7,357 37,507 19,065 18,442 5,845 3,065 2,780 Urban 0.00 - - - - - - -
0226 Kurdeg Total 274.84 9,847 47,984 23,881 24,103 7,281 3,680 3,601 Rural 274.84 9,847 47,984 23,881 24,103 7,281 3,680 3,601 Urban 0.00 - - - - - - -
0227 Kersai Total 236.97 7,580 39,218 19,582 19,636 6,185 3,127 3,058 Rural 236.97 7,580 39,218 19,582 19,636 6,185 3,127 3,058 Urban 0.00 - - - - - - -
0228 Bolba Total 288.63 6,182 30,786 15,223 15,563 4,827 2,465 2,362 Rural 288.63 6,182 30,786 15,223 15,563 4,827 2,465 2,362 Urban 0.00 - - - - - - -
0229 Thethaitangar Total 624.18 17,433 87,458 43,710 43,748 14,427 7,334 7,093 Rural 624.18 17,433 87,458 43,710 43,748 14,427 7,334 7,093 Urban 0.00 - - - - - - -
0230 Kolebira Total 437.44 14,106 71,283 35,993 35,290 11,437 5,929 5,508 Rural 437.44 14,106 71,283 35,993 35,290 11,437 5,929 5,508 Urban 0.00 - - - - - - -
0231 Jaldega Total 441.61 12,389 64,286 32,167 32,119 10,540 5,296 5,244 Rural 441.61 12,389 64,286 32,167 32,119 10,540 5,296 5,244 Urban 0.00 - - - - - - -
0232 Bansjor Total 151.07 4,981 25,519 12,856 12,663 3,827 1,913 1,914 Rural 151.07 4,981 25,519 12,856 12,663 3,827 1,913 1,914 Urban 0.00 - - - - - - -
0233 Bano Total 549.82 16,236 80,462 39,855 40,607 13,376 6,729 6,647 Rural 549.82 16,236 80,462 39,855 40,607 13,376 6,729 6,647 Urban 0.00 - - - - - - -
URBAN801798 Simdega (NP) Urban 36.20 8,252 42,944 21,884 21,060 5,421 2,744 2,677
Location code number
District/ CD Block/ Town
Total/ Rural/ Urban
Area in Square
KilometreNumber of households
Total population (including institutional and houseless population) Population in the age-group 0-6
26

PRIMARY CENSUS ABSTRACT
CENSUS ABSTRACT
Persons Males Females Persons Males Females Persons Males Females12 13 14 15 16 17 18 19 20 3 2
44,674 22,150 22,524 424,407 211,546 212,861 343,483 191,991 151,492 Total Simdega - District42,751 21,196 21,555 404,487 201,913 202,574 311,416 174,914 136,502 Rural1,923 954 969 19,920 9,633 10,287 32,067 17,077 14,990 Urban8,326 4,073 4,253 49,242 24,586 24,656 41,314 22,931 18,383 Total Simdega8,326 4,073 4,253 49,242 24,586 24,656 41,314 22,931 18,383 Rural
- - - - - - - - - Urban3,287 1,661 1,626 25,613 12,993 12,620 22,176 12,601 9,575 Total Pakar Tanr3,287 1,661 1,626 25,613 12,993 12,620 22,176 12,601 9,575 Rural
- - - - - - - - - Urban3,201 1,605 1,596 34,707 17,196 17,511 27,484 15,334 12,150 Total Kurdeg3,201 1,605 1,596 34,707 17,196 17,511 27,484 15,334 12,150 Rural
- - - - - - - - - Urban2,014 1,006 1,008 31,505 15,619 15,886 22,397 12,350 10,047 Total Kersai2,014 1,006 1,008 31,505 15,619 15,886 22,397 12,350 10,047 Rural
- - - - - - - - - Urban2,109 1,038 1,071 22,433 11,100 11,333 16,422 9,132 7,290 Total Bolba2,109 1,038 1,071 22,433 11,100 11,333 16,422 9,132 7,290 Rural
- - - - - - - - - Urban5,296 2,627 2,669 70,432 35,148 35,284 48,732 27,186 21,546 Total Thethaitangar5,296 2,627 2,669 70,432 35,148 35,284 48,732 27,186 21,546 Rural
- - - - - - - - - Urban9,292 4,710 4,582 44,590 22,385 22,205 42,131 23,248 18,883 Total Kolebira9,292 4,710 4,582 44,590 22,385 22,205 42,131 23,248 18,883 Rural
- - - - - - - - - Urban2,317 1,169 1,148 53,309 26,644 26,665 34,875 19,806 15,069 Total Jaldega2,317 1,169 1,148 53,309 26,644 26,665 34,875 19,806 15,069 Rural
- - - - - - - - - Urban886 414 472 21,840 10,999 10,841 13,334 7,726 5,608 Total Bansjor886 414 472 21,840 10,999 10,841 13,334 7,726 5,608 Rural- - - - - - - - - Urban
6,023 2,893 3,130 50,816 25,243 25,573 42,551 24,600 17,951 Total Bano6,023 2,893 3,130 50,816 25,243 25,573 42,551 24,600 17,951 Rural
- - - - - - - - - UrbanURBAN
1,923 954 969 19,920 9,633 10,287 32,067 17,077 14,990 Urban Simdega (NP)
Scheduled Castes population Scheduled Tribes population LiteratesTotal/ Rural/ Urban
District/ CD Block/ Town
27

DISTRICT CENSUS HANDBOOK : SIMDEGA
DISTRICT PRIMARY
Persons Males Females Persons Males Females Persons Males Females1 2 3 21 22 23 24 25 26 27 28 29
367 Simdega - District Total 288,645 159,867 128,778 155,510 105,703 49,807 96,004 67,365 28,639 Rural 275,254 149,948 125,306 145,029 97,332 47,697 94,867 66,557 28,310 Urban 13,391 9,919 3,472 10,481 8,371 2,110 1,137 808 329
0224 Simdega Total 34,049 19,491 14,558 16,644 11,633 5,011 10,907 7,705 3,202 Rural 34,049 19,491 14,558 16,644 11,633 5,011 10,907 7,705 3,202 Urban - - - - - - - - -
0225 Pakar Tanr Total 17,985 9,878 8,107 8,458 6,061 2,397 5,612 4,249 1,363 Rural 17,985 9,878 8,107 8,458 6,061 2,397 5,612 4,249 1,363 Urban - - - - - - - - -
0226 Kurdeg Total 23,401 12,992 10,409 10,257 7,273 2,984 4,475 3,391 1,084 Rural 23,401 12,992 10,409 10,257 7,273 2,984 4,475 3,391 1,084 Urban - - - - - - - - -
0227 Kersai Total 18,012 9,810 8,202 8,929 6,610 2,319 6,649 5,016 1,633 Rural 18,012 9,810 8,202 8,929 6,610 2,319 6,649 5,016 1,633 Urban - - - - - - - - -
0228 Bolba Total 18,134 9,212 8,922 11,513 7,021 4,492 7,010 4,827 2,183 Rural 18,134 9,212 8,922 11,513 7,021 4,492 7,010 4,827 2,183 Urban - - - - - - - - -
0229 Thethaitangar Total 43,540 23,203 20,337 23,948 15,593 8,355 16,096 11,139 4,957 Rural 43,540 23,203 20,337 23,948 15,593 8,355 16,096 11,139 4,957 Urban - - - - - - - - -
0230 Kolebira Total 36,411 19,317 17,094 15,999 10,326 5,673 10,715 6,845 3,870 Rural 36,411 19,317 17,094 15,999 10,326 5,673 10,715 6,845 3,870 Urban - - - - - - - - -
0231 Jaldega Total 29,833 16,940 12,893 15,709 10,709 5,000 12,410 8,819 3,591 Rural 29,833 16,940 12,893 15,709 10,709 5,000 12,410 8,819 3,591 Urban - - - - - - - - -
0232 Bansjor Total 12,425 7,158 5,267 10,470 6,446 4,024 8,654 5,244 3,410 Rural 12,425 7,158 5,267 10,470 6,446 4,024 8,654 5,244 3,410 Urban - - - - - - - - -
0233 Bano Total 41,464 21,947 19,517 23,102 15,660 7,442 12,339 9,322 3,017 Rural 41,464 21,947 19,517 23,102 15,660 7,442 12,339 9,322 3,017 Urban - - - - - - - - -
URBAN801798 Simdega (NP) Urban 13,391 9,919 3,472 10,481 8,371 2,110 1,137 808 329
CultivatorsDistrict/ CD Block/ Town
Total/ Rural/ Urban
Total workers Main workers
Industrial categoryLocation code number
28

PRIMARY CENSUS ABSTRACT
CENSUS ABSTRACT
Persons Males Females Persons Males Females Persons Males Females30 31 32 33 34 35 36 37 38 3 2
29,589 17,064 12,525 5,284 3,249 2,035 24,633 18,025 6,608 Total Simdega - District28,685 16,437 12,248 5,013 3,027 1,986 16,464 11,311 5,153 Rural
904 627 277 271 222 49 8,169 6,714 1,455 Urban2,861 1,970 891 620 334 286 2,256 1,624 632 Total Simdega2,861 1,970 891 620 334 286 2,256 1,624 632 Rural
- - - - - - - - - Urban1,663 1,065 598 459 280 179 724 467 257 Total Pakar Tanr1,663 1,065 598 459 280 179 724 467 257 Rural
- - - - - - - - - Urban4,007 2,655 1,352 324 230 94 1,451 997 454 Total Kurdeg4,007 2,655 1,352 324 230 94 1,451 997 454 Rural
- - - - - - - - - Urban1,120 764 356 262 197 65 898 633 265 Total Kersai1,120 764 356 262 197 65 898 633 265 Rural
- - - - - - - - - Urban3,270 1,452 1,818 369 216 153 864 526 338 Total Bolba3,270 1,452 1,818 369 216 153 864 526 338 Rural
- - - - - - - - - Urban3,997 2,008 1,989 1,165 679 486 2,690 1,767 923 Total Thethaitangar3,997 2,008 1,989 1,165 679 486 2,690 1,767 923 Rural
- - - - - - - - - Urban1,819 1,112 707 532 288 244 2,933 2,081 852 Total Kolebira1,819 1,112 707 532 288 244 2,933 2,081 852 Rural
- - - - - - - - - Urban1,381 645 736 420 255 165 1,498 990 508 Total Jaldega1,381 645 736 420 255 165 1,498 990 508 Rural
- - - - - - - - - Urban698 376 322 197 125 72 921 701 220 Total Bansjor698 376 322 197 125 72 921 701 220 Rural- - - - - - - - - Urban
7,869 4,390 3,479 665 423 242 2,229 1,525 704 Total Bano7,869 4,390 3,479 665 423 242 2,229 1,525 704 Rural
- - - - - - - - - UrbanURBAN
904 627 277 271 222 49 8,169 6,714 1,455 Urban Simdega (NP)
Agricultural labourers Household industry workers Other workersTotal/ Rural/ Urban
District/ CD Block/ Town
of main workers
29

DISTRICT CENSUS HANDBOOK : SIMDEGA
DISTRICT PRIMARY
Persons Males Females Persons Males Females Persons Males Females1 2 3 39 40 41 42 43 44 45 46 47
367 Simdega - District Total 133,135 54,164 78,971 62,015 25,808 36,207 60,643 22,425 38,218 Rural 130,225 52,616 77,609 61,292 25,368 35,924 59,459 21,979 37,480 Urban 2,910 1,548 1,362 723 440 283 1,184 446 738
0224 Simdega Total 17,405 7,858 9,547 8,532 3,664 4,868 7,482 3,287 4,195 Rural 17,405 7,858 9,547 8,532 3,664 4,868 7,482 3,287 4,195 Urban - - - - - - - - -
0225 Pakar Tanr Total 9,527 3,817 5,710 3,784 1,702 2,082 5,342 1,885 3,457 Rural 9,527 3,817 5,710 3,784 1,702 2,082 5,342 1,885 3,457 Urban - - - - - - - - -
0226 Kurdeg Total 13,144 5,719 7,425 2,901 1,165 1,736 9,032 3,982 5,050 Rural 13,144 5,719 7,425 2,901 1,165 1,736 9,032 3,982 5,050 Urban - - - - - - - - -
0227 Kersai Total 9,083 3,200 5,883 4,152 1,386 2,766 4,370 1,527 2,843 Rural 9,083 3,200 5,883 4,152 1,386 2,766 4,370 1,527 2,843 Urban - - - - - - - - -
0228 Bolba Total 6,621 2,191 4,430 3,241 1,125 2,116 3,027 860 2,167 Rural 6,621 2,191 4,430 3,241 1,125 2,116 3,027 860 2,167 Urban - - - - - - - - -
0229 Thethaitangar Total 19,592 7,610 11,982 11,020 4,231 6,789 7,164 2,531 4,633 Rural 19,592 7,610 11,982 11,020 4,231 6,789 7,164 2,531 4,633 Urban - - - - - - - - -
0230 Kolebira Total 20,412 8,991 11,421 11,224 5,114 6,110 7,309 2,854 4,455 Rural 20,412 8,991 11,421 11,224 5,114 6,110 7,309 2,854 4,455 Urban - - - - - - - - -
0231 Jaldega Total 14,124 6,231 7,893 9,201 4,364 4,837 3,991 1,434 2,557 Rural 14,124 6,231 7,893 9,201 4,364 4,837 3,991 1,434 2,557 Urban - - - - - - - - -
0232 Bansjor Total 1,955 712 1,243 901 253 648 651 254 397 Rural 1,955 712 1,243 901 253 648 651 254 397 Urban - - - - - - - - -
0233 Bano Total 18,362 6,287 12,075 6,336 2,364 3,972 11,091 3,365 7,726 Rural 18,362 6,287 12,075 6,336 2,364 3,972 11,091 3,365 7,726 Urban - - - - - - - - -
URBAN801798 Simdega (NP) Urban 2,910 1,548 1,362 723 440 283 1,184 446 738
Marginal workers CultivatorsLocation code number
District/ CD Block/ Town
Total/ Rural/ Urban
Industrial category
Agricultural labourers
30

PRIMARY CENSUS ABSTRACT
CENSUS ABSTRACT
Persons Males Females Persons Males Females Persons Males Females48 49 50 51 52 53 54 55 56 3 2 1
2,727 1,207 1,520 7,750 4,724 3,026 310,933 140,442 170,491 Total Simdega - District 3672,654 1,160 1,494 6,820 4,109 2,711 281,380 128,477 152,903 Rural
73 47 26 930 615 315 29,553 11,965 17,588 Urban328 171 157 1,063 736 327 38,082 16,602 21,480 Total Simdega 0224328 171 157 1,063 736 327 38,082 16,602 21,480 Rural- - - - - - - - - Urban142 66 76 259 164 95 19,522 9,187 10,335 Total Pakar Tanr 0225142 66 76 259 164 95 19,522 9,187 10,335 Rural- - - - - - - - - Urban334 164 170 877 408 469 24,583 10,889 13,694 Total Kurdeg 0226334 164 170 877 408 469 24,583 10,889 13,694 Rural- - - - - - - - - Urban151 70 81 410 217 193 21,206 9,772 11,434 Total Kersai 0227151 70 81 410 217 193 21,206 9,772 11,434 Rural- - - - - - - - - Urban119 70 49 234 136 98 12,652 6,011 6,641 Total Bolba 0228119 70 49 234 136 98 12,652 6,011 6,641 Rural- - - - - - - - - Urban307 136 171 1,101 712 389 43,918 20,507 23,411 Total Thethaitangar 0229307 136 171 1,101 712 389 43,918 20,507 23,411 Rural- - - - - - - - - Urban445 191 254 1,434 832 602 34,872 16,676 18,196 Total Kolebira 0230445 191 254 1,434 832 602 34,872 16,676 18,196 Rural- - - - - - - - - Urban471 160 311 461 273 188 34,453 15,227 19,226 Total Jaldega 0231471 160 311 461 273 188 34,453 15,227 19,226 Rural- - - - - - - - - Urban158 30 128 245 175 70 13,094 5,698 7,396 Total Bansjor 0232158 30 128 245 175 70 13,094 5,698 7,396 Rural- - - - - - - - - Urban199 102 97 736 456 280 38,998 17,908 21,090 Total Bano 0233199 102 97 736 456 280 38,998 17,908 21,090 Rural- - - - - - - - - Urban
URBAN73 47 26 930 615 315 29,553 11,965 17,588 Urban Simdega (NP) 801798
Non-workers
of marginal workersTotal/ Rural/ Urban
District/ CD Block/ Town
Location code number
Household industry workers Other workers
31


Appendix to District Primary Census Abstract Total, Scheduled Castes and
Scheduled Tribes Population - Urban Block wise

Location Code
Name of Town Name of Ward Boundaries of Urban Block / EB Number
Total Population
Scheduled Castes
Population
Scheduled Tribes
Population
1 2 3 4 5 6 7
801798 Simdega (NP) WARD No.-0001 EB No.-000100 278 21 145
801798 Simdega (NP) WARD No.-0001 EB No.-0002 SUB-EB No.01 781 9 618
801798 Simdega (NP) WARD No.-0001 EB No.-0002 SUB-EB No.02 603 3 340
801798 Simdega (NP) WARD No.-0001 EB No.-000300 299 20 273
801798 Simdega (NP) WARD No.-0001 EB No.-000400 408 109 299
801798 Simdega (NP) WARD No.-0001 EB No.-000500 331 - 329
801798 Simdega (NP) WARD No.-0001 EB No.-000600 685 5 649
801798 Simdega (NP) WARD No.-0001 EB No.-000700 360 - 360
801798 Simdega (NP) WARD No.-0002 EB No.-000800 393 6 379
801798 Simdega (NP) WARD No.-0002 EB No.-000900 368 8 305
801798 Simdega (NP) WARD No.-0002 EB No.-001000 783 19 214
801798 Simdega (NP) WARD No.-0002 EB No.-001100 652 7 470
801798 Simdega (NP) WARD No.-0002 EB No.-0012 SUB-EB No.01 269 65 150
801798 Simdega (NP) WARD No.-0002 EB No.-0012 SUB-EB No.02 567 142 177
801798 Simdega (NP) WARD No.-0002 EB No.-0013 SUB-EB No.01 595 28 379
801798 Simdega (NP) WARD No.-0002 EB No.-0013 SUB-EB No.02 765 36 218
801798 Simdega (NP) WARD No.-0003 EB No.-0014 SUB-EB No.01 652 4 207
801798 Simdega (NP) WARD No.-0003 EB No.-0014 SUB-EB No.02 627 29 213
801798 Simdega (NP) WARD No.-0003 EB No.-001500 625 10 328
801798 Simdega (NP) WARD No.-0003 EB No.-001600 350 - 262
801798 Simdega (NP) WARD No.-0003 EB No.-001700 333 - 312
801798 Simdega (NP) WARD No.-0003 EB No.-001800 636 45 297
801798 Simdega (NP) WARD No.-0003 EB No.-001900 515 15 269
801798 Simdega (NP) WARD No.-0003 EB No.-320100 94 12 16
801798 Simdega (NP) WARD No.-0004 EB No.-0020 SUB-EB No.01 426 7 212
801798 Simdega (NP) WARD No.-0004 EB No.-0020 SUB-EB No.02 385 14 18
801798 Simdega (NP) WARD No.-0004 EB No.-002100 779 32 283
801798 Simdega (NP) WARD No.-0004 EB No.-002200 159 - 148
801798 Simdega (NP) WARD No.-0004 EB No.-0023 SUB-EB No.01 462 23 318
801798 Simdega (NP) WARD No.-0004 EB No.-0023 SUB-EB No.02 343 7 246
801798 Simdega (NP) WARD No.-0004 EB No.-002400 239 - 239
801798 Simdega (NP) WARD No.-0005 EB No.-0025 SUB-EB No.01 502 3 27
801798 Simdega (NP) WARD No.-0005 EB No.-0025 SUB-EB No.02 546 22 92
801798 Simdega (NP) WARD No.-0005 EB No.-0026 SUB-EB No.01 490 20 110
801798 Simdega (NP) WARD No.-0005 EB No.-0026 SUB-EB No.02 696 44 293
801798 Simdega (NP) WARD No.-0005 EB No.-0027 SUB-EB No.01 640 47 230
801798 Simdega (NP) WARD No.-0005 EB No.-0027 SUB-EB No.02 638 47 194
801798 Simdega (NP) WARD No.-0006 EB No.-002800 491 48 101
801798 Simdega (NP) WARD No.-0006 EB No.-002900 350 30 116
801798 Simdega (NP) WARD No.-0006 EB No.-003000 857 - 15
801798 Simdega (NP) WARD No.-0006 EB No.-003100 135 - -
801798 Simdega (NP) WARD No.-0006 EB No.-003200 321 74 63
801798 Simdega (NP) WARD No.-0006 EB No.-003300 542 40 278
801798 Simdega (NP) WARD No.-0006 EB No.-003400 438 6 171
APPENDIX TO DISTRICT PRIMARY CENSUS ABSTRACT TOTAL, SCHEDULED CASTES AND SCHEDULED TRIBES POPULATION - URBAN BLOCK WISE
34

Location Code
Name of Town Name of Ward Boundaries of Urban Block / EB Number
Total Population
Scheduled Castes
Population
Scheduled Tribes
Population
1 2 3 4 5 6 7
APPENDIX TO DISTRICT PRIMARY CENSUS ABSTRACT TOTAL, SCHEDULED CASTES AND SCHEDULED TRIBES POPULATION - URBAN BLOCK WISE
801798 Simdega (NP) WARD No.-0007 EB No.-003500 712 6 696
801798 Simdega (NP) WARD No.-0007 EB No.-003600 588 - 548
801798 Simdega (NP) WARD No.-0007 EB No.-0037 SUB-EB No.01 827 6 687
801798 Simdega (NP) WARD No.-0007 EB No.-0037 SUB-EB No.02 434 5 429
801798 Simdega (NP) WARD No.-0007 EB No.-003800 471 13 317
801798 Simdega (NP) WARD No.-0007 EB No.-003900 373 8 284
801798 Simdega (NP) WARD No.-0007 EB No.-004000 444 7 419
801798 Simdega (NP) WARD No.-0007 EB No.-004100 514 3 469
801798 Simdega (NP) WARD No.-0007 EB No.-004200 391 31 254
801798 Simdega (NP) WARD No.-0008 EB No.-004300 267 1 262
801798 Simdega (NP) WARD No.-0008 EB No.-004400 641 344 245
801798 Simdega (NP) WARD No.-0008 EB No.-0045 SUB-EB No.01 441 43 290
801798 Simdega (NP) WARD No.-0008 EB No.-0045 SUB-EB No.02 586 28 477
801798 Simdega (NP) WARD No.-0009 EB No.-004600 688 6 362
801798 Simdega (NP) WARD No.-0009 EB No.-004700 723 - 79
801798 Simdega (NP) WARD No.-0010 EB No.-005600 523 49 411
801798 Simdega (NP) WARD No.-0011 EB No.-0050 SUB-EB No.01 459 - 17
801798 Simdega (NP) WARD No.-0011 EB No.-0050 SUB-EB No.02 404 - -
801798 Simdega (NP) WARD No.-0011 EB No.-005100 411 - -
801798 Simdega (NP) WARD No.-0011 EB No.-005200 304 - -
801798 Simdega (NP) WARD No.-0011 EB No.-005300 330 - 11
801798 Simdega (NP) WARD No.-0011 EB No.-005400 218 20 18
801798 Simdega (NP) WARD No.-0011 EB No.-005500 339 43 93
801798 Simdega (NP) WARD No.-0012 EB No.-004800 501 46 303
801798 Simdega (NP) WARD No.-0012 EB No.-004900 699 - 31
801798 Simdega (NP) WARD No.-0013 EB No.-005700 250 38 33
801798 Simdega (NP) WARD No.-0013 EB No.-005800 432 - 271
801798 Simdega (NP) WARD No.-0013 EB No.-0059 SUB-EB No.01 638 5 -
801798 Simdega (NP) WARD No.-0013 EB No.-0059 SUB-EB No.02 432 - 20
801798 Simdega (NP) WARD No.-0013 EB No.-310100 82 1 10
801798 Simdega (NP) WARD No.-0014 EB No.-006000 635 2 245
801798 Simdega (NP) WARD No.-0014 EB No.-006100 787 5 430
801798 Simdega (NP) WARD No.-0014 EB No.-006200 393 - 381
801798 Simdega (NP) WARD No.-0015 EB No.-006300 576 4 -
801798 Simdega (NP) WARD No.-0016 EB No.-006400 302 - 301
801798 Simdega (NP) WARD No.-0016 EB No.-006500 373 - 355
801798 Simdega (NP) WARD No.-0017 EB No.-006600 625 143 117
801798 Simdega (NP) WARD No.-0017 EB No.-006700 733 - -
801798 Simdega (NP) WARD No.-0017 EB No.-006800 586 - 273
801798 Simdega (NP) WARD No.-0017 EB No.-006900 105 9 96
801798 Simdega (NP) WARD No.-0018 EB No.-0070 SUB-EB No.01 587 - 43
801798 Simdega (NP) WARD No.-0018 EB No.-0070 SUB-EB No.02 448 - 261
801798 Simdega (NP) WARD No.-0018 EB No.-0071 SUB-EB No.01 703 - 7
801798 Simdega (NP) WARD No.-0018 EB No.-0071 SUB-EB No.02 561 - 12
35


Primary Census Abstract for Scheduled Castes (SC)

DISTRICT CENSUS HANDBOOK : SIMDEGA
PRIMARY CENSUS ABSTRACT
Persons Males Females Persons Males Females1 2 3 4 5 6 7 8 9 10
367 Simdega - District Total 9,364 44,674 22,150 22,524 7,722 3,910 3,812 Rural 8,984 42,751 21,196 21,555 7,422 3,779 3,643 Urban 380 1,923 954 969 300 131 169
0224 Simdega Total 1,701 8,326 4,073 4,253 1,400 698 702 Rural 1,701 8,326 4,073 4,253 1,400 698 702 Urban - - - - - - -
0225 Pakar Tanr Total 674 3,287 1,661 1,626 509 263 246 Rural 674 3,287 1,661 1,626 509 263 246 Urban - - - - - - -
0226 Kurdeg Total 736 3,201 1,605 1,596 494 238 256 Rural 736 3,201 1,605 1,596 494 238 256 Urban - - - - - - -
0227 Kersai Total 419 2,014 1,006 1,008 375 189 186 Rural 419 2,014 1,006 1,008 375 189 186 Urban - - - - - - -
0228 Bolba Total 436 2,109 1,038 1,071 342 174 168 Rural 436 2,109 1,038 1,071 342 174 168 Urban - - - - - - -
0229 Thethaitangar Total 1,133 5,296 2,627 2,669 973 493 480 Rural 1,133 5,296 2,627 2,669 973 493 480 Urban - - - - - - -
0230 Kolebira Total 1,927 9,292 4,710 4,582 1,615 872 743 Rural 1,927 9,292 4,710 4,582 1,615 872 743 Urban - - - - - - -
0231 Jaldega Total 467 2,317 1,169 1,148 448 225 223 Rural 467 2,317 1,169 1,148 448 225 223 Urban - - - - - - -
0232 Bansjor Total 179 886 414 472 177 82 95 Rural 179 886 414 472 177 82 95 Urban - - - - - - -
0233 Bano Total 1,312 6,023 2,893 3,130 1,089 545 544 Rural 1,312 6,023 2,893 3,130 1,089 545 544 Urban - - - - - - -
URBAN801798 Simdega (NP) Urban 380 1,923 954 969 300 131 169
Location code
numberDistrict/ CD Block/
Town
Total/ Rural/ Urban
Number of households with SC as
head
Total population (including institutional and houseless population) Population in the age-group 0-6
38
PRIMARY CENSUS ABSTRACT
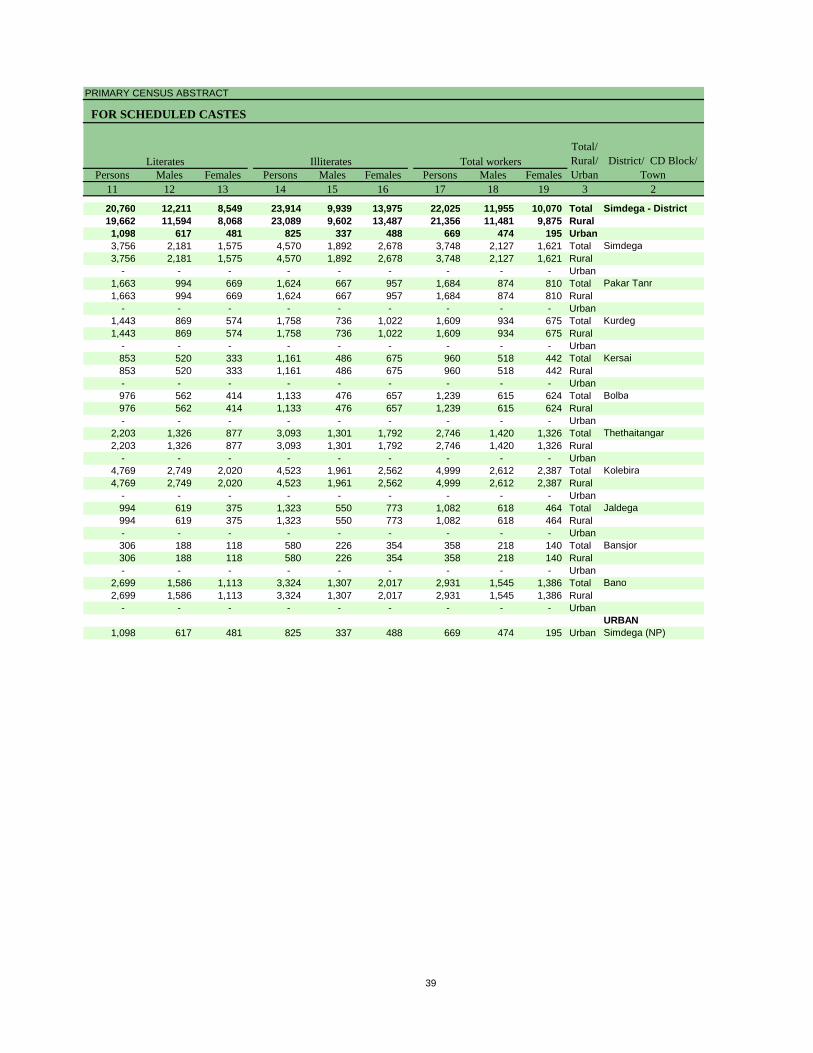
FOR SCHEDULED CASTES
Persons Males Females Persons Males Females Persons Males Females11 12 13 14 15 16 17 18 19 3 2
20,760 12,211 8,549 23,914 9,939 13,975 22,025 11,955 10,070 Total Simdega - District19,662 11,594 8,068 23,089 9,602 13,487 21,356 11,481 9,875 Rural1,098 617 481 825 337 488 669 474 195 Urban3,756 2,181 1,575 4,570 1,892 2,678 3,748 2,127 1,621 Total Simdega3,756 2,181 1,575 4,570 1,892 2,678 3,748 2,127 1,621 Rural
- - - - - - - - - Urban1,663 994 669 1,624 667 957 1,684 874 810 Total Pakar Tanr1,663 994 669 1,624 667 957 1,684 874 810 Rural
- - - - - - - - - Urban1,443 869 574 1,758 736 1,022 1,609 934 675 Total Kurdeg1,443 869 574 1,758 736 1,022 1,609 934 675 Rural
- - - - - - - - - Urban853 520 333 1,161 486 675 960 518 442 Total Kersai853 520 333 1,161 486 675 960 518 442 Rural- - - - - - - - - Urban976 562 414 1,133 476 657 1,239 615 624 Total Bolba976 562 414 1,133 476 657 1,239 615 624 Rural- - - - - - - - - Urban
2,203 1,326 877 3,093 1,301 1,792 2,746 1,420 1,326 Total Thethaitangar2,203 1,326 877 3,093 1,301 1,792 2,746 1,420 1,326 Rural
- - - - - - - - - Urban4,769 2,749 2,020 4,523 1,961 2,562 4,999 2,612 2,387 Total Kolebira4,769 2,749 2,020 4,523 1,961 2,562 4,999 2,612 2,387 Rural
- - - - - - - - - Urban994 619 375 1,323 550 773 1,082 618 464 Total Jaldega994 619 375 1,323 550 773 1,082 618 464 Rural- - - - - - - - - Urban306 188 118 580 226 354 358 218 140 Total Bansjor306 188 118 580 226 354 358 218 140 Rural- - - - - - - - - Urban
2,699 1,586 1,113 3,324 1,307 2,017 2,931 1,545 1,386 Total Bano2,699 1,586 1,113 3,324 1,307 2,017 2,931 1,545 1,386 Rural
- - - - - - - - - UrbanURBAN
1,098 617 481 825 337 488 669 474 195 Urban Simdega (NP)
Literates Illiterates District/ CD Block/ Town
Total/ Rural/ Urban
Total workers
39

DISTRICT CENSUS HANDBOOK : SIMDEGA
PRIMARY CENSUS ABSTRACT
Persons Males Females Persons Males Females Persons Males Females1 2 3 20 21 22 23 24 25 26 27 28
367 Simdega - District Total 11,098 7,547 3,551 5,439 3,946 1,493 2,510 1,566 944 Rural 10,591 7,144 3,447 5,417 3,927 1,490 2,419 1,485 934 Urban 507 403 104 22 19 3 91 81 10
0224 Simdega Total 1,809 1,196 613 786 513 273 588 402 186 Rural 1,809 1,196 613 786 513 273 588 402 186 Urban - - - - - - - - -
0225 Pakar Tanr Total 1,019 697 322 506 367 139 197 149 48 Rural 1,019 697 322 506 367 139 197 149 48 Urban - - - - - - - - -
0226 Kurdeg Total 598 429 169 122 107 15 304 206 98 Rural 598 429 169 122 107 15 304 206 98 Urban - - - - - - - - -
0227 Kersai Total 474 345 129 303 232 71 49 31 18 Rural 474 345 129 303 232 71 49 31 18 Urban - - - - - - - - -
0228 Bolba Total 745 441 304 368 274 94 279 109 170 Rural 745 441 304 368 274 94 279 109 170 Urban - - - - - - - - -
0229 Thethaitangar Total 1,709 1,078 631 885 618 267 338 172 166 Rural 1,709 1,078 631 885 618 267 338 172 166 Urban - - - - - - - - -
0230 Kolebira Total 1,839 1,259 580 1,265 875 390 200 140 60 Rural 1,839 1,259 580 1,265 875 390 200 140 60 Urban - - - - - - - - -
0231 Jaldega Total 501 325 176 262 188 74 30 22 8 Rural 501 325 176 262 188 74 30 22 8 Urban - - - - - - - - -
0232 Bansjor Total 256 199 57 141 122 19 67 32 35 Rural 256 199 57 141 122 19 67 32 35 Urban - - - - - - - - -
0233 Bano Total 1,641 1,175 466 779 631 148 367 222 145 Rural 1,641 1,175 466 779 631 148 367 222 145 Urban - - - - - - - - -
URBAN801798 Simdega (NP) Urban 507 403 104 22 19 3 91 81 10
Location code
numberDistrict/ CD Block/
Town
Total/ Rural/ Urban
Industrial category
Agricultural labourersMain workers Cultivators
40
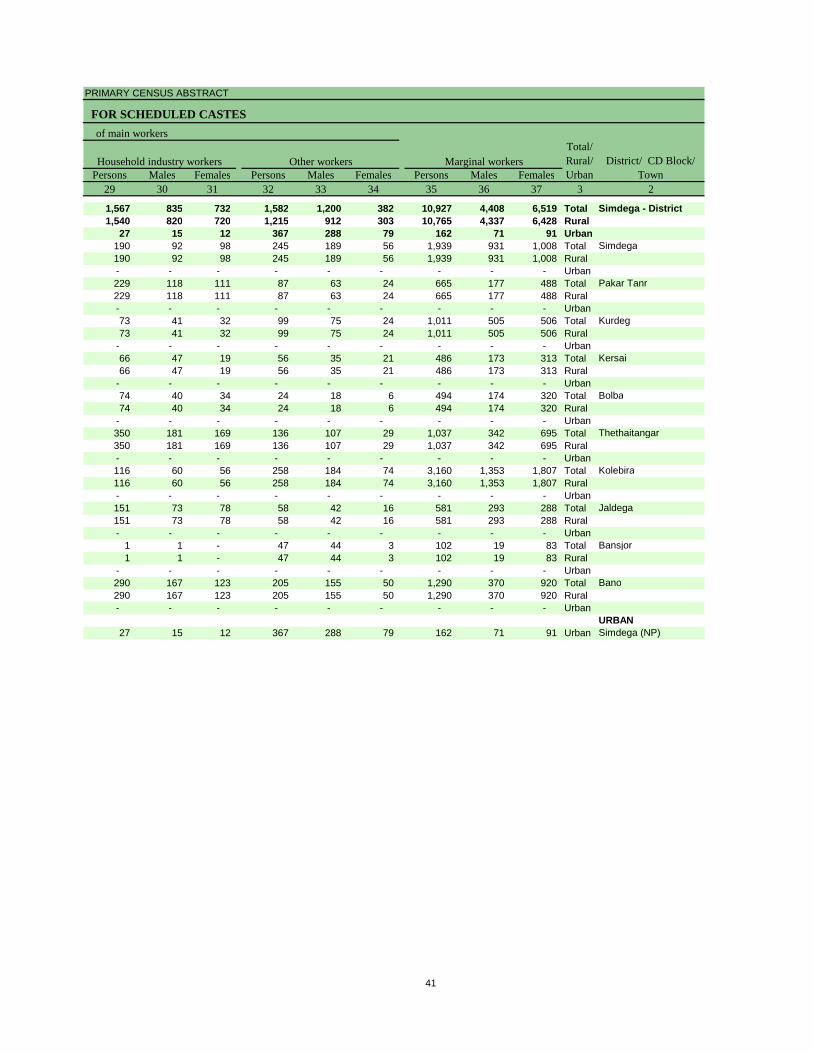
PRIMARY CENSUS ABSTRACT
FOR SCHEDULED CASTES
Persons Males Females Persons Males Females Persons Males Females29 30 31 32 33 34 35 36 37 3 2
1,567 835 732 1,582 1,200 382 10,927 4,408 6,519 Total Simdega - District1,540 820 720 1,215 912 303 10,765 4,337 6,428 Rural
27 15 12 367 288 79 162 71 91 Urban190 92 98 245 189 56 1,939 931 1,008 Total Simdega190 92 98 245 189 56 1,939 931 1,008 Rural- - - - - - - - - Urban229 118 111 87 63 24 665 177 488 Total Pakar Tanr229 118 111 87 63 24 665 177 488 Rural- - - - - - - - - Urban73 41 32 99 75 24 1,011 505 506 Total Kurdeg73 41 32 99 75 24 1,011 505 506 Rural
- - - - - - - - - Urban66 47 19 56 35 21 486 173 313 Total Kersai66 47 19 56 35 21 486 173 313 Rural
- - - - - - - - - Urban74 40 34 24 18 6 494 174 320 Total Bolba74 40 34 24 18 6 494 174 320 Rural
- - - - - - - - - Urban350 181 169 136 107 29 1,037 342 695 Total Thethaitangar350 181 169 136 107 29 1,037 342 695 Rural- - - - - - - - - Urban116 60 56 258 184 74 3,160 1,353 1,807 Total Kolebira116 60 56 258 184 74 3,160 1,353 1,807 Rural- - - - - - - - - Urban151 73 78 58 42 16 581 293 288 Total Jaldega151 73 78 58 42 16 581 293 288 Rural- - - - - - - - - Urban
1 1 - 47 44 3 102 19 83 Total Bansjor1 1 - 47 44 3 102 19 83 Rural
- - - - - - - - - Urban290 167 123 205 155 50 1,290 370 920 Total Bano290 167 123 205 155 50 1,290 370 920 Rural- - - - - - - - - Urban
URBAN27 15 12 367 288 79 162 71 91 Urban Simdega (NP)
of main workers
Other workersHousehold industry workers Marginal workersTotal/ Rural/ Urban
District/ CD Block/ Town
41

DISTRICT CENSUS HANDBOOK : SIMDEGA
PRIMARY CENSUS ABSTRACT
Persons Males Females Persons Males Females Persons Males Females1 2 3 38 39 40 41 42 43 44 45 46
367 Simdega - District Total 4,134 1,602 2,532 5,306 2,031 3,275 544 249 295 Rural 4,118 1,587 2,531 5,206 1,998 3,208 534 245 289 Urban 16 15 1 100 33 67 10 4 6
0224 Simdega Total 614 324 290 1,139 489 650 39 17 22 Rural 614 324 290 1,139 489 650 39 17 22 Urban - - - - - - - - -
0225 Pakar Tanr Total 253 55 198 390 107 283 17 10 7 Rural 253 55 198 390 107 283 17 10 7 Urban - - - - - - - - -
0226 Kurdeg Total 84 38 46 675 364 311 90 43 47 Rural 84 38 46 675 364 311 90 43 47 Urban - - - - - - - - -
0227 Kersai Total 229 83 146 173 55 118 61 26 35 Rural 229 83 146 173 55 118 61 26 35 Urban - - - - - - - - -
0228 Bolba Total 118 51 67 316 88 228 7 2 5 Rural 118 51 67 316 88 228 7 2 5 Urban - - - - - - - - -
0229 Thethaitangar Total 419 150 269 513 141 372 65 30 35 Rural 419 150 269 513 141 372 65 30 35 Urban - - - - - - - - -
0230 Kolebira Total 1,621 665 956 1,102 469 633 121 52 69 Rural 1,621 665 956 1,102 469 633 121 52 69 Urban - - - - - - - - -
0231 Jaldega Total 302 146 156 159 77 82 95 51 44 Rural 302 146 156 159 77 82 95 51 44 Urban - - - - - - - - -
0232 Bansjor Total 56 6 50 41 9 32 1 - 1 Rural 56 6 50 41 9 32 1 - 1 Urban - - - - - - - - -
0233 Bano Total 422 69 353 698 199 499 38 14 24 Rural 422 69 353 698 199 499 38 14 24 Urban - - - - - - - - -
URBAN801798 Simdega (NP) Urban 16 15 1 100 33 67 10 4 6
Total/ Rural/ Urban
Agricultural labourers
Industrial category of
Cultivators Household industry workersLocation
code number
District/ CD Block/ Town
42

PRIMARY CENSUS ABSTRACT
FOR SCHEDULED CASTES
Persons Males Females Persons Males Females47 48 49 50 51 52 3 2 1
943 526 417 22,649 10,195 12,454 Total Simdega - District 367907 507 400 21,395 9,715 11,680 Rural36 19 17 1,254 480 774 Urban
147 101 46 4,578 1,946 2,632 Total Simdega 0224147 101 46 4,578 1,946 2,632 Rural- - - - - - Urban
5 5 - 1,603 787 816 Total Pakar Tanr 02255 5 - 1,603 787 816 Rural
- - - - - - Urban162 60 102 1,592 671 921 Total Kurdeg 0226162 60 102 1,592 671 921 Rural- - - - - - Urban23 9 14 1,054 488 566 Total Kersai 022723 9 14 1,054 488 566 Rural
- - - - - - Urban53 33 20 870 423 447 Total Bolba 022853 33 20 870 423 447 Rural
- - - - - - Urban40 21 19 2,550 1,207 1,343 Total Thethaitangar 022940 21 19 2,550 1,207 1,343 Rural
- - - - - - Urban316 167 149 4,293 2,098 2,195 Total Kolebira 0230316 167 149 4,293 2,098 2,195 Rural- - - - - - Urban25 19 6 1,235 551 684 Total Jaldega 023125 19 6 1,235 551 684 Rural
- - - - - - Urban4 4 - 528 196 332 Total Bansjor 02324 4 - 528 196 332 Rural
- - - - - - Urban132 88 44 3,092 1,348 1,744 Total Bano 0233132 88 44 3,092 1,348 1,744 Rural- - - - - - Urban
URBAN36 19 17 1,254 480 774 Urban Simdega (NP) 801798
marginal workers
District/ CD Block/ Town
Location code
numberOther workers Non-workers
Total/ Rural/ Urban
43


Primary Census Abstract for Scheduled Tribes (ST)

DISTRICT CENSUS HANDBOOK : SIMDEGA
PRIMARY CENSUS ABSTRACT
Persons Males Females Persons Males Females1 2 3 4 5 6 7 8 9 10
367 Simdega - District Total 82,125 424,407 211,546 212,861 65,716 33,367 32,349 Rural 78,256 404,487 201,913 202,574 63,428 32,224 31,204 Urban 3,869 19,920 9,633 10,287 2,288 1,143 1,145
0224 Simdega Total 9,254 49,242 24,586 24,656 7,287 3,691 3,596 Rural 9,254 49,242 24,586 24,656 7,287 3,691 3,596 Urban - - - - - - -
0225 Pakar Tanr Total 4,911 25,613 12,993 12,620 3,858 2,031 1,827 Rural 4,911 25,613 12,993 12,620 3,858 2,031 1,827 Urban - - - - - - -
0226 Kurdeg Total 6,948 34,707 17,196 17,511 5,155 2,604 2,551 Rural 6,948 34,707 17,196 17,511 5,155 2,604 2,551 Urban - - - - - - -
0227 Kersai Total 5,982 31,505 15,619 15,886 4,848 2,451 2,397 Rural 5,982 31,505 15,619 15,886 4,848 2,451 2,397 Urban - - - - - - -
0228 Bolba Total 4,403 22,433 11,100 11,333 3,458 1,776 1,682 Rural 4,403 22,433 11,100 11,333 3,458 1,776 1,682 Urban - - - - - - -
0229 Thethaitangar Total 13,871 70,432 35,148 35,284 11,368 5,787 5,581 Rural 13,871 70,432 35,148 35,284 11,368 5,787 5,581 Urban - - - - - - -
0230 Kolebira Total 8,643 44,590 22,385 22,205 7,028 3,627 3,401 Rural 8,643 44,590 22,385 22,205 7,028 3,627 3,401 Urban - - - - - - -
0231 Jaldega Total 10,079 53,309 26,644 26,665 8,719 4,375 4,344 Rural 10,079 53,309 26,644 26,665 8,719 4,375 4,344 Urban - - - - - - -
0232 Bansjor Total 4,215 21,840 10,999 10,841 3,215 1,608 1,607 Rural 4,215 21,840 10,999 10,841 3,215 1,608 1,607 Urban - - - - - - -
0233 Bano Total 9,950 50,816 25,243 25,573 8,492 4,274 4,218 Rural 9,950 50,816 25,243 25,573 8,492 4,274 4,218 Urban - - - - - - -
URBAN801798 Simdega (NP) Urban 3,869 19,920 9,633 10,287 2,288 1,143 1,145
Population in the age-group 0-6Location
code number
District/ CD Block/ Town
Total/ Rural/ Urban
Number of households with ST as
head
Total population (including institutional and houseless population)
46
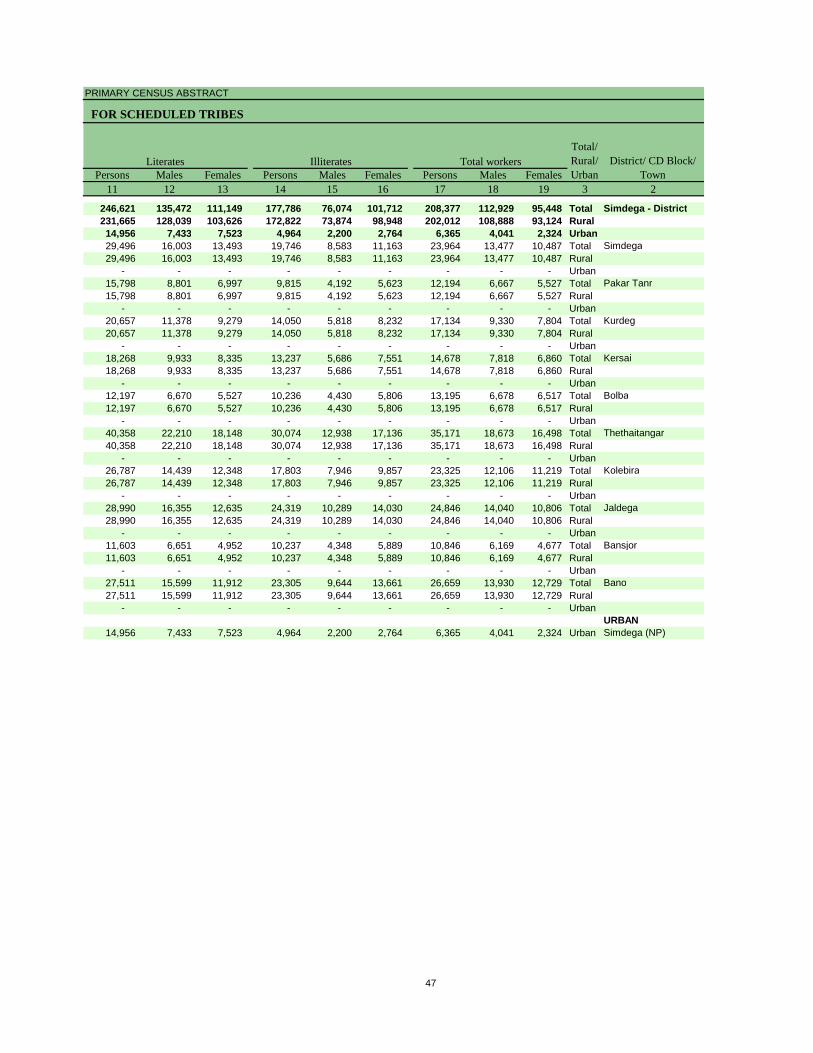
PRIMARY CENSUS ABSTRACT
FOR SCHEDULED TRIBES
Persons Males Females Persons Males Females Persons Males Females11 12 13 14 15 16 17 18 19 3 2
246,621 135,472 111,149 177,786 76,074 101,712 208,377 112,929 95,448 Total Simdega - District231,665 128,039 103,626 172,822 73,874 98,948 202,012 108,888 93,124 Rural14,956 7,433 7,523 4,964 2,200 2,764 6,365 4,041 2,324 Urban29,496 16,003 13,493 19,746 8,583 11,163 23,964 13,477 10,487 Total Simdega29,496 16,003 13,493 19,746 8,583 11,163 23,964 13,477 10,487 Rural
- - - - - - - - - Urban15,798 8,801 6,997 9,815 4,192 5,623 12,194 6,667 5,527 Total Pakar Tanr15,798 8,801 6,997 9,815 4,192 5,623 12,194 6,667 5,527 Rural
- - - - - - - - - Urban20,657 11,378 9,279 14,050 5,818 8,232 17,134 9,330 7,804 Total Kurdeg20,657 11,378 9,279 14,050 5,818 8,232 17,134 9,330 7,804 Rural
- - - - - - - - - Urban18,268 9,933 8,335 13,237 5,686 7,551 14,678 7,818 6,860 Total Kersai18,268 9,933 8,335 13,237 5,686 7,551 14,678 7,818 6,860 Rural
- - - - - - - - - Urban12,197 6,670 5,527 10,236 4,430 5,806 13,195 6,678 6,517 Total Bolba12,197 6,670 5,527 10,236 4,430 5,806 13,195 6,678 6,517 Rural
- - - - - - - - - Urban40,358 22,210 18,148 30,074 12,938 17,136 35,171 18,673 16,498 Total Thethaitangar40,358 22,210 18,148 30,074 12,938 17,136 35,171 18,673 16,498 Rural
- - - - - - - - - Urban26,787 14,439 12,348 17,803 7,946 9,857 23,325 12,106 11,219 Total Kolebira26,787 14,439 12,348 17,803 7,946 9,857 23,325 12,106 11,219 Rural
- - - - - - - - - Urban28,990 16,355 12,635 24,319 10,289 14,030 24,846 14,040 10,806 Total Jaldega28,990 16,355 12,635 24,319 10,289 14,030 24,846 14,040 10,806 Rural
- - - - - - - - - Urban11,603 6,651 4,952 10,237 4,348 5,889 10,846 6,169 4,677 Total Bansjor11,603 6,651 4,952 10,237 4,348 5,889 10,846 6,169 4,677 Rural
- - - - - - - - - Urban27,511 15,599 11,912 23,305 9,644 13,661 26,659 13,930 12,729 Total Bano27,511 15,599 11,912 23,305 9,644 13,661 26,659 13,930 12,729 Rural
- - - - - - - - - UrbanURBAN
14,956 7,433 7,523 4,964 2,200 2,764 6,365 4,041 2,324 Urban Simdega (NP)
Literates Illiterates District/ CD Block/ Town
Total/ Rural/ Urban
Total workers
47

DISTRICT CENSUS HANDBOOK : SIMDEGA
PRIMARY CENSUS ABSTRACT
Persons Males Females Persons Males Females Persons Males Females1 2 3 20 21 22 23 24 25 26 27 28
367 Simdega - District Total 110,821 73,463 37,358 75,258 52,456 22,802 21,432 12,223 9,209 Rural 106,526 70,502 36,024 74,417 51,848 22,569 20,878 11,816 9,062 Urban 4,295 2,961 1,334 841 608 233 554 407 147
0224 Simdega Total 12,021 8,251 3,770 8,771 6,107 2,664 1,814 1,246 568 Rural 12,021 8,251 3,770 8,771 6,107 2,664 1,814 1,246 568 Urban - - - - - - - - -
0225 Pakar Tanr Total 5,366 3,911 1,455 3,816 2,928 888 982 642 340 Rural 5,366 3,911 1,455 3,816 2,928 888 982 642 340 Urban - - - - - - - - -
0226 Kurdeg Total 7,473 5,192 2,281 3,674 2,742 932 2,924 1,922 1,002 Rural 7,473 5,192 2,281 3,674 2,742 932 2,924 1,922 1,002 Urban - - - - - - - - -
0227 Kersai Total 7,150 5,216 1,934 5,666 4,246 1,420 894 618 276 Rural 7,150 5,216 1,934 5,666 4,246 1,420 894 618 276 Urban - - - - - - - - -
0228 Bolba Total 8,544 5,194 3,350 5,436 3,728 1,708 2,366 1,034 1,332 Rural 8,544 5,194 3,350 5,436 3,728 1,708 2,366 1,034 1,332 Urban - - - - - - - - -
0229 Thethaitangar Total 19,201 12,477 6,724 13,834 9,575 4,259 3,161 1,576 1,585 Rural 19,201 12,477 6,724 13,834 9,575 4,259 3,161 1,576 1,585 Urban - - - - - - - - -
0230 Kolebira Total 9,914 6,131 3,783 7,225 4,520 2,705 1,217 727 490 Rural 9,914 6,131 3,783 7,225 4,520 2,705 1,217 727 490 Urban - - - - - - - - -
0231 Jaldega Total 13,159 8,960 4,199 10,801 7,742 3,059 1,218 559 659 Rural 13,159 8,960 4,199 10,801 7,742 3,059 1,218 559 659 Urban - - - - - - - - -
0232 Bansjor Total 9,158 5,544 3,614 7,797 4,663 3,134 544 291 253 Rural 9,158 5,544 3,614 7,797 4,663 3,134 544 291 253 Urban - - - - - - - - -
0233 Bano Total 14,540 9,626 4,914 7,397 5,597 1,800 5,758 3,201 2,557 Rural 14,540 9,626 4,914 7,397 5,597 1,800 5,758 3,201 2,557 Urban - - - - - - - - -
URBAN801798 Simdega (NP) Urban 4,295 2,961 1,334 841 608 233 554 407 147
CultivatorsLocation
code number
District/ CD Block/ Town
Total/ Rural/ Urban
Industrial category
Agricultural labourersMain workers
48

PRIMARY CENSUS ABSTRACT
FOR SCHEDULED TRIBES
Persons Males Females Persons Males Females Persons Males Females29 30 31 32 33 34 35 36 37 3 2
1,846 1,184 662 12,285 7,600 4,685 97,556 39,466 58,090 Total Simdega - District1,794 1,145 649 9,437 5,693 3,744 95,486 38,386 57,100 Rural
52 39 13 2,848 1,907 941 2,070 1,080 990 Urban207 115 92 1,229 783 446 11,943 5,226 6,717 Total Simdega207 115 92 1,229 783 446 11,943 5,226 6,717 Rural- - - - - - - - - Urban97 67 30 471 274 197 6,828 2,756 4,072 Total Pakar Tanr97 67 30 471 274 197 6,828 2,756 4,072 Rural
- - - - - - - - - Urban154 117 37 721 411 310 9,661 4,138 5,523 Total Kurdeg154 117 37 721 411 310 9,661 4,138 5,523 Rural- - - - - - - - - Urban95 69 26 495 283 212 7,528 2,602 4,926 Total Kersai95 69 26 495 283 212 7,528 2,602 4,926 Rural
- - - - - - - - - Urban149 84 65 593 348 245 4,651 1,484 3,167 Total Bolba149 84 65 593 348 245 4,651 1,484 3,167 Rural- - - - - - - - - Urban409 262 147 1,797 1,064 733 15,970 6,196 9,774 Total Thethaitangar409 262 147 1,797 1,064 733 15,970 6,196 9,774 Rural- - - - - - - - - Urban140 83 57 1,332 801 531 13,411 5,975 7,436 Total Kolebira140 83 57 1,332 801 531 13,411 5,975 7,436 Rural- - - - - - - - - Urban197 128 69 943 531 412 11,687 5,080 6,607 Total Jaldega197 128 69 943 531 412 11,687 5,080 6,607 Rural- - - - - - - - - Urban93 58 35 724 532 192 1,688 625 1,063 Total Bansjor93 58 35 724 532 192 1,688 625 1,063 Rural
- - - - - - - - - Urban253 162 91 1,132 666 466 12,119 4,304 7,815 Total Bano253 162 91 1,132 666 466 12,119 4,304 7,815 Rural- - - - - - - - - Urban
URBAN52 39 13 2,848 1,907 941 2,070 1,080 990 Urban Simdega (NP)
Household industry workers Marginal workersTotal/ Rural/ Urban
District/ CD Block/ Town
of main workers
Other workers
49

DISTRICT CENSUS HANDBOOK : SIMDEGA
PRIMARY CENSUS ABSTRACT
Persons Males Females Persons Males Females Persons Males Females1 2 3 38 39 40 41 42 43 44 45 46
367 Simdega - District Total 47,963 20,063 27,900 44,023 16,374 27,649 1,263 493 770 Rural 47,390 19,722 27,668 43,103 16,012 27,091 1,227 469 758 Urban 573 341 232 920 362 558 36 24 12
0224 Simdega Total 6,474 2,716 3,758 4,828 2,098 2,730 124 63 61 Rural 6,474 2,716 3,758 4,828 2,098 2,730 124 63 61 Urban - - - - - - - - -
0225 Pakar Tanr Total 2,751 1,267 1,484 3,821 1,353 2,468 74 30 44 Rural 2,751 1,267 1,484 3,821 1,353 2,468 74 30 44 Urban - - - - - - - - -
0226 Kurdeg Total 2,369 947 1,422 6,582 2,856 3,726 185 88 97 Rural 2,369 947 1,422 6,582 2,856 3,726 185 88 97 Urban - - - - - - - - -
0227 Kersai Total 3,569 1,161 2,408 3,653 1,295 2,358 41 19 22 Rural 3,569 1,161 2,408 3,653 1,295 2,358 41 19 22 Urban - - - - - - - - -
0228 Bolba Total 2,358 779 1,579 2,130 614 1,516 53 31 22 Rural 2,358 779 1,579 2,130 614 1,516 53 31 22 Urban - - - - - - - - -
0229 Thethaitangar Total 9,413 3,611 5,802 5,635 2,035 3,600 146 60 86 Rural 9,413 3,611 5,802 5,635 2,035 3,600 146 60 86 Urban - - - - - - - - -
0230 Kolebira Total 7,894 3,716 4,178 4,767 1,871 2,896 158 52 106 Rural 7,894 3,716 4,178 4,767 1,871 2,896 158 52 106 Urban - - - - - - - - -
0231 Jaldega Total 7,745 3,620 4,125 3,426 1,247 2,179 215 56 159 Rural 7,745 3,620 4,125 3,426 1,247 2,179 215 56 159 Urban - - - - - - - - -
0232 Bansjor Total 779 231 548 579 233 346 130 20 110 Rural 779 231 548 579 233 346 130 20 110 Urban - - - - - - - - -
0233 Bano Total 4,038 1,674 2,364 7,682 2,410 5,272 101 50 51 Rural 4,038 1,674 2,364 7,682 2,410 5,272 101 50 51 Urban - - - - - - - - -
URBAN801798 Simdega (NP) Urban 573 341 232 920 362 558 36 24 12
Industrial category of
Cultivators Household industry workersLocation
code number
District/ CD Block/ Town
Total/ Rural/ Urban
Agricultural labourers
50
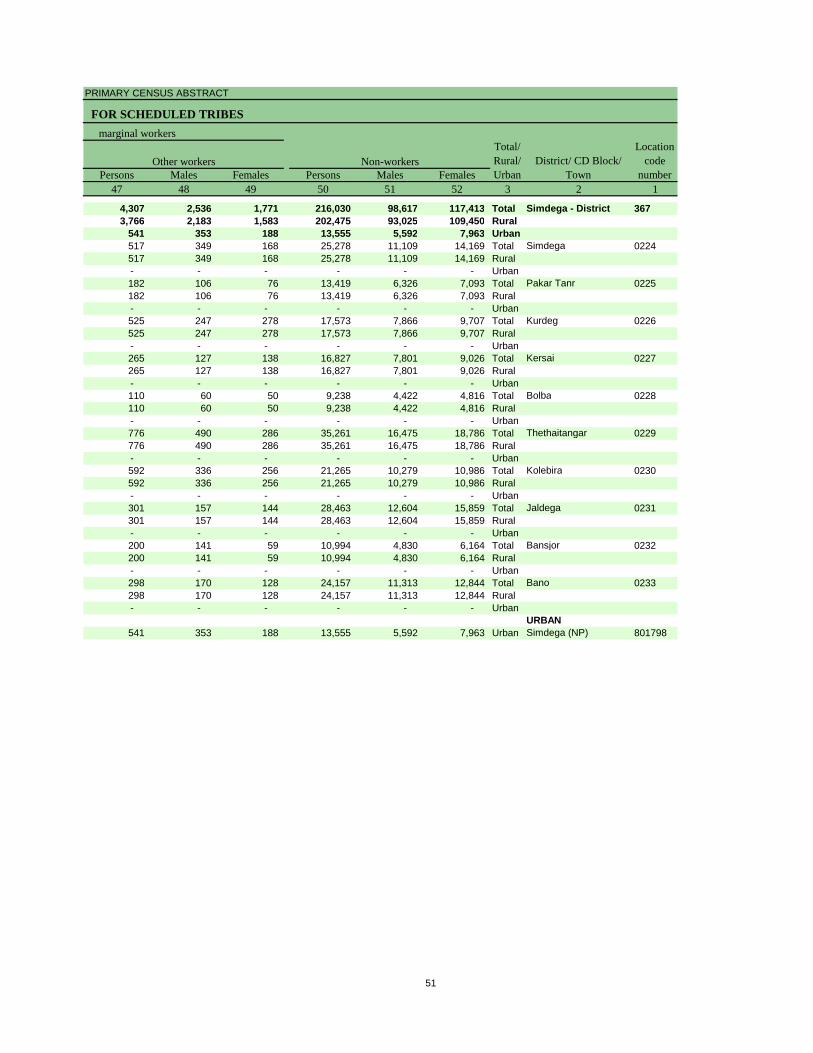
PRIMARY CENSUS ABSTRACT
FOR SCHEDULED TRIBES
Persons Males Females Persons Males Females47 48 49 50 51 52 3 2 1
4,307 2,536 1,771 216,030 98,617 117,413 Total Simdega - District 3673,766 2,183 1,583 202,475 93,025 109,450 Rural
541 353 188 13,555 5,592 7,963 Urban517 349 168 25,278 11,109 14,169 Total Simdega 0224517 349 168 25,278 11,109 14,169 Rural- - - - - - Urban182 106 76 13,419 6,326 7,093 Total Pakar Tanr 0225182 106 76 13,419 6,326 7,093 Rural- - - - - - Urban525 247 278 17,573 7,866 9,707 Total Kurdeg 0226525 247 278 17,573 7,866 9,707 Rural- - - - - - Urban265 127 138 16,827 7,801 9,026 Total Kersai 0227265 127 138 16,827 7,801 9,026 Rural- - - - - - Urban110 60 50 9,238 4,422 4,816 Total Bolba 0228110 60 50 9,238 4,422 4,816 Rural- - - - - - Urban776 490 286 35,261 16,475 18,786 Total Thethaitangar 0229776 490 286 35,261 16,475 18,786 Rural- - - - - - Urban592 336 256 21,265 10,279 10,986 Total Kolebira 0230592 336 256 21,265 10,279 10,986 Rural- - - - - - Urban301 157 144 28,463 12,604 15,859 Total Jaldega 0231301 157 144 28,463 12,604 15,859 Rural- - - - - - Urban200 141 59 10,994 4,830 6,164 Total Bansjor 0232200 141 59 10,994 4,830 6,164 Rural- - - - - - Urban298 170 128 24,157 11,313 12,844 Total Bano 0233298 170 128 24,157 11,313 12,844 Rural- - - - - - Urban
URBAN541 353 188 13,555 5,592 7,963 Urban Simdega (NP) 801798
marginal workers
District/ CD Block/ Town
Location code
numberOther workers Non-workers
Total/ Rural/ Urban
51


Rural PCA-C.D. blocks wise Village Primary Census
Abstract
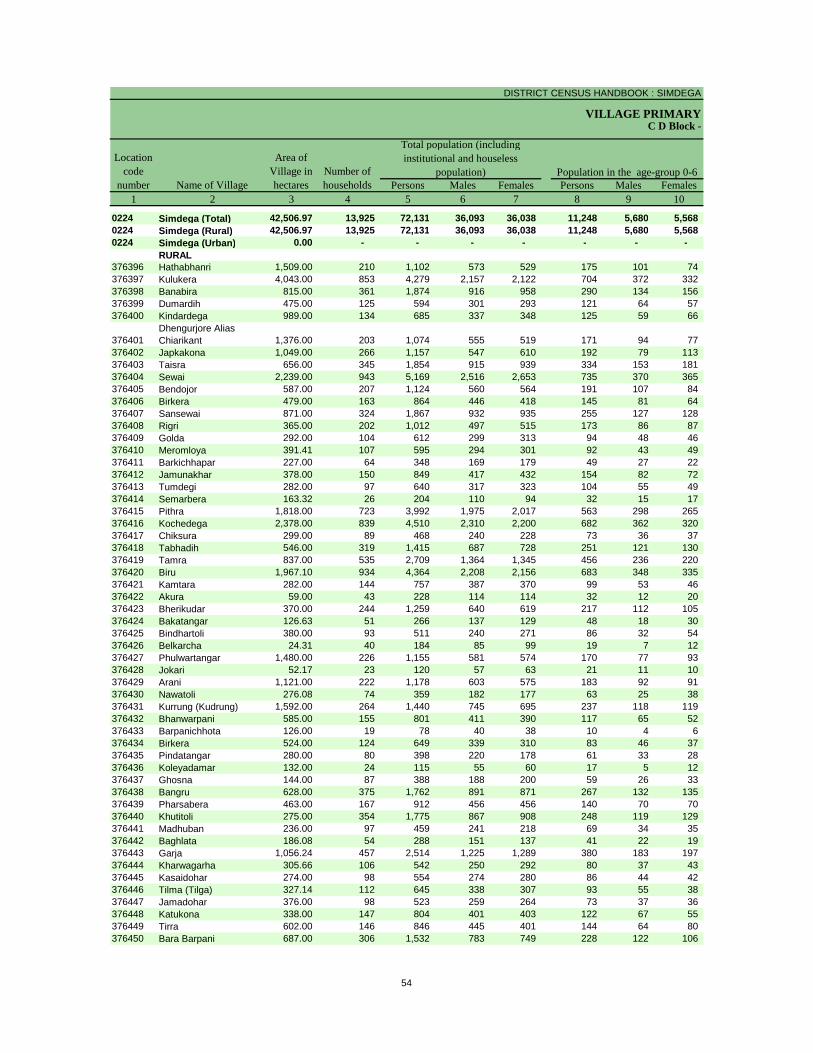
DISTRICT CENSUS HANDBOOK : SIMDEGA
VILLAGE PRIMARY
Persons Males Females Persons Males Females1 2 3 4 5 6 7 8 9 10
0224 Simdega (Total) 42,506.97 13,925 72,131 36,093 36,038 11,248 5,680 5,568 0224 Simdega (Rural) 42,506.97 13,925 72,131 36,093 36,038 11,248 5,680 5,568 0224 Simdega (Urban) 0.00 - - - - - - -
RURAL376396 Hathabhanri 1,509.00 210 1,102 573 529 175 101 74 376397 Kulukera 4,043.00 853 4,279 2,157 2,122 704 372 332 376398 Banabira 815.00 361 1,874 916 958 290 134 156 376399 Dumardih 475.00 125 594 301 293 121 64 57 376400 Kindardega 989.00 134 685 337 348 125 59 66
376401Dhengurjore Alias Chiarikant 1,376.00 203 1,074 555 519 171 94 77
376402 Japkakona 1,049.00 266 1,157 547 610 192 79 113 376403 Taisra 656.00 345 1,854 915 939 334 153 181 376404 Sewai 2,239.00 943 5,169 2,516 2,653 735 370 365 376405 Bendojor 587.00 207 1,124 560 564 191 107 84 376406 Birkera 479.00 163 864 446 418 145 81 64 376407 Sansewai 871.00 324 1,867 932 935 255 127 128 376408 Rigri 365.00 202 1,012 497 515 173 86 87 376409 Golda 292.00 104 612 299 313 94 48 46 376410 Meromloya 391.41 107 595 294 301 92 43 49 376411 Barkichhapar 227.00 64 348 169 179 49 27 22 376412 Jamunakhar 378.00 150 849 417 432 154 82 72 376413 Tumdegi 282.00 97 640 317 323 104 55 49 376414 Semarbera 163.32 26 204 110 94 32 15 17 376415 Pithra 1,818.00 723 3,992 1,975 2,017 563 298 265 376416 Kochedega 2,378.00 839 4,510 2,310 2,200 682 362 320 376417 Chiksura 299.00 89 468 240 228 73 36 37 376418 Tabhadih 546.00 319 1,415 687 728 251 121 130 376419 Tamra 837.00 535 2,709 1,364 1,345 456 236 220 376420 Biru 1,967.10 934 4,364 2,208 2,156 683 348 335 376421 Kamtara 282.00 144 757 387 370 99 53 46 376422 Akura 59.00 43 228 114 114 32 12 20 376423 Bherikudar 370.00 244 1,259 640 619 217 112 105 376424 Bakatangar 126.63 51 266 137 129 48 18 30 376425 Bindhartoli 380.00 93 511 240 271 86 32 54 376426 Belkarcha 24.31 40 184 85 99 19 7 12 376427 Phulwartangar 1,480.00 226 1,155 581 574 170 77 93 376428 Jokari 52.17 23 120 57 63 21 11 10 376429 Arani 1,121.00 222 1,178 603 575 183 92 91 376430 Nawatoli 276.08 74 359 182 177 63 25 38 376431 Kurrung (Kudrung) 1,592.00 264 1,440 745 695 237 118 119 376432 Bhanwarpani 585.00 155 801 411 390 117 65 52 376433 Barpanichhota 126.00 19 78 40 38 10 4 6 376434 Birkera 524.00 124 649 339 310 83 46 37 376435 Pindatangar 280.00 80 398 220 178 61 33 28 376436 Koleyadamar 132.00 24 115 55 60 17 5 12 376437 Ghosna 144.00 87 388 188 200 59 26 33 376438 Bangru 628.00 375 1,762 891 871 267 132 135 376439 Pharsabera 463.00 167 912 456 456 140 70 70 376440 Khutitoli 275.00 354 1,775 867 908 248 119 129 376441 Madhuban 236.00 97 459 241 218 69 34 35 376442 Baghlata 186.08 54 288 151 137 41 22 19 376443 Garja 1,056.24 457 2,514 1,225 1,289 380 183 197 376444 Kharwagarha 305.66 106 542 250 292 80 37 43 376445 Kasaidohar 274.00 98 554 274 280 86 44 42 376446 Tilma (Tilga) 327.14 112 645 338 307 93 55 38 376447 Jamadohar 376.00 98 523 259 264 73 37 36 376448 Katukona 338.00 147 804 401 403 122 67 55 376449 Tirra 602.00 146 846 445 401 144 64 80 376450 Bara Barpani 687.00 306 1,532 783 749 228 122 106
C D Block -
Population in the age-group 0-6Name of Village
Location code
number
Total population (including institutional and houseless
population)Area of
Village in hectares
Number of households
54

PRIMARY CENSUS ABSTRACT
CENSUS ABSTRACTSimdega
Persons Males Females Persons Males Females Persons Males Females11 12 13 14 15 16 17 18 19 2
8,326 4,073 4,253 49,242 24,586 24,656 41,314 22,931 18,383 Simdega (Total)8,326 4,073 4,253 49,242 24,586 24,656 41,314 22,931 18,383 Simdega (Rural)
- - - - - - - - - Simdega (Urban)RURAL
430 208 222 517 287 230 524 314 210 Hathabhanri1,479 733 746 1,794 904 890 1,989 1,151 838 Kulukera
589 271 318 849 406 443 981 541 440 Banabira59 32 27 335 171 164 207 119 88 Dumardih
156 77 79 429 209 220 193 114 79 Kindardega
- - - 794 411 383 604 357 247 Dhengurjore Alias Chiarikant
36 14 22 660 305 355 645 370 275 Japkakona228 99 129 967 476 491 999 550 449 Taisra155 74 81 4,345 2,096 2,249 3,143 1,650 1,493 Sewai287 144 143 774 386 388 616 335 281 Bendojor- - - 838 434 404 473 272 201 Birkera
7 4 3 1,672 819 853 1,173 614 559 Sansewai46 29 17 490 238 252 491 285 206 Rigri48 26 22 528 256 272 371 193 178 Golda33 14 19 498 242 256 333 181 152 Meromloya
- - - 261 125 136 218 116 102 Barkichhapar64 29 35 486 237 249 446 240 206 Jamunakhar
- - - 638 315 323 429 219 210 Tumdegi- - - 195 105 90 138 80 58 Semarbera327 164 163 3,011 1,491 1,520 2,235 1,228 1,007 Pithra268 136 132 3,519 1,798 1,721 2,706 1,487 1,219 Kochedega- - - 307 162 145 258 150 108 Chiksura342 160 182 557 271 286 818 444 374 Tabhadih213 113 100 1,227 595 632 1,368 777 591 Tamra686 345 341 2,226 1,137 1,089 2,529 1,439 1,090 Biru15 8 7 624 315 309 515 276 239 Kamtara
- - - 54 30 24 129 83 46 Akura85 47 38 711 363 348 772 453 319 Bherikudar
- - - 79 43 36 117 77 40 Bakatangar71 33 38 327 155 172 328 177 151 Bindhartoli1 1 - 158 71 87 119 61 58 Belkarcha
227 112 115 876 440 436 761 434 327 Phulwartangar- - - 92 44 48 87 43 44 Jokari99 47 52 1,052 542 510 691 391 300 Arani
- - - 206 105 101 219 136 83 Nawatoli99 54 45 1,174 608 566 696 418 278 Kurrung (Kudrung)
- - - 744 382 362 511 283 228 Bhanwarpani- - - 78 40 38 51 31 20 Barpanichhota- - - 599 312 287 464 258 206 Birkera13 5 8 372 208 164 296 173 123 Pindatangar
- - - 110 52 58 54 30 24 Koleyadamar126 62 64 259 124 135 215 116 99 Ghosna188 92 96 894 457 437 1,084 615 469 Bangru71 34 37 726 357 369 513 278 235 Pharsabera
490 243 247 1,100 532 568 1,276 679 597 Khutitoli43 20 23 217 121 96 271 161 110 Madhuban
- - - 222 118 104 168 91 77 Baghlata380 178 202 1,828 889 939 1,490 790 700 Garja367 164 203 168 82 86 283 138 145 Kharwagarha
6 2 4 526 259 267 345 175 170 Kasaidohar- - - 502 265 237 367 211 156 Tilma (Tilga)- - - 489 243 246 375 206 169 Jamadohar- - - 616 301 315 484 257 227 Katukona
4 2 2 698 367 331 516 300 216 Tirra83 41 42 1,228 624 604 913 529 384 Bara Barpani
Scheduled Castes population Scheduled Tribes populationName of Village
Literates
55

DISTRICT CENSUS HANDBOOK : SIMDEGA
VILLAGE PRIMARYC D Block -
Persons Males Females Persons Males Females Persons Males Females1 2 20 21 22 23 24 25 26 27 28
0224 Simdega (Total) 30,817 13,162 17,655 34,049 19,491 14,558 16,644 11,633 5,011 0224 Simdega (Rural) 30,817 13,162 17,655 34,049 19,491 14,558 16,644 11,633 5,011 0224 Simdega (Urban) - - - - - - - - -
RURAL376396 Hathabhanri 578 259 319 425 314 111 77 71 6 376397 Kulukera 2,290 1,006 1,284 1,764 1,091 673 768 609 159 376398 Banabira 893 375 518 813 436 377 363 217 146 376399 Dumardih 387 182 205 287 172 115 91 79 12 376400 Kindardega 492 223 269 415 205 210 255 176 79
376401Dhengurjore Alias Chiarikant 470 198 272 581 314 267 160 155 5
376402 Japkakona 512 177 335 667 386 281 179 161 18 376403 Taisra 855 365 490 822 505 317 233 145 88 376404 Sewai 2,026 866 1,160 2,262 1,350 912 2,088 1,272 816 376405 Bendojor 508 225 283 545 288 257 346 199 147 376406 Birkera 391 174 217 399 227 172 155 129 26 376407 Sansewai 694 318 376 979 522 457 560 377 183 376408 Rigri 521 212 309 353 232 121 184 130 54 376409 Golda 241 106 135 322 171 151 110 102 8 376410 Meromloya 262 113 149 344 175 169 130 107 23 376411 Barkichhapar 130 53 77 195 99 96 1 - 1 376412 Jamunakhar 403 177 226 474 234 240 150 119 31 376413 Tumdegi 211 98 113 329 165 164 268 143 125 376414 Semarbera 66 30 36 105 53 52 96 48 48 376415 Pithra 1,757 747 1,010 1,894 1,157 737 995 785 210 376416 Kochedega 1,804 823 981 2,470 1,332 1,138 792 679 113 376417 Chiksura 210 90 120 256 124 132 14 9 5 376418 Tabhadih 597 243 354 703 353 350 170 135 35 376419 Tamra 1,341 587 754 1,068 688 380 422 256 166 376420 Biru 1,835 769 1,066 1,492 1,121 371 794 710 84 376421 Kamtara 242 111 131 380 193 187 175 89 86 376422 Akura 99 31 68 51 46 5 3 3 - 376423 Bherikudar 487 187 300 564 333 231 138 118 20 376424 Bakatangar 149 60 89 165 92 73 67 66 1 376425 Bindhartoli 183 63 120 220 140 80 174 119 55 376426 Belkarcha 65 24 41 76 45 31 45 34 11 376427 Phulwartangar 394 147 247 605 324 281 567 305 262 376428 Jokari 33 14 19 31 23 8 31 23 8 376429 Arani 487 212 275 641 331 310 445 261 184 376430 Nawatoli 140 46 94 179 92 87 74 68 6 376431 Kurrung (Kudrung) 744 327 417 878 460 418 520 369 151 376432 Bhanwarpani 290 128 162 430 223 207 50 38 12 376433 Barpanichhota 27 9 18 49 24 25 - - - 376434 Birkera 185 81 104 349 191 158 97 60 37 376435 Pindatangar 102 47 55 219 119 100 219 119 100 376436 Koleyadamar 61 25 36 32 29 3 31 28 3 376437 Ghosna 173 72 101 201 107 94 40 25 15 376438 Bangru 678 276 402 770 485 285 335 280 55 376439 Pharsabera 399 178 221 383 229 154 145 123 22 376440 Khutitoli 499 188 311 716 392 324 158 110 48 376441 Madhuban 188 80 108 228 122 106 76 43 33 376442 Baghlata 120 60 60 150 79 71 64 36 28 376443 Garja 1,024 435 589 1,281 666 615 919 514 405 376444 Kharwagarha 259 112 147 279 143 136 200 130 70 376445 Kasaidohar 209 99 110 303 157 146 239 139 100 376446 Tilma (Tilga) 278 127 151 324 171 153 156 145 11 376447 Jamadohar 148 53 95 270 141 129 5 2 3 376448 Katukona 320 144 176 445 222 223 68 55 13 376449 Tirra 330 145 185 384 231 153 150 102 48 376450 Bara Barpani 619 254 365 664 440 224 436 260 176
Illiterates Total workers Main workersName of Village
Location code
number
56

PRIMARY CENSUS ABSTRACT
CENSUS ABSTRACTSimdega
Persons Males Females Persons Males Females PersonsMalesFemales Persons Males Females29 30 31 32 33 34 35 36 37 38 39 40 2
10,907 7,705 3,202 2,861 1,970 891 620 334 286 2,256 1,624 632 Simdega (Total)10,907 7,705 3,202 2,861 1,970 891 620 334 286 2,256 1,624 632 Simdega (Rural)
- - - - - - - - - - - - Simdega (Urban)RURAL
51 50 1 17 17 - - - - 9 4 5 Hathabhanri384 300 84 284 239 45 1 1 - 99 69 30 Kulukera161 96 65 153 91 62 - - - 49 30 19 Banabira
9 9 - 61 58 3 5 3 2 16 9 7 Dumardih251 174 77 3 2 1 - - - 1 - 1 Kindardega
142 142 - 1 1 - 4 4 - 13 8 5 Dhengurjore Alias Chiarikant
156 152 4 5 3 2 1 1 - 17 5 12 Japkakona108 75 33 44 26 18 41 17 24 40 27 13 Taisra
1,758 1,022 736 162 125 37 15 8 7 153 117 36 Sewai154 96 58 179 95 84 2 2 - 11 6 5 Bendojor131 111 20 11 10 1 - - - 13 8 5 Birkera399 278 121 105 66 39 9 6 3 47 27 20 Sansewai77 70 7 83 42 41 1 1 - 23 17 6 Rigri
102 99 3 1 - 1 - - - 7 3 4 Golda121 100 21 7 7 - - - - 2 - 2 Meromloya- - - - - - - - - 1 - 1 Barkichhapar71 61 10 57 45 12 4 3 1 18 10 8 Jamunakhar
233 125 108 7 1 6 8 4 4 20 13 7 Tumdegi75 36 39 9 6 3 3 1 2 9 5 4 Semarbera
717 581 136 116 93 23 88 62 26 74 49 25 Pithra517 491 26 185 131 54 10 7 3 80 50 30 Kochedega
9 6 3 2 1 1 - - - 3 2 1 Chiksura37 31 6 83 69 14 26 18 8 24 17 7 Tabhadih44 28 16 10 4 6 176 84 92 192 140 52 Tamra
474 447 27 74 69 5 28 19 9 218 175 43 Biru154 81 73 11 5 6 - - - 10 3 7 Kamtara
2 2 - 1 1 - - - - - - - Akura63 58 5 9 8 1 14 11 3 52 41 11 Bherikudar54 53 1 12 12 - - - - 1 1 - Bakatangar
129 96 33 16 7 9 1 - 1 28 16 12 Bindhartoli33 25 8 6 5 1 - - - 6 4 2 Belkarcha
530 287 243 25 11 14 - - - 12 7 5 Phulwartangar11 10 1 - - - - - - 20 13 7 Jokari
392 220 172 2 1 1 - - - 51 40 11 Arani71 68 3 1 - 1 - - - 2 - 2 Nawatoli
473 341 132 31 15 16 2 2 - 14 11 3 Kurrung (Kudrung)24 20 4 11 9 2 4 2 2 11 7 4 Bhanwarpani
- - - - - - - - - - - - Barpanichhota52 35 17 42 25 17 - - - 3 - 3 Birkera
209 111 98 1 1 - - - - 9 7 2 Pindatangar3 2 1 23 23 - - - - 5 3 2 Koleyadamar
31 18 13 2 1 1 - - - 7 6 1 Ghosna113 83 30 70 54 16 7 6 1 145 137 8 Bangru59 56 3 29 26 3 2 1 1 55 40 15 Pharsabera45 26 19 7 6 1 6 4 2 100 74 26 Khutitoli54 35 19 1 - 1 1 1 - 20 7 13 Madhuban44 24 20 10 7 3 - - - 10 5 5 Baghlata
549 296 253 230 126 104 17 8 9 123 84 39 Garja102 51 51 26 19 7 3 2 1 69 58 11 Kharwagarha193 104 89 15 11 4 7 4 3 24 20 4 Kasaidohar149 139 10 3 2 1 - - - 4 4 - Tilma (Tilga)- - - - - - - - - 5 2 3 Jamadohar44 44 - 6 6 - - - - 18 5 13 Katukona
121 81 40 11 8 3 - - - 18 13 5 Tirra150 77 73 192 110 82 18 8 10 76 65 11 Bara Barpani
CultivatorsName of Village
Household industry workersAgricultural labourers
Industrial category of main workers
Other workers
57

DISTRICT CENSUS HANDBOOK : SIMDEGA
VILLAGE PRIMARYC D Block -
Persons Males Females Persons Males Females Persons Males Females1 2 41 42 43 44 45 46 47 48 49
0224 Simdega (Total) 17,405 7,858 9,547 8,532 3,664 4,868 7,482 3,287 4,195 0224 Simdega (Rural) 17,405 7,858 9,547 8,532 3,664 4,868 7,482 3,287 4,195 0224 Simdega (Urban) - - - - - - - - -
RURAL376396 Hathabhanri 348 243 105 95 90 5 253 153 100 376397 Kulukera 996 482 514 495 291 204 481 175 306 376398 Banabira 450 219 231 105 57 48 306 140 166 376399 Dumardih 196 93 103 67 39 28 129 54 75 376400 Kindardega 160 29 131 151 28 123 7 - 7
376401Dhengurjore Alias Chiarikant 421 159 262 407 153 254 6 4 2
376402 Japkakona 488 225 263 326 138 188 152 81 71 376403 Taisra 589 360 229 65 37 28 506 309 197 376404 Sewai 174 78 96 53 12 41 48 18 30 376405 Bendojor 199 89 110 104 61 43 89 24 65 376406 Birkera 244 98 146 174 55 119 68 43 25 376407 Sansewai 419 145 274 89 4 85 329 141 188 376408 Rigri 169 102 67 50 38 12 113 61 52 376409 Golda 212 69 143 149 42 107 63 27 36 376410 Meromloya 214 68 146 4 1 3 207 64 143 376411 Barkichhapar 194 99 95 59 53 6 133 46 87 376412 Jamunakhar 324 115 209 149 46 103 169 67 102 376413 Tumdegi 61 22 39 27 7 20 33 14 19 376414 Semarbera 9 5 4 1 - 1 8 5 3 376415 Pithra 899 372 527 410 104 306 444 239 205 376416 Kochedega 1,678 653 1,025 1,261 536 725 390 103 287 376417 Chiksura 242 115 127 15 6 9 219 108 111 376418 Tabhadih 533 218 315 71 25 46 330 105 225 376419 Tamra 646 432 214 172 94 78 173 126 47 376420 Biru 698 411 287 311 178 133 265 130 135 376421 Kamtara 205 104 101 185 90 95 10 7 3 376422 Akura 48 43 5 40 40 - 8 3 5 376423 Bherikudar 426 215 211 128 61 67 216 111 105 376424 Bakatangar 98 26 72 94 24 70 2 1 1 376425 Bindhartoli 46 21 25 6 2 4 36 19 17 376426 Belkarcha 31 11 20 6 4 2 22 5 17 376427 Phulwartangar 38 19 19 22 14 8 8 2 6 376428 Jokari - - - - - - - - - 376429 Arani 196 70 126 161 54 107 16 3 13 376430 Nawatoli 105 24 81 87 19 68 18 5 13 376431 Kurrung (Kudrung) 358 91 267 283 60 223 56 25 31 376432 Bhanwarpani 380 185 195 266 129 137 94 43 51 376433 Barpanichhota 49 24 25 11 5 6 38 19 19 376434 Birkera 252 131 121 173 83 90 72 45 27 376435 Pindatangar - - - - - - - - - 376436 Koleyadamar 1 1 - - - - - - - 376437 Ghosna 161 82 79 12 7 5 147 75 72 376438 Bangru 435 205 230 83 43 40 279 108 171 376439 Pharsabera 238 106 132 146 54 92 69 36 33 376440 Khutitoli 558 282 276 57 27 30 453 227 226 376441 Madhuban 152 79 73 85 38 47 8 4 4 376442 Baghlata 86 43 43 51 26 25 31 13 18 376443 Garja 362 152 210 288 118 170 47 13 34 376444 Kharwagarha 79 13 66 34 5 29 38 5 33 376445 Kasaidohar 64 18 46 58 16 42 2 - 2 376446 Tilma (Tilga) 168 26 142 157 20 137 6 2 4 376447 Jamadohar 265 139 126 260 136 124 4 3 1 376448 Katukona 377 167 210 307 130 177 57 29 28 376449 Tirra 234 129 105 149 69 80 67 44 23 376450 Bara Barpani 228 180 48 206 167 39 14 7 7
Location code
number Name of VillageMarginal workers Cultivators Agricultural labourers
Industrial category
58

PRIMARY CENSUS ABSTRACT
CENSUS ABSTRACTSimdega
Persons Males Females Persons Males Females Persons Males Females50 51 52 53 54 55 56 57 58 2 1
328 171 157 1,063 736 327 38,082 16,602 21,480 Simdega (Total) 0224328 171 157 1,063 736 327 38,082 16,602 21,480 Simdega (Rural) 0224- - - - - - - - - Simdega (Urban) 0224
RURAL- - - - - - 677 259 418 Hathabhanri 37639616 12 4 4 4 - 2,515 1,066 1,449 Kulukera 37639738 21 17 1 1 - 1,061 480 581 Banabira 376398
- - - - - - 307 129 178 Dumardih 3763992 1 1 - - - 270 132 138 Kindardega 376400
6 2 4 2 - 2 493 241 252 Dhengurjore Alias Chiarikant 376401
9 5 4 1 1 - 490 161 329 Japkakona 3764022 1 1 16 13 3 1,032 410 622 Taisra 376403
11 6 5 62 42 20 2,907 1,166 1,741 Sewai 3764043 2 1 3 2 1 579 272 307 Bendojor 3764051 - 1 1 - 1 465 219 246 Birkera 376406
- - - 1 - 1 888 410 478 Sansewai 376407- - - 6 3 3 659 265 394 Rigri 376408- - - - - - 290 128 162 Golda 376409
1 1 - 2 2 - 251 119 132 Meromloya 3764101 - 1 1 - 1 153 70 83 Barkichhapar 3764112 1 1 4 1 3 375 183 192 Jamunakhar 376412
- - - 1 1 - 311 152 159 Tumdegi 376413- - - - - - 99 57 42 Semarbera 37641416 13 3 29 16 13 2,098 818 1,280 Pithra 3764151 - 1 26 14 12 2,040 978 1,062 Kochedega 376416
- - - 8 1 7 212 116 96 Chiksura 37641719 7 12 113 81 32 712 334 378 Tabhadih 37641834 16 18 267 196 71 1,641 676 965 Tamra 3764195 3 2 117 100 17 2,872 1,087 1,785 Biru 3764202 2 - 8 5 3 377 194 183 Kamtara 376421
- - - - - - 177 68 109 Akura 37642272 37 35 10 6 4 695 307 388 Bherikudar 376423
- - - 2 1 1 101 45 56 Bakatangar 376424- - - 4 - 4 291 100 191 Bindhartoli 376425
1 - 1 2 2 - 108 40 68 Belkarcha 376426- - - 8 3 5 550 257 293 Phulwartangar 376427- - - - - - 89 34 55 Jokari 376428- - - 19 13 6 537 272 265 Arani 376429- - - - - - 180 90 90 Nawatoli 376430
3 2 1 16 4 12 562 285 277 Kurrung (Kudrung) 3764315 1 4 15 12 3 371 188 183 Bhanwarpani 376432
- - - - - - 29 16 13 Barpanichhota 376433- - - 7 3 4 300 148 152 Birkera 376434- - - - - - 179 101 78 Pindatangar 376435- - - 1 1 - 83 26 57 Koleyadamar 376436- - - 2 - 2 187 81 106 Ghosna 376437
9 4 5 64 50 14 992 406 586 Bangru 3764384 1 3 19 15 4 529 227 302 Pharsabera 3764396 2 4 42 26 16 1,059 475 584 Khutitoli 3764403 2 1 56 35 21 231 119 112 Madhuban 376441
- - - 4 4 - 138 72 66 Baghlata 3764425 4 1 22 17 5 1,233 559 674 Garja 3764432 1 1 5 2 3 263 107 156 Kharwagarha 3764443 1 2 1 1 - 251 117 134 Kasaidohar 3764451 1 - 4 3 1 321 167 154 Tilma (Tilga) 376446
- - - 1 - 1 253 118 135 Jamadohar 376447- - - 13 8 5 359 179 180 Katukona 376448- - - 18 16 2 462 214 248 Tirra 376449
1 1 - 7 5 2 868 343 525 Bara Barpani 376450
Non-workers
of marginal workersLocation
code number
Household industry workersName of Village
Other workers
59

DISTRICT CENSUS HANDBOOK : SIMDEGA
VILLAGE PRIMARY
Persons Males Females Persons Males Females1 2 3 4 5 6 7 8 9 10
C D Block -
Population in the age-group 0-6Name of Village
Location code
number
Total population (including institutional and houseless
population)Area of
Village in hectares
Number of households
376451 Thalkobera 397.73 90 440 236 204 72 47 25 376452 Belgarh 412.00 86 418 196 222 51 26 25 376453 Jokbahar 1,354.00 487 2,293 1,157 1,136 375 188 187 376454 Muriya 1,376.00 283 1,496 729 767 219 104 115 376455 Konbera 289.00 56 264 130 134 44 24 20 376456 Danrgurda 338.10 170 817 398 419 150 71 79
60
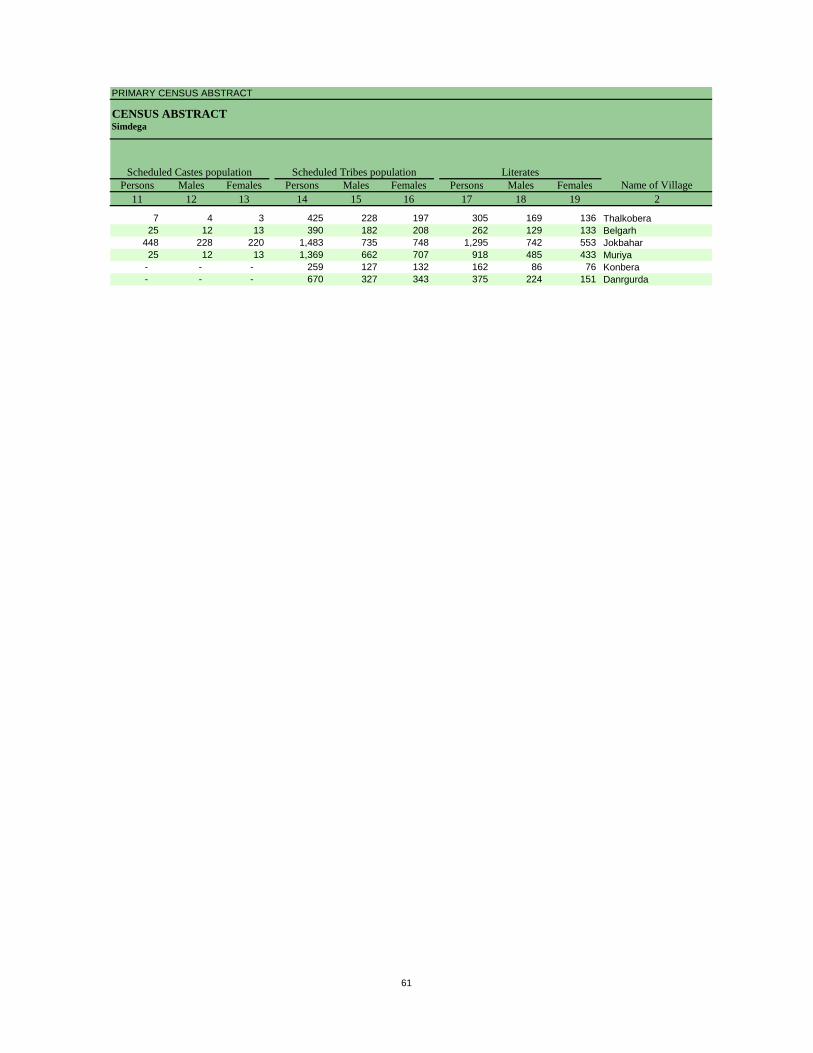
PRIMARY CENSUS ABSTRACT
CENSUS ABSTRACTSimdega
Persons Males Females Persons Males Females Persons Males Females11 12 13 14 15 16 17 18 19 2
Scheduled Castes population Scheduled Tribes populationName of Village
Literates
7 4 3 425 228 197 305 169 136 Thalkobera25 12 13 390 182 208 262 129 133 Belgarh
448 228 220 1,483 735 748 1,295 742 553 Jokbahar25 12 13 1,369 662 707 918 485 433 Muriya
- - - 259 127 132 162 86 76 Konbera- - - 670 327 343 375 224 151 Danrgurda
61

DISTRICT CENSUS HANDBOOK : SIMDEGA
VILLAGE PRIMARYC D Block -
Persons Males Females Persons Males Females Persons Males Females1 2 20 21 22 23 24 25 26 27 28
Illiterates Total workers Main workersName of Village
Location code
number
376451 Thalkobera 135 67 68 272 137 135 122 98 24 376452 Belgarh 156 67 89 207 106 101 80 75 5 376453 Jokbahar 998 415 583 1,131 617 514 771 498 273 376454 Muriya 578 244 334 639 371 268 374 268 106 376455 Konbera 102 44 58 152 80 72 54 52 2 376456 Danrgurda 442 174 268 417 216 201 215 165 50
62

PRIMARY CENSUS ABSTRACT
CENSUS ABSTRACTSimdega
Persons Males Females Persons Males Females PersonsMalesFemales Persons Males Females29 30 31 32 33 34 35 36 37 38 39 40 2
CultivatorsName of Village
Household industry workersAgricultural labourers
Industrial category of main workers
Other workers
94 75 19 24 21 3 - - - 4 2 2 Thalkobera60 57 3 5 5 - 2 2 - 13 11 2 Belgarh
384 255 129 133 94 39 101 33 68 153 116 37 Jokbahar189 161 28 134 75 59 12 8 4 39 24 15 Muriya
1 1 - 49 49 - - - - 4 2 2 Konbera144 133 11 64 26 38 1 1 - 6 5 1 Danrgurda
63

DISTRICT CENSUS HANDBOOK : SIMDEGA
VILLAGE PRIMARYC D Block -
Persons Males Females Persons Males Females Persons Males Females1 2 41 42 43 44 45 46 47 48 49
Location code
number Name of VillageMarginal workers Cultivators Agricultural labourers
Industrial category
376451 Thalkobera 150 39 111 137 37 100 13 2 11 376452 Belgarh 127 31 96 13 1 12 107 27 80 376453 Jokbahar 360 119 241 130 44 86 186 54 132 376454 Muriya 265 103 162 35 14 21 215 81 134 376455 Konbera 98 28 70 5 - 5 70 14 56 376456 Danrgurda 202 51 151 47 32 15 152 18 134
64

PRIMARY CENSUS ABSTRACT
CENSUS ABSTRACTSimdega
Persons Males Females Persons Males Females Persons Males Females50 51 52 53 54 55 56 57 58 2 1
Non-workers
of marginal workersLocation
code number
Household industry workersName of Village
Other workers
- - - - - - 168 99 69 Thalkobera 376451- - - 7 3 4 211 90 121 Belgarh 37645220 7 13 24 14 10 1,162 540 622 Jokbahar 3764532 - 2 13 8 5 857 358 499 Muriya 376454
22 14 8 1 - 1 112 50 62 Konbera 376455- - - 3 1 2 400 182 218 Danrgurda 376456
65

DISTRICT CENSUS HANDBOOK : SIMDEGA
VILLAGE PRIMARY
Persons Males Females Persons Males Females1 2 3 4 5 6 7 8 9 10
0225 Pakar Tanr (Total) 28,682.41 7,357 37,507 19,065 18,442 5,845 3,065 2,780 0225 Pakar Tanr (Rural) 28,682.41 7,357 37,507 19,065 18,442 5,845 3,065 2,780 0225 Pakar Tanr (Urban) 0.00 - - - - - - -
RURAL376457 Kinbira 894.00 426 1,870 947 923 288 142 146 376458 Kairbera 1,798.04 440 2,051 1,028 1,023 279 135 144 376459 Rengapani 589.00 93 437 235 202 80 53 27 376460 Hardibera 798.00 115 535 279 256 77 42 35 376461 Kesalpur 2,103.00 372 1,903 984 919 278 150 128 376462 Basatpur 791.00 176 829 414 415 141 73 68 376463 Purnapani 478.94 92 453 231 222 62 30 32 376464 Karamukha 415.68 90 496 244 252 66 30 36 376465 Takwa 524.05 190 936 480 456 169 93 76 376466 Asanbera 1,228.51 270 1,375 720 655 216 131 85 376467 Gondlipani 872.97 172 840 417 423 143 67 76 376468 Katasaru 662.00 100 440 217 223 58 34 24 376469 Sirupardhiya 166.00 56 314 150 164 61 30 31 376470 Lailonga 541.00 120 594 284 310 129 62 67 376471 Bhundupani 485.29 88 489 237 252 80 42 38 376472 Kurushkela 1,934.00 328 1,650 815 835 209 99 110 376473 Serlonga 699.00 114 542 271 271 89 47 42 376474 Ghaghra 616.00 132 627 337 290 86 50 36 376475 Bhelwadih 649.00 239 1,236 640 596 155 93 62 376476 Kewanddih 2,586.00 350 1,998 1,048 950 322 179 143 376477 Koleang 909.58 397 2,015 1,089 926 298 179 119 376478 Pakardanr 2,399.00 592 3,098 1,576 1,522 481 256 225 376479 Nanesera 835.00 247 1,336 679 657 196 97 99 376480 Palidih 203.00 155 807 391 416 136 55 81 376481 Sarkhutoli 526.00 207 1,141 579 562 215 111 104 376482 Masekera 153.00 47 210 107 103 27 14 13 376483 Dumardih 617.00 140 795 385 410 111 60 51 376484 Sikariyadanr 1,843.00 866 4,372 2,201 2,171 708 337 371 376485 Pahargurda 345.00 84 448 235 213 79 49 30 376486 Khanjaloya 555.35 168 883 442 441 132 70 62 376487 Sogra 1,465.00 491 2,787 1,403 1,384 474 255 219
C D Block -
Population in the age-group 0-6Name of Village
Location code
number
Total population (including institutional and houseless
population)Area of
Village in hectares
Number of households
66
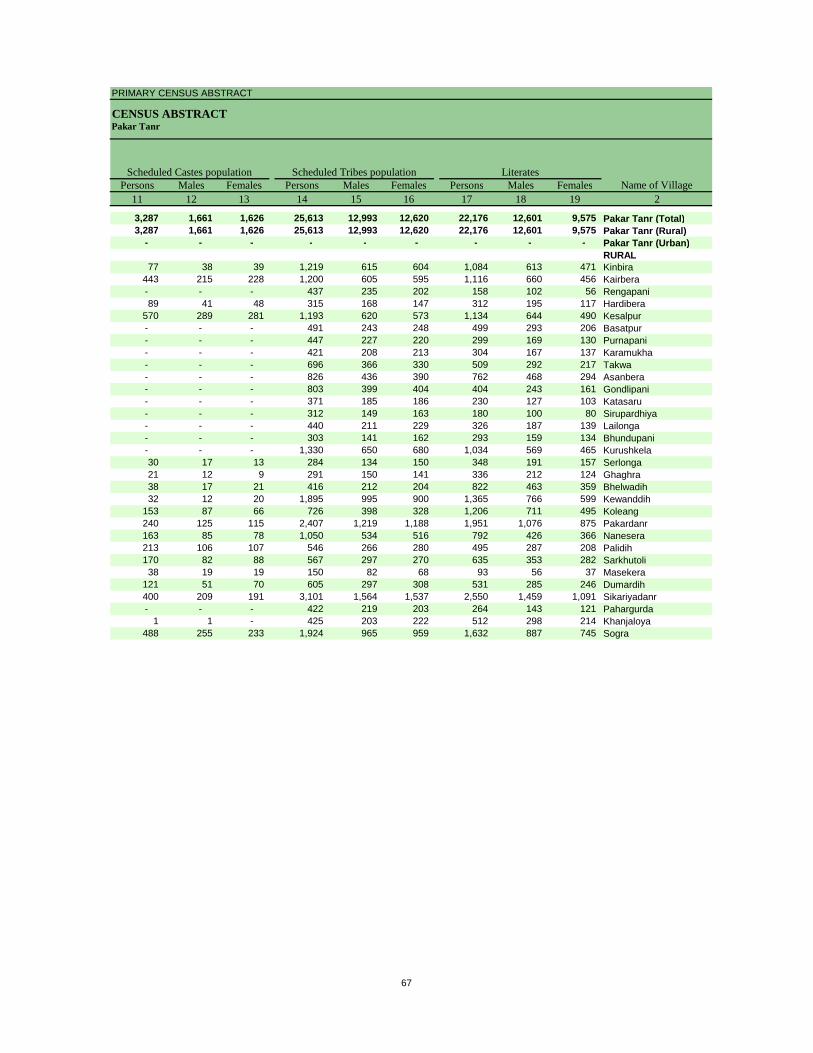
PRIMARY CENSUS ABSTRACT
CENSUS ABSTRACTPakar Tanr
Persons Males Females Persons Males Females Persons Males Females11 12 13 14 15 16 17 18 19 2
3,287 1,661 1,626 25,613 12,993 12,620 22,176 12,601 9,575 Pakar Tanr (Total)3,287 1,661 1,626 25,613 12,993 12,620 22,176 12,601 9,575 Pakar Tanr (Rural)
- - - - - - - - - Pakar Tanr (Urban)RURAL
77 38 39 1,219 615 604 1,084 613 471 Kinbira443 215 228 1,200 605 595 1,116 660 456 Kairbera- - - 437 235 202 158 102 56 Rengapani89 41 48 315 168 147 312 195 117 Hardibera
570 289 281 1,193 620 573 1,134 644 490 Kesalpur- - - 491 243 248 499 293 206 Basatpur- - - 447 227 220 299 169 130 Purnapani- - - 421 208 213 304 167 137 Karamukha- - - 696 366 330 509 292 217 Takwa- - - 826 436 390 762 468 294 Asanbera- - - 803 399 404 404 243 161 Gondlipani- - - 371 185 186 230 127 103 Katasaru- - - 312 149 163 180 100 80 Sirupardhiya- - - 440 211 229 326 187 139 Lailonga- - - 303 141 162 293 159 134 Bhundupani- - - 1,330 650 680 1,034 569 465 Kurushkela30 17 13 284 134 150 348 191 157 Serlonga21 12 9 291 150 141 336 212 124 Ghaghra38 17 21 416 212 204 822 463 359 Bhelwadih32 12 20 1,895 995 900 1,365 766 599 Kewanddih
153 87 66 726 398 328 1,206 711 495 Koleang240 125 115 2,407 1,219 1,188 1,951 1,076 875 Pakardanr163 85 78 1,050 534 516 792 426 366 Nanesera213 106 107 546 266 280 495 287 208 Palidih170 82 88 567 297 270 635 353 282 Sarkhutoli38 19 19 150 82 68 93 56 37 Masekera
121 51 70 605 297 308 531 285 246 Dumardih400 209 191 3,101 1,564 1,537 2,550 1,459 1,091 Sikariyadanr- - - 422 219 203 264 143 121 Pahargurda
1 1 - 425 203 222 512 298 214 Khanjaloya488 255 233 1,924 965 959 1,632 887 745 Sogra
Scheduled Castes population Scheduled Tribes populationName of Village
Literates
67

DISTRICT CENSUS HANDBOOK : SIMDEGA
VILLAGE PRIMARYC D Block -
Persons Males Females Persons Males Females Persons Males Females1 2 20 21 22 23 24 25 26 27 28
0225 Pakar Tanr (Total) 15,331 6,464 8,867 17,985 9,878 8,107 8,458 6,061 2,397 0225 Pakar Tanr (Rural) 15,331 6,464 8,867 17,985 9,878 8,107 8,458 6,061 2,397 0225 Pakar Tanr (Urban) - - - - - - - - -
RURAL376457 Kinbira 786 334 452 975 558 417 463 389 74 376458 Kairbera 935 368 567 1,187 582 605 534 422 112 376459 Rengapani 279 133 146 236 114 122 199 102 97 376460 Hardibera 223 84 139 315 157 158 2 1 1 376461 Kesalpur 769 340 429 910 484 426 387 343 44 376462 Basatpur 330 121 209 229 218 11 213 206 7 376463 Purnapani 154 62 92 125 114 11 13 9 4 376464 Karamukha 192 77 115 292 144 148 14 11 3 376465 Takwa 427 188 239 511 264 247 239 135 104 376466 Asanbera 613 252 361 850 431 419 446 238 208 376467 Gondlipani 436 174 262 450 223 227 14 3 11 376468 Katasaru 210 90 120 145 120 25 26 24 2 376469 Sirupardhiya 134 50 84 153 74 79 147 72 75 376470 Lailonga 268 97 171 300 140 160 72 69 3 376471 Bhundupani 196 78 118 224 110 114 11 7 4 376472 Kurushkela 616 246 370 888 436 452 183 150 33 376473 Serlonga 194 80 114 214 125 89 205 117 88 376474 Ghaghra 291 125 166 326 162 164 26 16 10 376475 Bhelwadih 414 177 237 586 329 257 426 236 190 376476 Kewanddih 633 282 351 1,005 539 466 377 296 81 376477 Koleang 809 378 431 1,012 552 460 533 391 142 376478 Pakardanr 1,147 500 647 1,296 793 503 707 447 260 376479 Nanesera 544 253 291 639 308 331 326 243 83 376480 Palidih 312 104 208 417 203 214 103 96 7 376481 Sarkhutoli 506 226 280 636 336 300 283 249 34 376482 Masekera 117 51 66 113 59 54 35 26 9 376483 Dumardih 264 100 164 430 212 218 243 172 71 376484 Sikariyadanr 1,822 742 1,080 1,874 1,095 779 1,260 897 363 376485 Pahargurda 184 92 92 289 149 140 86 80 6 376486 Khanjaloya 371 144 227 354 206 148 156 75 81 376487 Sogra 1,155 516 639 1,004 641 363 729 539 190
Illiterates Total workers Main workersName of Village
Location code
number
68

PRIMARY CENSUS ABSTRACT
CENSUS ABSTRACTPakar Tanr
Persons Males Females Persons Males Females PersonsMalesFemales Persons Males Females29 30 31 32 33 34 35 36 37 38 39 40 2
5,612 4,249 1,363 1,663 1,065 598 459 280 179 724 467 257 Pakar Tanr (Total)5,612 4,249 1,363 1,663 1,065 598 459 280 179 724 467 257 Pakar Tanr (Rural)
- - - - - - - - - - - - Pakar Tanr (Urban)RURAL
327 293 34 107 76 31 2 2 - 27 18 9 Kinbira337 269 68 120 106 14 48 27 21 29 20 9 Kairbera105 76 29 93 26 67 - - - 1 - 1 Rengapani- - - - - - - - - 2 1 1 Hardibera250 237 13 95 85 10 10 8 2 32 13 19 Kesalpur170 166 4 36 36 - - - - 7 4 3 Basatpur12 9 3 - - - - - - 1 - 1 Purnapani6 5 1 4 3 1 - - - 4 3 1 Karamukha
169 96 73 41 25 16 4 3 1 25 11 14 Takwa71 55 16 366 177 189 2 1 1 7 5 2 Asanbera3 - 3 1 1 - - - - 10 2 8 Gondlipani
18 17 1 3 3 - 3 3 - 2 1 1 Katasaru128 62 66 10 5 5 2 - 2 7 5 2 Sirupardhiya52 52 - 14 14 - - - - 6 3 3 Lailonga1 1 - 2 2 - 3 1 2 5 3 2 Bhundupani
127 112 15 17 13 4 27 17 10 12 8 4 Kurushkela147 78 69 6 2 4 5 3 2 47 34 13 Serlonga
4 4 - 22 12 10 - - - - - - Ghaghra324 173 151 24 16 8 39 23 16 39 24 15 Bhelwadih240 208 32 81 49 32 6 6 - 50 33 17 Kewanddih448 335 113 49 36 13 2 2 - 34 18 16 Koleang549 363 186 17 9 8 99 50 49 42 25 17 Pakardanr167 151 16 37 34 3 80 41 39 42 17 25 Nanesera73 73 - 3 3 - 5 5 - 22 15 7 Palidih
173 169 4 57 39 18 5 5 - 48 36 12 Sarkhutoli29 21 8 5 5 - - - - 1 - 1 Masekera
230 165 65 12 6 6 - - - 1 1 - Dumardih915 636 279 154 110 44 39 27 12 152 124 28 Sikariyadanr50 49 1 17 16 1 8 8 - 11 7 4 Pahargurda17 8 9 127 62 65 5 2 3 7 3 4 Khanjaloya
470 366 104 143 94 49 65 46 19 51 33 18 Sogra
CultivatorsName of Village
Household industry workersAgricultural labourers
Industrial category of main workers
Other workers
69

DISTRICT CENSUS HANDBOOK : SIMDEGA
VILLAGE PRIMARYC D Block -
Persons Males Females Persons Males Females Persons Males Females1 2 41 42 43 44 45 46 47 48 49
0225 Pakar Tanr (Total) 9,527 3,817 5,710 3,784 1,702 2,082 5,342 1,885 3,457 0225 Pakar Tanr (Rural) 9,527 3,817 5,710 3,784 1,702 2,082 5,342 1,885 3,457 0225 Pakar Tanr (Urban) - - - - - - - - -
RURAL376457 Kinbira 512 169 343 370 126 244 128 37 91 376458 Kairbera 653 160 493 197 82 115 443 68 375 376459 Rengapani 37 12 25 20 10 10 17 2 15 376460 Hardibera 313 156 157 7 4 3 305 151 154 376461 Kesalpur 523 141 382 305 67 238 209 69 140 376462 Basatpur 16 12 4 12 9 3 2 2 - 376463 Purnapani 112 105 7 110 104 6 2 1 1 376464 Karamukha 278 133 145 44 23 21 233 109 124 376465 Takwa 272 129 143 73 29 44 198 100 98 376466 Asanbera 404 193 211 118 88 30 277 102 175 376467 Gondlipani 436 220 216 154 109 45 275 107 168 376468 Katasaru 119 96 23 82 68 14 23 17 6 376469 Sirupardhiya 6 2 4 3 - 3 - - - 376470 Lailonga 228 71 157 22 14 8 205 57 148 376471 Bhundupani 213 103 110 41 23 18 168 77 91 376472 Kurushkela 705 286 419 518 216 302 118 37 81 376473 Serlonga 9 8 1 2 1 1 - - - 376474 Ghaghra 300 146 154 49 25 24 250 120 130 376475 Bhelwadih 160 93 67 47 21 26 43 33 10 376476 Kewanddih 628 243 385 342 95 247 264 135 129 376477 Koleang 479 161 318 214 85 129 243 57 186 376478 Pakardanr 589 346 243 215 185 30 344 142 202 376479 Nanesera 313 65 248 35 11 24 270 51 219 376480 Palidih 314 107 207 214 62 152 97 44 53 376481 Sarkhutoli 353 87 266 213 70 143 133 13 120 376482 Masekera 78 33 45 10 6 4 68 27 41 376483 Dumardih 187 40 147 77 5 72 110 35 75 376484 Sikariyadanr 614 198 416 132 43 89 447 132 315 376485 Pahargurda 203 69 134 12 9 3 190 60 130 376486 Khanjaloya 198 131 67 103 93 10 81 31 50 376487 Sogra 275 102 173 43 19 24 199 69 130
Location code
number Name of VillageMarginal workers Cultivators Agricultural labourers
Industrial category
70

PRIMARY CENSUS ABSTRACT
CENSUS ABSTRACTPakar Tanr
Persons Males Females Persons Males Females Persons Males Females50 51 52 53 54 55 56 57 58 2 1
142 66 76 259 164 95 19,522 9,187 10,335 Pakar Tanr (Total) 0225142 66 76 259 164 95 19,522 9,187 10,335 Pakar Tanr (Rural) 0225- - - - - - - - - Pakar Tanr (Urban) 0225
RURAL7 3 4 7 3 4 895 389 506 Kinbira 3764579 6 3 4 4 - 864 446 418 Kairbera 376458
- - - - - - 201 121 80 Rengapani 3764591 1 - - - - 220 122 98 Hardibera 3764603 2 1 6 3 3 993 500 493 Kesalpur 376461
- - - 2 1 1 600 196 404 Basatpur 376462- - - - - - 328 117 211 Purnapani 376463- - - 1 1 - 204 100 104 Karamukha 376464- - - 1 - 1 425 216 209 Takwa 376465
2 2 - 7 1 6 525 289 236 Asanbera 3764664 2 2 3 2 1 390 194 196 Gondlipani 3764674 4 - 10 7 3 295 97 198 Katasaru 376468
- - - 3 2 1 161 76 85 Sirupardhiya 376469- - - 1 - 1 294 144 150 Lailonga 376470
1 1 - 3 2 1 265 127 138 Bhundupani 37647139 12 27 30 21 9 762 379 383 Kurushkela 376472
- - - 7 7 - 328 146 182 Serlonga 376473- - - 1 1 - 301 175 126 Ghaghra 37647425 15 10 45 24 21 650 311 339 Bhelwadih 3764753 1 2 19 12 7 993 509 484 Kewanddih 3764762 1 1 20 18 2 1,003 537 466 Koleang 376477
11 6 5 19 13 6 1,802 783 1,019 Pakardanr 3764781 - 1 7 3 4 697 371 326 Nanesera 376479
- - - 3 1 2 390 188 202 Palidih 3764802 - 2 5 4 1 505 243 262 Sarkhutoli 376481
- - - - - - 97 48 49 Masekera 376482- - - - - - 365 173 192 Dumardih 37648318 8 10 17 15 2 2,498 1,106 1,392 Sikariyadanr 3764841 - 1 - - - 159 86 73 Pahargurda 3764851 - 1 13 7 6 529 236 293 Khanjaloya 3764868 2 6 25 12 13 1,783 762 1,021 Sogra 376487
Non-workers
of marginal workersLocation
code number
Household industry workersName of Village
Other workers
71

DISTRICT CENSUS HANDBOOK : SIMDEGA
VILLAGE PRIMARY
Persons Males Females Persons Males Females1 2 3 4 5 6 7 8 9 10
0226 Kurdeg (Total) 27,484.35 9,847 47,984 23,881 24,103 7,281 3,680 3,601 0226 Kurdeg (Rural) 27,484.35 9,847 47,984 23,881 24,103 7,281 3,680 3,601 0226 Kurdeg (Urban) 0.00 - - - - - - -
RURAL376488 Gariajor 1,995.39 763 3,667 1,858 1,809 551 295 256 376489 Barkibiura 2,677.00 1,108 4,944 2,459 2,485 723 361 362 376490 Kokrachhera 1,040.59 270 1,170 567 603 172 91 81 376491 Kutua Kachhar 1,653.00 612 2,778 1,340 1,438 406 192 214 376492 Patrapali 269.38 132 623 331 292 79 42 37 376493 Dumardih 1,212.85 527 2,604 1,258 1,346 401 182 219 376494 Gatadih 246.00 130 604 284 320 89 47 42 376495 Daridih 1,104.00 199 950 457 493 142 69 73 376496 Labdera 975.00 387 1,820 906 914 251 131 120 376497 Chhotkibiura 282.01 196 948 456 492 150 78 72 376498 Jhirkamunda 72.00 255 1,106 566 540 164 79 85 376499 Kurdeg 557.00 300 1,629 805 824 252 127 125 376500 Parkala 531.60 311 1,470 737 733 250 135 115 376501 Khinda 2,832.36 820 4,000 1,958 2,042 584 285 299 376502 Jhunka Chhapar 428.96 155 857 431 426 100 53 47 376503 Dhorhi 1,290.00 309 1,452 713 739 273 135 138 376504 Hethma 3,671.00 1,115 5,722 2,907 2,815 954 503 451 376505 Sarabmunda 537.84 156 891 451 440 118 54 64 376506 Khalijor 507.43 285 1,599 822 777 241 129 112 376507 Chhatakahu 626.00 165 947 479 468 150 73 77 376508 Litimara 616.64 182 991 491 500 123 55 68 376509 Kasdega 613.00 319 1,573 790 783 227 122 105 376510 Charrimunda 1,377.37 401 2,002 1,029 973 295 158 137 376511 Bangaon 1,305.83 387 1,841 899 942 266 131 135 376512 Rengarbahar 1,062.10 363 1,796 887 909 320 153 167
C D Block -
Population in the age-group 0-6Name of Village
Location code
number
Total population (including institutional and houseless
population)Area of
Village in hectares
Number of households
72

PRIMARY CENSUS ABSTRACT
CENSUS ABSTRACTKurdeg
Persons Males Females Persons Males Females Persons Males Females11 12 13 14 15 16 17 18 19 2
3,201 1,605 1,596 34,707 17,196 17,511 27,484 15,334 12,150 Kurdeg (Total)3,201 1,605 1,596 34,707 17,196 17,511 27,484 15,334 12,150 Kurdeg (Rural)
- - - - - - - - - Kurdeg (Urban)RURAL
258 119 139 2,420 1,238 1,182 1,955 1,103 852 Gariajor705 366 339 3,515 1,720 1,795 2,717 1,570 1,147 Barkibiura81 40 41 653 311 342 604 348 256 Kokrachhera91 45 46 2,046 974 1,072 1,568 855 713 Kutua Kachhar32 13 19 389 211 178 403 242 161 Patrapali
288 152 136 1,966 940 1,026 1,373 748 625 Dumardih27 13 14 352 165 187 323 169 154 Gatadih
- - - 859 418 441 547 309 238 Daridih136 65 71 911 454 457 1,057 592 465 Labdera31 15 16 334 165 169 558 288 270 Chhotkibiura16 5 11 142 69 73 804 438 366 Jhirkamunda62 33 29 1,171 577 594 952 530 422 Kurdeg29 17 12 967 468 499 995 518 477 Parkala40 20 20 3,760 1,833 1,927 2,484 1,337 1,147 Khinda
- - - 771 382 389 555 305 250 Jhunka Chhapar52 26 26 1,013 494 519 715 395 320 Dhorhi
129 69 60 5,309 2,690 2,619 3,385 1,937 1,448 Hethma- - - 836 418 418 589 309 280 Sarabmunda71 34 37 1,325 675 650 976 532 444 Khalijor7 3 4 762 387 375 570 319 251 Chhatakahu2 1 1 493 238 255 489 277 212 Litimara
460 242 218 641 311 330 849 499 350 Kasdega343 163 180 1,389 727 662 1,148 655 493 Charrimunda171 79 92 1,326 658 668 1,020 577 443 Bangaon170 85 85 1,357 673 684 848 482 366 Rengarbahar
Scheduled Castes population Scheduled Tribes populationName of Village
Literates
73

DISTRICT CENSUS HANDBOOK : SIMDEGA
VILLAGE PRIMARYC D Block -
Persons Males Females Persons Males Females Persons Males Females1 2 20 21 22 23 24 25 26 27 28
0226 Kurdeg (Total) 20,500 8,547 11,953 23,401 12,992 10,409 10,257 7,273 2,984 0226 Kurdeg (Rural) 20,500 8,547 11,953 23,401 12,992 10,409 10,257 7,273 2,984 0226 Kurdeg (Urban) - - - - - - - - -
RURAL376488 Gariajor 1,712 755 957 1,977 1,056 921 737 484 253 376489 Barkibiura 2,227 889 1,338 2,591 1,361 1,230 964 681 283 376490 Kokrachhera 566 219 347 627 291 336 198 164 34 376491 Kutua Kachhar 1,210 485 725 1,201 726 475 1,072 668 404 376492 Patrapali 220 89 131 199 181 18 189 174 15 376493 Dumardih 1,231 510 721 907 648 259 790 590 200 376494 Gatadih 281 115 166 309 151 158 43 37 6 376495 Daridih 403 148 255 448 250 198 161 117 44 376496 Labdera 763 314 449 710 438 272 353 247 106 376497 Chhotkibiura 390 168 222 328 231 97 266 187 79 376498 Jhirkamunda 302 128 174 454 308 146 369 264 105 376499 Kurdeg 677 275 402 734 366 368 170 133 37 376500 Parkala 475 219 256 670 361 309 293 196 97 376501 Khinda 1,516 621 895 2,294 1,165 1,129 756 604 152 376502 Jhunka Chhapar 302 126 176 596 299 297 76 69 7 376503 Dhorhi 737 318 419 787 387 400 412 247 165 376504 Hethma 2,337 970 1,367 2,495 1,484 1,011 1,323 900 423 376505 Sarabmunda 302 142 160 344 210 134 214 184 30 376506 Khalijor 623 290 333 860 445 415 631 369 262 376507 Chhatakahu 377 160 217 524 281 243 186 170 16 376508 Litimara 502 214 288 483 240 243 210 196 14 376509 Kasdega 724 291 433 650 432 218 109 89 20 376510 Charrimunda 854 374 480 1,131 631 500 119 92 27 376511 Bangaon 821 322 499 1,122 548 574 211 189 22 376512 Rengarbahar 948 405 543 960 502 458 405 222 183
Illiterates Total workers Main workersName of Village
Location code
number
74

PRIMARY CENSUS ABSTRACT
CENSUS ABSTRACTKurdeg
Persons Males Females Persons Males Females PersonsMalesFemales Persons Males Females29 30 31 32 33 34 35 36 37 38 39 40 2
4,475 3,391 1,084 4,007 2,655 1,352 324 230 94 1,451 997 454 Kurdeg (Total)4,475 3,391 1,084 4,007 2,655 1,352 324 230 94 1,451 997 454 Kurdeg (Rural)
- - - - - - - - - - - - Kurdeg (Urban)RURAL
481 346 135 195 103 92 31 17 14 30 18 12 Gariajor619 441 178 157 112 45 57 39 18 131 89 42 Barkibiura139 119 20 48 39 9 1 1 - 10 5 5 Kokrachhera238 178 60 743 430 313 26 17 9 65 43 22 Kutua Kachhar70 70 - 93 83 10 11 9 2 15 12 3 Patrapali
318 189 129 388 347 41 21 21 - 63 33 30 Dumardih24 23 1 16 12 4 - - - 3 2 1 Gatadih30 19 11 114 88 26 - - - 17 10 7 Daridih
187 132 55 113 77 36 16 11 5 37 27 10 Labdera22 22 - 34 27 7 7 4 3 203 134 69 Chhotkibiura77 32 45 46 27 19 28 17 11 218 188 30 Jhirkamunda46 29 17 40 28 12 5 4 1 79 72 7 Kurdeg85 58 27 19 14 5 18 11 7 171 113 58 Parkala
289 231 58 384 317 67 26 22 4 57 34 23 Khinda57 56 1 15 10 5 3 3 - 1 - 1 Jhunka Chhapar
121 90 31 265 142 123 7 4 3 19 11 8 Dhorhi830 684 146 364 139 225 29 21 8 100 56 44 Hethma11 10 1 177 156 21 6 5 1 20 13 7 Sarabmunda
228 127 101 342 211 131 14 9 5 47 22 25 Khalijor131 123 8 22 18 4 2 1 1 31 28 3 Chhatakahu128 125 3 70 65 5 2 2 - 10 4 6 Litimara
9 9 - 24 24 - 5 5 - 71 51 20 Kasdega70 62 8 25 17 8 1 1 - 23 12 11 Charrimunda
169 157 12 20 15 5 5 3 2 17 14 3 Bangaon96 59 37 293 154 139 3 3 - 13 6 7 Rengarbahar
CultivatorsName of Village
Household industry workersAgricultural labourers
Industrial category of main workers
Other workers
75
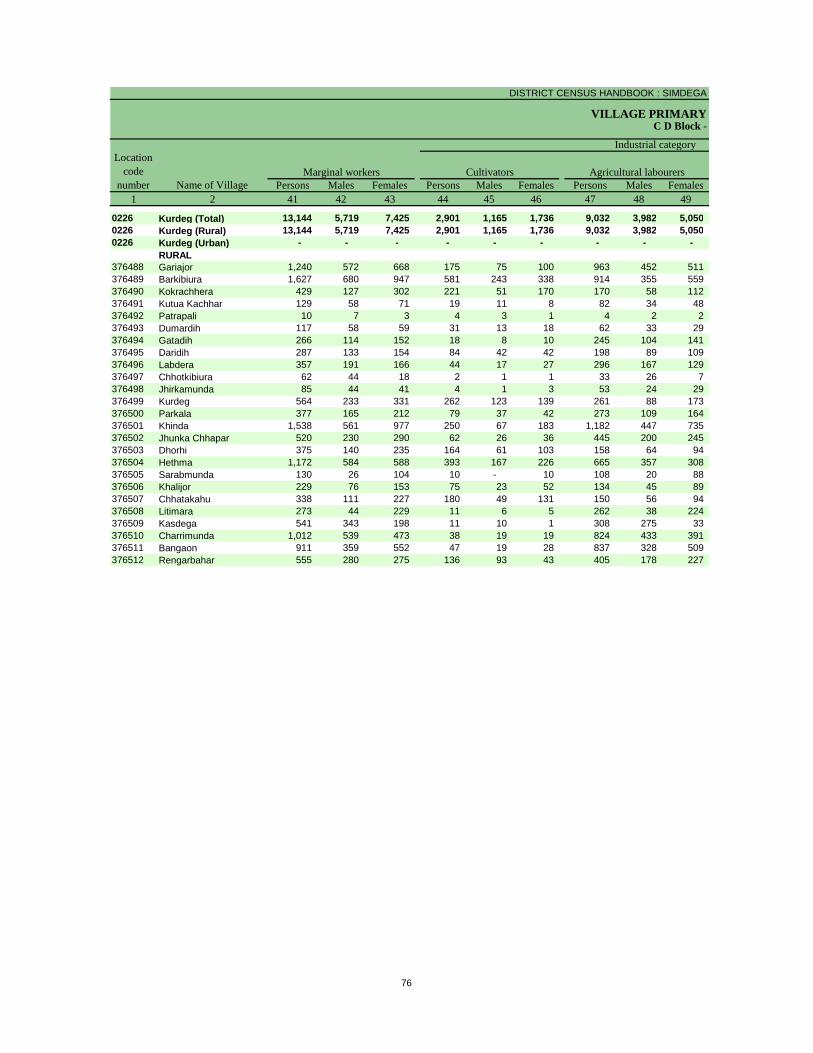
DISTRICT CENSUS HANDBOOK : SIMDEGA
VILLAGE PRIMARYC D Block -
Persons Males Females Persons Males Females Persons Males Females1 2 41 42 43 44 45 46 47 48 49
0226 Kurdeg (Total) 13,144 5,719 7,425 2,901 1,165 1,736 9,032 3,982 5,050 0226 Kurdeg (Rural) 13,144 5,719 7,425 2,901 1,165 1,736 9,032 3,982 5,050 0226 Kurdeg (Urban) - - - - - - - - -
RURAL376488 Gariajor 1,240 572 668 175 75 100 963 452 511 376489 Barkibiura 1,627 680 947 581 243 338 914 355 559 376490 Kokrachhera 429 127 302 221 51 170 170 58 112 376491 Kutua Kachhar 129 58 71 19 11 8 82 34 48 376492 Patrapali 10 7 3 4 3 1 4 2 2 376493 Dumardih 117 58 59 31 13 18 62 33 29 376494 Gatadih 266 114 152 18 8 10 245 104 141 376495 Daridih 287 133 154 84 42 42 198 89 109 376496 Labdera 357 191 166 44 17 27 296 167 129 376497 Chhotkibiura 62 44 18 2 1 1 33 26 7 376498 Jhirkamunda 85 44 41 4 1 3 53 24 29 376499 Kurdeg 564 233 331 262 123 139 261 88 173 376500 Parkala 377 165 212 79 37 42 273 109 164 376501 Khinda 1,538 561 977 250 67 183 1,182 447 735 376502 Jhunka Chhapar 520 230 290 62 26 36 445 200 245 376503 Dhorhi 375 140 235 164 61 103 158 64 94 376504 Hethma 1,172 584 588 393 167 226 665 357 308 376505 Sarabmunda 130 26 104 10 - 10 108 20 88 376506 Khalijor 229 76 153 75 23 52 134 45 89 376507 Chhatakahu 338 111 227 180 49 131 150 56 94 376508 Litimara 273 44 229 11 6 5 262 38 224 376509 Kasdega 541 343 198 11 10 1 308 275 33 376510 Charrimunda 1,012 539 473 38 19 19 824 433 391 376511 Bangaon 911 359 552 47 19 28 837 328 509 376512 Rengarbahar 555 280 275 136 93 43 405 178 227
Location code
number Name of VillageMarginal workers Cultivators Agricultural labourers
Industrial category
76

PRIMARY CENSUS ABSTRACT
CENSUS ABSTRACTKurdeg
Persons Males Females Persons Males Females Persons Males Females50 51 52 53 54 55 56 57 58 2 1
334 164 170 877 408 469 24,583 10,889 13,694 Kurdeg (Total) 0226334 164 170 877 408 469 24,583 10,889 13,694 Kurdeg (Rural) 0226- - - - - - - - - Kurdeg (Urban) 0226
RURAL65 30 35 37 15 22 1,690 802 888 Gariajor 37648850 27 23 82 55 27 2,353 1,098 1,255 Barkibiura 37648931 15 16 7 3 4 543 276 267 Kokrachhera 3764904 3 1 24 10 14 1,577 614 963 Kutua Kachhar 376491
- - - 2 2 - 424 150 274 Patrapali 3764922 2 - 22 10 12 1,697 610 1,087 Dumardih 3764932 1 1 1 1 - 295 133 162 Gatadih 3764941 - 1 4 2 2 502 207 295 Daridih 3764958 3 5 9 4 5 1,110 468 642 Labdera 3764961 1 - 26 16 10 620 225 395 Chhotkibiura 3764971 1 - 27 18 9 652 258 394 Jhirkamunda 3764984 2 2 37 20 17 895 439 456 Kurdeg 3764996 5 1 19 14 5 800 376 424 Parkala 376500
39 6 33 67 41 26 1,706 793 913 Khinda 37650110 4 6 3 - 3 261 132 129 Jhunka Chhapar 37650210 5 5 43 10 33 665 326 339 Dhorhi 37650315 9 6 99 51 48 3,227 1,423 1,804 Hethma 3765041 1 - 11 5 6 547 241 306 Sarabmunda 376505
- - - 20 8 12 739 377 362 Khalijor 376506- - - 8 6 2 423 198 225 Chhatakahu 376507- - - - - - 508 251 257 Litimara 37650818 11 7 204 47 157 923 358 565 Kasdega 37650954 33 21 96 54 42 871 398 473 Charrimunda 37651011 4 7 16 8 8 719 351 368 Bangaon 3765111 1 - 13 8 5 836 385 451 Rengarbahar 376512
Non-workers
of marginal workersLocation
code number
Household industry workersName of Village
Other workers
77

DISTRICT CENSUS HANDBOOK : SIMDEGA
VILLAGE PRIMARY
Persons Males Females Persons Males Females1 2 3 4 5 6 7 8 9 10
0227 Kersai (Total) 23,697.00 7,580 39,218 19,582 19,636 6,185 3,127 3,058 0227 Kersai (Rural) 23,697.00 7,580 39,218 19,582 19,636 6,185 3,127 3,058 0227 Kersai (Urban) 0.00 - - - - - - -
RURAL376513 Betma 1,200.00 152 788 391 397 122 53 69 376514 Karaigura 607.00 263 1,302 631 671 215 102 113 376515 Kinkel 1,903.00 756 3,833 1,899 1,934 591 305 286 376516 Basan 1,082.00 445 2,266 1,150 1,116 357 189 168 376517 Ghujhariya 285.00 161 827 416 411 151 74 77 376518 Karangaguri 720.00 250 1,411 697 714 190 76 114 376519 Karuarjor 1,568.00 474 2,497 1,237 1,260 454 238 216 376520 Raibera 418.00 147 962 464 498 130 73 57 376521 Karrajhariya 202.00 48 278 137 141 54 31 23 376522 Bagdega 1,860.00 631 3,335 1,703 1,632 511 276 235 376523 Gorairjor 547.00 206 934 472 462 138 72 66 376524 Korkotjor 614.00 176 882 444 438 119 63 56 376525 Kanjoba 1,713.00 530 2,801 1,397 1,404 453 219 234 376526 Karamtoli 417.00 212 1,099 544 555 174 103 71 376527 Kersai 1,398.00 782 4,003 2,052 1,951 613 312 301
376528Karamtoli Alias Mahuatoli 655.00 184 972 507 465 166 86 80
376529 Pakartoli 516.00 173 938 452 486 131 62 69 376530 Konskeli 407.00 202 1,190 605 585 156 77 79 376531 Kusumdegi 150.00376532 Paharsara 853.00 258 1,326 669 657 208 109 99 376533 Taisar 6,582.00 1,530 7,574 3,715 3,859 1,252 607 645
-------------Un-inhabited--------------
C D Block -
Population in the age-group 0-6Name of Village
Location code
number
Total population (including institutional and houseless
population)Area of
Village in hectares
Number of households
78
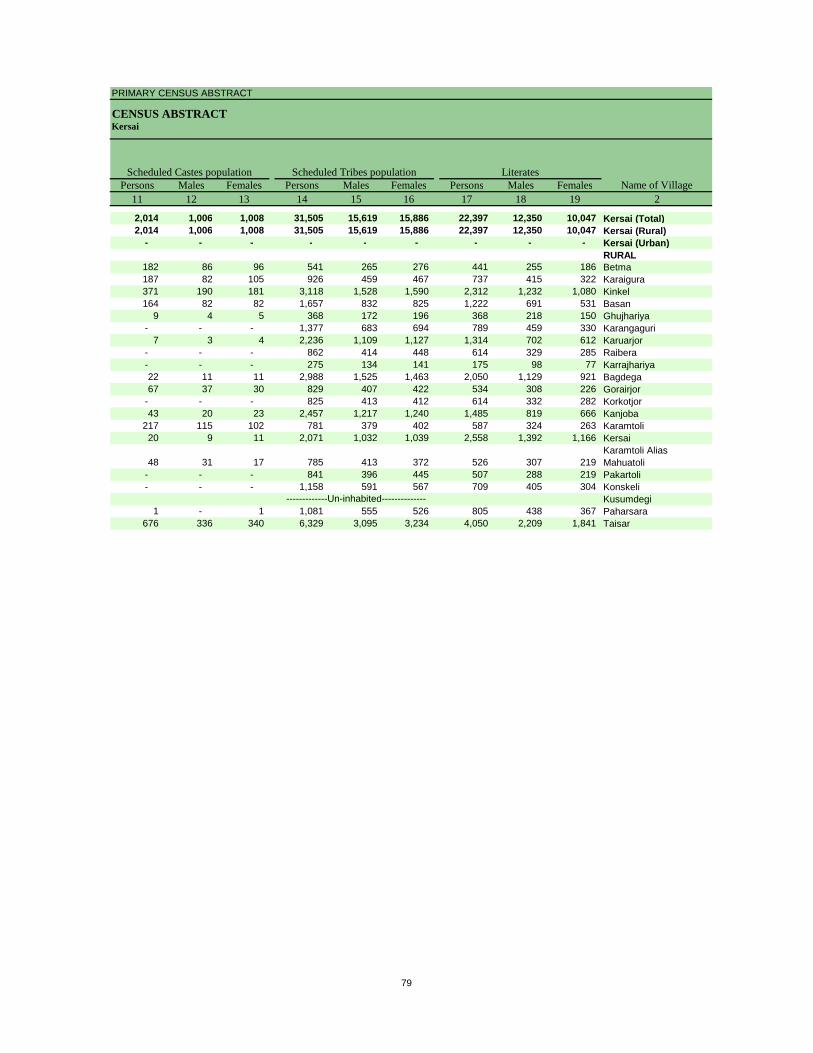
PRIMARY CENSUS ABSTRACT
CENSUS ABSTRACTKersai
Persons Males Females Persons Males Females Persons Males Females11 12 13 14 15 16 17 18 19 2
2,014 1,006 1,008 31,505 15,619 15,886 22,397 12,350 10,047 Kersai (Total)2,014 1,006 1,008 31,505 15,619 15,886 22,397 12,350 10,047 Kersai (Rural)
- - - - - - - - - Kersai (Urban)RURAL
182 86 96 541 265 276 441 255 186 Betma187 82 105 926 459 467 737 415 322 Karaigura371 190 181 3,118 1,528 1,590 2,312 1,232 1,080 Kinkel164 82 82 1,657 832 825 1,222 691 531 Basan
9 4 5 368 172 196 368 218 150 Ghujhariya- - - 1,377 683 694 789 459 330 Karangaguri
7 3 4 2,236 1,109 1,127 1,314 702 612 Karuarjor- - - 862 414 448 614 329 285 Raibera- - - 275 134 141 175 98 77 Karrajhariya22 11 11 2,988 1,525 1,463 2,050 1,129 921 Bagdega67 37 30 829 407 422 534 308 226 Gorairjor
- - - 825 413 412 614 332 282 Korkotjor43 20 23 2,457 1,217 1,240 1,485 819 666 Kanjoba
217 115 102 781 379 402 587 324 263 Karamtoli20 9 11 2,071 1,032 1,039 2,558 1,392 1,166 Kersai
48 31 17 785 413 372 526 307 219 Karamtoli Alias Mahuatoli
- - - 841 396 445 507 288 219 Pakartoli- - - 1,158 591 567 709 405 304 Konskeli
Kusumdegi1 - 1 1,081 555 526 805 438 367 Paharsara
676 336 340 6,329 3,095 3,234 4,050 2,209 1,841 Taisar
-------------Un-inhabited--------------
Scheduled Castes population Scheduled Tribes populationName of Village
Literates
79

DISTRICT CENSUS HANDBOOK : SIMDEGA
VILLAGE PRIMARYC D Block -
Persons Males Females Persons Males Females Persons Males Females1 2 20 21 22 23 24 25 26 27 28
0227 Kersai (Total) 16,821 7,232 9,589 18,012 9,810 8,202 8,929 6,610 2,319 0227 Kersai (Rural) 16,821 7,232 9,589 18,012 9,810 8,202 8,929 6,610 2,319 0227 Kersai (Urban) - - - - - - - - -
RURAL376513 Betma 347 136 211 441 220 221 14 11 3 376514 Karaigura 565 216 349 633 330 303 341 288 53 376515 Kinkel 1,521 667 854 1,894 915 979 760 492 268 376516 Basan 1,044 459 585 947 582 365 347 242 105 376517 Ghujhariya 459 198 261 417 210 207 247 144 103 376518 Karangaguri 622 238 384 427 269 158 398 249 149 376519 Karuarjor 1,183 535 648 1,191 662 529 405 373 32 376520 Raibera 348 135 213 508 246 262 209 200 9 376521 Karrajhariya 103 39 64 107 53 54 4 3 1 376522 Bagdega 1,285 574 711 1,823 936 887 715 556 159 376523 Gorairjor 400 164 236 493 247 246 140 124 16 376524 Korkotjor 268 112 156 454 235 219 185 154 31 376525 Kanjoba 1,316 578 738 1,315 730 585 866 649 217 376526 Karamtoli 512 220 292 454 237 217 193 158 35 376527 Kersai 1,445 660 785 1,518 971 547 1,140 781 359
376528Karamtoli Alias Mahuatoli 446 200 246 478 252 226 226 217 9
376529 Pakartoli 431 164 267 324 154 170 250 123 127 376530 Konskeli 481 200 281 584 318 266 114 107 7 376531 Kusumdegi376532 Paharsara 521 231 290 687 354 333 399 291 108 376533 Taisar 3,524 1,506 2,018 3,317 1,889 1,428 1,976 1,448 528
-------------Un-inhabited--------------
Illiterates Total workers Main workersName of Village
Location code
number
80
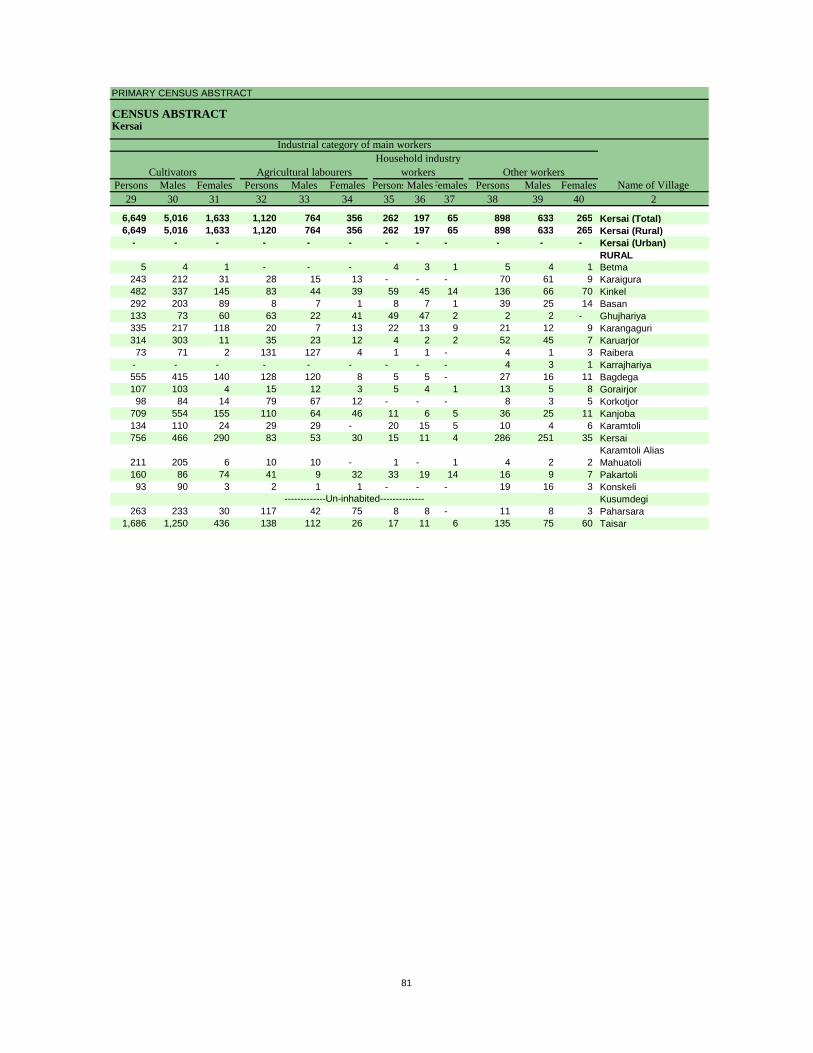
PRIMARY CENSUS ABSTRACT
CENSUS ABSTRACTKersai
Persons Males Females Persons Males Females PersonsMalesFemales Persons Males Females29 30 31 32 33 34 35 36 37 38 39 40 2
6,649 5,016 1,633 1,120 764 356 262 197 65 898 633 265 Kersai (Total)6,649 5,016 1,633 1,120 764 356 262 197 65 898 633 265 Kersai (Rural)
- - - - - - - - - - - - Kersai (Urban)RURAL
5 4 1 - - - 4 3 1 5 4 1 Betma243 212 31 28 15 13 - - - 70 61 9 Karaigura482 337 145 83 44 39 59 45 14 136 66 70 Kinkel292 203 89 8 7 1 8 7 1 39 25 14 Basan133 73 60 63 22 41 49 47 2 2 2 - Ghujhariya335 217 118 20 7 13 22 13 9 21 12 9 Karangaguri314 303 11 35 23 12 4 2 2 52 45 7 Karuarjor73 71 2 131 127 4 1 1 - 4 1 3 Raibera
- - - - - - - - - 4 3 1 Karrajhariya555 415 140 128 120 8 5 5 - 27 16 11 Bagdega107 103 4 15 12 3 5 4 1 13 5 8 Gorairjor98 84 14 79 67 12 - - - 8 3 5 Korkotjor
709 554 155 110 64 46 11 6 5 36 25 11 Kanjoba134 110 24 29 29 - 20 15 5 10 4 6 Karamtoli756 466 290 83 53 30 15 11 4 286 251 35 Kersai
211 205 6 10 10 - 1 - 1 4 2 2 Karamtoli Alias Mahuatoli
160 86 74 41 9 32 33 19 14 16 9 7 Pakartoli93 90 3 2 1 1 - - - 19 16 3 Konskeli
Kusumdegi263 233 30 117 42 75 8 8 - 11 8 3 Paharsara
1,686 1,250 436 138 112 26 17 11 6 135 75 60 Taisar
-------------Un-inhabited--------------
CultivatorsName of Village
Household industry workersAgricultural labourers
Industrial category of main workers
Other workers
81

DISTRICT CENSUS HANDBOOK : SIMDEGA
VILLAGE PRIMARYC D Block -
Persons Males Females Persons Males Females Persons Males Females1 2 41 42 43 44 45 46 47 48 49
0227 Kersai (Total) 9,083 3,200 5,883 4,152 1,386 2,766 4,370 1,527 2,843 0227 Kersai (Rural) 9,083 3,200 5,883 4,152 1,386 2,766 4,370 1,527 2,843 0227 Kersai (Urban) - - - - - - - - -
RURAL376513 Betma 427 209 218 405 195 210 16 8 8 376514 Karaigura 292 42 250 219 19 200 49 13 36 376515 Kinkel 1,134 423 711 532 191 341 511 199 312 376516 Basan 600 340 260 113 83 30 471 242 229 376517 Ghujhariya 170 66 104 10 7 3 155 59 96 376518 Karangaguri 29 20 9 21 15 6 - - - 376519 Karuarjor 786 289 497 460 138 322 301 133 168 376520 Raibera 299 46 253 101 16 85 192 29 163 376521 Karrajhariya 103 50 53 - - - 102 49 53 376522 Bagdega 1,108 380 728 511 169 342 555 194 361 376523 Gorairjor 353 123 230 269 85 184 52 21 31 376524 Korkotjor 269 81 188 87 24 63 175 54 121 376525 Kanjoba 449 81 368 143 42 101 282 31 251 376526 Karamtoli 261 79 182 138 32 106 79 27 52 376527 Kersai 378 190 188 199 102 97 85 25 60
376528Karamtoli Alias Mahuatoli 252 35 217 191 25 166 52 4 48
376529 Pakartoli 74 31 43 16 14 2 33 4 29 376530 Konskeli 470 211 259 246 82 164 221 126 95 376531 Kusumdegi376532 Paharsara 288 63 225 107 23 84 163 32 131 376533 Taisar 1,341 441 900 384 124 260 876 277 599
-------------Un-inhabited--------------
Location code
number Name of VillageMarginal workers Cultivators Agricultural labourers
Industrial category
82

PRIMARY CENSUS ABSTRACT
CENSUS ABSTRACTKersai
Persons Males Females Persons Males Females Persons Males Females50 51 52 53 54 55 56 57 58 2 1
151 70 81 410 217 193 21,206 9,772 11,434 Kersai (Total) 0227151 70 81 410 217 193 21,206 9,772 11,434 Kersai (Rural) 0227- - - - - - - - - Kersai (Urban) 0227
RURAL- - - 6 6 - 347 171 176 Betma 376513
3 3 - 21 7 14 669 301 368 Karaigura 37651413 5 8 78 28 50 1,939 984 955 Kinkel 3765152 2 - 14 13 1 1,319 568 751 Basan 3765162 - 2 3 - 3 410 206 204 Ghujhariya 376517
- - - 8 5 3 984 428 556 Karangaguri 3765181 - 1 24 18 6 1,306 575 731 Karuarjor 3765191 - 1 5 1 4 454 218 236 Raibera 376520
- - - 1 1 - 171 84 87 Karrajhariya 37652120 7 13 22 10 12 1,512 767 745 Bagdega 37652225 13 12 7 4 3 441 225 216 Gorairjor 376523
- - - 7 3 4 428 209 219 Korkotjor 3765244 2 2 20 6 14 1,486 667 819 Kanjoba 376525
35 14 21 9 6 3 645 307 338 Karamtoli 37652611 9 2 83 54 29 2,485 1,081 1,404 Kersai 376527
1 1 - 8 5 3 494 255 239 Karamtoli Alias Mahuatoli 376528
11 2 9 14 11 3 614 298 316 Pakartoli 376529- - - 3 3 - 606 287 319 Konskeli 376530
Kusumdegi 3765318 2 6 10 6 4 639 315 324 Paharsara 376532
14 10 4 67 30 37 4,257 1,826 2,431 Taisar 376533
-------------Un-inhabited--------------
Non-workers
of marginal workersLocation
code number
Household industry workersName of Village
Other workers
83
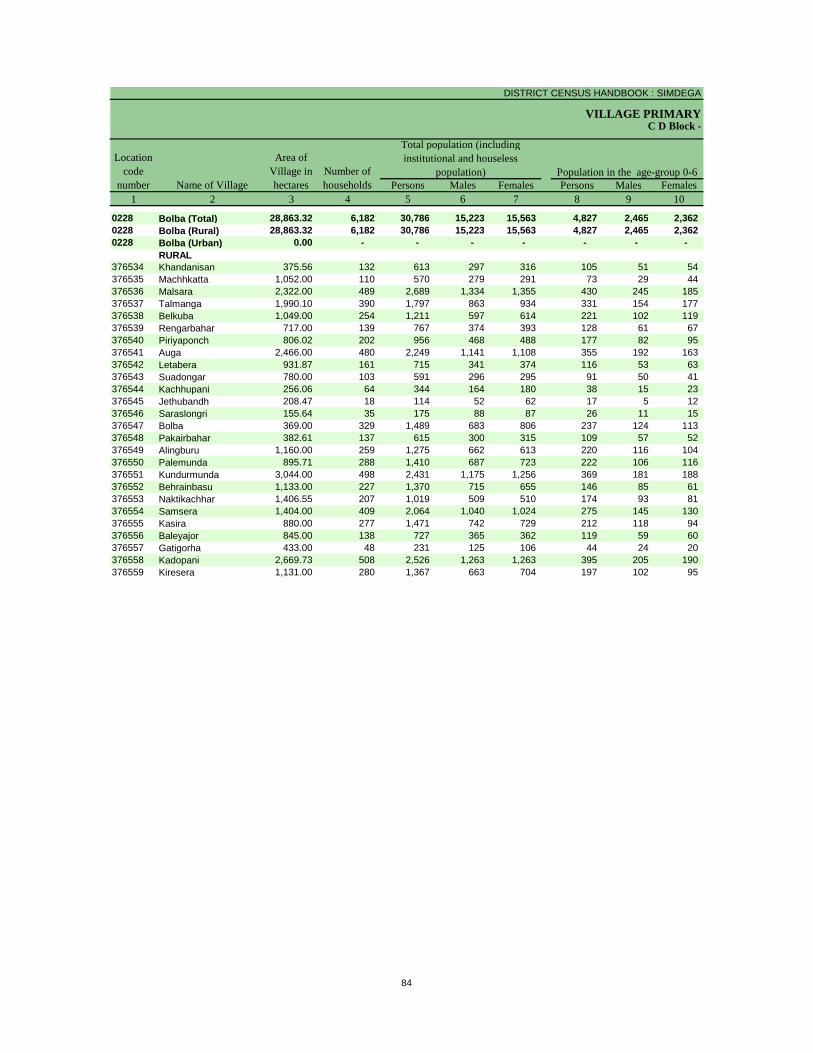
DISTRICT CENSUS HANDBOOK : SIMDEGA
VILLAGE PRIMARY
Persons Males Females Persons Males Females1 2 3 4 5 6 7 8 9 10
0228 Bolba (Total) 28,863.32 6,182 30,786 15,223 15,563 4,827 2,465 2,362 0228 Bolba (Rural) 28,863.32 6,182 30,786 15,223 15,563 4,827 2,465 2,362 0228 Bolba (Urban) 0.00 - - - - - - -
RURAL376534 Khandanisan 375.56 132 613 297 316 105 51 54 376535 Machhkatta 1,052.00 110 570 279 291 73 29 44 376536 Malsara 2,322.00 489 2,689 1,334 1,355 430 245 185 376537 Talmanga 1,990.10 390 1,797 863 934 331 154 177 376538 Belkuba 1,049.00 254 1,211 597 614 221 102 119 376539 Rengarbahar 717.00 139 767 374 393 128 61 67 376540 Piriyaponch 806.02 202 956 468 488 177 82 95 376541 Auga 2,466.00 480 2,249 1,141 1,108 355 192 163 376542 Letabera 931.87 161 715 341 374 116 53 63 376543 Suadongar 780.00 103 591 296 295 91 50 41 376544 Kachhupani 256.06 64 344 164 180 38 15 23 376545 Jethubandh 208.47 18 114 52 62 17 5 12 376546 Saraslongri 155.64 35 175 88 87 26 11 15 376547 Bolba 369.00 329 1,489 683 806 237 124 113 376548 Pakairbahar 382.61 137 615 300 315 109 57 52 376549 Alingburu 1,160.00 259 1,275 662 613 220 116 104 376550 Palemunda 895.71 288 1,410 687 723 222 106 116 376551 Kundurmunda 3,044.00 498 2,431 1,175 1,256 369 181 188 376552 Behrainbasu 1,133.00 227 1,370 715 655 146 85 61 376553 Naktikachhar 1,406.55 207 1,019 509 510 174 93 81 376554 Samsera 1,404.00 409 2,064 1,040 1,024 275 145 130 376555 Kasira 880.00 277 1,471 742 729 212 118 94 376556 Baleyajor 845.00 138 727 365 362 119 59 60 376557 Gatigorha 433.00 48 231 125 106 44 24 20 376558 Kadopani 2,669.73 508 2,526 1,263 1,263 395 205 190 376559 Kiresera 1,131.00 280 1,367 663 704 197 102 95
C D Block -
Population in the age-group 0-6Name of Village
Location code
number
Total population (including institutional and houseless
population)Area of
Village in hectares
Number of households
84

PRIMARY CENSUS ABSTRACT
CENSUS ABSTRACTBolba
Persons Males Females Persons Males Females Persons Males Females11 12 13 14 15 16 17 18 19 2
2,109 1,038 1,071 22,433 11,100 11,333 16,422 9,132 7,290 Bolba (Total)2,109 1,038 1,071 22,433 11,100 11,333 16,422 9,132 7,290 Bolba (Rural)
- - - - - - - - - Bolba (Urban)RURAL
- - - 370 172 198 304 167 137 Khandanisan11 7 4 397 188 209 266 148 118 Machhkatta13 5 8 2,132 1,069 1,063 1,513 805 708 Malsara
281 139 142 742 351 391 651 386 265 Talmanga135 65 70 797 396 401 540 320 220 Belkuba- - - 712 347 365 424 225 199 Rengarbahar34 19 15 601 293 308 436 251 185 Piriyaponch28 15 13 1,903 964 939 1,063 639 424 Auga
234 111 123 472 225 247 350 189 161 Letabera42 21 21 446 228 218 277 159 118 Suadongar52 23 29 214 100 114 199 106 93 Kachhupani
- - - 50 23 27 76 39 37 Jethubandh- - - 174 88 86 109 67 42 Saraslongri41 18 23 719 314 405 968 464 504 Bolba16 12 4 221 96 125 359 200 159 Pakairbahar20 11 9 450 236 214 724 433 291 Alingburu85 41 44 904 425 479 712 386 326 Palemunda
245 121 124 1,973 949 1,024 1,306 729 577 Kundurmunda- - - 1,338 698 640 917 518 399 Behrainbasu28 12 16 951 479 472 522 292 230 Naktikachhar
208 105 103 1,685 848 837 1,131 650 481 Samsera74 37 37 1,359 686 673 873 460 413 Kasira12 5 7 713 359 354 432 233 199 Baleyajor
- - - 231 125 106 128 77 51 Gatigorha196 105 91 1,998 1,011 987 1,445 801 644 Kadopani354 166 188 881 430 451 697 388 309 Kiresera
Scheduled Castes population Scheduled Tribes populationName of Village
Literates
85

DISTRICT CENSUS HANDBOOK : SIMDEGA
VILLAGE PRIMARYC D Block -
Persons Males Females Persons Males Females Persons Males Females1 2 20 21 22 23 24 25 26 27 28
0228 Bolba (Total) 14,364 6,091 8,273 18,134 9,212 8,922 11,513 7,021 4,492 0228 Bolba (Rural) 14,364 6,091 8,273 18,134 9,212 8,922 11,513 7,021 4,492 0228 Bolba (Urban) - - - - - - - - -
RURAL376534 Khandanisan 309 130 179 422 208 214 322 164 158 376535 Machhkatta 304 131 173 294 148 146 221 138 83 376536 Malsara 1,176 529 647 1,549 785 764 1,223 633 590 376537 Talmanga 1,146 477 669 1,164 574 590 464 339 125 376538 Belkuba 671 277 394 690 346 344 682 342 340 376539 Rengarbahar 343 149 194 477 239 238 414 221 193 376540 Piriyaponch 520 217 303 602 299 303 264 205 59 376541 Auga 1,186 502 684 1,385 733 652 959 576 383 376542 Letabera 365 152 213 441 219 222 343 177 166 376543 Suadongar 314 137 177 328 156 172 328 156 172 376544 Kachhupani 145 58 87 176 81 95 171 79 92 376545 Jethubandh 38 13 25 62 33 29 41 19 22 376546 Saraslongri 66 21 45 89 43 46 85 39 46 376547 Bolba 521 219 302 609 344 265 558 317 241 376548 Pakairbahar 256 100 156 467 228 239 318 163 155 376549 Alingburu 551 229 322 773 420 353 225 181 44 376550 Palemunda 698 301 397 1,063 515 548 302 264 38 376551 Kundurmunda 1,125 446 679 1,422 714 708 698 529 169 376552 Behrainbasu 453 197 256 756 380 376 727 372 355 376553 Naktikachhar 497 217 280 549 275 274 374 195 179 376554 Samsera 933 390 543 1,134 586 548 734 442 292 376555 Kasira 598 282 316 875 454 421 452 325 127 376556 Baleyajor 295 132 163 343 184 159 339 182 157 376557 Gatigorha 103 48 55 140 78 62 68 65 3 376558 Kadopani 1,081 462 619 1,534 792 742 640 561 79 376559 Kiresera 670 275 395 790 378 412 561 337 224
Illiterates Total workers Main workersName of Village
Location code
number
86

PRIMARY CENSUS ABSTRACT
CENSUS ABSTRACTBolba
Persons Males Females Persons Males Females PersonsMalesFemales Persons Males Females29 30 31 32 33 34 35 36 37 38 39 40 2
7,010 4,827 2,183 3,270 1,452 1,818 369 216 153 864 526 338 Bolba (Total)7,010 4,827 2,183 3,270 1,452 1,818 369 216 153 864 526 338 Bolba (Rural)
- - - - - - - - - - - - Bolba (Urban)RURAL
308 157 151 4 3 1 4 2 2 6 2 4 Khandanisan175 108 67 31 20 11 6 4 2 9 6 3 Machhkatta809 442 367 310 136 174 24 13 11 80 42 38 Malsara323 253 70 103 66 37 12 2 10 26 18 8 Talmanga454 221 233 127 69 58 33 16 17 68 36 32 Belkuba181 119 62 174 62 112 3 1 2 56 39 17 Rengarbahar159 156 3 58 22 36 3 3 - 44 24 20 Piriyaponch639 449 190 163 28 135 81 43 38 76 56 20 Auga185 130 55 156 45 111 - - - 2 2 - Letabera60 57 3 266 98 168 - - - 2 1 1 Suadongar30 27 3 136 49 87 1 1 - 4 2 2 Kachhupani10 9 1 31 10 21 - - - - - - Jethubandh30 26 4 49 10 39 - - - 6 3 3 Saraslongri
133 89 44 270 120 150 58 41 17 97 67 30 Bolba147 67 80 137 73 64 6 3 3 28 20 8 Pakairbahar98 95 3 75 53 22 3 2 1 49 31 18 Alingburu
125 119 6 148 130 18 4 4 - 25 11 14 Palemunda537 435 102 87 46 41 7 7 - 67 41 26 Kundurmunda487 260 227 186 77 109 2 1 1 52 34 18 Behrainbasu351 180 171 4 4 - 10 6 4 9 5 4 Naktikachhar431 293 138 201 95 106 58 33 25 44 21 23 Samsera339 258 81 96 58 38 2 1 1 15 8 7 Kasira151 129 22 170 45 125 1 - 1 17 8 9 Baleyajor63 62 1 - - - - - - 5 3 2 Gatigorha
511 480 31 62 33 29 9 9 - 58 39 19 Kadopani274 206 68 226 100 126 42 24 18 19 7 12 Kiresera
CultivatorsName of Village
Household industry workersAgricultural labourers
Industrial category of main workers
Other workers
87
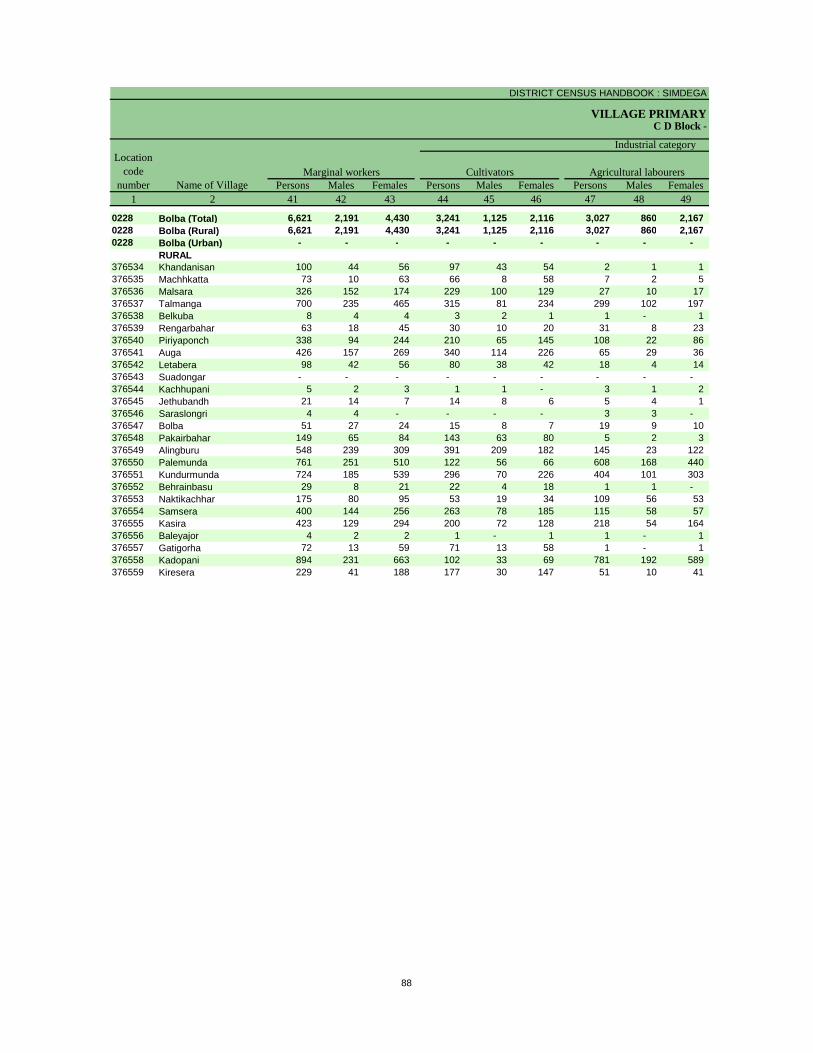
DISTRICT CENSUS HANDBOOK : SIMDEGA
VILLAGE PRIMARYC D Block -
Persons Males Females Persons Males Females Persons Males Females1 2 41 42 43 44 45 46 47 48 49
0228 Bolba (Total) 6,621 2,191 4,430 3,241 1,125 2,116 3,027 860 2,167 0228 Bolba (Rural) 6,621 2,191 4,430 3,241 1,125 2,116 3,027 860 2,167 0228 Bolba (Urban) - - - - - - - - -
RURAL376534 Khandanisan 100 44 56 97 43 54 2 1 1 376535 Machhkatta 73 10 63 66 8 58 7 2 5 376536 Malsara 326 152 174 229 100 129 27 10 17 376537 Talmanga 700 235 465 315 81 234 299 102 197 376538 Belkuba 8 4 4 3 2 1 1 - 1 376539 Rengarbahar 63 18 45 30 10 20 31 8 23 376540 Piriyaponch 338 94 244 210 65 145 108 22 86 376541 Auga 426 157 269 340 114 226 65 29 36 376542 Letabera 98 42 56 80 38 42 18 4 14 376543 Suadongar - - - - - - - - - 376544 Kachhupani 5 2 3 1 1 - 3 1 2 376545 Jethubandh 21 14 7 14 8 6 5 4 1 376546 Saraslongri 4 4 - - - - 3 3 - 376547 Bolba 51 27 24 15 8 7 19 9 10 376548 Pakairbahar 149 65 84 143 63 80 5 2 3 376549 Alingburu 548 239 309 391 209 182 145 23 122 376550 Palemunda 761 251 510 122 56 66 608 168 440 376551 Kundurmunda 724 185 539 296 70 226 404 101 303 376552 Behrainbasu 29 8 21 22 4 18 1 1 - 376553 Naktikachhar 175 80 95 53 19 34 109 56 53 376554 Samsera 400 144 256 263 78 185 115 58 57 376555 Kasira 423 129 294 200 72 128 218 54 164 376556 Baleyajor 4 2 2 1 - 1 1 - 1 376557 Gatigorha 72 13 59 71 13 58 1 - 1 376558 Kadopani 894 231 663 102 33 69 781 192 589 376559 Kiresera 229 41 188 177 30 147 51 10 41
Location code
number Name of VillageMarginal workers Cultivators Agricultural labourers
Industrial category
88

PRIMARY CENSUS ABSTRACT
CENSUS ABSTRACTBolba
Persons Males Females Persons Males Females Persons Males Females50 51 52 53 54 55 56 57 58 2 1
119 70 49 234 136 98 12,652 6,011 6,641 Bolba (Total) 0228119 70 49 234 136 98 12,652 6,011 6,641 Bolba (Rural) 0228- - - - - - - - - Bolba (Urban) 0228
RURAL1 - 1 - - - 191 89 102 Khandanisan 376534
- - - - - - 276 131 145 Machhkatta 3765352 - 2 68 42 26 1,140 549 591 Malsara 376536
21 10 11 65 42 23 633 289 344 Talmanga 3765371 - 1 3 2 1 521 251 270 Belkuba 376538
- - - 2 - 2 290 135 155 Rengarbahar 37653911 4 7 9 3 6 354 169 185 Piriyaponch 3765407 4 3 14 10 4 864 408 456 Auga 376541
- - - - - - 274 122 152 Letabera 376542- - - - - - 263 140 123 Suadongar 376543- - - 1 - 1 168 83 85 Kachhupani 376544- - - 2 2 - 52 19 33 Jethubandh 376545- - - 1 1 - 86 45 41 Saraslongri 376546
7 5 2 10 5 5 880 339 541 Bolba 376547- - - 1 - 1 148 72 76 Pakairbahar 376548- - - 12 7 5 502 242 260 Alingburu 37654927 24 3 4 3 1 347 172 175 Palemunda 37655014 8 6 10 6 4 1,009 461 548 Kundurmunda 376551
- - - 6 3 3 614 335 279 Behrainbasu 37655211 4 7 2 1 1 470 234 236 Naktikachhar 37655311 6 5 11 2 9 930 454 476 Samsera 376554
- - - 5 3 2 596 288 308 Kasira 376555- - - 2 2 - 384 181 203 Baleyajor 376556- - - - - - 91 47 44 Gatigorha 376557
6 5 1 5 1 4 992 471 521 Kadopani 376558- - - 1 1 - 577 285 292 Kiresera 376559
Non-workers
of marginal workersLocation
code number
Household industry workersName of Village
Other workers
89
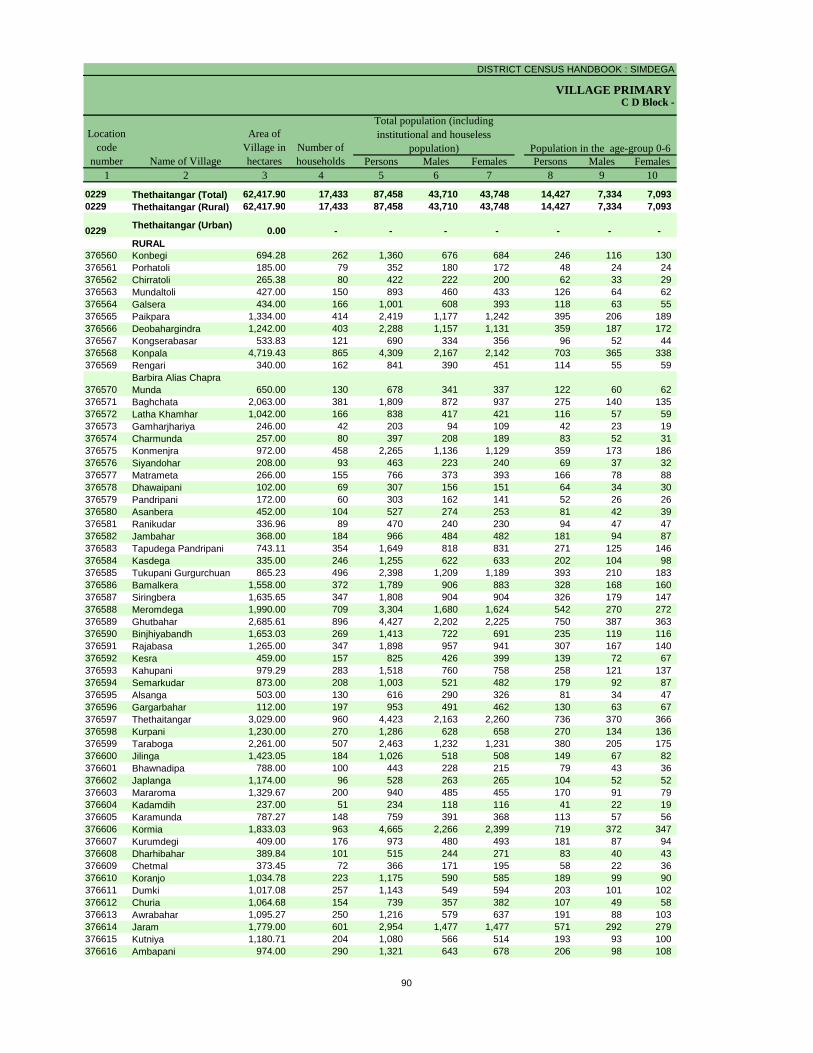
DISTRICT CENSUS HANDBOOK : SIMDEGA
VILLAGE PRIMARY
Persons Males Females Persons Males Females1 2 3 4 5 6 7 8 9 10
0229 Thethaitangar (Total) 62,417.90 17,433 87,458 43,710 43,748 14,427 7,334 7,093 0229 Thethaitangar (Rural) 62,417.90 17,433 87,458 43,710 43,748 14,427 7,334 7,093
0229 Thethaitangar (Urban) 0.00 - - - - - - - RURAL
376560 Konbegi 694.28 262 1,360 676 684 246 116 130 376561 Porhatoli 185.00 79 352 180 172 48 24 24 376562 Chirratoli 265.38 80 422 222 200 62 33 29 376563 Mundaltoli 427.00 150 893 460 433 126 64 62 376564 Galsera 434.00 166 1,001 608 393 118 63 55 376565 Paikpara 1,334.00 414 2,419 1,177 1,242 395 206 189 376566 Deobahargindra 1,242.00 403 2,288 1,157 1,131 359 187 172 376567 Kongserabasar 533.83 121 690 334 356 96 52 44 376568 Konpala 4,719.43 865 4,309 2,167 2,142 703 365 338 376569 Rengari 340.00 162 841 390 451 114 55 59
376570Barbira Alias Chapra Munda 650.00 130 678 341 337 122 60 62
376571 Baghchata 2,063.00 381 1,809 872 937 275 140 135 376572 Latha Khamhar 1,042.00 166 838 417 421 116 57 59 376573 Gamharjhariya 246.00 42 203 94 109 42 23 19 376574 Charmunda 257.00 80 397 208 189 83 52 31 376575 Konmenjra 972.00 458 2,265 1,136 1,129 359 173 186 376576 Siyandohar 208.00 93 463 223 240 69 37 32 376577 Matrameta 266.00 155 766 373 393 166 78 88 376578 Dhawaipani 102.00 69 307 156 151 64 34 30 376579 Pandripani 172.00 60 303 162 141 52 26 26 376580 Asanbera 452.00 104 527 274 253 81 42 39 376581 Ranikudar 336.96 89 470 240 230 94 47 47 376582 Jambahar 368.00 184 966 484 482 181 94 87 376583 Tapudega Pandripani 743.11 354 1,649 818 831 271 125 146 376584 Kasdega 335.00 246 1,255 622 633 202 104 98 376585 Tukupani Gurgurchuan 865.23 496 2,398 1,209 1,189 393 210 183 376586 Bamalkera 1,558.00 372 1,789 906 883 328 168 160 376587 Siringbera 1,635.65 347 1,808 904 904 326 179 147 376588 Meromdega 1,990.00 709 3,304 1,680 1,624 542 270 272 376589 Ghutbahar 2,685.61 896 4,427 2,202 2,225 750 387 363 376590 Binjhiyabandh 1,653.03 269 1,413 722 691 235 119 116 376591 Rajabasa 1,265.00 347 1,898 957 941 307 167 140 376592 Kesra 459.00 157 825 426 399 139 72 67 376593 Kahupani 979.29 283 1,518 760 758 258 121 137 376594 Semarkudar 873.00 208 1,003 521 482 179 92 87 376595 Alsanga 503.00 130 616 290 326 81 34 47 376596 Gargarbahar 112.00 197 953 491 462 130 63 67 376597 Thethaitangar 3,029.00 960 4,423 2,163 2,260 736 370 366 376598 Kurpani 1,230.00 270 1,286 628 658 270 134 136 376599 Taraboga 2,261.00 507 2,463 1,232 1,231 380 205 175 376600 Jilinga 1,423.05 184 1,026 518 508 149 67 82 376601 Bhawnadipa 788.00 100 443 228 215 79 43 36 376602 Japlanga 1,174.00 96 528 263 265 104 52 52 376603 Mararoma 1,329.67 200 940 485 455 170 91 79 376604 Kadamdih 237.00 51 234 118 116 41 22 19 376605 Karamunda 787.27 148 759 391 368 113 57 56 376606 Kormia 1,833.03 963 4,665 2,266 2,399 719 372 347 376607 Kurumdegi 409.00 176 973 480 493 181 87 94 376608 Dharhibahar 389.84 101 515 244 271 83 40 43 376609 Chetmal 373.45 72 366 171 195 58 22 36 376610 Koranjo 1,034.78 223 1,175 590 585 189 99 90 376611 Dumki 1,017.08 257 1,143 549 594 203 101 102 376612 Churia 1,064.68 154 739 357 382 107 49 58 376613 Awrabahar 1,095.27 250 1,216 579 637 191 88 103 376614 Jaram 1,779.00 601 2,954 1,477 1,477 571 292 279 376615 Kutniya 1,180.71 204 1,080 566 514 193 93 100 376616 Ambapani 974.00 290 1,321 643 678 206 98 108
Name of Village
Location code
number
Total population (including institutional and houseless
population)Area of
Village in hectares
Number of households
C D Block -
Population in the age-group 0-6
90
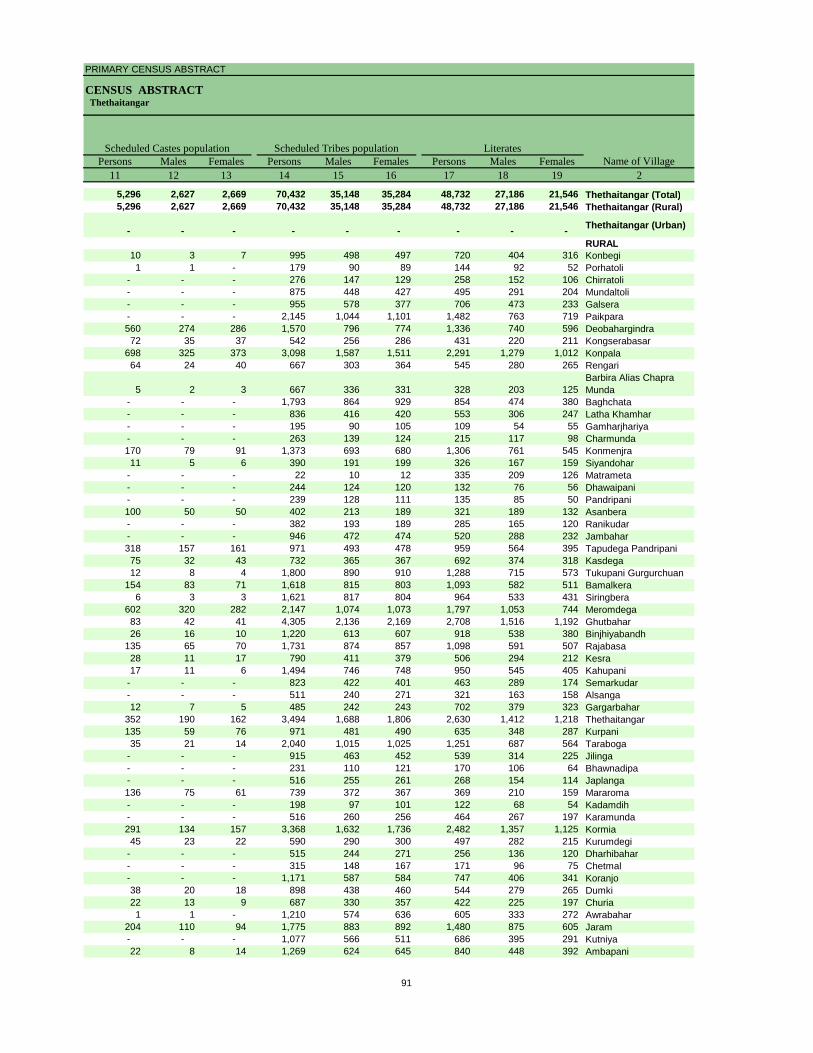
PRIMARY CENSUS ABSTRACT
CENSUS ABSTRACT Thethaitangar
Persons Males Females Persons Males Females Persons Males Females11 12 13 14 15 16 17 18 19 2
5,296 2,627 2,669 70,432 35,148 35,284 48,732 27,186 21,546 Thethaitangar (Total)5,296 2,627 2,669 70,432 35,148 35,284 48,732 27,186 21,546 Thethaitangar (Rural)
- - - - - - - - - Thethaitangar (Urban)
RURAL10 3 7 995 498 497 720 404 316 Konbegi1 1 - 179 90 89 144 92 52 Porhatoli
- - - 276 147 129 258 152 106 Chirratoli- - - 875 448 427 495 291 204 Mundaltoli- - - 955 578 377 706 473 233 Galsera- - - 2,145 1,044 1,101 1,482 763 719 Paikpara560 274 286 1,570 796 774 1,336 740 596 Deobahargindra72 35 37 542 256 286 431 220 211 Kongserabasar
698 325 373 3,098 1,587 1,511 2,291 1,279 1,012 Konpala64 24 40 667 303 364 545 280 265 Rengari
5 2 3 667 336 331 328 203 125 Barbira Alias Chapra Munda
- - - 1,793 864 929 854 474 380 Baghchata- - - 836 416 420 553 306 247 Latha Khamhar- - - 195 90 105 109 54 55 Gamharjhariya- - - 263 139 124 215 117 98 Charmunda170 79 91 1,373 693 680 1,306 761 545 Konmenjra11 5 6 390 191 199 326 167 159 Siyandohar
- - - 22 10 12 335 209 126 Matrameta- - - 244 124 120 132 76 56 Dhawaipani- - - 239 128 111 135 85 50 Pandripani100 50 50 402 213 189 321 189 132 Asanbera- - - 382 193 189 285 165 120 Ranikudar- - - 946 472 474 520 288 232 Jambahar318 157 161 971 493 478 959 564 395 Tapudega Pandripani75 32 43 732 365 367 692 374 318 Kasdega12 8 4 1,800 890 910 1,288 715 573 Tukupani Gurgurchuan
154 83 71 1,618 815 803 1,093 582 511 Bamalkera6 3 3 1,621 817 804 964 533 431 Siringbera
602 320 282 2,147 1,074 1,073 1,797 1,053 744 Meromdega83 42 41 4,305 2,136 2,169 2,708 1,516 1,192 Ghutbahar26 16 10 1,220 613 607 918 538 380 Binjhiyabandh
135 65 70 1,731 874 857 1,098 591 507 Rajabasa28 11 17 790 411 379 506 294 212 Kesra17 11 6 1,494 746 748 950 545 405 Kahupani
- - - 823 422 401 463 289 174 Semarkudar- - - 511 240 271 321 163 158 Alsanga12 7 5 485 242 243 702 379 323 Gargarbahar
352 190 162 3,494 1,688 1,806 2,630 1,412 1,218 Thethaitangar135 59 76 971 481 490 635 348 287 Kurpani35 21 14 2,040 1,015 1,025 1,251 687 564 Taraboga
- - - 915 463 452 539 314 225 Jilinga- - - 231 110 121 170 106 64 Bhawnadipa- - - 516 255 261 268 154 114 Japlanga136 75 61 739 372 367 369 210 159 Mararoma- - - 198 97 101 122 68 54 Kadamdih- - - 516 260 256 464 267 197 Karamunda291 134 157 3,368 1,632 1,736 2,482 1,357 1,125 Kormia45 23 22 590 290 300 497 282 215 Kurumdegi
- - - 515 244 271 256 136 120 Dharhibahar- - - 315 148 167 171 96 75 Chetmal- - - 1,171 587 584 747 406 341 Koranjo38 20 18 898 438 460 544 279 265 Dumki22 13 9 687 330 357 422 225 197 Churia1 1 - 1,210 574 636 605 333 272 Awrabahar
204 110 94 1,775 883 892 1,480 875 605 Jaram- - - 1,077 566 511 686 395 291 Kutniya22 8 14 1,269 624 645 840 448 392 Ambapani
Name of VillageLiteratesScheduled Castes population Scheduled Tribes population
91

DISTRICT CENSUS HANDBOOK : SIMDEGA PRIMARY CENSUS ABSTRACT
VILLAGE PRIMARY CENSUS ABSTRACTC D Block - Thethaitangar
Persons Males Females Persons Males Females Persons Males Females Persons1 2 20 21 22 23 24 25 26 27 28 29
0229 Thethaitangar (Total) 38,726 16,524 22,202 43,540 23,203 20,337 23,948 15,593 8,355 16,096 0229 Thethaitangar (Rural) 38,726 16,524 22,202 43,540 23,203 20,337 23,948 15,593 8,355 16,096
0229 Thethaitangar (Urban) - - - - - - - - - - RURAL
376560 Konbegi 640 272 368 722 360 362 477 264 213 377 376561 Porhatoli 208 88 120 188 93 95 97 85 12 56 376562 Chirratoli 164 70 94 192 105 87 60 51 9 37 376563 Mundaltoli 398 169 229 529 251 278 165 153 12 136 376564 Galsera 295 135 160 387 200 187 277 157 120 236 376565 Paikpara 937 414 523 1,118 559 559 919 482 437 762 376566 Deobahargindra 952 417 535 1,075 552 523 427 310 117 293 376567 Kongserabasar 259 114 145 416 209 207 307 157 150 253 376568 Konpala 2,018 888 1,130 2,308 1,150 1,158 1,486 891 595 1,083 376569 Rengari 296 110 186 445 193 252 166 118 48 97
376570Barbira Alias Chapra Munda 350 138 212 294 145 149 202 96 106 162
376571 Baghchata 955 398 557 777 422 355 642 406 236 571 376572 Latha Khamhar 285 111 174 411 226 185 318 192 126 292 376573 Gamharjhariya 94 40 54 106 52 54 103 51 52 95 376574 Charmunda 182 91 91 175 91 84 158 83 75 153 376575 Konmenjra 959 375 584 1,146 569 577 744 464 280 347 376576 Siyandohar 137 56 81 298 147 151 134 96 38 63 376577 Matrameta 431 164 267 349 168 181 6 5 1 - 376578 Dhawaipani 175 80 95 129 80 49 46 38 8 17 376579 Pandripani 168 77 91 154 84 70 78 75 3 53 376580 Asanbera 206 85 121 310 160 150 66 41 25 54 376581 Ranikudar 185 75 110 334 172 162 32 29 3 12 376582 Jambahar 446 196 250 629 314 315 45 33 12 8 376583 Tapudega Pandripani 690 254 436 671 426 245 572 386 186 348 376584 Kasdega 563 248 315 698 384 314 238 149 89 127 376585 Tukupani Gurgurchuan 1,110 494 616 1,174 672 502 918 594 324 353 376586 Bamalkera 696 324 372 945 497 448 516 329 187 460 376587 Siringbera 844 371 473 912 458 454 693 405 288 299 376588 Meromdega 1,507 627 880 1,337 883 454 1,183 814 369 853 376589 Ghutbahar 1,719 686 1,033 1,594 1,079 515 1,049 960 89 895 376590 Binjhiyabandh 495 184 311 624 370 254 422 318 104 374 376591 Rajabasa 800 366 434 849 464 385 258 233 25 218 376592 Kesra 319 132 187 301 197 104 197 135 62 188 376593 Kahupani 568 215 353 806 418 388 270 176 94 176 376594 Semarkudar 540 232 308 514 276 238 258 239 19 224 376595 Alsanga 295 127 168 226 161 65 226 161 65 152 376596 Gargarbahar 251 112 139 239 200 39 166 137 29 27 376597 Thethaitangar 1,793 751 1,042 2,188 1,171 1,017 1,428 906 522 924 376598 Kurpani 651 280 371 653 336 317 417 252 165 196 376599 Taraboga 1,212 545 667 1,291 666 625 685 494 191 429 376600 Jilinga 487 204 283 639 330 309 363 232 131 110 376601 Bhawnadipa 273 122 151 162 126 36 159 125 34 87 376602 Japlanga 260 109 151 265 133 132 80 77 3 16 376603 Mararoma 571 275 296 487 250 237 101 84 17 74 376604 Kadamdih 112 50 62 128 66 62 44 36 8 36 376605 Karamunda 295 124 171 402 217 185 10 4 6 1 376606 Kormia 2,183 909 1,274 2,596 1,273 1,323 1,137 702 435 834 376607 Kurumdegi 476 198 278 514 273 241 143 94 49 117 376608 Dharhibahar 259 108 151 302 150 152 130 114 16 78 376609 Chetmal 195 75 120 199 92 107 181 89 92 168 376610 Koranjo 428 184 244 653 321 332 23 11 12 - 376611 Dumki 599 270 329 677 333 344 133 75 58 41 376612 Churia 317 132 185 417 209 208 328 200 128 311 376613 Awrabahar 611 246 365 704 339 365 593 285 308 490 376614 Jaram 1,474 602 872 1,528 799 729 864 562 302 310 376615 Kutniya 394 171 223 558 288 270 154 145 9 122 376616 Ambapani 481 195 286 571 315 256 38 27 11 2
Name of Village
Location code
numberIlliterates Total workers Main workers Cultivators
92

PRIMARY CENSUS ABSTRACT
CENSUS ABSTRACT Thethaitangar
Males Females Persons Males Females Persons MalesFemales Persons Males Females30 31 32 33 34 35 36 37 38 39 40 2 1
11,139 4,957 3,997 2,008 1,989 1,165 679 486 2,690 1,767 923 Thethaitangar (Total) 022911,139 4,957 3,997 2,008 1,989 1,165 679 486 2,690 1,767 923 Thethaitangar (Rural) 0229
- - - - - - - - - - - Thethaitangar (Urban) 0229RURAL
206 171 60 29 31 9 8 1 31 21 10 Konbegi 37656052 4 27 22 5 - - - 14 11 3 Porhatoli 37656134 3 11 9 2 - - - 12 8 4 Chirratoli 376562
129 7 14 13 1 - - - 15 11 4 Mundaltoli 376563135 101 10 5 5 1 1 - 30 16 14 Galsera 376564406 356 128 61 67 - - - 29 15 14 Paikpara 376565238 55 88 45 43 32 19 13 14 8 6 Deobahargindra 376566128 125 47 24 23 3 2 1 4 3 1 Kongserabasar 376567726 357 245 73 172 95 57 38 63 35 28 Konpala 37656891 6 14 10 4 3 2 1 52 15 37 Rengari 376569
75 87 17 6 11 12 7 5 11 8 3 Barbira Alias Chapra Munda 376570
370 201 54 28 26 1 1 - 16 7 9 Baghchata 376571181 111 4 2 2 - - - 22 9 13 Latha Khamhar 37657245 50 1 - 1 - - - 7 6 1 Gamharjhariya 37657380 73 2 1 1 - - - 3 2 1 Charmunda 376574
241 106 184 98 86 100 52 48 113 73 40 Konmenjra 37657541 22 30 25 5 - - - 41 30 11 Siyandohar 376576
- - - - - - - - 6 5 1 Matrameta 37657715 2 6 5 1 2 1 1 21 17 4 Dhawaipani 37657852 1 19 18 1 - - - 6 5 1 Pandripani 37657937 17 7 - 7 3 3 - 2 1 1 Asanbera 37658010 2 13 13 - - - - 7 6 1 Ranikudar 3765816 2 4 4 - 1 1 - 32 22 10 Jambahar 376582
245 103 111 64 47 31 22 9 82 55 27 Tapudega Pandripani 37658372 55 59 34 25 7 4 3 45 39 6 Kasdega 376584
219 134 261 152 109 17 9 8 287 214 73 Tukupani Gurgurchuan 376585296 164 9 8 1 10 9 1 37 16 21 Bamalkera 376586270 29 369 119 250 11 7 4 14 9 5 Siringbera 376587589 264 43 28 15 111 70 41 176 127 49 Meromdega 376588843 52 44 43 1 30 23 7 80 51 29 Ghutbahar 376589304 70 37 9 28 - - - 11 5 6 Binjhiyabandh 376590198 20 17 16 1 5 5 - 18 14 4 Rajabasa 376591130 58 5 3 2 1 1 - 3 1 2 Kesra 376592134 42 91 40 51 - - - 3 2 1 Kahupani 376593210 14 17 14 3 - - - 17 15 2 Semarkudar 376594140 12 48 5 43 16 8 8 10 8 2 Alsanga 37659524 3 15 12 3 36 29 7 88 72 16 Gargarbahar 376596
590 334 189 82 107 58 30 28 257 204 53 Thethaitangar 376597156 40 175 59 116 - - - 46 37 9 Kurpani 376598335 94 135 93 42 20 12 8 101 54 47 Taraboga 37659987 23 247 140 107 - - - 6 5 1 Jilinga 37660085 2 - - - 67 38 29 5 2 3 Bhawnadipa 37660116 - 60 60 - - - - 4 1 3 Japlanga 37660267 7 15 9 6 - - - 12 8 4 Mararoma 37660332 4 7 4 3 - - - 1 - 1 Kadamdih 3766041 - 3 1 2 - - - 6 2 4 Karamunda 376605
519 315 53 35 18 71 40 31 179 108 71 Kormia 37660676 41 5 5 - 5 5 - 16 8 8 Kurumdegi 37660773 5 26 23 3 2 1 1 24 17 7 Dharhibahar 37660884 84 7 2 5 1 - 1 5 3 2 Chetmal 376609
- - 1 - 1 - - - 22 11 11 Koranjo 37661028 13 31 14 17 6 5 1 55 28 27 Dumki 376611
191 120 3 2 1 6 4 2 8 3 5 Churia 376612245 245 8 1 7 7 7 - 88 32 56 Awrabahar 376613269 41 240 86 154 80 45 35 234 162 72 Jaram 376614122 - 16 13 3 5 5 - 11 5 6 Kutniya 376615
2 - 3 3 - 8 4 4 25 18 7 Ambapani 376616
Location code
number Cultivators
Name of Village
Household industry workersAgricultural labourers
Industrial category of main workers
Other workers
93

DISTRICT CENSUS HANDBOOK : SIMDEGA PRIMARY CENSUS ABSTRACT
VILLAGE PRIMARY CENSUS ABSTRACTC D Block - Thethaitangar
Persons Males Females Persons Males Females Persons Males Females Persons Males2 41 42 43 44 45 46 47 48 49 50 51
Thethaitangar (Total) 19,592 7,610 11,982 11,020 4,231 6,789 7,164 2,531 4,633 307 136 Thethaitangar (Rural) 19,592 7,610 11,982 11,020 4,231 6,789 7,164 2,531 4,633 307 136
Thethaitangar (Urban) - - - - - - - - - - - RURALKonbegi 245 96 149 106 33 73 86 38 48 1 - Porhatoli 91 8 83 48 3 45 36 5 31 - - Chirratoli 132 54 78 47 8 39 65 29 36 14 11 Mundaltoli 364 98 266 334 86 248 20 5 15 - - Galsera 110 43 67 94 36 58 2 2 - 3 - Paikpara 199 77 122 154 57 97 39 19 20 2 - Deobahargindra 648 242 406 244 101 143 386 132 254 - - Kongserabasar 109 52 57 78 35 43 24 14 10 - - Konpala 822 259 563 596 137 459 192 98 94 2 1 Rengari 279 75 204 154 41 113 118 30 88 - - Barbira Alias Chapra Munda 92 49 43 26 16 10 48 25 23 6 2 Baghchata 135 16 119 123 14 109 11 1 10 - - Latha Khamhar 93 34 59 57 5 52 28 26 2 - - Gamharjhariya 3 1 2 1 - 1 - - - - - Charmunda 17 8 9 11 6 5 5 2 3 - - Konmenjra 402 105 297 104 33 71 267 57 210 3 3 Siyandohar 164 51 113 118 29 89 35 15 20 - - Matrameta 343 163 180 23 11 12 269 109 160 2 1 Dhawaipani 83 42 41 4 2 2 38 3 35 - - Pandripani 76 9 67 58 9 49 18 - 18 - - Asanbera 244 119 125 41 27 14 191 87 104 12 5 Ranikudar 302 143 159 206 77 129 82 57 25 - - Jambahar 584 281 303 90 62 28 458 207 251 1 - Tapudega Pandripani 99 40 59 35 20 15 53 13 40 1 1 Kasdega 460 235 225 234 108 126 83 25 58 45 16 Tukupani Gurgurchuan 256 78 178 163 54 109 82 18 64 1 - Bamalkera 429 168 261 341 132 209 67 22 45 11 6 Siringbera 219 53 166 28 10 18 177 39 138 8 2 Meromdega 154 69 85 50 21 29 40 11 29 3 2 Ghutbahar 545 119 426 439 59 380 50 18 32 6 1 Binjhiyabandh 202 52 150 66 21 45 132 30 102 - - Rajabasa 591 231 360 417 197 220 163 29 134 5 - Kesra 104 62 42 66 35 31 29 23 6 3 1 Kahupani 536 242 294 57 31 26 466 206 260 2 - Semarkudar 256 37 219 223 26 197 22 5 17 1 - Alsanga - - - - - - - - - - - Gargarbahar 73 63 10 9 7 2 46 38 8 6 6 Thethaitangar 760 265 495 232 85 147 466 144 322 10 5 Kurpani 236 84 152 123 30 93 95 43 52 - - Taraboga 606 172 434 431 121 310 155 43 112 4 - Jilinga 276 98 178 197 70 127 74 25 49 - - Bhawnadipa 3 1 2 1 - 1 - - - 2 1 Japlanga 185 56 129 - - - 183 56 127 2 - Mararoma 386 166 220 291 118 173 89 44 45 2 2 Kadamdih 84 30 54 19 13 6 65 17 48 - - Karamunda 392 213 179 196 125 71 190 85 105 3 2 Kormia 1,459 571 888 1,117 433 684 278 104 174 25 8 Kurumdegi 371 179 192 290 160 130 66 12 54 5 4 Dharhibahar 172 36 136 131 29 102 31 2 29 3 1 Chetmal 18 3 15 17 3 14 - - - - - Koranjo 630 310 320 624 308 316 2 1 1 - - Dumki 544 258 286 339 161 178 127 52 75 20 7 Churia 89 9 80 69 2 67 15 5 10 2 - Awrabahar 111 54 57 97 44 53 9 6 3 - - Jaram 664 237 427 109 42 67 365 67 298 30 17 Kutniya 404 143 261 87 82 5 314 58 256 3 3 Ambapani 533 288 245 442 241 201 86 43 43 4 3
Name of VillageHousehold industry workersMarginal workers Cultivators Agricultural labourers
Industrial category of marginal workers
94

PRIMARY CENSUS ABSTRACT
CENSUS ABSTRACT
Females Persons Males Females Persons Males Females52 53 54 55 56 57 58 2 1
171 1,101 712 389 43,918 20,507 23,411 Thethaitangar (Total) 0229171 1,101 712 389 43,918 20,507 23,411 Thethaitangar (Rural) 0229
- - - - - - - Thethaitangar (Urban) 0229RURAL
1 52 25 27 638 316 322 Konbegi 376560- 7 - 7 164 87 77 Porhatoli 376561
3 6 6 - 230 117 113 Chirratoli 376562- 10 7 3 364 209 155 Mundaltoli 376563
3 11 5 6 614 408 206 Galsera 3765642 4 1 3 1,301 618 683 Paikpara 376565
- 18 9 9 1,213 605 608 Deobahargindra 376566- 7 3 4 274 125 149 Kongserabasar 376567
1 32 23 9 2,001 1,017 984 Konpala 376568- 7 4 3 396 197 199 Rengari 376569
4 12 6 6 384 196 188 Barbira Alias Chapra Munda 376570
- 1 1 - 1,032 450 582 Baghchata 376571- 8 3 5 427 191 236 Latha Khamhar 376572- 2 1 1 97 42 55 Gamharjhariya 376573- 1 - 1 222 117 105 Charmunda 376574- 28 12 16 1,119 567 552 Konmenjra 376575- 11 7 4 165 76 89 Siyandohar 376576
1 49 42 7 417 205 212 Matrameta 376577- 41 37 4 178 76 102 Dhawaipani 376578- - - - 149 78 71 Pandripani 376579
7 - - - 217 114 103 Asanbera 376580- 14 9 5 136 68 68 Ranikudar 376581
1 35 12 23 337 170 167 Jambahar 376582- 10 6 4 978 392 586 Tapudega Pandripani 37658329 98 86 12 557 238 319 Kasdega 3765841 10 6 4 1,224 537 687 Tukupani Gurgurchuan 3765855 10 8 2 844 409 435 Bamalkera 3765866 6 2 4 896 446 450 Siringbera 3765871 61 35 26 1,967 797 1,170 Meromdega 3765885 50 41 9 2,833 1,123 1,710 Ghutbahar 376589
- 4 1 3 789 352 437 Binjhiyabandh 3765905 6 5 1 1,049 493 556 Rajabasa 3765912 6 3 3 524 229 295 Kesra 3765922 11 5 6 712 342 370 Kahupani 3765931 10 6 4 489 245 244 Semarkudar 376594
- - - - 390 129 261 Alsanga 376595- 12 12 - 714 291 423 Gargarbahar 376596
5 52 31 21 2,235 992 1,243 Thethaitangar 376597- 18 11 7 633 292 341 Kurpani 376598
4 16 8 8 1,172 566 606 Taraboga 376599- 5 3 2 387 188 199 Jilinga 376600
1 - - - 281 102 179 Bhawnadipa 3766012 - - - 263 130 133 Japlanga 376602
- 4 2 2 453 235 218 Mararoma 376603- - - - 106 52 54 Kadamdih 376604
1 3 1 2 357 174 183 Karamunda 37660517 39 26 13 2,069 993 1,076 Kormia 3766061 10 3 7 459 207 252 Kurumdegi 3766072 7 4 3 213 94 119 Dharhibahar 376608
- 1 - 1 167 79 88 Chetmal 376609- 4 1 3 522 269 253 Koranjo 37661013 58 38 20 466 216 250 Dumki 3766112 3 2 1 322 148 174 Churia 376612
- 5 4 1 512 240 272 Awrabahar 37661313 160 111 49 1,426 678 748 Jaram 376614
- - - - 522 278 244 Kutniya 3766151 1 1 - 750 328 422 Ambapani 376616
Location code
numberHousehold industry workers
Name of VillageOther workers Non-workers
95

DISTRICT CENSUS HANDBOOK : SIMDEGA
VILLAGE PRIMARY
Persons Males Females Persons Males Females1 2 3 4 5 6 7 8 9 10
Name of Village
Location code
number
Total population (including institutional and houseless
population)Area of
Village in hectares
Number of households
C D Block -
Population in the age-group 0-6
376617 Jampani 1,139.46 359 1,825 908 917 244 127 117 376618 Deobahar 1,126.00 279 1,359 690 669 234 125 109 376619 Kereya 3,058.07 1,100 5,731 2,870 2,861 928 486 442 376620 Pandripani 717.74 164 871 435 436 166 75 91
96

PRIMARY CENSUS ABSTRACT
CENSUS ABSTRACT Thethaitangar
Persons Males Females Persons Males Females Persons Males Females11 12 13 14 15 16 17 18 19 2
Name of VillageLiteratesScheduled Castes population Scheduled Tribes population
5 3 2 1,798 896 902 1,166 612 554 Jampani- - - 1,322 668 654 763 408 355 Deobahar822 405 417 4,674 2,351 2,323 2,895 1,578 1,317 Kereya29 12 17 841 422 419 444 266 178 Pandripani
97

DISTRICT CENSUS HANDBOOK : SIMDEGA PRIMARY CENSUS ABSTRACT
VILLAGE PRIMARY CENSUS ABSTRACTC D Block - Thethaitangar
Persons Males Females Persons Males Females Persons Males Females Persons1 2 20 21 22 23 24 25 26 27 28 29
Name of Village
Location code
numberIlliterates Total workers Main workers Cultivators
376617 Jampani 659 296 363 838 488 350 688 424 264 466 376618 Deobahar 596 282 314 727 374 353 346 210 136 295 376619 Kereya 2,836 1,292 1,544 3,215 1,641 1,574 1,804 1,012 792 1,035 376620 Pandripani 427 169 258 444 226 218 178 120 58 103
98

PRIMARY CENSUS ABSTRACT
CENSUS ABSTRACT Thethaitangar
Males Females Persons Males Females Persons MalesFemales Persons Males Females30 31 32 33 34 35 36 37 38 39 40 2 1
Location code
number Cultivators
Name of Village
Household industry workersAgricultural labourers
Industrial category of main workers
Other workers
307 159 139 67 72 9 6 3 74 44 30 Jampani 376617180 115 18 10 8 10 7 3 23 13 10 Deobahar 376618632 403 440 218 222 272 129 143 57 33 24 Kereya 37661970 33 65 43 22 1 - 1 9 7 2 Pandripani 376620
99

DISTRICT CENSUS HANDBOOK : SIMDEGA PRIMARY CENSUS ABSTRACT
VILLAGE PRIMARY CENSUS ABSTRACTC D Block - Thethaitangar
Persons Males Females Persons Males Females Persons Males Females Persons Males2 41 42 43 44 45 46 47 48 49 50 51
Name of VillageHousehold industry workersMarginal workers Cultivators Agricultural labourers
Industrial category of marginal workers
Jampani 150 64 86 35 22 13 99 31 68 3 1 Deobahar 381 164 217 294 115 179 80 43 37 4 3 Kereya 1,411 629 782 929 439 490 401 152 249 41 20 Pandripani 266 106 160 105 39 66 146 60 86 6 1
100

PRIMARY CENSUS ABSTRACT
CENSUS ABSTRACT
Females Persons Males Females Persons Males Females52 53 54 55 56 57 58 2 1
Location code
numberHousehold industry workers
Name of VillageOther workers Non-workers
2 13 10 3 987 420 567 Jampani 3766171 3 3 - 632 316 316 Deobahar 376618
21 40 18 22 2,516 1,229 1,287 Kereya 3766195 9 6 3 427 209 218 Pandripani 376620
101
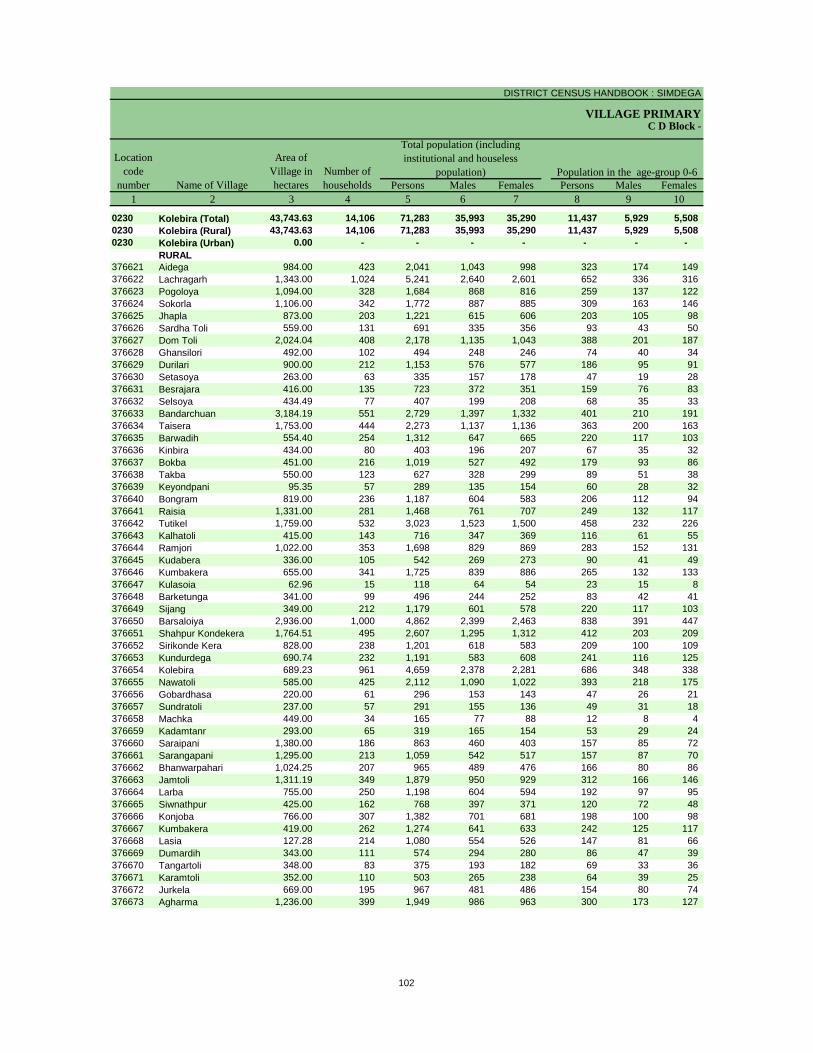
DISTRICT CENSUS HANDBOOK : SIMDEGA
VILLAGE PRIMARY
Persons Males Females Persons Males Females1 2 3 4 5 6 7 8 9 10
0230 Kolebira (Total) 43,743.63 14,106 71,283 35,993 35,290 11,437 5,929 5,508 0230 Kolebira (Rural) 43,743.63 14,106 71,283 35,993 35,290 11,437 5,929 5,508 0230 Kolebira (Urban) 0.00 - - - - - - -
RURAL376621 Aidega 984.00 423 2,041 1,043 998 323 174 149 376622 Lachragarh 1,343.00 1,024 5,241 2,640 2,601 652 336 316 376623 Pogoloya 1,094.00 328 1,684 868 816 259 137 122 376624 Sokorla 1,106.00 342 1,772 887 885 309 163 146 376625 Jhapla 873.00 203 1,221 615 606 203 105 98 376626 Sardha Toli 559.00 131 691 335 356 93 43 50 376627 Dom Toli 2,024.04 408 2,178 1,135 1,043 388 201 187 376628 Ghansilori 492.00 102 494 248 246 74 40 34 376629 Durilari 900.00 212 1,153 576 577 186 95 91 376630 Setasoya 263.00 63 335 157 178 47 19 28 376631 Besrajara 416.00 135 723 372 351 159 76 83 376632 Selsoya 434.49 77 407 199 208 68 35 33 376633 Bandarchuan 3,184.19 551 2,729 1,397 1,332 401 210 191 376634 Taisera 1,753.00 444 2,273 1,137 1,136 363 200 163 376635 Barwadih 554.40 254 1,312 647 665 220 117 103 376636 Kinbira 434.00 80 403 196 207 67 35 32 376637 Bokba 451.00 216 1,019 527 492 179 93 86 376638 Takba 550.00 123 627 328 299 89 51 38 376639 Keyondpani 95.35 57 289 135 154 60 28 32 376640 Bongram 819.00 236 1,187 604 583 206 112 94 376641 Raisia 1,331.00 281 1,468 761 707 249 132 117 376642 Tutikel 1,759.00 532 3,023 1,523 1,500 458 232 226 376643 Kalhatoli 415.00 143 716 347 369 116 61 55 376644 Ramjori 1,022.00 353 1,698 829 869 283 152 131 376645 Kudabera 336.00 105 542 269 273 90 41 49 376646 Kumbakera 655.00 341 1,725 839 886 265 132 133 376647 Kulasoia 62.96 15 118 64 54 23 15 8 376648 Barketunga 341.00 99 496 244 252 83 42 41 376649 Sijang 349.00 212 1,179 601 578 220 117 103 376650 Barsaloiya 2,936.00 1,000 4,862 2,399 2,463 838 391 447 376651 Shahpur Kondekera 1,764.51 495 2,607 1,295 1,312 412 203 209 376652 Sirikonde Kera 828.00 238 1,201 618 583 209 100 109 376653 Kundurdega 690.74 232 1,191 583 608 241 116 125 376654 Kolebira 689.23 961 4,659 2,378 2,281 686 348 338 376655 Nawatoli 585.00 425 2,112 1,090 1,022 393 218 175 376656 Gobardhasa 220.00 61 296 153 143 47 26 21 376657 Sundratoli 237.00 57 291 155 136 49 31 18 376658 Machka 449.00 34 165 77 88 12 8 4 376659 Kadamtanr 293.00 65 319 165 154 53 29 24 376660 Saraipani 1,380.00 186 863 460 403 157 85 72 376661 Sarangapani 1,295.00 213 1,059 542 517 157 87 70 376662 Bhanwarpahari 1,024.25 207 965 489 476 166 80 86 376663 Jamtoli 1,311.19 349 1,879 950 929 312 166 146 376664 Larba 755.00 250 1,198 604 594 192 97 95 376665 Siwnathpur 425.00 162 768 397 371 120 72 48 376666 Konjoba 766.00 307 1,382 701 681 198 100 98 376667 Kumbakera 419.00 262 1,274 641 633 242 125 117 376668 Lasia 127.28 214 1,080 554 526 147 81 66 376669 Dumardih 343.00 111 574 294 280 86 47 39 376670 Tangartoli 348.00 83 375 193 182 69 33 36 376671 Karamtoli 352.00 110 503 265 238 64 39 25 376672 Jurkela 669.00 195 967 481 486 154 80 74 376673 Agharma 1,236.00 399 1,949 986 963 300 173 127
C D Block -
Population in the age-group 0-6Name of Village
Location code
number
Total population (including institutional and houseless
population)Area of
Village in hectares
Number of households
102

PRIMARY CENSUS ABSTRACT
CENSUS ABSTRACTKolebira
Persons Males Females Persons Males Females Persons Males Females11 12 13 14 15 16 17 18 19 2
9,292 4,710 4,582 44,590 22,385 22,205 42,131 23,248 18,883 Kolebira (Total)9,292 4,710 4,582 44,590 22,385 22,205 42,131 23,248 18,883 Kolebira (Rural)
- - - - - - - - - Kolebira (Urban)RURAL
173 86 87 1,644 833 811 1,238 702 536 Aidega564 281 283 2,132 1,047 1,085 3,654 1,961 1,693 Lachragarh- - - 1,305 671 634 1,089 620 469 Pogoloya381 185 196 1,334 673 661 862 471 391 Sokorla51 27 24 1,125 567 558 588 311 277 Jhapla35 17 18 608 296 312 438 231 207 Sardha Toli
100 56 44 2,005 1,043 962 1,325 754 571 Dom Toli96 54 42 395 193 202 331 167 164 Ghansilori93 50 43 981 480 501 629 359 270 Durilari
- - - 330 154 176 221 116 105 Setasoya12 8 4 666 347 319 426 234 192 Besrajara
104 49 55 300 148 152 230 125 105 Selsoya195 96 99 2,504 1,283 1,221 1,630 895 735 Bandarchuan794 406 388 1,336 660 676 1,246 673 573 Taisera79 36 43 863 425 438 761 401 360 Barwadih57 27 30 332 165 167 191 94 97 Kinbira
435 217 218 338 185 153 609 347 262 Bokba205 102 103 373 200 173 430 244 186 Takba- - - 87 39 48 187 91 96 Keyondpani216 116 100 782 383 399 697 371 326 Bongram426 215 211 942 496 446 783 427 356 Raisia361 173 188 2,553 1,290 1,263 2,070 1,094 976 Tutikel- - - 581 279 302 348 169 179 Kalhatoli184 83 101 1,295 629 666 920 511 409 Ramjori
3 1 2 424 212 212 309 170 139 Kudabera1 - 1 1,003 499 504 939 509 430 Kumbakera
- - - 118 64 54 63 39 24 Kulasoia- - - 235 118 117 252 151 101 Barketunga89 48 41 303 155 148 430 268 162 Sijang
230 106 124 2,947 1,455 1,492 2,835 1,597 1,238 Barsaloiya69 33 36 1,865 917 948 1,449 815 634 Shahpur Kondekera
163 89 74 706 358 348 638 372 266 Sirikonde Kera414 216 198 660 312 348 576 330 246 Kundurdega484 249 235 1,640 804 836 3,332 1,810 1,522 Kolebira524 260 264 1,057 549 508 1,175 642 533 Nawatoli43 21 22 253 132 121 186 104 82 Gobardhasa66 37 29 189 98 91 176 108 68 Sundratoli31 16 15 134 61 73 97 48 49 Machka
108 58 50 210 107 103 189 106 83 Kadamtanr307 168 139 442 229 213 459 263 196 Saraipani560 293 267 388 194 194 586 353 233 Sarangapani413 207 206 463 240 223 522 295 227 Bhanwarpahari637 327 310 882 441 441 1,065 606 459 Jamtoli144 67 77 643 326 317 722 387 335 Larba225 117 108 524 269 255 416 228 188 Siwnathpur168 87 81 590 301 289 794 470 324 Konjoba46 23 23 563 281 282 616 352 264 Kumbakera5 2 3 279 125 154 803 443 360 Lasia
- - - 401 206 195 361 198 163 Dumardih- - - 242 125 117 187 107 80 Tangartoli
1 1 - 397 211 186 256 141 115 Karamtoli- - - 892 441 451 555 278 277 Jurkela- - - 1,329 669 660 1,240 690 550 Agharma
Scheduled Castes population Scheduled Tribes populationName of Village
Literates
103

DISTRICT CENSUS HANDBOOK : SIMDEGA
VILLAGE PRIMARYC D Block -
Persons Males Females Persons Males Females Persons Males Females1 2 20 21 22 23 24 25 26 27 28
0230 Kolebira (Total) 29,152 12,745 16,407 36,411 19,317 17,094 15,999 10,326 5,673 0230 Kolebira (Rural) 29,152 12,745 16,407 36,411 19,317 17,094 15,999 10,326 5,673 0230 Kolebira (Urban) - - - - - - - - -
RURAL376621 Aidega 803 341 462 978 556 422 406 343 63 376622 Lachragarh 1,587 679 908 2,298 1,233 1,065 1,198 704 494 376623 Pogoloya 595 248 347 873 460 413 433 220 213 376624 Sokorla 910 416 494 1,005 499 506 14 11 3 376625 Jhapla 633 304 329 589 307 282 40 32 8 376626 Sardha Toli 253 104 149 348 181 167 42 10 32 376627 Dom Toli 853 381 472 1,149 601 548 218 114 104 376628 Ghansilori 163 81 82 297 148 149 7 2 5 376629 Durilari 524 217 307 656 330 326 421 213 208 376630 Setasoya 114 41 73 187 93 94 17 8 9 376631 Besrajara 297 138 159 299 145 154 149 115 34 376632 Selsoya 177 74 103 208 108 100 207 107 100 376633 Bandarchuan 1,099 502 597 1,269 662 607 963 529 434 376634 Taisera 1,027 464 563 1,418 723 695 190 128 62 376635 Barwadih 551 246 305 829 400 429 378 235 143 376636 Kinbira 212 102 110 235 113 122 177 87 90 376637 Bokba 410 180 230 448 261 187 159 119 40 376638 Takba 197 84 113 358 190 168 155 137 18 376639 Keyondpani 102 44 58 127 68 59 14 11 3 376640 Bongram 490 233 257 618 339 279 432 256 176 376641 Raisia 685 334 351 770 415 355 567 301 266 376642 Tutikel 953 429 524 1,829 952 877 188 162 26 376643 Kalhatoli 368 178 190 451 216 235 135 107 28 376644 Ramjori 778 318 460 872 459 413 602 380 222 376645 Kudabera 233 99 134 320 156 164 7 3 4 376646 Kumbakera 786 330 456 924 462 462 174 140 34 376647 Kulasoia 55 25 30 49 26 23 1 1 - 376648 Barketunga 244 93 151 315 164 151 46 32 14 376649 Sijang 749 333 416 557 294 263 109 62 47 376650 Barsaloiya 2,027 802 1,225 2,584 1,347 1,237 1,164 845 319 376651 Shahpur Kondekera 1,158 480 678 1,459 753 706 714 475 239 376652 Sirikonde Kera 563 246 317 707 361 346 167 115 52 376653 Kundurdega 615 253 362 641 328 313 404 278 126 376654 Kolebira 1,327 568 759 1,498 1,110 388 1,127 919 208 376655 Nawatoli 937 448 489 1,053 586 467 516 348 168 376656 Gobardhasa 110 49 61 172 92 80 23 18 5 376657 Sundratoli 115 47 68 128 84 44 5 3 2 376658 Machka 68 29 39 99 49 50 66 40 26 376659 Kadamtanr 130 59 71 234 115 119 47 43 4 376660 Saraipani 404 197 207 435 220 215 281 211 70 376661 Sarangapani 473 189 284 547 267 280 239 189 50 376662 Bhanwarpahari 443 194 249 621 317 304 193 122 71 376663 Jamtoli 814 344 470 1,115 558 557 299 193 106 376664 Larba 476 217 259 615 310 305 258 151 107 376665 Siwnathpur 352 169 183 422 206 216 323 199 124 376666 Konjoba 588 231 357 645 347 298 370 243 127 376667 Kumbakera 658 289 369 711 360 351 573 337 236 376668 Lasia 277 111 166 337 255 82 225 171 54 376669 Dumardih 213 96 117 289 150 139 288 149 139 376670 Tangartoli 188 86 102 173 84 89 160 78 82 376671 Karamtoli 247 124 123 336 174 162 159 103 56 376672 Jurkela 412 203 209 361 194 167 185 120 65 376673 Agharma 709 296 413 953 489 464 764 407 357
Illiterates Total workers Main workersName of Village
Location code
number
104

PRIMARY CENSUS ABSTRACT
CENSUS ABSTRACTKolebira
Persons Males Females Persons Males Females PersonsMalesFemales Persons Males Females29 30 31 32 33 34 35 36 37 38 39 40 2
10,715 6,845 3,870 1,819 1,112 707 532 288 244 2,933 2,081 852 Kolebira (Total)10,715 6,845 3,870 1,819 1,112 707 532 288 244 2,933 2,081 852 Kolebira (Rural)
- - - - - - - - - - - - Kolebira (Urban)RURAL
323 275 48 42 36 6 5 5 - 36 27 9 Aidega296 196 100 165 73 92 150 39 111 587 396 191 Lachragarh324 175 149 90 31 59 - - - 19 14 5 Pogoloya
6 5 1 1 1 - 1 - 1 6 5 1 Sokorla32 27 5 - - - 1 - 1 7 5 2 Jhapla3 2 1 - - - 2 2 - 37 6 31 Sardha Toli
177 91 86 11 6 5 5 2 3 25 15 10 Dom Toli5 2 3 - - - - - - 2 - 2 Ghansilori
374 194 180 7 3 4 - - - 40 16 24 Durilari10 4 6 1 1 - 1 1 - 5 2 3 Setasoya
106 87 19 30 19 11 2 2 - 11 7 4 Besrajara204 105 99 - - - - - - 3 2 1 Selsoya879 475 404 64 41 23 2 1 1 18 12 6 Bandarchuan69 62 7 45 28 17 11 7 4 65 31 34 Taisera
342 209 133 22 14 8 4 3 1 10 9 1 Barwadih169 82 87 2 - 2 - - - 6 5 1 Kinbira128 99 29 - - - 1 1 - 30 19 11 Bokba145 133 12 8 3 5 - - - 2 1 1 Takba
5 5 - - - - - - - 9 6 3 Keyondpani375 219 156 18 15 3 13 9 4 26 13 13 Bongram537 287 250 2 - 2 20 9 11 8 5 3 Raisia102 98 4 4 3 1 3 2 1 79 59 20 Tutikel87 74 13 44 29 15 1 1 - 3 3 - Kalhatoli
392 284 108 174 72 102 9 5 4 27 19 8 Ramjori- - - 2 - 2 - - - 5 3 2 Kudabera120 110 10 28 16 12 - - - 26 14 12 Kumbakera- - - - - - - - - 1 1 - Kulasoia30 19 11 - - - - - - 16 13 3 Barketunga78 49 29 1 1 - 2 - 2 28 12 16 Sijang
811 580 231 188 146 42 35 21 14 130 98 32 Barsaloiya584 386 198 73 51 22 4 3 1 53 35 18 Shahpur Kondekera147 103 44 5 2 3 - - - 15 10 5 Sirikonde Kera329 209 120 54 52 2 1 1 - 20 16 4 Kundurdega170 147 23 47 31 16 73 57 16 837 684 153 Kolebira155 102 53 119 66 53 49 40 9 193 140 53 Nawatoli
3 2 1 - - - 1 1 - 19 15 4 Gobardhasa- - - 2 1 1 - - - 3 2 1 Sundratoli61 36 25 3 3 - 1 - 1 1 1 - Machka18 16 2 18 18 - - - - 11 9 2 Kadamtanr
245 187 58 17 12 5 6 2 4 13 10 3 Saraipani174 152 22 59 32 27 1 1 - 5 4 1 Sarangapani143 84 59 13 9 4 12 9 3 25 20 5 Bhanwarpahari169 107 62 69 42 27 11 6 5 50 38 12 Jamtoli160 91 69 18 14 4 60 31 29 20 15 5 Larba251 160 91 66 38 28 1 1 - 5 - 5 Siwnathpur205 134 71 59 50 9 7 4 3 99 55 44 Konjoba429 252 177 70 42 28 15 8 7 59 35 24 Kumbakera71 42 29 10 8 2 4 2 2 140 119 21 Lasia
212 109 103 65 36 29 - - - 11 4 7 Dumardih149 71 78 7 4 3 - - - 4 3 1 Tangartoli98 63 35 42 28 14 15 10 5 4 2 2 Karamtoli
130 85 45 31 20 11 3 2 1 21 13 8 Jurkela683 359 324 23 15 8 - - - 58 33 25 Agharma
CultivatorsName of Village
Household industry workersAgricultural labourers
Industrial category of main workers
Other workers
105

DISTRICT CENSUS HANDBOOK : SIMDEGA
VILLAGE PRIMARYC D Block -
Persons Males Females Persons Males Females Persons Males Females1 2 41 42 43 44 45 46 47 48 49
0230 Kolebira (Total) 20,412 8,991 11,421 11,224 5,114 6,110 7,309 2,854 4,455 0230 Kolebira (Rural) 20,412 8,991 11,421 11,224 5,114 6,110 7,309 2,854 4,455 0230 Kolebira (Urban) - - - - - - - - -
RURAL376621 Aidega 572 213 359 231 73 158 321 130 191 376622 Lachragarh 1,100 529 571 158 92 66 323 121 202 376623 Pogoloya 440 240 200 402 217 185 32 19 13 376624 Sokorla 991 488 503 719 350 369 239 123 116 376625 Jhapla 549 275 274 502 251 251 40 19 21 376626 Sardha Toli 306 171 135 250 149 101 52 21 31 376627 Dom Toli 931 487 444 722 382 340 187 97 90 376628 Ghansilori 290 146 144 272 137 135 6 2 4 376629 Durilari 235 117 118 38 17 21 157 78 79 376630 Setasoya 170 85 85 51 24 27 117 59 58 376631 Besrajara 150 30 120 66 13 53 71 5 66 376632 Selsoya 1 1 - - - - - - - 376633 Bandarchuan 306 133 173 104 60 44 177 63 114 376634 Taisera 1,228 595 633 654 342 312 476 202 274 376635 Barwadih 451 165 286 400 146 254 45 17 28 376636 Kinbira 58 26 32 19 8 11 24 12 12 376637 Bokba 289 142 147 161 68 93 125 71 54 376638 Takba 203 53 150 196 51 145 6 2 4 376639 Keyondpani 113 57 56 88 41 47 19 10 9 376640 Bongram 186 83 103 63 48 15 113 27 86 376641 Raisia 203 114 89 194 109 85 5 3 2 376642 Tutikel 1,641 790 851 1,467 702 765 134 58 76 376643 Kalhatoli 316 109 207 155 62 93 155 42 113 376644 Ramjori 270 79 191 115 18 97 98 31 67 376645 Kudabera 313 153 160 145 131 14 163 20 143 376646 Kumbakera 750 322 428 573 257 316 161 51 110 376647 Kulasoia 48 25 23 46 24 22 - - - 376648 Barketunga 269 132 137 202 95 107 53 29 24 376649 Sijang 448 232 216 236 122 114 86 43 43 376650 Barsaloiya 1,420 502 918 468 192 276 909 293 616 376651 Shahpur Kondekera 745 278 467 197 112 85 529 157 372 376652 Sirikonde Kera 540 246 294 211 97 114 284 136 148 376653 Kundurdega 237 50 187 201 41 160 25 3 22 376654 Kolebira 371 191 180 103 49 54 99 40 59 376655 Nawatoli 537 238 299 103 25 78 341 154 187 376656 Gobardhasa 149 74 75 117 56 61 24 12 12 376657 Sundratoli 123 81 42 93 62 31 23 15 8 376658 Machka 33 9 24 21 7 14 5 2 3 376659 Kadamtanr 187 72 115 169 65 104 17 6 11 376660 Saraipani 154 9 145 148 6 142 1 1 - 376661 Sarangapani 308 78 230 168 32 136 140 46 94 376662 Bhanwarpahari 428 195 233 62 18 44 345 167 178 376663 Jamtoli 816 365 451 303 146 157 461 185 276 376664 Larba 357 159 198 144 66 78 184 80 104 376665 Siwnathpur 99 7 92 77 5 72 21 1 20 376666 Konjoba 275 104 171 30 8 22 218 83 135 376667 Kumbakera 138 23 115 128 20 108 7 - 7 376668 Lasia 112 84 28 15 12 3 12 8 4 376669 Dumardih 1 1 - - - - - - - 376670 Tangartoli 13 6 7 5 2 3 4 2 2 376671 Karamtoli 177 71 106 53 26 27 116 42 74 376672 Jurkela 176 74 102 111 48 63 52 19 33 376673 Agharma 189 82 107 68 30 38 107 47 60
Location code
number Name of VillageMarginal workers Cultivators Agricultural labourers
Industrial category
106
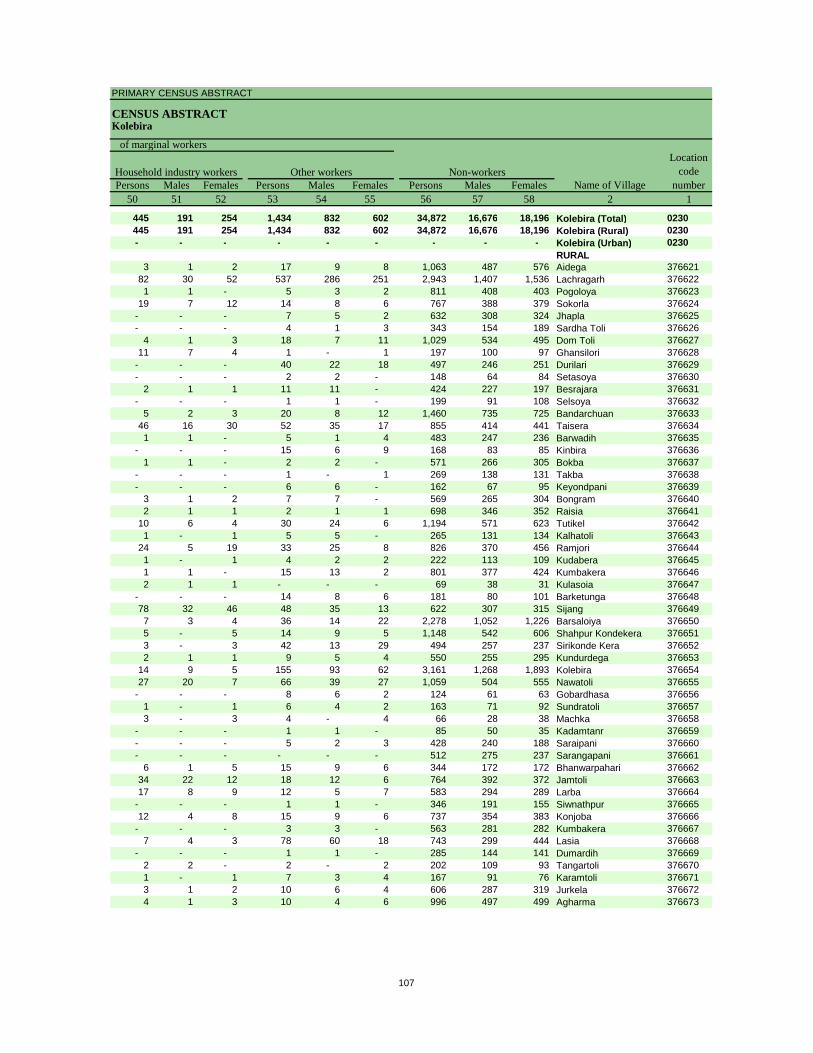
PRIMARY CENSUS ABSTRACT
CENSUS ABSTRACTKolebira
Persons Males Females Persons Males Females Persons Males Females50 51 52 53 54 55 56 57 58 2 1
445 191 254 1,434 832 602 34,872 16,676 18,196 Kolebira (Total) 0230445 191 254 1,434 832 602 34,872 16,676 18,196 Kolebira (Rural) 0230- - - - - - - - - Kolebira (Urban) 0230
RURAL3 1 2 17 9 8 1,063 487 576 Aidega 376621
82 30 52 537 286 251 2,943 1,407 1,536 Lachragarh 3766221 1 - 5 3 2 811 408 403 Pogoloya 376623
19 7 12 14 8 6 767 388 379 Sokorla 376624- - - 7 5 2 632 308 324 Jhapla 376625- - - 4 1 3 343 154 189 Sardha Toli 376626
4 1 3 18 7 11 1,029 534 495 Dom Toli 37662711 7 4 1 - 1 197 100 97 Ghansilori 376628
- - - 40 22 18 497 246 251 Durilari 376629- - - 2 2 - 148 64 84 Setasoya 376630
2 1 1 11 11 - 424 227 197 Besrajara 376631- - - 1 1 - 199 91 108 Selsoya 376632
5 2 3 20 8 12 1,460 735 725 Bandarchuan 37663346 16 30 52 35 17 855 414 441 Taisera 3766341 1 - 5 1 4 483 247 236 Barwadih 376635
- - - 15 6 9 168 83 85 Kinbira 3766361 1 - 2 2 - 571 266 305 Bokba 376637
- - - 1 - 1 269 138 131 Takba 376638- - - 6 6 - 162 67 95 Keyondpani 376639
3 1 2 7 7 - 569 265 304 Bongram 3766402 1 1 2 1 1 698 346 352 Raisia 376641
10 6 4 30 24 6 1,194 571 623 Tutikel 3766421 - 1 5 5 - 265 131 134 Kalhatoli 376643
24 5 19 33 25 8 826 370 456 Ramjori 3766441 - 1 4 2 2 222 113 109 Kudabera 3766451 1 - 15 13 2 801 377 424 Kumbakera 3766462 1 1 - - - 69 38 31 Kulasoia 376647
- - - 14 8 6 181 80 101 Barketunga 37664878 32 46 48 35 13 622 307 315 Sijang 3766497 3 4 36 14 22 2,278 1,052 1,226 Barsaloiya 3766505 - 5 14 9 5 1,148 542 606 Shahpur Kondekera 3766513 - 3 42 13 29 494 257 237 Sirikonde Kera 3766522 1 1 9 5 4 550 255 295 Kundurdega 376653
14 9 5 155 93 62 3,161 1,268 1,893 Kolebira 37665427 20 7 66 39 27 1,059 504 555 Nawatoli 376655
- - - 8 6 2 124 61 63 Gobardhasa 3766561 - 1 6 4 2 163 71 92 Sundratoli 3766573 - 3 4 - 4 66 28 38 Machka 376658
- - - 1 1 - 85 50 35 Kadamtanr 376659- - - 5 2 3 428 240 188 Saraipani 376660- - - - - - 512 275 237 Sarangapani 376661
6 1 5 15 9 6 344 172 172 Bhanwarpahari 37666234 22 12 18 12 6 764 392 372 Jamtoli 37666317 8 9 12 5 7 583 294 289 Larba 376664
- - - 1 1 - 346 191 155 Siwnathpur 37666512 4 8 15 9 6 737 354 383 Konjoba 376666
- - - 3 3 - 563 281 282 Kumbakera 3766677 4 3 78 60 18 743 299 444 Lasia 376668
- - - 1 1 - 285 144 141 Dumardih 3766692 2 - 2 - 2 202 109 93 Tangartoli 3766701 - 1 7 3 4 167 91 76 Karamtoli 3766713 1 2 10 6 4 606 287 319 Jurkela 3766724 1 3 10 4 6 996 497 499 Agharma 376673
Non-workers
of marginal workersLocation
code number
Household industry workersName of Village
Other workers
107

DISTRICT CENSUS HANDBOOK : SIMDEGA
VILLAGE PRIMARY
Persons Males Females Persons Males Females1 2 3 4 5 6 7 8 9 10
0231 Jaldega (Total) 44,161.27 12,389 64,286 32,167 32,119 10,540 5,296 5,244 0231 Jaldega (Rural) 44,161.27 12,389 64,286 32,167 32,119 10,540 5,296 5,244 0231 Jaldega (Urban) 0.00 - - - - - - -
RURAL376674 Pharsa 401.30 92 505 244 261 73 31 42 376675 Anai 146.86 88 491 257 234 78 43 35 376676 Tilmibera 150.54 41 240 111 129 32 18 14 376677 Dumarmunda 418.94 115 666 344 322 96 52 44 376678 Menjurgara 488.67 192 1,026 488 538 155 71 84 376679 Orga 1,189.55 592 2,943 1,468 1,475 453 222 231 376680 Dhelsera 399.77 179 1,013 526 487 130 69 61 376681 Sarubahar 834.07 398 2,008 1,008 1,000 315 159 156 376682 Janoda 330.50 78 433 224 209 79 42 37 376683 Bandosera 474.47 112 560 280 280 100 48 52 376684 Seharmunda 192.08 91 443 217 226 77 39 38 376685 Parba 1,873.69 408 1,978 1,006 972 280 145 135 376686 Pomian 862.00 161 732 366 366 118 63 55 376687 Lomboi 5,246.17 1,367 7,303 3,696 3,607 1,245 621 624 376688 Tikra 1,559.00 315 1,635 829 806 262 137 125 376689 Semariya 305.16 94 517 269 248 80 46 34 376690 Bhundupani 729.59 103 568 289 279 95 51 44 376691 Lamdega 1,686.15 381 1,899 937 962 323 153 170 376692 Hututua 942.82 220 1,056 516 540 201 94 107 376693 Lamdega 239.73 77 419 225 194 76 40 36 376694 Bhitbuna 538.89 163 822 400 422 155 74 81 376695 Baraibera 183.00 70 346 170 176 38 18 20 376696 Banjoga 659.00 177 894 442 452 158 70 88 376697 Dhengurpani 482.03 114 638 310 328 86 38 48 376698 Sukhajhariya 367.36 64 312 150 162 55 29 26 376699 Kauwadarha 285.22 23 108 46 62 19 7 12 376700 Lachhanpur 87.39 19 75 37 38 9 5 4 376701 Mangaspur 334.45 69 320 170 150 65 33 32 376702 Dhauraanjan 404.70 14 63 31 32 9 4 5 376703 Ramjari 670.34 159 813 409 404 120 56 64 376704 Kutangia 2,157.41 366 1,945 957 988 283 133 150 376705 Torian 1,053.57 228 1,381 706 675 247 126 121 376706 Tati 982.34 210 1,043 521 522 120 60 60 376707 Phirka 241.55 37 179 84 95 43 17 26 376708 Barbera 272.88 56 292 146 146 42 13 29 376709 Paitano 1,042.95 179 948 467 481 165 84 81 376710 Hutubda 683.57 119 658 346 312 103 50 53 376711 Titlingi 560.07 78 399 197 202 67 30 37 376712 Baribiringa 457.33 127 707 345 362 107 56 51 376713 Mayamdega 330.00 110 514 238 276 85 44 41 376714 Turupdega 227.99 52 276 132 144 47 21 26 376715 Kharwagarha 1,356.00 361 1,997 1,015 982 370 196 174 376716 Keluga 584.92 291 1,514 750 764 259 119 140 376717 Tangia 666.28 175 929 454 475 122 64 58 376718 Jaldega 1,425.99 641 3,161 1,496 1,665 475 233 242 376719 Sawnajara 466.39 143 788 418 370 117 64 53 376720 Barkitangar 237.03 55 241 124 117 37 17 20 376721 Kharwagarha 250.41 58 283 140 143 41 20 21 376722 Tengratuku 223.45 69 353 172 181 57 35 22 376723 Dhorhibahar 782.62 223 1,222 621 601 193 107 86 376724 Tingina 457.19 353 1,797 891 906 336 169 167 376725 Silanga 1,170.00 296 1,528 747 781 303 153 150 376726 Konmerla 1,059.45 439 2,222 1,120 1,102 407 215 192 376727 Dumarbera 141.62 74 377 192 185 63 36 27 376728 Gagutoli 162.55 86 411 194 217 63 33 30 376729 Baldega 708.63 253 1,271 625 646 209 105 104
C D Block -
Population in the age-group 0-6Name of Village
Location code
number
Total population (including institutional and houseless
population)Area of
Village in hectares
Number of households
108

PRIMARY CENSUS ABSTRACT
CENSUS ABSTRACTJaldega
Persons Males Females Persons Males Females Persons Males Females11 12 13 14 15 16 17 18 19 2
2,317 1,169 1,148 53,309 26,644 26,665 34,875 19,806 15,069 Jaldega (Total)2,317 1,169 1,148 53,309 26,644 26,665 34,875 19,806 15,069 Jaldega (Rural)
- - - - - - - - - Jaldega (Urban)RURAL
- - - 459 224 235 329 183 146 Pharsa7 3 4 365 185 180 293 164 129 Anai
- - - 239 110 129 136 80 56 Tilmibera- - - 560 287 273 350 200 150 Dumarmunda- - - 985 468 517 615 328 287 Menjurgara121 58 63 2,165 1,054 1,111 1,739 969 770 Orga
2 2 - 768 388 380 636 363 273 Dhelsera69 30 39 1,729 869 860 1,075 591 484 Sarubahar
- - - 433 224 209 235 136 99 Janoda- - - 444 228 216 283 158 125 Bandosera- - - 405 197 208 213 119 94 Seharmunda37 17 20 1,631 836 795 835 518 317 Parba
- - - 720 361 359 362 223 139 Pomian- - - 7,016 3,565 3,451 4,467 2,475 1,992 Lomboi- - - 1,632 828 804 833 474 359 Tikra- - - 514 268 246 291 165 126 Semariya- - - 568 289 279 380 205 175 Bhundupani66 30 36 1,386 688 698 1,109 635 474 Lamdega
- - - 1,053 515 538 426 256 170 Hututua- - - 414 223 191 202 127 75 Lamdega22 12 10 759 371 388 394 223 171 Bhitbuna11 6 5 329 163 166 192 109 83 Baraibera
- - - 894 442 452 351 221 130 Banjoga- - - 589 283 306 307 183 124 Dhengurpani- - - 267 128 139 159 86 73 Sukhajhariya31 13 18 10 4 6 54 27 27 Kauwadarha
- - - 37 16 21 34 18 16 Lachhanpur- - - 221 117 104 117 83 34 Mangaspur- - - 52 27 25 36 21 15 Dhauraanjan- - - 812 409 403 449 257 192 Ramjari
1 1 - 1,917 941 976 1,110 620 490 Kutangia81 45 36 1,266 645 621 847 498 349 Torian9 5 4 966 481 485 661 379 282 Tati
- - - 150 72 78 66 41 25 Phirka- - - 292 146 146 183 110 73 Barbera126 60 66 820 406 414 450 261 189 Paitano- - - 642 337 305 426 243 183 Hutubda- - - 396 197 199 275 150 125 Titlingi- - - 698 342 356 366 214 152 Baribiringa28 16 12 447 204 243 250 134 116 Mayamdega
- - - 209 100 109 142 72 70 Turupdega300 151 149 1,290 654 636 874 536 338 Kharwagarha23 13 10 1,477 731 746 667 395 272 Keluga13 7 6 880 429 451 421 225 196 Tangia
148 61 87 1,424 655 769 2,016 1,044 972 Jaldega- - - 656 349 307 438 257 181 Sawnajara- - - 216 112 104 137 75 62 Barkitangar55 36 19 199 90 109 182 99 83 Kharwagarha
- - - 349 170 179 244 121 123 Tengratuku65 31 34 1,066 547 519 672 369 303 Dhorhibahar
206 103 103 1,445 709 736 832 495 337 Tingina112 65 47 1,140 555 585 701 393 308 Silanga164 87 77 1,380 693 687 1,164 677 487 Konmerla12 6 6 108 51 57 200 105 95 Dumarbera
- - - 328 151 177 288 149 139 Gagutoli123 58 65 767 377 390 546 318 228 Baldega
Scheduled Castes population Scheduled Tribes populationName of Village
Literates
109

DISTRICT CENSUS HANDBOOK : SIMDEGA
VILLAGE PRIMARYC D Block -
Persons Males Females Persons Males Females Persons Males Females1 2 20 21 22 23 24 25 26 27 28
0231 Jaldega (Total) 29,411 12,361 17,050 29,833 16,940 12,893 15,709 10,709 5,000 0231 Jaldega (Rural) 29,411 12,361 17,050 29,833 16,940 12,893 15,709 10,709 5,000 0231 Jaldega (Urban) - - - - - - - - -
RURAL376674 Pharsa 176 61 115 269 141 128 211 141 70 376675 Anai 198 93 105 220 113 107 203 103 100 376676 Tilmibera 104 31 73 100 52 48 93 50 43 376677 Dumarmunda 316 144 172 236 112 124 80 37 43 376678 Menjurgara 411 160 251 552 264 288 530 251 279 376679 Orga 1,204 499 705 1,169 672 497 926 527 399 376680 Dhelsera 377 163 214 626 322 304 311 171 140 376681 Sarubahar 933 417 516 1,033 531 502 939 480 459 376682 Janoda 198 88 110 221 116 105 39 18 21 376683 Bandosera 277 122 155 390 191 199 16 6 10 376684 Seharmunda 230 98 132 275 133 142 215 113 102 376685 Parba 1,143 488 655 1,343 675 668 255 169 86 376686 Pomian 370 143 227 206 161 45 180 146 34 376687 Lomboi 2,836 1,221 1,615 3,972 2,086 1,886 1,042 762 280 376688 Tikra 802 355 447 631 497 134 424 403 21 376689 Semariya 226 104 122 140 135 5 131 127 4 376690 Bhundupani 188 84 104 206 154 52 200 149 51 376691 Lamdega 790 302 488 948 477 471 392 270 122 376692 Hututua 630 260 370 354 245 109 327 235 92 376693 Lamdega 217 98 119 182 99 83 20 10 10 376694 Bhitbuna 428 177 251 321 172 149 224 131 93 376695 Baraibera 154 61 93 186 97 89 143 84 59 376696 Banjoga 543 221 322 393 231 162 306 209 97 376697 Dhengurpani 331 127 204 306 156 150 302 155 147 376698 Sukhajhariya 153 64 89 161 85 76 8 3 5 376699 Kauwadarha 54 19 35 62 28 34 7 4 3 376700 Lachhanpur 41 19 22 47 21 26 1 1 - 376701 Mangaspur 203 87 116 171 95 76 4 1 3 376702 Dhauraanjan 27 10 17 32 18 14 5 3 2 376703 Ramjari 364 152 212 419 225 194 243 172 71 376704 Kutangia 835 337 498 1,059 544 515 559 331 228 376705 Torian 534 208 326 368 278 90 216 189 27 376706 Tati 382 142 240 293 252 41 273 237 36 376707 Phirka 113 43 70 43 41 2 43 41 2 376708 Barbera 109 36 73 121 61 60 56 54 2 376709 Paitano 498 206 292 336 248 88 334 246 88 376710 Hutubda 232 103 129 383 206 177 16 11 5 376711 Titlingi 124 47 77 223 111 112 66 55 11 376712 Baribiringa 341 131 210 416 204 212 172 141 31 376713 Mayamdega 264 104 160 260 123 137 128 57 71 376714 Turupdega 134 60 74 155 78 77 153 77 76 376715 Kharwagarha 1,123 479 644 977 502 475 820 451 369 376716 Keluga 847 355 492 605 374 231 290 261 29 376717 Tangia 508 229 279 344 221 123 280 196 84 376718 Jaldega 1,145 452 693 1,118 741 377 710 519 191 376719 Sawnajara 350 161 189 288 203 85 229 185 44 376720 Barkitangar 104 49 55 87 74 13 86 73 13 376721 Kharwagarha 101 41 60 77 72 5 77 72 5 376722 Tengratuku 109 51 58 87 81 6 87 81 6 376723 Dhorhibahar 550 252 298 548 342 206 309 279 30 376724 Tingina 965 396 569 941 497 444 623 424 199 376725 Silanga 827 354 473 744 382 362 507 320 187 376726 Konmerla 1,058 443 615 881 572 309 591 452 139 376727 Dumarbera 177 87 90 163 99 64 90 80 10 376728 Gagutoli 123 45 78 102 81 21 99 78 21 376729 Baldega 725 307 418 508 321 187 296 260 36
Illiterates Total workers Main workersName of Village
Location code
number
110

PRIMARY CENSUS ABSTRACT
CENSUS ABSTRACTJaldega
Persons Males Females Persons Males Females PersonsMalesFemales Persons Males Females29 30 31 32 33 34 35 36 37 38 39 40 2
12,410 8,819 3,591 1,381 645 736 420 255 165 1,498 990 508 Jaldega (Total)12,410 8,819 3,591 1,381 645 736 420 255 165 1,498 990 508 Jaldega (Rural)
- - - - - - - - - - - - Jaldega (Urban)RURAL
199 136 63 8 2 6 - - - 4 3 1 Pharsa172 80 92 10 6 4 16 15 1 5 2 3 Anai84 47 37 6 - 6 - - - 3 3 - Tilmibera76 37 39 2 - 2 - - - 2 - 2 Dumarmunda
367 207 160 150 35 115 2 1 1 11 8 3 Menjurgara552 337 215 28 18 10 28 12 16 318 160 158 Orga262 134 128 2 - 2 9 5 4 38 32 6 Dhelsera866 436 430 46 27 19 4 3 1 23 14 9 Sarubahar20 8 12 1 - 1 5 3 2 13 7 6 Janoda
- - - - - - 6 3 3 10 3 7 Bandosera209 109 100 2 1 1 1 1 - 3 2 1 Seharmunda230 151 79 7 3 4 4 4 - 14 11 3 Parba160 135 25 14 8 6 1 1 - 5 2 3 Pomian876 644 232 78 60 18 16 13 3 72 45 27 Lomboi394 382 12 9 8 1 - - - 21 13 8 Tikra127 123 4 2 2 - - - - 2 2 - Semariya193 144 49 2 2 - 1 1 - 4 2 2 Bhundupani326 226 100 8 6 2 18 11 7 40 27 13 Lamdega304 222 82 12 6 6 6 4 2 5 3 2 Hututua11 5 6 - - - 3 2 1 6 3 3 Lamdega
206 121 85 3 3 - 1 - 1 14 7 7 Bhitbuna75 54 21 65 28 37 - - - 3 2 1 Baraibera
298 202 96 - - - 3 3 - 5 4 1 Banjoga235 145 90 60 3 57 - - - 7 7 - Dhengurpani- - - - - - - - - 8 3 5 Sukhajhariya
4 4 - - - - - - - 3 - 3 Kauwadarha- - - - - - - - - 1 1 - Lachhanpur- - - - - - - - - 4 1 3 Mangaspur- - - - - - - - - 5 3 2 Dhauraanjan200 151 49 31 14 17 1 - 1 11 7 4 Ramjari212 178 34 311 134 177 6 1 5 30 18 12 Kutangia186 168 18 - - - 10 6 4 20 15 5 Torian246 212 34 2 2 - - - - 25 23 2 Tati40 40 - 1 - 1 - - - 2 1 1 Phirka51 50 1 1 1 - 1 1 - 3 2 1 Barbera
201 186 15 69 15 54 52 36 16 12 9 3 Paitano8 6 2 1 - 1 - - - 7 5 2 Hutubda
48 44 4 11 7 4 1 1 - 6 3 3 Titlingi143 124 19 21 13 8 - - - 8 4 4 Baribiringa110 46 64 - - - 10 6 4 8 5 3 Mayamdega150 76 74 - - - - - - 3 1 2 Turupdega734 410 324 60 29 31 11 3 8 15 9 6 Kharwagarha257 241 16 2 2 - 24 14 10 7 4 3 Keluga266 188 78 2 1 1 9 5 4 3 2 1 Tangia349 231 118 32 15 17 29 19 10 300 254 46 Jaldega210 178 32 7 1 6 2 2 - 10 4 6 Sawnajara83 72 11 - - - - - - 3 1 2 Barkitangar76 72 4 - - - - - - 1 - 1 Kharwagarha74 73 1 2 2 - - - - 11 6 5 Tengratuku
274 254 20 - - - 20 17 3 15 8 7 Dhorhibahar437 314 123 75 53 22 62 25 37 49 32 17 Tingina464 296 168 30 14 16 1 1 - 12 9 3 Silanga468 375 93 31 16 15 4 4 - 88 57 31 Konmerla58 54 4 2 1 1 2 1 1 28 24 4 Dumarbera32 29 3 35 32 3 - - - 32 17 15 Gagutoli
231 215 16 20 10 10 18 13 5 27 22 5 Baldega
CultivatorsName of Village
Household industry workersAgricultural labourers
Industrial category of main workers
Other workers
111

DISTRICT CENSUS HANDBOOK : SIMDEGA
VILLAGE PRIMARYC D Block -
Persons Males Females Persons Males Females Persons Males Females1 2 41 42 43 44 45 46 47 48 49
0231 Jaldega (Total) 14,124 6,231 7,893 9,201 4,364 4,837 3,991 1,434 2,557 0231 Jaldega (Rural) 14,124 6,231 7,893 9,201 4,364 4,837 3,991 1,434 2,557 0231 Jaldega (Urban) - - - - - - - - -
RURAL376674 Pharsa 58 - 58 27 - 27 31 - 31 376675 Anai 17 10 7 9 4 5 - - - 376676 Tilmibera 7 2 5 4 1 3 1 - 1 376677 Dumarmunda 156 75 81 146 71 75 1 - 1 376678 Menjurgara 22 13 9 11 7 4 5 4 1 376679 Orga 243 145 98 36 17 19 125 86 39 376680 Dhelsera 315 151 164 303 142 161 2 1 1 376681 Sarubahar 94 51 43 25 11 14 22 16 6 376682 Janoda 182 98 84 176 94 82 4 2 2 376683 Bandosera 374 185 189 283 140 143 49 16 33 376684 Seharmunda 60 20 40 56 20 36 4 - 4 376685 Parba 1,088 506 582 935 440 495 140 57 83 376686 Pomian 26 15 11 13 7 6 11 7 4 376687 Lomboi 2,930 1,324 1,606 2,023 953 1,070 880 365 515 376688 Tikra 207 94 113 98 47 51 104 45 59 376689 Semariya 9 8 1 2 2 - 2 1 1 376690 Bhundupani 6 5 1 4 3 1 1 1 - 376691 Lamdega 556 207 349 371 174 197 179 27 152 376692 Hututua 27 10 17 12 6 6 14 4 10 376693 Lamdega 162 89 73 102 54 48 52 30 22 376694 Bhitbuna 97 41 56 42 31 11 14 7 7 376695 Baraibera 43 13 30 10 4 6 26 6 20 376696 Banjoga 87 22 65 67 14 53 15 4 11 376697 Dhengurpani 4 1 3 2 1 1 2 - 2 376698 Sukhajhariya 153 82 71 99 60 39 51 20 31 376699 Kauwadarha 55 24 31 53 23 30 2 1 1 376700 Lachhanpur 46 20 26 46 20 26 - - - 376701 Mangaspur 167 94 73 155 88 67 10 5 5 376702 Dhauraanjan 27 15 12 27 15 12 - - - 376703 Ramjari 176 53 123 27 11 16 146 41 105 376704 Kutangia 500 213 287 138 82 56 340 122 218 376705 Torian 152 89 63 129 72 57 17 15 2 376706 Tati 20 15 5 10 6 4 1 1 - 376707 Phirka - - - - - - - - - 376708 Barbera 65 7 58 61 6 55 - - - 376709 Paitano 2 2 - 1 1 - 1 1 - 376710 Hutubda 367 195 172 312 146 166 49 47 2 376711 Titlingi 157 56 101 77 26 51 80 30 50 376712 Baribiringa 244 63 181 128 34 94 103 27 76 376713 Mayamdega 132 66 66 83 40 43 10 5 5 376714 Turupdega 2 1 1 2 1 1 - - - 376715 Kharwagarha 157 51 106 105 15 90 16 6 10 376716 Keluga 315 113 202 286 107 179 22 4 18 376717 Tangia 64 25 39 15 11 4 45 12 33 376718 Jaldega 408 222 186 193 176 17 157 20 137 376719 Sawnajara 59 18 41 3 - 3 47 17 30 376720 Barkitangar 1 1 - - - - 1 1 - 376721 Kharwagarha - - - - - - - - - 376722 Tengratuku - - - - - - - - - 376723 Dhorhibahar 239 63 176 22 13 9 167 31 136 376724 Tingina 318 73 245 137 20 117 159 41 118 376725 Silanga 237 62 175 140 12 128 63 32 31 376726 Konmerla 290 120 170 51 37 14 201 59 142 376727 Dumarbera 73 19 54 57 9 48 7 5 2 376728 Gagutoli 3 3 - 1 1 - 2 2 - 376729 Baldega 212 61 151 20 11 9 188 46 142
Location code
number Name of VillageMarginal workers Cultivators Agricultural labourers
Industrial category
112

PRIMARY CENSUS ABSTRACT
CENSUS ABSTRACTJaldega
Persons Males Females Persons Males Females Persons Males Females50 51 52 53 54 55 56 57 58 2 1
471 160 311 461 273 188 34,453 15,227 19,226 Jaldega (Total) 0231471 160 311 461 273 188 34,453 15,227 19,226 Jaldega (Rural) 0231- - - - - - - - - Jaldega (Urban) 0231
RURAL- - - - - - 236 103 133 Pharsa 376674
8 6 2 - - - 271 144 127 Anai 376675- - - 2 1 1 140 59 81 Tilmibera 376676
2 - 2 7 4 3 430 232 198 Dumarmunda 3766771 - 1 5 2 3 474 224 250 Menjurgara 376678
21 10 11 61 32 29 1,774 796 978 Orga 3766792 1 1 8 7 1 387 204 183 Dhelsera 376680
33 17 16 14 7 7 975 477 498 Sarubahar 376681- - - 2 2 - 212 108 104 Janoda 376682- - - 42 29 13 170 89 81 Bandosera 376683- - - - - - 168 84 84 Seharmunda 376684
2 1 1 11 8 3 635 331 304 Parba 3766851 1 - 1 - 1 526 205 321 Pomian 376686
18 3 15 9 3 6 3,331 1,610 1,721 Lomboi 3766874 1 3 1 1 - 1,004 332 672 Tikra 376688
- - - 5 5 - 377 134 243 Semariya 376689- - - 1 1 - 362 135 227 Bhundupani 376690- - - 6 6 - 951 460 491 Lamdega 376691- - - 1 - 1 702 271 431 Hututua 376692
4 1 3 4 4 - 237 126 111 Lamdega 37669337 1 36 4 2 2 501 228 273 Bhitbuna 3766941 1 - 6 2 4 160 73 87 Baraibera 3766954 4 - 1 - 1 501 211 290 Banjoga 376696
- - - - - - 332 154 178 Dhengurpani 376697- - - 3 2 1 151 65 86 Sukhajhariya 376698- - - - - - 46 18 28 Kauwadarha 376699- - - - - - 28 16 12 Lachhanpur 376700
2 1 1 - - - 149 75 74 Mangaspur 376701- - - - - - 31 13 18 Dhauraanjan 376702- - - 3 1 2 394 184 210 Ramjari 37670314 3 11 8 6 2 886 413 473 Kutangia 3767042 - 2 4 2 2 1,013 428 585 Torian 3767053 3 - 6 5 1 750 269 481 Tati 376706
- - - - - - 136 43 93 Phirka 376707- - - 4 1 3 171 85 86 Barbera 376708- - - - - - 612 219 393 Paitano 376709- - - 6 2 4 275 140 135 Hutubda 376710- - - - - - 176 86 90 Titlingi 376711
9 - 9 4 2 2 291 141 150 Baribiringa 37671235 19 16 4 2 2 254 115 139 Mayamdega 376713
- - - - - - 121 54 67 Turupdega 37671422 21 1 14 9 5 1,020 513 507 Kharwagarha 3767154 1 3 3 1 2 909 376 533 Keluga 376716
- - - 4 2 2 585 233 352 Tangia 37671717 6 11 41 20 21 2,043 755 1,288 Jaldega 3767182 - 2 7 1 6 500 215 285 Sawnajara 376719
- - - - - - 154 50 104 Barkitangar 376720- - - - - - 206 68 138 Kharwagarha 376721- - - - - - 266 91 175 Tengratuku 37672242 15 27 8 4 4 674 279 395 Dhorhibahar 37672317 7 10 5 5 - 856 394 462 Tingina 37672424 12 12 10 6 4 784 365 419 Silanga 37672515 5 10 23 19 4 1,341 548 793 Konmerla 376726
- - - 9 5 4 214 93 121 Dumarbera 376727- - - - - - 309 113 196 Gagutoli 376728- - - 4 4 - 763 304 459 Baldega 376729
Non-workers
of marginal workersLocation
code number
Household industry workersName of Village
Other workers
113
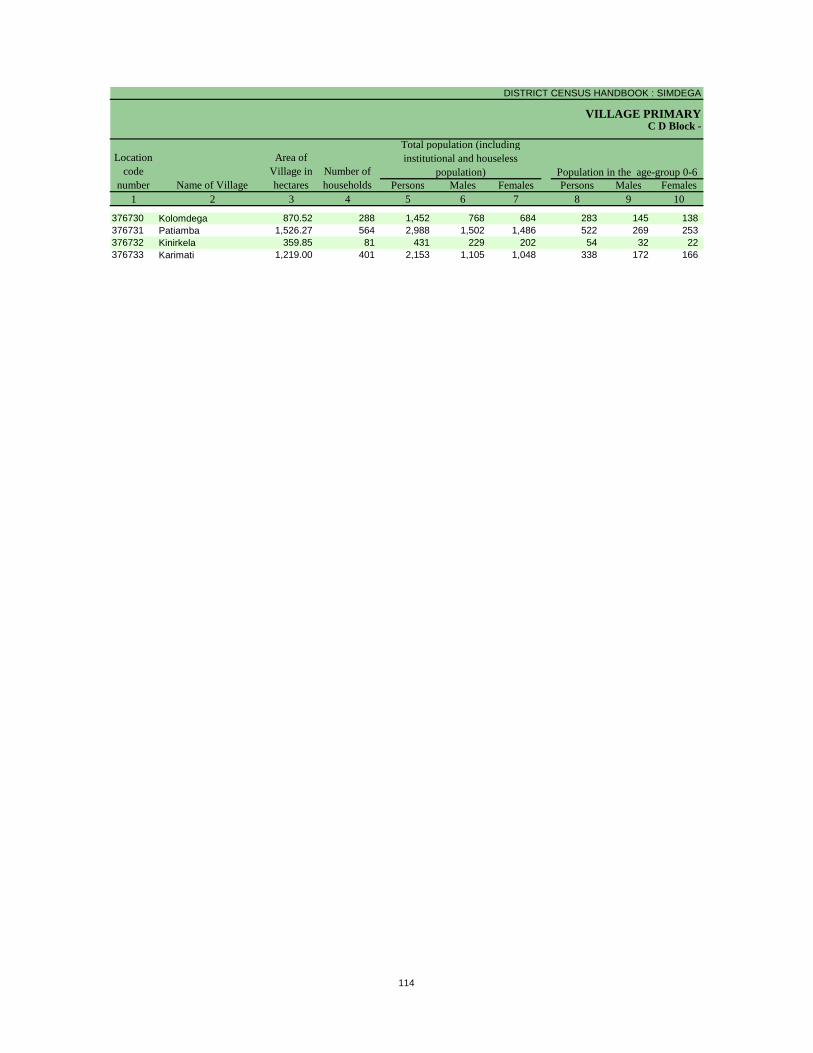
DISTRICT CENSUS HANDBOOK : SIMDEGA
VILLAGE PRIMARY
Persons Males Females Persons Males Females1 2 3 4 5 6 7 8 9 10
C D Block -
Population in the age-group 0-6Name of Village
Location code
number
Total population (including institutional and houseless
population)Area of
Village in hectares
Number of households
376730 Kolomdega 870.52 288 1,452 768 684 283 145 138 376731 Patiamba 1,526.27 564 2,988 1,502 1,486 522 269 253 376732 Kinirkela 359.85 81 431 229 202 54 32 22 376733 Karimati 1,219.00 401 2,153 1,105 1,048 338 172 166
114
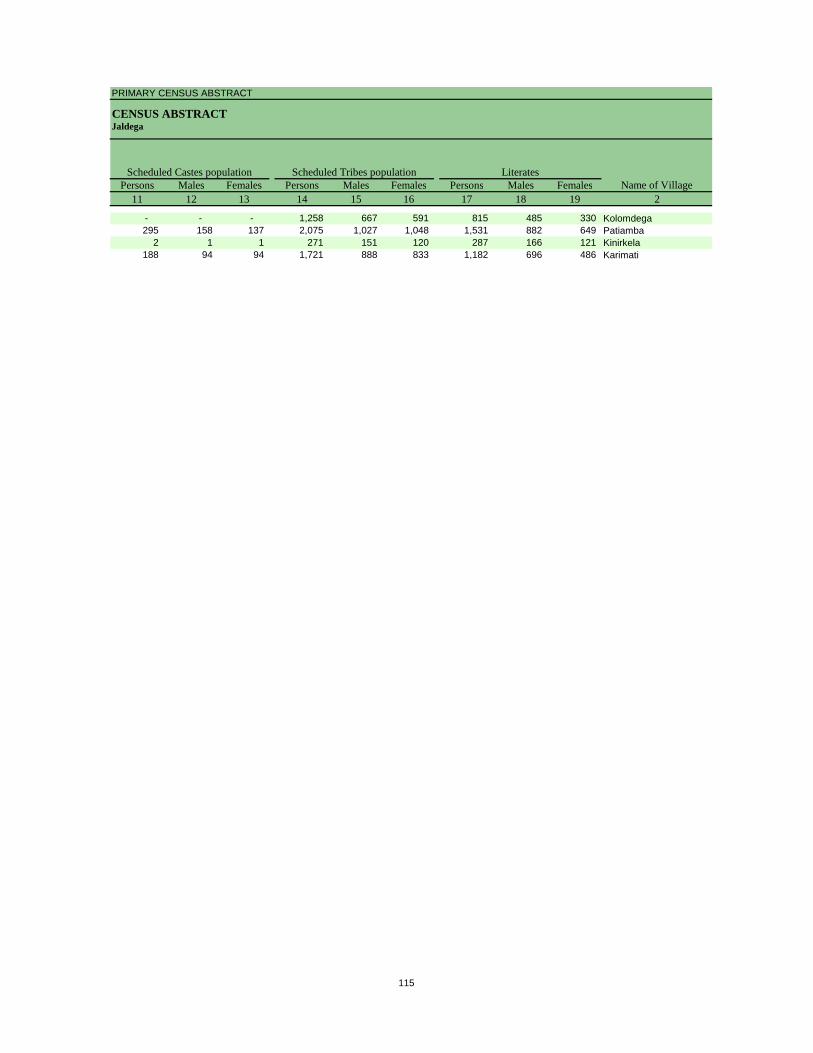
PRIMARY CENSUS ABSTRACT
CENSUS ABSTRACTJaldega
Persons Males Females Persons Males Females Persons Males Females11 12 13 14 15 16 17 18 19 2
Scheduled Castes population Scheduled Tribes populationName of Village
Literates
- - - 1,258 667 591 815 485 330 Kolomdega295 158 137 2,075 1,027 1,048 1,531 882 649 Patiamba
2 1 1 271 151 120 287 166 121 Kinirkela188 94 94 1,721 888 833 1,182 696 486 Karimati
115
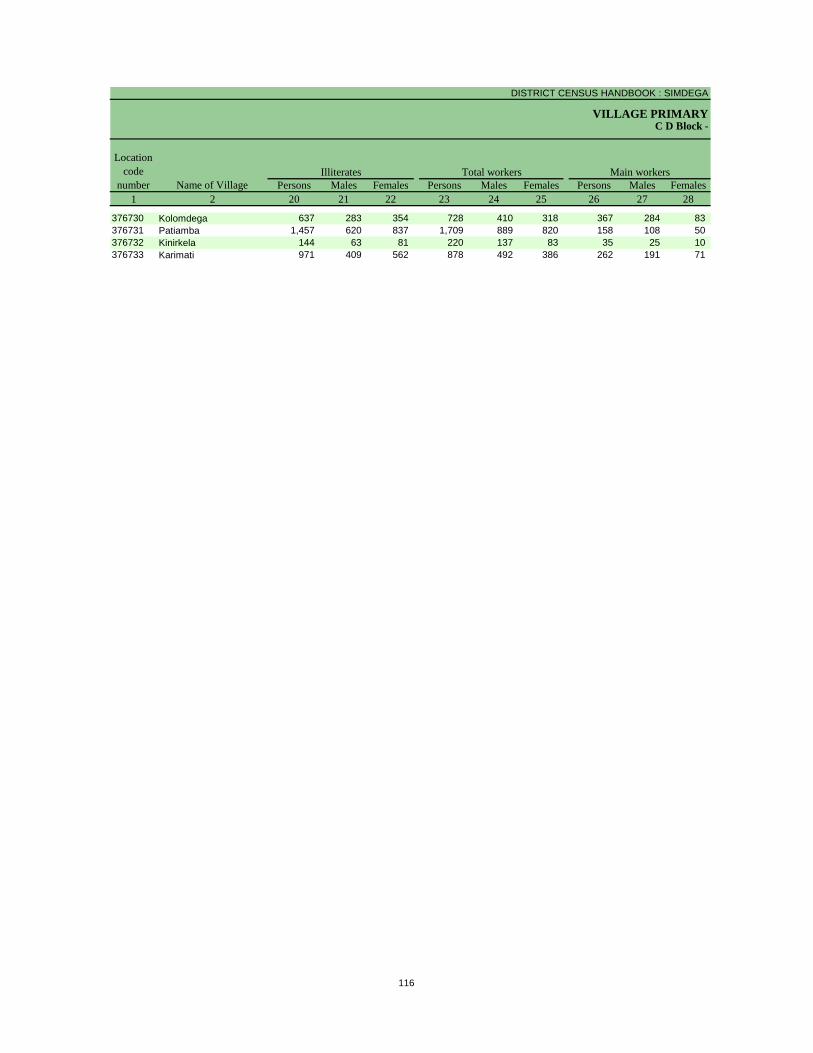
DISTRICT CENSUS HANDBOOK : SIMDEGA
VILLAGE PRIMARYC D Block -
Persons Males Females Persons Males Females Persons Males Females1 2 20 21 22 23 24 25 26 27 28
Illiterates Total workers Main workersName of Village
Location code
number
376730 Kolomdega 637 283 354 728 410 318 367 284 83 376731 Patiamba 1,457 620 837 1,709 889 820 158 108 50 376732 Kinirkela 144 63 81 220 137 83 35 25 10 376733 Karimati 971 409 562 878 492 386 262 191 71
116
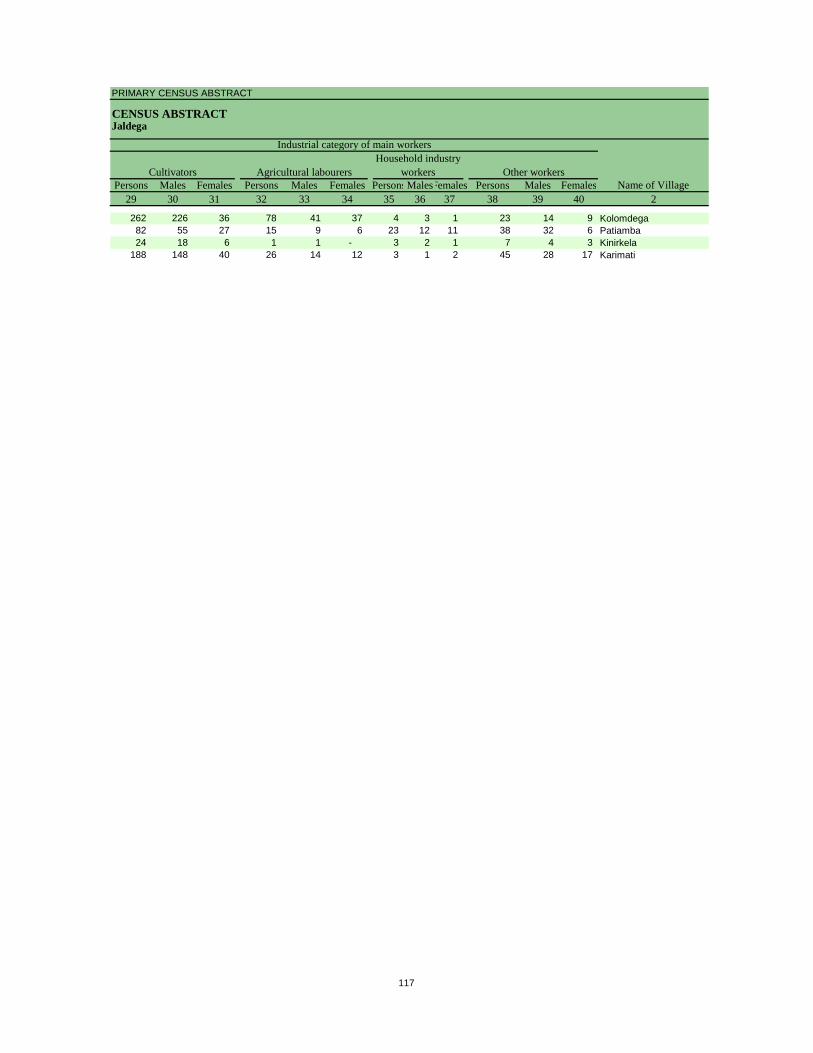
PRIMARY CENSUS ABSTRACT
CENSUS ABSTRACTJaldega
Persons Males Females Persons Males Females PersonsMalesFemales Persons Males Females29 30 31 32 33 34 35 36 37 38 39 40 2
CultivatorsName of Village
Household industry workersAgricultural labourers
Industrial category of main workers
Other workers
262 226 36 78 41 37 4 3 1 23 14 9 Kolomdega82 55 27 15 9 6 23 12 11 38 32 6 Patiamba24 18 6 1 1 - 3 2 1 7 4 3 Kinirkela
188 148 40 26 14 12 3 1 2 45 28 17 Karimati
117

DISTRICT CENSUS HANDBOOK : SIMDEGA
VILLAGE PRIMARYC D Block -
Persons Males Females Persons Males Females Persons Males Females1 2 41 42 43 44 45 46 47 48 49
Location code
number Name of VillageMarginal workers Cultivators Agricultural labourers
Industrial category
376730 Kolomdega 361 126 235 230 101 129 124 20 104 376731 Patiamba 1,551 781 770 1,204 653 551 157 73 84 376732 Kinirkela 185 112 73 176 106 70 7 5 2 376733 Karimati 616 301 315 456 218 238 134 66 68
118

PRIMARY CENSUS ABSTRACT
CENSUS ABSTRACTJaldega
Persons Males Females Persons Males Females Persons Males Females50 51 52 53 54 55 56 57 58 2 1
Non-workers
of marginal workersLocation
code number
Household industry workersName of Village
Other workers
- - - 7 5 2 724 358 366 Kolomdega 376730123 18 105 67 37 30 1,279 613 666 Patiamba 376731
1 1 - 1 - 1 211 92 119 Kinirkela 3767321 1 - 25 16 9 1,275 613 662 Karimati 376733
119
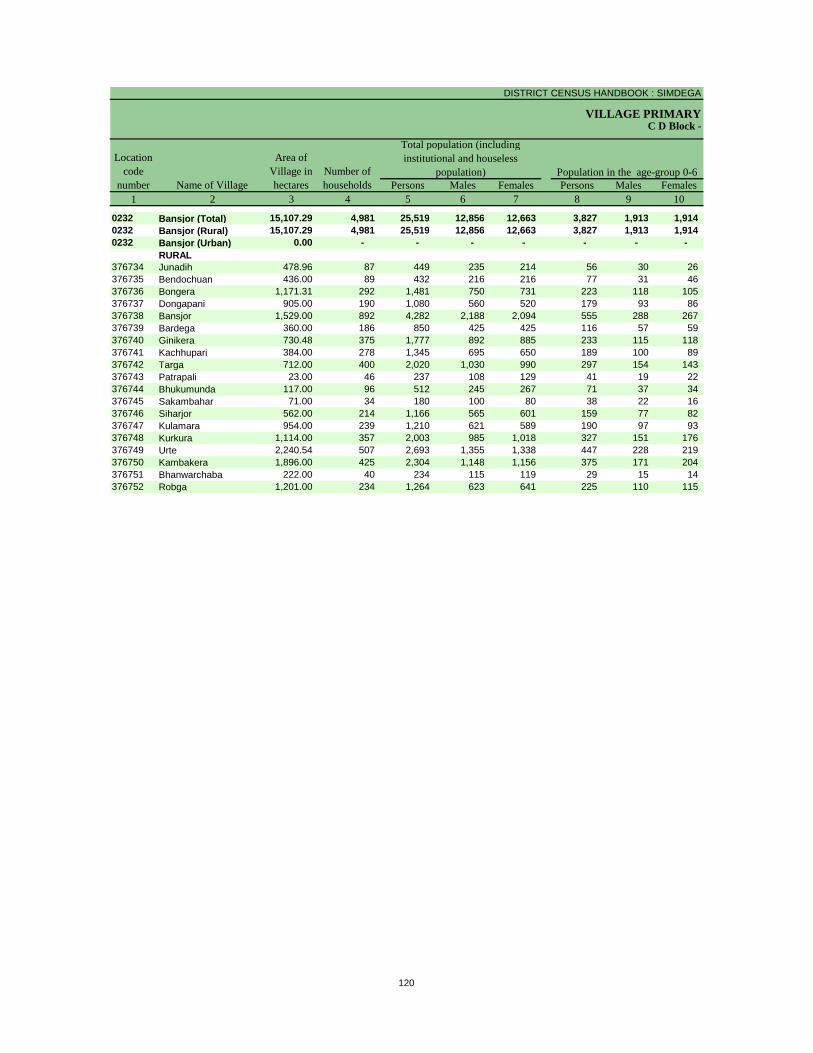
DISTRICT CENSUS HANDBOOK : SIMDEGA
VILLAGE PRIMARY
Persons Males Females Persons Males Females1 2 3 4 5 6 7 8 9 10
0232 Bansjor (Total) 15,107.29 4,981 25,519 12,856 12,663 3,827 1,913 1,914 0232 Bansjor (Rural) 15,107.29 4,981 25,519 12,856 12,663 3,827 1,913 1,914 0232 Bansjor (Urban) 0.00 - - - - - - -
RURAL376734 Junadih 478.96 87 449 235 214 56 30 26 376735 Bendochuan 436.00 89 432 216 216 77 31 46 376736 Bongera 1,171.31 292 1,481 750 731 223 118 105 376737 Dongapani 905.00 190 1,080 560 520 179 93 86 376738 Bansjor 1,529.00 892 4,282 2,188 2,094 555 288 267 376739 Bardega 360.00 186 850 425 425 116 57 59 376740 Ginikera 730.48 375 1,777 892 885 233 115 118 376741 Kachhupari 384.00 278 1,345 695 650 189 100 89 376742 Targa 712.00 400 2,020 1,030 990 297 154 143 376743 Patrapali 23.00 46 237 108 129 41 19 22 376744 Bhukumunda 117.00 96 512 245 267 71 37 34 376745 Sakambahar 71.00 34 180 100 80 38 22 16 376746 Siharjor 562.00 214 1,166 565 601 159 77 82 376747 Kulamara 954.00 239 1,210 621 589 190 97 93 376748 Kurkura 1,114.00 357 2,003 985 1,018 327 151 176 376749 Urte 2,240.54 507 2,693 1,355 1,338 447 228 219 376750 Kambakera 1,896.00 425 2,304 1,148 1,156 375 171 204 376751 Bhanwarchaba 222.00 40 234 115 119 29 15 14 376752 Robga 1,201.00 234 1,264 623 641 225 110 115
C D Block -
Population in the age-group 0-6Name of Village
Location code
number
Total population (including institutional and houseless
population)Area of
Village in hectares
Number of households
120

PRIMARY CENSUS ABSTRACT
CENSUS ABSTRACTBansjor
Persons Males Females Persons Males Females Persons Males Females11 12 13 14 15 16 17 18 19 2
886 414 472 21,840 10,999 10,841 13,334 7,726 5,608 Bansjor (Total)886 414 472 21,840 10,999 10,841 13,334 7,726 5,608 Bansjor (Rural)- - - - - - - - - Bansjor (Urban)
RURAL- - - 432 227 205 263 164 99 Junadih30 13 17 400 201 199 236 139 97 Bendochuan12 5 7 1,286 657 629 773 439 334 Bongera
- - - 1,048 545 503 454 288 166 Dongapani96 52 44 3,781 1,914 1,867 2,292 1,336 956 Bansjor
- - - 841 423 418 454 259 195 Bardega1 1 - 1,481 728 753 1,052 604 448 Ginikera
- - - 721 366 355 688 409 279 Kachhupari103 47 56 1,436 736 700 999 615 384 Targa181 85 96 36 16 20 112 59 53 Patrapali- - - 510 244 266 271 139 132 Bhukumunda- - - 179 99 80 85 58 27 Sakambahar- - - 1,165 564 601 704 367 337 Siharjor44 21 23 1,061 548 513 570 341 229 Kulamara
419 190 229 1,289 655 634 903 536 367 Kurkura- - - 2,620 1,314 1,306 1,403 793 610 Urte- - - 2,074 1,037 1,037 1,375 758 617 Kambakera- - - 217 103 114 118 67 51 Bhanwarchaba- - - 1,263 622 641 582 355 227 Robga
Scheduled Castes population Scheduled Tribes populationName of Village
Literates
121

DISTRICT CENSUS HANDBOOK : SIMDEGA
VILLAGE PRIMARYC D Block -
Persons Males Females Persons Males Females Persons Males Females1 2 20 21 22 23 24 25 26 27 28
0232 Bansjor (Total) 12,185 5,130 7,055 12,425 7,158 5,267 10,470 6,446 4,024 0232 Bansjor (Rural) 12,185 5,130 7,055 12,425 7,158 5,267 10,470 6,446 4,024 0232 Bansjor (Urban) - - - - - - - - -
RURAL376734 Junadih 186 71 115 249 134 115 227 121 106 376735 Bendochuan 196 77 119 216 112 104 209 108 101 376736 Bongera 708 311 397 777 404 373 721 372 349 376737 Dongapani 626 272 354 590 310 280 535 280 255 376738 Bansjor 1,990 852 1,138 2,112 1,250 862 1,470 1,017 453 376739 Bardega 396 166 230 412 257 155 318 219 99 376740 Ginikera 725 288 437 801 488 313 680 420 260 376741 Kachhupari 657 286 371 696 401 295 583 372 211 376742 Targa 1,021 415 606 734 567 167 614 505 109 376743 Patrapali 125 49 76 84 55 29 62 53 9 376744 Bhukumunda 241 106 135 213 131 82 210 130 80 376745 Sakambahar 95 42 53 85 51 34 51 49 2 376746 Siharjor 462 198 264 667 359 308 466 328 138 376747 Kulamara 640 280 360 621 348 273 554 319 235 376748 Kurkura 1,100 449 651 843 507 336 696 492 204 376749 Urte 1,290 562 728 1,197 680 517 1,015 591 424 376750 Kambakera 929 390 539 1,328 695 633 1,286 671 615 376751 Bhanwarchaba 116 48 68 113 64 49 113 64 49 376752 Robga 682 268 414 687 345 342 660 335 325
Illiterates Total workers Main workersName of Village
Location code
number
122

PRIMARY CENSUS ABSTRACT
CENSUS ABSTRACTBansjor
Persons Males Females Persons Males Females PersonsMalesFemales Persons Males Females29 30 31 32 33 34 35 36 37 38 39 40 2
8,654 5,244 3,410 698 376 322 197 125 72 921 701 220 Bansjor (Total)8,654 5,244 3,410 698 376 322 197 125 72 921 701 220 Bansjor (Rural)
- - - - - - - - - - - - Bansjor (Urban)RURAL
216 114 102 - - - 4 2 2 7 5 2 Junadih197 99 98 2 1 1 1 1 - 9 7 2 Bendochuan688 349 339 8 5 3 3 3 - 22 15 7 Bongera517 270 247 5 4 1 5 3 2 8 3 5 Dongapani985 645 340 113 68 45 20 8 12 352 296 56 Bansjor200 131 69 16 10 6 3 3 - 99 75 24 Bardega381 258 123 131 52 79 46 24 22 122 86 36 Ginikera481 305 176 14 6 8 31 17 14 57 44 13 Kachhupari499 418 81 91 68 23 - - - 24 19 5 Targa
7 7 - 9 4 5 1 1 - 45 41 4 Patrapali112 67 45 82 52 30 - - - 16 11 5 Bhukumunda39 39 - 5 3 2 2 2 - 5 5 - Sakambahar
449 320 129 2 1 1 2 1 1 13 6 7 Siharjor482 271 211 11 8 3 17 9 8 44 31 13 Kulamara469 362 107 178 87 91 37 34 3 12 9 3 Kurkura936 545 391 2 1 1 21 14 7 56 31 25 Urte
1,269 662 607 6 1 5 - - - 11 8 3 Kambakera105 59 46 - - - 4 3 1 4 2 2 Bhanwarchaba622 323 299 23 5 18 - - - 15 7 8 Robga
CultivatorsName of Village
Household industry workersAgricultural labourers
Industrial category of main workers
Other workers
123

DISTRICT CENSUS HANDBOOK : SIMDEGA
VILLAGE PRIMARYC D Block -
Persons Males Females Persons Males Females Persons Males Females1 2 41 42 43 44 45 46 47 48 49
0232 Bansjor (Total) 1,955 712 1,243 901 253 648 651 254 397 0232 Bansjor (Rural) 1,955 712 1,243 901 253 648 651 254 397 0232 Bansjor (Urban) - - - - - - - - -
RURAL376734 Junadih 22 13 9 22 13 9 - - - 376735 Bendochuan 7 4 3 4 2 2 - - - 376736 Bongera 56 32 24 45 24 21 5 3 2 376737 Dongapani 55 30 25 49 26 23 2 2 - 376738 Bansjor 642 233 409 114 26 88 307 128 179 376739 Bardega 94 38 56 71 21 50 7 4 3 376740 Ginikera 121 68 53 51 30 21 48 25 23 376741 Kachhupari 113 29 84 92 13 79 6 5 1 376742 Targa 120 62 58 1 1 - 100 45 55 376743 Patrapali 22 2 20 8 1 7 14 1 13 376744 Bhukumunda 3 1 2 - - - 3 1 2 376745 Sakambahar 34 2 32 28 - 28 6 2 4 376746 Siharjor 201 31 170 199 31 168 1 - 1 376747 Kulamara 67 29 38 9 4 5 42 13 29 376748 Kurkura 147 15 132 99 8 91 47 6 41 376749 Urte 182 89 93 67 33 34 45 10 35 376750 Kambakera 42 24 18 29 16 13 8 4 4 376751 Bhanwarchaba - - - - - - - - - 376752 Robga 27 10 17 13 4 9 10 5 5
Location code
number Name of VillageMarginal workers Cultivators Agricultural labourers
Industrial category
124

PRIMARY CENSUS ABSTRACT
CENSUS ABSTRACTBansjor
Persons Males Females Persons Males Females Persons Males Females50 51 52 53 54 55 56 57 58 2 1
158 30 128 245 175 70 13,094 5,698 7,396 Bansjor (Total) 0232158 30 128 245 175 70 13,094 5,698 7,396 Bansjor (Rural) 0232- - - - - - - - - Bansjor (Urban) 0232
RURAL- - - - - - 200 101 99 Junadih 376734
1 1 - 2 1 1 216 104 112 Bendochuan 3767351 - 1 5 5 - 704 346 358 Bongera 3767361 1 - 3 1 2 490 250 240 Dongapani 376737
118 7 111 103 72 31 2,170 938 1,232 Bansjor 376738- - - 16 13 3 438 168 270 Bardega 376739
4 3 1 18 10 8 976 404 572 Ginikera 3767401 1 - 14 10 4 649 294 355 Kachhupari 3767412 2 - 17 14 3 1,286 463 823 Targa 376742
- - - - - - 153 53 100 Patrapali 376743- - - - - - 299 114 185 Bhukumunda 376744- - - - - - 95 49 46 Sakambahar 376745- - - 1 - 1 499 206 293 Siharjor 376746
3 3 - 13 9 4 589 273 316 Kulamara 3767471 1 - - - - 1,160 478 682 Kurkura 376748
25 10 15 45 36 9 1,496 675 821 Urte 3767491 1 - 4 3 1 976 453 523 Kambakera 376750
- - - - - - 121 51 70 Bhanwarchaba 376751- - - 4 1 3 577 278 299 Robga 376752
Non-workers
of marginal workersLocation
code number
Household industry workersName of Village
Other workers
125

DISTRICT CENSUS HANDBOOK : SIMDEGA
VILLAGE PRIMARY
Persons Males Females Persons Males Females1 2 3 4 5 6 7 8 9 10
0233 Bano (Total) 54,982.39 16,236 80,462 39,855 40,607 13,376 6,729 6,647 0233 Bano (Rural) 54,982.39 16,236 80,462 39,855 40,607 13,376 6,729 6,647 0233 Bano (Urban) 0.00 - - - - - - -
RURAL376753 Jorponda 466.47 167 905 434 471 174 86 88 376754 Kohipat 226.03 93 457 240 217 69 34 35 376755 Jorobari 679.64 235 1,227 595 632 184 75 109 376756 Biruli 365.00 97 425 202 223 85 47 38 376757 Kenwgutu 356.88 102 529 256 273 90 49 41 376758 Hurda 373.00 251 1,077 578 499 154 84 70 376759 Jamtai 653.12 227 1,129 559 570 178 84 94 376760 Marani 323.00 155 657 319 338 115 57 58 376761 Raikera 2,060.00 577 2,789 1,333 1,456 392 202 190 376762 Tembro 411.00 71 323 166 157 41 21 20 376763 Kanta 211.00 64 306 151 155 56 23 33 376764 Chandsay 512.69 146 662 322 340 138 68 70 376765 Gerda 654.48 295 1,519 766 753 236 129 107 376766 Genmer 605.24 300 1,563 790 773 234 125 109 376767 Khijurbahar 173.00 49 237 117 120 31 18 13 376768 Toneya 897.60 195 945 456 489 171 73 98 376769 Karkata 296.78 66 350 195 155 67 36 31 376770 Jamur Soiya 684.78 105 606 295 311 115 61 54 376771 Pangur 852.78 171 845 411 434 138 68 70 376772 Marikel 354.00 36 185 89 96 22 8 14 376773 Saubera 1,100.54 351 1,666 835 831 279 138 141 376774 Hurpi 356.58 123 657 348 309 142 80 62 376775 Hatinghore 552.00 278 1,367 711 656 229 121 108 376776 Dumbariya 2,064.62 502 2,608 1,318 1,290 460 236 224 376777 Sotasoya 448.00 98 498 232 266 106 53 53 376778 Urmu 693.00 113 652 317 335 127 64 63 376779 Konop 338.62 71 314 157 157 39 19 20 376780 Garra 264.00 79 435 229 206 76 45 31 376781 Pohshar 549.00 128 590 282 308 102 43 59 376782 Hatnahdah 326.00 90 471 237 234 76 36 40 376783 Latakel 465.00 187 916 466 450 149 83 66 376784 Konaroia 322.00 142 664 328 336 98 48 50 376785 Paro 835.00 340 1,686 815 871 315 151 164 376786 Loasokra 781.28 160 769 384 385 156 68 88 376787 Chhotkaduil 258.00 47 259 131 128 42 17 25 376788 Barkaduil 480.73 162 918 459 459 170 88 82 376789 Bingora 219.60 37 196 100 96 24 14 10 376790 Lamgarh 594.00 136 633 300 333 93 38 55 376791 Maimsar 137.87 60 273 144 129 59 34 25 376792 Barerpa 86.00 34 154 77 77 40 17 23 376793 Kudrung 164.00 41 220 101 119 39 21 18 376794 Sikrom 162.00 47 226 121 105 43 24 19 376795 Bintuka 718.41 173 850 444 406 136 74 62 376796 Nawagaon 295.43 95 473 225 248 82 37 45 376797 Kusum 235.00 68 413 218 195 89 47 42 376798 Nimtur 337.00 124 632 304 328 131 68 63 376799 Kebetang 227.00 65 327 165 162 65 32 33 376800 Turuyu 499.00 108 557 272 285 66 34 32 376801 Barumda 442.91 70 311 148 163 60 31 29 376802 Bamulda 763.00 241 1,121 563 558 202 102 100 376803 Konaroa 1,686.00 588 2,979 1,482 1,497 521 267 254 376804 Jarakel 976.00 369 1,977 894 1,083 328 157 171 376805 Pabura 552.00 244 1,201 598 603 194 97 97 376806 Jamang 257.90 88 460 223 237 88 38 50 376807 Kenduda 207.00 55 293 155 138 45 26 19 376808 Chatuora 192.66 67 307 161 146 39 19 20
C D Block -
Population in the age-group 0-6Name of Village
Location code
number
Total population (including institutional and houseless
population)Area of
Village in hectares
Number of households
126

PRIMARY CENSUS ABSTRACT
CENSUS ABSTRACTBano
Persons Males Females Persons Males Females Persons Males Females11 12 13 14 15 16 17 18 19 2
6,023 2,893 3,130 50,816 25,243 25,573 42,551 24,600 17,951 Bano (Total)6,023 2,893 3,130 50,816 25,243 25,573 42,551 24,600 17,951 Bano (Rural)
- - - - - - - - - Bano (Urban)RURAL
248 121 127 244 112 132 431 260 171 Jorponda- - - 210 122 88 276 179 97 Kohipat77 38 39 832 395 437 661 376 285 Jorobari
239 108 131 80 43 37 153 96 57 Biruli312 150 162 172 86 86 281 165 116 Kenwgutu52 25 27 281 157 124 635 395 240 Hurda29 10 19 769 389 380 670 373 297 Jamtai
125 67 58 177 82 95 314 176 138 Marani392 178 214 1,310 645 665 1,394 797 597 Raikera- - - 198 104 94 206 124 82 Tembro78 40 38 227 110 117 160 94 66 Kanta66 30 36 472 232 240 197 124 73 Chandsay
333 157 176 256 134 122 662 401 261 Gerda- - - 998 503 495 671 423 248 Genmer- - - 109 54 55 126 67 59 Khijurbahar284 125 159 410 214 196 438 264 174 Toneya
6 4 2 163 89 74 164 115 49 Karkata2 - 2 445 212 233 318 173 145 Jamur Soiya
- - - 371 184 187 395 238 157 Pangur- - - 121 60 61 93 63 30 Marikel- - - 1,151 569 582 802 477 325 Saubera- - - 398 216 182 363 217 146 Hurpi67 31 36 589 335 254 744 460 284 Hatinghore17 10 7 1,696 858 838 1,132 684 448 Dumbariya
- - - 365 167 198 218 120 98 Sotasoya- - - 546 270 276 317 182 135 Urmu- - - 286 143 143 165 95 70 Konop
5 1 4 424 224 200 249 150 99 Garra- - - 301 135 166 299 186 113 Pohshar17 7 10 428 219 209 281 164 117 Hatnahdah
- - - 634 320 314 533 309 224 Latakel- - - 456 225 231 373 222 151 Konaroia101 48 53 933 459 474 815 481 334 Paro- - - 677 340 337 302 197 105 Loasokra- - - 129 67 62 140 89 51 Chhotkaduil- - - 424 208 216 393 245 148 Barkaduil- - - 101 51 50 122 70 52 Bingora
8 4 4 287 135 152 337 192 145 Lamgarh- - - 95 48 47 113 76 37 Maimsar16 8 8 56 25 31 45 35 10 Barerpa
- - - 79 36 43 111 59 52 Kudrung- - - 133 75 58 128 77 51 Sikrom- - - 588 307 281 394 253 141 Bintuka- - - 342 166 176 199 117 82 Nawagaon31 14 17 375 200 175 214 129 85 Kusum
- - - 170 80 90 295 163 132 Nimtur- - - 240 123 117 159 93 66 Kebetang50 23 27 320 153 167 340 195 145 Turuyu85 44 41 225 104 121 169 86 83 Barumda
118 61 57 830 419 411 549 323 226 Bamulda206 102 104 2,467 1,224 1,243 1,615 918 697 Konaroa15 - 15 1,591 755 836 1,025 527 498 Jarakel
216 107 109 820 411 409 656 385 271 Pabura126 59 67 333 163 170 271 155 116 Jamang19 9 10 197 105 92 208 119 89 Kenduda
- - - 13 4 9 158 100 58 Chatuora
Scheduled Castes population Scheduled Tribes populationName of Village
Literates
127

DISTRICT CENSUS HANDBOOK : SIMDEGA
VILLAGE PRIMARYC D Block -
Persons Males Females Persons Males Females Persons Males Females1 2 20 21 22 23 24 25 26 27 28
0233 Bano (Total) 37,911 15,255 22,656 41,464 21,947 19,517 23,102 15,660 7,442 0233 Bano (Rural) 37,911 15,255 22,656 41,464 21,947 19,517 23,102 15,660 7,442 0233 Bano (Urban) - - - - - - - - -
RURAL376753 Jorponda 474 174 300 273 215 58 236 196 40 376754 Kohipat 181 61 120 150 129 21 133 119 14 376755 Jorobari 566 219 347 576 345 231 238 200 38 376756 Biruli 272 106 166 217 91 126 171 85 86 376757 Kenwgutu 248 91 157 347 161 186 145 129 16 376758 Hurda 442 183 259 558 316 242 343 278 65 376759 Jamtai 459 186 273 681 350 331 404 273 131 376760 Marani 343 143 200 360 170 190 137 133 4 376761 Raikera 1,395 536 859 1,744 841 903 918 639 279 376762 Tembro 117 42 75 200 100 100 180 92 88 376763 Kanta 146 57 89 137 83 54 111 74 37 376764 Chandsay 465 198 267 331 185 146 198 161 37 376765 Gerda 857 365 492 750 405 345 524 367 157 376766 Genmer 892 367 525 927 469 458 291 238 53 376767 Khijurbahar 111 50 61 162 81 81 103 60 43 376768 Toneya 507 192 315 499 241 258 218 200 18 376769 Karkata 186 80 106 88 81 7 79 72 7 376770 Jamur Soiya 288 122 166 180 138 42 155 120 35 376771 Pangur 450 173 277 359 229 130 216 204 12 376772 Marikel 92 26 66 103 53 50 76 52 24 376773 Saubera 864 358 506 966 488 478 385 285 100 376774 Hurpi 294 131 163 290 158 132 140 104 36 376775 Hatinghore 623 251 372 687 340 347 317 185 132 376776 Dumbariya 1,476 634 842 1,407 712 695 1,053 671 382 376777 Sotasoya 280 112 168 356 167 189 128 112 16 376778 Urmu 335 135 200 332 172 160 36 21 15 376779 Konop 149 62 87 184 90 94 89 87 2 376780 Garra 186 79 107 207 109 98 21 12 9 376781 Pohshar 291 96 195 375 185 190 124 78 46 376782 Hatnahdah 190 73 117 262 143 119 177 125 52 376783 Latakel 383 157 226 425 232 193 254 168 86 376784 Konaroia 291 106 185 395 205 190 323 200 123 376785 Paro 871 334 537 792 436 356 369 233 136 376786 Loasokra 467 187 280 439 237 202 146 74 72 376787 Chhotkaduil 119 42 77 190 100 90 98 50 48 376788 Barkaduil 525 214 311 479 238 241 78 41 37 376789 Bingora 74 30 44 101 54 47 65 39 26 376790 Lamgarh 296 108 188 345 163 182 344 162 182 376791 Maimsar 160 68 92 153 79 74 53 49 4 376792 Barerpa 109 42 67 93 46 47 30 28 2 376793 Kudrung 109 42 67 124 58 66 102 58 44 376794 Sikrom 98 44 54 129 66 63 75 59 16 376795 Bintuka 456 191 265 393 202 191 371 192 179 376796 Nawagaon 274 108 166 250 125 125 193 123 70 376797 Kusum 199 89 110 204 104 100 55 29 26 376798 Nimtur 337 141 196 280 135 145 203 127 76 376799 Kebetang 168 72 96 167 86 81 148 72 76 376800 Turuyu 217 77 140 279 143 136 176 111 65 376801 Barumda 142 62 80 188 91 97 78 65 13 376802 Bamulda 572 240 332 633 319 314 335 243 92 376803 Konaroa 1,364 564 800 1,794 898 896 284 216 68 376804 Jarakel 952 367 585 1,001 510 491 530 372 158 376805 Pabura 545 213 332 670 338 332 487 325 162 376806 Jamang 189 68 121 121 112 9 117 110 7 376807 Kenduda 85 36 49 83 71 12 82 70 12 376808 Chatuora 149 61 88 159 81 78 87 77 10
Illiterates Total workers Main workersName of Village
Location code
number
128

PRIMARY CENSUS ABSTRACT
CENSUS ABSTRACTBano
Persons Males Females Persons Males Females PersonsMalesFemales Persons Males Females29 30 31 32 33 34 35 36 37 38 39 40 2
12,339 9,322 3,017 7,869 4,390 3,479 665 423 242 2,229 1,525 704 Bano (Total)12,339 9,322 3,017 7,869 4,390 3,479 665 423 242 2,229 1,525 704 Bano (Rural)
- - - - - - - - - - - - Bano (Urban)RURAL
153 149 4 69 39 30 1 1 - 13 7 6 Jorponda125 113 12 2 2 - - - - 6 4 2 Kohipat205 176 29 23 19 4 7 2 5 3 3 - Jorobari154 78 76 9 - 9 - - - 8 7 1 Biruli133 123 10 - - - - - - 12 6 6 Kenwgutu104 87 17 115 95 20 25 18 7 99 78 21 Hurda365 249 116 27 17 10 2 2 - 10 5 5 Jamtai128 128 - 4 4 - - - - 5 1 4 Marani755 531 224 89 58 31 23 19 4 51 31 20 Raikera166 85 81 4 2 2 - - - 10 5 5 Tembro100 68 32 3 2 1 - - - 8 4 4 Kanta129 124 5 55 30 25 12 7 5 2 - 2 Chandsay439 317 122 66 32 34 7 7 - 12 11 1 Gerda249 206 43 11 11 - 4 4 - 27 17 10 Genmer15 13 2 85 46 39 - - - 3 1 2 Khijurbahar
157 154 3 49 41 8 - - - 12 5 7 Toneya49 47 2 23 22 1 1 1 - 6 2 4 Karkata82 68 14 63 49 14 1 - 1 9 3 6 Jamur Soiya
119 119 - 79 70 9 9 9 - 9 6 3 Pangur- - - 75 51 24 - - - 1 1 - Marikel129 94 35 240 180 60 4 3 1 12 8 4 Saubera103 78 25 17 11 6 5 5 - 15 10 5 Hurpi230 123 107 3 1 2 44 31 13 40 30 10 Hatinghore420 388 32 586 258 328 6 4 2 41 21 20 Dumbariya126 110 16 1 1 - 1 1 - - - - Sotasoya11 10 1 14 5 9 4 2 2 7 4 3 Urmu65 64 1 23 22 1 - - - 1 1 - Konop4 2 2 2 1 1 10 6 4 5 3 2 Garra
120 76 44 1 - 1 1 1 - 2 1 1 Pohshar133 107 26 20 4 16 19 10 9 5 4 1 Hatnahdah235 157 78 - - - 2 2 - 17 9 8 Latakel210 130 80 111 69 42 - - - 2 1 1 Konaroia265 151 114 28 23 5 16 14 2 60 45 15 Paro126 62 64 3 3 - 1 - 1 16 9 7 Loasokra88 45 43 6 3 3 - - - 4 2 2 Chhotkaduil20 10 10 51 27 24 1 1 - 6 3 3 Barkaduil34 31 3 28 6 22 1 1 - 2 1 1 Bingora
323 149 174 - - - 9 4 5 12 9 3 Lamgarh41 41 - 4 4 - 4 2 2 4 2 2 Maimsar25 25 - - - - 2 1 1 3 2 1 Barerpa2 2 - 97 54 43 - - - 3 2 1 Kudrung
40 39 1 30 16 14 - - - 5 4 1 Sikrom347 177 170 12 7 5 5 4 1 7 4 3 Bintuka76 76 - 107 42 65 3 3 - 7 2 5 Nawagaon31 19 12 - - - 16 8 8 8 2 6 Kusum
114 105 9 78 17 61 6 2 4 5 3 2 Nimtur137 69 68 4 1 3 1 1 - 6 1 5 Kebetang98 91 7 70 15 55 3 3 - 5 2 3 Turuyu69 60 9 1 1 - 2 2 - 6 2 4 Barumda
109 85 24 192 133 59 16 10 6 18 15 3 Bamulda111 73 38 143 121 22 13 10 3 17 12 5 Konaroa269 241 28 101 23 78 4 2 2 156 106 50 Jarakel114 106 8 319 183 136 25 15 10 29 21 8 Pabura111 106 5 - - - 4 4 - 2 - 2 Jamang75 68 7 2 1 1 - - - 5 1 4 Kenduda58 57 1 28 19 9 - - - 1 1 - Chatuora
CultivatorsName of Village
Household industry workersAgricultural labourers
Industrial category of main workers
Other workers
129

DISTRICT CENSUS HANDBOOK : SIMDEGA
VILLAGE PRIMARYC D Block -
Persons Males Females Persons Males Females Persons Males Females1 2 41 42 43 44 45 46 47 48 49
0233 Bano (Total) 18,362 6,287 12,075 6,336 2,364 3,972 11,091 3,365 7,726 0233 Bano (Rural) 18,362 6,287 12,075 6,336 2,364 3,972 11,091 3,365 7,726 0233 Bano (Urban) - - - - - - - - -
RURAL376753 Jorponda 37 19 18 6 4 2 29 14 15 376754 Kohipat 17 10 7 13 6 7 4 4 - 376755 Jorobari 338 145 193 77 50 27 255 91 164 376756 Biruli 46 6 40 2 1 1 44 5 39 376757 Kenwgutu 202 32 170 138 21 117 64 11 53 376758 Hurda 215 38 177 95 16 79 107 20 87 376759 Jamtai 277 77 200 248 57 191 29 20 9 376760 Marani 223 37 186 131 3 128 91 33 58 376761 Raikera 826 202 624 658 144 514 138 41 97 376762 Tembro 20 8 12 19 7 12 - - - 376763 Kanta 26 9 17 - - - 26 9 17 376764 Chandsay 133 24 109 101 17 84 29 5 24 376765 Gerda 226 38 188 184 22 162 35 13 22 376766 Genmer 636 231 405 454 221 233 178 8 170 376767 Khijurbahar 59 21 38 43 13 30 15 8 7 376768 Toneya 281 41 240 249 21 228 32 20 12 376769 Karkata 9 9 - - - - 9 9 - 376770 Jamur Soiya 25 18 7 - - - 23 16 7 376771 Pangur 143 25 118 27 16 11 115 9 106 376772 Marikel 27 1 26 - - - 27 1 26 376773 Saubera 581 203 378 29 6 23 518 174 344 376774 Hurpi 150 54 96 1 - 1 111 40 71 376775 Hatinghore 370 155 215 132 55 77 141 45 96 376776 Dumbariya 354 41 313 12 1 11 336 36 300 376777 Sotasoya 228 55 173 1 - 1 226 55 171 376778 Urmu 296 151 145 102 100 2 187 49 138 376779 Konop 95 3 92 - - - 95 3 92 376780 Garra 186 97 89 47 23 24 139 74 65 376781 Pohshar 251 107 144 10 1 9 241 106 135 376782 Hatnahdah 85 18 67 25 6 19 58 12 46 376783 Latakel 171 64 107 4 2 2 133 39 94 376784 Konaroia 72 5 67 61 2 59 11 3 8 376785 Paro 423 203 220 135 107 28 240 62 178 376786 Loasokra 293 163 130 116 103 13 120 26 94 376787 Chhotkaduil 92 50 42 57 31 26 34 19 15 376788 Barkaduil 401 197 204 135 71 64 259 125 134 376789 Bingora 36 15 21 4 - 4 32 15 17 376790 Lamgarh 1 1 - - - - - - - 376791 Maimsar 100 30 70 58 10 48 37 18 19 376792 Barerpa 63 18 45 36 7 29 19 9 10 376793 Kudrung 22 - 22 1 - 1 21 - 21 376794 Sikrom 54 7 47 2 2 - 52 5 47 376795 Bintuka 22 10 12 1 - 1 20 10 10 376796 Nawagaon 57 2 55 1 - 1 53 - 53 376797 Kusum 149 75 74 147 74 73 - - - 376798 Nimtur 77 8 69 1 - 1 74 7 67 376799 Kebetang 19 14 5 18 13 5 - - - 376800 Turuyu 103 32 71 25 7 18 78 25 53 376801 Barumda 110 26 84 - - - 109 26 83 376802 Bamulda 298 76 222 46 8 38 249 68 181 376803 Konaroa 1,510 682 828 154 112 42 1,344 562 782 376804 Jarakel 471 138 333 130 34 96 324 97 227 376805 Pabura 183 13 170 - - - 181 12 169 376806 Jamang 4 2 2 3 2 1 - - - 376807 Kenduda 1 1 - 1 1 - - - - 376808 Chatuora 72 4 68 7 4 3 65 - 65
Location code
number Name of VillageMarginal workers Cultivators Agricultural labourers
Industrial category
130

PRIMARY CENSUS ABSTRACT
CENSUS ABSTRACTBano
Persons Males Females Persons Males Females Persons Males Females50 51 52 53 54 55 56 57 58 2 1
199 102 97 736 456 280 38,998 17,908 21,090 Bano (Total) 0233199 102 97 736 456 280 38,998 17,908 21,090 Bano (Rural) 0233- - - - - - - - - Bano (Urban) 0233
RURAL1 - 1 1 1 - 632 219 413 Jorponda 376753
- - - - - - 307 111 196 Kohipat 3767543 2 1 3 2 1 651 250 401 Jorobari 376755
- - - - - - 208 111 97 Biruli 376756- - - - - - 182 95 87 Kenwgutu 37675710 1 9 3 1 2 519 262 257 Hurda 376758
- - - - - - 448 209 239 Jamtai 376759- - - 1 1 - 297 149 148 Marani 376760
2 - 2 28 17 11 1,045 492 553 Raikera 376761- - - 1 1 - 123 66 57 Tembro 376762- - - - - - 169 68 101 Kanta 376763
1 1 - 2 1 1 331 137 194 Chandsay 3767643 1 2 4 2 2 769 361 408 Gerda 3767651 1 - 3 1 2 636 321 315 Genmer 376766
- - - 1 - 1 75 36 39 Khijurbahar 376767- - - - - - 446 215 231 Toneya 376768- - - - - - 262 114 148 Karkata 376769- - - 2 2 - 426 157 269 Jamur Soiya 376770- - - 1 - 1 486 182 304 Pangur 376771- - - - - - 82 36 46 Marikel 376772
6 4 2 28 19 9 700 347 353 Saubera 376773- - - 38 14 24 367 190 177 Hurpi 376774
8 4 4 89 51 38 680 371 309 Hatinghore 3767751 1 - 5 3 2 1,201 606 595 Dumbariya 3767761 - 1 - - - 142 65 77 Sotasoya 3767772 1 1 5 1 4 320 145 175 Urmu 376778
- - - - - - 130 67 63 Konop 376779- - - - - - 228 120 108 Garra 376780- - - - - - 215 97 118 Pohshar 376781
2 - 2 - - - 209 94 115 Hatnahdah 37678230 19 11 4 4 - 491 234 257 Latakel 376783
- - - - - - 269 123 146 Konaroia 37678414 10 4 34 24 10 894 379 515 Paro 37678515 7 8 42 27 15 330 147 183 Loasokra 376786
- - - 1 - 1 69 31 38 Chhotkaduil 3767876 1 5 1 - 1 439 221 218 Barkaduil 376788
- - - - - - 95 46 49 Bingora 376789- - - 1 1 - 288 137 151 Lamgarh 376790- - - 5 2 3 120 65 55 Maimsar 376791
7 2 5 1 - 1 61 31 30 Barerpa 376792- - - - - - 96 43 53 Kudrung 376793- - - - - - 97 55 42 Sikrom 376794- - - 1 - 1 457 242 215 Bintuka 376795
2 1 1 1 1 - 223 100 123 Nawagaon 3767962 1 1 - - - 209 114 95 Kusum 3767972 1 1 - - - 352 169 183 Nimtur 376798
- - - 1 1 - 160 79 81 Kebetang 376799- - - - - - 278 129 149 Turuyu 376800- - - 1 - 1 123 57 66 Barumda 376801
3 - 3 - - - 488 244 244 Bamulda 3768028 6 2 4 2 2 1,185 584 601 Konaroa 3768033 2 1 14 5 9 976 384 592 Jarakel 376804
- - - 2 1 1 531 260 271 Pabura 376805- - - 1 - 1 339 111 228 Jamang 376806- - - - - - 210 84 126 Kenduda 376807- - - - - - 148 80 68 Chatuora 376808
Non-workers
of marginal workersLocation
code number
Household industry workersName of Village
Other workers
131
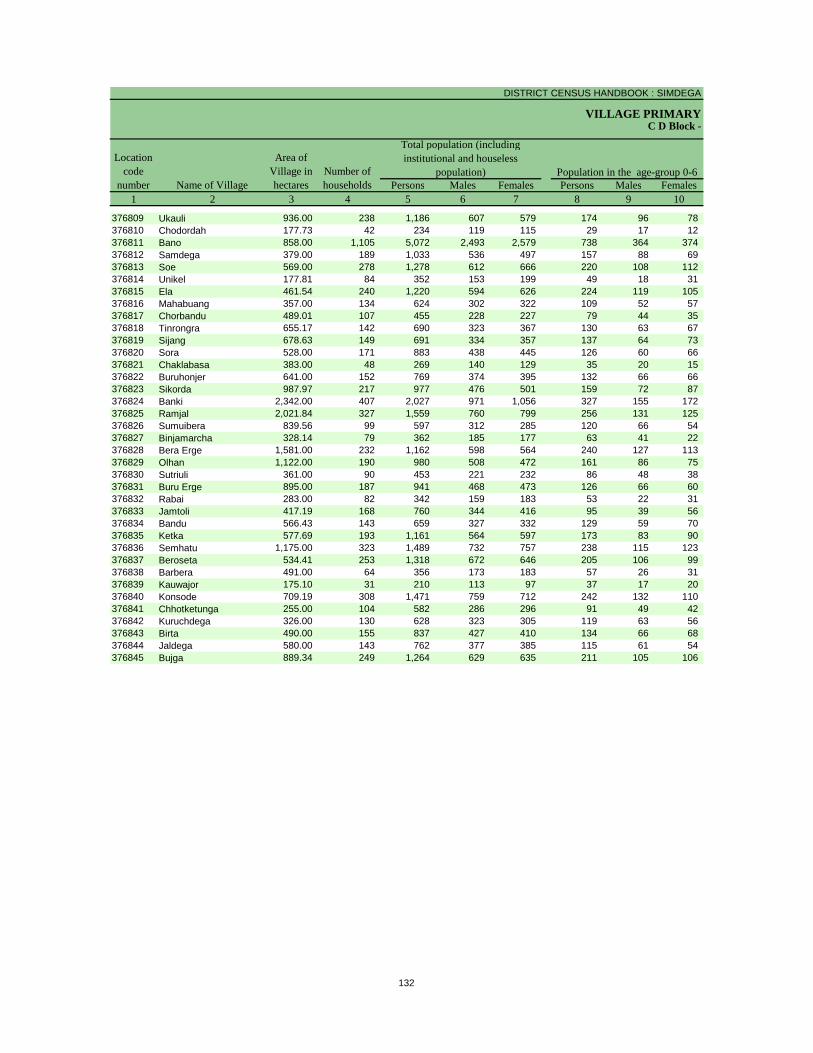
DISTRICT CENSUS HANDBOOK : SIMDEGA
VILLAGE PRIMARY
Persons Males Females Persons Males Females1 2 3 4 5 6 7 8 9 10
C D Block -
Population in the age-group 0-6Name of Village
Location code
number
Total population (including institutional and houseless
population)Area of
Village in hectares
Number of households
376809 Ukauli 936.00 238 1,186 607 579 174 96 78 376810 Chodordah 177.73 42 234 119 115 29 17 12 376811 Bano 858.00 1,105 5,072 2,493 2,579 738 364 374 376812 Samdega 379.00 189 1,033 536 497 157 88 69 376813 Soe 569.00 278 1,278 612 666 220 108 112 376814 Unikel 177.81 84 352 153 199 49 18 31 376815 Ela 461.54 240 1,220 594 626 224 119 105 376816 Mahabuang 357.00 134 624 302 322 109 52 57 376817 Chorbandu 489.01 107 455 228 227 79 44 35 376818 Tinrongra 655.17 142 690 323 367 130 63 67 376819 Sijang 678.63 149 691 334 357 137 64 73 376820 Sora 528.00 171 883 438 445 126 60 66 376821 Chaklabasa 383.00 48 269 140 129 35 20 15 376822 Buruhonjer 641.00 152 769 374 395 132 66 66 376823 Sikorda 987.97 217 977 476 501 159 72 87 376824 Banki 2,342.00 407 2,027 971 1,056 327 155 172 376825 Ramjal 2,021.84 327 1,559 760 799 256 131 125 376826 Sumuibera 839.56 99 597 312 285 120 66 54 376827 Binjamarcha 328.14 79 362 185 177 63 41 22 376828 Bera Erge 1,581.00 232 1,162 598 564 240 127 113 376829 Olhan 1,122.00 190 980 508 472 161 86 75 376830 Sutriuli 361.00 90 453 221 232 86 48 38 376831 Buru Erge 895.00 187 941 468 473 126 66 60 376832 Rabai 283.00 82 342 159 183 53 22 31 376833 Jamtoli 417.19 168 760 344 416 95 39 56 376834 Bandu 566.43 143 659 327 332 129 59 70 376835 Ketka 577.69 193 1,161 564 597 173 83 90 376836 Semhatu 1,175.00 323 1,489 732 757 238 115 123 376837 Beroseta 534.41 253 1,318 672 646 205 106 99 376838 Barbera 491.00 64 356 173 183 57 26 31 376839 Kauwajor 175.10 31 210 113 97 37 17 20 376840 Konsode 709.19 308 1,471 759 712 242 132 110 376841 Chhotketunga 255.00 104 582 286 296 91 49 42 376842 Kuruchdega 326.00 130 628 323 305 119 63 56 376843 Birta 490.00 155 837 427 410 134 66 68 376844 Jaldega 580.00 143 762 377 385 115 61 54 376845 Bujga 889.34 249 1,264 629 635 211 105 106
132

PRIMARY CENSUS ABSTRACT
CENSUS ABSTRACTBano
Persons Males Females Persons Males Females Persons Males Females11 12 13 14 15 16 17 18 19 2
Scheduled Castes population Scheduled Tribes populationName of Village
Literates
47 27 20 883 454 429 590 353 237 Ukauli- - - 234 119 115 178 97 81 Chodordah
1,386 678 708 1,754 812 942 3,321 1,801 1,520 Bano298 149 149 518 279 239 584 344 240 Samdega18 8 10 586 281 305 690 390 300 Soe
271 118 153 59 26 33 216 105 111 Unikel180 93 87 864 417 447 668 345 323 Ela- - - 446 213 233 322 187 135 Mahabuang12 4 8 404 204 200 203 137 66 Chorbandu11 5 6 616 292 324 312 188 124 Tinrongra
- - - 613 296 317 429 223 206 Sijang- - - 375 183 192 575 336 239 Sora16 8 8 253 132 121 158 91 67 Chaklabasa
100 44 56 353 177 176 379 222 157 Buruhonjer- - - 788 388 400 489 286 203 Sikorda22 12 10 1,497 713 784 1,153 631 522 Banki
- - - 1,155 562 593 874 490 384 Ramjal- - - 588 307 281 367 202 165 Sumuibera- - - 285 144 141 184 107 77 Binjamarcha68 39 29 948 485 463 564 334 230 Bera Erge4 2 2 749 389 360 326 203 123 Olhan
- - - 211 98 113 189 109 80 Sutriuli- - - 663 324 339 524 310 214 Buru Erge14 7 7 240 109 131 220 118 102 Rabai23 11 12 634 293 341 465 238 227 Jamtoli41 20 21 526 265 261 329 201 128 Bandu
- - - 1,145 555 590 773 413 360 Ketka12 7 5 1,288 626 662 757 447 310 Semhatu79 38 41 828 428 400 730 442 288 Beroseta
- - - 343 167 176 247 127 120 Barbera- - - 195 104 91 131 77 54 Kauwajor- - - 1,096 570 526 793 472 321 Konsode- - - 468 225 243 380 207 173 Chhotketunga- - - 541 278 263 344 201 143 Kuruchdega81 42 39 664 337 327 427 249 178 Birta
- - - 635 310 325 524 283 241 Jaldega- - - 827 415 412 657 381 276 Bujga
133

DISTRICT CENSUS HANDBOOK : SIMDEGA
VILLAGE PRIMARYC D Block -
Persons Males Females Persons Males Females Persons Males Females1 2 20 21 22 23 24 25 26 27 28
Illiterates Total workers Main workersName of Village
Location code
number
376809 Ukauli 596 254 342 604 303 301 312 199 113 376810 Chodordah 56 22 34 124 71 53 40 31 9 376811 Bano 1,751 692 1,059 1,820 1,236 584 1,221 966 255 376812 Samdega 449 192 257 500 284 216 405 235 170 376813 Soe 588 222 366 434 298 136 261 228 33 376814 Unikel 136 48 88 190 86 104 160 82 78 376815 Ela 552 249 303 644 322 322 241 205 36 376816 Mahabuang 302 115 187 369 179 190 364 177 187 376817 Chorbandu 252 91 161 285 141 144 100 95 5 376818 Tinrongra 378 135 243 349 163 186 127 102 25 376819 Sijang 262 111 151 378 185 193 172 117 55 376820 Sora 308 102 206 450 227 223 298 206 92 376821 Chaklabasa 111 49 62 152 78 74 120 71 49 376822 Buruhonjer 390 152 238 432 219 213 227 148 79 376823 Sikorda 488 190 298 391 272 119 256 236 20 376824 Banki 874 340 534 1,171 575 596 499 353 146 376825 Ramjal 685 270 415 929 473 456 534 324 210 376826 Sumuibera 230 110 120 287 146 141 287 146 141 376827 Binjamarcha 178 78 100 191 101 90 186 97 89 376828 Bera Erge 598 264 334 668 330 338 654 322 332 376829 Olhan 654 305 349 552 281 271 400 221 179 376830 Sutriuli 264 112 152 222 113 109 188 106 82 376831 Buru Erge 417 158 259 536 260 276 348 251 97 376832 Rabai 122 41 81 185 85 100 12 8 4 376833 Jamtoli 295 106 189 553 258 295 196 128 68 376834 Bandu 330 126 204 322 160 162 15 5 10 376835 Ketka 388 151 237 641 321 320 279 130 149 376836 Semhatu 732 285 447 874 420 454 698 407 291 376837 Beroseta 588 230 358 756 387 369 680 354 326 376838 Barbera 109 46 63 198 110 88 125 79 46 376839 Kauwajor 79 36 43 113 61 52 111 60 51 376840 Konsode 678 287 391 616 378 238 223 163 60 376841 Chhotketunga 202 79 123 292 142 150 265 129 136 376842 Kuruchdega 284 122 162 345 165 180 9 5 4 376843 Birta 410 178 232 273 220 53 219 199 20 376844 Jaldega 238 94 144 387 196 191 137 117 20 376845 Bujga 607 248 359 636 325 311 304 293 11
134

PRIMARY CENSUS ABSTRACT
CENSUS ABSTRACTBano
Persons Males Females Persons Males Females PersonsMalesFemales Persons Males Females29 30 31 32 33 34 35 36 37 38 39 40 2
CultivatorsName of Village
Household industry workersAgricultural labourers
Industrial category of main workers
Other workers
275 178 97 2 1 1 6 4 2 29 16 13 Ukauli9 9 - 30 21 9 1 1 - - - - Chodordah
215 186 29 104 69 35 26 18 8 876 693 183 Bano82 75 7 201 99 102 110 54 56 12 7 5 Samdega97 86 11 118 111 7 - - - 46 31 15 Soe49 44 5 83 23 60 25 15 10 3 - 3 Unikel
207 183 24 10 6 4 1 1 - 23 15 8 Ela239 120 119 107 48 59 6 3 3 12 6 6 Mahabuang88 86 2 8 8 - - - - 4 1 3 Chorbandu99 84 15 15 8 7 6 6 - 7 4 3 Tinrongra38 34 4 123 75 48 4 4 - 7 4 3 Sijang
207 145 62 68 45 23 - - - 23 16 7 Sora11 7 4 107 64 43 - - - 2 - 2 Chaklabasa
203 135 68 10 3 7 3 2 1 11 8 3 Buruhonjer77 70 7 169 158 11 - - - 10 8 2 Sikorda
436 319 117 5 2 3 21 13 8 37 19 18 Banki2 1 1 506 310 196 10 5 5 16 8 8 Ramjal
- - - 276 140 136 - - - 11 6 5 Sumuibera86 70 16 98 27 71 - - - 2 - 2 Binjamarcha
137 67 70 509 253 256 - - - 8 2 6 Bera Erge204 203 1 183 11 172 7 5 2 6 2 4 Olhan95 94 1 73 3 70 11 6 5 9 3 6 Sutriuli
229 223 6 112 27 85 1 1 - 6 - 6 Buru Erge1 - 1 - - - 3 1 2 8 7 1 Rabai
103 85 18 50 22 28 15 7 8 28 14 14 Jamtoli- - - - - - 2 1 1 13 4 9 Bandu201 96 105 36 8 28 2 1 1 40 25 15 Ketka155 152 3 535 252 283 3 - 3 5 3 2 Semhatu40 24 16 585 301 284 50 27 23 5 2 3 Beroseta
122 77 45 - - - - - - 3 2 1 Barbera45 25 20 61 33 28 - - - 5 2 3 Kauwajor
139 106 33 17 13 4 4 4 - 63 40 23 Konsode149 78 71 96 39 57 6 3 3 14 9 5 Chhotketunga- - - 1 1 - - - - 8 4 4 Kuruchdega41 40 1 159 143 16 18 15 3 1 1 - Birta43 40 3 79 69 10 4 4 - 11 4 7 Jaldega
119 118 1 160 156 4 - - - 25 19 6 Bujga
135

DISTRICT CENSUS HANDBOOK : SIMDEGA
VILLAGE PRIMARYC D Block -
Persons Males Females Persons Males Females Persons Males Females1 2 41 42 43 44 45 46 47 48 49
Location code
number Name of VillageMarginal workers Cultivators Agricultural labourers
Industrial category
376809 Ukauli 292 104 188 137 34 103 148 67 81 376810 Chodordah 84 40 44 1 - 1 77 36 41 376811 Bano 599 270 329 41 22 19 264 46 218 376812 Samdega 95 49 46 12 10 2 77 34 43 376813 Soe 173 70 103 31 15 16 98 30 68 376814 Unikel 30 4 26 3 - 3 20 2 18 376815 Ela 403 117 286 36 10 26 364 107 257 376816 Mahabuang 5 2 3 1 - 1 4 2 2 376817 Chorbandu 185 46 139 181 44 137 4 2 2 376818 Tinrongra 222 61 161 7 3 4 215 58 157 376819 Sijang 206 68 138 54 32 22 152 36 116 376820 Sora 152 21 131 49 6 43 102 14 88 376821 Chaklabasa 32 7 25 3 2 1 29 5 24 376822 Buruhonjer 205 71 134 81 7 74 77 29 48 376823 Sikorda 135 36 99 120 34 86 12 1 11 376824 Banki 672 222 450 312 49 263 358 172 186 376825 Ramjal 395 149 246 157 82 75 235 65 170 376826 Sumuibera - - - - - - - - - 376827 Binjamarcha 5 4 1 - - - 5 4 1 376828 Bera Erge 14 8 6 1 - 1 9 6 3 376829 Olhan 152 60 92 77 40 37 72 20 52 376830 Sutriuli 34 7 27 1 1 - 32 6 26 376831 Buru Erge 188 9 179 4 1 3 182 6 176 376832 Rabai 173 77 96 152 69 83 20 8 12 376833 Jamtoli 357 130 227 268 101 167 79 23 56 376834 Bandu 307 155 152 305 155 150 1 - 1 376835 Ketka 362 191 171 150 113 37 210 77 133 376836 Semhatu 176 13 163 3 1 2 172 11 161 376837 Beroseta 76 33 43 4 3 1 69 29 40 376838 Barbera 73 31 42 21 10 11 50 20 30 376839 Kauwajor 2 1 1 - - - - - - 376840 Konsode 393 215 178 155 108 47 231 103 128 376841 Chhotketunga 27 13 14 11 6 5 15 6 9 376842 Kuruchdega 336 160 176 - - - 336 160 176 376843 Birta 54 21 33 2 2 - 48 18 30 376844 Jaldega 250 79 171 9 3 6 237 73 164 376845 Bujga 332 32 300 - - - 330 30 300
136

PRIMARY CENSUS ABSTRACT
CENSUS ABSTRACTBano
Persons Males Females Persons Males Females Persons Males Females50 51 52 53 54 55 56 57 58 2 1
Non-workers
of marginal workersLocation
code number
Household industry workersName of Village
Other workers
1 - 1 6 3 3 582 304 278 Ukauli 3768094 2 2 2 2 - 110 48 62 Chodordah 376810
12 11 1 282 191 91 3,252 1,257 1,995 Bano 3768116 5 1 - - - 533 252 281 Samdega 376812
- - - 44 25 19 844 314 530 Soe 3768137 2 5 - - - 162 67 95 Unikel 376814
- - - 3 - 3 576 272 304 Ela 376815- - - - - - 255 123 132 Mahabuang 376816- - - - - - 170 87 83 Chorbandu 376817- - - - - - 341 160 181 Tinrongra 376818- - - - - - 313 149 164 Sijang 376819- - - 1 1 - 433 211 222 Sora 376820- - - - - - 117 62 55 Chaklabasa 376821- - - 47 35 12 337 155 182 Buruhonjer 376822- - - 3 1 2 586 204 382 Sikorda 376823
1 - 1 1 1 - 856 396 460 Banki 3768242 1 1 1 1 - 630 287 343 Ramjal 376825
- - - - - - 310 166 144 Sumuibera 376826- - - - - - 171 84 87 Binjamarcha 376827
4 2 2 - - - 494 268 226 Bera Erge 3768283 - 3 - - - 428 227 201 Olhan 3768291 - 1 - - - 231 108 123 Sutriuli 376830
- - - 2 2 - 405 208 197 Buru Erge 376831- - - 1 - 1 157 74 83 Rabai 376832
9 5 4 1 1 - 207 86 121 Jamtoli 376833- - - 1 - 1 337 167 170 Bandu 376834
2 1 1 - - - 520 243 277 Ketka 376835- - - 1 1 - 615 312 303 Semhatu 376836
3 1 2 - - - 562 285 277 Beroseta 3768372 1 1 - - - 158 63 95 Barbera 3768382 1 1 - - - 97 52 45 Kauwajor 3768392 1 1 5 3 2 855 381 474 Konsode 376840
- - - 1 1 - 290 144 146 Chhotketunga 376841- - - - - - 283 158 125 Kuruchdega 376842
1 - 1 3 1 2 564 207 357 Birta 3768434 3 1 - - - 375 181 194 Jaldega 376844
- - - 2 2 - 628 304 324 Bujga 376845
137


Urban PCA-Town wise Primary Census Abstract
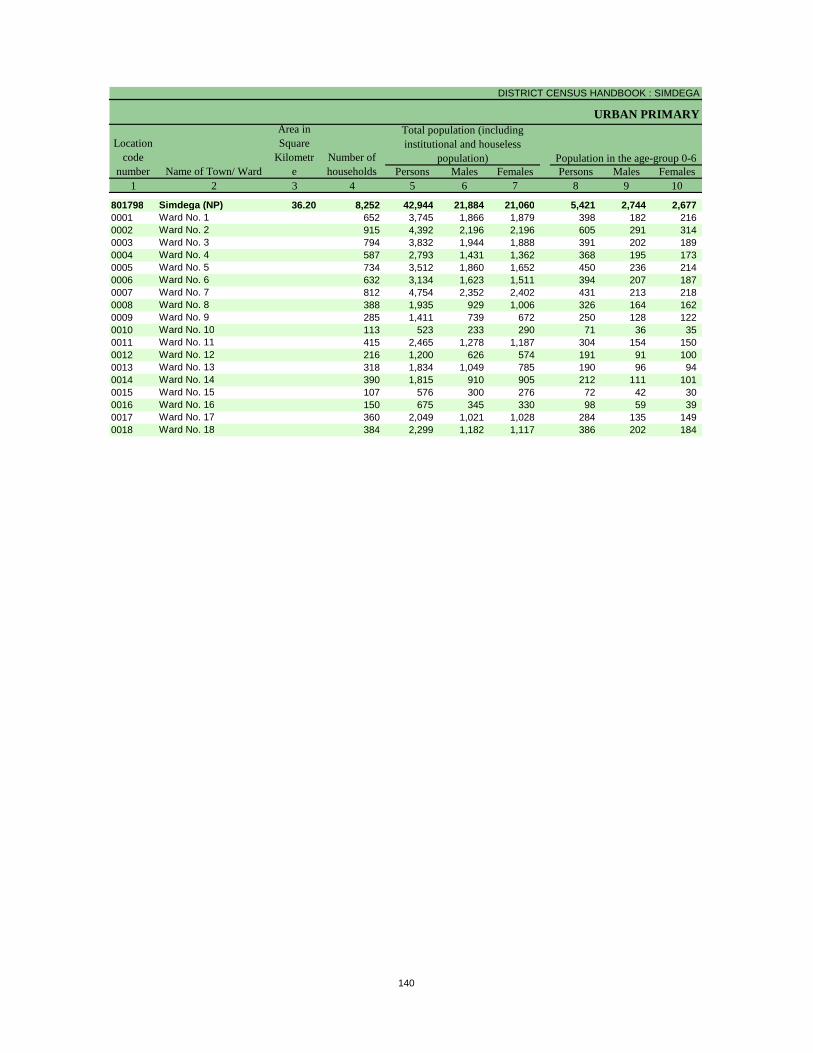
DISTRICT CENSUS HANDBOOK : SIMDEGA
URBAN PRIMARY
Persons Males Females Persons Males Females1 2 3 4 5 6 7 8 9 10
801798 Simdega (NP) 36.20 8,252 42,944 21,884 21,060 5,421 2,744 2,677 0001 Ward No. 1 652 3,745 1,866 1,879 398 182 216 0002 Ward No. 2 915 4,392 2,196 2,196 605 291 314 0003 Ward No. 3 794 3,832 1,944 1,888 391 202 189 0004 Ward No. 4 587 2,793 1,431 1,362 368 195 173 0005 Ward No. 5 734 3,512 1,860 1,652 450 236 214 0006 Ward No. 6 632 3,134 1,623 1,511 394 207 187 0007 Ward No. 7 812 4,754 2,352 2,402 431 213 218 0008 Ward No. 8 388 1,935 929 1,006 326 164 162 0009 Ward No. 9 285 1,411 739 672 250 128 122 0010 Ward No. 10 113 523 233 290 71 36 35 0011 Ward No. 11 415 2,465 1,278 1,187 304 154 150 0012 Ward No. 12 216 1,200 626 574 191 91 100 0013 Ward No. 13 318 1,834 1,049 785 190 96 94 0014 Ward No. 14 390 1,815 910 905 212 111 101 0015 Ward No. 15 107 576 300 276 72 42 30 0016 Ward No. 16 150 675 345 330 98 59 39 0017 Ward No. 17 360 2,049 1,021 1,028 284 135 149 0018 Ward No. 18 384 2,299 1,182 1,117 386 202 184
Name of Town/ Ward
Location code
number
Total population (including institutional and houseless
population)
Area in Square
Kilometre
Number of households
Population in the age-group 0-6
140

PRIMARY CENSUS ABSTRACT
CENSUS ABSTRACT
Persons Males Females Persons Males Females Persons Males Females11 12 13 14 15 16 17 18 19 2
1,923 954 969 19,920 9,633 10,287 32,067 17,077 14,990 Simdega (NP)167 83 84 3,013 1,487 1,526 2,818 1,498 1,320 Ward No. 1311 136 175 2,292 1,093 1,199 3,195 1,692 1,503 Ward No. 2115 58 57 1,904 893 1,011 3,215 1,672 1,543 Ward No. 383 47 36 1,464 736 728 2,095 1,122 973 Ward No. 4
183 91 92 946 470 476 2,475 1,408 1,067 Ward No. 5198 99 99 744 351 393 2,386 1,293 1,093 Ward No. 679 50 29 4,103 1,941 2,162 4,008 1,961 2,047 Ward No. 7
416 207 209 1,274 599 675 1,004 511 493 Ward No. 86 4 2 441 251 190 750 453 297 Ward No. 9
49 21 28 411 179 232 335 156 179 Ward No. 1063 28 35 139 72 67 1,972 1,059 913 Ward No. 1146 26 20 334 155 179 789 467 322 Ward No. 1244 25 19 334 157 177 1,481 888 593 Ward No. 137 5 2 1,056 516 540 1,453 749 704 Ward No. 144 1 3 - - - 488 252 236 Ward No. 15
- - - 656 333 323 480 249 231 Ward No. 16152 73 79 486 234 252 1,543 807 736 Ward No. 17- - - 323 166 157 1,580 840 740 Ward No. 18
Name of Town/ WardScheduled Castes population Scheduled Tribes population Literates
141

DISTRICT CENSUS HANDBOOK : SIMDEGA
URBAN PRIMARY
Persons Males Females Persons Males Females Persons Males Females1 2 20 21 22 23 24 25 26 27 28
801798 Simdega (NP) 10,877 4,807 6,070 13,391 9,919 3,472 10,481 8,371 2,110 0001 Ward No. 1 927 368 559 1,098 658 440 701 480 221 0002 Ward No. 2 1,197 504 693 1,513 1,011 502 1,123 923 200 0003 Ward No. 3 617 272 345 1,129 872 257 1,049 817 232 0004 Ward No. 4 698 309 389 847 657 190 606 478 128 0005 Ward No. 5 1,037 452 585 1,091 841 250 883 767 116 0006 Ward No. 6 748 330 418 916 755 161 878 727 151 0007 Ward No. 7 746 391 355 1,576 1,077 499 839 605 234 0008 Ward No. 8 931 418 513 701 444 257 579 387 192 0009 Ward No. 9 661 286 375 563 330 233 453 265 188 0010 Ward No. 10 188 77 111 222 120 102 139 82 57 0011 Ward No. 11 493 219 274 711 614 97 673 592 81 0012 Ward No. 12 411 159 252 355 292 63 241 213 28 0013 Ward No. 13 353 161 192 580 515 65 528 483 45 0014 Ward No. 14 362 161 201 568 404 164 422 332 90 0015 Ward No. 15 88 48 40 202 174 28 176 169 7 0016 Ward No. 16 195 96 99 212 165 47 173 140 33 0017 Ward No. 17 506 214 292 538 482 56 476 427 49 0018 Ward No. 18 719 342 377 569 508 61 542 484 58
Name of Town/ Ward
Location code
numberIlliterates Total workers Main workers
142

PRIMARY CENSUS ABSTRACT
CENSUS ABSTRACT
Persons Males Females Persons Males Females Persons Males Females Persons Males Females29 30 31 32 33 34 35 36 37 38 39 40 2
1,137 808 329 904 627 277 271 222 49 8,169 6,714 1,455 Simdega (NP)188 118 70 103 75 28 27 24 3 383 263 120 Ward No. 189 73 16 205 175 30 9 8 1 820 667 153 Ward No. 259 42 17 12 8 4 17 10 7 961 757 204 Ward No. 361 43 18 29 23 6 48 44 4 468 368 100 Ward No. 455 50 5 62 52 10 26 19 7 740 646 94 Ward No. 531 24 7 2 1 1 29 19 10 816 683 133 Ward No. 6
124 104 20 16 11 5 8 8 - 691 482 209 Ward No. 7179 122 57 243 168 75 4 3 1 153 94 59 Ward No. 8159 85 74 85 9 76 - - - 209 171 38 Ward No. 921 16 5 16 7 9 20 10 10 82 49 33 Ward No. 1012 11 1 2 2 - 11 11 - 648 568 80 Ward No. 1124 21 3 9 4 5 5 5 - 203 183 20 Ward No. 1223 23 - 3 3 - 25 24 1 477 433 44 Ward No. 1322 12 10 38 21 17 6 5 1 356 294 62 Ward No. 141 1 - - - - - - - 175 168 7 Ward No. 15
23 22 1 49 40 9 1 1 - 100 77 23 Ward No. 163 2 1 16 15 1 22 20 2 435 390 45 Ward No. 17
63 39 24 14 13 1 13 11 2 452 421 31 Ward No. 18
CultivatorsName of Town/ Ward
Household industry workersAgricultural labourers
Industrial category of main workers
Other workers
143

DISTRICT CENSUS HANDBOOK : SIMDEGA
URBAN PRIMARY
Persons Males Females Persons Males Females Persons Males Females1 2 41 42 43 44 45 46 47 48 49
801798 Simdega (NP) 2,910 1,548 1,362 723 440 283 1,184 446 738 0001 Ward No. 1 397 178 219 75 36 39 282 122 160 0002 Ward No. 2 390 88 302 29 13 16 303 45 258 0003 Ward No. 3 80 55 25 28 16 12 15 12 3 0004 Ward No. 4 241 179 62 51 37 14 38 22 16 0005 Ward No. 5 208 74 134 48 15 33 65 13 52 0006 Ward No. 6 38 28 10 1 1 - - - - 0007 Ward No. 7 737 472 265 344 234 110 254 144 110 0008 Ward No. 8 122 57 65 37 16 21 71 32 39 0009 Ward No. 9 110 65 45 22 12 10 8 3 5 0010 Ward No. 10 83 38 45 3 1 2 36 8 28 0011 Ward No. 11 38 22 16 3 3 - 3 1 2 0012 Ward No. 12 114 79 35 32 23 9 18 11 7 0013 Ward No. 13 52 32 20 10 6 4 2 2 - 0014 Ward No. 14 146 72 74 27 16 11 65 18 47 0015 Ward No. 15 26 5 21 - - - - - - 0016 Ward No. 16 39 25 14 8 7 1 23 13 10 0017 Ward No. 17 62 55 7 4 3 1 1 - 1 0018 Ward No. 18 27 24 3 1 1 - - - -
Name of Town/ WardMarginal workers Cultivators Agricultural labourers
Industrial categoryLocation
code number
144
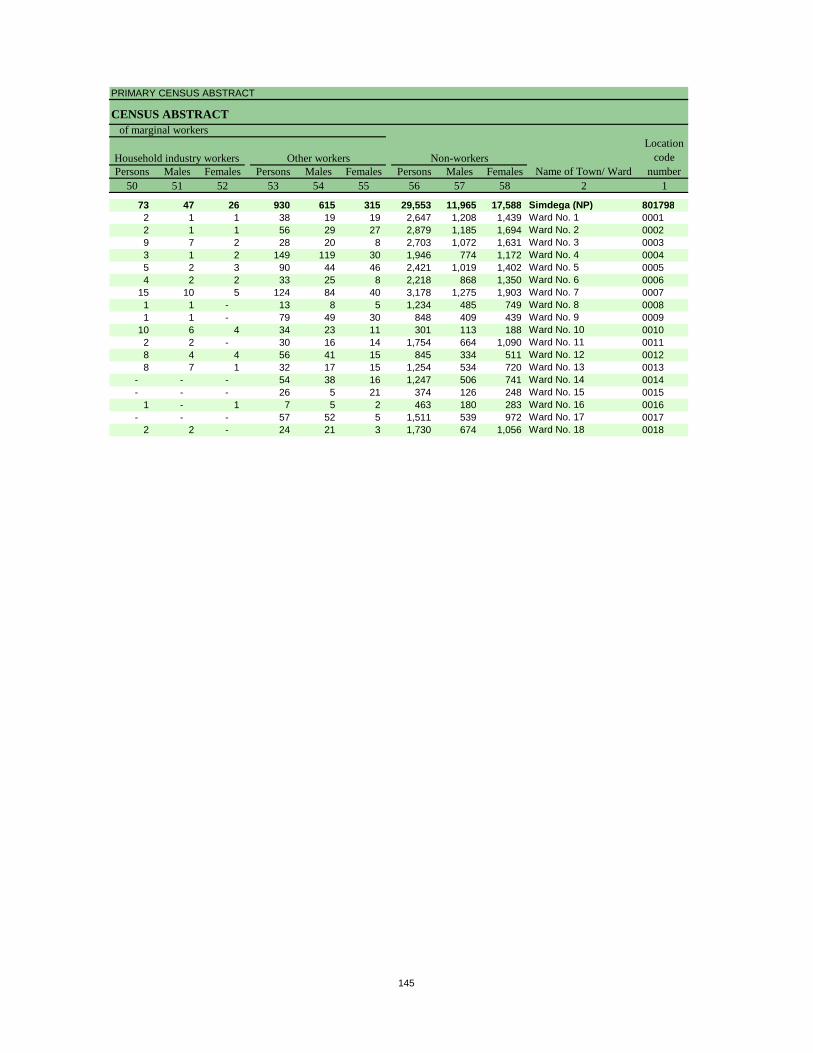
PRIMARY CENSUS ABSTRACT
CENSUS ABSTRACT
Persons Males Females Persons Males Females Persons Males Females50 51 52 53 54 55 56 57 58 2 1
73 47 26 930 615 315 29,553 11,965 17,588 Simdega (NP) 8017982 1 1 38 19 19 2,647 1,208 1,439 Ward No. 1 00012 1 1 56 29 27 2,879 1,185 1,694 Ward No. 2 00029 7 2 28 20 8 2,703 1,072 1,631 Ward No. 3 00033 1 2 149 119 30 1,946 774 1,172 Ward No. 4 00045 2 3 90 44 46 2,421 1,019 1,402 Ward No. 5 00054 2 2 33 25 8 2,218 868 1,350 Ward No. 6 0006
15 10 5 124 84 40 3,178 1,275 1,903 Ward No. 7 00071 1 - 13 8 5 1,234 485 749 Ward No. 8 00081 1 - 79 49 30 848 409 439 Ward No. 9 0009
10 6 4 34 23 11 301 113 188 Ward No. 10 00102 2 - 30 16 14 1,754 664 1,090 Ward No. 11 00118 4 4 56 41 15 845 334 511 Ward No. 12 00128 7 1 32 17 15 1,254 534 720 Ward No. 13 0013
- - - 54 38 16 1,247 506 741 Ward No. 14 0014- - - 26 5 21 374 126 248 Ward No. 15 0015
1 - 1 7 5 2 463 180 283 Ward No. 16 0016- - - 57 52 5 1,511 539 972 Ward No. 17 0017
2 2 - 24 21 3 1,730 674 1,056 Ward No. 18 0018
Location code
numberHousehold industry workers
Name of Town/ WardOther workers
of marginal workers
Non-workers
145


Section – II
Tables based on Households Amenities and Assets
(Rural /Urban) at District and Sub-District level


Total Rural Urban Total Rural Urban Total Rural Urban1 2 3 4 5 6 7 8 9 10 11 12
Owned No exclusive room 2,446 2,277 169 219 202 17 1,555 1,502 53One room 14,457 13,996 461 1,448 1,409 39 10,005 9,845 160Two rooms 47,350 45,763 1,587 5,112 4,988 124 33,400 32,726 674Three rooms 25,388 24,293 1,095 2,130 2,055 75 18,692 18,131 5613+ rooms 21,411 19,297 2,114 1,517 1,417 100 15,306 14,200 1,106
Rented No exclusive room 185 91 94 36 27 9 66 34 32One room 1,106 692 414 165 122 43 474 320 154Two rooms 1,987 848 1,139 139 77 62 1,013 484 529Three rooms 610 238 372 30 14 16 305 143 1623+ rooms 391 166 225 20 10 10 214 102 112
Others No exclusive room 66 42 24 14 10 4 22 18 4One room 415 362 53 92 80 12 213 199 14Two rooms 435 349 86 47 38 9 246 212 34Three rooms 210 150 60 12 7 5 111 96 153+ rooms 149 119 30 5 4 1 87 78 9
Total No exclusive room 2,697 2,410 287 269 239 30 1,643 1,554 89One room 15,978 15,050 928 1,705 1,611 94 10,692 10,364 328Two rooms 49,772 46,960 2,812 5,298 5,103 195 34,659 33,422 1,237Three rooms 26,208 24,681 1,527 2,172 2,076 96 19,108 18,370 7383+ rooms 21,951 19,582 2,369 1,542 1,431 111 15,607 14,380 1,227
Data Source:-Census of India, 2011, HH- series Tables on Houses, Household amenities and assets
District - Simdega (20367)
Table -1: Households by Ownership Status and by Number of Dwelling rooms occupied in the District, 2011
Name of district
Number of householdsTotal Scheduled Castes Scheduled Tribes
Ownership status
Number of dwelling rooms
149

Permanent Semi permanent Temporary Permanent
1 2 3 4 5 61 Sub-District - Simdega (2036702718) 5,749 (26.51%) 15,024 (69.28%) 865 (3.99%) 1,731 (12.58%)
2 Sub-District - Pakar Tanr (2036702719) 691 (9.47%) 5,945 (81.44%) 656 (8.99%) 691 (9.47%)
3 Sub-District - Kurdeg (2036702720) 1,090 (11.21%) 8,389 (86.25%) 245 (2.52%) 1,090 (11.21%)
4 Sub-District - Kersai (2036702721) 645 (8.75%) 6,510 (88.34%) 213 (2.89%) 645 (8.75%)
5 Sub-District - Bolba (2036702722) 574 (9.36%) 5,435 (88.63%) 114 (1.86%) 574 (9.36%)
6 Sub-District - Thethaitangar (2036702723) 2,310 (13.43%) 14,699 (85.45%) 179 (1.04%) 2,310 (13.43%)
7 Sub-District - Kolebira (2036702724) 2,862 (20.62%) 10,712 (77.18%) 274 (1.97%) 2,862 (20.62%)
8 Sub-District - Jaldega (2036702725) 1,425 (11.65%) 10,564 (86.39%) 222 (1.82%) 1,425 (11.65%)
9 Sub-District - Bansjor (2036702726) 668 (13.56%) 4,243 (86.15%) 11 (0.22%) 668 (13.56%)
10 Sub-District - Bano (2036702727) 2,932 (18.15%) 12,787 (79.14%) 424 (2.62%) 2,932 (18.15%)
District - Simdega (20367) 18,946 (16.25%) 94,308 (80.88%) 3,203 (2.75%) 14,928 (13.74%)
Note :
Sl. No. Name of Sub - District Total
1.Data Source:-Census of India, 2011, HH- series Tables on Houses, Household amenities and assets.
Permanent : Permanent houses refer to those houses whose walls & roofs are made of pucca materials, i.e., where burnt bricks, G.I. Sheets or other metal sheets, stone, cement, concrete is used for wall and tiles, slate, shingle, corrugated iron, zinc or other metal sheets, asbestos sheets, bricks, lime and stone and RBC/RCC concrete are used for roof.
Semi Permanent : Semi permanent houses refer to those houses made of other types of materials.
Temporary : Temporary houses refer to those houses having wall and roofs made of Kutcha materials, i.e., where, grass, leaves, reeds, bamboo, mud and unburnt bricks are used for the construction of walls and grass, leaves, reeds, bamboo thatch, mud, unburnt bricks and wood etc. are used for roofs.
Table - 2 : Percentage distribution of Households living in Permanent,
150

Semi permanent Temporary Permanent Semi permanent Temporary
7 8 9 10 11 211,307 (82.15%) 717 (5.21%) 4,018 (50.71%) 3,717 (46.91%) 148 (1.87%) Sub-District - Simdega (2036702718)
5,945 (81.44%) 656 (8.99%) 0 (0%) 0 (0%) 0 (0%) Sub-District - Pakar Tanr (2036702719)
8,389 (86.25%) 245 (2.52%) 0 (0%) 0 (0%) 0 (0%) Sub-District - Kurdeg (2036702720)
6,510 (88.34%) 213 (2.89%) 0 (0%) 0 (0%) 0 (0%) Sub-District - Kersai (2036702721)
5,435 (88.63%) 114 (1.86%) 0 (0%) 0 (0%) 0 (0%) Sub-District - Bolba (2036702722)
14,699 (85.45%) 179 (1.04%) 0 (0%) 0 (0%) 0 (0%) Sub-District - Thethaitangar (2036702723)
10,712 (77.18%) 274 (1.97%) 0 (0%) 0 (0%) 0 (0%) Sub-District - Kolebira (2036702724)
10,564 (86.39%) 222 (1.82%) 0 (0%) 0 (0%) 0 (0%) Sub-District - Jaldega (2036702725)
4,243 (86.15%) 11 (0.22%) 0 (0%) 0 (0%) 0 (0%) Sub-District - Bansjor (2036702726)
12,787 (79.14%) 424 (2.62%) 0 (0%) 0 (0%) 0 (0%) Sub-District - Bano (2036702727)
90,591 (83.35%) 3,055 (2.81%) 4,018 (50.71%) 3,717 (46.91%) 148 (1.87%) District - Simdega (20367)
Semi permanent and Temporary Houses , 2011Urban Name of Sub-DistrictRural
151

Tap water from treated source
Tap water from untreated source
Covered well Un-covered well
1 2 3 4 5 6 7 81 Total 21,687 831 (3.83%) 413 (1.9%) 397 (1.83%) 8,789 (40.53%)
Rural 13,764 181 (1.32%) 251 (1.82%) 117 (0.85%) 6,547 (47.57%)Urban 7,923 650 (8.2%) 162 (2.04%) 280 (3.53%) 2,242 (28.3%)
2 Total 7,300 53 (0.73%) 51 (0.7%) 43 (0.59%) 4,369 (59.85%)Rural 7,300 53 (0.73%) 51 (0.7%) 43 (0.59%) 4,369 (59.85%)Urban 0 (0%) 0 (0%) 0 (0%) 0 (0%) 0 (0%)
3 Total 9,726 220 (2.26%) 100 (1.03%) 57 (0.59%) 5,163 (53.08%)Rural 9,726 220 (2.26%) 100 (1.03%) 57 (0.59%) 5,163 (53.08%)Urban 0 (0%) 0 (0%) 0 (0%) 0 (0%) 0 (0%)
4 Total 7,369 28 (0.38%) 36 (0.49%) 53 (0.72%) 4,523 (61.38%)Rural 7,369 28 (0.38%) 36 (0.49%) 53 (0.72%) 4,523 (61.38%)Urban 0 (0%) 0 (0%) 0 (0%) 0 (0%) 0 (0%)
5 Total 6,132 25 (0.41%) 15 (0.24%) 30 (0.49%) 3,466 (56.52%)Rural 6,132 25 (0.41%) 15 (0.24%) 30 (0.49%) 3,466 (56.52%)Urban 0 (0%) 0 (0%) 0 (0%) 0 (0%) 0 (0%)
6 Total 17,202 137 (0.8%) 306 (1.78%) 85 (0.49%) 8,936 (51.95%)Rural 17,202 137 (0.8%) 306 (1.78%) 85 (0.49%) 8,936 (51.95%)Urban 0 (0%) 0 (0%) 0 (0%) 0 (0%) 0 (0%)
7 Total 13,879 146 (1.05%) 175 (1.26%) 210 (1.51%) 7,664 (55.22%)Rural 13,879 146 (1.05%) 175 (1.26%) 210 (1.51%) 7,664 (55.22%)Urban 0 (0%) 0 (0%) 0 (0%) 0 (0%) 0 (0%)
8 Total 12,228 118 (0.96%) 79 (0.65%) 73 (0.6%) 8,465 (69.23%)Rural 12,228 118 (0.96%) 79 (0.65%) 73 (0.6%) 8,465 (69.23%)Urban 0 (0%) 0 (0%) 0 (0%) 0 (0%) 0 (0%)
9 Total 4,925 16 (0.32%) 133 (2.7%) 18 (0.37%) 3,071 (62.36%)Rural 4,925 16 (0.32%) 133 (2.7%) 18 (0.37%) 3,071 (62.36%)Urban 0 (0%) 0 (0%) 0 (0%) 0 (0%) 0 (0%)
10 Total 16,158 357 (2.21%) 280 (1.73%) 154 (0.95%) 10,963 (67.85%)Rural 16,158 357 (2.21%) 280 (1.73%) 154 (0.95%) 10,963 (67.85%)Urban 0 (0%) 0 (0%) 0 (0%) 0 (0%) 0 (0%)Total 116,606 1,931 (1.66%) 1,588 (1.36%) 1,120 (0.96%) 65,409 (56.09%)Rural 108,683 1,281 (1.18%) 1,426 (1.31%) 840 (0.77%) 63,167 (58.12%)Urban 7,923 650 (8.2%) 162 (2.04%) 280 (3.53%) 2,242 (28.3%)
Data Source:-Census of India, 2011, HH- series Tables on Houses, Household amenities and assets.
Table -3 : Number and Percentage of Households Sl. No.
Name of Sub-District Total/ Rural/ Urban
Total Number of households
Number and percentage of Household
Note: Percentage is given in brackets after the number of households.
Sub-District - Simdega (2036702718)
Sub-District - Pakar Tanr (2036702719)
Sub-District - Kurdeg (2036702720)
Sub-District - Kersai (2036702721)
Sub-District - Bolba (2036702722)
Sub-District - Thethaitangar (2036702723)
Sub-District - Kolebira (2036702724)
Sub-District - Jaldega (2036702725)
Sub-District - Bansjor (2036702726)
Sub-District - Bano (2036702727)
District - Simdega (20367)
152

Handpump Tubewell/ borehole
Spring River/ canal Tank/ pond/ lake
Other Sources
9 10 11 12 13 14 3 210,459 (48.23%) 252 (1.16%) 76 (0.35%) 174 (0.8%) 12 (0.06%) 284 (1.31%) Total6,131 (44.54%) 29 (0.21%) 74 (0.54%) 173 (1.26%) 7 (0.05%) 254 (1.85%) Rural4,328 (54.63%) 223 (2.81%) 2 (0.03%) 1 (0.01%) 5 (0.06%) 30 (0.38%) Urban2,509 (34.37%) 5 (0.07%) 90 (1.23%) 69 (0.95%) 4 (0.05%) 107 (1.47%) Total2,509 (34.37%) 5 (0.07%) 90 (1.23%) 69 (0.95%) 4 (0.05%) 107 (1.47%) Rural
0 (0%) 0 (0%) 0 (0%) 0 (0%) 0 (0%) 0 (0%) Urban4,073 (41.88%) 9 (0.09%) 24 (0.25%) 55 (0.57%) 11 (0.11%) 14 (0.14%) Total4,073 (41.88%) 9 (0.09%) 24 (0.25%) 55 (0.57%) 11 (0.11%) 14 (0.14%) Rural
0 (0%) 0 (0%) 0 (0%) 0 (0%) 0 (0%) 0 (0%) Urban2,586 (35.09%) 1 (0.01%) 11 (0.15%) 56 (0.76%) 29 (0.39%) 46 (0.62%) Total2,586 (35.09%) 1 (0.01%) 11 (0.15%) 56 (0.76%) 29 (0.39%) 46 (0.62%) Rural
0 (0%) 0 (0%) 0 (0%) 0 (0%) 0 (0%) 0 (0%) Urban2,504 (40.83%) 0 (0%) 14 (0.23%) 54 (0.88%) 1 (0.02%) 23 (0.38%) Total2,504 (40.83%) 0 (0%) 14 (0.23%) 54 (0.88%) 1 (0.02%) 23 (0.38%) Rural
0 (0%) 0 (0%) 0 (0%) 0 (0%) 0 (0%) 0 (0%) Urban7,004 (40.72%) 20 (0.12%) 196 (1.14%) 273 (1.59%) 16 (0.09%) 229 (1.33%) Total7,004 (40.72%) 20 (0.12%) 196 (1.14%) 273 (1.59%) 16 (0.09%) 229 (1.33%) Rural
0 (0%) 0 (0%) 0 (0%) 0 (0%) 0 (0%) 0 (0%) Urban5,252 (37.84%) 214 (1.54%) 134 (0.97%) 20 (0.14%) 19 (0.14%) 45 (0.32%) Total5,252 (37.84%) 214 (1.54%) 134 (0.97%) 20 (0.14%) 19 (0.14%) 45 (0.32%) Rural
0 (0%) 0 (0%) 0 (0%) 0 (0%) 0 (0%) 0 (0%) Urban3,134 (25.63%) 5 (0.04%) 192 (1.57%) 108 (0.88%) 2 (0.02%) 52 (0.43%) Total3,134 (25.63%) 5 (0.04%) 192 (1.57%) 108 (0.88%) 2 (0.02%) 52 (0.43%) Rural
0 (0%) 0 (0%) 0 (0%) 0 (0%) 0 (0%) 0 (0%) Urban1,457 (29.58%) 20 (0.41%) 93 (1.89%) 108 (2.19%) 0 (0%) 9 (0.18%) Total1,457 (29.58%) 20 (0.41%) 93 (1.89%) 108 (2.19%) 0 (0%) 9 (0.18%) Rural
0 (0%) 0 (0%) 0 (0%) 0 (0%) 0 (0%) 0 (0%) Urban4,052 (25.08%) 9 (0.06%) 124 (0.77%) 154 (0.95%) 1 (0.01%) 64 (0.4%) Total4,052 (25.08%) 9 (0.06%) 124 (0.77%) 154 (0.95%) 1 (0.01%) 64 (0.4%) Rural
0 (0%) 0 (0%) 0 (0%) 0 (0%) 0 (0%) 0 (0%) Urban43,030 (36.9%) 535 (0.46%) 954 (0.82%) 1,071 (0.92%) 95 (0.08%) 873 (0.75%) Total
38,702 (35.61%) 312 (0.29%) 952 (0.88%) 1,070 (0.98%) 90 (0.08%) 843 (0.78%) Rural4,328 (54.63%) 223 (2.81%) 2 (0.03%) 1 (0.01%) 5 (0.06%) 30 (0.38%) Urban
by main source of Drinking water, 2011.Name of Sub-Districthaving following source of drinking water Total/
Rural/ Urban
Sub-District - Simdega (2036702718)
Sub-District - Pakar Tanr (2036702719)
Sub-District - Kurdeg (2036702720)
Sub-District - Kersai (2036702721)
Sub-District - Bolba (2036702722)
District - Simdega (20367)
Sub-District - Thethaitangar (2036702723)
Sub-District - Kolebira (2036702724)
Sub-District - Jaldega (2036702725)
Sub-District - Bansjor (2036702726)
Sub-District - Bano (2036702727)
153
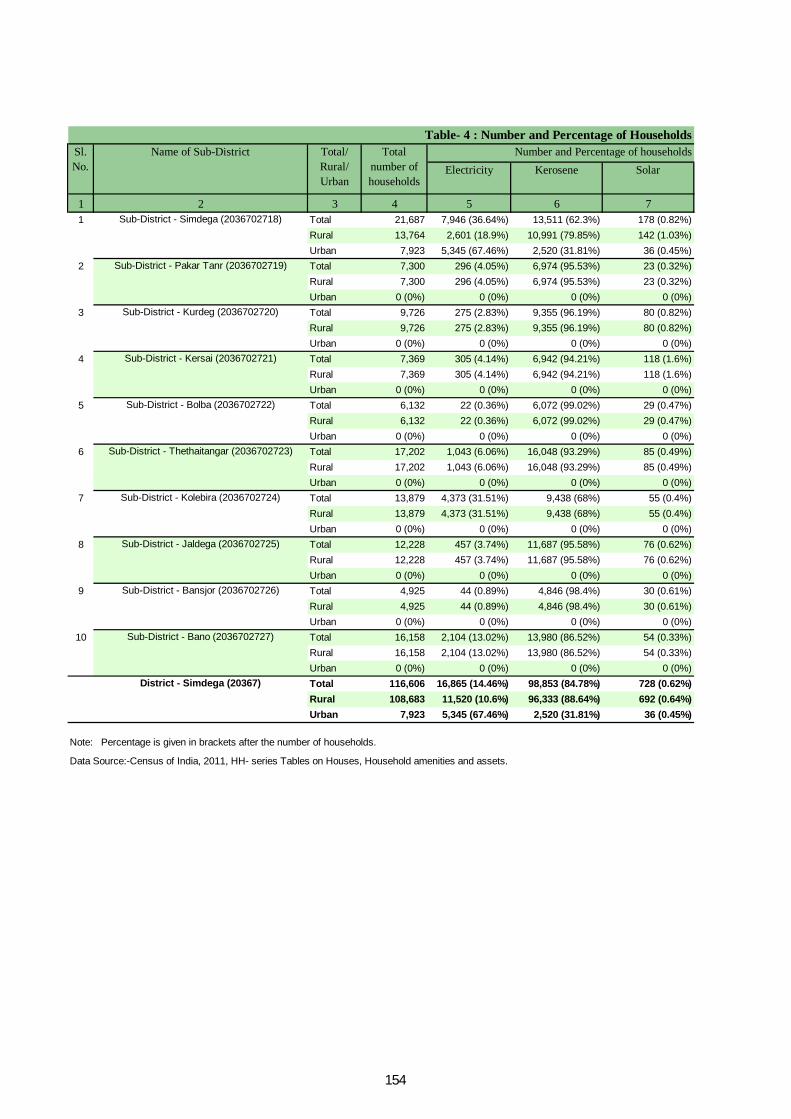
Electricity Kerosene Solar
1 2 3 4 5 6 71 Total 21,687 7,946 (36.64%) 13,511 (62.3%) 178 (0.82%)
Rural 13,764 2,601 (18.9%) 10,991 (79.85%) 142 (1.03%)Urban 7,923 5,345 (67.46%) 2,520 (31.81%) 36 (0.45%)
2 Total 7,300 296 (4.05%) 6,974 (95.53%) 23 (0.32%)Rural 7,300 296 (4.05%) 6,974 (95.53%) 23 (0.32%)Urban 0 (0%) 0 (0%) 0 (0%) 0 (0%)
3 Total 9,726 275 (2.83%) 9,355 (96.19%) 80 (0.82%)Rural 9,726 275 (2.83%) 9,355 (96.19%) 80 (0.82%)Urban 0 (0%) 0 (0%) 0 (0%) 0 (0%)
4 Total 7,369 305 (4.14%) 6,942 (94.21%) 118 (1.6%)Rural 7,369 305 (4.14%) 6,942 (94.21%) 118 (1.6%)Urban 0 (0%) 0 (0%) 0 (0%) 0 (0%)
5 Total 6,132 22 (0.36%) 6,072 (99.02%) 29 (0.47%)Rural 6,132 22 (0.36%) 6,072 (99.02%) 29 (0.47%)Urban 0 (0%) 0 (0%) 0 (0%) 0 (0%)
6 Total 17,202 1,043 (6.06%) 16,048 (93.29%) 85 (0.49%)Rural 17,202 1,043 (6.06%) 16,048 (93.29%) 85 (0.49%)Urban 0 (0%) 0 (0%) 0 (0%) 0 (0%)
7 Total 13,879 4,373 (31.51%) 9,438 (68%) 55 (0.4%)Rural 13,879 4,373 (31.51%) 9,438 (68%) 55 (0.4%)Urban 0 (0%) 0 (0%) 0 (0%) 0 (0%)
8 Total 12,228 457 (3.74%) 11,687 (95.58%) 76 (0.62%)Rural 12,228 457 (3.74%) 11,687 (95.58%) 76 (0.62%)Urban 0 (0%) 0 (0%) 0 (0%) 0 (0%)
9 Total 4,925 44 (0.89%) 4,846 (98.4%) 30 (0.61%)Rural 4,925 44 (0.89%) 4,846 (98.4%) 30 (0.61%)Urban 0 (0%) 0 (0%) 0 (0%) 0 (0%)
10 Total 16,158 2,104 (13.02%) 13,980 (86.52%) 54 (0.33%)Rural 16,158 2,104 (13.02%) 13,980 (86.52%) 54 (0.33%)Urban 0 (0%) 0 (0%) 0 (0%) 0 (0%)Total 116,606 16,865 (14.46%) 98,853 (84.78%) 728 (0.62%)Rural 108,683 11,520 (10.6%) 96,333 (88.64%) 692 (0.64%)Urban 7,923 5,345 (67.46%) 2,520 (31.81%) 36 (0.45%)
Data Source:-Census of India, 2011, HH- series Tables on Houses, Household amenities and assets.
Table- 4 : Number and Percentage of Households Sl. No.
Name of Sub-District Total/ Rural/ Urban
Total number of households
Number and Percentage of households
Note: Percentage is given in brackets after the number of households.
Sub-District - Simdega (2036702718)
Sub-District - Pakar Tanr (2036702719)
Sub-District - Kurdeg (2036702720)
Sub-District - Kersai (2036702721)
Sub-District - Bolba (2036702722)
Sub-District - Thethaitangar (2036702723)
Sub-District - Kolebira (2036702724)
Sub-District - Jaldega (2036702725)
Sub-District - Bansjor (2036702726)
Sub-District - Bano (2036702727)
District - Simdega (20367)
154

Other oil Any other No lighting
8 9 10 3 228 (0.13%) 18 (0.08%) 6 (0.03%) Total15 (0.11%) 11 (0.08%) 4 (0.03%) Rural13 (0.16%) 7 (0.09%) 2 (0.03%) Urban4 (0.05%) 1 (0.01%) 2 (0.03%) Total4 (0.05%) 1 (0.01%) 2 (0.03%) Rural
0 (0%) 0 (0%) 0 (0%) Urban3 (0.03%) 10 (0.1%) 3 (0.03%) Total3 (0.03%) 10 (0.1%) 3 (0.03%) Rural
0 (0%) 0 (0%) 0 (0%) Urban3 (0.04%) 1 (0.01%) 0 (0%) Total3 (0.04%) 1 (0.01%) 0 (0%) Rural
0 (0%) 0 (0%) 0 (0%) Urban5 (0.08%) 4 (0.07%) 0 (0%) Total5 (0.08%) 4 (0.07%) 0 (0%) Rural
0 (0%) 0 (0%) 0 (0%) Urban14 (0.08%) 8 (0.05%) 4 (0.02%) Total14 (0.08%) 8 (0.05%) 4 (0.02%) Rural
0 (0%) 0 (0%) 0 (0%) Urban8 (0.06%) 2 (0.01%) 3 (0.02%) Total8 (0.06%) 2 (0.01%) 3 (0.02%) Rural
0 (0%) 0 (0%) 0 (0%) Urban2 (0.02%) 5 (0.04%) 1 (0.01%) Total2 (0.02%) 5 (0.04%) 1 (0.01%) Rural
0 (0%) 0 (0%) 0 (0%) Urban4 (0.08%) 0 (0%) 1 (0.02%) Total4 (0.08%) 0 (0%) 1 (0.02%) Rural
0 (0%) 0 (0%) 0 (0%) Urban14 (0.09%) 5 (0.03%) 1 (0.01%) Total14 (0.09%) 5 (0.03%) 1 (0.01%) Rural
0 (0%) 0 (0%) 0 (0%) Urban85 (0.07%) 54 (0.05%) 21 (0.02%) Total72 (0.07%) 47 (0.04%) 19 (0.02%) Rural13 (0.16%) 7 (0.09%) 2 (0.03%) Urban
Name of Sub-Districtby main source of Lighting, 2011. having following main source of lighting Total/
Rural/ Urban
Sub-District - Simdega (2036702718)
Sub-District - Pakar Tanr (2036702719)
Sub-District - Kurdeg (2036702720)
Sub-District - Kersai (2036702721)
Sub-District - Bolba (2036702722)
District - Simdega (20367)
Sub-District - Thethaitangar (2036702723)
Sub-District - Kolebira (2036702724)
Sub-District - Jaldega (2036702725)
Sub-District - Bansjor (2036702726)
Sub-District - Bano (2036702727)
155

Pit LatrinePiped sewer
systemSeptic tank Other system With
slab/Ventilated improved pit
Without slab/open pit
1 2 3 4 5 6 7 8 91 Total 21,687 300 (1.38%) 4,194 (19.34%) 220 (1.01%) 268 (1.24%) 37 (0.17%)
Rural 13,764 82 (0.6%) 517 (3.76%) 86 (0.62%) 119 (0.86%) 4 (0.03%)Urban 7,923 218 (2.75%) 3,677 (46.41%) 134 (1.69%) 149 (1.88%) 33 (0.42%)
2 Total 7,300 11 (0.15%) 82 (1.12%) 59 (0.81%) 13 (0.18%) 13 (0.18%)Rural 7,300 11 (0.15%) 82 (1.12%) 59 (0.81%) 13 (0.18%) 13 (0.18%)Urban 0 (0%) 0 (0%) 0 (0%) 0 (0%) 0 (0%) 0 (0%)
3 Total 9,726 11 (0.11%) 356 (3.66%) 64 (0.66%) 69 (0.71%) 164 (1.69%)Rural 9,726 11 (0.11%) 356 (3.66%) 64 (0.66%) 69 (0.71%) 164 (1.69%)Urban 0 (0%) 0 (0%) 0 (0%) 0 (0%) 0 (0%) 0 (0%)
4 Total 7,369 32 (0.43%) 211 (2.86%) 19 (0.26%) 13 (0.18%) 3 (0.04%)Rural 7,369 32 (0.43%) 211 (2.86%) 19 (0.26%) 13 (0.18%) 3 (0.04%)Urban 0 (0%) 0 (0%) 0 (0%) 0 (0%) 0 (0%) 0 (0%)
5 Total 6,132 5 (0.08%) 125 (2.04%) 52 (0.85%) 11 (0.18%) 0 (0%)Rural 6,132 5 (0.08%) 125 (2.04%) 52 (0.85%) 11 (0.18%) 0 (0%)Urban 0 (0%) 0 (0%) 0 (0%) 0 (0%) 0 (0%) 0 (0%)
6 Total 17,202 31 (0.18%) 450 (2.62%) 84 (0.49%) 61 (0.35%) 10 (0.06%)Rural 17,202 31 (0.18%) 450 (2.62%) 84 (0.49%) 61 (0.35%) 10 (0.06%)Urban 0 (0%) 0 (0%) 0 (0%) 0 (0%) 0 (0%) 0 (0%)
7 Total 13,879 52 (0.37%) 840 (6.05%) 144 (1.04%) 120 (0.86%) 54 (0.39%)Rural 13,879 52 (0.37%) 840 (6.05%) 144 (1.04%) 120 (0.86%) 54 (0.39%)Urban 0 (0%) 0 (0%) 0 (0%) 0 (0%) 0 (0%) 0 (0%)
8 Total 12,228 53 (0.43%) 250 (2.04%) 54 (0.44%) 170 (1.39%) 10 (0.08%)Rural 12,228 53 (0.43%) 250 (2.04%) 54 (0.44%) 170 (1.39%) 10 (0.08%)Urban 0 (0%) 0 (0%) 0 (0%) 0 (0%) 0 (0%) 0 (0%)
9 Total 4,925 1 (0.02%) 40 (0.81%) 1 (0.02%) 2 (0.04%) 0 (0%)Rural 4,925 1 (0.02%) 40 (0.81%) 1 (0.02%) 2 (0.04%) 0 (0%)Urban 0 (0%) 0 (0%) 0 (0%) 0 (0%) 0 (0%) 0 (0%)
10 Total 16,158 25 (0.15%) 454 (2.81%) 141 (0.87%) 61 (0.38%) 8 (0.05%)Rural 16,158 25 (0.15%) 454 (2.81%) 141 (0.87%) 61 (0.38%) 8 (0.05%)Urban 0 (0%) 0 (0%) 0 (0%) 0 (0%) 0 (0%) 0 (0%)Total 116,606 521 (0.45%) 7,002 (6%) 838 (0.72%) 788 (0.68%) 299 (0.26%)Rural 108,683 303 (0.28%) 3,325 (3.06%) 704 (0.65%) 639 (0.59%) 266 (0.24%)Urban 7,923 218 (2.75%) 3,677 (46.41%) 134 (1.69%) 149 (1.88%) 33 (0.42%)
Data Source:-Census of India, 2011, HH- series Tables on Houses, Household amenities and assets.
Table -5 : Number and Percentage of Households by type of Latrine facility, 2011Sl. No.
Name of Sub-District Total/ Rural/ Urban
Total number of households Flush/Pour latrine
having following type of latrine facility Number and percentage of households
Note: Percentage is given in brackets after the number of households.
Sub-District - Simdega (2036702718)
Sub-District - Pakar Tanr (2036702719)
Sub-District - Kurdeg (2036702720)
Sub-District - Kersai (2036702721)
Sub-District - Bolba (2036702722)
Sub-District - Thethaitangar (2036702723)
Sub-District - Kolebira (2036702724)
Sub-District - Jaldega (2036702725)
Sub-District - Bansjor (2036702726)
Sub-District - Bano (2036702727)
District - Simdega (20367)
156
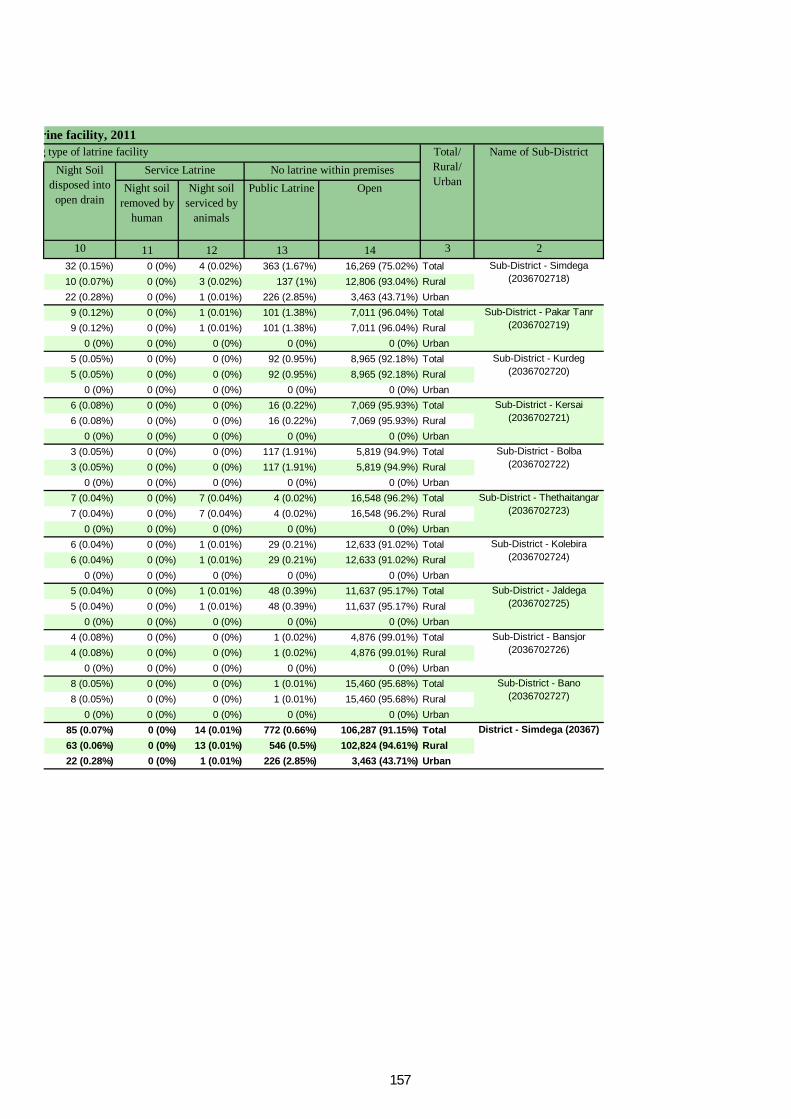
Night soil removed by
human
Night soil serviced by
animals
Public Latrine Open
10 11 12 13 14 3 232 (0.15%) 0 (0%) 4 (0.02%) 363 (1.67%) 16,269 (75.02%) Total10 (0.07%) 0 (0%) 3 (0.02%) 137 (1%) 12,806 (93.04%) Rural22 (0.28%) 0 (0%) 1 (0.01%) 226 (2.85%) 3,463 (43.71%) Urban9 (0.12%) 0 (0%) 1 (0.01%) 101 (1.38%) 7,011 (96.04%) Total9 (0.12%) 0 (0%) 1 (0.01%) 101 (1.38%) 7,011 (96.04%) Rural
0 (0%) 0 (0%) 0 (0%) 0 (0%) 0 (0%) Urban5 (0.05%) 0 (0%) 0 (0%) 92 (0.95%) 8,965 (92.18%) Total5 (0.05%) 0 (0%) 0 (0%) 92 (0.95%) 8,965 (92.18%) Rural
0 (0%) 0 (0%) 0 (0%) 0 (0%) 0 (0%) Urban6 (0.08%) 0 (0%) 0 (0%) 16 (0.22%) 7,069 (95.93%) Total6 (0.08%) 0 (0%) 0 (0%) 16 (0.22%) 7,069 (95.93%) Rural
0 (0%) 0 (0%) 0 (0%) 0 (0%) 0 (0%) Urban3 (0.05%) 0 (0%) 0 (0%) 117 (1.91%) 5,819 (94.9%) Total3 (0.05%) 0 (0%) 0 (0%) 117 (1.91%) 5,819 (94.9%) Rural
0 (0%) 0 (0%) 0 (0%) 0 (0%) 0 (0%) Urban7 (0.04%) 0 (0%) 7 (0.04%) 4 (0.02%) 16,548 (96.2%) Total7 (0.04%) 0 (0%) 7 (0.04%) 4 (0.02%) 16,548 (96.2%) Rural
0 (0%) 0 (0%) 0 (0%) 0 (0%) 0 (0%) Urban6 (0.04%) 0 (0%) 1 (0.01%) 29 (0.21%) 12,633 (91.02%) Total6 (0.04%) 0 (0%) 1 (0.01%) 29 (0.21%) 12,633 (91.02%) Rural
0 (0%) 0 (0%) 0 (0%) 0 (0%) 0 (0%) Urban5 (0.04%) 0 (0%) 1 (0.01%) 48 (0.39%) 11,637 (95.17%) Total5 (0.04%) 0 (0%) 1 (0.01%) 48 (0.39%) 11,637 (95.17%) Rural
0 (0%) 0 (0%) 0 (0%) 0 (0%) 0 (0%) Urban4 (0.08%) 0 (0%) 0 (0%) 1 (0.02%) 4,876 (99.01%) Total4 (0.08%) 0 (0%) 0 (0%) 1 (0.02%) 4,876 (99.01%) Rural
0 (0%) 0 (0%) 0 (0%) 0 (0%) 0 (0%) Urban8 (0.05%) 0 (0%) 0 (0%) 1 (0.01%) 15,460 (95.68%) Total8 (0.05%) 0 (0%) 0 (0%) 1 (0.01%) 15,460 (95.68%) Rural
0 (0%) 0 (0%) 0 (0%) 0 (0%) 0 (0%) Urban85 (0.07%) 0 (0%) 14 (0.01%) 772 (0.66%) 106,287 (91.15%) Total63 (0.06%) 0 (0%) 13 (0.01%) 546 (0.5%) 102,824 (94.61%) Rural22 (0.28%) 0 (0%) 1 (0.01%) 226 (2.85%) 3,463 (43.71%) Urban
by type of Latrine facility, 2011Name of Sub-District
No latrine within premisesNight Soil disposed into
open drain
Service Latrine having following type of latrine facility Total/
Rural/ Urban
Sub-District - Simdega (2036702718)
Sub-District - Pakar Tanr (2036702719)
Sub-District - Kurdeg (2036702720)
Sub-District - Kersai (2036702721)
Sub-District - Bolba (2036702722)
District - Simdega (20367)
Sub-District - Thethaitangar (2036702723)
Sub-District - Kolebira (2036702724)
Sub-District - Jaldega (2036702725)
Sub-District - Bansjor (2036702726)
Sub-District - Bano (2036702727)
157

Closed drainage Open drainage No drainage
1 2 3 4 5 6 71 Total 21,687 648 (2.99%) 1,927 (8.89%) 19,112 (88.13%)
Rural 13,764 30 (0.22%) 409 (2.97%) 13,325 (96.81%)Urban 7,923 618 (7.8%) 1,518 (19.16%) 5,787 (73.04%)
2 Total 7,300 7 (0.1%) 493 (6.75%) 6,800 (93.15%)Rural 7,300 7 (0.1%) 493 (6.75%) 6,800 (93.15%)Urban 0 0 (0%) 0 (0%) 0 (0%)
3 Total 9,726 30 (0.31%) 457 (4.7%) 9,239 (94.99%)Rural 9,726 30 (0.31%) 457 (4.7%) 9,239 (94.99%)Urban 0 0 (0%) 0 (0%) 0 (0%)
4 Total 7,369 24 (0.33%) 530 (7.19%) 6,815 (92.48%)Rural 7,369 24 (0.33%) 530 (7.19%) 6,815 (92.48%)Urban 0 0 (0%) 0 (0%) 0 (0%)
5 Total 6,132 14 (0.23%) 44 (0.72%) 6,074 (99.05%)Rural 6,132 14 (0.23%) 44 (0.72%) 6,074 (99.05%)Urban 0 0 (0%) 0 (0%) 0 (0%)
6 Total 17,202 48 (0.28%) 586 (3.41%) 16,568 (96.31%)Rural 17,202 48 (0.28%) 586 (3.41%) 16,568 (96.31%)Urban 0 0 (0%) 0 (0%) 0 (0%)
7 Total 13,879 200 (1.44%) 703 (5.07%) 12,976 (93.49%)Rural 13,879 200 (1.44%) 703 (5.07%) 12,976 (93.49%)Urban 0 0 (0%) 0 (0%) 0 (0%)
8 Total 12,228 15 (0.12%) 688 (5.63%) 11,525 (94.25%)Rural 12,228 15 (0.12%) 688 (5.63%) 11,525 (94.25%)Urban 0 0 (0%) 0 (0%) 0 (0%)
9 Total 4,925 5 (0.1%) 116 (2.36%) 4,804 (97.54%)Rural 4,925 5 (0.1%) 116 (2.36%) 4,804 (97.54%)Urban 0 0 (0%) 0 (0%) 0 (0%)
10 Total 16,158 29 (0.18%) 755 (4.67%) 15,374 (95.15%)Rural 16,158 29 (0.18%) 755 (4.67%) 15,374 (95.15%)Urban 0 0 (0%) 0 (0%) 0 (0%)Total 116,606 1,020 (0.87%) 6,299 (5.4%) 109,287 (93.72%)Rural 108,683 402 (0.37%) 4,781 (4.4%) 103,500 (95.23%)Urban 7,923 618 (7.8%) 1,518 (19.16%) 5,787 (73.04%)
Data Source:-Census of India, 2011, HH- series Tables on Houses, Household amenities and assets.
Note: Percentage is given in brackets after the number of households.
Sub-District - Simdega (2036702718)
Sub-District - Pakar Tanr (2036702719)
Sub-District - Kurdeg (2036702720)
Sub-District - Kersai (2036702721)
Sub-District - Bolba (2036702722)
Sub-District - Thethaitangar (2036702723)
Sub-District - Kolebira (2036702724)
Sub-District - Jaldega (2036702725)
Sub-District - Bansjor (2036702726)
Sub-District - Bano (2036702727)
District - Simdega (20367)
Table -6 : Number and Percentage of Households by type of Drainage connectivity for waste water outlet , 2011 Sl. No. Name of Sub-District Total/
Rural/ Urban
Total number of households
Number and Percentage of households by type of drainage connectivity for waste water outlet
158
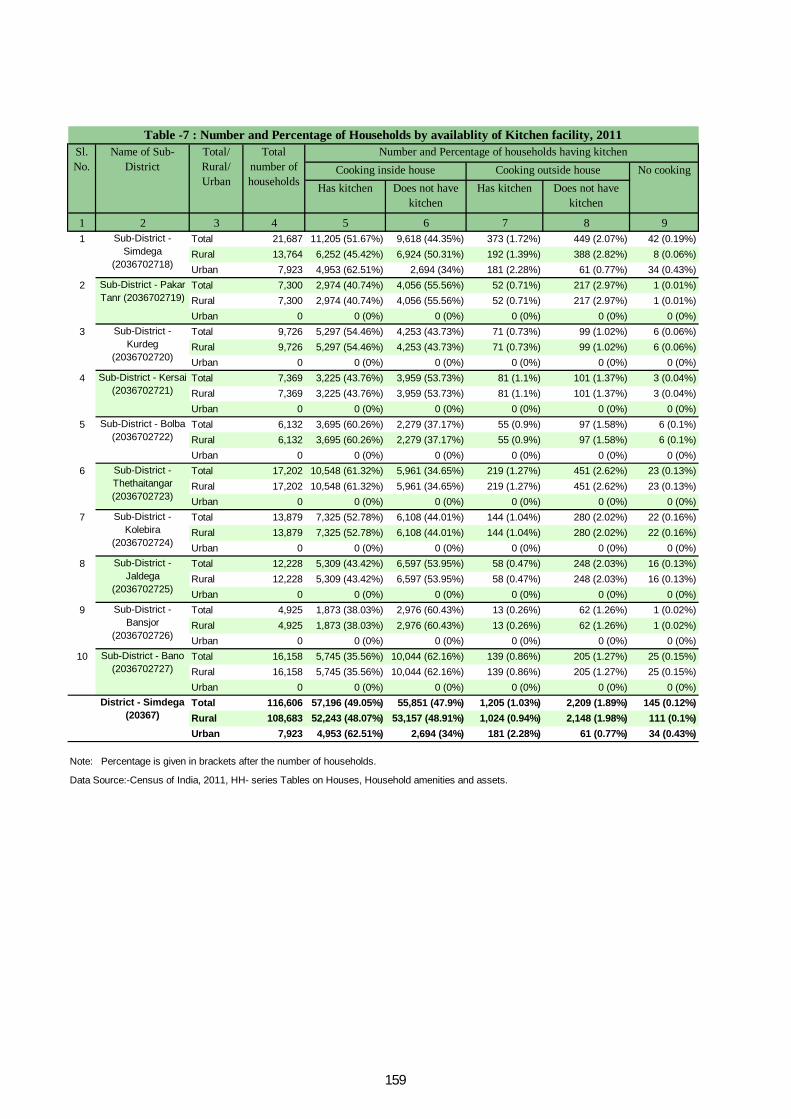
Has kitchen Does not have kitchen
Has kitchen Does not have kitchen
1 2 3 4 5 6 7 8 91 Total 21,687 11,205 (51.67%) 9,618 (44.35%) 373 (1.72%) 449 (2.07%) 42 (0.19%)
Rural 13,764 6,252 (45.42%) 6,924 (50.31%) 192 (1.39%) 388 (2.82%) 8 (0.06%)Urban 7,923 4,953 (62.51%) 2,694 (34%) 181 (2.28%) 61 (0.77%) 34 (0.43%)
2 Total 7,300 2,974 (40.74%) 4,056 (55.56%) 52 (0.71%) 217 (2.97%) 1 (0.01%)Rural 7,300 2,974 (40.74%) 4,056 (55.56%) 52 (0.71%) 217 (2.97%) 1 (0.01%)Urban 0 0 (0%) 0 (0%) 0 (0%) 0 (0%) 0 (0%)
3 Total 9,726 5,297 (54.46%) 4,253 (43.73%) 71 (0.73%) 99 (1.02%) 6 (0.06%)Rural 9,726 5,297 (54.46%) 4,253 (43.73%) 71 (0.73%) 99 (1.02%) 6 (0.06%)Urban 0 0 (0%) 0 (0%) 0 (0%) 0 (0%) 0 (0%)
4 Total 7,369 3,225 (43.76%) 3,959 (53.73%) 81 (1.1%) 101 (1.37%) 3 (0.04%)Rural 7,369 3,225 (43.76%) 3,959 (53.73%) 81 (1.1%) 101 (1.37%) 3 (0.04%)Urban 0 0 (0%) 0 (0%) 0 (0%) 0 (0%) 0 (0%)
5 Total 6,132 3,695 (60.26%) 2,279 (37.17%) 55 (0.9%) 97 (1.58%) 6 (0.1%)Rural 6,132 3,695 (60.26%) 2,279 (37.17%) 55 (0.9%) 97 (1.58%) 6 (0.1%)Urban 0 0 (0%) 0 (0%) 0 (0%) 0 (0%) 0 (0%)
6 Total 17,202 10,548 (61.32%) 5,961 (34.65%) 219 (1.27%) 451 (2.62%) 23 (0.13%)Rural 17,202 10,548 (61.32%) 5,961 (34.65%) 219 (1.27%) 451 (2.62%) 23 (0.13%)Urban 0 0 (0%) 0 (0%) 0 (0%) 0 (0%) 0 (0%)
7 Total 13,879 7,325 (52.78%) 6,108 (44.01%) 144 (1.04%) 280 (2.02%) 22 (0.16%)Rural 13,879 7,325 (52.78%) 6,108 (44.01%) 144 (1.04%) 280 (2.02%) 22 (0.16%)Urban 0 0 (0%) 0 (0%) 0 (0%) 0 (0%) 0 (0%)
8 Total 12,228 5,309 (43.42%) 6,597 (53.95%) 58 (0.47%) 248 (2.03%) 16 (0.13%)Rural 12,228 5,309 (43.42%) 6,597 (53.95%) 58 (0.47%) 248 (2.03%) 16 (0.13%)Urban 0 0 (0%) 0 (0%) 0 (0%) 0 (0%) 0 (0%)
9 Total 4,925 1,873 (38.03%) 2,976 (60.43%) 13 (0.26%) 62 (1.26%) 1 (0.02%)Rural 4,925 1,873 (38.03%) 2,976 (60.43%) 13 (0.26%) 62 (1.26%) 1 (0.02%)Urban 0 0 (0%) 0 (0%) 0 (0%) 0 (0%) 0 (0%)
10 Total 16,158 5,745 (35.56%) 10,044 (62.16%) 139 (0.86%) 205 (1.27%) 25 (0.15%)Rural 16,158 5,745 (35.56%) 10,044 (62.16%) 139 (0.86%) 205 (1.27%) 25 (0.15%)Urban 0 0 (0%) 0 (0%) 0 (0%) 0 (0%) 0 (0%)Total 116,606 57,196 (49.05%) 55,851 (47.9%) 1,205 (1.03%) 2,209 (1.89%) 145 (0.12%)Rural 108,683 52,243 (48.07%) 53,157 (48.91%) 1,024 (0.94%) 2,148 (1.98%) 111 (0.1%)Urban 7,923 4,953 (62.51%) 2,694 (34%) 181 (2.28%) 61 (0.77%) 34 (0.43%)
Data Source:-Census of India, 2011, HH- series Tables on Houses, Household amenities and assets.
Table -7 : Number and Percentage of Households by availablity of Kitchen facility, 2011Sl. No.
Name of Sub-District
Total/ Rural/ Urban
Total number of households
Number and Percentage of households having kitchenCooking inside house Cooking outside house No cooking
Note: Percentage is given in brackets after the number of households.
Sub-District - Simdega
(2036702718)
Sub-District - Pakar Tanr (2036702719)
Sub-District - Kurdeg
(2036702720)
Sub-District - Kersai (2036702721)
Sub-District - Bolba (2036702722)
Sub-District - Thethaitangar (2036702723)
Sub-District - Kolebira
(2036702724)
Sub-District - Jaldega
(2036702725)
Sub-District - Bansjor
(2036702726)
Sub-District - Bano (2036702727)
District - Simdega (20367)
159

Firewood Crop residue Cowdung cake Coal/ lignite/ charcoal
1 2 3 4 5 6 7 81 Total 21,687 18,501 (85.31%) 215 (0.99%) 84 (0.39%) 12 (0.06%)
Rural 13,764 13,371 (97.14%) 107 (0.78%) 52 (0.38%) 0 (0%)Urban 7,923 5,130 (64.75%) 108 (1.36%) 32 (0.4%) 12 (0.15%)
2 Total 7,300 7,238 (99.15%) 37 (0.51%) 14 (0.19%) 0 (0%)Rural 7,300 7,238 (99.15%) 37 (0.51%) 14 (0.19%) 0 (0%)Urban 0 0 (0%) 0 (0%) 0 (0%) 0 (0%)
3 Total 9,726 9,574 (98.44%) 80 (0.82%) 6 (0.06%) 1 (0.01%)Rural 9,726 9,574 (98.44%) 80 (0.82%) 6 (0.06%) 1 (0.01%)Urban 0 0 (0%) 0 (0%) 0 (0%) 0 (0%)
4 Total 7,369 7,141 (96.91%) 150 (2.04%) 24 (0.33%) 0 (0%)Rural 7,369 7,141 (96.91%) 150 (2.04%) 24 (0.33%) 0 (0%)Urban 0 0 (0%) 0 (0%) 0 (0%) 0 (0%)
5 Total 6,132 6,011 (98.03%) 67 (1.09%) 23 (0.38%) 0 (0%)Rural 6,132 6,011 (98.03%) 67 (1.09%) 23 (0.38%) 0 (0%)Urban 0 0 (0%) 0 (0%) 0 (0%) 0 (0%)
6 Total 17,202 16,911 (98.31%) 105 (0.61%) 46 (0.27%) 4 (0.02%)Rural 17,202 16,911 (98.31%) 105 (0.61%) 46 (0.27%) 4 (0.02%)Urban 0 0 (0%) 0 (0%) 0 (0%) 0 (0%)
7 Total 13,879 13,418 (96.68%) 142 (1.02%) 2 (0.01%) 3 (0.02%)Rural 13,879 13,418 (96.68%) 142 (1.02%) 2 (0.01%) 3 (0.02%)Urban 0 0 (0%) 0 (0%) 0 (0%) 0 (0%)
8 Total 12,228 11,961 (97.82%) 120 (0.98%) 1 (0.01%) 6 (0.05%)Rural 12,228 11,961 (97.82%) 120 (0.98%) 1 (0.01%) 6 (0.05%)Urban 0 0 (0%) 0 (0%) 0 (0%) 0 (0%)
9 Total 4,925 4,904 (99.57%) 11 (0.22%) 0 (0%) 1 (0.02%)Rural 4,925 4,904 (99.57%) 11 (0.22%) 0 (0%) 1 (0.02%)Urban 0 0 (0%) 0 (0%) 0 (0%) 0 (0%)
10 Total 16,158 15,785 (97.69%) 177 (1.1%) 17 (0.11%) 0 (0%)Rural 16,158 15,785 (97.69%) 177 (1.1%) 17 (0.11%) 0 (0%)Urban 0 0 (0%) 0 (0%) 0 (0%) 0 (0%)Total 116,606 111,444 (95.57%) 1,104 (0.95%) 217 (0.19%) 27 (0.02%)Rural 108,683 106,314 (97.82%) 996 (0.92%) 185 (0.17%) 15 (0.01%)Urban 7,923 5,130 (64.75%) 108 (1.36%) 32 (0.4%) 12 (0.15%)
Data Source:-Census of India, 2011, HH- series Tables on Houses, Household amenities and assets.
Number and percentage of households bySl. No.
Name of Sub-District Total/ Rural/ Urban
Total number of households
Table -8 : Number and Percentage of Households
Note: Percentage is given in brackets after the number of households.
Sub-District - Simdega (2036702718)
Sub-District - Pakar Tanr (2036702719)
Sub-District - Kurdeg (2036702720)
Sub-District - Kersai (2036702721)
Sub-District - Bolba (2036702722)
Sub-District - Thethaitangar (2036702723)
Sub-District - Kolebira (2036702724)
Sub-District - Jaldega (2036702725)
Sub-District - Bansjor (2036702726)
Sub-District - Bano (2036702727)
District - Simdega (20367)
160
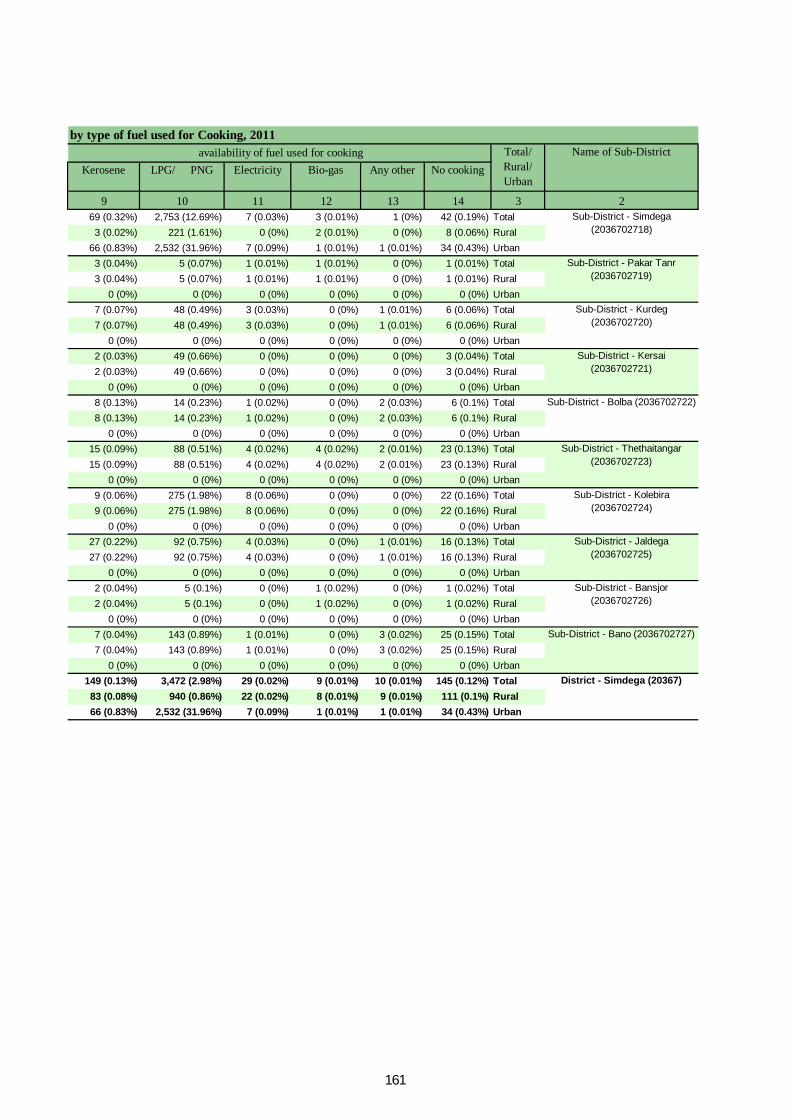
Kerosene LPG/ PNG Electricity Bio-gas Any other No cooking
9 10 11 12 13 14 3 269 (0.32%) 2,753 (12.69%) 7 (0.03%) 3 (0.01%) 1 (0%) 42 (0.19%) Total3 (0.02%) 221 (1.61%) 0 (0%) 2 (0.01%) 0 (0%) 8 (0.06%) Rural
66 (0.83%) 2,532 (31.96%) 7 (0.09%) 1 (0.01%) 1 (0.01%) 34 (0.43%) Urban3 (0.04%) 5 (0.07%) 1 (0.01%) 1 (0.01%) 0 (0%) 1 (0.01%) Total3 (0.04%) 5 (0.07%) 1 (0.01%) 1 (0.01%) 0 (0%) 1 (0.01%) Rural
0 (0%) 0 (0%) 0 (0%) 0 (0%) 0 (0%) 0 (0%) Urban7 (0.07%) 48 (0.49%) 3 (0.03%) 0 (0%) 1 (0.01%) 6 (0.06%) Total7 (0.07%) 48 (0.49%) 3 (0.03%) 0 (0%) 1 (0.01%) 6 (0.06%) Rural
0 (0%) 0 (0%) 0 (0%) 0 (0%) 0 (0%) 0 (0%) Urban2 (0.03%) 49 (0.66%) 0 (0%) 0 (0%) 0 (0%) 3 (0.04%) Total2 (0.03%) 49 (0.66%) 0 (0%) 0 (0%) 0 (0%) 3 (0.04%) Rural
0 (0%) 0 (0%) 0 (0%) 0 (0%) 0 (0%) 0 (0%) Urban8 (0.13%) 14 (0.23%) 1 (0.02%) 0 (0%) 2 (0.03%) 6 (0.1%) Total8 (0.13%) 14 (0.23%) 1 (0.02%) 0 (0%) 2 (0.03%) 6 (0.1%) Rural
0 (0%) 0 (0%) 0 (0%) 0 (0%) 0 (0%) 0 (0%) Urban15 (0.09%) 88 (0.51%) 4 (0.02%) 4 (0.02%) 2 (0.01%) 23 (0.13%) Total15 (0.09%) 88 (0.51%) 4 (0.02%) 4 (0.02%) 2 (0.01%) 23 (0.13%) Rural
0 (0%) 0 (0%) 0 (0%) 0 (0%) 0 (0%) 0 (0%) Urban9 (0.06%) 275 (1.98%) 8 (0.06%) 0 (0%) 0 (0%) 22 (0.16%) Total9 (0.06%) 275 (1.98%) 8 (0.06%) 0 (0%) 0 (0%) 22 (0.16%) Rural
0 (0%) 0 (0%) 0 (0%) 0 (0%) 0 (0%) 0 (0%) Urban27 (0.22%) 92 (0.75%) 4 (0.03%) 0 (0%) 1 (0.01%) 16 (0.13%) Total27 (0.22%) 92 (0.75%) 4 (0.03%) 0 (0%) 1 (0.01%) 16 (0.13%) Rural
0 (0%) 0 (0%) 0 (0%) 0 (0%) 0 (0%) 0 (0%) Urban2 (0.04%) 5 (0.1%) 0 (0%) 1 (0.02%) 0 (0%) 1 (0.02%) Total2 (0.04%) 5 (0.1%) 0 (0%) 1 (0.02%) 0 (0%) 1 (0.02%) Rural
0 (0%) 0 (0%) 0 (0%) 0 (0%) 0 (0%) 0 (0%) Urban7 (0.04%) 143 (0.89%) 1 (0.01%) 0 (0%) 3 (0.02%) 25 (0.15%) Total7 (0.04%) 143 (0.89%) 1 (0.01%) 0 (0%) 3 (0.02%) 25 (0.15%) Rural
0 (0%) 0 (0%) 0 (0%) 0 (0%) 0 (0%) 0 (0%) Urban149 (0.13%) 3,472 (2.98%) 29 (0.02%) 9 (0.01%) 10 (0.01%) 145 (0.12%) Total83 (0.08%) 940 (0.86%) 22 (0.02%) 8 (0.01%) 9 (0.01%) 111 (0.1%) Rural66 (0.83%) 2,532 (31.96%) 7 (0.09%) 1 (0.01%) 1 (0.01%) 34 (0.43%) Urban
by type of fuel used for Cooking, 2011 availability of fuel used for cooking Name of Sub-DistrictTotal/
Rural/ Urban
Sub-District - Simdega (2036702718)
Sub-District - Pakar Tanr (2036702719)
Sub-District - Kurdeg (2036702720)
Sub-District - Kersai (2036702721)
Sub-District - Bolba (2036702722)
District - Simdega (20367)
Sub-District - Thethaitangar (2036702723)
Sub-District - Kolebira (2036702724)
Sub-District - Jaldega (2036702725)
Sub-District - Bansjor (2036702726)
Sub-District - Bano (2036702727)
161
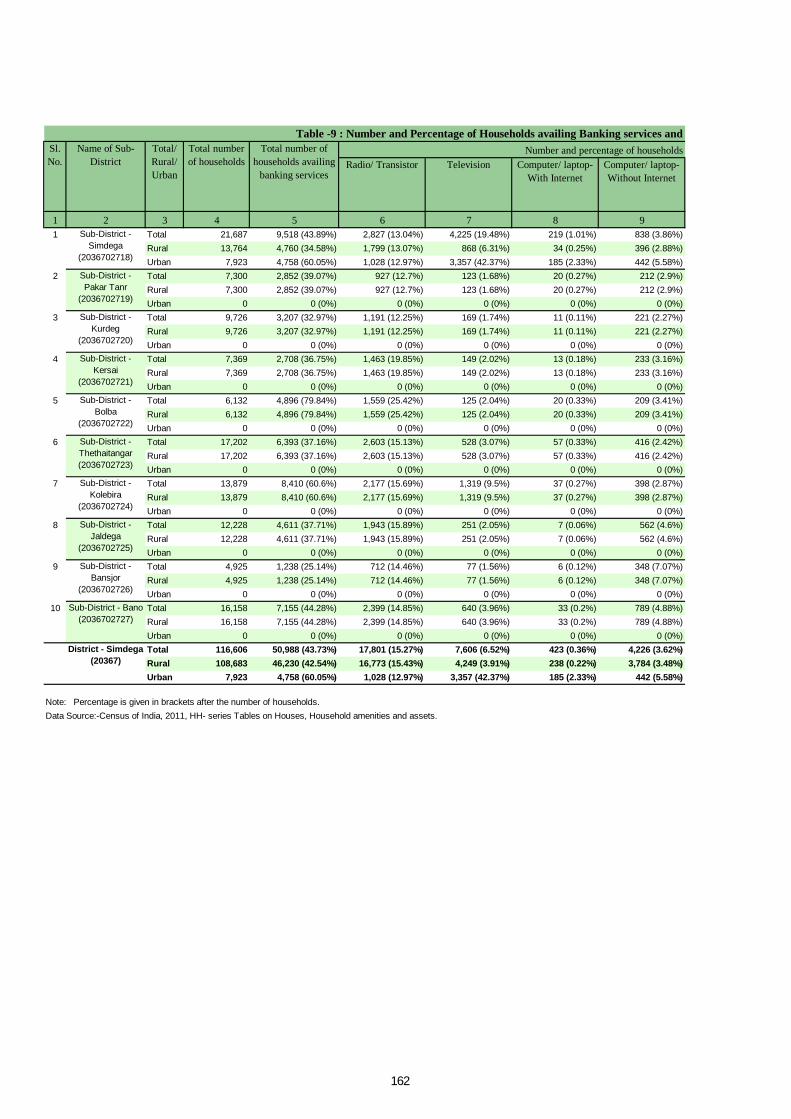
Radio/ Transistor Television Computer/ laptop- With Internet
Computer/ laptop- Without Internet
1 2 3 4 5 6 7 8 91 Total 21,687 9,518 (43.89%) 2,827 (13.04%) 4,225 (19.48%) 219 (1.01%) 838 (3.86%)
Rural 13,764 4,760 (34.58%) 1,799 (13.07%) 868 (6.31%) 34 (0.25%) 396 (2.88%)Urban 7,923 4,758 (60.05%) 1,028 (12.97%) 3,357 (42.37%) 185 (2.33%) 442 (5.58%)
2 Total 7,300 2,852 (39.07%) 927 (12.7%) 123 (1.68%) 20 (0.27%) 212 (2.9%)Rural 7,300 2,852 (39.07%) 927 (12.7%) 123 (1.68%) 20 (0.27%) 212 (2.9%)Urban 0 0 (0%) 0 (0%) 0 (0%) 0 (0%) 0 (0%)
3 Total 9,726 3,207 (32.97%) 1,191 (12.25%) 169 (1.74%) 11 (0.11%) 221 (2.27%)Rural 9,726 3,207 (32.97%) 1,191 (12.25%) 169 (1.74%) 11 (0.11%) 221 (2.27%)Urban 0 0 (0%) 0 (0%) 0 (0%) 0 (0%) 0 (0%)
4 Total 7,369 2,708 (36.75%) 1,463 (19.85%) 149 (2.02%) 13 (0.18%) 233 (3.16%)Rural 7,369 2,708 (36.75%) 1,463 (19.85%) 149 (2.02%) 13 (0.18%) 233 (3.16%)Urban 0 0 (0%) 0 (0%) 0 (0%) 0 (0%) 0 (0%)
5 Total 6,132 4,896 (79.84%) 1,559 (25.42%) 125 (2.04%) 20 (0.33%) 209 (3.41%)Rural 6,132 4,896 (79.84%) 1,559 (25.42%) 125 (2.04%) 20 (0.33%) 209 (3.41%)Urban 0 0 (0%) 0 (0%) 0 (0%) 0 (0%) 0 (0%)
6 Total 17,202 6,393 (37.16%) 2,603 (15.13%) 528 (3.07%) 57 (0.33%) 416 (2.42%)Rural 17,202 6,393 (37.16%) 2,603 (15.13%) 528 (3.07%) 57 (0.33%) 416 (2.42%)Urban 0 0 (0%) 0 (0%) 0 (0%) 0 (0%) 0 (0%)
7 Total 13,879 8,410 (60.6%) 2,177 (15.69%) 1,319 (9.5%) 37 (0.27%) 398 (2.87%)Rural 13,879 8,410 (60.6%) 2,177 (15.69%) 1,319 (9.5%) 37 (0.27%) 398 (2.87%)Urban 0 0 (0%) 0 (0%) 0 (0%) 0 (0%) 0 (0%)
8 Total 12,228 4,611 (37.71%) 1,943 (15.89%) 251 (2.05%) 7 (0.06%) 562 (4.6%)Rural 12,228 4,611 (37.71%) 1,943 (15.89%) 251 (2.05%) 7 (0.06%) 562 (4.6%)Urban 0 0 (0%) 0 (0%) 0 (0%) 0 (0%) 0 (0%)
9 Total 4,925 1,238 (25.14%) 712 (14.46%) 77 (1.56%) 6 (0.12%) 348 (7.07%)Rural 4,925 1,238 (25.14%) 712 (14.46%) 77 (1.56%) 6 (0.12%) 348 (7.07%)Urban 0 0 (0%) 0 (0%) 0 (0%) 0 (0%) 0 (0%)
10 Total 16,158 7,155 (44.28%) 2,399 (14.85%) 640 (3.96%) 33 (0.2%) 789 (4.88%)Rural 16,158 7,155 (44.28%) 2,399 (14.85%) 640 (3.96%) 33 (0.2%) 789 (4.88%)Urban 0 0 (0%) 0 (0%) 0 (0%) 0 (0%) 0 (0%)Total 116,606 50,988 (43.73%) 17,801 (15.27%) 7,606 (6.52%) 423 (0.36%) 4,226 (3.62%)Rural 108,683 46,230 (42.54%) 16,773 (15.43%) 4,249 (3.91%) 238 (0.22%) 3,784 (3.48%)Urban 7,923 4,758 (60.05%) 1,028 (12.97%) 3,357 (42.37%) 185 (2.33%) 442 (5.58%)
Table -9 : Number and Percentage of Households availing Banking services and Total number of households
Total number of households availing
banking services
Number and percentage of households Sl. No.
Name of Sub-District
Total/ Rural/ Urban
Sub-District - Simdega
(2036702718)
Sub-District - Pakar Tanr
(2036702719)
Sub-District - Kurdeg
(2036702720)
Sub-District - Kersai
(2036702721)
Sub-District - Bolba
(2036702722)
Data Source:-Census of India, 2011, HH- series Tables on Houses, Household amenities and assets.Note: Percentage is given in brackets after the number of households.
Sub-District - Thethaitangar (2036702723)
Sub-District - Kolebira
(2036702724)
Sub-District - Jaldega
(2036702725)
Sub-District - Bansjor
(2036702726)
Sub-District - Bano (2036702727)
District - Simdega (20367)
162

Land line Telephone
Mobile Telephone Both Land line and Mobile Telephone
Bicycle Scooter/ Motor Cycle/ Moped
Car/ Jeep/ Van None of the specified asset
10 11 12 13 14 15 16 3 2296 (1.36%) 7,947 (36.64%) 396 (1.83%) 15,375 (70.9%) 3,751 (17.3%) 495 (2.28%) 3,603 (16.61%) Total101 (0.73%) 3,154 (22.91%) 129 (0.94%) 10,318 (74.96%) 1,184 (8.6%) 164 (1.19%) 2,592 (18.83%) Rural195 (2.46%) 4,793 (60.49%) 267 (3.37%) 5,057 (63.83%) 2,567 (32.4%) 331 (4.18%) 1,011 (12.76%) Urban47 (0.64%) 1,165 (15.96%) 55 (0.75%) 5,324 (72.93%) 494 (6.77%) 31 (0.42%) 1,661 (22.75%) Total47 (0.64%) 1,165 (15.96%) 55 (0.75%) 5,324 (72.93%) 494 (6.77%) 31 (0.42%) 1,661 (22.75%) Rural
0 (0%) 0 (0%) 0 (0%) 0 (0%) 0 (0%) 0 (0%) 0 (0%) Urban76 (0.78%) 1,570 (16.14%) 30 (0.31%) 6,686 (68.74%) 653 (6.71%) 48 (0.49%) 2,413 (24.81%) Total76 (0.78%) 1,570 (16.14%) 30 (0.31%) 6,686 (68.74%) 653 (6.71%) 48 (0.49%) 2,413 (24.81%) Rural
0 (0%) 0 (0%) 0 (0%) 0 (0%) 0 (0%) 0 (0%) 0 (0%) Urban44 (0.6%) 1,002 (13.6%) 78 (1.06%) 5,626 (76.35%) 475 (6.45%) 49 (0.66%) 1,381 (18.74%) Total44 (0.6%) 1,002 (13.6%) 78 (1.06%) 5,626 (76.35%) 475 (6.45%) 49 (0.66%) 1,381 (18.74%) Rural
0 (0%) 0 (0%) 0 (0%) 0 (0%) 0 (0%) 0 (0%) 0 (0%) Urban85 (1.39%) 966 (15.75%) 60 (0.98%) 4,639 (75.65%) 355 (5.79%) 61 (0.99%) 1,068 (17.42%) Total85 (1.39%) 966 (15.75%) 60 (0.98%) 4,639 (75.65%) 355 (5.79%) 61 (0.99%) 1,068 (17.42%) Rural
0 (0%) 0 (0%) 0 (0%) 0 (0%) 0 (0%) 0 (0%) 0 (0%) Urban143 (0.83%) 2,991 (17.39%) 172 (1%) 13,566 (78.86%) 1,102 (6.41%) 135 (0.78%) 2,765 (16.07%) Total143 (0.83%) 2,991 (17.39%) 172 (1%) 13,566 (78.86%) 1,102 (6.41%) 135 (0.78%) 2,765 (16.07%) Rural
0 (0%) 0 (0%) 0 (0%) 0 (0%) 0 (0%) 0 (0%) 0 (0%) Urban168 (1.21%) 3,554 (25.61%) 147 (1.06%) 10,524 (75.83%) 1,175 (8.47%) 151 (1.09%) 2,358 (16.99%) Total168 (1.21%) 3,554 (25.61%) 147 (1.06%) 10,524 (75.83%) 1,175 (8.47%) 151 (1.09%) 2,358 (16.99%) Rural
0 (0%) 0 (0%) 0 (0%) 0 (0%) 0 (0%) 0 (0%) 0 (0%) Urban139 (1.14%) 2,343 (19.16%) 64 (0.52%) 9,237 (75.54%) 706 (5.77%) 69 (0.56%) 2,178 (17.81%) Total139 (1.14%) 2,343 (19.16%) 64 (0.52%) 9,237 (75.54%) 706 (5.77%) 69 (0.56%) 2,178 (17.81%) Rural
0 (0%) 0 (0%) 0 (0%) 0 (0%) 0 (0%) 0 (0%) 0 (0%) Urban37 (0.75%) 952 (19.33%) 20 (0.41%) 3,677 (74.66%) 227 (4.61%) 13 (0.26%) 976 (19.82%) Total37 (0.75%) 952 (19.33%) 20 (0.41%) 3,677 (74.66%) 227 (4.61%) 13 (0.26%) 976 (19.82%) Rural
0 (0%) 0 (0%) 0 (0%) 0 (0%) 0 (0%) 0 (0%) 0 (0%) Urban155 (0.96%) 2,728 (16.88%) 74 (0.46%) 11,368 (70.36%) 804 (4.98%) 106 (0.66%) 3,670 (22.71%) Total155 (0.96%) 2,728 (16.88%) 74 (0.46%) 11,368 (70.36%) 804 (4.98%) 106 (0.66%) 3,670 (22.71%) Rural
0 (0%) 0 (0%) 0 (0%) 0 (0%) 0 (0%) 0 (0%) 0 (0%) Urban1,190 (1.02%) 25,218 (21.63%) 1,096 (0.94%) 86,022 (73.77%) 9,742 (8.35%) 1,158 (0.99%) 22,073 (18.93%) Total
995 (0.92%) 20,425 (18.79%) 829 (0.76%) 80,965 (74.5%) 7,175 (6.6%) 827 (0.76%) 21,062 (19.38%) Rural195 (2.46%) 4,793 (60.49%) 267 (3.37%) 5,057 (63.83%) 2,567 (32.4%) 331 (4.18%) 1,011 (12.76%) Urban
number of Households having each of the specified assets in, 2011 having each of the following specified assets Name of Sub-
DistrictTotal/ Rural/ Urban
Sub-District - Simdega
(2036702718)
Sub-District - Pakar Tanr
(2036702719)
Sub-District - Kurdeg
(2036702720)
Sub-District - Kersai
(2036702721)
Sub-District - Bolba
(2036702722)
District - Simdega (20367)
Sub-District - Thethaitangar (2036702723)
Sub-District - Kolebira
(2036702724)
Sub-District - Jaldega
(2036702725)
Sub-District - Bansjor
(2036702726)
Sub-District - Bano (2036702727)
163

ORGI-JHARKHAND English - (10-2011)
Directorate of Census Operations, Jharkhand Ministry of Home Affairs, Government of India RIADA Central Office Building, 2nd Floor Industrial Area Namkum, Ranchi-834010 Email: [email protected] Website: http://www.censusindia.gov.in


