Dolar Et Al. 2006 Distributional Ecology of Small Cetaceans in the Philippines

Distributional range, ecology and mating system of the
Cape mole-rat, Georychus capensis family Bathyergidae
J. H. Visser, N. C. Bennett and B. Jansen van Vuuren
J. H. Visser
Molecular Zoology Laboratory, Department of Zoology, University of Johannesburg, P.O.
Box 524, Auckland Park 2000, South Africa
N. C. Bennett
Department of Zoology and Entomology, University of Pretoria, Pretoria 0002, South Africa
B. Jansen van Vuuren
Molecular Zoology Laboratory, Department of Zoology, University of Johannesburg, P.O.
Box 524, Auckland Park 2000, South Africa
Corresponding author: B. Jansen van Vuuren
Address: Molecular Zoology Laboratory, Department of Zoology, University of
Johannesburg, P.O. Box 524, Auckland Park 2000, South Africa
Tel.: +27 11 559 2457
Email: [email protected]
1

Distributional range, ecology and mating system of the Cape mole-rat, Georychus capensis
family Bathyergidae
J. H. Visser, N. C. Bennett and B. Jansen van Vuuren
Abstract
Interpopulation variation in life-history patterns are influenced by intrinsic and extrinsic
factors. Life-history patterns have been intensely studied in the eusocial African bathyergid
species, largely neglecting the solitary species. Of these solitary genera, the Cape mole-rat,
Georychus capensis (Pallas 1778), is endemic to South Africa with a disjunct distribution
across its range. Knowledge regarding this species is rudimentary and therefore this study
aimed to investigate the current distribution of the species with particular attention to
common ecological variables, differences in body size between localities and sexes, as well
as its reproduction and mating system. Georychus is a habitat specialist restricted to specific
ecological areas. A lack of sexual size dimorphism and correlation between male testis size
and the number of females in the population, suggests a polygynous mating system,
facilitated by the spatial distribution of the sexes. A positive relationship between male testes
size and the percentage of females in populations sampled suggests that larger sperm reserves
(i.e., larger testes) are required in populations with a higher percentage of females. In
addition, mating variables (testicular size and litter size) are linked to ecological factors
(elevation, aridity, soil- and vegetation type) which could impact mate searching, mating
success and food resources.
Key words: Georychus capensis; Cape mole-rat; mating system; seasonal breeding; male
multiple mating
2

Introduction
Life-history variation is influenced by local adaptation to the environment (e.g., Berven 1982;
Rohr 1997 and references therein; Lüddecke 2002; Laugen et al. 2003) and influences
population dynamics and species’ distributions (Rohr 1997). Measure of reproductive
investment including male testes size, female litter size and offspring sex ratio is influenced
by a myriad of factors including: breeding season, body mass, population density, social
system, individual physiological and genetic factors, food availability, mortality, altitude and
latitude (Millar 1973 and references therein; Nakata 1984). In addition, sperm competition
(Merilä and Sheldon 1998; Jolly and Phillips-Conroy 2001; Preston et al. 2002; Schulte-
Hostedde and Millar 2004; Hettyey and Roberts 2006), scramble competition polygyny
(Clutton-Brock 1989; Davies 1991), the temporal and spatial distribution of the sexes (Davies
1991; Reynolds 1996) and the operational sex ratio of a species (Greenwood 1980; Hettyey
and Roberts 2006) are also influential in determining intraspecific variation in reproductive
biology. Such intraspecific geographic variation has been demonstrated in litter size (Hill
1972; Waltner 1991; Mathies and Andrews 1995; Rohr 1997; Lemos-Espinal et al. 1998) and
testicular size (Merilä and Sheldon 1998; Hettyey et al. 2005) due to various ecological and
biological factors.
The family Bathyergidae is a monophyletic family of obligatory subterranean hystricognath
rodents endemic to sub-Saharan Africa. Six genera are currently recognized namely
Heterocephalus, Heliophobius, Bathyergus, Georychus, Cryptomys and Fukomys (Honeycutt
et al. 1987; Janecek et al. 1992; Burda 2000; Faulkes et al. 2004; Ingram et al. 2004; Van
Daele et al. 2007; Kock et al. 2009). The social structures exhibited by these genera appear to
be linked to ecological factors (Bennett 1988; but see Burda 2000). Two of the genera have
received much attention in the reproductive biology literature due to their eusociality
3

(Heterocephalus and Cryptomys, Bennett and Faulkes 2000). Captive breeding of animals for
the past few decades have resulted in a considerable knowledge of their reproductive biology
(Šumbera et al. 2003 and references therein). The solitary genera (Georychus, Bathyergus and
Heliophobius) have received far less attention with only minor aspects of their reproductive
biology being investigated (Jarvis 1969; van der Horst 1972; Bennett and Jarvis 1988;
Bennett et al. 1991).
Georychus, a monotypic genus, has a disjunct distribution across South Africa in the coastal
dunes and sandy deposits along rivers and inter-montane valleys of the Western Cape, south-
western KwaZulu-Natal and in Mpumalanga (see Figure 1; De Graaff 1981; Nanni 1988;
Bronner 1990; Skinner and Chimimba 2005; Bennett et al. 2006). Fossil evidence suggests
that Georychus once had a much wider distribution (Hendey 1969; Klein 1974; Avery 1998,
2000), which contracted during the Quaternary (Klein 1974; Avery 1991, 2000). Populations
in Mpumalanga and KwaZulu-Natal Provinces might therefore represent geographical relicts
(Avery 1991).
The Cape mole-rat (Georychus capensis; Pallas 1778) is a solitary and strongly territorial
species (Bennett and Jarvis 1988; Narins et al. 1992) with an obligatory subterranean lifestyle
(Taylor et al. 1985). Burrows are extended to obtain food and mates (Bennett 1988; Du Toit
et al. 1985) and mate attraction is initiated by the males in the form of hind foot drumming
(Bennett and Jarvis 1988; Narins et al. 1992; Bennett et al. 2006). The onset of this
drumming breaks down territoriality between individuals and courtship is accompanied by
increased testosterone levels (but see Oosthuizen and Bennett 2009) and enlargement of the
testes and reproductive glands in males (Bennett 1988; Bennett et al. 2006).
4

Figure 1 Map showing localities where G. capensis were sampled across South Africa. The
distributional range (shaded) of the species is indicated (based on historical records).
Previous research on G. capensis has focused on its physiology (Oosthuizen et al. 2003,
Oosthuizen and Bennett 2007; Oosthuizen et al. 2008; Oosthuizen and Bennett 2009),
reproductive biology (Taylor et al. 1985; Bennett 1988; Bennett and Jarvis 1988; Kinahan et
al. 2008), intergeneric relationships (Honeycutt et al. 1987; Nevo et al. 1987; Allard and
Honeycutt 1992; Faulkes et al. 2004; Ingram et al. 2004), age determination (Taylor et al.
1985), seismic communication (Narins et al. 1992), energetic cost of digging (Du Toit et al.
1985; Scantlebury et al. 2006), influence on plant communities (Hagenah and Bennett 2012)
and burrowing dynamics (Romañach 2005; Thomas et al. 2012). Invariably, sample sizes in
these studies were small and biased towards single regions within the distributional range,
especially the western Cape Province. Consequently, little is known about the biology,
ecology and mating system of this species across its entire distributional range, and whether
regional differences might be present.
5

Here, by including larger sample sizes for populations from across the entire South African
range, we aim to 1) determine the current distribution of G. capensis and identify common
ecological variables influencing the distribution of suitable habitat for this species, 2)
investigate whether differences exist in body size across the range or between the sexes, 3)
investigate the reproductive biology of this species and compare testicular size and litter size
across the distribution so as to infer possible mating strategies and 4) to identify ecological
factors contributing to variation in reproductive parameters across the species range by
exploring correlations between ecological factors and both testes size and litter size. A
thorough understanding of the biology of species including distributions and ecological
impacts may provide vital information for conservation and management. Documentation of
variation in life history parameters across a species range may provide insight into the
adaptive basis and evolution of such variation and the evolution of life-history patterns in
mole-rats in general. Georychus capensis is currently classified as least concern (IUCN)
because of its relatively widespread distribution and absence of significant threats (Maree and
Faulkes 2008). Novel information on this genus may therefore better inform its conservation
status, especially given the fragmented nature of populations across the species range.
Materials and Methods
Sampling and laboratory procedures
Specimens of Georychus capensis were collected from 15 distinct localities (Figure 1; see
Table 2 for sample sizes and capture months) across their distributional range in the western
Cape (CapeNature Permit Number: 0056-AAA041-00084), KwaZulu-Natal (EKZNW Permit
Number: OP1716/2016) and Mpumalanga (MPTA Permit Number: 5524). In total, 383 G.
capensis were captured across their range comprising 122 males and 261 females. Specimens
6

were captured by placing Gophinator traps baited with peanut butter inside the burrow
systems. These traps are specifically designed to instantaneously and humanely kill rodents
the size of G. capensis (200mm long and 400g in mass). This practice was approved by the
Ethics Committee of the University of Johannesburg (Ethics number 215086650-10/09/15).
Traps were checked every hour and the killed animals were removed and immediately frozen
at -10 °C. To obtain body mass, specimens were weighed (in grams) on a RADWAG
electronic scale accurate to two decimal places. Body length was measured (in millimetres) in
a straight line from the tip of the nose to the base of the tail using a standard measuring tape.
Animals were dissected to confirm sex and the embryos removed from gravid females while
the testes of males were removed. The embryos and testes were weighed (in grams) on a
Sartorius research scale (Sarto Mass Services CC, Zeiss, West Germany) accurate to five
decimal places. Both testes were weighed together to determine total mass; similarly, the
embryos were also weighed together to determine total mass.
Ecological variables
Broad ecological variables were noted (i.e., landscape type and elevation) for each sampling
area (Table 1). Further geographical and climatological information of these areas were
gathered from the literature and databases; these included aspects of geology, soil type,
deposit age (from Keyser 1997), rainfall and vegetation type (from Mucina and Rutherford
2006).
Statistical procedures
Statistical procedures were carried out using IBM SPSS Statistics version 20.0.0
(International Business Machines Corporation 2011). The data for the sexes were analysed
7

Table 1 Information on the sampled G. capensis specimens showing the sampling locality, coordinates of the sampling locality, elevation above sea-level (in
metres) where animals were collected, mean rainfall of the locality (from Mucina and Rutherford 2006), type of area where animals were sampled, soil type
of that area (from Keyser 1997), the age of the particular soil type and the vegetation type of the area (from Mucina and Rutherford 2006).
Locality Coordinates Elevation Mean rainfall Sampling area Soil type Deposit age Vegetation type
Nieuwoudt-ville S 31°22'; E 19°06' 720 285 Grazed area near vlei
Tillite; sandstone;
shale
Palaeozoic
Nieuwoudt-ville
Shale Renosterveld
Citrusdal S 32°36'; E 19°01' 160 260
Grazed area near vlei
and river
Shale; sandstone Palaeozoic
Leipoldtville Sand
Fynbos
Moorreesburg S 33°17'; E 18°34' 90 425 Grazed area near vlei
Unconsolidated
superficial deposits
(limestone;
sandstone)
Cainozoic
Swartland Silcrete
Renosterveld
Darling S 33°24'; E 18°24' 140 520 Grazed area near vlei
Unconsolidated
superficial deposits
(limestone;
sandstone)
Cainozoic
Swartland Granite
Renosterveld
Wolseley S 33°24'; E 19°12' 280 480 Grazed area near vlei
Unconsolidated
superficial deposits
(limestone;
Cainozoic
Breede Alluvium
Fynbos
8

sandstone)
Ceres S 33°12'; E 19°14' 900 570
Grazed area near vlei
and river
Shale; sandstone Palaeozoic
Kouebokkeveld
Shale Fynbos
Paarl S 33°44'; E 18°58' 110 655
Rugby field near
river
Quartzite; shale;
tillite
Palaeozoic
Swartland Alluvium
Fynbos
Worcester S 33°40'; E 19°31' 240 265
Lawns near vlei and
river
Unconsolidated
superficial deposits
(limestone;
sandstone)
Cainozoic
Breede Alluvium
Renosterveld
Cape Town S 34°00'; E 18°31' 20 575 Lawn near vlei
Unconsolidated
superficial deposits
(limestone;
sandstone)
Cainozoic
Cap Flats Sand
Fynbos
Struisbaai S 34°41'; E 20°00' 5 475 Grazed area near vlei
Unconsolidated
superficial deposits
(limestone;
sandstone)
Cainozoic
Agulhas Sand
Fynbos
Swellendam S 34°03'; E 20°25' 90 520
Grazed area near
river
Conglomerate; shale;
sandstone; limestone
Mesozoic
Swellendam Silcrete
Fynbos
9

Oudshoorn S 33°51'; E 22°02' 600 785
Grazed area near vlei
and river
Quartzite; shale;
tillite
Palaeozoic
South Outeniqua
Sandstone Fynbos
Nottingham Road S 29°29'; E 29°52' 1800 890 Grazed area near vlei
Shale; mudstone;
sandstone; grit; coal
Mesozoic
Drakensberg
Foothill Moist
Grassland
Wakkerstroom S 27°18'; E 30°16' 2000 902 Grazed area near vlei
Shale; mudstone;
sandstone; grit; coal
Mesozoic
Wakkerstroom
Montane Grassland
Belfast S 25°33'; E 30°04' 1940 858 Grazed area near vlei
Quartzite; shale;
limestone; andesite;
tuff; hornfels;
conglomerates
Precambrian
Lydenburg Montane
Grassland
10

together as well as separately. Non-parametric tests were used for analyses as the data were
non-normally distributed.
For gravid females, the mass of the removed embryos was subtracted from their total body
mass to obtain the true field mass of non-pregnant females. Because the smallest gravid
female weighed 121 g (with embryos removed; Table 2), this mass was considered to be the
minimum reproductive mass for G. capensis. Therefore, females weighing less than 120 g
were considered as juveniles and removed from the datasets to obtain estimates of adult
individuals only. In support of this, young G. capensis reach sexual maturity at approximately
1.5 years of age (Bennett and Faulkes 2000). Given a growth rate of 8.2 g/month for young
mole-rats (Taylor et al. 1985), this gives individuals that weigh less than 120g an age of 15
months, which is well below the reproductive age.
Three different datasets were compiled for mass analyses: these were (i) all individuals
irrespective of sex and age, (ii) only males and (iii) only females (for gravid females, the
mass of embryos were subtracted from total mass). For consistency, these datasets were also
analysed with juvenile animals (with a mass lower than 120g) removed to obtain estimates of
mature animals only. All of these were used to investigate the differences in body mass
between populations across the entire range as well as differences in body mass between
males and females. The body mass of males and females were also compared within each
population to assess possible sexual size dimorphism.
Body mass differences among populations were investigated through a Kruskal-Wallis test in
the IBM SPSS Statistics package. Body mass differences between males and females across
11

Table 2 Information on the sampled G. capensis specimens showing the sampling locality, number of sampled males, mass range (in grams) of sampled
males, number of sampled females, mass range of sampled females (in grams), number of gravid sampled females, the number of embryos contained by these
gravid females, the mass range of these gravid females (embryo mass subtracted) and the month of capture of the gravid individuals. The month of capture for
populations containing no gravid individuals are indicated in brackets.
Locality
Number of
males
Mass range (g)
of males
Number of
females
Mass range (g) of
females
Number of
gravid
females
Number of
embryos
Mass range
(g) of gravid
females
Capture month
Nieuwoudt-ville 1 131 1 247 - - - (5 July)
Citrusdal 4 96 - 181 17 110 - 396 - - - (7 July)
Moorreesburg 44 89 - 322 103 75 - 302 31 173 121 - 302 3 July - 13 August
Darling 12 100 - 407 13 98 - 259 - - - (1 July)
Wolseley 7 138 - 306 16 110 - 258 2 8 162 - 231 24 August
Ceres 11 68 - 264 12 52 - 280 1 8 280 5 September
Paarl 6 145 - 346 12 153 - 385 1 8 290 21 August
Worcester 4 138 - 241 10 147 - 339 9 51 147 - 339 15 August - 19 September
Cape Town 8 208 - 332 17 106 - 365 1 7 218 20 August
Struisbaai 3 61 - 193 17 99 - 208 1 5 160 15 July
Swellendam 3 143 - 290 15 124 - 248 10 38 131 - 248 13 August - 19 September
12

Oudshoorn 9 162 - 315 13 89 - 303 8 34 133 - 303 11 August
Nottingham Road 1 141 2 209 - 233 1 2 209 28 January
Wakkerstroom 6 91 - 243 13 91 - 291 2 2 214 - 230 16 January
Belfast 3 144 - 212 0 - - - - (14 January)
Total 122 - 261 - 67 336 - -
13

the entire distributional range, as well as within each locality, were performed using a non-
parametric Mann-Whitney U test.
To account for any relationship between female size and litter size (allometry in litter size),
the number of embryos in an individual gravid female was regressed (using a linear
regression) against the body mass of the particular gravid female. The residuals of this
relationship were calculated to obtain estimates of female mass-corrected litter sizes.
Differences in mass-corrected litter sizes across the distributional range were compared using
a Kruskal-Wallis test.
Males show enlargement of the testes and reproductive glands at the onset of the breeding
season (Bennett 1988; Bennett et al. 2006). Our sampling period coincided with the G.
capensis mating season as evidenced by the presence of gravid females in all but four of 15
sampling locations (Table 2) and the large, round testes of trapped males (also see Šumbera et
al. 2003). The synchronized sampling over this period would minimize any bias in testicular
mass measurements due to breeding status.
Testicular mass was regressed against male body mass and the residuals of this relationship
calculated to obtain relative testicular mass (a widely used measure of male reproductive
investment; Hettyey et al. 2005) using a linear regression. This analysis was performed
including only adult males (all males weighing less than 120g were removed) from
populations with sample sizes of more than 3 specimens (i.e., small populations were
removed). Differences in relative testicular mass across the distributional range were
compared using a Kruskal-Wallis test.
14

Relative testicular mass was then regressed against the percentage of females, mass-corrected
litter sizes and proportion of gravid females within each population (using a linear regression)
to test for any relationship between male testes size and the relative abundance of females in
a given population, and possible reproductive variables linked to testis size. These analyses
were also performed using a body condition index (mass/length2) for males to account for any
variability in the animals’ condition between sampling localities. As only males were
captured at Belfast (locality 15 on Figure 1), this population was excluded from regression
analyses concerning the proportion of females in populations.
The influence of ecological variables (Table 1) on reproductive parameters was analysed
using several datasets. Reproductive datasets included the relative testicular size in males,
the mass-corrected litter size for females, the average litter size of a population (the average
number of embryos per gravid female), the proportion of gravid females to the total number
of females sampled and the percentage of females in a given population. The influence of the
elevation above sea level and annual rainfall on reproductive variables was investigated using
a linear regression. The impact of deposit age was analysed through a Kruskal-Wallis test
using four deposit age categories: Palaeozoic, Cainozoic, Mesozoic and Precambrian. In
addition, the effect of vegetation type was investigated using a Mann-Whitney U test;
vegetation types were grouped into Fynbos/Renosterveld and Grassland - the former
consisting of shrubland and heathland vegetation and the latter of grasses (see Mucina and
Rutherford 2006). These two vegetation types constitute two strictly different biomes in the
southern African subregion.
15

Results
The mass of males ranged between 61g and 407g, whereas female mass ranged between 52g
and 396g (Table 2). Of the females, 67 were found to be gravid carrying 336 embryos in total
(Table 2). Gravid female mass (with embryos removed) ranged between 121g and 339g.
Mass differences across the distribution
No consistent geographic trend was evident in body masses across the range of G. capensis.
What was notable, however, was that individuals in some populations were on average
consistently larger (e.g., Paarl and Cape Town; localities 7 and 9 on Figure 1) or smaller (e.g.,
Struisbaai; locality 10 on Figure 1) in pairwise comparisons between populations (see Figure
2; Table 3; Supplementary Tables S1 and S2).
Similarly, no general trends were observed when the geographic differences in masses were
compared within sexes. Some populations, however, again differed notably from most other
populations. For females, specimens from e.g., Paarl (locality 7 on Figure 1) were the largest,
whereas those from the Darling and Struisbaai were the smallest (localities 7, 4 and 9
respectively on Figure 1; Figure 2C; Supplementary Tables S1 and S2). For males, specimens
from Cape Town were the largest (locality 9 on Figure 1; Figure 2B; Supplementary Tables
S1 and S2).
As sampling was carried out during the rainy season, seasonal variation in mass could not be
evaluated. Sampling during the wetter periods coincided with the highest vegetation cover
and therefore the highest possible availability of food resources. Little bias is therefore
expected in the body mass data as the body condition of animals during this period should be
similarly influenced across populations.
16

Figure 2 Graphs showing the differences in mass (mean and standard deviation) of G. capensis
individuals between localities for A.) all individuals, B.) males and C.) females. Numbers in brackets
correspond to localities in Figure 1.
17

Table 3 Summary of the statistical results for statistical analyses involving comparisons of mass
between localities, between males of localities and between females of localities for G. capensis
specimens. For each analysis, both the full dataset was used and a dataset of mature animals where all
juvenile animals (<120g) were removed. The Chi-square statistic, degrees of freedom and p-value are
given for each analysis.
Variables Chi-Square df p-value
Mass difference between localities 38.749 14 0.000
Mass difference between localities (juveniles removed) 30.576 14 0.006
Male mass difference between localities 29.636 14 0.009
Male mass difference between localities (juveniles removed) 24.322 14 0.042
Female mass difference between localities 33.624 13 0.001
Female mass difference between localities (juveniles removed) 27.466 13 0.011
18

Table 4 Summary of the statistical results for statistical analyses involving comparisons of mass
between males and females of all localities and within each locality respectively for G. capensis
specimens. For each analysis, both the full dataset was used and a dataset of mature individuals only
where all juvenile animals (<120g) were removed. The Mann-Whitney U statistic, number of females
N(F), number of males N(M), p-value and the mean mass ± standard deviation (in grams) for females
and males respectively are given for each analysis.
Variables Mann-Whitney U N(F) N(M) p-value Mean ± SD (F) Mean ± SD (M)
Male versus female mass
between all localities 14653 261 122 0.209 188 ± 58 197 ± 67
Male versus female mass
between all localities
(juveniles removed)
11367.5 229 109 0.185 199 ± 52 210 ± 60
Population comparisons (All specimens)
Population Mann-Whitney U N(F) N(M) p-value
Citrusdal 13.000 17 4 0.065 221 ± 81 152 ± 40
Moorreesburg 2244.000 103 44 0.926 185 ± 53 186 ± 58
Darling 40.500 13 12 0.040 151 ± 44 217 ± 94
Wolseley 30.500 16 7 0.089 183 ± 52 229 ± 61
Ceres 63.500 12 11 0.880 163 ± 60 167 ± 57
Paarl 36.000 12 6 1.000 240 ± 66 242 ± 65
Worcester 14.000 10 4 0.454 224 ± 59 190 ± 43
Cape Town 22.000 17 8 0.006 200 ± 71 277 ± 45
Struisbaai 24.500 17 3 0.921 149 ± 29 135 ± 67
Swellendam 16.000 15 3 0.498 190 ± 39 220 ± 74
Oudshoorn 37.000 13 9 0.164 190 ± 55 223 ± 48
Nottingham Road 0.000 2 1 0.667 221 ± 17 141
Wakkerstroom 38.500 13 6 0.966 175 ± 53 169 ± 63
Population comparisons (Juveniles removed)
Population Mann-Whitney U N(F) N(M) p-value
Citrusdal 10.000 16 3 0.138 228 ± 78 158 ± 32
Moorreesburg 1693.500 89 39 0.828 197 ± 45 197 ± 52
Darling 28.500 10 11 0.061 165 ± 41 227 ± 90
Wolseley 30.500 14 7 0.172 193 ± 46 229 ± 61
Ceres 31.500 10 8 0.460 180 ± 47 194 ± 38
Paarl 36.000 12 6 1.000 240 ± 66 242 ± 65
Worcester 14.000 10 4 0.454 224 ± 59 190 ± 43
Cape Town 22.000 14 8 0.020 219 ± 63 277 ± 45
Struisbaai 9.500 13 2 0.571 162 ± 20 172 ± 30
Swellendam 16.000 15 3 0.498 190 ± 39 220 ± 74
Oudshoorn 37.000 12 9 0.247 198 ± 48 223 ± 48
Nottingham Road 0.000 2 1 0.667 221 ± 17 141
Wakkerstroom 14.000 11 4 0.343 188 ± 47 207 ± 33
19

Mass differences between the sexes
There was no statistically significant difference in the body masses between males and
females across the range or within localities, even with juveniles removed (Table 4). The only
consistent difference was the specimens from the Cape Town population (locality 9 on Figure
1) where males were larger than females. There was also a significant difference between
male and female masses in the Darling locality (locality 4 on Figure 1) with non-significant
trends towards differences when juveniles were removed.
Litter size
There was a significant relationship (r2 = 0.202, N = 67, p = 0.000) between the mass of a
particular female and the number of embryos carried by that female. Larger females carried
larger litters compared to smaller (and presumably younger) females (Supplementary Figure
S4). In addition, significant variation (Chi-Square = 19.364, df = 10, p = 0.036) in mass-
corrected litter size was evident across the distributional range.
Testicular size differences across the distribution
Testicular mass was significantly and positively correlated with body mass in all instances
(all mature animals with juveniles removed, all animals belonging to smaller populations
removed, mature animals with juveniles and small populations removed; Table 5). While
there was a significant and strong correlation (r2 = 0.654, N = 97, p = 0.000) between body
mass and body length (Supplementary Figure S1), the body condition index performed poorly
at explaining testicular size relative to analyses using only body mass as a proxy for animal
size (Table 5). Similarly, the relationship between relative (to body condition index) testicular
size and the percentage of females in a given population was also weaker than when using
only relative (to body mass) testicular size. Given the consideration that body mass explains
20

Table 5 Summary of the statistical results for regression analyses investigating the relationship
between testicular mass in male G. capensis and their body mass, as well as between relative
testicular size and the percentage of females in the population where that male was sampled. Both the
full dataset was used and a dataset of mature individuals only where all juvenile animals (<120g) were
removed. In addition, populations where three or less animals were sampled were removed for further
analyses. The results for the regression analyses using body condition index as a proxy for animal
health are also shown. The r2 values, number of samples (N) and the p-value are given for each
analysis.
All specimens
All specimens r2 N p-value
Testicular mass vs. body mass 0.513 97 0.000
Residuals vs. percentage females 0.211 94 0.000
Juveniles removed r2 N p-value
Testicular mass vs. body mass 0.416 83 0.000
Residuals vs. percentage females 0.192 83 0.000
Small populations removed
All specimens r2 N p-value
Testicular mass vs. body mass 0.503 92 0.000
Residuals vs. percentage females 0.211 92 0.000
Juveniles removed r2 N p-value
Testicular mass vs. body mass 0.412 82 0.000
Residuals vs. percentage females 0.210 82 0.000
Body Condition Index
All specimens r2 N p-value
Testicular mass vs. body condition index 0.157 92 0.000
Residuals vs. percentage females 0.123 92 0.000
Juveniles removed r2 N p-value
Testicular mass vs. body condition index 0.056 82 0.019
Residuals vs. percentage females 0.112 82 0.001
21

most of the variation in testicular mass, this relationship was used for subsequent analyses
concerning relative testicular size.
Figure 3 Graph showing the geographic variation between localities in relative testicular mass of
mature G. capensis males. Numbers in brackets correspond to localities in Figure 1.
Relative testicular mass differed significantly among populations across the range (All males:
Chi-Square = 48.932, df = 14, p = 0.000; Males with juveniles removed: Chi-Square =
43.566, df = 14, p = 0.000; Figure 3; Supplementary Table S3) and was consistently
significantly correlated with the percentage of females within a population (all mature
22

Figure 4 Regression showing the relationship between A.) relative testicular mass and B.) body condition index (BCI) corrected testicular mass of mature G.
capensis males and the percentage of females in the population where the males were sampled.
23

animals with juveniles removed, all animals with small populations removed, mature animals
with juveniles and small populations removed; Table 5; Figure 4) with populations containing
fewer females displaying smaller relative testicular masses. No similar trends were evident
when comparing relative testicular mass and the average number of embryos per gravid
female or proportion of gravid females within each population (Supplementary Table S4).
Reproduction and ecology
Relative testicular mass in males was significantly correlated with elevation and, to a lesser
degree, with rainfall (Table 6). Populations at lower elevations displayed larger testicular
masses than their highland counterparts (Figure 5A); males from regions with a lower annual
rainfall had larger relative testicular masses compared to regions of higher rainfall (Figure
5B). Similarly, the mass-corrected litter sizes of females correlated with these two ecological
variables, with a higher number of embryos found in females at lower elevations and in lower
rainfall areas (Figure 5C and 5D). The average litter size of populations was also significantly
and strongly correlated to elevation (Table 6) - females at lower elevations carried larger
litters than those from higher elevations (results not shown). No comparable trends were
evident in the other female reproductive variables.
There was a significant difference in relative testicular mass between populations found in
different deposit ages (Table 6). This was, however, largely influenced by a significant
difference in relative testicular mass between populations in Palaeozoic and Cainozoic
deposits in which the former was significantly smaller than the latter (Mann-Whitney U =
312.000, N = 87, p = 0.000; mean relative testicular masses: Palaeozoic, 0.010 ± 0.210 SD;
Cainozoic, 1.701 ± 0.460 SD; Supplementary Figure S2A). A similar situation was evident in
the mass-corrected litter sizes of females, where significantly more embryos were carried by
24

Table 6 Summary of the statistical results for analyses investigating the relationship between ecological
variables including elevation above sea level (m), annual rainfall (mm) and the deposit age and vegetation type
where G. capensis populations are found and the reproductive variables of these populations. Reproductive
datasets included the relative testicular size in males, the size corrected number of embryos per particular gravid
female (residuals of the regression of the number of embryos versus the mass of the particular gravid female),
average litter size per population (the average number of embryos per gravid female), the proportion of gravid
females to the total number of females sampled and the percentage of females in a given population. The r2
values, number of samples (N) and the p-values are given for the regression analyses, the Chi-Square values,
degrees of freedom (df) an p-values for the comparisons between multiple different groups and the Mann-
Whitney U values, number of samples (N) and the p-values for the comparison between two different groups.
Elevation
Reproductive Variable r2 N p-value
Relative testicular mass in males 0.249 97 0.000
Residuals (Number of embryos vs. gravid female mass) 0.177 67 0.000
Number of embryos/Number of gravid females 0.428 11 0.029
Number of gravid females/Total number of females 0.000 11 0.975
Percentage of females in a population 0.059 13 0.424
Rainfall
Reproductive Variable r2 N p-value
Relative testicular mass in males 0.098 97 0.002
Residuals (Number of embryos vs. gravid female mass) 0.109 67 0.006
Number of embryos/Number of gravid females 0.267 11 0.103
Number of gravid females/Total number of females 0.031 11 0.605
Percentage of females in a population 0.049 13 0.469
Deposit age
Reproductive Variable Chi-Square df p-value
Relative testicular mass in males 24.007 3 0.000
Residuals (Number of embryos vs. gravid female mass) 8.801 3 0.032
Number of embryos/Number of gravid females 5.906 3 0.116
Number of gravid females/Total number of females 2.156 3 0.541
Percentage of females in a population 2.286 2 0.319
Vegetation type
Reproductive Variable Mann-Whitney U N p-value
Relative testicular mass in males 152.000 97 0.007
Residuals (Number of embryos vs. gravid female mass) 7.000 67 0.001
Number of embryos/Number of gravid females 0.000 11 0.036
Number of gravid females/Total number of females 7.000 11 0.727
Percentage of females in a population 4.000 13 0.769
25

Figure 5 Regression showing the relationship between mating variables and ecological variables in sampled G. capensis populations with regards to A.)
relative testicular mass in males and elevation above sea-level (m), B.) relative testicular mass in males and annual rainfall (mm), C.) female size-corrected
litter size and elevation above sea-level (m) and D.) female size-corrected litter size and annual rainfall (mm).
26

females in the Palaeozoic and Cainozoic compared to the Precambrian deposits (mean mass-
corrected litter sizes of females: Palaeozoic, 0.269 ± 1.379 SD; Cainozoic, 0.305 ± 2.970 SD;
Precambrian, -3.728 ± 0.753 SD; Table 6; Supplementary Figure S2B). No similar trends
were shared in any of the other female reproductive datasets.
Males from the Fynbos/Renosterveld vegetation types had significantly larger relative
testicular masses than those in Grassland vegetation (Table 6); a similar pattern was observed
in females where gravid females carried larger litters, both mass-corrected (individually) and
on average, in the Fynbos/Renosterveld vegetation compared to their Grassland counterparts
(Supplementary Figure S2C and S2D). No similar trends were observed for any of the other
female reproductive datasets.
Discussion
Ecology and distribution
Georychus capensis occurs over a wide range of elevations (Table 1) from the western Cape
lowland areas between the escarpment and the ocean (with the exception of the Nieuwoudt-
ville population; 720m above sea-level; locality 1 on Figure 1) to the highlands of
Mpumalanga (Wakkerstroom and Belfast; 2000m and 1940m above sea-level respectively;
localities 14 and 15 on Figure 1) and KwaZulu-Natal (Nottingham Road; 1800m above sea-
level; locality 13 on Figure 1). The range reported here overlaps notably, but also extends that
previously suggested by De Graaff (1981) (new records from Moorreesburg, Ceres and
Oudshoorn: localities 3, 6 and 12 on Figure 1).
The most commonly preferred soil types are derived from sandstone, limestone, shale and
quartzite (Table 1) which together make up the sandy loam, clay and alluvium soils which
27

these mole-rats exclusively inhabit (also see De Graaff 1981; Skinner and Chimimba 2005).
The substrates that G. capensis inhabit become more recent from the east towards the west
(Precambrian to Cainozoic; see Keyser 1997; Table 1). Georychus likely spread from the
north-eastern parts of South Africa downward towards the south coast and subsequently to
the west (also see the phylogeny of Honeycutt et al. 1987 where KwaZulu-Natal animals
appear to be older). This is also supported by fossil evidence of G. capensis found at
Elandsfontein in the western Cape in layers that date back only to the late Pliocene (ca. 12
Mya; Hendey 1969).
Georychus inhabits mesic regions across its distributional range - both in the winter rainfall
zone of the western Cape (285 - 655mm p.a.; average 485mm; Mucina and Rutherford 2006)
and the summer rainfall regions of KwaZulu-Natal (890mm p.a.) and Mpumalanga (858 -
902mm p.a.); an observation also made by Bennett et al. (2006). The higher annual rainfall
allows burrowing for most of the year (Thomas et al. 2012) as it makes the soil workable
(Scantlebury et al. 2006) and reduces the energetic cost of digging (Lovegrove 1989; Zelová
et al. 2011; Okrouhlík et al. 2015). High rainfall also ensures reliable food resources for most
of the year (Bennett 1988).
Although G. capensis is found in a diverse array of vegetation types (Table 1) including
fynbos, renosterveld and grassland (also see Low and Rebelo 1998), it is limited by the
presence of certain environmental conditions within these habitats such as alluvium and water
(i.e., drainage systems). This is likely due to the preference for mesic soil conditions and the
accompanying loamy and sandy soils formed by denudation in Georychus. All populations
were associated with either vlei land areas or were close to rivers (Table 1). In addition, all
populations were found in anthropogenically influenced (grazing of cattle or planted lawns)
28

landscapes (also see Bennett 1988) with no individuals present in pristine natural habitats.
Conversely, it has also been shown that the presence of G. capensis may increase the
abundance of grass through disruption of other vegetation types by selective feeding
(Hagenah and Bennett 2012). Whether mole-rats prefer grasslands, or whether their presence
facilitates grassland formation, remains unknown, and requires additional study.
The distribution, composition and abundance of geophytes are also a determining factor in
the distribution of suitable habitat for G. capensis (Bennett 1988; Romañach 2005). Mole-rat
diet consists mainly of geophytes (bulbs, tubers and corms; Du Toit et al. 1985; Lovegrove
and Jarvis 1986), but also contains a certain amount (6.9%, Broll 1981) of grass/aerial plant
material (Davies and Jarvis 1986; Bennett 1988; Bennett et al. 2006). In the mesic regions,
geophytes (high digestibility) show a clumped, albeit patchy, distribution (Du Toit et al.
1985). Notwithstanding, geophytes are relatively easy to find and this food source may
therefore ensure the maintenance of their energy budget (Bennett 1988). Indeed, they extend
burrows and perform a non-random search for these food items (Du Toit et al. 1985; Bennett
and Faulkes 2000; Romañach 2005). Mole-rats also maintain food stores during the drier
parts of the year when food is more scarce or difficult to find (Du Toit et al. 1985; Bennett
1988; Bennett et al. 2006; Thomas et al. 2012). Indeed, food stores were observed in the
Belfast and Morreesburg localities (localities 3 and 15 on Figure 1) where burrow systems
were excavated (in the rainy seasons of January and July/August respectively). Burrow
systems were not excavated during the drier months of the year, thereby leaving the potential
for food storage in G. capensis during these periods as speculative.
29

Size differences across the distribution
There was no clear geographic trend in animal body mass from different populations across
the distribution, however, some populations differed significantly from others. The factors
driving the size differences in single areas are not immediately obvious as similar mesic
habitat types are occupied across the range. Occurrence on planted grass lawns are the only
ecological factor that set apart the Paarl and Cape Town populations (localities 7 and 9
respectively on Figure 1) where animals are consistently larger. The availability of grass as a
food source year-round may increase growth (see Taylor et al. 1985).
Body masses for all animals, as well as males and females separately, fall within the range
reported by previous authors (e.g., Du Toit et al. 1985; Taylor et al. 1985; Bennett et al. 2006;
Hagenah and Bennett 2012; Oosthuizen et al. 2013). Body mass is significantly correlated
with age (r = 0.76) and growth continues after maturity (Taylor et al. 1985). According to
Smithers (1983), a maximum body mass of 360g is attained by G. capensis. In the current
study, five animals (two males and three females) had body masses higher than 360g
(between 365g and 407g). Given that young males grow at 7.4g/month (Taylor 1985) until
they reach 60g (Bennett 1988) and at 5.8g/month thereafter, this would give the male
weighing 407g an age of 5.7 years, which is in line (albeit slightly higher) with a lifespan of 5
years proposed by Bennett and Faulkes (2000).
Size differences between the sexes
No sexual dimorphism exists across the distributional range of G. capensis, which is in
agreement with previous investigations (Smithers 1983; Taylor et al. 1985; Bennett 1988;
Bennett and Faulkes 2000; Bennett et al. 2006; Scantlebury et al. 2006; Thomas et al. 2012).
The lack of sexual dimorphism across the distributional range points to an absence of
competition for resources such as mates (i.e., due to the mating system), and/or ecological
30

constraints (also see Pochron and Wright 2002); their specialized habitat selects for a certain
size optimum in both sexes. Sexual dimorphism was, however, evident in the Cape Town
(locality 8 on Figure 1) population with males being significantly larger; a trend that was also
weakly observed in Darling (locality 4 on Figure 1). The factors influencing this dimorphism
are not immediately obvious, however, the sex ratio in the Cape Town population is 1:1 (also
observed in the Darling population), the area occupied is small (0.68 hectares) and burrow
systems are closely spaced. As previously noted, sex ratio in subterranean mammals is
affected by population density and competition (Malizia and Busch 1997; Nevo 1999; Zenuto
et al. 1999; Busch et al. 2000). The mating system in this small area may therefore involve
intra-sexual competition between males for receptive females. Indeed, Heliophobius
argenteocinereus (Peters 1846) exhibits a similar equal sex ratio and displays analogous size
dimorphism between the sexes (Šumbera et al. 2003).
Reproduction
Reproduction in Georychus is influenced by various factors, both intrinsically and
extrinsically. Intrinsic factors include female allometry in litter size, male allometry in
testicular size and a mating strategy linked to the sex ratio and distribution of receptive
females. On the other hand, extrinsic factors comprise ecological aspects such as elevation,
rainfall, soil type and vegetation.
Litters
Georychus is a seasonal breeder (Bennett and Jarvis 1988) with the potential of producing
two litters per breeding season (Taylor et al. 1985). Gravid females were collected during
July to September in the western Cape Province and during late January in the KwaZulu-
Natal and Mpumalanga areas (Table 2). The gravid period for the western Cape is in
31

agreement with other studies (Taylor et al. 1985; Bennett and Jarvis 1988; Bennett et al.
2006) which found that young were born in August to December. The later date of capture
for the gravid individuals from the KwaZulu-Natal and Mpumalanga areas may indicate a
shift in the breeding season; young will likely be born in February to March. The link
between mating season and rainfall seasonality of (winter rainfall in the western Cape and
summer rainfall in the east of South Africa) may give young animals the opportunity to
disperse from their natal burrows and establish their own territories (Bennett 1988) which
would require moist soil (also see Šumbera et al. 2003). A breeding season which coincides
with the wetter months would therefore prove advantageous. As sampling did not cover a full
year in the Western Cape, KwaZulu-Natal and Mpumalanga, it is, however, speculative
whether the difference in breeding season between these areas represents a real adaptive shift.
A mean litter size of 5 (1-11) was found for the gravid females collected across the
distributional range (30% of females contained 5 embryos). This is less than found in
previous studies (mean litter size 6, range 3-10; Bennett 1988; Bennett et al. 2006), but is still
significantly larger than reported for other mole-rat species (Bennett 1988; Šumbera et al.
2003). A larger litter size may be selected for in Georychus due to higher predation pressure
as they move above-ground more frequently than other members of the bathyergids and are
consequently preyed upon by birds of prey, small carnivores and domestic pets (J.H. Visser,
personal observation).
Allometry in sexual traits
Female size has a significant effect on litter size in G. capensis - this allometry in litter size
has been noted in various other taxa (Burkholder and Walker 1973; Western 1979; Eisenberg
1981; Clutton-Brock and Harvey 1983; Peters 1983; Fitch 1985; Harvey and Clutton-Brock
32

1985; Harvey et al. 1986; Vitt and Breitenbach 1993; Wapstra and Swain 2001; Rocha et al.
2002). Larger females can presumably invest more resources into reproduction or have a
larger reproductive tract which may accommodate a larger amount of embryos.
Similar allometry applied to testicular mass, which relied significantly on male body mass
(also see Merilä and Sheldon 1998; Jolly and Phillips-Conroy 2001; Hettyey et al. 2005 for
similar examples in other taxa). In addition, the body condition index of males also has a
slight effect on testicular mass, however it seems that testicular growth is, to a larger extent,
an allometric function of an individual’s size than of its body condition. As similar conditions
prevailed across the sampled distribution and sampling covered only a single breeding
season, body condition was presumably similarly influenced in all populations. The effect of
animals’ body condition on testicular size must therefore be investigated across a longer
time-span and between different seasons before a robust conclusion may be drawn.
Mating system
The mating system of a species is determined by the temporal and spatial distribution of
males and receptive females (Davies 1991; Reynolds 1996). In Georychus, females (gravid
and non-gravid) are spatially clustered (between 1-30m; spatial networks not shown) around
male burrow systems. This proximity (also see Bennett 1988; Bennett et al. 2006) is likely
due to two factors. First, the subterranean lifestyle imposes certain constraints on the ability
of individuals to find receptive mates due to low vagility. The solitary, strongly territorial
nature of this species (Bennett 1988; Narins et al. 1992) also leads to permanent territories
(single burrow systems) which are occupied for life (Bennett and Faulkes 2000; Herbst et al.
2004). To obtain mates in such a system, males of G. capensis excavate linear tunnel systems
which shift annually (likely due to mate searching) while females excavate circular burrow
33

systems which are nearly permanently maintained (Bennett and Faulkes 2000; Herbst et al.
2004). Secondly, Georychus communicates with conspecifics (advertising sex and
reproductive status) using seismic signalling in the form of foot drumming with its hind legs
(Bennett and Jarvis 1988; Narins et al. 1992; Bennett et al. 2006) and burrow systems
therefore need to be closely spaced (3-4m; Narins et al. 1992) for such communication to be
effective.
In G. capensis, the males may be the driver that determines females' spatial location (also see
Thomas et al. 2012). The sex ratio in G. capensis is biased towards females (also see the
sampling of Oosthuizen et al. 2013 for a similar pattern) - a consequence of the mating
system (Greenwood 1980) which may influence male reproductive variables through
differences in the amount of polyandrous matings (Hettyey and Roberts 2006). Together with
this, there is no size dimorphism between the sexes and male animals do not have fat padding
around the neck as observed in the two Bathyergus species, suggesting less competition for
female acquisition (Scantlebury et al. 2006). Females, however, have a significantly larger
zygomatic arch width (Thomas et al. 2012; but see Taylor et al. 1985 for a contrary finding) -
a secondary sexual trait which may be related to competition over mates, as in Bathyergus
suillus (Schreber 1782) (Thomas et al. 2009).
Given these life-history traits, G. capensis likely exhibits a polygynous mating system. This
consideration is supported by the larger relative testis size (size-dependent variation in testis
size) in G. capensis populations with more females, geographic structuring of relative testis
size (also noted in geographically and genetically discrete populations of polygynous Green
Finches and anurans; Merilä and Sheldon 1998 and Hettyey et al. 2005 respectively) and a
linear increase in testicular size with body size (in common with other polygynous species -
34
Green Finches, Cardeulis chloris, L., 1758, Hamadryas baboons, Papio hamadryas, L., 1758,
common frog, Rana temporaria, L., 1758; Merilä and Sheldon 1998; Jolly and Phillips-
Conroy 2001; Hettyey et al. 2005).
In polygynous social systems, two scenarios may explain increased testis size. In the first
instance, relative testis size is strongly and phylogenetically independently related to sperm
competition in most taxa (see Merilä and Sheldon 1998 for examples; Jolly and Phillips-
Conroy 2001; see examples in Preston et al. 2002; Schulte-Hostedde and Millar 2004;
Hettyey and Roberts 2006) with polygyny generally resulting in larger testes (Jolly and
Phillips-Conroy 2001). Sperm competition arises when females mate with more than one
male, and male gametes have to compete within the reproductive tract (as seen in
polyandrous species; Jolly and Phillips-Conroy 2001). The second instance involves scramble
competition polygyny which arises when females and their ranges are not defendable
(Clutton-Brock 1989; Davies 1991) and males range over a large area and attempt to mate
with receptive females (Kappeler 1997). Male lemurs exhibit scramble competition linked to
the temporal distribution of receptive females (Kappeler 1997) which favours larger testes
(Harcourt et al. 1981) and weakly selects traits for competition (e.g., size dimorphism; see
references in Kappeler 1997). As with G. capensis, lemurs (Mirza coquereli, Grandidier
1867) have no dimorphism, are solitary, polygynous, have a sex ratio biased towards females
and display pronounced seasonal variation in testis size with an increase in the mating season
(Kappeler 1997).
In G. capensis, relative testicular size in relation to female availability exhibits the opposite
trend than predicted for sperm competition or scramble competition. A likely explanation
may involve the number of females in close proximity to a male dictating the ejaculate
35

volume and stored sperm volume required for successful mating. Larger testes are favoured
when a male has the opportunity to mate with a number of females in a limited space of time
(negates potential sperm depletion; Jolly and Phillips-Conroy 2001) and is associated with
higher copulation rates (more females mated) and greater siring success as it allows for the
storage and production of more sperm (Preston et al. 2002; Schulte-Hostedde and Millar
2004). Indeed, in G. capensis mating takes place multiple times consisting of a series of brief
copulations (Bennett 1988; Bennett et al. 2006). The possibility therefore exists that larger
testes in this species would facilitate multiple ejaculations and sufficient sperm reserves to
negate sperm depletion. In areas with few females, and given that animals are not able to
move over large distances, males invest in smaller testes as fewer copulations are achieved. It
is entirely possible that several males will not have access to a female during their lifetime
and as such, there is no need to invest in larger testes.
Reproduction and ecology
A significant relationship (r2 = 0.530, N = 15, p = 0.002) exists between elevation and annual
rainfall at sampling localities across the distribution of G. capensis (Supplementary Figure
S3). In this regard, areas of lower elevation also have a lower annual rainfall and vice versa.
Altitudinal effects on reproductive parameters through a difference in climatic conditions are
common in reptiles (Fitch 1985; Vitt and Breitenbach 1993). It is therefore also notable that
testicular size in male G. capensis correlates with both elevation and annual rainfall. The
larger relative testicular masses in this species are restricted to lower elevations and in lower
rainfall (arid) areas. As such, variation in this reproductive trait may be linked to moisture - a
factor which influences the energetic cost of digging and therefore mate searching
(Lovegrove 1989; Zelová et al. 2011; Okrouhlík et al. 2015). In drier areas, mate searching
may be more difficult and energetically expensive. Males in such areas therefore presumably
36

invest in larger sperm reserves to maximize successful impregnation when a female is
encountered.
Interestingly, the mass-corrected litter size in females followed a similar pattern to relative
testicular mass in males - females carry larger litters in arid, lowland habitats than their
highland counterparts where more mesic conditions prevail. In many lizard species a harsher
climate makes activity more difficult and shortens the breeding season, therefore litter size is
increased to compensate for only a single breeding episode (Rocha et al. 2002 and references
therein). Even though Georychus has the potential of producing two litters per breeding
season, it is unclear whether this is a cosmopolitan phenomenon across populations as a
sampling bias exists (the Cape Peninsula; see Taylor et al. 1985) in the single study
investigating breeding seasonality. It is therefore unclear whether a larger litter size in low
elevation populations may be the result of a single reproductive bout.
Assuming a similar pattern in breeding seasonality across all G. capensis populations (two
litters per year), two potential scenarios are likely: either the impregnation rate by males is
maximized through the larger sperm reserves in arid areas, or larger litter sizes may ensure
demographic stability. The former scenario is unlikely, given that there is no significant
relationship between relative testicular mass in males and female reproductive variables
(Supplementary Table S4). In the latter scenario, larger litters would ensure survival of at
least a few young, should the mortality rate be linked to aridity, physiological stress on
females or predation. Indeed, larger litters suffer an increased mortality rate (Cameron 1973;
Millar 1973 and references therein; Johnson et al. 1999; Madsen and Shine 2009) due to
nutritional stress (lower quantity and quality of milk, Cameron 1973; Millar 1973), predation
in the nest before and during dispersal and maternal mortality (Cameron 1973). No data were
37

collected, however, on the mortality rate of young in the present study, thereby leaving these
considerations as speculative. Conversely, larger litters may also result in higher population
densities - a situation which would aid mate searching in arid areas. Population densities were
not estimated in this study, however it was observed that populations at lower elevations
contained a higher number of individuals (>50 animals) which were spatially more
aggregated (<100m apart) than G. capensis populations in highland areas (<10 animals
spaced >500m apart, J.H. Visser, Personal observation).
Smaller litters in Georychus populations at higher altitudes may also result from other
extrinsic factors. Similar patterns of smaller size-specific litters at higher altitudes relative to
their lowland counterparts have been reported for populations of various lizard species
(Waltner 1991; Mathies and Andrews 1995; Rohr 1997; Lemos-Espinal et al. 1998). This
phenomenon has been attributed to environmental conditions such as lower resource
availability (Rohr 1997).
Indeed, environmental conditions relating to soil type and vegetation differ among the
sampling areas in this study. The older deposits form the higher parts of South Africa with
the low-lying areas being of a more recent origin (Cowling et al. 2009). Along with this
variation in geomorphology, the west-to-east rainfall gradient across the country has also
influenced the evolution and establishment of Fynbos and Renosterbos in the western parts
with the Grassland biome remaining in the interior and highlands (Patridge and Maud 2000;
Chase and Meadows 2007). Given this link between the geomorphology and vegetation type
with the ecological variables of elevation and rainfall, it is not surprising that relative
testicular mass and the mass-corrected litter size in Georychus populations were similarly
influenced by the age of deposits as well as the vegetation type.
38

Annual rainfall patterns influence life-history patterns through soil moisture and food
availability, even at fine spatial scales, in the dusky rat (Rattus colletti, Thomas 1904)
(Madsen and Shine 2009). A higher availability of food (Hill 1972; Chapman et al. 1990;
Rohr 1997) and also more nutritious foodstuffs (Hill 1972; Cameron 1973) results in larger
litters as more energy may be allocated to reproduction (Millar 1973 and references therein;
McNab 1980, 1986). As such, soil type may also influence litter size - larger litters have
demonstrated in the cottontail rabbit (Sylvilagus floridarlus, Bachman 1837) in more fertile
soils (Hill 1972). The fertility of the soil influences the vegetation type found in such soil and
hence the quality and quantity of food available (Hill 1972). Given the dependence of
Georychus on the geophyte richness of an area (Du Toit et al. 1985; Lovegrove and Jarvis
1986; Bennett 1988; Romañach 2005), it is possible that the geophyte richness of the
Grassland areas (older soil types) may be lower than for the Fynbos/Renosterbos regions
(younger soil types). Correspondingly, this would result in smaller litter sizes in the lower
nutrition areas. The effects of soil type and vegetation type on relative testicular mass in
males is not as easily explained and may result from a link between the climate, geology and
vegetation. The influence of food availability on the reproduction of G. capensis remains,
however, speculative without any data on the soil fertility and geophyte richness of sampled
areas.
In addition, the results of the difference in reproductive variables (especially embryo counts)
across the distribution must be viewed with caution. Sample sizes in the Mpumalanga and
KwaZulu-Natal areas were comparatively lower than in the western Cape. Litter size may
also vary between breeding seasons due to variation in female physiology and female size
over a life-time (Krohne 1981). Indeed, sampling only spanned a single breeding season.
These sampling effects therefore preclude robust conclusions about the influence of ecology
39

on the mating system of Georychus and the geographic differences in mating variables
reported in this study need further investigation to confirm possible adaptive differences
among populations.
Conclusion
Georychus capensis is a habitat specialist which occurs only where particular ecological
conditions prevail. This species is not nearly as cosmopolitan as B. suillus or Cryptomys
hottentotus (Lesson 1826) and is dependent on mesic conditions and areas associated with
vleis or that are close to rivers. In addition, the breeding cycle of G. capensis appears to
depend on rainfall and its seasonality which may have selected for different breeding seasons
in animals from the western Cape and KwaZulu-Natal/Mpumalanga areas respectively.
No size dimorphism exists between males and females and this, together with a female-biased
sex ratio and testicular size dependent on the sex ratio in a population, points to a complex
mating system. Due to the low vagility of these subterranean animals, females are spatially
distributed around males to facilitate breeding. As a result of the higher number of females in
some populations, males have the opportunity to copulate with several females and therefore
need larger sperm reserves to negate sperm depletion. The mating system is therefore one
where females only mate with a few or single males during a breeding season, but males are
polygynous; indeed it is possible that males possess harems. Parentage analysis would be
beneficial to determine whether the young of gravid females and juveniles close to such
females, are indeed fathered by the local resident male.
In addition, reproduction in Georychus is also influenced by various ecological factors such
as elevation, rainfall, soil type and vegetation. Areas of lower elevation and a more arid
40

climate are correlated with increased male testicular size and female litter size relative to
highland, mesic areas. Presumably, a more arid environment makes mate-searching a more
arduous task. To maximize fertilization, males therefore display larger sperm reserves in such
areas, presumably to maximize fertilization success should a female be encountered. In turn,
larger litter sizes in such areas could be the result of a higher fertilization rate, although
demographic effects and fine-scale distributional effects are more likely - a more aggregated
and larger population would facilitate locating receptive mates in a fossorial system. Lastly,
the mating system of G. capensis also appears linked to soil and vegetation type (both of
which are in turn linked to elevation and rainfall). The influence of these ecological factors
are, presumably, linked to the distribution of adequate food resources, however, this is
speculative.
Georychus is currently monotypic due to a lack of karyotypic or morphological variation
(Nevo et al. 1986; Deuve et al. 2008); however genetic investigations suggest possible unique
evolutionary units in KwaZulu-Natal (Honeycutt et al. 1987; Nevo et al. 1987; Honeycutt et
al. 1991), Mpumalanga (Ingram et al. 2004) and the western Cape. Animals from these areas
may therefore represent putative species and given the fragmented and isolated distribution of
populations, occupation of different soil- and vegetation types together with the geographic
variation in traits such as testicular size, litter size and breeding season, the genus may
represent a species complex (for example see Visser et al. 2014 for data on B. suillus).
Incorporation of the genetic material from all sampled individuals in a phylogeographic study
will shed light on intraspecific and even interspecific relationships within Georychus and will
inform conservation management approaches.
41

Acknowledgements
We are grateful to the land-owners who allowed collection of specimens on their properties.
Funding for this project was provided by NRF grants to B. Jansen van Vuuren and N.C.
Bennett.
References
Allard, M.W., and Honeycutt, R.L. 1992. Nucleotide sequence variation in the mitochondrial
12S rRNA gene and the phylogeny of African mole-rats (Rodentia: Bathyergidae). Mol.
Biol. Evol. 9: 27-40. Available from http://mbe.oxfordjournals.org/content/9/1/27.short.
[Accessed 23 May 2016].
Avery, D.M. 1991. Late Quarternary incidence of some micromammalian species in Natal.
Durban Mus. Novit. No. 16: 1-16.
Avery, D.M. 1998. An assessment of the lower Pleistocene micro mammalian fauna from
Swartkrans members 1–3, Gauteng, South Africa. Geobios, 31: 393-414.
doi:10.1016/S0016-6995(98)80022-3.
Avery, D.M. 2000. Notes on the systematics of micromammals from Sterkfontein, Gauteng,
South Africa. Palaeontol. Afr. 36: 83-90. Available from
http://hdl.handle.net/10539/16381. [Accessed 23 May 2016].
Bennett, N.C. 1988. The trend towards sociality in three species of southern African mole-
rats Bathyergidae: causes and consequences. PhD thesis, University of Cape Town, Cape
Town, South Africa.
Bennett, N.C., and Faulkes, C.G. 2000. African mole-rats: ecology and eusociality.
Cambridge University Press, United Kingdom.
42

Bennett, N.C., and Jarvis, J.U.M. 1988. The reproductive biology of the Cape mole-rat,
Georychus capensis (Rodentia: Bathyergidae). J. Zool. (Lond.) 214: 95-106. doi:
10.1111/j.1469-7998.1988.tb04989.x.
Bennett, N.C., Jarvis, J.U.M., Aguilar, G.H. and McDaid, E.J. 1991. Growth and
development in six species of African mole-rats (Rodentia: Bathyergidae). J. Zool. (Lond.)
225: 13-26. DOI: 10.1111/j.1469-7998.1991.tb03798.x
Bennett, N.C., Maree, S., and Faulkes, C.G. 2006. Georychus capensis. Mamm. Species, No.
799: 1-4.
Berven, K.A. 1982. The genetic basis of altitudinal variation in the wood frog Rana sylvatica.
I. An experimental analysis of life history traits. Evolution, 36: 962-983. doi:
10.2307/2408075.
Broll, B.W. 1981. Comparative morphology of the gastrointestinal tract of four species of
mole-rat (Rodentia, Bathyergidae) in relation to diet. Unpublished project, Zoology
Department Library, Cape Town University, Cape Town, South Africa.
Bronner, G.N. 1990. New distribution records for four mammal species, with notes on their
taxonomy and ecology. Koedoe, 33: 1-7. doi: 10.4102/koedoe.v33i2.435.
Burda, H. 2000. Determinants of the distribution and radiation of African mole-rats
(Bathyergidae, Rodentia). Ecology or geography? In Small African mammals. Edited by
C. Denys, L. Granjon and A. Poulet. Colloques et Se´minaires - Editions de l’ IRD, Paris.
Burkholder, G.L. and Walker, J.M. 1973. Habitat and reproduction of the desert whiptail
lizard, Cnemidophorus tigris Baird and Girard in southwestern Idaho at the northern part
of its range. Herpetologica, 29: 76-83. Available from
http://www.jstor.org/stable/3891208. [Accessed 23 August 2016].
Busch, C., Antinuchi, C.D., del Valle, J.C., Kittlein, M.J., Malizia, A.I., Vassallo, A.I. and
Zenuto, R. 2000. Population ecology of subterranean rodents. In Life underground: the
43

biology of subterranean rodents. Edited by E.A Lacey, J.L. Patton and G.N. Cameron.
Chicago: University of Chicago Press. pp. 183-226.
Cameron, G.N. 1973. Effect of litter size on postnatal growth and survival in the Desert
Woodrat. J. Mammal. 54: 489-493. doi: 10.2307/1379133.
Chapman, C.A., Walker, S., Lefebvre, L. 1990. Reproductive strategies of primates: The
influence of body size and diet on litter size. Primates, 31: 1-13.
doi:10.1007/BF02381026.
Clutton-Brock, T.H. 1989. Mammalian mating systems. Proc. R. Soc. Lond. B Biol. Sci. 236:
339-372.
Clutton-Brock, T.H. and Harvey, P.H. 1983. The functional significance of variation in body
size among mammals. In Advances in the Study of Mammalian Behavior. Edited by J.F.
Eisenberg and D.G. Kleiman. Spec. Publ. Am. Soc. Mammal. No. 7. pp. 632-663.
Davies, N.B. 1991. Mating systems. In Behavioural ecology. Edited by J.R. Krebs and N.B.
Davies. Blackwell, Oxford. pp 263-294.
Davies, K.C., and Jarvis, J.U.M. 1986. The burrow systems and burrowing dynamics of the
mole-rats Bathyergus suillus and Cryptomys hottentotus in the fynbos of the south-western
Cape, South Africa. J. Zool. (Lond.) 209: 125-147. doi: 10.1111/j.1469-
7998.1986.tb03570.x.
De Graaff, G. 1981. The rodents of Southern Africa. Butterworth, Johannesburg, South
Africa.
Deuve, J.L., Bennett, N.C., Britton-Davidian, J., and Robinson, T.J. 2008. Chromosomal
phylogeny and evolution of the African mole-rats (Bathyergidae). Chromosome Res. 16:
57-74. doi: 10.1007/s10577-007-1200-8.
Du Toit, J.T., Jarvis, J.U.M., and Louw, G.N. 1985. Nutrition and burrowing energetics of
the Cape mole-rat Georychus capensis. Oecologia, 66: 81-87. doi: 10.1007/BF00378556.
44

Eisenberg, J.F. 1981. The Mammalian Radiations. University of Chicago Press, Chicago,
USA.
Faulkes, C.G., Bennett, N.C., Bruford, M.W., O’Brien, H.P., Aguilar, G.H., and Jarvis,
J.U.M. 1997. Ecological constraints drive social evolution in the African mole-rats. Proc.
R. Soc. Lond. B Biol. Sci. 264: 1619-1627. doi: 10.1098/rspb.1997.0226.
Fitch, H.S. 1985. Clutch and litter size variation in New World reptiles. Univ. Kans. Mus.
Nat. Hist. Misc. Publ. No. 76: 1-76. Available from
https://archive.org/details/variationinclutc00fitc. [Accessed 23 August 2016].
Greenwood, P.J. 1980. Mating systems, philopatry and dispersal in birds and mammals.
Anim. Behav. 28: 1140-1162. doi: 10.1016/S0003-3472(80)80103-5.
Hagenah, N., and Bennett, N.C. 2013. Mole rats act as ecosystem engineers within a
biodiversity hotspot, the Cape Fynbos. J. Zool. (Lond.) 289: 19-26. doi: 10.1111/j.1469-
7998.2012.00958.x.
Harcourt, A.H., Harvey, P.H., Larson, S.G., and Short, R.V. 1981. Testis weight, body
weight, and breeding system in primates. Nature, 293: 55-57. doi: 10.1038/293055a0.
Harvey, P.H. and Clutton-Brock, T.H. 1985. Life History variation in primates. Evolution,
39: 559-581. doi: 10.2307/2408653.
Harvey, P.H., Martin, R.D. and Clutton-Brock, T.H. 1986. Life history in comparative
perspective. In Primate Societies. Edited by B.B. Smuts, D.L. Cheney, R.M. Seyfarth,
R.W. Wrangham, and T.T. Struhsaker. Chicago: University of Chicago Press. pp. 181-
196.
Hendey, Q.B. 1969. Quaternary vertebrate fossil sites in the south-western Cape Province. S.
Afr. Archaeol. Bull. 24: 96-105. doi: 10.2307/3888285.
45

Herbst, M., Jarvis, J.U.M., and Bennett, N.C. 2004. Non-invasive assessment of reproductive
seasonality in the Red data listed wild Namaqua dune mole-rat, Bathyergus janetta. J.
Zool. (Lond.) 263: 259-268.
Hettyey, A., Laurila, A., Herczeg, G., Jönsson, K.I., Kovács, T. and Merilä, J. 2005. Does
testis weight decline towards the Subarctic? A case study on the common frog, Rana
temporaria. Naturwissenschaften, 92: 188-192. doi: 10.1007/s00114-005-0607-3.
Hettyey, A. and Roberts, J.D. 2006. Sperm traits of the quacking frog, Crinia georgiana:
intra- and interpopulation variation in a species with a high risk of sperm competition.
Behav. Ecol. Sociobiol. 59: 389-396. doi: 10.1007/s00265-005-0062-3.
Hill, E.P. 1972. Litter size in Alabama cottontails as influenced by soil fertility. J. Wildl.
Manage. 36: 1199-1209. doi: 10.2307/3799249.
Honeycutt, R.L., Edwards, S.V., Nelson, K., and Nevo, E. 1987. Mitochondrial DNA
variation and the phylogeny of African mole rats (Rodentia: Bathyergidae). Syst. Zool. 36:
280-292. doi: 10.2307/2413067.
Ingram, C.M. 2005. The evolution of nuclear microsatellite DNA markers and their flanking
regions using reciprocal comparisons within the African mole-rats (Rodentia:
Bathyergidae). PhD thesis, Texas A&M University, Texas, USA.
Ingram, C.M., Burda, H., and Honeycutt, R.L. 2004. Molecular phylogenetics and taxonomy
of the African mole-rats, genus Cryptomys and the new genus Coetomys (Gray, 1864).
Mol. Phylogenet. Evol. 31: 997-1014. doi:10.1016/j.ympev.2003.11.004.
Janecek, L.L., Honeycutt, R.L., Rautenbach, L., Erasmus, B.H., Reig, S., and Schilitter, D.A.
1992. AIIozyme variation and systematics of African mole-rats (Rodentia: Bathyergidae).
Biochem. Syst. Ecol. 20: 401-416. doi:10.1016/0305-1978(92)90081-N.
Jarvis, J.U.M. 1969. The breeding season and litter size of African mole-rats. J. Reprod.
Fertil. 6: 237-248.
46

Johnson, R.K., Nielsen, M.K. and Casey, D.S. 1999. Responses in ovulation rate, embryonal
survival, and litter traits in swine to 14 generations of selection to increase litter size. J.
Anim. Sci. 77: 541-557. doi:10.2527/1999.773541x.
Jolly, C.J., and Phillips-Conroy, J.E. 2003. Testicular size, mating system, and maturation
schedules in wild Anubis and Hamadryas baboons. Int. J. Primatol. 24: 125-142. doi:
10.1023/A:1021402730111.
Kappeler, P.M. 1996. Intrasexual selection and testis size in strepsirhine primates. Behav.
Ecol. 8: 10-19. doi: 10.1093/beheco/8.1.10.
Kappeler, P.M. 1997. Intrasexual selection in Mirza coquereli: evidence for scramble
competition polygyny in a solitary primate. Behav. Ecol. Sociobiol. 45: 115-127. doi:
10.1007/s002650050371.
Keyser, N. 1997. Geological map of the Republic of South Africa and the kingdoms of
Lesotho and Swaziland. I:I,000.000. Council for Geoscience, South Africa.
Kinahan, A.A., Bennett, N.C., Belton, L.E., and Bateman, P.W. 2008. Do mating strategies
determine genital allometry in African mole rats (Bathyergidae)? J. Zool. (Lond.) 274:
312-317. doi: 10.1111/j.1469-7998.2007.00386.x.
Klein, R.G. 1974. A provisional statement on terminal Pleistocene mammalian extinctions in
the Cape Biotic Zone (southern Cape Province, South Africa). S. Afr. Archaeol. Bull.,
Goodwin Series, 2: 39-45. doi: 10.2307/3858066.
Krohne, D.T. 1981. Intraspecific litter size variation in Microtus californicus: Variation
within populations. J. Mammal. 62: 29-40. doi: http://dx.doi.org/10.2307/1380475.
Kock, D., Ingram, C.M., Frabotta, L.J., Honeycutt, R.L., and Burda, H. 2006. On the
nomenclature of Bathyergidae and Fukomys n. gen. (Mammalia: Rodentia). Zootaxa,
1142: 51-55. Available from http://www.mapress.com/zootaxa/2006f/z01142p055.pdf.
[accessed 10 October 2016].
47

Laugen, A.T., Laurila, A., Räsänen, K. and Merilä, J. 2003. Latitudinal counter gradient
variation in the common frog (Rana temporaria) development rates - evidence for local
adaptation. J. Evol. Biol. 16: 996-1005. doi: 10.1046/j.1420-9101.2003.00560.x.
Lemos-Espinal, J.R., Ballinger, R.E. and Smith, G.R. 1998. Comparative demography of the
high altitude lizard, Sceloporus grammicus (Phrynosomatidae), on the Iztaccihuatl
Volcano, Puebla, Mexico. Great Basin Nat. 58: 375-379. Available from
http://www.jstor.org/stable/41713075. [Accessed 23 August 2016].
Lovegrove, B.G. 1989. The cost of burrowing by the social mole-rats (Bathyergidae)
Cryptomys damarensis and Heterocephalus glaber: the role of soil moisture. Physiol.
Zool. 62: 449-469. Available from
http://www.jstor.org/stable/30156179?seq=1#page_scan_tab_contents. [accessed 23 May
2016].
Lovegrove, B.G., and Jarvis, J.U.M. 1986. Coevolution between mole-rats (Bathyergidae)
and a geophyte, Micranthus (Iridaceae). Cimbebasia, 8: 79-85.
Low, A.B., and Rebelo. A.T. 1998. Vegetation of South Africa, Lesotho and Swaziland.
Second edition. Department of Environmental Affairs and Tourism, Pretoria, South
Africa.
Lüddecke, H. 2002. Variation and trade-offs in reproductive output of the Andean frog Hyla
labialis. Oecologia, 130: 403-410. doi:10.1007/s00442-001-0820-5.
Madsen, T. and Shine, R. 1999. Rainfall and rats: Climatically-driven dynamics of a tropical
rodent population. Aust. J. Ecol. 24: 80-89. doi: 10.1046/j.14429993.1999.00948.x.
Malizia, A.I., and Busch, C. 1997. Breeding biology of the fossorial rodent Ctenomys talarum
(Rodentia: Octodontidae). J. Zool. (Lond.) 242: 463-471. doi: 10.1111/j.1469-
7998.1997.tb03849.x.
48

Maree, S., and Faulkes, C. 2008. Georychus capensis. The IUCN Red List of Threatened
Species 2008: e.T9077A12955652. Available from
http://dx.doi.org/10.2305/IUCN.UK.2008.RLTS.T9077A12955652.en [accessed 20 April
2016].
Mathies, T. and Andrews, R.M. 1995. Thermal and reproductive biology of high and low
elevation populations of the lizard Sceloporus scalaris: implications for the evolution of
viviparity. Oecologia, 104: 101-111. doi:10.1007/BF00365568.
McNab, B.K. 1980. Food habits, energetics, and the population biology of mammals. Am.
Nat. 116: 227-268. Available from http://www.jstor.org/stable/2460712. [Accessed 23
August 2016].
McNab, B.K. 1986. The influence of food habits on the energetics of eutherian mammals.
Ecol. Monogr. 56: 1-19. doi: 10.2307/2937268.
Merilä, J., and Sheldon, B.C. 1998. Testis size variation in the greenfinch Carduelis chloris:
relevance for some recent models of sexual selection. Behav. Ecol. Sociobiol. 45: 115-
123. doi: 10.1007/s002650050545.
Millar, J.S. 1973. Evolution of litter-size in the Pika, Ochotona princeps (Richardson).
Evolution, 27: 134-143. doi: 10.2307/2407127.
Mucina, L., and Rutherford, M.C. 2006. The vegetation of South Africa, Lesotho and
Swaziland. Strelitzia 19. South African National Biodiversity Institute, Pretoria, South
Africa.
Nanni, R.F. 1988. The interaction of mole-rats (Georychus capensis and Cryptomys
hottentotus) in the Nottingham road region of Natal. MSc thesis, University of Natal,
Pietermaritzburg, South Africa.
49

Narins, P.M., Reichman, O.J, Jarvis, J.U.M., and Lewis, E.R. 1992. Seismic signal
transmission between burrows of the Cape mole-rat, Georychus capensis. J. Comp.
Physiol. 170: 13-21. doi: 10.1007/BF00190397.
Nevo, E. 1999. Mosaic evolution of subterranean mammals: regression, progression and
global convergence. Oxford University Press, New York, USA.
Okrouhlík, J., Burda, H., Kunc, P., Knížková, I., and Šumbera, R. 2015. Surprisingly low risk
of overheating during digging in two subterranean rodents. Physiol. Behav. 138: 236-241.
doi: 10.1016/j.physbeh.2014.10.029.
Oosthuizen, M.K., and Bennett, N.C. 2007. LH responses to single doses of exogenous
GnRH in the Cape mole-rat (Georychus capensis): the pituitary potential for opportunistic
breeding. J. Zool. (Lond.) 271: 198-202. doi: 10.1111/j.1469-7998.2006.00201.x.
Oosthuizen, M.K., and Bennett, N.C. 2009. Seasonal variation in gonadal steroids of males
and females in the Cape mole-rat (Georychus capensis): the potential for opportunistic
breeding. Afr. Zool. 44: 117-122. doi: 10.1080/15627020.2009.11407443.
Oosthuizen, M.K., Cooper, H.M., and Bennett, N.C. 2003. Circadian rhythms of locomotor
activity in solitary and social species of African mole-rats (family Bathyergidae). J. Biol.
Rhythms, 16: 481-490. doi: 10.1177/0748730403259109.
Oosthuizen, M.K., Scheibler, A-G., Bennett, N.C., and Amrein, I. 2013. Effects of laboratory
housing on exploratory behaviour, novelty discrimination and spatial reference memory in
a subterranean, solitary rodent, the Cape mole-rat (Georychus capensis). PLoS ONE 8(9):
e75863. doi:10.1371/journal.pone.0075863.
Peters, R.H. 1983. The ecological implications of body size. Cambridge University Press,
Cambridge, UK.
50

Pochron, S.T., and Wright, P.C. 2002. Dynamics of testes size compensates for variation in
male body size. Evol. Ecol. Res. 4: 577-585. Available from http://www.evolutionary-
ecology.com/abstracts/v04/1408.html. [accessed 23 May 2016].
Preston, B.T., Stevenson, I.R., Pemberton, J.M., Coltman, D.W., and Wilson, K. 2003. Overt
and covert competition in a promiscuous mammal: the importance of weaponry and testes
size to male reproductive success. Proc. R. Soc. Lond. B Biol. Sci. 270: 633-640. doi:
10.1098/rspb.2002.2268.
Reichman, O.J., and Jarvis, J.U.M. 1989. The influence of three sympatric species of
fossorial mole-rats (Bathyergidae) on vegetation. J. Mammal. 70: 763-771.
doi: http://dx.doi.org/10.2307/13817.
Reynolds, J. 1996. Animal breeding systems. Trends Ecol. Evol. 11: 68-72. doi:
10.1016/0169-5347(96)81045-7.
Rocha, C.G.D., Vrcibradic, D., Teixeira, R.L. and Cuzzuol, M.G.T. 2002. Interpopulational
variation in litter size of the skink Mabuya agilis in southeastern Brazil. Copeia, 3: 857-
864. Available from http://www.jstor.org/stable/1448168. [Accessed 23 August 2016].
Rohr, D.H. 1997. Demographic and life-history variation in two proximate populations of a
viviparous skink separated by a steep altitudinal gradient. J. Anim. Ecol. 66: 567-578. doi:
10.2307/5950.
Romañach, S.S. 2005. Influences of sociality and habitat on African mole-rat burrowing
patterns. Can. J. Zool. 83: 1051- 1058. doi: 10.1139/z05-099.
Scantlebury, M., Speakman, J.R., and Bennett, N.C. 2006. The energy costs of sexual
dimorphism in mole-rats are morphological not behavioural. Proc. R. Soc. Lond. B Biol.
Sci. 273: 57-63. doi: 10.1098/rspb.2005.3280.
Schulte-Hostedde, A.I., and Millar, J.S. 2004. Intraspecific variation of testis size and sperm
length in the yellow-pine chipmunk (Tamias amoenus): implications for sperm
51

competition and reproductive success. Behav. Ecol. Sociobiol. 55: 272-277. doi:
10.1007/s00265-003-0707-z.
Skinner, J.D., and Chimimba, C.T. 2005. The mammals of the Southern African subregion.
Cambridge: Cambridge University Press, Cambridge, UK.
Smithers, R.H.N. 1983. The mammals of the southern African subregion. University of
Pretoria, Pretoria, South Africa.
Šumbera, R., Burda, H., and Chitaukali, W.N. 2003. reproductive biology of a solitary
subterranean bathyergid rodent, the silvery mole-rat (Heliophobius argenteocinereus). J.
Mammal. 84: 278-287. doi: 10.1644/1545-1542(2003)084<0278:RBOASS>2.0.CO;2.
Taylor, P.J., Jarvis, J.U.M., and Crowe, T.M. 1985. Age determination in the Cape mole-rat
Georychus capensis. S. Afr. J. Zool. 20: 261-267. doi: 10.1080/02541858.1985.11447947.
Thomas, H.G., Bateman, P.W., LeComber, S.C., Bennett, N.C., Elwood, R.W., and
Scantlebury, M. 2009. Burrow architecture and digging activity in the Cape dune mole rat.
J. Zool. (Lond.) 279: 277-284. doi: 10.1111/j.1469-7998.2009.00616.x.
Thomas, H.G., Bateman, P.W., Scantlebury, M., and Bennett, N.C. 2012. Season but not sex
influences burrow length and complexity in the non-sexually dimorphic solitary Cape
mole-rat (Rodentia: Bathyergidae) J. Zool. (Lond.) 288: 214-221. doi: 10.1111/j.1469-
7998.2012.00944.x.
Van Daele, P.A.A.G., Faulkes, C.G., Verheyen, E., and Adriaens, D. 2007. African mole-rats
(Bathyergidae): a complex radiation in Afrotropical soils. In Subterranean rodents: news
from underground. Edited by S. Begall, H. Burda and C.E. Schleich. Heidelberg: Springer-
Verlag. pp. 357-373.
Van der Horst, G. 1972. Seasonal effect on the anatomy and histology of the reproductive
tract of the male rodent mole Bathyergus s. suillus (Schreber). Zool. Afr. 7: 491-520.
52

Available from http://journals.co.za/content/afzoo/7/2/AJA00445096_859. [Accessed 23
August 2016].
Vitt, L.J. and Breitenbach, G.L. 1993. Life histories and reproductive tactics among lizards in
the genus Cnemidophorus (Sauria: Teiidae). In Biology of Whiptail Lizards (genus
Cnemidophorus). Edited by J.W. Wright and L.J. Vitt. Norman: Oklahoma Museum of
Natural History. pp. 211-243.
Walker, E.P. 1975. Mammals of the world. Third edition vol II. The Johns Hopkins
University Press, Baltimore, USA.
Waltner, R.C. 1991. Altitudinal ecology of Agama tuberculata Gray in the western
Himalayas. Univ. Kans.. Mus. Nat. Hist. Misc. Publ. No. 83: 1-74. Available from
http://www.biodiversitylibrary.org/item/54701#page/3/mode/1up. [Accessed 23 August
2016].
Wapstra, E., and Swain, R. 2001. Geographical and annual variation in life-history traits in a
temperate zone Australian skink. J. Herpetol. 35: 194-203. doi: 10.2307/1566108.
Western, D. 1979. Size, life history, and ecology in mammals. Afr. J. Ecol. 17: 185-204.
doi: 10.1111/j.1365-2028.1979.tb00256.x.
Zelová, J., Šumbera, R., Okrouhlík, J., Šklíba, J., Lövy, M., and Burda, H. 2011. A seasonal
difference of daily energy expenditure in a free-living subterranean rodent, the silvery
mole-rat (Heliophobius argenteocinereus; Bathyergidae). Comp. Biochem. .Physiol. A
158: 17-21. doi: 10.1016/j.cbpa.2010.07.026.
Zenuto, R.R., Malizia, A.I., and Busch, C. 1999. Sexual size dimorphism, testes size and
mating system in two populations of Ctenomys talarum (Rodentia: Octodontidae). J. Nat.
Hist. 33: 305-314. Available from http://dx.doi.org/10.1080/002229399300434. [Accessed
23 August 2016].
53

Supplementary Material
Supplementary Table S1 Summary of the statistically significant results for the pairwise
comparisons between the masses of G. capensis for all individuals, only male individuals and only
female individuals between the various sampling localities. The names of the two populations that
were compared (Pop 1 and Pop2) are shown along with the Mann-Whitney U test statistic, number of
samples in population 1 (N(Pop1)) and population 2 (N(Pop2)) and the p-value for the comparison.
Pairwise mass difference: All specimens
Pop1 Pop2 Mann-Whitney U N (Pop1) N (Pop2) p-value
Citrusdal Paarl -70.345 21 18 0.048
Moorreesburg Paarl -89.971 147 18 0.001
Darling Paarl -112.710 25 18 0.001
Wolseley Paarl -69.554 23 18 0.046
Worcester Paarl -125.359 23 18 0.000
Wakkerstroom Paarl 113.566 19 18 0.002
Struisbaai Paarl 165.500 20 18 0.000
Struisbaai Citrusdal 95.155 20 21 0.006
Struisbaai Moorreesburg 75.529 20 147 0.004
Struisbaai Wolseley 95.946 20 23 0.005
Struisbaai Worcester 124.929 20 14 0.001
Struisbaai Cape Town 134.930 20 25 0.000
Struisbaai Swellendam -94.972 20 18 0.008
Struisbaai Oudshoorn -109.295 20 22 0.001
Worcester Worcester -84.787 23 14 0.024
Worcester Oudshoorn -69.154 23 22 0.036
Worcester Cape Town -94.789 23 25 0.003
Moorreesburg Cape Town -59.401 147 25 0.013
54

Darling Cape Town -82.140 25 25 0.009
Wakkerstroom Cape Town 82.996 19 25 0.014
Pairwise mass difference: Males
Pop1 Pop2 Mann-Whitney U N (Pop1) N (Pop2) p-value
Nieuwoudt-ville Cape Town -82.875 1 8 0.027
Citrusdal Cape Town -71.875 4 8 0.001
Moorreesburg Cape Town -46.625 44 8 0.001
Darling Cape Town -37.500 12 8 0.020
Worcester Cape Town -56.193 11 8 0.001
Worcester Cape Town -44.625 4 8 0.039
Struisbaai Cape Town 70.708 3 8 0.003
Nottingham Road Cape Town 76.375 1 8 0.042
Wakkerstroom Cape Town 54.792 6 8 0.004
Belfast Cape Town 58.042 3 8 0.015
Worcester Paarl -38.485 11 6 0.032
Struisbaai Paarl 53.000 3 6 0.034
Citrusdal Paarl -54.176 4 6 0.018
Citrusdal Oudshoorn -46.111 4 9 0.030
Citrusdal Wolseley -49.000 4 7 0.027
Struisbaai Wolseley 47.833 3 7 0.050
Pairwise mass difference: Females
Pop1 Pop2 Mann-Whitney U N (Pop1) N (Pop2) p-value
Moorreesburg Paarl -60.113 103 12 0.009
Wolseley Paarl -63.885 16 12 0.027
Worcester Paarl -88.250 12 12 0.004
Wakkerstroom Paarl 76.474 13 12 0.011
Struisbaai Paarl 113.673 17 12 0.000
Struisbaai Citrusdal 83.000 17 17 0.001
Struisbaai Moorreesburg 53.759 17 103 0.007
Struisbaai Worcester 98.806 17 10 0.001
55
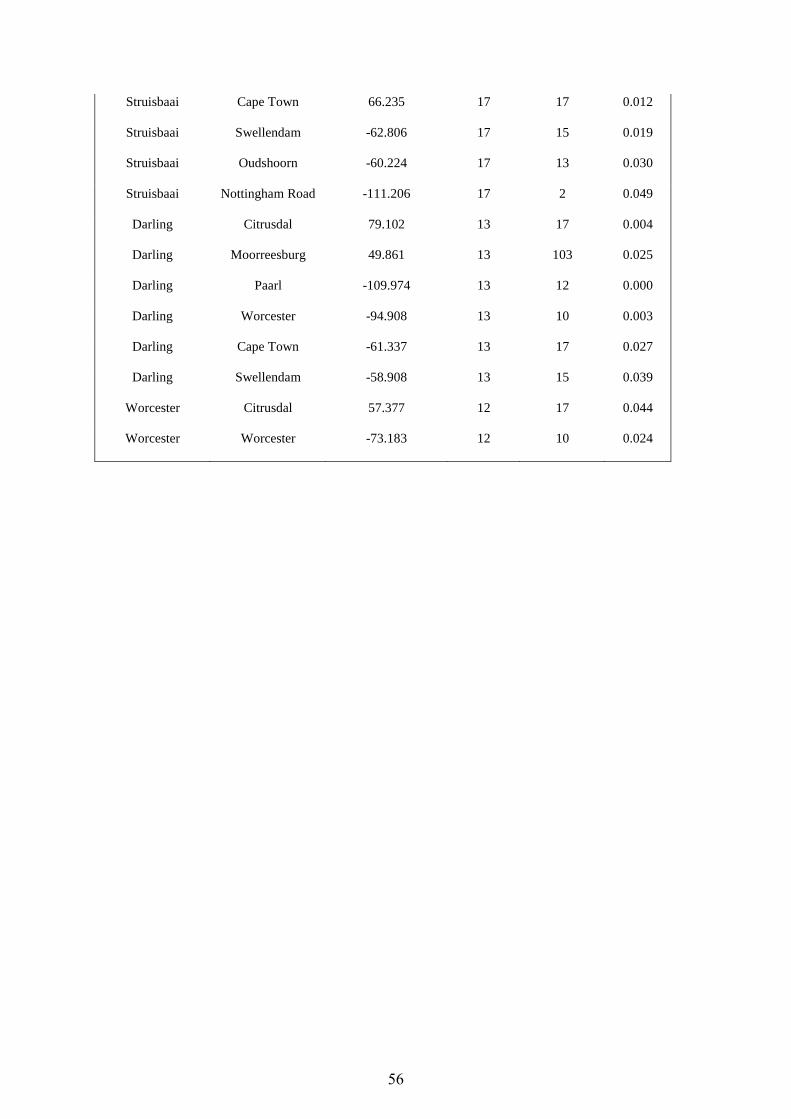
Struisbaai Cape Town 66.235 17 17 0.012
Struisbaai Swellendam -62.806 17 15 0.019
Struisbaai Oudshoorn -60.224 17 13 0.030
Struisbaai Nottingham Road -111.206 17 2 0.049
Darling Citrusdal 79.102 13 17 0.004
Darling Moorreesburg 49.861 13 103 0.025
Darling Paarl -109.974 13 12 0.000
Darling Worcester -94.908 13 10 0.003
Darling Cape Town -61.337 13 17 0.027
Darling Swellendam -58.908 13 15 0.039
Worcester Citrusdal 57.377 12 17 0.044
Worcester Worcester -73.183 12 10 0.024
56

Supplementary Table S2 Summary of the statistically significant results for the pairwise
comparisons between the masses of mature G. capensis (individuals with a mass <120g removed) for
all individuals, only male individuals and only female individuals between the various sampling
localities. The names of the two populations that were compared (Pop 1 and Pop2) are shown along
with the Mann-Whitney U test statistic, number of samples in population 1 (N(Pop1)) and population
2 (N(Pop2)) and the p-value for the comparison.
Pairwise mass difference: All specimens (Juveniles removed)
Pop1 Pop2 Mann-Whitney U N (Pop1) N (Pop2) p-value
Struisbaai Citrusdal 85.553 15 19 0.011
Struisbaai Moorreesburg 69.655 15 128 0.009
Struisbaai Wolseley -92.550 15 21 0.006
Struisbaai Worcester 96.179 15 14 0.008
Struisbaai Cape Town 134.955 15 22 0.000
Struisbaai Oudshoorn -90.543 15 21 0.006
Struisbaai Paarl 136.75 15 18 0.000
Moorreesburg Paarl -67.095 128 18 0.006
Darling Paarl -86.107 21 18 0.006
Worcester Paarl -88.111 18 18 0.007
Swellendam Paarl 70.528 18 18 0.030
Wakkerstroom Paarl 75.550 15 18 0.027
Belfast Paarl 126.583 3 18 0.035
Belfast Cape Town 126.788 3 22 0.035
Moorreesburg Cape Town -65.300 128 22 0.004
Darling Cape Town -84.312 21 22 0.005
Worcester Cape Town -86.316 18 22 0.005
Swellendam Cape Town 68.732 18 22 0.027
Wakkerstroom Cape Town 73.755 15 22 0.024
Pairwise mass difference: Males (Juveniles removed)
57

Pop1 Pop2 Mann-Whitney U N (Pop1) N (Pop2) p-value
Nieuwoudt-ville Cape Town -82.875 1 8 0.013
Citrusdal Cape Town -63.708 3 8 0.003
Moorreesburg Cape Town -40.375 39 8 0.001
Darling Cape Town -32.375 11 8 0.027
Worcester Cape Town -41.812 8 8 0.008
Worcester Cape Town -44.625 4 8 0.021
Struisbaai Cape Town 55.125 2 8 0.027
Nottingham Road Cape Town 76.375 1 8 0.023
Belfast Cape Town 58.042 3 8 0.007
Citrusdal Paarl -46.000 3 6 0.040
Pairwise mass difference: Females (Juveniles removed)
Pop1 Pop2 Mann-Whitney U N (Pop1) N (Pop2) p-value
Struisbaai Citrusdal 73.668 13 16 0.003
Struisbaai Moorreesburg 52.486 13 89 0.008
Struisbaai Wolseley 55.538 13 14 0.033
Struisbaai Worcester 80.831 13 10 0.004
Struisbaai Cape Town 73.016 13 14 0.004
Struisbaai Oudshoorn -53.272 13 12 0.045
Struisbaai Paarl 95.897 13 12 0.000
Moorreesburg Paarl -43.411 89 12 0.033
Worcester Paarl -68.967 10 12 0.015
Swellendam Paarl 51.067 15 12 0.047
Wakkerstroom Paarl 58.985 11 12 0.033
Darling Paarl -90.367 10 12 0.001
Darling Citrusdal 68.138 10 16 0.011
Darling Worcester -75.300 10 10 0.011
Darling Cape Town -67.486 10 14 0.014
58

Supplementary Table S3 Summary of the statistically significant results for the pairwise
comparisons between the relative testicular masses of G. capensis for all males and only mature males
(individuals with a mass <120g removed) between the various sampling localities. The names of the
two populations that were compared (Pop 1 and Pop2) are shown along with the Mann-Whitney U
test statistic, number of samples in population 1 (N(Pop1)) and population 2 (N(Pop2)) and the p-
value for the comparison.
Pairwise relative testicular mass difference: All specimens
Pop1 Pop2 Mann-Whitney U N (Pop1) N (Pop2) p-value
Worcester Citrusdal 49.800 10 3 0.007
Worcester Moorreesburg 48.247 10 38 0.000
Worcester Wolseley 47.400 10 5 0.002
Worcester Worcester -53.133 10 3 0.004
Worcester Struisbaai -68.800 10 2 0.002
Worcester Swellendam -74.800 10 2 0.001
Worcester Oudshoorn -29.300 10 8 0.028
Worcester Cape Town -70.050 10 7 0.000
Moorreesburg Cape Town -21.803 38 7 0.046
Darling Cape Town -44.050 5 7 0.006
Paarl Cape Town -38.750 4 7 0.025
Oudshoorn Cape Town 40.750 8 7 0.004
Wakkerstroom Cape Town 54.875 4 7 0.001
Belfast Cape Town 60.750 3 7 0.001
Darling Swellendam -48.800 5 2 0.038
Oudshoorn Swellendam 45.500 8 2 0.041
Wakkerstroom Swellendam 59.625 4 2 0.011
Belfast Swellendam 65.500 3 2 0.011
Belfast Struisbaai 59.500 3 2 0.021
Wakkerstroom Struisbaai 53.625 4 2 0.028
59

Wakkerstroom Moorreesburg 33.072 4 38 0.025
Belfast Moorreesburg 38.947 3 38 0.021
Pairwise relative testicular mass difference: Juveniles removed
Pop1 Pop2 Mann-Whitney U N (Pop1) N (Pop2) p-value
Worcester Citrusdal 47.500 7 2 0.018
Worcester Moorreesburg 46.265 7 34 0.000
Worcester Wolseley 45.200 7 5 0.002
Worcester Paarl -32.750 7 4 0.036
Worcester Worcester -50.667 7 3 0.003
Worcester Struisbaai -55.000 7 1 0.039
Worcester Swellendam -69.500 7 2 0.001
Worcester Oudshoorn -30.000 7 8 0.020
Worcester Cape Town -66.125 7 7 0.000
Moorreesburg Cape Town -19.860 34 7 0.043
Darling Cape Town -38.925 5 7 0.006
Paarl Cape Town -33.375 4 7 0.029
Oudshoorn Cape Town 36.125 8 7 0.004
Wakkerstroom Cape Town 52.125 2 7 0.008
Belfast Cape Town 53.792 3 7 0.001
Belfast Swellendam 57.167 3 2 0.012
Darling Swellendam -42.300 5 2 0.043
Oudshoorn Swellendam 39.500 8 2 0.045
Wakkerstroom Swellendam 55.500 2 2 0.026
Belfast Moorreesburg 33.931 3 34 0.024
60

Supplementary Table S4 Summary of the statistical results for regression analyses investigating the
relationship between relative testicular mass in male G. capensis and reproductive variables such as
the average number of embryos in a population and the proportion of gravid females in a population.
Both the full dataset was used and a dataset of mature individuals only where all juvenile animals
(<120g) were removed. The r2 value, number of samples (N) and the p-value are given for each
analysis.
Average number of embryos
All specimens r2 N p-value
Relative testicular mass vs. average number of embryos in a population 0.013 85 0.219
Juveniles removed r2 N p-value
Relative testicular mass vs. average number of embryos in a population 0.016 75 0.281
Proportion of gravid females
All specimens r2 N p-value
Relative testicular mass vs. proportion of gravid females in a population 0.012 85 0.322
Juveniles removed r2 N p-value
Relative testicular mass vs. proportion of gravid females in a population 0.007 75 0.474
61

Supplementary Figure S1 Regression showing the relationship between body mass (g) and body length (mm) in male G. capensis.
62

Supplementary Figure S2 Graphs (mean and standard deviation) showing the differences in G. capensis A.) relative testicular mass (males) and B.) female
size-corrected litter size in soils of different ages. In addition, the differences C.) relative testicular mass (males) and D.) female size-corrected litter size in
different vegetation types are shown.
63

Supplementary Figure S3 Regression showing the relationship between annual rainfall (mm) and elevation above sea-level (m) across the populations where
G. capensis was sampled.
64

Supplementary Figure S4 Regression showing the relationship between the number of embryos in a gravid female G. capensis and the mass (g) of that
particular female.
65