Distribution of Thorium Uranium, and Potassium in … · Distribution of Thorium Uranium, and...
35
Distribution of Thorium Uranium, and Potassium in Igneous Rocks of the Boulder Batholith Region, Montana, and Its Bearing on Radiogenic Heat Production and Heat Flow GEOLOGICAL SURVEY PROFESSIONAL PAPER 614-E
Transcript of Distribution of Thorium Uranium, and Potassium in … · Distribution of Thorium Uranium, and...

Distribution of Thorium
Uranium, and Potassium in
Igneous Rocks of the Boulder
Batholith Region, Montana, and
Its Bearing on Radiogenic Heat
Production and Heat Flow
GEOLOGICAL SURVEY PROFESSIONAL PAPER 614-E


Distribution of Thorium
Uranium, and Potassium in
Igneous Rocks of the Boulder
Batholith Region, Montana, and
Its Bearing on Radiogenic Heat
Production and Heat FlowBy ROBERT I. TILLING and DAVID GOTTFRIED
SHORTER CONTRIBUTIONS TO GENERAL GEOLOGY
GEOLOGICAL SURVEY PROFESSIONAL PAPER 614-E
A study of the relationship between
content of heat-producing elementsJ 1 O
and host-rock chemistry and heat flow
UNITED STATES GOVERNMENT PRINTING OFFICE, WASHINGTON : 1969
UNITED STATES DEPARTMENT OF THE INTERIOR
WALTER J. HICKEL, Secretary
GEOLOGICAL SURVEY
William T. Pecora, Director
For sale by the Superintendent of Documents, U.S. Government Printing Office Washington, D.C. 20402 - Price 40 cents (paper cover)

CONTENTS
Page Abstract ________________________________________ ElIntroduction. ____ ______ ___ _ 1Acknowledgments __ 2 Geologic setting... _____ ___ ___ 2Distribution of thorium, uranium, and potassium in
igneous rocks of the Boulder batholith region _ _ 6 Prebatholith volcanic rocks______ _ 6Batholith rocks________ _______ ________ 6Postbatholith volcanic rocks________ _______ 6
Para Distribution of thorium Continued
Summary and comparison of thorium, uranium, and potassium abundance data____________________ E10
Nature of variation in thorium and uranium content.___ II Comparison of thorium and uranium distribution between
contrasting magma series.__________________ 12Radiogenic heat production and heat flow-________ 17References.. ______________________________ 19
ILLUSTRATIONS
Par* FIGUBE 1. Sketch map showing the areal distribution of igneous rocks in the Boulder batholith region_______________ F3
2. Generalized geolgic map of the Boulder batholith and vicinity________________________________ ____ 43-5. Graphs showing relations of thorium and uranium contents and SiO2, K2O, and CaO/CN^O+KcO) in
3. Prebatholith volcanic rocks of the Boulder batholith region____________________________________ 74. Rocks of the Boulder batholith-___________________________________________________________ 85. Postbatholith volcanic rocks of the Boulder batholith region_____________-_-_____ _________ 9
6. Thorium and uranium distribution curves of selected igneous suites_____________----__-____---_---_--__- 147. Graphs showing a comparison of thorium and uranium distribution patterns of selected granodiorites and
adamellites_-__________________________________________________________ 16
TABLES
TABLE 1. Intel-laboratory comparison of results of analyses for thorium and uranium on four standard rock samples. __2. Summary of thorium, uranium, and potassium values and weighted average values for rocks of the Boulder
batholith _ _ _________ _ _____ _ ______ _ _______ _ ____________ ----- ___ --3. Summary of thorium, uranium, and potassium values for prebatholith and postbatholith volcanic rocks com
pared with weighted average values for the Boulder batholith________________ ___ _____4. Comparison of the thorium and uranium distribution between hydrothermaUy altered Butte Quartz Monzonite
samples and their fresh, unaltered counterparts __ ________ __ _____________________-_----_--_----5. Lime-alkali indices and median Th/U ratios of selected suites of igneous rocks____ ________-__-_---_-----_-6. Radiogenic heat production in igneous rocks of the Boulder batholith and in some other crystalline materials.
7-12. Distribution of thorium, uranium, and potassium in 7. Prebatholith volcanic rocks of the Boulder batholith region.. ___ 8. Rocks of the Boulder batholith ___ _ __ ___ __ _______________ __ _ -- 9. Mafic inclusions in some rocks of the Boulder batholith.- _ _______________ __________________
10. Postbatholith Lowland Creek Volcanics (early Eocene)
F-2
10
11
121317
24252727
11. Postbatholith igneous rocks of probable early Tertiary age in the Boulder batholith region. ______ 2712. Post-Lowland Creek volcanic rocks (Miocene or Pliocene) _ _____________ _ ________________ 28
13. Distribution of thorium and uranium in the Butte Quartz Monzonite from underground workings in the Buttedistrict, Montana __ ____________________________________________________-___---_--------_-_-- 28
14. Distribution of thorium, uranium, and potassium in Butte Quartz Monzonite samples from a drill hole forwhich heat flow has been measured______________________________________-__-__---_-_--_-__----- 29
15. Distribution of thorium, uranium, and potassium in a single stock of Woodson Mountain Granodiorite, Southern California batholith _______ _______________________________ _ 29
in


SHORTER CONTRIBUTIONS TO GENERAL GEOLOGY
DISTRIBUTION OF THORIUM, URANIUM, AND POTASSIUM IN IGNEOUS ROCKS OF THE BOULDER BATHOLITH REGION, MONTANA, AND ITS BEARING ON RADIOGENIC HE^T
PRODUCTION AND HEAT FLOW
By ROBERT I. TILLING and DAVID GOTTPBIED
ABSTRACTThorium and uranium contents in about 150 samples of igneous
rocks from the Boulder batholith region generally increase with increasing SiC>2 content and decreasing CaO/(Na2O+K8O) ratio of their host rocks. Prebatholith volcanic rocks (the Upper Cretaceous Elkhorn Mountains Yolcanics and its correlatives) vary in thorium, uranium, and potassium contents from one out crop area to another: two areas contain rocks with average values of 2.4-2.6 percent K, 6.0-6.6 ppm (parts per million) Th, 2.1-2.9 ppm U, and Th/U ratios between 2.4 and 3.2; a third area contains rocks with average values of 3.5 percent K, 16.6 ppm Th, 3.7 ppm U, and a Th/U ratio of 4.2. The older (and more mafic) rocks of the composite Boulder batholith (also Late Cretaceous) have an average content of 6.2-11.0 ppm Th and 1.5-3.4 ppm U, whereas the younger (and more felsic) rocks have an average content of 15.7-36.3 ppm Th and 4.0-9.2 ppm U. The average radioelement content of the batholith, weighted ac cording to areal abundance of constituent rocks, is 3.3 percent K, 15.4 ppm Th, and 3.9 ppm U. Average Th/U ratios of the batholith samples range from 4.0 to 5.8 and have no apparent correlation with rock composition or position in the intrusive sequence. Postbatholith volcanic rocks (the Lowland Creek Volcanics of early Eocene age and post-Lowland Creek rocks of Pliocene or Miocene age) have thorium, uranium, and potassium contents comparable with those in some of the younger batholith rocks.
Comparison of the Boulder batholith with selected igneous suites representative of diverse magmatic provinces shows that its thorium and uranium distribution is typical of that for calc- alkalic suites. The thorium and uranium distribution pattern of any comagmatic igneous suite can be grossly correlated with its lime-alkali (Peacock) index, which in turn reflects differences in tectonic setting and (or) magma provinces. Calculated from average thorium, uranium, and potassium contents (using Birch's heat-generation values), the total radiogenic production of the calc-alkalic Boulder batholith (weighted according to rock abundance) is 6.8 microcalories per gram per year, as opposed to a similarly computed value of 2.7 microcalories per gram per year for the calcic Southern California batholith.
Available heat-flow measurements from a drill hole and under ground workings in the Butte Quartz Monzonite near Butte are about 2.2 microcalories per square centimeter per second. Calculations demonstrate that the observed heat flow can be fully attributed to radiogenic heat produced in a column of surface rocks 25-35 kilometers thick (depending on the average thorium, uranium, and potassium contents used in the calcula tion), even though limited seismic data indicate that the crust in the Boulder batholith region is about 45 kilometers thick. The apparent discrepancy between radiogenic heat production and heat flow may be resolved by postulating that the content
of heat-producing elements in the crust decreases with depth, which has also been suggested by other investigators as part'il explanation for analogous discrepancies between heat flow and radiogenic heat in the Sierra Nevada batholith.
INTRODUCTION
Data on the distribution of heat-producing elemerts (thorium, uranium, and potassium) in igneous rocks are fundamental to interpretation of petrologic, isotop; °., and geologic evidence pertinent to many problems of magma generation and differentiation, radiogenic heat production and heat flow, and, in the broadest sense, evolution of the earth's crust. It is now generally f o- cepted that the observed continental heat flow c^n largely be attributed to heat generated by the radio- elements. Thus a knowledge of the distribution of these heat-producing elements in the rocks in which heat flow is measured is essential for meaningful interpretation.
The geochemistry of thorium and uranium has be<m ably summarized by Adams, Osmond, and Rogers (1959), and many investigators have studied the d'^- tribution of thorium and uranium in several magmatic differentiation series (for example, Whitfield and others, 1959; Larsen, 3d, and Gottfried, 1960; Gottfried and others, 1962, 1963; Heier and Rogers, 1963; Phair and Gottfried, 1964; and Kolbe and Taylor, 1966a, b). The relationship between radioelement content and rad: o- genic heat has been examined in detail by Birch (1954, 1965), Verhoogen (1956), MacDonald (1964), Wass*r- burg, MacDonald, Hoyle, and Fowler (1964), and Wollenberg and Smith (1964, 1968a, b).
Previous studies of radioactivity of rocks in 1he Boulder batholith region were made under the auspices of the U.S. Atomic Energy Commission in connection with the intensive prospecting for uranium in the northern part of the batholith from 1949 to IS 56 (Becraft, 1956; Bieler and Wright, 1960; Wright and Bieler, 1960). In conjunction with this exploration pro gram for uranium deposits, fundamental studies on the distribution of thorium and uranium in fresh, unaltered batholith and prebatholith and postbatholith volcanic rocks were also initiated to better understand the
El

E2 SHORTER CONTRIBUTIONS TO GENERAL GEOLOGY
behavior of these elements during magmatic differentia tion. In recent years, the geologic mapping of the Boulder batholith and vicinity has been nearly com pleted, thereby making it possible to evaluate the data on thorium, uranium, and potassium distribution in light of a better understood igneous history of the region.
In this report, data on about 150 samples are pre sented, correlated with their rock chemistry, and compared with data on samples from selected igneous rock series of the United States and elsewhere in the world. In addition, radiogenic heat production, calcu lated from the average radioelement content of the samples, is compared with preliminary heat-flow data on the Boulder batholith.
Analyses for thorium and uranium were obtained by wet chemical methods. During the early stages of the study, thorium was determined by the chemical method of Levine and Grimaldi (1958), which subsequently has been greatly simplified with the use of arsenazo III as the reagent for thorium (May and Jenskins, 1965). Most of the thorium data in this report were obtained by the arsenazo III method, which yields results repro ducible to ± 10 percent for thorium contents as low as a few parts per million. Uranium contents were deter mined by the fluorimetric method of Grimaldi, May, and Fletcher (1952) adapted to concentrations of uranium commonly found in igneous rocks. With the fluorimetric method, uranium contents can be deter mined with a precision of ± 10-15 percent for concentra tions greater than 1 ppm; however, for concentrations from 0.5 to 1 ppm, the analytical uncertainty may be as great as ± 50 percent.
A comparison of thorium and uranium values ob tained by the methods used in this study with those determined by neutron activation, isotope dilution, and gamma-ray spectrometry for four standard rock samples is given in table 1. The agreement between results from
TABLE 1. Interlaboratory comparison of results of analyses, in parts per miUion, for thorium and uranium on four standard rock samples
[Chemical method: Roosevelt Moore and Esma Campbell (this rept.). Neutron activation and gamma-ray spectrometry: Morgan and Heier (1966). Delayed- neutron method: Hamilton (1966)]
Sample No. and rock type
Chemical method
Neutron activation
Gamma- ray spec trometry
Isotope Delayed-dilution neutron
method
Thor- Ura- Thor- Ura- Thor- Ura- Thor- Ura- Ura-ium ni- ium ni- ium ni- ium ni- nium
um um um urn
G-2,granite.___ 21.5 GSP-1, granodi-
orite..-.......... 100AGV-1, andesite... 6.1 BCR-1, basalt...- 6.2
2.0 24.1 2.16 25.7 2.1 124.3 11.94
2.2 2.0 1.6
6.47 2.176.00 1.81
1066.46.1
1.7 H06 22.4 1.9 86.27 "1.96 1.6 ...............
1.64
1.801.471.44
1 Doe, Tatsumoto, Delavaux, and Peterman (1967).* Peterman, Doe, and Bartel (1067).3 Mitsunobu Tatsumoto (unpub. data, 1968).
these independent methods is highly satisfactory and indicates that the accuracy of the determinations is of the same order as the precision.
ACENO WLEDGM ENTS
We wish to express our gratitude to David D. Blackwell, Southern Methodist University, Dallas, Tex., and to our colleague Eugene C. Roberteon, U.S. Geological Survey, for kindly providing their under ground samples from the Butte district and their heat- flow data in advance of publication. Robertson, along with Harry W. Smedes, Geological Survey, critically read an earlier version of the manuscript and suggested many ways to improve it. Thanks are also due Randolph Chapman, presently at Trinity College, Hartford, Conn., for collecting many of th^ samples analyzed in this report and Roosevelt Moore, Esma Campbell, Paul Elmore, and other chemists in the Geological Survey for analytical data. We also bene fited from discussions of mutual problems with Michael Fleisher and Zell E. Peterman, Geological Survey, who also drew our attention to some of the Russian litera ture on thorium and uranium. Earlier phases of this study were done on behalf of the Division of Research of the U.S. Atomic Energy Commission.
GEOLOGIC SETTING
The geologic setting of the composite Boulder batholith and satellitic plutons has been described elsewhere and need only be summarized briefly here (Knopf, 1957, 1963; Smedes, 1966a; Doe and others, 1968; Tilling and others, 1968). The Boulder batholith is exposed over an area of approximately 2,rOO square miles. It cuts rocks ranging in age from early Pre- cambrian (pre-Beltian metamorphic rocks) to Late Cretaceous (Elkhorn Mountains Volcanics) and is cut and unconformably overlain by the Lowknd Creek Volcanics of early Eocene age and by younger rocks (Smedes and Thomas, 1965).
At its type locality, the Elkhorn Mountain? Volcanics consists of pyroclastic and epiclastic volcanic strata, lavas, and welded tuffs having a combined strati- graphic thickness of more than 10,000 feet and ranging in composition from basalt to rhyolite (Khpper and others, 1957; Smedes, 1966a). Because of th«.ir similar lithology and stratigraphic position, Upper Cretaceous volcanic and clastic rocks in the Wolf Creek area to the north of the Elkhorn Mountains area r.nd in the Three Forks and Maudlow areas to the south and east (fig. 1) are considered to be grossly contemporaneous with the Elkhorn Mountains Volcanics (Robinson, 1963; Robert G. Schmidt, oral commun., 1968). Smedes (1966a, p. 21) suggested that the Upper Cretaceous
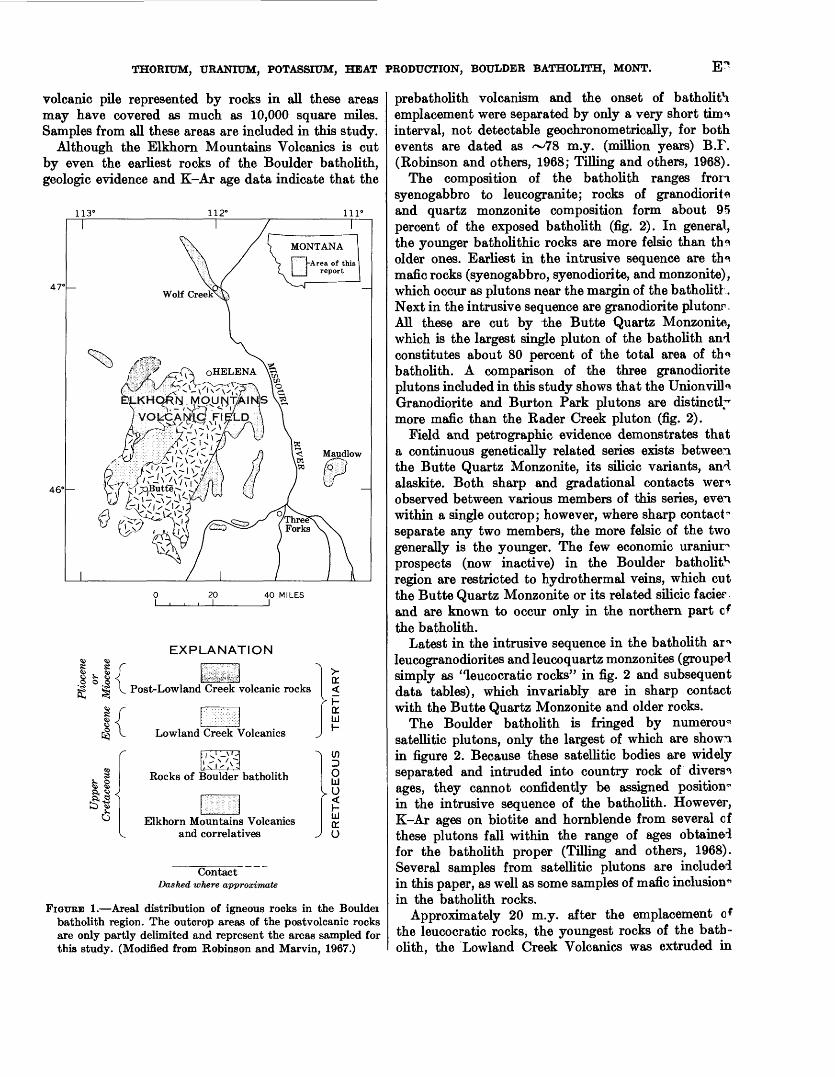
THORIUM, URANIUM, POTASSIUM, HEAT PRODUCTION, BOULDER BATHOLITH, MONT. E-
volcanic pile represented by rocks in all these areas may have covered as much as 10,000 square miles. Samples from all these areas are included in this study.
Although the Elkhorn Mountains Volcanics is cut by even the earliest rocks of the Boulder batholith, geologic evidence and K-Ar age data indicate that the
113° 112° 111"
47
46°
20I
EXPLANATION
40 MILES I
Post-Lowland Creek volcanic rocks
Lowland Creek Volcanics
Rocks of Boulder batholith
Elkhorn Mountains Volcanics and correlatives
ContactDashed where approximate
FIGURE 1. Areal distribution of igneous rocks in the Bouldei batholith region. The outcrop areas of the postvolcanic rocks are only partly delimited and represent the areas sampled for this study. (Modified from Robinson and Marvin, 1967.)
prebatholith volcanism and the onset of batholit1! emplacement were separated by only a very short tim^ interval, not detectable geochronometrically, for both events are dated as ~78 m.y. (million years) B.F. (Robinson and others, 1968; Tilling and others, 1968).
The composition of the batholith ranges from syenogabbro to leucogranite; rocks of granodiorite and quartz monzonite composition form about 95 percent of the exposed batholith (fig. 2). In general, the younger batholithic rocks are more felsic than th<* older ones. Earliest in the intrusive sequence are tin mafic rocks (syenogabbro, syenodiorite, and monzonite), which occur as plutons near the margin of the batholith. Next in the intrusive sequence are granodiorite plutonr. All these are cut by the Butte Quartz Monzonito, which is the largest single pluton of the batholith and constitutes about 80 percent of the total area of th°> batholith. A comparison of the three granodiorite plutons included in this study shows that the Unionvilta Granodiorite and Burton Park plutons are distinctly more mafic than the Rader Creek pluton (fig. 2).
Field and petrographic evidence demonstrates that a continuous genetically related series exists between the Butte Quartz Monzonite, its silicic variants, and alaskite. Both sharp and gradational contacts wer^ observed between various members of this series, evei within a single outcrop; however, where sharp contact" separate any two members, the more felsic of the two generally is the younger. The few economic uranium prospects (now inactive) in the Boulder batholith region are restricted to hydrothermal veins, which cut the Butte Quartz Monzonite or its related silicic facier and are known to occur only in the northern part cf the batholith.
Latest in the intrusive sequence in the batholith ar^ leucogranodiorites and leucoquartz monzonites (grouped simply as "leucocratic rocks" in fig. 2 and subsequent data tables), which invariably are in sharp contact with the Butte Quartz Monzonite and older rocks.
The Boulder batholith is fringed by numeroir satellitic plutons, only the largest of which are show^i in figure 2. Because these satellitic bodies are widely separated and intruded into country rock of diverse ages, they cannot confidently be assigned position^1 in the intrusive sequence of the batholith. However, K-Ar ages on biotite and hornblende from several cf these plutons fall within the range of ages obtained for the batholith proper (Tilling and others, 1968). Several samples from satellitic plutons are included in this paper, as well as some samples of mafic inclusion-" in the batholith rocks.
Approximately 20 m.y. after the emplacement of the leucocratic rocks, the youngest rocks of the bath- olith, the Lowland Creek Volcanics was extruded in

SHORTER CONTRIBUTIONS TO GENERAL GEOLOGY
_112D 3Q1 112°00'
460 30'h-
46°00'
15 MILES
FIGURE 2. Generalized geologic map of the Boulder batholith and vicinity. (Modified from Tilling and others, 196" fig. 1.)
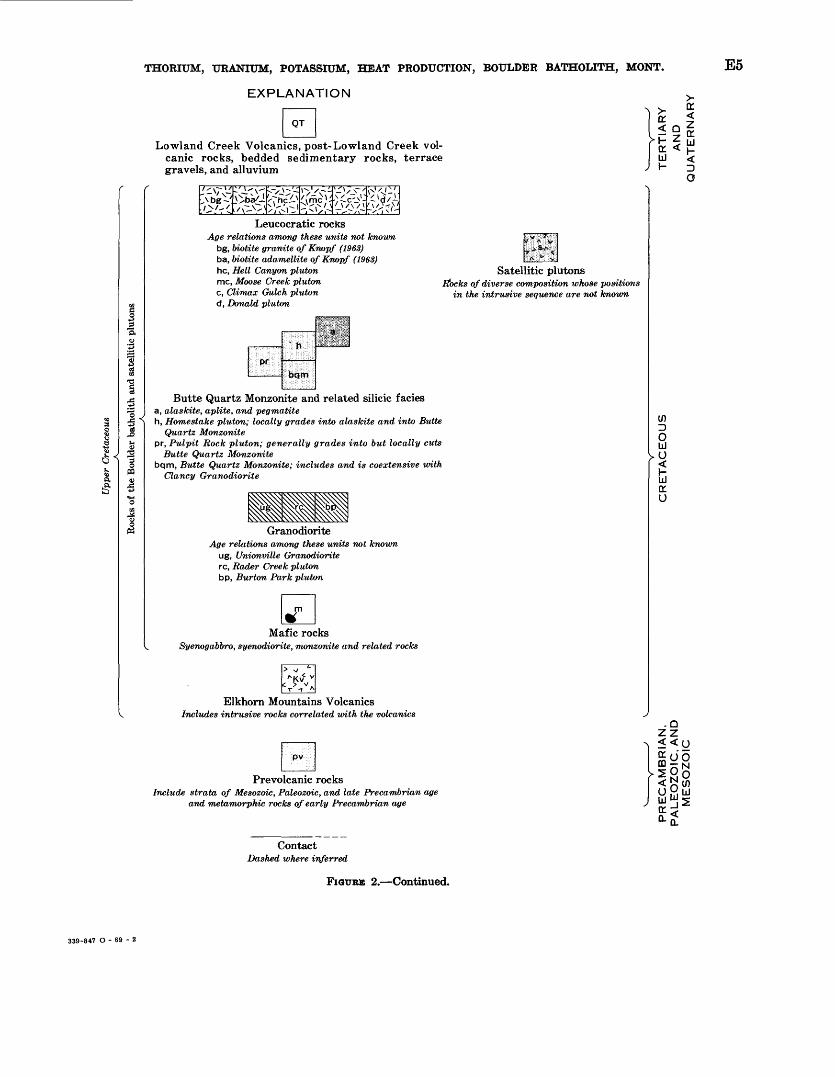
THORIUM, URANIUM, POTASSIUM, HEAT PRODUCTION, BOULDER BATHOI/ITH, MONT. E5
EXPLANATION
Lowland Creek Volcanics, post-Lowland Creek vol canic rocks, bedded sedimentary rocks, terrace gravels, and alluvium
Leucocratic rocksAge relations among these units not known
bg, biotite granite of Knopf (1963) ba, biotite adamellite of Knopf (1963) he, Hell Canyon pluton me, Moose Creek pluton c, Climax Gulch pluton d, Donald pluton
Satellitic plutonsflocks of diverse composition whose positions
in the intrusive sequence are not known
Butte Quartz Monzonite and related silicic facies a, alaskite, aplite, and pegmatite h, Homestake pluton; locally grades into alaskite and into Butte
Quartz Monzonite pr, Pulpit Rock pluton; generally grades into but locally cuts
Butte Quartz Monzonite bqm, Butte Quartz Monzonite; includes and is coextensive with
Clancy Granodiorite
GranodioriteAge relations among these units not known
ug, Unionville Granodiorite re, Rader Creek pluton bp, Burton Park pluton
Mafic rocksSyenogabbro, syenodiorite, monzonite and related rocks
Elkhorn Mountains Volcanics Includes intrusive rocks correlated with the volcanics
Prevolcanic rocksInclude strata of Mesozoic, Paleozoic, and late Precambrian age
and metamorphic rocks of early Precambrian age
Contact Dashed where inferred
FIGTJBE 2. Continued.
339-847 O - 69 - 2

E6 SHORTER CONTRIBUTIONS TO GENERAL GEOLOGY
early Eocene time (48-50 m.y.) onto the eroded surface of the batholith (Smedes and Thomas, 1965). These volcanic rocks, which occur in the southwestern part of the Boulder batholith region (fig. 1), consist mainly of quartz latitic to rhyolitic flows, pyroclastics, welded tuffs, and reworked volcanic debris (Smedes, 1962). Dikes, probably feeders associated with the Lowland Creek Volcanics, locally injected the batholith and associated hydrothermal veins. In addition to samples of Lowland Creek Volcanics, three samples of basalts of probable early Tertiary age from the Three Forks and Wolf Creek areas have been analyzed in this study. Although these three basalts may well be contempo raneous with part of the Lowland Creek Volcanics, they are not considered as part of the Lowland Creek volcanic field.
Another period of Tertiary volcanism is represented by rhyolite plugs, dikes, and flows, which crop out principally in the northern and northwestern part of the Boulder batholith region (fig. 1). Field relations (Ruppel, 1961, 1963; Smedes, 1966a; Knopf, 1913) demonstrate that these rocks are younger than the Lowland Creek Volcanics and may be as young as Miocene or Pliocene. In this report, these rocks are termed "post-Lowland Creek volcanic rocks."
Igneous rocks of the Boulder batholith region are grossly similar in chemical composition and characterize the region as a calc-alkalic igneous province; the rocks of the batholith have a lime-alkali (Peacock, 1931) index of about 58. Although minor differences exist, the prebatholith volcanic rocks are compositionally similar to the older and more mafic rocks of the batho lith (m, ug, bp, re, and bqm of fig. 2), and the post- batholith volcanic rocks are similar to the younger and more felsic batholith rocks (pr, h, a, and "leuco- cratic rocks" of fig. 2). Exceptions are the three post- batholith basalt samples from the Wolf Creek and Three Forks areas (designated as "other lower Tertiary igneous rocks" in tables 3 and 11 and fig. 5).
DISTRIBUTION OP THORIUM, URANIUM, AND PO TASSIUM IN IGNEOUS ROCKS OF THE BOULDER BATHOLITH REGION
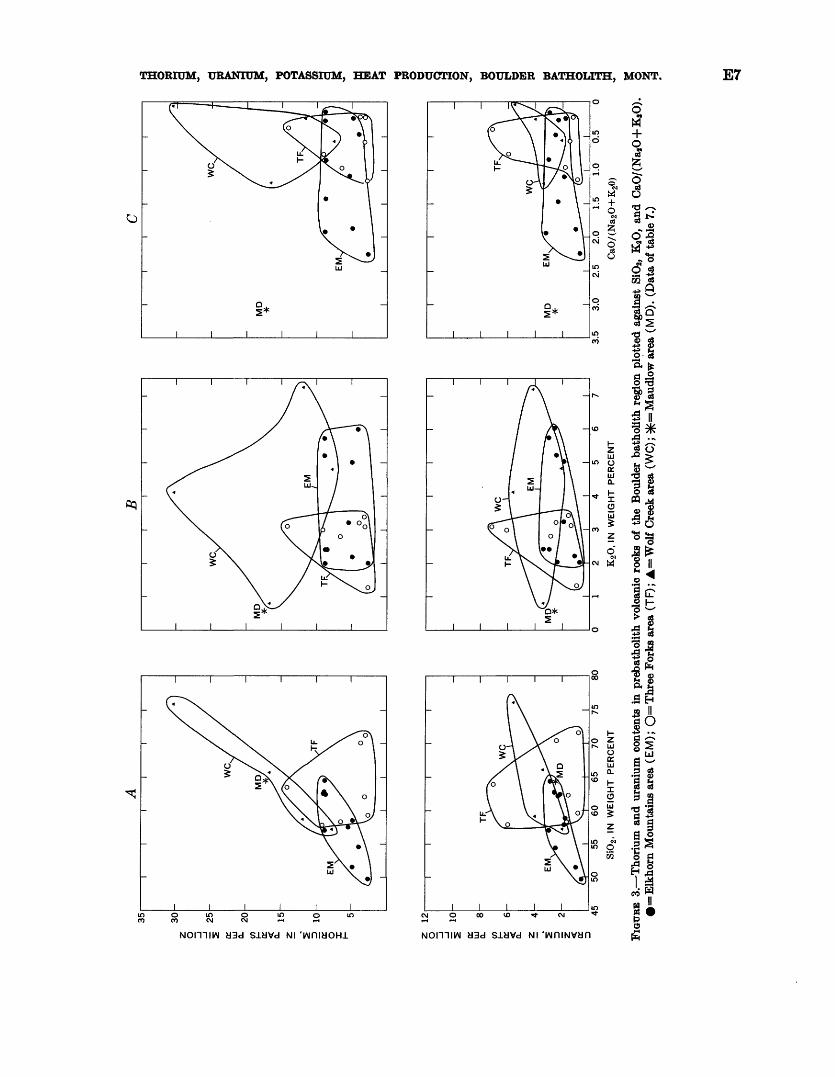
PREBATHOLITH VOLCANIC BOOKS
When plotted against selected chemical parameters (fig. 3), thorium and uranium in prebatholith volcanic rocks (table 7) reveal considerable overlap but nonethe less define several fields according to their areas of occurrence. With exception of a few samples, the analyzed prebatholith volcanic rocks contain less than 10 ppm Th and less than 4 ppm U. In general, samples from the Wolf Creek area are highest in thorium and uranium and have the highest Th/U ratio (table 3). Figure 3A shows a positive correlation between SiO2 and
both thorium and uranium for samples from the Elk- horn Mountains Volcanics and the Wolf Creek area. For the Three Forks samples, there may be no correlation between SiO2 and thorium and uranium, though a weak negative one is suggested. Figure 3(7 suggests that both thorium and uranium tend to increase with decreasing CaO/(Na2O+K2O), although this relationship is much better illustrated by data for the batholith (fig. 4(7). Numerous workers have described a systematic increase of thorium and, less systematically, uranium content with increase in potassium content (Lyons, IS 64; Heier and Rogers, 1963; Whitfield and others, 195«). These relations, however, are at best only feebly demonstrated by the prebatholith volcanic rocks of the Boulder batholith region (fig. 3B).
BATHOLITH BOCKS
Sixty chemically analyzed rocks representative of the major plutons of the Boulder batholith have been analyzed for thorium and uranium in tl is study (table 8). A plot of the, thorium and uranium contents of these samples against selected chemical parameters (fig. 4) illustrates the pattern of increasing thorium and uranium with increasing SiO2 commonly observed for calc-alkalic rock series; the correlation of thorium and uranium concentration with bulk rock composition is particularly well demonstrated if the data are plotted against CaO/(Na,O+K»0) (fig.40).
Although there is much scatter, the plotted data show that each pluton, or group of similar plutons, of the batholith has a characteristic range of thorium and uranium. With the exception of two samples, the batholith rocks have less than 10 ppm U, the older rocks (the mafic rocks and granodiorites) generally having less than half that amount. Similarly, the older rocks generally contain less than 15 ppm Tl, whereas the younger and more felsic rocks contain more than 15 and as much as 42 ppm Th. With exception of three samples, only the alaskites contain more than 20 ppm Th. Thorium and uranium contents of mafic inclusions in the batholith rocks (table 9) and of the satellitic plutons (table 8) are comparable to those of the older batholith rocks.
POSTBATHOLTTH VOLCANIC BOCK'S
Thorium and uranium contents of postbatholith volcanic rocks (tables 10-12) also define distinct fields when plotted against SiO2 , K2O, and CaO/(Na 2O-f K2O) (fig. 5). Samples of the Lowland Creek Volcanics and the other lower Tertiary samples are characterized by lower average thorium and uranium contents in com parison with the post-Lowland Creek rocks (table 3). In a gross way, the variation in thorium and uranium abundance can be correlated with rock composition.
S5 URANIUM, IN PARTS PER MILLION
g ^2 ^____K) -t> CT> 00 CM °MIIIIF
THORIUM, IN PARTS PER MILLION
i-1 i- ro i\j co w____O____en____o____w____oi i i i i r

E8 SHORTER CONTRIBUTIONS TO GENERAL GEOLOGY
I I I I I I I I
Hi
X
9,
^^
l
"* nD
111-
ill ill i i i i i i i i i
i i i i i i i i i
-
-
ico 17;
z oo "§w ?
2 m^
o 10 o n CM CM
d3d SldVd Nl '
n i i i
i i i
3 .
O £ T» *» 5 a PS CM
- alin N S it 10 p .-^ "
iw
S Y ^3 /\
PQ -£
OOOlO ^-CMOOOVO^-CM
Nomiw aad siavd NI '

THORIUM, URANIUM, POTASSIUM, HEAT PRODUCTION, BOULDER BATHOLITH, MONT. E9
I vg " r To oT
I I I I I I I I
&£ 4* c?
32JZJ'"I-' qo
§1 6^ § V
§-5
qStf't O o ^
38 ^
II a «
i r i i i r
I____I____I____I_____I____I____I____I____I
o ro Oil CM
d3d SldVd NI'
I I I I I I
J___L I I
ao £>dflP 5^A 4
1°
3§
*|gn O
Is^ o
iiO »3> .2
0i|I 1M*r |iIQ
B|S"2 Jrf
Niomii/yi y3d siyvd NI '
g £

E10 SHORTER CONTRIBUTIONS TO GENERAL GEOLOGY
Figure 5A, G demonstrates that thorium and uranium increase exponentially with increasing SiO2 and de creasing CaO/(Na2O+K2O). Even though the data are much more scattered, thorium, in general, increases with increasing K2O in all the postbatholith samples. However, although uranium for the Lowland Creek Volcanics and other lower Tertiary samples varies but little with variation in K2O, uranium for post-Lowland Creek samples increases with increasing K2O (fig. 5J3). Despite differences in rock composition and in abun dance of thorium and uranium, the average Th/U ratios of all the postbatholith rocks differ only slightly, ranging from 4.0 to 4.7.
SUMMARY AND COMPARISON OF THORIUM, URANI UM, AND POTASSIUM ABUNDANCE DATA
The satellitic plutons have the lowest average con tents of thorium and uranium observed for the batholith (table 2); however, the number of samples analyzed (six) is probably not sufficient to adequately represent these bodies, for, though generally small, they are abundant and have diverse composition. Among the units of the batholith proper, the rocks early in the intrusive sequence have lower thorium and uranium contents than those later in the sequence, primarily because the early rocks are more mafic. However, com positional control on thorium and uranium abundance is not the only factor involved as shown by comparison of the granodiorite units. Although granodiorites of the Rader Creek pluton are decidedly more felsic than granodiorites of the Burton Park and Unionville Granodiorite plutons, they contain the lowest amounts of thorium and uranium observed for the granodioritic rocks (table 8).
The average radioelement (thorium, uranium, and potassium) content of the batholith, weighted according to area! abundance of constituent rocks, is 3.3 percent K, 15.4 ppm Th, 3.9 ppm U; the Th/U ratio is 4.7 (table 2).
The youngest rocks of the batholith do not contain the most thorium and uranium; the lower cor tents of thorium and uranium in these rocks relative to the Butte Quartz Monzonite and related rocks may be in part be cause they are not the most felsic rocks of the batholith, even though they are the youngest. In addition, in the youngest rocks Na2O generally is greater thm K2O, whereas in all other batholith rocks K2O predominates over Na2O (table 8). Thus, the youngest rc^ks ap parently depart from the typical calc-alkalic differen tiation trend in which the youngest rocks are highest in K2O and SiO2 as well as in thorium and uranium. That the Boulder batholith may not represent a simple calc- alkalic differentiation series is suggested also by lead and strontium isotope data, which indicate that the leucocratic rocks (of which only the Hell Canyon and Donald plutons were analyzed isotopically) and the rocks of the Rader Creek pluton differ significantly in isotopic makeup from all other rocks of the I Hholith and from each other (Doe and others, 1968).
Average Th/U ratios of the batholith range from 4.0 to 5.8, with no apparent relation to bulk rock composi tion or to position in the intrusive sequence. Only for the Butte Quartz Monzonite and its silicic differentiates is any possible systematic variation in Th/U ratio ob served. The average Th/U ratio is 4.5 for tH Butte Quartz Monzonite, 4.7 for its silicic facies, and 4.9 for the alaskites. Thus for the Butte Quartz Monzonite- alaskite series, which constitutes about 80 percent of the
TABLE 2. Summary of thorium, uranium, and potassium values and weighted average values for rocks of the Boulder batholith
[Rocks listed according to position in Intrusive sequence from oldest to youngest (except for satellitic plutons). Data from table 8]
. . Number of Map unit (fig. 2) Samples
Mafic rocks (m) __ . ............Granodiorite
Mafic (ug, bp) 2. ___ . ___ .... _ . .......Felsic (re) _____ ... ___ .
Butte Quartz Monzonite (bqm) 3.. . .Silicic facies of the Butte Quartz Monzonite (pr, h). . Alaskites (a)* ....................Leucocratic rocks (he, d, c) .......Satellitic plutons (s) _____ . ___ . ..
Average (weighted according to areal abund ance of constituent plutons) ..................
4
5 7
15 6 5
12 6
Estimated areal
abundance (percent of
exposed batholith)
0.5
4.5 4.5
73.0 4.0 1.0 7.5 5.0
Potassium (percent)
Range
2.3-3.1
2.0-3.4 2.1-3.6 1.8-3.7 3.3-4.1 3.9-4.9 2.4-3.4 1.6-4.0
Average
2.7
2.8 2.5 3.4 3.6 4.5 2.9 2.6
3.3 .
Thorium (ppm)
Range
2.7-10.7
8. 8-16. 9 5.4-12.6
11.8-19.0 14.9-38.5 26. 0-42. 0 7.6-30.7 2. 5-11. 1
Average
6.2
11.0 7.3
16.2 22.3 36.3 15.7 5.9
15.4 ..
Uranium (ppm)
Range
0.4- 2.3
1.7-5.7 .8-2.7
1.6-7.1 2.6-12.1 4.4-20.0 1.6-8.8 .7- 2.3
Average
1.5
3.41.5 4.0 5.9 9.2 4.1 1.4
3.9 .
Th/U
Range
2.6-6.7
2. 8- 5. 5 3.4-9.2 2.7-11.2 1.6-7.9 2.1-6.9 1.9-6.5 1.6- 5.8
Average 1
4.8
4.0 4.8 4.0 4.7 4.9 4.4 4.5
84.7
Computed from individual Th/U ratios, not from average thorium and uranium.2 Age relations between the granodiorite units (ug, bp, re) cannot be determined because these rocks are separated spatially (see flg. 2). The Unfonville Qranodiorite (ug)
and Burton Park pluton (bp) are arbitrarily placed earlier in the intrusive sequence because of their more mafic composition. »Excluding samples 54C-248 and 52C-10a which are xenolith-rich mafic border facies. 1 Excluding the granite porphyry sample (5T-29a). s Calculated from average Th/U ratios of the batholith units and not from weighted average thorium and uranium.

THORIUM, URANIUM, POTASSIUM, HEAT PRODUCTION, BOULDER BATHOLITH, MONT. EJ1
exposed batholith, the Th/U ratio appears to increase slightly with differentiation, although the increase may not be statistically significant because of analytical uncertainties (p. E2).
In terms of bulk rock composition and thorium and uranium content, the Elkhorn Mountains Volcanics is grossly similar to the oldest rocks of the batholith, the mafic rocks (table 3). This relationship is consistent with field and geochronometric evidence, which indi cates that the Elkhorn Mountains Volcanics and the oldest batholith rocks were separated by an extremely short time interval. However, the average Th/U ratio of 3.2 for the Elkhorn Mountains Volcanics contrasts with that of 4.8 for the mafic rocks of the batholith. In fact, average Th/U ratios of all the prebatholith vol canic rocks studied are lower than average ratios of the batholith rocks, if the single volcanic sample from the Maudlow area and the mafic granodiorites are omitted. Similarly, excluding the three basalt samples, the post batholith volcanic rocks also have lower average Th/U ratios than the batholith rocks (compare table 2 with table 3).
With few exceptions, both the prebatholith and post batholith volcanic rocks are characterized by lower average Th/U ratios than rocks of the Boulder bath olith. This difference in Th/U ratio no doubt is partly due to differences in rock composition; however, the fact the the combined range in chemical composition of the prebatholith and postbatholith volcanic rocks is similar to that of the batholith suggests that rock composition cannot be the sole factor causing this difference. Although presently available data are in conclusive, the possibility exists that the difference in Th/U ratio might stem in part from fundamental dif ferences in the geochemical behavior of thorium and uranium under conditions of plutonism as opposed to volcanism. A similar explanation has recently been in
voked to partly explain variations in cesium distribution in extrusive basalts versus hypabassal intrusive basalts (Gottfried and others, 1968).
NATURE OF VARIATION IN THORIUM AND URANIUM CONTENT
Primary magnetic abundances of thorium and uran ium can be modified by later alteration (Hurley, 1950; Neuerburg and others, 1956; Brown and Silver, 195*>; Tilton and others, 1955; Larsen, 3d, 1957; Larsen, Jr., and Gottfried, 1961; Ragland and others, 1967). Therefore it is essential to evaluate whether the ob served variations in thorium and uranium are pre dominantly due to primary or secondary processes.
To minimize the possibility of obtaining secondary variations in thorium and uranium content, the rocvs analyzed in this study were carefully collected to avoid zones of hydro thermal alteration and (or) faulting; the samples analyzed appeared fresh both in hand sample and in thin section. Petrographic study indi cated that sphene is a common primary accessor mineral in nearly all the batholithic rocks. Allanite of probable deuteric origin was found only in trace amounts in many of the batholith rocks but is absent in the mafic rocks and mafic granodiorites. However, there is no apparent correlation between the absence or presence of these thorium- and uranium-rich minerr Is and the observed thorium and uranium content of t\e host rock. With the exception of the glassy welded tuff from Maudlow (table 7), which has an anomalously low content of K2O relative to the other prebatholith volcanic rocks, the major-element compositions also do not suggest any alteration of the rocks. Therefore, because of the lack of contrary evidence, the distribution of thorium and uranium in igneous rocks of the region was assumed to be predominantly primary.
TABLE 3. Summary of thorium, uranium, and potassium values for prebatholith and postbatholith volcanic rocks compared with weightedaverage values for the Boulder batholith
[Data from tables 7, 10,11, and 12]
Number of Potassium (percent) Thorium (ppm) Uranium (ppm) Th/U
Range Average Range Average Range Average Range Average
Prebatholith volcanic rocks:Elkhorn Mountains volcanic field._.______..___.. 10 1.7-5.0 2.6 2.5-8.9 6.6 .7-3.0 2.1 1.5-4.8 3.2 Three Forks area........................................... 7 1.1-2.8 2.4 2.7-14.4 6.0 .8-6.0 2.9 1.6-9.6 2.4Wolf Creek area............................................. 4 .7-6.0 3.5 6.8-30.9 16.6 2.0-5.6 3.7 3.0-5.5 4.2Maudlow area_____...._____.___...._____ 1 . .5 ... 17.5 __.___ 2.6 ______ 6.7
Boulder batholith (weighted average from table 2)....__...... 60 1.6-4.9 3.3 2.5-42 15.4 .4-20.0 3.9 1.5-11.2 4.7Postbatholith volcanic rocks:
Lowland Creek Volcanics (early Eocene).........__....... 11 1.9-4.4 2,9 4.0-20.2 9.0 .8-4.5 2.5 .9-13.4 4.3Other lower Tertiary igneous rocks__.__.___.__... 3 1.8-2.6 2,2 2.1-7.9 4.7 .4-2.1 1.1 3.8-5.3 4.7 Post-Lowland Creek volcanic rocks (Miocene or Pliocene).. 10 2.3-4.6 3.5 3.2-44 21.9 2.1-18.0 6.1 1.5-7.2 4.0
E12 SHORTER CONTRIBUTIONS TO GENERAL GEOLOGY
A test of the validity of the assumption that varia tions in thorium and uranium are indeed primary was provided by data on a suite of hydrothermally altered Butte Quartz Monzonite collected from several under ground workings in the Butte district (table 13). Some of these show only slight argillic and sericitic alteration and contain minor sulfides; others are very intensely altered and contain abundant sulfides. In light of data on the ease of leaching uranium, and to a lesser extent thorium, it was anticipated that the uranium and thorium values for these samples which have clearly interacted with hydrothermal fluids should be erratic, depart from primary values, and yield anomalous Th/U ratios. However, a comparison of data on these altered Butte Quartz Monzonite samples with data on their fresh, unaltered counterparts indicates that the thorium and uranium distribution for both are about the same (table 4).
TABLE 4. Comparison of the thorium and uranium distribution between hydrothermally altered Butte Quartz Monzonite samples and their fresh, unaltered counterparts
[Data from tables 8,13, and 14]
Th/UButte Quartz Number Thorium (ppm) Uranium (ppm)Monzonite of
Samples samples Range Average Range Average Range Average
Hydrothermally altered____
Fresh, unaltered (surface) ....
Fresh, unaltered (drill hole).....
14 12.1-25.8 17.1 2.2-8.8 4.4 2.2-6.2 4.3
14 11.8-19.0 16.2 1.6-7.1 4.0 2.7-11.2 4.0
19 12.8-32.4 22.8 3.5-11.8 6.3 2.1-6.3 3.7
This rather unexpected result can be interpreted as either (1) the alteration had little or no effect on the primary thorium, and uranium distribution or (2) what appear to be unaltered samples are in fact also altered. The second interpretation does not seem reasonable, because it would require that the entire mass of Butte Quartz Monzonite be pervasively, and uniformly, affected by ore fluids associated with the Butte mineralization. Such a large-scale alteration, involving distances as great as 60 miles, can be rejected on the basis of isotopic studies (Doe and others, 1968). Though the apparent lack of difference in thorium and uranium distribution between fresh and altered samples is puzzling, the first interpretation nonetheless cannot be excluded. If the first interpretation is assumed to be valid for all samples, then the observed variations in thorium and uranium are probably predominantly primary variations, disturbed little or not at all by later alteration processes.
Data on another suite of Butte Quartz Monzonite samples from a drill hole in the Butte district (table 14) provide a means of testing the possibility that thorium and uranium distribution might vary with depth. The samples from this drill hole, which are also discussed
in connection with heat-flow data (see p. E18), are extremely fresh, although a few contain thin veinlets (0.5-1.5 mm) of sulfides. The depth of the samples ranges from approximately 850 to 4,000 feet Exam ination of table 14 reveals that there is no systematic variation of thorium and uranium with depth and that the thorium and uranium contents of the drill-hole samples are approximately 50 percent higher tl an those typically observed for the Butte Quartz Monzonite (compare tables 8 and 14). Although the drill-hole samples have values of SiOz, alkalies, CaO/(Na2O+K2O) typical to those of the Butte Quartz Monzonite, their average thorium and uranium content is comparable instead to that of the silicic fades of the Butte Quartz Monzonite (table 8).
In summary, available data support the assumption that the thorium, uranium, and potassium distribution in igneous rocks of the Boulder batholith region is predominantly primary and that the distribution observed does .not vary with depth, at least ir a 4,000- foot interval.
COMPARISON OF THORIUM AND URANIUM EISTRIBU- TION BETWEEN CONTRASTING MAGMA SFRIES
It is beyond the scope of this report to summ arize and interpret all the available data on thorium and uranium in igenous rocks for comparison with our data. More over, pertinent petrochemical and geologic information necessary for meaningful interpretation of much of the existing thorium and uranium data is not available, not known, or obscured by postcrystallization phenomena. Therefore, reference is made only to several igneous rock suites (table 5) which were chosen for comparison because:1. The petrochemistry and geologic history of these
suites are reasonably well known.2. The suites selected represent a wide rang^ of mag-
matic provinces and tectonic settings.3. The suites selected are Cretaceous or younger, there
by minimizing postcrystallization modification which affects many of the older suites.
4. Most of the suites selected encompass a vdde com positional range, representing most stages of mag- matic differentiation and thus avoiding comparison of thorium and uranium distribution on the basis of random rock types alone without reference to relative stage of differentiation.
5. The suites selected probably bracket all th e possible variation patterns of thorium and urar^um with differentiation undisturbed by postcrystallization events.
For ease of such comparison, the thorium and uranium data of these selected reference suites are plotted against

THORIUM, URANIUM, POTASSIUM, HEAT PRODUCTION, BOULDER BATHOLITH, MONT. El 3
TABLE 5. Lime-alkali indices and median ThfV ratios of selected suites of igneous rocks
Refer- Referencesence Locality Lime- Median suite alkali- Th/IT Thorium and Chemical and
in fig. 6 index ratio uranium data geologic data
1 .... Kamchatka, 64 1.2U.S.S.R.
2__.. Mariana Islands.. 65 1.2-2.9
3__.. Mount Garibaldi, 64 1.6 British Colum bia.
4____ Strawberry Mts., 63 2.6 Oreg.
5-....- Lassen, Calif....- 64 2.7
6___. Modoc, Calif.....
Shavrova (1958,1961).
Gottfried, Moore,and Campbell(1963).
Shavrova (1958,1961).
Schmidt (1957);Gilbert Corwin(oralcommun., 1967);Stark (1963).
.do-.. - - Mathews (1957).
.do.._........ Thayer (1957).
Larsen, 3d, and Williams (1932).Gottfried (1960).
60 2.8 .....do
7___.. JemezMts., N. 58 3.4 Mex.
.do-
Big Bend, Tex... 51 2.8
Virginia.
Southern Califor nia batholith.
48 3.7
64 3.5
Gottfried, Moore, and Caemmerer (1962).
.do-
Larsen, 3d. and Gottfried (1960); Larsen, Jr., and Gottfried (1961).
Powers (1932); Anderson (1941).
R. L. Smith and R. A. Bailey (oral commun., 1967).
Lonsdale and Max well (1949); J. T. Lonsdale (writ ten commun., 1962).
Charles Milton (oral commun., 1962).
Larsen, Jr. (1948).
SiO 2 content (fig. 6.4); the use of a differentiation index other than SiO 2 would not result in significantly different configuration of the plots.
A comparison of the thorium and uranium variation curves (fig. 6.4) for a given petrographic province in dicates a rather strong geochemical association of these elements over a wide span of differentiation; accord ingly, the Th/U ratio remains fairly constant. However, the Th/U ratio does vary between igneous rock series representing different magma types. The median Th/U ratios of the reference suites (table 5) show a gross correlation with their lime-alkali indices. With exception of the Southern California batholith, the calcic volcanic suites seem to have significantly lower Th/U ratios than those of the alkali-calcic and alkalic series of the continental interior regions. Similar variations of Th/U ratio with geologic setting have been noted by Heier and Carter (1964) for tholeiitic basalts: an average of 1.5 for those of orogenic belts as compared with an average of about 4 for those of the plateau type. Doe (1967) also observed a tendency for higher Th/U ratios to occur in rocks of the continental interior than in rocks of the west coast of the United States.
Thorium and uranium in the reference suites (fig. 6) show a strong correlation with the lime-alkali (Peacock, 1931) index of the given suite, which in turn is influenced by tectonic setting. Reference suites 1-8 are of volcanic origin; reference suite 9 represents a dike complex. The thorium and uranium patterns in these reference
suites are discussed briefly and then they are compared with rocks of the Boulder batholith region and with several other suites of plutonic rocks.
The calcic rock suites (curves 1-5, fig. 6.4) are fairly rep resentative of the circum-Pacific petrographic province and of a tectonically active "island-arc" setting. In these suites thorium can increase gradually to about 6 ppm (curves 3-5), remain nearly constant (curve 2), or decrease slightly (curve 1) with increasing Si0 2 . The uranium distribution pattern of these calcic suites generally follows that of thorium (fig. 6.4). Some of tH calcic suites represent marked exceptions to the often- stated generalization that thorium and uranium con tents increase with increasing SiOa or differentiation index. The Southern California batholith differs from the other calcic suites and is discussed later (p. El5).
The calc-alkalic reference suites represent tectonic associations of the continental interior, that is, tectonic settings east of the "quartz diorite line" of Moore (1959). These suites are characterized by the curvilinear increase of thorium and uranium with increasing SiC-, the increase being most pronounced in the siliceous end members of the suite (fig. 6.4). This relationship is well illustrated by the Jemez Mountains volcanic suite, which is predominantly calc-alkalic, but less so by the Modoc lavas, which have a lime-alkali index that nearly falls into the calcic grouping.
It is generally accepted that alkalic rocks have tectonic associations typical of regions of relative crustal stability. Curvilinear distribution of thorium ard uranium are also characteristic of these suites; however, in the rocks of alkalic affinities, both the thorium and uranium contents are significantly higher than in other igneous rocks (fig. 6.4).
Thorium and uranium distribution curves for rocks of the Boulder batholith region (generalized from data of figs. 3-5 and tables 7-12) are plotted in figure SB, the patterned fields of which are based on the thorium and uranium distribution curves of the reference suites in figure 6A. The Boulder batholith rocks (lime-alkrli index, ^58) show the curvilinear trend typical of calc-alkalic rocks with respect to both thorium and uranium contents, although the siliceous part of the curve actually lies within the field designated for mo^e alkalic rock suites. This slight departure of the batholith curve from the arbitrarily delimited "calc-alkalic" field (as shown in fig. QE) probably has little or no geologic significance and merely illustrates the imper fect nature of such a composite plot as well as the impossibility of fitting natural rock suites into artificial pigeonholes without having some minor overlap. Like the batholith rocks, the postbatholith volcanic roc^s have thorium and uranium distribution curves which

E14
35
SHORTER CONTRIBUTIONS TO GENERAL GEOLOGY
87ppm \ 45ppm D
T
42ppm44ppm#//,Boulder batholith^ //: : : :> :;:'. :- -: :: : '': : : :-:'!:'!: ;/ : ^ / '
40 45 50 55 60 65 70 75 80 40 45
SiO2 , IN WEIGHT PERCENT
50 55 60 65 70
SiO2 , IN WEIGHT PERCENT
75
EXPLANATION
Alkalic and alkali-calcic Calc-alkalic Calcic
1. Kamchatka, U.S.S.R.(64) 3. Mount Garibaldi,
British Columbia (64) 5. Lassen, Calif. (64) 7. Jemez Mountains,
New Mexico (58)
2. Mariana Islands (65) 4. Strawberry Mountains,
Oreg. (63) 6. Modoc, Calif. (60)8. Big Bend, Tex.(51)9. Virginia (48)
EXPLANATION
Alkalic and alkali-calcic Calc-alkalic
PLC = Post-Lowland Creek volcanic rocks (Miocene or Pliocene)
LC = Lowland Creek Volcanicsand other lower Tertiary rocks
Calcic
>Postbatholitr
EMV = Elkhorn Mountains Volcanics ^and correlative rocks VPrebatholith (Upper Cretaceous) )
FIGURE 6. A, Thorium and uranium distribution curves of selected reference igneous suites (see text and table 5). The lime- alkali index of suite is given in parentheses after locality name. B, Thorium and uranium distribution curves of igneous rocks of the Boulder batholith region and of the Southern California batholith superimposed on fields defined by the reference igneous suites of figure 6-4.
THORIUM, URANIUM, POTASSIUM, HEAT PRODUCTION, BOULDER BATHOLITH, MONT. E15
are characteristic of calc-alkalic rock suites but which also plot partly into the "calcic" field as outlined. The thorium curve for the prebatholith volcanic rocks is similar in form to, and intermediate between, the thorium curves for the batholith rocks and the post- batholith volcanic rocks. Similarly, the uranium curve for the prebatholith volcanic rocks lies between the curves for the batholith and for the postbatholith volcanic rocks; however, it does not display the sharp increase in the siliceous end.
The uranium distribution curve for the prebatholith volcanic rocks is more typical of calcic suites, but the thorium curve is that expected for calc-alkalic suites. The reason for this apparent divergence of trends is not known.
Th/U ratios of the igneous rocks of the Boulder batholith region show no systematic variation with respect to degree of differentiation or to age, but there is a tendency for the volcanic rocks, both prebatholith and postbatholith, to have lower ratios than the batholith rocks. Although the average Th/U ratios (tables 7, 8, and 10-12) of the igneous rocks are generally higher than 3.0 and thus are compatible with their calc-alkalic character (see table 5), mafic inclusions in batholithic rocks generally have Th/U ratios less than 3.0 (table 9).
The Southern California batholith (Larsen, Jr., 1948) is a typical representative of a calcic suite (lime-alkali index, ~64), yet its thorium and uranium distribution patterns (fig. QB) resemble more closely those of calc-alkalic suites (for example, the Boulder batholith) than those of the reference calcic volcanic suites (fig. 6A). The reason for this difference is not known, but it may reflect inherent differences in crystallization regimes of a plutonic versus the volcanic environment of the reference calcic suites. Though the distribution curves of thorium and uranium of the Boulder and Southern California batholiths are similar in form, they differ markedly in amounts; figure QB graphically demonstrates that the Boulder batholith is significantly higher in both thorium and uranium than the Southern California batholith. This dif ference in radioactive element content, which is as cribed to difference in petrographic province and, hence, tectonic setting, is also well expressed by the average thorium and uranium contents of these batho liths weighted according to relative areal abundance of the constituent rocks types:
RegionThorium
(ppm)
Boulder batholith (table 2, this rept.)___ 15. 4 Batholiths of Western United States (South
ern California, Sierra Nevada, and Idaho batholiths; Phair and Gottfried, 1964, table IB) 11. 4,
Southern California batholith (table 6, this rept.)_-__-------------- ____________ 5. 5
Uranium (ppm)
3 9
2,5
1.7
Many differences in thorium and uranium related to bulk composition are believed to reflect primarily d*f- ferences of a regional or provincial nature; that is, different segments of the earth's crust differ intrinsically in their thorium and uranium content: For this reason, bulk composition is no universal guide to estimating thorium and uranium content, nor are thorium and uranium guides to bulk composition. To illustrate, frv^o examples have been chosen; the first is of similar thorium and uranium contents from plutons that differ markedly in bulk composition, and the second is of markedly different thorium and uranium contents frna plutons of closely similar bulk composition (fig. 7).
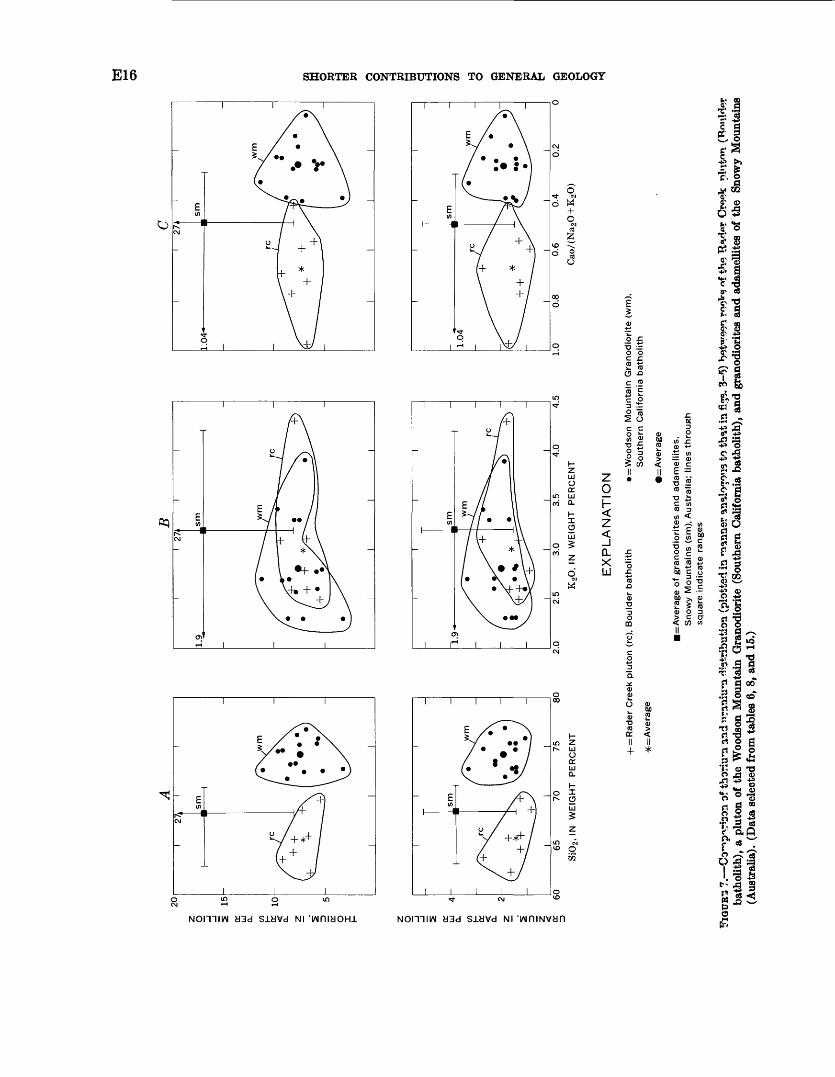
The Rader Creek granodiorite pluton and the Woodson Mountain Granodiorite from the Southern California batholith (table 15) differ significantly in bulk composition, having large differences in, and no overlap of, the SiO2 and CaO/(Na2O+K2O) values but nearly identical average thorium and uranium contorts (fig. 7). The Rader Creek pluton and plutons from the Snowy Mountains, Australia, are similar in bulk composition. The granodiorite and adamellite from the Snowy Mountains have distinctly higher thorium and uranium contents than the Rader Creek or Woodson Mountain plutons, yet the differences in bulk ro°<k composition are small (fig. 7).
This concept of one region of the crust enriched in thorium and uranium ("uranium and thorium prov inces") relative to another has been examined in some detail by Phair and Gottfried (1964), who demonstrated that the Colorado Front Range as a whole has about twice as much thorium and uranium as do batholiths of the Western United States and the "continental crust" of Heier and Rogers (1963).
In summary, the distribution of thorium and ura nium in igneous rocks of the Boulder batholith region is typical of that observed for calc-alkalic rock suites. The comparison of the data of this report with thorium and uranium data on other comagmatic rock ser«» attempts to take into account the dependence of the thorium and uranium distribution pattern on the
E16 SHORTER CONTRIBUTIONS TO GENERAL GEOLOGY
t- M
M
n i r c o
oOL
If) LUO
<z <Q. XUJ
J> 0)
</) <<S ~ </> -CO) ^- ^ hn
. ,ro +-i
go > a;S 5 <50) O 3
11 Jl + *
NomiiAi y3d siyvd NI ' siyvd NI 'i/\intNvyn

THORIUM, URANIUM, POTASSIUM, HEAT PRODUCTION, BOULDER BATHOLITH, MONT. E17
petrographic province, and it is concluded that in any calculation of average crustal abundances of thorium and uranium or in any scheme of the evolution of the radiogenic daughters of these elements, the possibility of wide regional ("provincial") differences should be considered.
RADIOGENIC HEAT PRODUCTION AND HEAT FLOW
The radiogenic heat production of igneous rocks of the Boulder batholith region has been calculated from their thorium, uranium, and potassium contents (table 6) on the basis of Birch's estimates (1954) of heat generation (1 ppm Th=0.20 microcalories per gram per year; 1 ppm U=0.73 /jcal/g yr; 1 percent K=0.27 Mcal/g yr). Heat-production values for the prebatholith volcanic rocks range from 3.4 to 7.0 ncsl/g yr. These values are comparable to those for the earlier and more mafic rocks of the batholith and for rocks of the
satellitic plutons. The younger rocks of the batholith, which are volumetricaHy predominant, are character ized by higher heat-production values, 7.0 to 15.2 /ical/g yr. The average total heat production of tl^ batholith, weighted according to area! abundance of the constituent plutons, is 6.8 /ical/g yr. Of the post- batholith volcanic rocks, the post-Lowland Creek rocks have an average value of 9.8 /*cal/g yr, or slightfy more than twice the heat-production capacity (4.4 /ical/g yr) of the Lowland Creek rocks. Insufficient data preclude calculating average heat-production values for the prebatholith and postbatholith volcanic rocks, weighted for rock abundance.
For comparison, values for total heat production of rocks from other regions are also shown in table 6. The major rock types of the calcic Southern California batholith (tonalite and granodiorite) have distinctly lower heat-production values than the rocks of tl «.
TABLE 6. Radiogenic heat production in igneous rocks of the Boulder batholith and in some other crystalline materials
Map unit or rock type Number of
Estimatedareal
abundance(percent of
exposedbatholith)
Average values
Potassium (percent)
Thorium (ppm)
Uranium (ppm)
Total hea*. Gical/gyrx
Bonlder batholith region
Prebatholith volcanic rocks: Elkhorn Mountains volcanic field ____________________Three Forks area.. _______________________ . _ ..Wolf Creek area. ... __________________________ .
Boulder batholith: Mafic rocks __ . ____________________ ...Granodiorite (ug, bp)... ______________ .......Granodiorite (re). ........... . ............ . ______ . _ .Butte Quartz Monzonite ________________________Silicic Butte Quartz Monzonite. . _____ . ___ . __ .. . .Alaskite. __ . ___ . __ . __ ....Lencocratic rocks. ____________ ..Satellitic plutons. ______ . ................
Average (weighted according to areal abundance of map units) ______ ..
..... 10 .............. 2.67 0 A
..... 4 .............. 3.5
..... 4 0.5 2.7
..... 5 4.5 2.87 4.5 2.5
. 14 73.0 3.4__ 6 4.0 3.6.... 5 1.0 4.5
19 7 R 9 O
6 5.0 2.6
...... 3.3
6.6tt n
16.6
ft 9
11.07.3
16.222.336.315.75.9
15.4
2.19 O9 7
1.53.41.54.05.99.24.11.4
3.9
3.64.07.0
3.15.43.27.19.7
15.2e.r2.r6.8
Postbatholith volcanic rocks:Lowland Creek Volcanics (early Eocene) ___ . Post-Lowland Creek volcanic rocks (Miocene or Pliocene) -
2.9 3.5
9.0 21.9
2.5 6.1
4.4 9.8
Southern California batholith »
Gabbro ........ ___ . _____________ . ..Tonalite _ . ___________________Granodiorite ______________Quartz monzonite and granite ...... ___________ ... ..
Average (weighted according to areal abundance of rock types) _______ .
..... 7 7 0.319 A9 1 9
24 28 2.92 n O Q
1 7
0.64.18 1
19.1
5.5
0.31.52 15.2
1.7
0.42.33.98.P
2.7
Sierra Nevada batholith region *
Prebatholith rocks:Metavolcanic rocks __ .Clastic, sedimentary rocks _____________
Sierra Nevada batholith:Cretaceous plutons ___________ .Jurassic or Cretaceous (granodiorite of Dinkey Creek)Triassicor Jurassic rocks of eastern Sierra Nevada
278
0.142.40
2.771.883.78
0.9814.5
21.311.018.6
0.453.31
7.173.564.29
0.6 6.0
10.3 5.3 8.1
Baltholiths, Western United States 3 (Southern California, Sierra Nevada, and Idaho)
Gabbro and diorite. _ . ___________ .Tonalite . _______________ .Granodiorite ___________ .Quartz monzonite, granite.. . .....
. .. ....... 173ft
............. 12
12.633.710 134.6
0.51 fi
Q ft
3.6
0.85.5
12.118.5
0.51.72.54.0
0.72.75.07.6
Average (weighted according to areal abundance of rock types). 2.4 11.6 2.5 4.7
See footnotes at end of table.

E18 SHORTER CONTRIBUTIONS TO GENERAL GEOLOGY
TABLE 6. Radiogenic heat production in igneous rocks of the Boulder batholith and in some other crystalline materials Continued
Map unit or rock type Number of samples
Estimatedarea!
abundance(percent of
exposedbatholith)
Average values
Potassium (percent)
Thorium (ppm)
Uranium (ppm)
Total heat G«ca]/gyr)
Snowy Mountains, Australia *
. _________ 4 .. ......... ___ . ___ .. _____ 8 ... .......
20
3.48.... 3.87
2.63
19.917.217.0
4.08.03.8
7 910.26.0
Cape Granites, Sontb Africa«
.. - .-..__--.. .-._.. 17 ..........
......... ................. 0 ..-.. .-
.. __ ... _ . ___ ..... __ 8 ..... .....
4.154.364.17
21.626.023.5
6.512.011.6
10.217.413.9
Canadian Precambrian shield *
Composite samples (330 rocks). 2.68 10.3 2.45 4.6
Continental crust'
2.6 10.0 2.8 4.7
Some crustal and meteoritic materials*
Chondrites.__. Achondrites
High calcium..Low calcium...
Granitic rocks... Basalts. __. Eclogites
Low uranium..High uranium.
50/21/8
5/3/5 1
755 24
2/7/6 10/12/12
0.0845
.0430
.00093.79.84
.0360.2600
.51
.0059 «18.5
2.7
.18 .45
a 012.081.0021
4.75.6
.048 .25
0.04
.17
.0038.21.2
.08
.34
i Average potassium, thorium, and uranium values calculated from data ot Larsen, Jr. (1948), Larsen, 3d, and Gottfried (I960), and Larsen, Jr., and GoWried (1961). s Data of Wollenberg and Smith (1968a, b).s Average thorium and uranium values from Larsen, 3d, and Gottfried (1960) as combined in Phair and Gottfried (1964); average K values estimated from data of
Larsen, Jr., and Schmidt (1068), Bateman (1065), and of this report.« Average K, Th, and TJ values taken from Kolbe and Taylor (1966a).* Average K, Th, and U values taken from Kolbe and Taylor (1966b). Average K, Th, and U values taken from Shaw (1967). i Average K, Th, and U values taken from Heier and Rogers (1963).s Data from literature as tabulated in Wasserburg and others (1964, table 1). Numbers of samples separated by slashes indicates the number of K, Th, and U analyses,
respectively.» Calculated from average Th/K ratio of 166 granitic rocks.
calcalkalic Boulder batholith; the average values for total heat production of these masses, weighted accord ing to areal abundance of the constituent rocks, are 2.7 and 6.8 M^al/g yr, respectively. The Butte Quartz Monzonite and its silicic facies, which compose ap proximately 80 percent of the Boulder batholith, have a heat production capacity less than that of the Mount Givens Granodiorite but greater than that of the granodiorite at Dinkey Creek of the Sierra Nevada batholith. Table 6 also reveals that the weighted heat production of the Boulder batholith is less than heat- production values of the Snowy Mountains (Australia) and of the Cape Granites (South Africa) but greater than heat production of the Canadian Precambrian shield. It is noteworthy that the average radioelement content (hence, heat production also) of the Canadian Precambrian shield (Shaw, 1967) is virtually identical with that of the "continental crust" of Heier and Rogers (1963). Of the values for radiogenic heat production calculated from average radioelement con tent of crustal and meteoritic materials tabulated by
Wasserburg, MacDonald, Hoyle, and Fowler (1964), the value for "granitic rocks" (8.2 jxcal/g yr) approxi mates that for the Butte Quartz Monzonite (7.1 Mcal/g yr) and its silicic facies (9.7 ycal/g yr).
Data by D. D. Blackwell and E. C. Robertson (written commun., 1968) indicate that the heat flow measured in a drill hole in the Butte Quartz 1 lonzonite of the Boulder batholith is 2.2 ^cal/cm2 sec (micro- calories per square centimeter per second) and the heat flow calculated from measurements in the under ground workings at Butte is 2.1 /teal/cm2 sec (see tables 13 and 14 and p. E12). These values are higher than the mean heat flow of the earth, 1.5 ±10 percent /xcal/cm2 sec (Lee and Uyeda, 1965), but are compatible with the mean value of 2.3 Meal/cm2 sec for six heat- flow measurements from the western inter or of the United States (see Von Herzen, 1967, table 1) and with a preliminary value of 2.25 jucal/cm2 sec near Wallace, Idaho (Lachenbruch and others, 1967). Heat flow in the Rocky Mountains and western Great Basin generally exceeds 1.6 pcal/cm2 sec (Roy and

THORIUM, URANIUM, POTASSIUM, HEAT PRODUCTION, BOULDER BATHOLITH, MONT. EI9
Blackwell, 1966; Decker, 1966; Lachenbruch and others, 1967).
Calculations using mean specific gravity of 2.70 and heat-production values computed from the average radioelement content (table 14) show that the heat flow of 2.2 /teal/cm2 sec measured in the drill hole can be attributed entirely to radiogenic heat produced by a column of surface rock approximately 25 kilometers thick, if it is assumed that the radioelement distribution in the rock does not vary with depth. As previously noted (p. El2), the radioelement content of the drill hole samples is atypical, roughly 50 percent higher than that typically observed for the Butte Quartz Monzonite. Computations based on heat-production values cal culated from the mean radioelement content of the whole Butte Quartz Monzonite * indicate that a slab of rock about 35 kilometers thick could produce the ob served heat flow. Limited seismic data (Meyer and others, 1961; McCamy and Meyer, 1964) show that the crust in the Boulder batholith region is about 45 kilo meters, which is about 10 kilometers thicker than the maximum thickness of the rock column (35 km) that would provide the necessary radiogenic heat to match the observed heat flow. These calculations suggest that radiogenic heat not only can account entirely for the heat flow observed but also would exceed the heat flow, if the radioelements were uniformly distributed through out the entire 45-kilometer thickness of the crust.
Observed heat flow in the Boulder batholith is thus lower than that expected from the radiogenic heat production of the surface rocks, if uniform distribution of radioelement in the crust is assumed. This situation is analogous to that observed for the Sierra Nevada batholith (Lachenbruch and others, 1966; Bateman and Eaton, 1967). Lachenbruch, Wollenberg, Greene, and Smith (1966) have attempted to reconcile the dif ference between heat flow and radiogenic heat by pro posing that the radioactive elements were concentrated in the upper part of the crust and subsequently removed by erosion. Whether or not a similar mechanism was operative in the Boulder batholith cannot be fully evaluated with presently available geologic and analytic data. However, erosion on the order of 7-10 kilometers of batholith since the Late Cretaceous, as suggested for the Sierra Nevada batholith (Bateman and Eaton, 1967), probably did not occur in the Boulder batholith region, for geologic evidence indicates that the present erosion surface is probably nowhere more than 2-3 kilometers from the roof of the batholith (see, for exam ple, Ruppel, 1963). Nonetheless, the possibility that the radioelement content of the crust in the Boulder
> Table 4 shows that the distribution of thorium and uranium in unaltered Butte Quartz Monzonite is comparable with that in altered rocks of the uaderground work ings at Butte where the 2.1 /teal/cm9 sec heat-flow measurement was made.
batholith region decreases with depth must be seriousl^ considered as a possible explanation for apparent dis crepancy between heat flow and heat production.
Data presented in this report suggest that, at leaf t down to a depth of little more than a kilometer, ther^ is no decrease (or increase) in radioelement content. However, seismic data (McCamy and Meyer, 1964) suggest that material in the lower half of the approxi mately 45 kilometer-thick crust is characterized by higher seismic velocity, 7.4-7.6 km/sec (kilometers per second) as opposed to 6.0 km/sec for material in tl ^ upper half. On the basis of gravity data, Biehler ard Bonini (1966) and Burfeind (1967) suggested that tH Boulder batholith probably does not extend to deptl <> greater than 10-15 kilometers. Thus, geophysical data enhance the possibility that the lower part of ll^ crust is composed of denser (more mafic) material that is lower in heat-producing radioelements. Until detailed information on the subsurface configuraticn of the batholith and on the structure of the crust becomes available, it is not possible at present to determine the contribution, if any, of heat from lowrcr crustal and (or) upper mantle sources to the overs 11 thermal budget of the crust in the Boulder batholith region. The limited geophysical data available, none theless, are compatible with the interpretation that the abundance of radioelement may decrease with depth in the crust.
In summary, the available data indicate that in tl ^ Boulder and Sierra Nevada batholiths radiogenic her.t production is probably ample to match observed heat flow. The data also suggest the existence of lateral regional ("provincial") variations in the distribution of radioelements, and hence of radiogenic heat production, in selected areas of the crust. Clearly, much more data are required on heat flow, especially in regions where crustal thickness and radioelement distribution are known, and on regional variation in thorium, uranium, and potassium distribution patterns before the inte~- play of conductive, convective, and radiative heat processes in the earth's thermal regime can be properly evaluated. In addition, data must be gathered en possible vertical variation in radioelement content in crustal and ultimately in mantle materials collected by deep drilling. The demonstration of such vertical variation surely would resolve many of the difficulties in presently proposed theories and models of the heat budget of the earth.
REFERENCES
Adams, J. A. S., Osmond, J. K, and Robers, J. J. W., 1959, Tl ?. geochemistry of thorium and uranium, Chapter 6, of Volume 3 in Ahrens, L. H., and others, eds., Physics and chemistry of the earth: London, Pergamon Press, p. 298-348.
E20 SHORTER CONTRIBUTIONS TO GENERAL GEOLOGY
Anderson, C. A., 1941, Volcanoes of the Medicine Lake highland, California: California Univ. Dept. Geol. Sci. Bull., v. 25, no. 7, p. 347-422.
Bateman, P. C., 1965, Geology and tungsten mineralization of the Bishop district, California: U.S. Geol. Survey Prof. Paper 470, 208 p.
Bateman, P. C., and Eaton, J. P., 1967, Sierra Nevada batholith: Science, v. 158, p. 1407-1417.
Becraft, G. E., 1956, Uranium deposits in the northern part of the Boulder batholith: Econ. Geology, v. 81, p. 362-374.
Biehler, Shawn, and Bonini, W. E., 1966, A geophysical interpre tation of the Boulder batholith, Montana [abs.]: Am. Geophys. Union Trans., v. 47, p. 192.
Bieler, B. H., and Wright, H. D., 1960, Primary mineralization of uranium-bearing "siliceous reef" veins in the Boulder batholith, Montana Part II, The veins: Econ. Geology, v. 55, p. 363-382.
Birch, Francis, 1954, Heat from radioactivity, Chapter 5 of Faul, Henry, ed., Nuclear geology: New York, John Wiley & Sons, Inc., p. 148-174.
1965, Speculations on the earth's thermal history: Geol. Soc. America Bull., v. 76, p. 133-154.
Brown, Harrison, and Silver, L. T., 1956, The possibilities of obtaining long-range supplies of uranium, thorium, and other substances from igneous rocks, in Page, L. R., Stocking, H. E., and Smith, H. D., compilers, Contributions to the geology of uranium and thorium by the United States Geological Survey and Atomic Energy Commission for the United Nations International Conference on Peaceful Uses of Atomic Energy, Geneva, Switzerland, 1955: U.S. Geol. Survey Prof. Paper 300, p. 91-95.
Burfeind, W. J., 1967, Gravity investigation of the Tobacco Root Mountains, Jefferson Basin, Boulder batholith, and adjacent areas of southwestern Montana: Indiana Univ. Ph. D. dissert., 146 p.
Decker, E. R., 1966, Crustal heat flow in Colorado and New Mexico [abs.]: Am. Geophys. Union Trans., v. 47, p. 180-181.
Doe, B. R., 1967, The bearing of lead isotope on the source of granitic magma: Jour. Petrology, v. 7, p. 1-33.
Doe, B. R., Tatsumoto, Mitsunobu, Delevaux, M. H., and Peter- man, Z. E., 1967, Isotope-dilution determination of five elements in G-2 (granite), with a discussion of the analysis of lead, in Geological Survey research 1967: U.S. Geol. Survey Prof. Paper 575-B, p. B170-B177.
Doe, B. R., Tilling, R. I., Hedge, C. R., and Klepper, M. R., 1968, Lead and strontium isotope studies of the Boulder batholith, southwestern Montana: Econ. Geology, v. 63, p. 884-906.
Gottfried, David, Moore, 'Roosevelt, and Caemmerer, Alice, 1962, Thorium and uranium in some alkalic igneous rocks from Virginia and Texas, in Short papers in geology, hydrology, and topography: U.S. Geol. Survey Prof. Paper 450-B, p. B70-B72.
Gottfried, David, Moore, Roosevelt, and Campbell, Esma, 1963, Thorium and uranium in some volcanic rocks from the circum-Pacific province, in Short papers in geology, hydrol ogy, and topography: U.S. Geol. Survey Prof. Paper 450-E, p. E85-E89.
Gottfried, David, Greenland, L. Paul, and Campbell, E. Y., 1968, Variation of Nb-Ta, Zr-Hf, Th-U, and K-Cs in two diabase-granophyre suites: Geochim. et Cosmochim. Acta, v. 32, p. 925-948.
Grimaldi, F. S., May, Irving, and Fletcher, M. H., 1952, U.S. Geological Survey fluorimetric methods of uranium analysis: U.S. Geol. Survey Circ. 199, 20 p.
Hamilton, E. I., 1966, The uranium content of soir^ interna tional standards: Earth and Planetary Sci. Letters, v. 1, p. 317-318.
Heier, K. S., and Carter, J. L., 1964, Uranium, thcrium, and potassium contents in basic rocks and their bear'ng on the nature of the upper mantle, in Adams, J. A. S., ard Lowder, W. M., eds., The natural radiation environment: Chicago, Univ. Chicago Press, p. 63-85.
Heier, K. S., and Rogers, J. J. W., 1963, Radiometrfc determi nation of thorium, uranium, and potassium in basalts and in two magmatic differentiation series: Geochim. et Cosmo chim. Acta, v. 27, p. 137-154.
Hurley, P. M., 1950, Distribution of radioactivity in granites and possible relation to helium age measurements: Geol. Soc. America Bull., v. 61, p. 1-8.
Klepper, M. R., Weeks, R. A., and Ruppel, E. T., 1957, Geology of the southern Elkhorn Mountains, Jefferson end Broad- water Counties, Montana: U.S. Geol. Survey F-of. Paper 292, 82 p.
Knopf, Adolph, 1913, Ore deposits of the Helena mining region, Montana: U.S. Geol. Survey Bull. 527, 143 p.
1957, The Boulder bathylith of Montana: Am. Jour. Sci., v. 255, p. 81-103.
-1963, Geology of the northern part of the BouMer bathylith and adjacent area, Lewis and Clark and Jefferson Counties, Montana: U.S. Geol. Survey Misc. Geol. Inv. Map 1-381, scale 1:48,000.
Eolbe, Peter, and Taylor, S. R., 1966a, Geochemical investiga tion of the granitic rocks of the Snowy Mountains area, New South Wales: Geol. Soc. Australia Jour., v. 13, p. 1-25.
1966b, Major and trace element relationships in granodi-orites and granites from Australia and South Afrw. Contr. Mineralogy and Petrology, v. 12, p. 202-222.
Lachenbruch, A. H., Wollenberg, H. A., Greene, G. W., and Smith, A. R., 1966, Heat flow and heat production in the central Sierra Nevada, preliminary results [abs.]: Am. Geophys. Union Trans., v. 47, p. 179.
Lachenbruch, A. H., Marshall, B. V., and Sass, J. H., 1967, Geothermal studies in the western United States and the Arctic, MI United States Program for the Irternational Mantle Project, Progress Report 1967: WashinHon, D.C., Natl. Acad. Sci.-Natl. Research Council, p. 63-P4.
Larsen, E. S., Jr., 1948, Batholith and associated rocks of Corona, Elsinore, and San Luis Rey quadrangle*, southern California: Geol. Soc. America Mem. 29, 182 p.
Larsen, E. S., Jr., and Gottfried, David, 1961, Distribution of uranium in rocks and minerals of Mesozoic batholiths in Western United States: U.S. Geol. Survey Bull. 1070-C, p. 63-102.
Larsen, E. S., Jr., and Schmidt, R. G., 1958, A reconnaissance of the Idaho batholith and comparison with tl ? southern California batholith: U.S. Geol. Survey Bull. 1070-A, 33 p.
Larsen, E. S., 3d, 1957, Distribution of uranium in igneous complexes: U.S. Geol. Survey TEI-700, p. 249-253, issued by U.S. Atomic Energy Comm. Tech. Inf. Service, Oak Ridge, Tenn.
Larsen, E. S., 3d, and Gottfried, David, 1960, Uranium and thorium in selected suites of igneous rocks: Anr, Jour. Sci. (Bradley volume), v. 258-A, p. 151-169.

THORIUM, URANIUM, POTASSIUM, HEAT PRODUCTION, BOULDER BATHOLITH, MONT.E2'
Lee, W. H. K., and Uyeda, S., 1965, Review of heat-flow data, in Lee, W. H. K., ed., Terrestrial heat flow: Am. Geophys. Union Geophys. Mon. Ser. no. 8, Natl. Acad. Sci.-Natl. Research Council Pub. 1288, p. 87-190.
Levine, Harry, and Grimaldi, P. S., 1958, Determination of thorium in the parts per million range in rocks: Geochim. et Cosmochim. Acta, v. 14, p. 93-97.
Lonsdale, J. T., and Maxwell, R. A., 1949, Petrology of Big Bend National Park, Texas [abs.]: Geol. Soc. America Bull., v. 60, no. 12, pt. 2, p. 1906.
Lyons, J. B., 1944, Igneous rocks of the northern Big Belt Range, Montana: Geol. Soc. America Bull., v. 55, no. 4, p. 445-472.
1964, Distribution of thorium and uranium in three early Paleozoic plutonic series of New Hampshire: U.S. Geol. Survey Bull. 1144-P, 43 p.
McCamy, Keith, and Meyer, R. P., 1964, A correlation* method of apparent velocity measurement: Jour. Geophys. Re search, v. 69, p. 691-700.
MacDonald, G. J. F., 1964, Dependence of the surface heat flow on the radioactivity of the earth: Jour. Geophys. Research, v. 69, p. 2933-2946.
Mathews, W. H., 1957, Petrology of Quaternary volcanics of the Mount Garibaldi map-area, southwestern British Columbia: Am. Jour. Sci., v. 255, p. 400-415.
May, Irving, and Jenkins, L. B., 1965, Use of arsenazo III in determination of thorium in rocks and minerals, in Geo logical Survey research 1965: U.S. Geol. Survey Prof. Paper 525-D, p. D192-D195.
Meyer, R. P., Steinhart, J. S., and Bonini, W. E., 1961, Montana, 1959, Chapter 9 in Explosion studies of continental struc ture: Carnegie Inst. Washington Pub. 622, p. 305-343.
Moore, J. G., 1959, The quartz diorite boundary line in the Western United States: Jour. Geology, v. 67, p. 198-210.
Morgan, J. W., and Heier, K. S., 1966, Uranium, thorium, and potassium in six U.S.G.S. standard rocks: Earth and Planetary Sci. Letters, v. 1, p. 158-160.
Neuerburg, G. J., Antweiler, J. C., and Bieler, B. H., 1956, Uranium content and teachability of some igneous rocks of the United States: U.S. Geol. Survey Prof. Paper 300, p. 55-64.
Peacock, M. A., 1931, Classification of igneous rock series: Jour. Geology, v. 39, p. 54-67.
Peterman, Z. E., Doe, B. R., and Bartel, Ardith, 1967, Data on the rock GSP-1 (granodiorite) and the isotope-dilution method of analysis for Rb and Sr, in Geological Survey research 1967: U.S. Geol. Survey Prof. Paper 575-B, p. B181-B186.
Phair, George, and Gottfried, David, 1964, The Colorado Front Range, Colorado, U.S.A., as a uranium and thorium province, in Adams, J. A. S., and Lowder, W. M., eds., The naturel radiation environment, Chicago, Univ. Chicago Press, p. 7-38.
Powers, H. A., 1932, The lavas of the Modoc Lava Bed quad rangle, California: Am. Mineralogist, v. 17, p. 253-294.
Prostka, H. J., 1966, Igneous geology of the Dry Mountain quadrangle, Jefferson County, Montana: U.S. Geol. Survey Bull. 1221-F, 21 p.
Ragland, P. C., Billings, G. K., and Adams, J. A. S., 1967, Chemical fractionation and its relationship to the dis tribution of thorium and uranium in a zoned granite batho- lith: Geochim. et Cosmochim. Acta, v. 21, p. 17-34.
Robinson, G. D., 1963, Geology of the Three Forks quad rangle, Montana: U.S. Geol. Survey Prof. Paper 37C, 143 p.
Robinson, G. D., Klepper, M. R., and Obradovich, Johr- 1968, Overlapping plutonism, volcanism, and tectonism in the Boulder batholith region, western Montana, in Coats, R. R., Hay, R. L., and Anderson, C. A., eds, Studies in volcanology, Howel Williams Volume: Geol. Soc. America Mem. 116, p. 557-576.
Robinson, G. D., and Marvin, R. P., 1967, Upper Cretaceon volcanic glass from western Montana: Geol. Soc. America Bull., v. 78, p. 601-608.
Roy, R. P., and Blackwell, D. D., 1966, Heat flow in the Sierra Nevada and western Great Basin [abs.]: Am. Geophy Union Trans., v. 47, p. 179-180.
Ruppel, E. T., 1961, Reconnaissance geologic map of th^ Deer Lodge quadrangle, Powell, Deer Lodge, and Jefferson Counties, Montana: U.S. Geol. Survey Mineral Inv. Field Studies Map MF-174, scale 1:48,000.
1963, Geology of the Basin quadrangle, Jefferson, Lewisand Clark, and Powell Counties, Montana: U.S. Ged.Survey Bull. 1151, 121 p.
Schmidt, R. G., 1957, Petrology of the volcanic rocks [of Saipan,Mariana Islands]: U.S. Geol. Survey Prof. Paper 280-P,p. 127-175.
Shapiro, Leonard, and Brannock, W. W., 1962, Rapid analysisof silicate, carbonate, and phosphate rocks: U.S. Gee1 .Survey Bull. 1144-A, 56 p.
Shavrova, N. N., 1958, The content of radium and thoriumin lavas of the Klyuchevshii Group: Akad. Nauk SSSRLab Vulkanologii Byull. Vukanol. Sta., no. 27, p. 51-f 4(in Russian).
1961, The content of radium and thorium in the lav^sof the Bezymyanny volcano: Akad. Nauk SSSR Lab.Vulkanologii Byull. Vulkanol. Sta., no. 31, p. 31-38 (inRussian).
Shaw, D. M., 1967, U, Th and K in the Canadian Precambrtenshield and possible mantle compositions: Geochim. etCosmochim. Acta, v. 31, p. 1111-1113.
Smedes, H. W., 1962, Lowland Creek Volcanics, an upp^rOligocene formation near Butte, Montana: Jour. Geology,
v. 70, p. 255-266. 1966a, Geology and igneous petrology of the northern
Elkhorn Mountains, Jefferson, and Broadwater Countie«, Montana: U.S. Geol. Survey Prof. Paper 510, 116 p.
-1966b, Preliminary geologic map of the Butte Southquadrangle, Montana: U.S. Geol. Survey open-file map.
Smedes, H. W., and Thomas, H. H., 1965, Reassignment of theLowland Creek Volcanics to Eocene age: Jour. Geology,v. 73, p. 508-509.
Stark, J. T., 1963, Petrology of volcanic rocks of Guam: U.S.Geol. Survey Prof. Paper 403-C, p. 1-32.
Thayer, T. P., 1957, Some relations of later Tertiary volcanologyand structures in eastern Oregon: Internat. Geol. Congrefs,20th, Mexico City, 1956, Vulcanologia del Cenozoico, Tomo1, sec.l, p. 231-245.
Tilling, R. I., 1964, Variation in modes and norms of a "honrvgeneous" pluton of the Boulder batholith, Montana, inGeological Survey research 1964: U.S. Geol. SunmyProf. Paper 501-D, p. D8-D13 [1965].

E22 SHORTER CONTRIBUTIONS TO GENERAL GEOLOGY
Tilling, R. I., Klepper, M. R., and Obradovich, J. D., 1968, K-Ar ages and time span of emplacement of the Boulder batholith, Montana: Am. Jour. Sci., v. 266, p. 671-689.
Tilton, G. R., Patterson, Claire, Brown, Harrison, Inghram, Mark, Hayden, Richard, Hess, David, and Larsen, E. S., Jr., 1955, Isotopic composition and distribution of lead, uranium, and thorium in a Precambrian granite [Ontario]: Geol. Soc. America Bull., v. 66, p. 1131-1148.
Von Herzen, R. P., 1967, Surface heat flow and some implications for the mantle, in Gaskell, T. F., ed., The earth's mantle: London and New York, Academic Press, p. 197-230.
Verhoogen, John, 1956, Temperatures within the earth, chapter 2 of volume 1 in Ahrens, L. H., Rankama, K., and Runcorn, S. K., eds., Physics and Chemistry of the earth, London, Pergamon Press, p. 17-43.
Wasserburg, G. J., MacDonald, G. J. F., Hoyle, Fred, and Fowler, W. A., 1964, Relative contributions of uranium, thorium, and potassium to heat production in the earth: Science, v. 143, p. 465-467.
Whitfield, J. M., Rogers, J. J. W., and Adams, J. A. S., 1959, The relationship between the petrology and th^ thorium and uranium contents of some granitic rocks: G^ochim. et Cosmochim. Acta, v. 17, p. 248-271.
Williams, Howel, 1932, Geology of the Lassen Volcani*? National Park, California: California Univ. Dept. Geol. Sci. Bull., v. 21, no. 8, p. 195-385.
Wollenberg, H. A., and Smith, A. R., 1964, Radioactivity and radiogenic heat in Sierra Nevada plutons: Jour. Geophys. Research, v. 69, p. 3471-3478.
1968a, Radiogeologic studies in the central part of the Sierra Nevada batholith, California: Jour. Geophys. Re search, v. 73, p. 1481-1495.
1968b, Radiogenic heat production in pre-batholithicrocks of the central Sierra Nevada [abs.]: Am. Geophys. Union Trans., v. 49, no. 1, p. 332-333.
Wright, H. D., and Bieler, B. H., 1960, Primary mineralization of uranium-bearing "siliceous reef" veins in the Boulder batholith, Montana Part I, The host rocks: Econ. Geology, v. 55, p. 56-72.

TABLES 7-15

E24 SHORTER CONTRIBUTIONS TO GENERAL GEOLOGY
TABLE 7. Distribution of thorium, uranium, and potassium in prebatholith volcanic rocks of the Boulder batholith region[Thorium and uranium analyses by Esma Campbell, Roosevelt Moore, and Alice Caemmerer (using methods cited in text), unless otherwise noted. Analysis for major elements
using rapid methods described by Shapiro and Brannock (1962): Elkhorn Mountains samples, by F. 8. Borris, J. M. Dowd, P. L. D. Elmore, H. F. PhiTfps, and K. E. White; Three Forks samples, by P. L. D. Elmore, 8. D. Botts, and M. D. Mack; Wolf Creek and Maudlow samples, by P. L. D. Elmore, 8. D. Botts, Iva^ Barlow, and
Gillison Chloe]
SamplePotassium (percent)
Thorium (ppm)
Uranium (ppm) 'FT* /IT
Weight percent
SiCh KsO NazO
CaO
CaO KjO+NatO
Elkhorn Mountains volcanic field >
52C-76a............
52C-84a. _-...._...
52C-93.. ......... .
52C-95.. ...... .
52C-97.. ....... ...
52C-98.. ..........
52C-99- .......
52C-«8c.. .........
52C-108.- - ....
52C-111-. .........
Average .......
16.................
16a... ..............192................
196................140................
12.................334................339................
Average __ .
5.0
1.8
1.7
3.2
2.6
3.6
2.6
1.7
2.0
2.0
2.6
2.6
1.1
2.8 2.3
2.5 2.6 2.6
2.4
3.8
18
2.5
8.9
8.8
4.9
5.4
8.9
8.8
8.8
6.6
114 (14.9, 13.8)
»16.7 2.7
(2.6, 2.8) 3.1 5.8
(5.5, 6.1) 9.3 3.8 3.1
(3.0, 3.2)
6.0
(2.5,
(1.0,
(0.74,
(3.0,
(2.3,
(1.8,
(1.8,
(2.3,
(3.1,
(2.5,
2.5 2.5) 1.0 1.0)
0.71 0.68) 2.9 2.7) 2.3 2.3) 1.8 1.9) 1.8 1.7) 2.3 2.3) 3.0 2.8) 2.6 2.6)
2.1
7.1 (7.0, 7.2)
*4.59 .9
(1.0, 0.8) 1.6 1.8
6.0 2.4 .8
(1.2, 0.5)
2.9
1.5
4.8
3.5
3.1
3.8
2.6
3.0
3.9
2.9
3.4
3.2
2.0
3.63.0
1.9 3.2
1.6 1.6 3.9
2.4
54.5
51.6
49.8
616
62.5
58.6
57.7
62.5
57.2
62.8
68.2
63.6
59.4
62.1 68.5
57.9 70.2 71.4
63.3
6.0
2.2
2.0
5.7
5.2
5.0
3.2
2.0
2.4
2.4
3.6
Three Forks*
3.1
1.3
3.4 2.8
3.0 3.2 3.1
2.8
3.4
2.4
2.2
3.8
3.2
13
2.5
2.0
1.7
2.2
2.8
ireaJ
3.9
3.9
3.5 3.3
3.7 4.2 4.0
3.8
6.0
8.7
9.5
1.5
2.4
2.3
6.4
5.8
8.0
4.0
5.5
3.0
6.2
12 6.1
5.2 1.7 1.6
4.0
0.49
1.89
2.26
.16
.29
.25
1.12
1.45
1.95
.87
1.07
0.43
1.19
.61too.78 .23 .23
.64
Andesite flow.
"Qabbro", intrusive equivalent of Elkhorn Mountains Volcanics.
Basalt flow.
Trachyte flow.
Do.
Do.
Andesite flow.
Dacite welded toff.
Andesite flow.
Do.
Rhyodacite perlite (70 percent glars).
Glass fraction from sample 16. Andesite flow.
Do. Do.
Latite. « \Dacite laccolith correlative with latite (sample / 12).«
Wolf Creek area «
WC-59-20.. .......
WC-60-23.........
WC-60-37... ......
WC-59-14.........
Average ___
6.0
10
.7
3.4
3.5
12.0
6.8 (6.3, 7.3)
16.9 (17.1, 16.7)
30.9
16.6
4.0
2.0
3.3
5.6
3.7
3.0
3.4
5.1
5.5
4.2
59.0
57.3
65.8
76.1
64.6
7.2
4.8
.80
4.1
4.2
3.9
3.4
3.0
11
3.6
3.0
18
16
.31
3.2
0.27
.59
1.21
.04
.53
Latite flow; upper part of Two Medicine Forma tion.
Dacite flow; lower part of Two Medicine Forma tion.
Quartz latite, ashflow unit; lower part of Two Medicine Formation.
Rhyolite dike or sill; assumed to be Elkhorn Mountains Volcanics equivalent.
Maudlow area
35-59.............. 0.5 17.5(2.6,
2.8 3.0)
6.2 616 0.68 1.2 5.6 3.11 Glassy welded tuff, described by Robinson and Marvin (1967).
i Geologic information regarding samples from R. W. Chapman (written commun., 1956).* Geologic information regarding samples from Robinson (1963).* Isotope dilution determinations by Brace R. Doe, U.S. Geological Survey.4 Intrusive equivalents of the Elkhorn Mountains Volcanics.1 Geologic Information regarding samples from R. G. Schmidt (oral commun., 1968).

THORIUM, URANIUM, POTASSIUM, HEAT PRODUCTION, BOULDER BATHOLITH, MONT.
TABLE 8. Distribution of thorium, uranium, and potassium in rocks of the Boulder batholith
E25
[Rocks grouped according to map units (fig. 2) from oldest to youngest (except for satellitic plutons); letters in parentheses refer to map units. Thorium and uranium analy^s by Esma Campbell, Roosevelt Moore, and Alice Caemmerer (using methods cited in text), unless otherwise noted. Analysts for major elements, l-8,_using rapid methods described by Shapiro and Brannock (1962); 9,10, using standard methods: 1, F. S. Boms, J. M. Dowd, P. L. D. Elmore, H. F. Phillips, and K. E. White; 2, P. L. D. Elmore, S. D. Botts, Gillison Chloe, Lowell Artis, and Hezekiah Smith; 3, P. L. D. Elmore, S. D. Botts, and M. D. Mack; 4, P. L. D. Elmore, S. D. Botts, J. L. Glenn, Gillison Chloe, Lowell Artis, and Hezekiah Smith; 5, P. L. D. Elmore, I. H. Barlow, S. D. Botts, and Gillison Chloe; 6, P. L. D. Elmore and E. E. White; 7. P. L. D. Elmore, E. E. White, and S. D. Botts; 8, P. L. D. Elmore, S. D. Botts, Lowell Artis, Gillison Chloe, J. L. Glenn, Hezekiah Smith, and James Kelsey; 9, Elaine L. Munson; 10, J. J. Engel, in Enopf (1957)]
Sample No.
Potassium (percent)
Thorium (ppm)
Uranium (ppm) Th/U -
Weight percent
SiOj KjO NazO
CaO
CaO KiO+NajO
Analysts Remarks for majrnr
elements
Mafic rocks (m)
S1419.. ......
63E-350 ... ...
4S-C-1.- .....
4T-360- ... ...
Average.....
2.6
2.3
2.7
3.1
2.7
5.6 (5.5, 5.7)
5.9
10.7 (10.0, 11.4)
2.7 (2.7, 2.7)
6.2
1.7
2.3
1.6 (1.4, 1.7, 1.8)
0.4 (0.5, 0.4)
1.5
3.3
2.6
6.7
6.7
4.8
54.5
56.5
57.9
57.2
56.5
3.2
2.8
3.3
3.7
3.2
2.2
2.7
2.6
3.9
2.8
6.8
6.0
6.6
6.4
6.4
1.26
L09
1.12
.84
Syenogabbro (calcic melamonzonite of Smedes. 1966a, table 2, No. 9).
Syenogabbro (Ringing Rocks stock, Prostka, 1966).
Composite of eight samples (Smedes, 1966a, table 2, No. 8).
5
4
6
4
1.08
Granodiorite (ug, re, bp) 1
53C-140- ... .
4T-349- ... ...3T-500- ... ...
53C-191.- ... .
5T-60.. .........
Average (ug, bp)
53C-163-- ......
B8C-166 ......
53O-168- ....
2T-1057- ....
2T-1065 ......
2T-1080-.-. ..
2T-1093
Average (re)
3.3
2.7 3.4
2.5
2.0
2.8
2.1
2.6
2.2
2.3
22
2.6
3.6
2.5
16.9
9.3 10.8
(10.9, 10.6) 9.2
8.8 (9.3, 8.3)
11.0
5.4 (5.7, 5.0)
6.6 (6.1, 7.1)
6.6
7.4 (7.4, 7.7, 7.0, 7.4)
(8,1, 8.J
9.3 (8.9, 9.7)
8.0 (8.1, 7.9)
7.3
5.7 (5.9, 5.5)
1.7 2.4
3.3 (3.4, 3.2)
3.9
3.4
1.2 (1.3, 1.2)
1.2 (L4, 1.1)
1.6 (1.7, 1.6)
0.8 (0.8, 0.7
1.2 (LI, 1.3)
2.7
1.7 (1.8, 1.6)
1.5
3.0
5.5 4.5
2.8
2.2
3.6
4.5
5.5
4.1
9.2
6.8
3.4
4.7
*4,8
63.2
61.14 63.0
61.0
62.1
62.1
69.6
66.0
62.4
68.6
64.6
63.6
65.6
65.8
4.0
3.34 4.1
3.0
2.4
3.4
2.5
3.1
2.6
2.8
2.6
3.1
4.3
3.0
2.5
2.78 2.8
2.6
2.9
2.7
3.6
3.3
3.3
3.6
3.6
3.4
3.6
3.5
4.6
5.51 4.4
5.8
6.0
5.3
3.4
4.6
5.7
3.8
4.8
4.5
3.3
4.3
0.71 ) ( 1 1 Mafic granodiorite; samples from UnionviQe 1 .90 | Granodiorite. 1 10 .64 J I 4
1-04 1 Mafic granodiorite; samples from Burton Park J j 13 j pluton (Smedes, 1966b). 1 4
.88
.56
.72
.97
.59
.77
.69
.42
Felsic granodiorite; samples from Rader Creek pluton (Tilling, 1964).
1
1
1
2
2
2
2
.67
Bntte Quartz Moraonlte (bqm)
52C-10a ...
54C-248.- ... .
52C-52b ---.-
52C-60... . ...
52C-65- ... ...
53C-205. . ....
63C-209
52C-114.. ... .
63C-202... ...
56E-420 ... ...
56E-494 ......
6K-306.... ...
DDH-B-3 52C-13 ....
53C-149- ... -
63C-150-. ...
3T-273.. ...... ..
Average.....
3.5
1.8
3.5
3.2
3.3
3.3
3.4
3.5
3.3
3.6
3.7
3.4
3.4 3.2
3.3
3.3
3.1
3.4
13.0 (12.6,13.3)
7.9
19.0
18.8
15.2
16.2 (16.3,16.0)
16.2
17.9
15.6
14.6 (15.0,14.2)
15.4 (15.3,15.6)
11.8 (11.2,12.4)
24.9 15.5
16.9
15.6 (15.6,15.5)
18.0 (17.3,18.7)
»16.14
16.2
2.9 (3.0,2.8)
3.2 (3.3,3.1)
(7.2,7io) 5.1
(5.2,5.0) 2.4
(2.5,2.4) 5.1
(5.2,4.9) 3.8
(3.7,3.9) 1.6
(1.7,1.6) 5.2
(4.9,5.6,5.1)
(4.2,4,0) 3.2
(3.2,3.2) 3.3
(3. 1, 3. 5) 6.4 3.2
(3.3,3.2) 4.5
(3.9,5.0,4.6) 3.6
(3.3,3.8) 4,6
'4.32
4.0
4,5
2.5
2.7
3.7
6.3
3.2
4.3
11.2
3.0
3.6
4,8
3.6
3.8 4.8
3.8
4.3
3.9
3.7
«4.0
59.8
50.6
65.3
64.0
62.5
63.5
64.3
63.0
63.8
64.8
65.3
65.4
66.0 64.8
65.0
66.6
65.49
64.6
4.2
2.2
4.2
3.9
4.0
4.0
4.1
4.2
4.0
4.3
4.5
4.1
4.1 3.9
4.0
4.0
3.66
4.1
3.0
3.1
3.0
2.9
2.8
3.0
2.9
2.9
3.0
3.0
2.7
2.9
2.9 3.1
2.8
3.0
2.80
2.9
5.1
7.2
3.2
4.2
4.6
4.4
4.1
4.3
4.2
4.2
3.8
4.0
4.0 4.4
4.3
3.8
4.29
4.1
0.71
1.36
.44
.62
.68
.63
.59
.61
.60'
.58
.63
.57
.56
.63
.63
.54
.66
Strongly foliated xenolith-rich border fades; these two samples are not plotted in figures
and are excluded from averages.
Coarse-grained equigranular to slightly porphy- ritic varieties with E-feldspar megacrysts.
Coarse-grained strongly porphyritic varieties with E-feldspar megacrysts; 3T-273 is the "type" Clancy Granodiorite; DDH-B-3 is average of 19 samples from drill hole (table 14) .
1
1
1
1
1
1
1
1
7
7
7
1
1
1
10
.59
See footnotes at end of table.

E26 SHORTER CONTRIBUTIONS TO GENERAL GEOLOGY
TABLE 8. Distribution of thorium, uranium, and potassium in rocks of the Boulder batholith Continued
Sample No.
Potassium (percent)
Thorium (ppm)
Uranium (ppm) Th/U -
Weight percent
SiOz KzO NfeO CaO 1
CaO
fcO+NazORemarks
Analysts for major elements
Silicic fades of Butte Quartz Monzonlte (pr, h)
62C-113a
53C-203-
530-206.
2T-534... ..
62C-45. ......
IK-241
Average..
3.5
11
3.6
3.8
3.3
3.5
3.6
18.3 (18.2,18.1,
18.3,18.6) 23.0
19.0
38.6
119
20.1
22.3
12.1 (12.0,12.2)
13 (13,13)
3.4 (3.2,3.6)
18 (18,19)
2.6 (2.6,2.6)
8.3
6.9
1.5
5.3
6.6
7.9
5.7
2.4
17
68.0
67.3
70.9
72.3
68.4
71.5
69.7
12
19
14
16
10
12
14
3.1
2.9
3.4
3.0
3.4
2.9
3.1
3.2
2.9
2.3
2.4
3.2
2.9
2.8
0.70
.37
.31
.32,
.43
.41
.42
Shown as part of the Butte Quartz Monzonita , (bqm) hi figure 2.
Pulpit Rock pluton (pr) (fig. 2)
1
1
1
2
1
5
Alaskltes(a)
62C-8-.. . ....
52C-15 ...
54C-249.-
6K-445a ......
62KOO ... ... ..
Average. ..
6T-29a
15
18
12
3.9
19
15
14
26
34
40
42
39.6 (38.9,40.2)
36.3
17.6
14 (15,13)
19 (6.2,17,19)
7.5 (6.2,9.3)
20 (20,20)
9.0
9.2
2.6
6.9
6.9
5.3
2.1
14
19
6.8
79.2
76.7
76.2
78.0
78.4
77.1
73.2
5.4
5.8
5.0
17
5.9
6.4
5.3
3.0
2.2
3.0
3.2
2.3
2.7
3.1
0.36
.81
.80
.85
.93
.75
1.1
Leucocratic rocks (d, he,
53C-lMa- .......
W-21 ... .....
2T-275- ..63C-207-- ....
520-37.
53C-204- ....
IK-633
2T-797 ... ...
66TB-1. ........
60S-C-8. .....
1753
Average. .
2.4
2.8
3.0 3.2
2.8
2.8
3.0
2.6
3.0
3.2
2.8 3.4
2.9
12.7
12.8 (13.6, 12.1)
212 7.6
(7.5,7.8) 10.4
8.1
11.8
17.3 (16.7,17.9)
17.3
19.5 (18.6,20.4)
16.2 30.7
(30.5,30.9)
16.7
2.3 (2. 1, 2. 5)
2.1
3.7 2.4
(2.5,2.6) 1.6
(1.7,1.2) 2.0
(2.1,2.0) 6.2
(6.3,6.0) 5.0
(5.0,5.0) 8.8
(8.6,8.9)
12 (10,15)
3.2 8.0
11
5.6
6.1
6.5 3.2
6.5
10
1.9
3.5
2.0
16
5.1 3.8
14
70.4
70.4
70.1 71.1
71.2
70.8
68.0
67.4
70.8
65.18
612 70.0
69.1
2.9 3.9
3.4 10
3.6 3.6 3.9 3.8
3.4 12
3.4 12
3.6 3.2
3.2 3.7
3.6 3.8
3.75 3.09
3.4 3.3 11 3.1
3.5 3.6
2.3
2.6
2.9 2.1
2.4
2.4
3.2
3.7
2.2
4.14
15 2.9
2.9
0.04
.11
.10
.17
.11
.11
.13
c)
0.34
.35
.40
.27
.33
.33
.47
.54
.30
.60
.67
.40.
.42
Alaskite . . .
Alaskite.. ......................................
AlaskiteAlaskite.- __ . ....................
Alaskite. ..................... ...........
Granite porphyry (not shown in fig. 2) ; iis relationship to alaskite is not known, but it is grouped with alaskite because of chemicM similarity.
Rocks lithologically similar to those of tin Donald pluton (not shown hi fig. 2).
Hell Canyon pluton (he) (fig. 2) .......
Sample from Tobacco Root batholith (across tin Jefferson River valley from the Hell Canyon pluton) lithologically similar to samples IK- 633 and 2T-797.
Climax Gulch pluton (c) (fig. 2).. . .... .
1
1
1
7
2
8
1
2
2 1
1
1
2
3
[ I S
Satellitic plutona (s)
211 ..........
216
224 62C-116-- ...
M3-205.-. _ M6-208. ......
Average .....
2.3
2.3
10 3.6
'2.0 U.6
2.6
16 (13,18)
10 (11,3.9)
9.8 11.1
»2.6 '3.6
5.9
0.8
.7
1.7 2.3
(2.3,2.3) 1.6 LI
1.4
5.7
5.7
5.8 18
1.5 3.4
15
58.4
59.7
65.1 65.2
ND ND
62.1
2.8
2.8
18 12
2.4 1.9
3.2
3.2
3.4
11 3.2
ND ND
3.5
6.2
5.8
3.2 3.6
ND .ND .
17
1.03
.94
.36
.49
.70
Kgd (granodiorite undivided) of Knopf (1963)
IMarysville stock; data from Whitfield, Rogerf , I and Adams (1959).
1 33 1
' Age relations between the granodiorite units are not known because these rocks do not occur in contact with one another.2 Excluding the anomalously high value of 9.2 for sample 2T-1057.3 Isotope dilntion determination by Brace R. Doe, U.S. Geol. Survey.* Excluding the anomalously high valne of 11.2 for sample 52C-114. Thorium, uranium, and potassium determined by gamma-ray spectrometry; data from Whitfield, Rogers, and Adams (1959).

THORIUM, URANIUM, POTASSIUM, HEAT PRODUCTION, BOULDER BATHOLITH, MONT. E27
TABLE 9. Distribution of thorium, uranium, and potassium in mafic inclusions in some rocks of the Boulder batholith(Thorium and uranium analyses by Alice Caemmerer and Roosevelt Moore, using methods cited hi text. Major element analyses by F. 8. Borris, J. M. Dowd, P. L. D. Elmor %
H. F. Phillips, and K. E. White, using rapid methods described by Shapiro and Brannock (1962). Remarks from R. W. Chapman (written commun., 1956)]
Sample
53C-120b.- ...... .
53C-160a.-.. .....
53C-160b.. .
53C-176-. ...........
53C-177a...
83C-177b.. .......
Average .........
Potassium (percent)
4.6
3.6
1.9
.7
1.2
1.1
2.2
Thorium (ppm)
11.7
ia?7.9
2.7
6.1
1.9 (2.0,1.8)
6.7
Uranium (ppm) '.
4.2 (4.4,4.1)
5.9 (6.7,6.1)
3.2 (3.1,3.4)
(1.1,1:1)
CLT.L;
(0.8, a 9)
2.8
rh/u -
2.8
1.8
2.5
2.5
3.2
2.4
2.5
Weight percent
8102
58.8
66.8
66.9
46.0
64.6
61.8
64.0
K20 NajO
6.6
4.2
2.3
.84
1.6
1.3
2.6
2.7
3.6
3.7
1.6
2.9
3.3
3.0
CaO
CaO KaO+NajO
6.4
6.4
6.3
9.6
7.6
8.3
7.1
Remarks
0.651
. 69 Inost rock is Butte Quartz Mon- ( zonite.
1.06 J
3.941
1. 73 [Host rock is satellitlc pluton of "dioritic" composition.
1.81 J
1.64
TABLE 10. Distribution of thorium, uranium, and potassium in the postbatholith Lowland Creek Volcanics (early Eocene)[Thorium and uranium analyses by Roosevelt Moore, Esma Campbell, and Alice Caemmerer, using methods cited in text. Analysts for major elements, using rapid methods
described by Shapiro and Brannock (1962): 1, H. F. Phillips, K. E. White, F. S. Borris, P/L. D. Elmore; 2, P. L. D. Elmore, I. H. Barlow, S. D. Botts; 3, P. L. I). Elmore, S. D. Botts, Gillison Chloe, Lowell Artis, and Hezeklah Smith; 4, P. L. D. Elmore, S. D. Botts, and M. D. Mack; 6, H. F. Phillips, K. E. White, and J. 1*. Dowd]
Potassium Sample (percent)
78-110.........
78-111.........
78-112.........
SI-417 __ . _ .
68-362.........
52C-64 _ .....
52C-66.. ......
52C-86 L......
52C-72 __ ....
52C-104.......
719.. . ...
Average
1.9
4.4
3.6
2.1
3.2
2.2
2.8
2.0
2.9
3.7
ND
2.9
Thorium (ppm)
6.5 (6.1,6.9)
18.8 (19.2,18.3)
20.2 (20.0,20.6)
4.0 (4.6,3.3)
6.3 (7.0,6.6)
8.9
9.0
6.0
7.9
8.8
4.0 (3.7,4.3)
9.0
Uranium (ppm) '
2.9
1.6 (1.4,1.6)
4.0
.8
1.9
1.8 (1.9,1.8,1.8)
2.4 (2.6,2.4)
2.0
(il«(3.2,3.9)
2.6 (2.6,2.5)
4.5
2.5
Th/U -
2.2
12.5
5.1
6.0
3.3
6.0
3.8
2.5
2.2
3.4
.9
43
Weight percent
SiO 3
63.4
70.0
71.669.1
70.5
73.1
67.9
61.0
68.5
67.6
ND
68.3
K20 NasO
2.3
6.3
4.3
2.5
3.8
2.6
3.4
2.4
3.5
4.5
ND
3.5
4.2
2.8
3.8
4.3
3.6
3.4
2.9
3.3
2.8
2.4
ND
3.4
CaO
CaO K20+N820
4.2
1.7
1.5
2.9
2.2
2.4
2.3
4.8
2.6
2.6
ND
2.7
0.66
.21
.16
.43
.30
.40
.37
.84
.41
.38
ND
.42
Analysts- Remarks for major
elements
Quartz latite porphyry
Rhyolite vitrophyre, very near quartz latite..
Quartz latite lava
Quartz latite lava
Andesite dike cutting Kgd (granodiorite un divided) of KnopfTl963).
Rhyolite dike, cutting alteration halo in Butte Quartz Monzonite, 4,100-foot level, Steward mine, Butte district.
2
2
2
3
4
1
5
1
1
1
1 The assignment of this sample to the Lowland Creek Volcanics is arbitrary, based on compositional similarity.
TABLE 11. Distribution of thorium, uranium, and potassium in the postbatholith igneous rocks of probable early Tertiary age in theBoulder batholith region
[Thorium and uranium analyses by Esma Campbell and Roosevelt Moore, using methods cited in text. Analysts for major elements, using rapid methods described by Shapi'o and Brannock (1962): Three Forks sample, P. L. D. Elmore, S. D. Botts, and M. D. Mack; Wolf Creek samples, P. L. D. Elmore, S. D. Botts, I. H. Barlow, and Gillison Chloe]
Potassium Thorium Sample (percent) (ppm)
Uranium (ppm) '.
Weight percent CaO
SiOa KiO N82O CaO KjO+NajO
Wolf Creek area
WC-60-5..
WC-60-15.. .
2.6 2.1 (1.9,2.3)
2.2 4.1 (4.0,4.2)
0.4 (a 6, 0.4)
as(0.8,0.8)
6.3 50.8 3.1
5.1 52.8 2.7
as 7.0
4.8 5.1
1.10 Syenogabbro or trachybasalt which intrudes Two Medicine Formation (R. G. Schmic't., oral commun. 1968).
.68 Hornblende monzonite dike intruding Ac" el Mountain Volcanics of Lyons (1944) (R. G. Schmidt, oral commun, 1968).
Three Forks area
326.
Average ..
1.8 7.9 (7.9,7.9)
2. 2 4. 7
2.1
1.1
3.8 54.5 2.2
4. 7 52. 7 2. 7
3.0 6.5
3.7 6.2
1. 25 Basalt which intrudes Tertiary rocks (Robinson, 1963).
2.93

E28 SHORTER CONTRIBUTIONS TO GENERAL GEOLOGY
TABLE 12. Distribution of thorium, uranium, and potassium in post-Lowland Creek volcanic rocks (Miocene or Pliocene)[Thorium and uranium by Esma Campbell, Roosevelt Moore, and Alice Caemmerer, using methods cited in text. Analysts for major elements, using rapid met! ods described
by Shapiro and Brannock (1962): 1, F. S. Borris, J. M. Dowd, P. L. D. Elmore, H. F. Phillips, and K. E. White; 2, P. L. D. Elmore, S. D. Botts, Lowel" Artis, James Kelsey, Gillison Chloe, J. L. Glenn, and Hezekiah Smith]
Potassium Thorium TJranit Sample (percent) (ppm) (ppm
4T-505-. ...
52C-1... ..
52C-20b
52C-20C _ ......
52C-79a
52O80 .
52C-8U. ........
52C-83a... ...
52C-83b
53C-135 ...
Average .....
4.6 3.3 (17' 1'
0 O6.6
4.2 ^
3.3
4.230 (20>4> o. U
2.3
2.8
3.8 (30.7,
3.5
17.1if"34.2 <" *
34.4) (7.8, 42
(18.5, 10.4
(2.5, 18.8 17.1) 8.8
(2.4, 3.2
(2.3, 9.6
(2.2, 31.3 31.9)
21.9
im Weight percent CaO Ant
SiOa KjO NasO CaO KjO+NasO eleu
4.4 3.9 72.1 5.6 2.1 0.88 0.14 Rhyolite lava.
11.6 4.2 78.0 4.0 4.0 .34 .04 Por phyritic soda rhyoUte from small intrusiv' 11.8) plug. 8.5 4.0 75.6 4.0 2.4 .44 .07 Aphanitic rock near center of dike; quart'' 9.3) latite very near rhyolite (Smedes, 1966a>.
18.0 2.3 71.6 5.0 3.4 .05 .01 Rhyolite pitch stone near margin of dib* 17.6) (Smedes, 1966a). 2.6 4.0 67.6 4.0 3.4 2.4 .32 Quartz latite lava..... __ .................. ...2.6) 2.6 7.2 78.0 5.0 2.2 .45 .05 Rhyolite lava.. ........................
2.4 3.7 68.0 3.6 4.2 2.6 .33 Quartz latite lava... ...................2.3) 2.2 1.5 66.2 2.8 4.2 3.2 .46 Quartz latite lava, aphanitic and perlitic .... ..2.2) 2.1 4.6 71.6 3.4 3.6 2.4 .34 Quartz latite lava, vesicular...................2.0) 6.2 5.0 76.0 4.6 4.0 .30 .03 Soda rhyolite dike.. . .............. .......
6.-1 4.0 72.5 4.2 3.4 1.3 0.18
ilysts najor aents
2
1
1
1
1
1
1
1
1
1
TABLE 13. Distribution of thorium and uranium in the Butte Quartz Monzonite from under ground workings in the Butte district, Montana
[Samples collected by E. C. Robertson, U.S. Geol. Survey. Thorium and uranium analyses by Esma Campbell and Roosevelt Moore, using methods cited in text)
Sample
720 __ .....
733 __
725726 727-2.....
717.... 718. ..732.... 731.. 723... 722-2....
722-3... 729.... 800.
Mine Approximate Thorium Uranium Th/U depth (feet) (ppm) (ppm)
Steward...... __ ................. 3,400 13.2 4.9 2.7(13.0,13.4)
..-..do................... .......... 3,800 14.8 2.2 6.7(15.8,13.9)
.....do. __ .....-.... .... . 3,900 15.6 4.5 3.5
.....do..... 4,000 12.1 3.3 3.7
.....do.. . . 4,000 18.6 4.5 4.1(18.9,18.3)
.....do __ .... .... ... ........ . - 4,100 25.8 5.6 4.6
.....do..-. .. 4,100 10.2 4.6 2.2
. .do..- 4,200 23.3 3.8 6.1 do. _ ........ .. 4,400 18.2 3.9 4.7Mt. Con..... . .. . 4,200 19.3 8.8 2.2. .do 5,000 18.0 2.9 6.2
(17.8,18.1) do..-. 5,000 13.5 2.4 5.6Leonard........... ................ 2,000 22.1 6.5 3.4Kelley- ... ..... .... - 4,600 15.4 3.7 4.2
(14.9,15.8)
Average. 17.1 4.4 4.3

THORIUM, URANIUM, POTASSIUM, HEAT PRODUCTION, BOULDER BATHOLITH, MONT.
TABLE 14. Distribution of thorium, uranium, and potassium in Butte Quartz Monzonite samples from a drill hole(DDH-B-S) for which heat flow has been measured
[Samples provided by D. D. Blackwell, Southern Methodist Univ. and E. C. Robertson, U. S. Geol. Survey. Specific gravity: Determined by specific-gravity balance, using solid core segments. This report: Potassium analyses (atomic-absorption determinations) by P. L. D. Elmore, Lowell Artls, S. D. Botts, Oillison Chloe, J. L. Glean, James Kelsey, and Hezekiah Smith; thorium and uranium analyses by Roosevelt Moore. Previous analysis: D. D. Blackwell (written commun., 1968); analyses (gamma-ray spectrometric determinations on solid core segments) by Gordon McKay, Bice Univ.]
Sample No. and depth (feet)
850. _ . _ .......950......- .....1050....-. ...1150. ...........1350 .I860. __.. ... .2150 .2250.. .2450. .,2550..... .....
2660 .... ......
2750. .2850 .
2950 .
3050».. ..... .
3160-3200 »-. .
3450-3500»._......
3550-3600 «-. ...
3950-3995 »-.. ..
Average ......
This report
gravity Potassium (percent)
2.682.722.682.692.702 722.712.712.702.69
2.72
2.742.67
2.70
»2.67
»2.71
»2.75
*2.71
»2.68
2.70
3.1 3.4 3.4 3.4 3.6 3.5 3.4 3.7 3.3 2.8
3.6
3.43.0
3.5
3.2
3.6
3.6
3.7
3.9
3.4
Thorium (ppm)
32.4 25.9 249 240 26.3 20.0 26.2 240 240 247
(248,246) 17.2
(16.7,17.6) 19.5 16.2
(16.8,16.7) 25.2
(25.2,25.3) 20.5
(20.9,20.1) 12.8
(12.4,13.2) 18.4
(17.8,19.1) 20.6
(21.0,2aO, 20.7) 2L6
(21.0,22.2)
22.8
Previous analysis
Uranium Potassium Thorium Uranium (ppm) Th/U (percent) (ppm) (ppm) Th/U
8.0 8.2 48 3.8 42 6.0 6.8 7.6 8.2 6.2
4.8
6.8 46
11.8
6.6 (6.4,6.8)
3.5 (3.0,3.4,40)
6.0 (6.4,6.6)
7.1 (7.0,7.2)
6.4 (6.4,6.2)
6.3
40 3 2 __ .. .6.2 ... 6.3 .. 6.0 a a5 0
3.2 2.9 40
3.6
3.4 3.5
2.1 _ .. . __ .,
3.1 41 23.8
3.7 45 19.7
3.1 3.9 22.3
2.9 42 20.7
3.3 44 240
3.7 ...
8.0 3.0
6.4 3.6
6.6 3.4
6.5 3.2
6.6 43
i Composite samples of three pieces of core collected at the depth or between the depths indicated by sample number. < Average of the three chips in composite.
NOTE: The potassium determinations by gamma-ray spectrometry are systematically higher than those by atomic absorption, by as much as 30 percent. The reason for this lack of agreement is not clear but may perhaps be the different form of the samples: the gamma-ray deter minations were on composites of actual drill-core segments (that is, sample was not powdered), whereas the atomic-absorption determina tions were on powdered sample material representing approximately 1 inch of each of the three (1.5-inch diameter) core segments making up the original composite samples. Although the agreement between thorium and uranium is much better, the difference in sample form may also account for some of the discrepancy between our data and the Bice Univ. data.
TABLE 15. Distribution of thorium, uranium, and potassium in a single stock of Woodson Mountain Granodiorite, Southern Californiabatholith
'Thorium and uranium analyses by Roosevelt Moore, Esma Campbell, and L. B. Jenkins; major-element analyses by P. L. D. Elmore, S. D. Botts, Hezekiah Smith, andGillison Chloe (using methods described by Shapiro and Brannock, 1962), unless otherwise noted]
Sample No.
8-9..... .
8-13....... .............GSC-4 ........8-2GSC-L.. .8-11........ ............S-15.............. ......SLB-596 » ...LTS-4z .............GSC-2-. ... ..... ....
S-12. .8-10....................GSC-3 .
Potassium Thorium Uranium (percent) (ppm) (ppm) '
1 O
1.92.21 Q
2.32.22.22.22.82.32.12.72.7a2as
8.7ai
11.3 7.1 5.2 8.5 8.0 9.1 9.7 5.8 5.7 7.5 7.9 6.9
14.1
1.8 1.5as1.4 1.4 2.2 2.2 1.4 2.7 1.4 1.0 1.6 2.4 1.8 2.8
Ph/U -
48 2.1 3.4 5.0a? as ae6.5ae41 6.7 47asas6.0
Weight percent
SiO2
71.9 72.7 72.6 72.5 72.6 73.3 73.4 748 74.72 75.3 75.8 75.4 76.1 76.9 77.0
KiO
2.3 2.3 2.7 2.3 2.8 2.7 2.6 2.7 3.40 2.79 2.6as as3.9 46
NasO
3.9as40 3.9 43 40 40 3.9 a 76 412 40as a?3.9 3.5
CaO
CaO NasO+KaO
2.4 2.4 2.2 2.5 1.8 1.6 1.8 1.5 1.62 1.9 1.7 1.3 .95 .44 .54
0.39 .39 .33 .40 .25 .24 .27 .23 .23 .27 .26 .18 .14 .06 .11
Remarks
Foliated dark facies near border. Do.
Contaminated {granodiorite. Typical central phase.
Do. Do. Do. Do. Do. Do. Do. Do. Do.
Leucocratic phase. Aplitedike.
Average 1 2.3 7.5 1.9 42 741 2.8 3.9 1.7 .26
1 Chemical data for sample SLB-596 from Larsen, Jr. (1948). 1 Chemical data for sample LTS-4 provided by L. T. Silver. * Excluding aplite sample GSC-3.
U. S. GOVERNMENT PRINTING OFFICE : 1969 O - 339-847