Distribution of anti-cancer drugs within solid …...vi I have received so much love from my...
221
Distribution of anti-cancer drugs within solid tumours and normal tissues and its potential for modification to improve therapeutic index by Krupa J. Patel A thesis submitted in conformity with the requirements for the degree of Doctor of Philosophy Graduate Department of Medical Biophysics University of Toronto © Copyright by Krupa J. Patel 2011
Transcript of Distribution of anti-cancer drugs within solid …...vi I have received so much love from my...

Distribution of anti-cancer drugs within solid tumours and normal tissues and its potential for modification to improve therapeutic index
by
Krupa J. Patel
A thesis submitted in conformity with the requirements for the degree of Doctor of Philosophy Graduate Department of Medical Biophysics
University of Toronto
© Copyright by Krupa J. Patel 2011

ii
ABSTRACT
Distribution of anti-cancer drugs within solid tumours and normal tissues and its potential for modification to improve therapeutic index
Krupa J. Patel
Doctor of Philosophy, 2011 Graduate Department of Medical Biophysics
University of Toronto
Limited drug distribution is an important cause of drug resistance. Anti-cancer
drugs gain access to solid tumors via the blood, and must penetrate tissue to reach all
viable cancer cells. This thesis aims to compare the distribution of anticancer drugs in
normal tissues and tumours, to examine whether drug distribution is modifiable and
quantifiable in solid tumours, and to determine whether extracellular drug distribution
can be improved by modifying intracellular drug distribution.
The time-dependent spatial distribution of three anticancer drugs, doxorubicin,
mitoxantrone and topotecan, were studied in normal tissues and tumours. Ten minutes
after drug administration, there was fairly uniform distribution in the heart, kidney and
liver whereas drug distribution within tumours was limited to perivascular regions.
Doxorubicin distribution in P-glycoprotein (PgP) over-expressing tumours was
compared to that in wild-type tumours and changes in distribution were evaluated with
the use of PgP inhibitors. There was better doxorubicin distribution in PgP-over-
expressing tumours compared to wild-type tumours, and pretreatment of PgP-over-
expressing tumours with PgP inhibitors decreased doxorubicin distribution. These data
suggest that reduced uptake of drug into cells may enhance extracellular drug
distribution, and the dual effects of PgP inhibitors (increased drug uptake in proximal

iii
cells, but poorer drug distribution) may explain, in part, why these agents have not
provided clinical benefit.
The effect of the proton pump inhibitor pantoprozole on intracellular and
extracellular drug distribution was determined. Pantoprazole increased endosomal pH in
cells, leading to less sequestration of doxorubicin within them, and increased the toxicity
of doxorubicin for cultured cells. In wild-type MCF7 tumours, pretreatment with
pantoprazole enhanced doxorubicin distribution and tumour growth delay without
apparent increase in toxicity. These studies have led to initiation of a phase I clinical trial
of pantoprazole and doxorubicin for patients with solid tumours.
The work completed in this thesis has demonstrated that limited drug distribution
in solid tumours is markedly different compared to normal tissues and this is likely due to
features of the tumour microenvironment. The data show that drug distribution can be
modified and that these changes can be quantified, and may correlate with improved anti-
tumour effects. Improving drug distribution through the use of proton pump inhibitors
may be an effective strategy to improve chemotherapeutic efficacy.

iv
I dedicate my thesis to Mummy and Papa – Your love and sacrifice are my strength and motivation.
I also dedicate my thesis to Ritaben and Poonam – With you both standing on either side of me holding my hands, I will never fall.

v
ACKNOWLEDGMENTS
First and foremost I would like to thank God because without Him, nothing is possible and with Him, nothing is impossible. It is because of Him that I have people in my life who make me who I am today and continue to help me to grow and progress in my journey of life. Coming into graduate school I had a very naïve mindset and was completely unaware of what research and PhD degree entailed. I am grateful to Dr. Ian Tannock for taking me into his laboratory and giving me a project that perfectly suited my interests and built on my strengths. Thank you Dr. Tannock for always giving me direction, guidance and support and for trusting me with just the right amount of independence. Over the years I have come to really enjoy and embrace my project. I would like to thank my committee members Dr. David Hedley and Dr. LotharLilge for keeping me in check every once in a while through regular committee meetings. Thank you Dr. Lilge for taking time between committee meetings to help me strengthen parts of my project and my understanding of it. I am grateful for having wonderful lab mates throughout the years who have made the day-to-day routine of grad school all the more enjoyable. Carol Lee, thanks for all your help and guidance over the years. I inherited my project from the hands of Andy Primeau, and I thank him for being so helpful and accommodating while I learned the ropes! Thank you to Olivier, Rama, Vithika, Alaina, Jas, Susie and Man for being wonderful labmates with whom I have had many helpful and enjoyable discussions and conversations – I wish each of you all the best in your future endeavours. There is one person I cannot imagine my Tannock lab years without and that is Andrea Fung (aka Dr. Dre). Andrea, I thank you for giving me strength, support, encouragement, enthusiasm and most of all your friendship over the last 6.5 years. Your selflessness and inner strength are truly inspirational and I know they will lead you through a successful journey. Over the years at Princess Margaret, I have come to know some few amazing people who have become dear friends. Thank you Mahadeo for all your wisdom and advice, Mariam for your smiles and comforting words and Mamta for your encouraging discipline and your warm words of encouragement. Ramya, I have never met anyone with such a warm and caring heart as yours, its truly touching. You might be the one person who truly understands my timeline in graduate school! Thank you all for making birthdays, graduations, and all celebrations such special and memorable moments.You are all so very strong, talented and dedicated individuals and I am sure these qualities will lead you to success and happiness.

vi
I have received so much love from my Swadhyay family. To all my brothers and sisters, uncles and aunties, your love has meant so much to me. To the one person who has accepted me as I am and awaken in me the belief that “I can”, Dadaji, you are the source of the strength and love I feel in my heart. In the last year of my thesis, when I needed someone to hold my hand, I met you Jay. Your confidence in me has strengthened mine. It is truly a blessing to be able walk the last steps of this chapter together as we embark on many more to come. Nakupenda wewe sana, just the way you are. And lastly, I would like to thank four important people in my life. My sisters, Ritaben and Poonam, I have only been able to walk down this path because you have stood by me in every decision I have made. Your faith in me has given me the courage and confidence to truly believe in myself. You both work extremely hard and have complete dedication in all that you do. It is inspiring to see how selfless and committed you both are to your patients, to your friends and to your family. I love you both so much and I want to thank you for being amazing sisters and my best friends. To my parents, Mummy and Papa, it is only because of everything you have sacrificed and your unconditional love that I have been able to accomplish this chapter of my life. Bapuji and Dada have always given importance and value to education, and you have instilled that into all of us. You are my role models of patience, hard work and success. You have taught me to always aim for the best and take the lead, and I will but, your footsteps are the ones I will always follow. I love you.
Tvamevamata cha pita tvameva Tvamevabandhus cha sakhatvameva
Tvamevavidhyadravinamtvameva Tvamevasarvam mama deva deva
(You are my mother, you are my father
You are my friend You are my source of knowledge, wealth and wisdom
You are everything to me)

vii
TABLE OF CONTENTS ABSTRACT ....................................................................................................................... ii ACKNOWLEDGEMENTS.............................................................................................iv
TABLE OF CONTENTS ............................................................................................... vii
LIST OF TABLES ........................................................................................................... xi
LIST OF FIGURES ........................................................................................................ xii
ABBREVIATIONS ......................................................................................................... xv
CHAPTER 1 ...................................................................................................................... 1
1.1 OVERVIEW ............................................................................................................. 2 1.2 CANCER CHEMOTHERAPY ................................................................................ 3 1.3 PROPERTIES OF ANTI-CANCER DRUGS .......................................................... 4 1.4 CLASSIFICATION OF ANTI-CANCER DRUGS ................................................. 5
1.4.1 Alkylating agents ............................................................................................... 5 1.4.2 Platinating agents ............................................................................................... 6 1.4.3 Antimetabolites .................................................................................................. 7 1.4.4 Topoisomerase inhibitors ................................................................................... 9 1.4.5 Antimicrotubular agents................................................................................... 10 1.4.6 Molecular-targeted agents ................................................................................ 11
1.5 RESISTANCE TO CHEMOTHERAPY ................................................................ 12 1.6 CELLULAR AND MOLECULAR CAUSES OF DRUG RESISTANCE ............ 14
1.6.1 Decreased Drug Uptake ................................................................................... 14 1.6.2 Multidrug resistance and altered drug efflux ................................................... 15 1.6.3 Decreased drug activation and increased drug inactivation ............................. 23 1.6.4 Alteration of drug targets ................................................................................. 24 1.6.5 Defects in DNA repair ..................................................................................... 25 1.6.6 Defects in apoptosis / Altered regulation of apoptosis .................................... 26
1.7 MECHANISMS OF DRUG RESISTANCE THAT RELATE TO THE TUMOUR MICROENVIRONMENT ............................................................................................ 28
1.7.1 Drug distribution .............................................................................................. 28

viii
1.7.2 The extracellular matrix and cell-cell adhesion ............................................... 35 1.7.3 Tumour vasculature ......................................................................................... 36 1.7.4 Tumour Hypoxia .............................................................................................. 42 1.7.5 Tumour Acidity ................................................................................................ 44 1.7.6 Repopulation .................................................................................................... 49
1.8 METHODS FOR STUDYING DRUG DISTRIBUTION ...................................... 50
1.8.1 In vitro models ................................................................................................. 50 1.8.2 In vivo models.................................................................................................. 54
1.9 RATIONALE .......................................................................................................... 57 1.10 HYPOTHESES ..................................................................................................... 58 1.11 OBJECTIVES & SPECIFIC AIMS ...................................................................... 59 1.12 REFERENCES ..................................................................................................... 60
CHAPTER 2 .................................................................................................................... 75 2.1 ABSTRACT ............................................................................................................ 76 2.2 INTRODUCTION .................................................................................................. 77 2.3 MATERIALS AND METHODS ............................................................................ 79
2.3.1 Drugs and reagents ........................................................................................... 79 2.3.2 Cell lines .......................................................................................................... 80 2.3.4 Mice ................................................................................................................. 80 2.3.5 Evaluation of drug distribution ........................................................................ 80 2.3.6 Fluorescence imaging ...................................................................................... 81 2.3.7 Image analysis .................................................................................................. 82
2.4 RESULTS ............................................................................................................... 83
2.4.1 Distribution of drugs in tumours ...................................................................... 83 2.4.2 Change in tumour vasculature and hypoxia following drug treatment ............ 85 2.4.3 Drug distribution in heart, kidney and liver ..................................................... 86 2.4.4 Drug distribution in the brain ........................................................................... 88
2.5 DISCUSSION ......................................................................................................... 89 2.6 FIGURES ................................................................................................................ 94 2.7 REFERENCES ..................................................................................................... 108

ix
CHAPTER 3 .................................................................................................................. 112 3.1 ABSTRACT .......................................................................................................... 113 3.2 INTRODUCTION ................................................................................................ 114 3.3 MATERIALS AND METHODS .......................................................................... 116
3.3.1 Drugs and reagents ......................................................................................... 116 3.3.2 Tumour model ................................................................................................ 116 3.3.3 Evaluation of doxorubicin distribution .......................................................... 117 3.3.4 Fluorescence imaging .................................................................................... 117 3.3.5 Image analysis ................................................................................................ 118 3.3.6 Growth delay studies...................................................................................... 119
3.4 RESULTS ............................................................................................................. 119
3.4.1 Blood vessel density ...................................................................................... 119 3.4.2 PgP overexpression and doxorubicin distribution ......................................... 121 3.4.3 PgP inhibitors and doxorubicin penetration ................................................... 121 3.4.4 Growth delay and toxicity .............................................................................. 122
3.5 DISCUSSION ....................................................................................................... 123 3.6 CONCLUSIONS................................................................................................... 127 3.7 FIGURES .............................................................................................................. 129
3.8 REFERENCES ..................................................................................................... 135
CHAPTER 4 .................................................................................................................. 139
4.1 ABSTRACT .......................................................................................................... 140 4.2 INTRODUCTION ................................................................................................ 141 4.3 MATERIALS AND METHODS .......................................................................... 143
4.3.1 Drugs and reagents ......................................................................................... 143 4.3.3 Measurement of endosomal pH ..................................................................... 144 4.3.4 Doxorubicin uptake ........................................................................................ 145 4.3.5 Evaluation of doxorubicin penetration in multilayered cell cultures ............. 146 4.3.6 Plasma concentrations of pantoprazole in mice ............................................. 147 4.3.7 Evaluation of doxorubicin distribution in solid tumours ............................... 148 4.3.8 Growth delay studies...................................................................................... 150 4.3.9 Statistical analysis .......................................................................................... 151
4.4 RESULTS ............................................................................................................. 151
4.4.1 Proton pump inhibitors increase endosomal pH in tumour cells ................... 151

x
4.4.2 Pantoprazole pre-treatment alters doxorubicin uptake in tumour cells in culture................................................................................................................................. 151 4.4.3 Doxorubicin penetration increases in multilayered cell cultures pre-treated with pantoprazole .................................................................................................... 153 4.4.6 Effect of pantoprazole on vasculature and hypoxia in solid tumours ............ 154 4.4.7 Influence of pantoprazole pre-treatment on growth delay ............................. 155
4.5 DISCUSSION ....................................................................................................... 156 4.6 FIGURES .............................................................................................................. 162 4.7 REFERENCES ..................................................................................................... 175
CHAPTER 5 .................................................................................................................. 179 5.1 SUMMARY OF FINDINGS ................................................................................ 180 5.2 DISTRIBUTION OF ANTICANCER DRUGS IN NORMAL AND TUMOUR TISSUES ..................................................................................................................... 181 5.3 THE INFLUENCE OF PgP EXPRESSION AND ITS INHIBITORS ON DOXORUBICIN DISTRIBUTION ............................................................................ 183 5.4 THE INFLUENCE OF PANTOPRAZOLE ON DOXORUBICIN DISTIRBUTION AND ACTIVITY IN CANCER ..................................................... 185 5.5 LIMITATIONS AND FUTURE DIRECTIONS .................................................. 187 5.6 CONCLUSIONS................................................................................................... 199 5.7 REFERENCES ..................................................................................................... 201

xi
LIST OF TABLES Chapter 1: Introduction
Table 1.1 A partial list of anti-cancer agents and their toxicities
Chapter 2: Distribution of anticancer drugs in tumours and normal tissues
Table 2.1 Drug distribution gradients and distance at half intensity in PC3 and DU145 tumours treated with mitoxantrone and A431 and MCF-7 tumours treated with doxorubicin Table 2.2 Characteristics of drug distribution gradients in relation to distance to the nearest blood vessel Chapter 3: The influence of P-glycoprotein expression and its inhibitors on the distribution of doxorubicin in breast tumours Table 3.1 Characteristics of wild-type (EMT6, MCF-7) and PgP overexpressing tumours (AR1, BC19) at 10 minutes after treatment with doxorubicin (DOX) or with pre-treatment 2 hours earlier with inhibitors of PgP.

xii
LIST OF FIGURES Chapter 1: Introduction
Figure 1.1 Schematic of mechanism of drug resistance Figure 1.2 The trans-membrane domains and ATP binding sites of P-glycoprotein and Multidrug Resistance Protein 1. Figure 1.3 A schematic showing P-glycoprotein and its inhibitors. Figure 1.4 Factors that influence drug distribution include supply, flux and consumption Figure 1.5 Angiogenesis is driven by a balance between various pro and anti-angiogenic factors Figure 1.6 Altered pH within tumour cells influences the intracellular distribution of basic anticancer drugs Figure 1.7 In vitro models to study drug distribution include multicellular spheroids and multilayered cell cultures (MCCs).
Figure 1.8 Photomicrograph of doxorubicin distribution in a 16C tumour xenograft
Chapter 2: Distribution of anticancer drugs in tumours and normal tissues
Figure 2.1 Drug distribution in tumour sections at 10 minutes after intravenous administration Figure 2.2 Time-dependent drug distribution in tumour tissue. Figure 2.3 Drug distribution in MDA-MB-231 tumour tissue in relation to distance to the nearest blood vessel Figure 2.4 Time-dependent effects of the anticancer drugs on blood vessels and hypoxia in MDA-MB-231 tumours. Figure 2.5 Doxorubicin distribution in tumour and normal tissue in MDA-MB-231 tumour bearing mice at 10 minutes after injection. Figure 2.6 Perivascular doxorubicin distribution and blood vessel density in normal and tumour tissue at 10 minutes after injection.

xiii
Figure 2.8 Time-dependent mitoxantrone distribution in normal tissues. Figure 2.9 Time-dependent topotecan distribution in normal tissues. Figure 2.10 Drug distribution in normal tissues in relation to distance to the nearest blood vessel. Figure 2.11 Time dependent drug concentrations in normal tissue. Figure 2.12 Mitoxantrone distribution in mouse liver with a secondary tumour. Figure 2.13 Drug distribution in the brain. Chapter 3: The influence of P-glycoprotein expression and its inhibitors on the distribution of doxorubicin in breast tumours Figure 3.1 Distribution of doxorubicin in solid tumours. Figure 3.2 The gradient of doxorubicin fluorescence intensity in relation to distance from the nearest blood vessel. Figure 3.3 Distribution of doxorubicin in solid tumours. Figure 3.4 The gradient of doxorubicin fluorescence intensity in relation to distance from the nearest blood vessel and a model of doxorubicin distribution in solid tumours. Figure 3.5 Tumour growth delay and toxicity studies. Chapter 4: Influence of pantoprazole on distribution and activity of doxorubicin in cell culture and in solid tumours Figure 4.1 Endosomal pH measurements in cancer cells. Figure 4.2 Doxorubicin uptake in tumour cells in culture. Figure 4.3 Doxorubicin fluorescence in cells pretreated with either saline or 1 mM pantoprazole measured using flow cytometry. Figure 4.4 The penetration of doxorubicin in multilayered cell cultures (MCCs). Figure 4.5 Plasma concentration of pantoprazole in nude mice at various time points after administration of 200mg/kg to Balb/C mice. Figure 4.6 Toxicity measurements of doxorubicin and pantoprazole treatments in nude mice.

xiv
Figure 4.7 The distribution of doxorubicin fluorescence intensity in relation to the nearest blood vessel in murine tumours. Figure 4.8 The distribution of doxorubicin fluorescence intensity in relation to the nearest blood vessel in xenografts. Figure 4.9 The distribution of blood vessels and hypoxia following treatment of EMT6 and AR1 tumours. Figure 4.10 The distribution of blood vessels and hypoxia following treatment of MCF-7 and NCI tumours Figure 4.11 The distribution of blood vessels and hypoxia following treatment of MCF-7 and NCI tumours. Figure 4.12 Effect of pantoprazole and doxorubicin treatment on tumour growth in mice. Chapter 5: Conclusions & future directions Figure 5.1 The 3-dimensional histogram displaying distribution of pixel intensities for a given distance to the nearest blood vessel. Figure 5.2 Fluorescence emission of drugs at various pHs.

xv
ABBREVIATIONS
γH2AX gamma histone 2AX
5-FU 5-fluorouraciil
α-MEM Alpha minimal essential medium
ABC ATP binding cassette
AML Acute myeloid leukemia
AOI Area of interest
ATP Adenosine triphosphate
BBB Blood brain barrier
DiOC7 3,3'-diheptyloxycarbocyanine
DMEM Dulbecco’s modified Eagle’s medium
DMSO Dimethyl sulfoxide
DNA Deoxyribonucleic acid
DOX Doxorubicin
ECM Extracellular matrix
EGF Epidermal growth factor
EGFR Epidermal growth factor receptor
ERK Extracellular signal-related kinase
FBS Fetal bovine serum
FITC Fluorescein isothiocyanate
GSH Glutathione
GST Glutathione-S-Transferase
HER2 Human epidermal growth factor receptor 2
xvi
HIF Hypoxia inducible factor
HPLC High performance liquid chromatography
IFP Interstitial fluid pressure
IP Intraperitoneal
IV Intravenous
LPZ Lansoprazole
mAb Monoclonal antibody
MAPK Mitogen activated protein kinase
MCC Multilayered cell cultures
MDR Multidrug resistance
MITOX Mitoxantrone
MRP1 Multidrug resistance protein 1
MTD Maximum tolerated dose
OCT Optimal cutting temperature
PBS Phosphate-buffered saline
PECAM Platelet endothelial cell adhesion molecule
PgP P-glycoprotein
PPI Proton pump inhibitor
PTP Pantoprazole
RNA Ribonucleic acid
RPMI Roswell Park memorial institute medium
TGF Transforming growth factor
TMX Tamoxifen

xvii
TOPO Topotecan
V-H+-ATPase Vacuolar- H+-ATPase
VEGF Vascular endothelial growth factor
VEGFR Vascular endothelial growth factor receptor

1
CHAPTER 1
INTRODUCTION

2
1.1 OVERVIEW In 2010, Canada will continue to see an increase in the number of individuals
diagnosed with and dying from cancer. Every hour of every day, an average of 20 people
will be diagnosed with some type of cancer and 8 people will die from cancer. Although
awareness of cancer has increased in modern times, it is not a modern disease. From the
ancient civilizations, through the Middle Ages, cancer occurrences have been described
in various ways. Through the ages, various methods to treat cancer have been explored.
The use of chemotherapy in cancer came from studies during World War II of the effects
of sulphur and nitrogen mustard to cause death of proliferating cells. These studies
eventually led to the application of nitrogen mustard for the treatment of leukemia and
lymphoma. Since the 1950’s, chemotherapy has been used with modest success to treat
solid tumours. In the past 5 decades major advances have been made in the development
of a variety of cytotoxic agents and there are currently over 500 drugs in clinical trials for
cancer, 300 or which are directed against specific molecular targets.
Chemotherapy is used widely to prevent disease recurrence after local treatment
(adjuvant therapy) by eradicating micro-metastases and improving local control of the
primary tumour. Chemotherapy may also be administered prior to local treatment
(neoadjuvant therapy) in order to reduce tumour size and decrease probability of
metastasis. Chemotherapy is used commonly as palliative treatment for many types of
cancer in advanced phases to reduce the volume of established metastases.
3
1.2 CANCER CHEMOTHERAPY Current cancer therapies, including chemotherapy, radiation, immunotherapy and
gene therapy, are designed to induce sufficient damage to tumour cells to cause them to
either lose their proliferating capacity or cause cell death, while having minimal toxicity
to normal tissue. Many anticancer drugs are selectively toxic to proliferating cells, and
therefore have toxicity for cells in the bone marrow (precursors of mature granulocytes)
and intestinal mucosa. As a result, most cytotoxic treatments are unable to reach a high
level of selectivity for cancer cells and also cause toxicity to normal tissues that limits
both dose and frequency of drug administration. Chemotherapy is administered at
intervals to permit recovery of blood counts and prevent infection and bleeding.
Effective anticancer therapy for many tumours requires a combination of multiple
drugs that have different mechanisms of action and different dose-limiting toxicities to
produce larger additive affects against a tumour while reducing toxicity to normal tissues.
Heterogeneous tumour cell populations increase the number and diversity of potential
target sites. As well, heterogeneity within a single tumour can lead to varying sensitivity
to drugs among cell subpopulations and this can lead to the selection or induction of
drug-resistant subpopulations. Combining multiple drugs can improve therapeutic
efficacy by having a greater number of targets and reducing cross-resistance (1).
Mechanisms by which different agents may give therapeutic benefit when used in
combination can be classified as follows: (1) independent toxicity, which may allow for
the potential use of anticancer drugs at full dosage; (2) spatial cooperation, where
subpopulations missed by one agent may be treated by another; (3) protection of normal
tissues; and (4) enhancement of tumour response (2).

4
1.3 PROPERTIES OF ANTI-CANCER DRUGS In order for anticancer drugs to be efficacious, they must reach targeted areas in
the body. The distribution of anticancer drugs within the body is governed by various
factors such as blood flow to different organs, diffusion, protein and tissue binding, and
lipid solubility. Response to chemotherapeutic agents once they are delivered to tissues
and tumour via the bloodstream will depend on several processes including drug uptake
into cells, intracellular metabolism, binding to molecular targets and cellular mechanisms
for overcoming drug-induced damage. Drug effects inside the cells and the mechanisms
that the cell uses to try to circumvent or repair damage vary widely among different types
of drugs and this variability in these processes will influence response. Pharmacokinetic
and pharmacodynamic modeling examines the relationship between a clinical endpoint,
such as toxicity or response and the time course of the drug in the body. This type of
modeling is useful for identifying clinical parameters that will guide dose and frequency
of administration. Most chemotherapeutic drugs have a narrow therapeutic index and are
given at close to the maximum tolerated dose (MTD).
Although metabolism of chemotherapeutic agents is drug specific, many
chemotherapeutic agents are metabolized primarily in the liver where oxidative and
reductive reactions take place via the cytochrome P-450 system, known as phase I. Phase
II is conjugation where reactions lead to inactive metabolites that can be eliminated from
the body by biliary or renal excretions. During phase I reactions, metabolites can be
produced that retain therapeutic activity (e.g. doxorubicin) for some drugs, whereas for
others (e.g. cyclophosphamide) metabolism is required for activation. Many anticancer
drugs have active metabolites, and this introduces additional complexity into

5
understanding the relationship between drug pharmacokinetics and effect. Most drugs
are eventually eliminated from the body by the kidney or the biliary tract. Renal
excretion can either be of the active drug (e.g. carboplatin) or of metabolites that have
undergone phase II metabolism (e.g. doxorubicin).
1.4 CLASSIFICATION OF ANTI-CANCER DRUGS
The majority of anti-cancer drugs used today are cytotoxic agents with activity
against proliferating cells, however they have little specificity against neoplastic cells.
1.4.1 Alkylating agents
Alkylating agents were among the first group of drugs used for the systemic
therapy of cancer, identified by their ability to cause DNA damage. Nitrogen mustard
was developed as a by-product from a study on poisonous war substances and was one of
the first agents used clinically. Derivatives of nitrogen mustards include
cyclophosphamide, melphalan and chlorambucil. They are chemically diverse agents
that act through the covalent bonding of alkyl groups (e.g. –CH2Cl) to intracellular
macromolecules. Alkylation of pyrimidine and purine bases in DNA is likely to be the
major cause of lethal toxicity, as it has been observed that there is a quantitative
relationship between the concentration of drug that causes toxicity to the cells and the
production of lesions in DNA, such as single-strand breaks and cross-links (3, 4). Inter-
strand DNA cross-links subsequently inhibit DNA separation or cause abnormal DNA
separation preventing cell division from occurring. Alkylating agents bind directly to
DNA, and have limited cell cycle specificity. Although the nitrogen mustards were

6
originally used for the treatment of lymphomas, they are now widely used clinically as
part of treatment protocols for breast, lymphatic, gynecological and pediatric tumours, in
high-dose chemotherapy regimens and for a number of autoimmune diseases. Toxicities
common to all agents of this class are myelosuppression, immunosuppression, hair loss,
nausea and vomiting. Many alkylating agents have longer-term effects such as infertility
and carcinogenesis due to long-lasting DNA damage.
1.4.2 Platinating agents
Platinating agents came about from an observation that an electric current
delivered to bacterial culture via platinum electrodes leads to inhibition of bacterial
growth (5, 6). The active compound was cisplatin (cis-diamminedichloroplatinum II).
Cisplatin was found to have substantial toxicities including severe renal, neurologic, and
emetogenic effects. Carboplatin (cis-diammine(1,1-cyclobutanedicarboxylato)
platinum(II)), an analog of cisplatin, was introduced into clinical trials in 1981 to help
circumvent some of the toxicities of cisplatin (7). Both cisplatin and carboplatin are
platinum (II) complexes with two ammonia groups in the cis position. While cisplatin
has two chloride “leaving” groups, carboplatin has a cyclobutane moiety. The major
cytotoxic target of these two analogs is DNA. The agents bind to DNA at two sites and
produce inter-strand cross-linkages and lead to the formation of intra-strand bifunctional
adducts (8, 9). Although this is known, the type of DNA lesions responsible for
cytotoxicity and the mechanism that leads to cell death remain unclear. Platinating
agents are commonly used as part of first-line therapy for testicular, urothelial, lung,
gynecological, and other cancers. Carboplatin and its derivatives are comparable in
efficacy to cisplatin, for example for ovarian cancer the two have equal efficacy, however

7
for gastrointestinal cancer, oxaliplatin is more active (10, 11). Common toxicities
include myelosuppression, nephrotoxicity and neurotoxicity.
1.4.3 Antimetabolites
Antimetabolites are synthetic drugs that act as inhibitors of critical biochemical
pathways in the formation of DNA, or as nucleotide analogs in DNA or RNA that result
in the formation of abnormal nucleic acids. The metabolic processes of the cell are
complex and involve many enzymes. Two major pathways give rise to the synthesis of
purines and pyrimidines. Purine analogs (e.g. 6-thioguanine and 2-chlorodeoxy
adenosine) and pyrimidine analogs (e.g. 5-fluorouracil, cytosine arabinoside and
gemcitibine) act by either inhibiting the formation of the normal nucleotides or
interacting with DNA and preventing further extension of the new DNA strand, leading
to the inhibition of cell division. Folate-derived co-factors are also involved in these
processes and are essential for certain reactions, such as the conversion of deoxyruridine
monophosphate (dUMP) to deoxythymidine monophosphate (dTMP) (12). Antifolates
are not nucleoside analogs but rather they prevent the formation of reduced folates, which
are required for DNA synthesis. Methotrexate is an antifolate that acts as a competitive
inhibitor of dihydrofolate reductase (DHFR) (13). Most antimetabolites are cell cycle
specific and effective against rapidly dividing cells. Toxicity of antimetabolites reflects
their effects on proliferating cells; therefore mucositis, myelosuppresion and
thrombocytopenia are common.

8
Table 1.1 A partial list of anti-cancer agents and their toxicities
Drug Category Chemotherapeutic agent or molecular targeting agent
Commonly occurring toxicities
Alkylating agents Nitrogen Mustards - cylcophosphamide - melphalan - chlorambucil
Nitrosoureas - chloroethylnitrosoureas
myelosuppression, immunosuppression, hair loss, nausea and vomiting
Platinating agents Cisplatin Carboplatin Oxaliplatin
myelosuppression, nephrotoxicity and neurotoxicity
Antimetabolites Methotrexate 5-Fluorouracil Cytidine analogues
- gemcitabine - cytosine arabinoside
Purine antimetabolites - 6-mercaptopurine
mucositis, myelosuppresion and thrombocytopenia
Topoisomerase inhibitors
Topoisomerase I inhibitors - camptothecin - topotecan - irinotecan
Topoisomerase II inhibitors - doxorubicin - daunorubicin - mitoxantrone
myelosuppresion, cardiac toxicity, mucositis and loss of hair
Anti-microtubular agents
Vinca Alkaloids - vinblastine - vincristine
Taxanes - paclitaxel - docetaxel
myelosuppression and neurotoxicity
Molecular-targeted agents
Antibodies - traztuzumab - bevacizumab
Small Molecules - bortezomib - imatinib - gefitinib
diarrhea, nausea, thrombocytopenia, acneiform skin rash, mucositis

9
1.4.4 Topoisomerase inhibitors
Topoisomerase inhibitors are widely used as anti-tumour drugs. DNA
topoisomerases are ubiquitous nuclear enzymes that relax supercoiled double-stranded
DNA to allow DNA replication and RNA transcription. Topoisomerases bind to DNA
creating a DNA-topoisomerase cleavable complex. This subsequently leads to the
formation of either a single strand nick (topoisomerase I) or a double-strand nick
(topoisomerase II) which allow the DNA to swivel to relieve torsional strain and to
religate (14-16). Thus, topoisomerases are known to be involved in many important
DNA metabolism reactions including replication, recombination, transcription and
chromosome segregation during mitosis (17). Topoisomerase inhibitors prevent DNA
religation by binding to and stabilizing the cleavable complex. Stabilized DNA
intercalation and the formation of a cleavable complex may lead to interaction with the
replication machinery and this interaction may be responsible for DNA synthesis
inhibition. This interaction between the replication machinery and the reversible
cleavable complex leads to cell death and G2 arrest of the cell cycle (18, 19). Despite the
fact that most of the inhibitors in this class share the same target, they have different
experimental and clinical antitumour properties which could be due to different modes of
action or to specific sites of interactions (20, 21).
Topoisomerase I inhibitors include camptothecin and its derivatives topotecan and
irinotecan. DNA topoisomerase I is expressed continuously during the cell cycle and in
quiescent cells, whereas topoisomerase II expression increases during the S phase of the
cell cycle and is almost absent in quiescent cells (22, 23). Thus, DNA topoisomerase I
can be targeted in slow growing tumours (24). Camptothecins have shown promise in the

10
treatment of ovarian cancer and small cell lung cancer and are now used as part of first
line therapy in metastatic colorectal cancer where they have a modest effect to improve
survival (25-28).
Topoisomerase II inhibitors comprise several classes of drugs including
anthracyclines, anthracenediones, amsacrines, ellipticines (DNA intercalators), and non-
intercalating etoposides (16). It has been found that the high levels of topoisomerase II in
tumour cells parallel the high proliferative potential of these cells (29, 30).
Topoisomerase II inhibitors are used in the treatment of a wide range of cancers such as
leukemia, lymphoma, breast cancer and other solid tumours. Although dose-limiting
toxicities are specific to groups of drugs, some of these toxicities include
myelosuppresion, cardiac toxicity, mucositis and loss of hair.
1.4.5 Antimicrotubular agents
Antimicrotubular agents include naturally occurring compounds such as vinca
alkaloids and plant-derived taxanes. The vinca alkaloids, vinblastine and vincristine, act
by binding to the protein tubulin and inhibit its polymerization to form microtubules (31).
Cells damaged with these agents may lead to lethality by entering an abortive metaphase
followed by cell lysis. These drugs are used in the treatment of testicular cancer and
leukemia, and in combination with other cytotoxic agents to treat lymphomas or various
solid tumours. Myelosuppression and neurotoxicity are commonly associated with the
use of these agents in the clinic. The taxanes, paclitaxel and docetaxel, are also anti-
microtubular agents and bind to tubulin, but at a site that is different from that of vinca
alkaloids. Taxanes have been proposed to act by inhibiting microtubular disassembly,
preventing the normal growth and breakdown of microtubules that is required for cell

11
division (32). This class of drugs has been observed to have activity against ovarian,
breast, lung and breast tumours. Dose-limiting toxicities are myelosuppression and
neurotoxicity (1).
1.4.6 Molecular-targeted agents An emerging group of antineoplastic agents are molecular targeted agents. Cancer occurs
through a series of steps including the accumulation of molecular changes that allow
histological premalignant lesions to develop into invasive tumours (33). Targeted
therapies that are directed to these specific molecular changes/targets that are selectively
expressed in cancer cells show promise. These agents have potential for increasing
specificity. A large research effort has focused on the development of therapeutic
antibodies. Monoclonal antibodies can have various modes of actions. They can bind to
the respective antigen and interfere with its activity and interact with binding partners.
The antigen can be a soluble ligand and examples of such antibodies include infliximab,
adalimumab, and certolizumab (anti-TNFα) or bevacizumab (anti-vascular endothelial
growth factor). Alternatively, the antibody may target a receptor expressed at the cell
surface, block its interaction with a ligand, interfere with a multimerization process or
trigger internalization of receptors or apoptosis of targeted cells. Examples of such
antibodies include cetuximab and panitumumab [(anti-epidermal growth factor receptor)
or HER1 (human epidermal growth factor receptor)] and trastuzumab (anti-HER2) (34).
Other targeted agents include small molecules that interact with various cell signalling
molecules. Examples of these agents include imatinib, erlotinib, gefitinib and tipifarnib.
By targeting specific gene products such as those involved in signal transduction

12
pathways, angiogenesis, cell cycle control, apoptosis and inflammation, monoclonal
antibodies and small molecules show much promise for anticancer treatment.
1.5 RESISTANCE TO CHEMOTHERAPY
The treatment of disseminated cancer has become increasingly aimed at molecular
targets derived from studies of oncogenes and tumour suppressors known to be involved
in the development of the disease (35). Cancer treatment has transformed from the use of
general cytotoxic agents such as nitrogen mustards to the development of natural product
anticancer drugs which are more cytotoxic to cancer cells than normal cells, to the use of
specific monoclonal antibodies and immunotoxins targeted to cell surface receptors (36,
37) and specific agents that inactivate kinases in growth-promoting pathways (38).
While these targeted agents hold promise, in clinic, over 95% of systemic treatment is
with chemotherapeutic agents.
Despite its widespread use, improved response rates and reduced side effects, many
human cancers either do not respond to chemotherapy, or acquire resistance during the
course of therapy. The mechanisms that contribute to drug resistance are complex and
multifactorial. They occur at the molecular, cellular, and physiological level of the
tumour. A large research effort has been devoted to studying the various underlying
mechanisms of drug resistance. Mechanisms of drug resistance can be summarized as
those that operate at the level of the cell membrane, cytoplasm and nucleus (Figure 1.1).

13
Figure 1.1 Schematic of mechanism of drug resistance. Illustrates the basic molecular mechanisms of drug resistance such as efflux pumps (eg. P-glycoprotein), decreased drug activation and increased drug inactivation (eg. cyclophosphamide resistance decrease in cellular uptake (eg. methotrexate resistance), alterations in drug targets (topoisomerase II and doxorubicin resistance), sequestration/compartmentalization within acidic endosomes and organelles (eg. doxorubicin resistance), and increased DNA repair ability (eg. alklating agents). (Adapted from Gottesman, 2002; (39)).

14
1.6 CELLULAR AND MOLECULAR CAUSES OF DRUG RESISTANCE
Cellular and molecular causes of drug resistance include up-regulation of target
enzymes, increased drug metabolism, multidrug resistance via drug export transporters
such as p-glycoprotein and multidrug resistance protein, and in the case of
haematological malignancies, enhanced survival due to defects in the apoptotic pathway.
1.6.1 Decreased Drug Uptake
Accumulation of a drug within a cell results from a balance between drug entry and
exit mechanisms. Drugs enter cells through three different routes: (1) passive diffusion
across the plasma membrane, (2) facilitated diffusion in which the drug enters through a
receptor or transporter and (3) active transport by a carrier-mediated process such as
endocytosis. The latter two mechanisms of entry have pharmacological significance that
is apparent through the observation of the existence of resistant mutants with defects in
these pathways (39).
For drugs that enter cells via receptors or transporters, selection of drug-resistant
cells can demonstrate mutations that eliminate or modify these cell surface molecules.
An example of this is resistance to toxic folate analogs such as methotrexate that
commonly occurs by mutation of one or both of the folate transporters (folate binding
protein and /or the reduced folate transporter) (40).
A defective drug uptake system that results in altered intracellular drug content has
been observed in cisplatin-resistant cells (41-43). Members of the Ctr transporter family
have been shown to be involved in mediating cisplatin transport across the plasma

15
membrane (44). Mice with a mutant ctr gene have showed a substantial increase in
cisplatin resistance and decrease in cellular cisplatin accumulation (45).
Immunotoxins are among the types of drugs that bind to cell surface receptors and
are generally internalized via receptor-mediated endocytosis. Cancer cell mutants that
have defective endocytosis are resistant to both toxins and immunotoxins (39, 46).
1.6.2 Multidrug resistance and altered drug efflux
Multidrug resistance is a term used to describe the phenomenon characterized by
the ability of drug resistant tumours to exhibit simultaneous resistance to a number of
structurally and functionally unrelated chemotherapeutic agents. The ATP-binding
cassette (ABC) family of membrane transport ATPases have significant importance in the
clinic. The family of proteins is phylogenetically ancient and their normal function in
eukaryotic cells remain to be fully characterized. The general structure of these ATPases
is composed of four structural domains, two that span the membrane (each containing
several transmembrane segments) and two that remain in the cytoplasm. The last two
units, called nucleotide domains, play a role in cleaving ATP (hydrolysis) to derive
energy necessary for transporting cell nutrients such as sugars, amino acids, ions and
small peptides across membranes (47). The cytotoxic drugs that are most frequently
associated with MDR are hydrophobic, natural products such as taxanes (paclitaxel,
docetaxel), vinca alkaloids (vinorelbine, vincristine, vinblastine), anthracyclines
(doxorubicin, daunorubicin, epirubicin), epipodophyllotoxins (etoposide, teniposide),
topotecan, dactiniomycin and mitomycin C (47, 48). Among the ABC transporters
involved in MDR are multidrug resistance associated protein (MRP) and p-glycoprotein
(PgP). Drug resistance develops in cancer cells often as a result of over-expression of

16
these transporters, which cause an increased efflux of cytotoxic drugs from the cancer
cells leading to insufficient intracellular levels of the drug necessary for effective therapy.
In addition, MDR can occur intrinsically in some cancers without previous exposure to
chemotherapy agents (47). This type of gene amplification is probably due in part to
selection and in part to induction during chemotherapy.
1.6.2.1 P-glycoprotein
P-glycoprotein (PgP) is also a member of a super-family of ATP-dependent
membrane transport proteins that is predominantly found in the plasma membrane. PgP
has been shown to pump substrates out of tumour cells through an ATP-dependent
mechanism in a unidirectional manner. PgP is a 170-kD protein that contains two
homologous halves, each comprised of six putative trans-membrane segments and a
cytosolic ATP-binding site. PgP confers resistance to a broad range of complex
heterocyclic hydrophobic, natural product antineoplastic drugs that include anthracycline
antibiotics, the Vinca alkaloids, and the taxanes. In addition to its expression on the
plasma membrane PgP is also present on the luminal side of the Golgi stack membranes
in different MDR-resistant cells. However, it is absent from endocytic vesicles and
lysosomes and present in only small amounts in the endoplasmic reticulum (49). PgP is
not only expressed in tumour cells, but also on the luminal side of epithelial cells of
several normal tissues, suggesting that it may have a physiological role in the elimination
of xenobiotics or endogenous metabolites. Expression of PgP in human normal tissue is
quite variable with the highest levels found in the apical membranes of the blood-brain
barrier, intestines, liver and kidney (50). In cancerous tissue, the expression of PgP is
usually highest in tumours that are derived from tissues that normally express PgP, such

17
as epithelial cells of the colon, kidney, adrenal, pancreas and liver, resulting in the
potential for resistance to some cytotoxic agents before chemotherapy is first
administered. In other tumours, the expression of PgP may be low at the time of
diagnosis but increases after exposure to chemotherapy agents, thereby resulting in the
development of MDR in those cells (51).
1.6.2.2 Multidrug resistance associated protein (MRP)
MRP is a 190-kd member of the ABC super-family of transmembrane transporter
proteins encoded by the MRP1 gene on chromosome 16 (1). Depending on the cell type,
MRP may be located in either the plasma membrane or in intracellular membranes (52,
53). This protein has seventeen transmembrane segments (Figure 1.2). PgP and MRP1
confer resistance to a similar but not identical spectrum of anticancer agents. The
transport kinetics of anthracyclines by PgP and MRP are very similar (54). However,
unlike PgP that targets and transports hydrophobic drugs, MRP proteins can transport
hydrophilic molecules and even organic anions. They also transport neutral drugs
conjugated with glutathione (GSH, L-γ-glutamyl-L-cysteinyl-glycine), glucoronide, or
sulfate and anticancer agents that are not metabolized to glutathione conjugates by co-
transport with free GSH (55, 56). The emergence of resistance of tumour cells to
chemotherapy and correlation of resistance to over-expression of transport proteins have
led to considerable efforts to develop agents able to inhibit MRP-1 mediated transport.
While several PgP inhibitors have entered clinical trials, the development of specific
MRP inhibitors is still ongoing. Among the recent advances in development of MRP
inhibitors are agosterol A and its analogs, verapamil derivatives (57), the flavonoids
18
(genistein, flavopiridol) (58), raloxifene-based inhibitors (59, 60), isoxazole-based
compounds and quinoline derivatives (57).
1.6.2.3 Reversal of multidrug resistance
Over the last two decades a large research effort has been dedicated to studying
methods of inhibiting PgP as a way of reversing MDR. The field of MDR modulators in
the clinic became increasingly more popular after studies that showed that the expression
of PgP was a significant prognostic marker in certain childhood malignancies (61, 62).
By blocking the action of the pump, through a variety of mechanisms, chemotherapeutic
agents can be retained within the cell and allow for intracellular accumulation of drug to
ultimately cause cytotoxicity (Figure 1.3). In order for reversal agents to be successful in
the clinic, several conditions have to be considered: (1) MDR must be a major
mechanism of resistance to chemotherapy (2) the inhibition of PgP or another pump
should be feasible in tumour cells in vivo without deleterious effects in normal tissues
expressing the pump, (3) compounds should not have an intrinsic toxicity preventing
their safe usage. Most reversal agents have not been successful in clinical trials because
they have failed to meet these conditions. Through a succession of steps, three
generations of compounds were developed. The first generation of compounds were
already in clinic for other therapeutic applications. In the case of verapamil, cyclosporine
A, and quinidine, they were unsuccessful because their low binding affinities necessitated
the use of high doses, resulting in unacceptable toxicities (47, 63).

19
Figure 1.2 The trans-membrane domains and ATP binding sites of P-glycoprotein and Multidrug Resistance Protein 1. P-glycoprotein comprises of six putative trans-membrane domains and MRP1 has seven transmembrane domains. (Adapted from Morrow and Cowan, 2000; (64))

20
Many of the second generation of PgP inhibitors were analogues of the previous
generation but they were designed to be more potent and less toxic. Second generation
modulators include dexverapamil, dexniguldine, valspodar (PSC 833) and biricodar (VX-
710). Of these, the best characterized and most studied is PSC 833, which is a non-
immunosuppresive derivative of cyclosporine A. Although PSC 833 has been studied in
numerous clinical trials in combination with cytotoxic agents, results have been
disappointing (65-70).
Although second generation inhibitors have better pharmacogenic profiles than their
predecessors, these compounds significantly inhibit the metabolism and excretion of
cytotoxic agents. Cytochrome P450 enzymes are involved in the metabolism of cytotoxic
agents and are often induced in response to chemotherapy. Many cytotoxic agents are
substrates for both PgP and for the cytochrome P450 isoenzyme 3A4, including several
of the second-generation PgP inhibitors. Due to the competition between cytotoxic
agents and these PgP inhibitors for cytochrome P450 3A4 activity, there have been
unpredictable pharmacokinetic interactions (71). For example, the inhibition of the
cytochrome P450 3A4-mediated metabolism of paclitaxel and vinblastine by valspodar
has been observed to result in increased serum concentrations of the chemotherapy agents
and increased risk of drug overexposure to the patients (72). Use of second-generation
inhibitors has thus been limited due to the unpredictability of interactions that could
result in under- or over-dosing patients. As well, the ability of some second generation
compounds to affect other ABC transporters such as MRP1 may lead to greater adverse
effects of anticancer drugs (73).

21
Third generation inhibitors have been designed to specifically and potently inhibit
PgP without affecting cytochrome P450 3A4 (74). This specificity in preclinical studies
have translated to clinical trials where minimal pharmacokinetic interactions have not
necessitated dose reductions. Third generation inhibitors currently in clinical
development include tariquidar (XR9576), zosuquidar (LY335979), laniquidar
(R101933) and ONT-093 (71). Of these the most promising inhibitor is tariquidar, which
binds with high affinity to the PgP transporter and potently inhibits its activity (75).
However, phase II studies show that tariquidar in combination with chemotherapeutic
agents has only modest effects in patients who have already acquired drug resistance to
these cytotoxic agents (76).
From this section it is evident that resistance to chemotherapy is complex and
intricate and drug efflux pumps are just one of the multitude of mechanisms that can
simultaneously lead to drug resistance. Other in vitro studies have suggested that drug
efflux pumps such as PgP are likely to influence the distribution of anticancer drugs and
that reversal agents may alter these distribution patterns making the drugs less efficacious
(77). Drug efflux pumps are likely to have important effects on drug distribution in solid
tumours, this concept is important in the context of the work shown in this thesis and will
be examined in detail in later sections.

22
Figure 1.3 A schematic showing P-glycoprotein and its inhibitors. P-glycoprotein pumps within the cell membrane prevents the accumulation of most anticancer drugs within a cell. Inhibitors of P-glycoprotein may block the action and increase intracellular concentration of drug.

23
1.6.3 Decreased drug activation and increased drug inactivation Altered activity of specific enzymes systems (such as glutathione S-transferase
(GST) and topoisomerase) can be cause for cellular based resistance. Despite unaltered
intracellular drug concentrations, this mechanism of drug resistance can decrease the
cytotoxic activity of drugs.
Glutathione is an enzyme system involved in drug and xenobiotic detoxification
where biotransformation processes are catalyzed by GST to conjugate organic molecules
with glutathione (GSH) to form excretable polar molecules (78). The GSTs are
extensively involved in the metabolic biotransformation of many anticancer drugs, such
as the nitrogen mustards, in particular cyclophosphamide. Several resistant cell lines
have been shown to overexpress GST (79, 80). The GST-π isozyme has been shown to
be over-expressed in MCF-7/ADR cells, which also express elevated levels of P-
glycoprotein (PgP), and exhibit increased peroxidase activity (81). Similar increases in
GST-π levels have been reported in other multidrug resistant (MDR) cell lines (82, 83).
Although transfected GST-π has been shown to increase resistance to drugs such as
chlorambucil and melphalan (84, 85), evidence suggests that GST- π does not confer
resistance for doxorubicin (86). Glutathione also appears to play a key role in
detoxification and cellular repair following damaging effects from anticancer drugs.
Mechanisms to overcome this form of resistance involve reducing intracellular GSH
levels using agents such as buthionine sulfoximine (BSO). BSO has been observed to
selectively inhibit γ-glutamylcysteine synthetase, the rate-limiting step in the synthesis of
GSH (87). However, studies showing the use of BSO in combination with
chemotherapy may have minimal or limited effects on improving drug efficacy (88).

24
The enzymes topoisomerase I and topoisomerase II constitute effective
therapeutic targets for anticancer drugs in rapidly dividing tumour cells. For example,
doxorubicin and etoposide specifically target topoisomerase II (89, 90), while
camptothecin analogs target topoisomerase I (91). Cells can become resistant to
topoisomerase II inhibitors due to either under-expression of topoisomerase II or
topoisomerase II gene mutations. This may occur by reduced activity of topoisomerase II
activity (92), as well as reductions in topoisomerase II mRNA levels. Evidence suggests
a compensatory mechanisms of over-expression of topoisomerase I in cells resistant to
topoisomerase II due to reduced expression of topoisomerase II (93) and over-expression
of topoisomerase II in camptothecin-resistant cells (94). One approach to circumvent
topoisomerase I and topoisomerase II resistance is to target both enzyme classes in
sequential combination. This method has been tested in phase I trials and shows some
potential as an effective treatment strategy (95).
1.6.4 Alteration of drug targets In order for antimetabolites to cause cytotoxicity, these agents must interact with
their intracellular protein targets. Resistance to these agents can occur in two ways: the
levels of the target protein may be increased requiring increased concentrations of drug,
or the levels of the target protein may remain the same but the gene encoding the protein
can acquire a mutation that maintains near normal metabolic activity but leads to lower
affinity for the drug. An example of the latter type of resistance has been observed for 5-
fluorouracil (5-FU) with the acquisition of mutations in its target enzyme, thymidylate
synthase (96).

25
Although taxanes have recently emerged as effective anticancer drugs with broad
ranging anticancer activity, some cancer cells have acquired the ability to confer
resistance to these microtubule-targeting drugs. Several mechanisms of resistance to
paclitaxel involving alterations in tubulin have been described. Such alterations include:
(1) altered expression of β-tubulin isotypes in paclitaxel-resistant cells (97, 98); (2)
increased microtubule dynamics in paclitaxel-resistant cancer cells (99), and (3) the
presence of β-tubulin mutations in paclitaxel-resistant cells (100-102). The naturally
occurring epothilones and their analogs are a new class of antineoplastics that may be a
promising strategy to circumvent paclitaxel-resistant cells by inducing tumour cell
apoptosis by stabilizing microtubules involved in mitosis (103, 104).
1.6.5 Defects in DNA repair
When cancer cells are treated with cytotoxic agents that cause DNA damage they
will die unless the damage is repaired. Cells can become resistant by acquiring more
efficient processes to repair DNA damage. While numerous DNA repair pathways exist,
the major ones include direct (O6-alkylguanine DNA methyltransferase, AGT), base
excision (BER), nucleotide excision (NER), mismatch (MMR), homologous (HR), and
non-homologous end-joining (NHEJ) repair. Inhibiting enzymes in these pathways to
prevent DNA repair has been researched as a potentially effective method to circumvent
this type of drug resistance. However normal tissues may also become more sensitive to
drugs. The direct and base excision repair pathways show evidence of being the most
clinically relevant targets (105). The direct repair pathway is typified by O6-alkylguanine
DNA methyltransferase (AGT), which plays an important biological role in directly

26
repairing O6-alkylguanine in DNA. Elevated levels of AGT in tumours correlate to
resistance and make AGT a potential DNA repair target for cancer therapeutics (106-
108). The chemotherapeutic agent BCNU (1,3-bis (2-chloroethyl)-1-nitrosourea)
generates chloroethyl modifications at O6, which can rearrange and lead to an inter-strand
crosslink that is particularly toxic because it blocks DNA replication (109). Selective
targeting of such DNA repair enzymes may have the potential to enhance and augment
the currently used chemotherapeutic agents and radiation and overcome drug resistance.
Although attention to DNA repair pathways as potential targets has not received too
much attention, this field shows encouraging promise in translational studies.
1.6.6 Defects in apoptosis / Altered regulation of apoptosis
Chemotherapeutic agents can result in the induction cellular apoptotic pathways.
Hence, alterations that inhibit apoptotic pathways might contribute to drug resistance.
Apoptosis is programmed cell death characterized by cell shrinkage, membrane blebbing,
chromatin condensation and nuclear fragmentation caused by endonucleolytic cleavage
of genomic DNA. Whether a cell continues through the cell cycle or undergoes
apoptosis, is dependent upon a complex interplay of a team of genes and proteins that
exert a regulatory role in cellular events (47). Chemotherapy induced apoptosis may
occur via the intrinsic pathway mediated by the Bcl-2 family of proteins, or by the
extrinsic pathway regulated by members of the tumour necrosis factor (TNF) family of
receptors (110). The Bcl-2 family consists of more than 30 anti and pro-apoptotic
molecules and there is evidence to support the role of Bcl-2 family members in resistance
to chemotherapy (110, 111). Clinical studies show a correlation between elevated anti-

27
apoptotic Bcl-2 expression and poor prognosis in a number of neoplasms including AML,
lymphocytic leukemia and prostate cancer (112-114). Over-expression of Bcl-2 in tissue
culture has been observed to prevent apoptosis upon treatments with the majority of
cancer chemotherapeutic agents (115, 116).
In addition to its key role in inducing cell cycle arrest in G1 and apoptosis
following DNA damage cause by anticancer drugs, it has been suggested that the tumour
suppressor gene p53 also plays an important role in the regulation of expression of the
downstream proteins bcl-2 and bax (117, 118). Numerous studies support the importance
of p53 in therapeutic response and the vast majority of chemotherapeutic agents have
shown greater efficacy in killing human tumours with wild type as compared with mutant
p53 (119). The role of p53 and other apoptotic proteins in the development of drug
resistance in solid tumours has been challenged by a number of studies. A number of in
vitro and in vivo experiments have found that p53 status does not correlate with
chemotherapeutic sensitivity and in some cases disruption of p53 function has been
shown to enhance chemosensitivity (120, 121). These studies suggest that assays used to
assess the extent of cell kill by anticancer agents tend to examine the rate rather than the
overall cell kill. Colony forming assays have shown that changes in apoptosis do not lead
to any changes in eventual cell killing and p53 status does not affect sensitivity of DNA
damaging agents (122). There has been little affect on clonogenic survival after drug
treatment in cell lines transfected with Bax and Bcl-2 (121). Clinical reports have also
shown no direct correlation between Bcl-expression and therapeutic response (123).

28
1.7 MECHANISMS OF DRUG RESISTANCE THAT RELATE TO THE TUMOUR MICROENVIRONMENT
Although genetically determined factors contribute to drug resistance,
mechanisms related to the microenvironment of solid tumours may also have a profound
effect on the sensitivity of tumours to chemotherapeutic agents (39, 124). Solid tumours
are societies of cells that reside within complex physiological microenvironments that
can influence their response to chemotherapy. Microenvironmental factors that may
influence the sensitivity of tumours to anti-cancer drugs include: the requirement for
drugs to penetrate tumour tissue from blood vessels and distribute widely enough to reach
target cancer cells, the extracellular matrix and cell-cell adhesion, the variation in
vascular density and blood flow leading to decreased and varying delivery of drugs, the
altered interstitial fluid pressure, the presence of hypoxia, the low extracellular pH of the
tumour microenvironment, and the proliferation of surviving cells between courses of
chemotherapy (repopulation) (124). There is a strong interplay between various
microenvironmental factors that is likely to be conducive to a drug resistant phenotype.
1.7.1 Drug distribution
The ability of pharmacological agents to reach the target cells in living systems
determines the effectiveness of these substances. Most of the cells in the human body are
within a few cell diameters of blood vessels. This high level of organization facilitates
the delivery of oxygen and nutrients to the cells that form the tissues of the body. It also
enables the efficient delivery of most medicines.

29
Many drugs are administered via the bloodstream. Once the drug has entered the
circulatory system there are several limitations to transport before the substance can reach
the cells of normal or neoplastic tissue. A tissue may be represented as three well-
defined regions: (1) a vascular space through which blood flows; (2) an interstitial space,
which provides the support structure of the tissue; and (3) the cellular space. A drug
must first permeate the vessel wall from the bloodstream, then move through the
interstitial space by convection and diffusion, and once in contact with a cell, it must
cross the cellular wall and then transport through the intracellular space to a specific
action site. At this cellular level, the majority of the therapeutic effect takes place. Any
one of these transport processes: vascular distribution, capillary permeation, interstitial
transport and cellular uptake or cellular metabolism, could be the rate-limiting step in the
uptake of a drug in a tissue.
Drugs leave blood vessels and penetrate into tissues by the processes of
convection and/or diffusion. Convection depends on gradients of pressure (both
hydrostatic and osmotic) between the vascular space and the interstitial space; vessel
permeability and the surface area for exchange; and the volume and structure of the
extracellular matrix. Drug diffusion is determined by concentration gradients and the
size and charge of the molecules.
The homeostatic regulation of tissue and the growth of blood vessels is vastly
different between normal tissues in the body and tumour tissue leading to drastic
differences in drug distribution between the two.

30
1.7.1.1 Drug distribution in normal tissues
The circulatory system is used to distribute anticancer drugs to the body.
Therefore highly perfused normal tissues such as the liver and kidney generally have the
largest uptake of anticancer drugs when compared to poorly perfused tissues such as most
solid tumours. In addition to being well-perfused, normal tissue vasculature is highly
organized and large pressure gradients across the endothelial membrane increase the
efficiency of drug delivery compared to that in tumour tissue. The toxicity of most
anticancer drugs to many normal cells is a major disadvantage of chemotherapy. For
example, one of the major dose-limiting factors of doxorubicin is cardiac toxicity. Large
concentrations of drug are also often found in normal tissues such as muscle and liver
(125). The brain on the other hand has been reported to have limited accumulation of
drug due to the blood-brain barrier (BBB) (126). The key cellular elements of the brain
microvasculature that compose the BBB include tight junctions between cerebral
endothelial cells and pericytes embedded within the basement membrane (127). As well,
ABC transporters such as P-glycoprotein expressed and polarized on the luminal side of
the BBB play a critical role in keeping drugs and neurotoxic substances from entering the
brain and in transporting toxic metabolites out of the brain (128).
1.7.1.2 Drug distribution in solid tumours
Limited delivery of anticancer drugs is the result of large distances (up to 100µm
or more) between some proliferating tumour cells and functional blood vessels (129).
Large intercapillary distances are caused by rapid proliferation of tumour cells that forces
blood vessels apart and reduces vascular density. This process is exacerbated by a poorly
organized vascular architecture (130, 131), irregular blood flow (132, 133) , and

31
compression of blood and lymphatic vessels by cancer cells (134). Some reasons why
cells that are distant from blood vessels might be resistant to conventional chemotherapy
include: selective toxicity of most anticancer drugs for cycling cells so that non-
proliferating or slowly proliferating cells distant from blood vessels are resistant (135),
decreased activity of some drugs in hypoxic, acidic or nutrient-deprived
microenvironments (130, 136), and restricted exposure to drug in sufficient
concentrations to cause cell death due to limited drug distribution.
The effective treatment of solid tumours requires constituent cells be sensitive to
the drug and that the drug be able to achieve a concentration within the cells sufficient to
cause cytotoxicity. Anticancer drugs need to gain access to all of the cells within a
tumour; if they are unable to do so, then their effectiveness will be compromised
regardless of their mode of action or potency. If the drugs are unable to reach tumour
cells that are responsible for regenerating the tumour (i.e. clonogenic cells or tumour
stem cells), then regardless of the novelty of even new molecular medicines, tumour
recurrence is highly likely (137). A curative cancer treatment is one that accesses all
crucial tumour cells and kills them; the survival of one cell could form the focus of
tumour recurrence. Therefore even if large distances between tumour cells and non-
functional blood vessels occur only in a small region of a tumour, they can pose an
important barrier to a positive therapeutic outcome.
1.7.1.3 Factors that affect drug distribution in solid tumours
Distribution of anticancer drugs in tumour tissue is influenced by properties such
as supply, flux and consumption of drug. The supply of a drug to the tissue will depend
on its dose and pharmacokinetics. Flux of the drug through tissue refers to movement of

32
the drug after leaving the vasculature. Physicochemical properties of drugs such as
molecular weight, shape, charge and solubility determine the flux and the rate of
diffusion of the drug through tissue. Consumption of drug involves properties such as
binding, metabolism and sequestration of drug. Cellular metabolism will reduce drug
penetration and build-up within the tissue, and binding and sequestration can increase net
levels of a drug but limit its penetration (Figure 1.4).
In addition to characteristics of the drug that can influence its distribution, cellular
properties and properties of the tumour microenvironment can also have a profound
impact on the ability of anti-cancer drugs to not only reach their targets but to elicit their
effects. One of the major cellular mechanisms of drug resistance is the presence of drug
efflux pumps that are often over-expressed in solid tumours. This mechanism of
resistance was discussed earlier in the context of their effects of reducing drug
concentrations at drug targets. However, there is strong evidence to suggest that drug
efflux pumps such as P-glycoprotein may also have important and significant effects on
drug distribution.
Factors within the microenvironment that may alter drug distribution include the
extracellular matrix (ECM), cell-cell adhesion, cellular packing density, tumour
vasculature and interstitial fluid pressure, the presence of tumour hypoxia, tumour
acidity, and repopulation of surviving to tumour cells between courses of chemotherapy.
With increasing knowledge of these factors, strategies to modify tumour physiology and
improve drug distribution can be developed.

33
Figure 1.4 Factors that influence drug distribution are supply, flux and consumption. Cells close to blood vessels have a high rate of cell proliferation whereas cells distal from blood vessels have a low rate of cell proliferation. (Adapted from Tredan et al., 2007; (138)).

34
1.7.1.3.1 P-glycoprotein expression and drug distribution
Drug resistance develops in cancer cells often as a result of over-expression of
drug efflux pumps such as PgP, which by actively removing drug from the cytoplasm of
tumour cells into the interstitial space, prevents the accumulation of intracellular drug
concentrations sufficient for cell death (77).
Drug resistance develops from limited drug distribution because while cells
close to blood vessels retain large quantities of drugs, cells that are more distal are
exposed to minimal concentrations of drugs. Drug efflux pumps expressed in tumour
cells prevent intracellular accumulation of drugs. By actively pumping out drugs in cells
that are close to blood vessels, more drug may be available to reach distal cells. It has
been proposed that drug efflux pumps may alter drug distribution in this way. Studies
using in vitro models have suggested that tumour cell lines which over-express PgP have
improved drug penetration in cells distal from the source of drug compared to their wild-
type counterparts (77). Improved drug distribution due to PgP over-expression is not
necessarily beneficial for therapeutic outcome because sufficient intracellular
concentrations of drug are required in all tumour cells both close to and distal from blood
vessels.
Inhibitors of PgP, through various mechanisms, block the action of the pump, and
allow for drug to be retained within the cells. Since PgP over-expression improves drug
distribution in cells distal from the drug source, then PgP inhibitors are likely to counter
this effect and show penetration profiles similar to those of wild-type cells (i.e. of limited
drug penetration restricted to cells peripheral to blood vessels), this effect has been
observed in in vitro models (77). Therefore expression of drug efflux pumps is likely to

35
have an important influence on drug distribution within the solid tumour
microenvironment.
1.7.2 The extracellular matrix and cell-cell adhesion
The extracellular matrix (ECM) is produced by mesenchymal cells and contains
fibrillar collagen, fibronectin, hyaluronic acid and proteoglycans. The ECM plays a role
in regulating processes such as growth, differentiation, death of cells, transport of
molecules and gene expression by stabilizing the microenvironment through interaction
with various cell surface receptors and soluble molecules such as cytokines and growth
factors (139). The ECM maintains tissue integrity and 3-dimensional architecture and
provides structural and mechanical support to cells and surrounding tissue. The ECM is
remodelled to sustain tumour growth, angiogenesis and invasion. Increased synthesis of
many matrix components has been reported in tumour tissue and has been correlated with
poor prognosis and resistance to chemotherapeutic agents (140, 141).
In addition to interacting with components of the ECM, cells within the tumour
microenvironment also interact with neighbouring cells. These interactions between
tumour cells and their environment have been shown to play a critical role in cell
adhesion-mediated drug resistance. Cell-cell adherens junctions are the most common
type of intracellular adhesions and are important for maintaining tissue architecture and
cell polarity. Disruption of normal cell-cell adhesion in transformed cells may contribute
to tumour cells having enhanced migration and proliferation, leading to invasion and
metastasis (142). Cellular adhesion is mediated by the interaction of several families of
molecules including integrins, cadherins, selectins and the immunoglobulin super-family

36
of cell adhesion molecules that bind to receptors on the cell surface (143). The
interactions of tumour cells with various components of the ECM is mediated by
integrins, and those interactions have been shown to protect them from cell death induced
by various cytotoxic agents (143).
1.7.2.1 The influence of the ECM on drug distribution
The composition and structure of tumour ECM have been shown to influence drug
transport in solid tumours. Cellular adhesion to other cells or the ECM can also cause
drug resistance by limiting penetration of anticancer drugs into solid tumour tissue.
Modification of the tumour extracellular matrix might facilitate the penetration of drugs
into tumours. Treatment of tumours with collagenase has been shown to enhance the
interstitial diffusion rate and the intratumoural delivery of macromolecules such as
monoclonal antibodies (144). Previous studies have shown poor drug penetration into
solid tumours with high packing density, and drug penetration was shown to improve
upon administration of agents that induced apoptosis and reduction in cell density (145-
148). The clinical applicability of such agents, however, remains unclear because
modification of the extracellular matrix or its interactions with tumour cells might
increase the probability of metastatic spread.
1.7.3 Tumour vasculature One of the hallmarks of cancer is the acquired capability of tumours to sustain
angiogenesis, which is the process of new vessel formation from the endothelium of
existing vasculature. The oxygen and nutrients supplied by the vasculature are crucial for
cell function and survival. This creates a requirement for all cells within a tissue to reside
within 100-200μm of a capillary blood vessel (149). The formation of new vessels in

37
normal tissues is governed by the net balance between pro- (e.g. vascular endothelial
growth factor (VEGF) and interleukin-8 (IL-8)) and anti-angiogenic factors (e.g.
endostatin and angiostatin). This process is highly regulated so that angiogenesis is “on”
or “off” depending on the conditions (e.g “on” during wound-healing). However, during
neoplastic transformation and tumour progression, a disruption in the balance between
pro- and anti- angiogenic molecules occurs (150). This is sometimes referred to as the
angiogenic switch and allows for continued proliferation and growth of tumour cells
(151, 152) (Figure 1.5). A number of factors appear to contribute to a change in the
balance of angiogenic signals during tumour development. These factors include
oncogene-driven production of growth factors by tumour cells, changes in the tumour
microenvironment, the recruitment of progenitor endothelial cells from bone marrow, and
the down-regulation of natural inhibitors of angiogenesis. Hypoxia, (by deregulation of
HIF-1α), glucose deprivation, low pH, and inducers of reactive oxygen species (ROS) are
among the microenvironmental alterations that stimulate angiogenic signals (153-155).
Although the exact molecular mechanisms that underlie the formation of abnormal
vasculature are unknown, it is likely that uncontrolled VEGF signalling plays a key role
(156).

38
Figure 1.5 Angiogenesis is driven by a balance between various pro and anti-angiogenic factors. In normal tissues (A) factors remain in balance, where as in tumour tissue (B), this balance is offset leading to abnormal vessel formation. (Adapted from Tredan et al., 2007; (138))

39
In normal vasculature, the angiogenic process involves activation followed by the
binding of angiogenic factors to their cognate receptors on endothelial cells (EC) and the
subsequent migration, proliferation, and differentiation of ECs into newly formed
capillaries (157). Newly formed vessels are stabilized in the resolution phase with the
establishment of a basement membrane, formation of junctional complexes and lining of
vessels with pericytes, resulting in the formation of well-organized, dichotomously
branched, even-diameter vessels.
Vascular resolution is incomplete in tumour angiogenesis leading to the formation
of irregular, dilated, tortuous and disorganized microvessels with partial endothelial
lining, fragmentary basement membrane, high permeability, inconsistent diameter, highly
branched structures and lack of differentiation (158, 159). Fenestrations within tumour
vessels make them leaky and highly permeable. In addition, the chaotic architecture of
tumour vessels are unevenly distributed within tumours leading to areas of high vascular
concentration (vascular hotspots) that usually localized at the periphery of the tumour and
areas of sparse vascular density that are often found in the tumour core (160). Although
tumour vessel formation is disorganized and unregulated, the ability to hastily form
microvessels is highly conducive to rapid tumour growth.
As a consequence of a disorganized vascular network and the absence of
functional lymphatics (161, 162), tumour cells have limited access to oxygen and
nutrients, and there is increased interstitial fluid pressure (163, 164). Interstitial fluid
pressure (IFP) in most normal non-diseased tissues is tightly regulated and remains close
to atmospheric levels (-3 to +3 mmHg). In solid malignant tumours, however, IFP is
often elevated. Measurements of IFP in a variety of human tumours including head and

40
neck, cervix and breast cancers, are typically in the range of 10-40 mmHg (164-166).
Although the causes of elevated IFP levels in tumours are not fully understood, they
likely involve blood vessel leakiness, the lack of functional lymphatics, interstitial
fibrosis and a contraction of the interstitial space mediated by stromal fibroblasts (167).
Poorly-formed tumour vasculature is associated with raised interstitial fluid pressure and
poor drug distribution, which markedly affect therapeutic response and lead to resistance.
1.7.3.1 The influence of tumour vasculature and increased interstitial fluid pressure on drug distribution
Because blood flow within tumours is slowand intermittent, the delivery of
therapeutics is inefficient. Many high-molecular weight anti-cancer drugs are transported
from the circulatory system through the interstitial space by convection rather than by
diffusion (168). Increased IFP contributes to decreased transcapillary transport in
tumours, and decreased uptake of drugs or therapeutic antibodies into the tumour. High
IFP is a major impeding factor on drug distribution preventing cancer cells from
acquiring effective drug concentrations and reducing overall therapeutic efficacy.
Approaches to improve blood flow, and thereby reduce IFP and overcome this
form of drug resistance, involve the use of VEGF antagonists, such as bevacizumab
(169), platelet-derived growth factors (PDGF) inhibitors (170), TGFβ antagonists (171),
hyaluronidase (172), and prostaglandin E1 (PGE1) (173). Inhibitors of VEGF and other
anti-angiogenic agents used in combination with chemotherapy in experimental and
clinical settings aim to eradicate two tumour subpopulations: tumour endothelial cells to
prevent the formation of new vessels, and tumour cells. Cytotoxic agents kill cancer cells
directly and anti-angiogenic agents kill cancer cells indirectly by depriving them of
nutrients. Some studies have shown, however, that by destroying vasculature, delivery of

41
oxygen and therapeutics to the tumour is severely compromised, decreasing the
effectiveness of chemotherapy agents as well as radiation (174-176). It has been
proposed that the judicious application of anti-VEGF agents can prune immature and
ineffective blood vessels, while sparing the more effective vessels. This effect of anti-
VEGF agents has been shown to decrease vessel permeability and lower IFP. In this
way, anti-VEGF agents might temporarily improve drug penetration in solid tumours
(177, 178). This process is referred to as vessel normalization and provides the rationale
for the use of antiangiogenic agents to enhance drug distribution and chemotherapeutic
efficacy. The theory of vascular normalization seems to be model dependent as other
studies have not been able to find such an effect (179).
PDGF controls the IFP of normal connective tissue by promoting interactions
between integrins of stromal fibroblasts with ECM molecules and by stimulating
contraction of these cells. PDGF inhibitors such as imatinib have been shown to lower
IFP and increase uptake of chemotherapeutic drugs by blocking these interactions (170).
It has been observed that the collagen-fiber network can affect IFP, and since TGFβ
promotes ECM formation, its antagonists might cause a decrease in tumour IFP by
reducing relative fibrosis in tumours (171). TGFβ may also have an effect of normalizing
blood vessels. Hyaluronidase acts by degrading hyaluronan, which is a high-molecular
weight polysaccharide that is an important constituent of the ECM to form large networks
with proteoglycans. Hyaluronan attracts water and causes tissue swelling, and so
degrading it is likely to alter the ECM and reducing the swelling and IFP (172). PGE1
was observed to lower IFP by decreasing the contractility of stromal fibroblasts (173).

42
Although many strategies to affect tumour vasculature and IFP have been
proposed, it is not possible to determine which approach has the best clinical potential.
Some methods exert their effects immediately, while others take longer, some may have
toxic effects on normal tissues, and some may actually promote tumour growth if not
used in combination with other therapeutics. While, abnormal tumour vasculature and
high interstitial fluid pressure are important modulators of drug distribution, mechanisms
to overcome this form of resistance have yet to be validated in the clinic.
1.7.4 Tumour Hypoxia
Due to the inconsistency in vessel formation and morphology, the rates of blood
flow may vary with location and time within a tumour. Along with abnormal
vasculature, there is compression of blood vessels by cancer cells, which increases
resistance to blood flow and impairs blood supply to the tumour (134). The limited
vasculature and the large distances between tumour cells and capillaries results in a
reduction of delivery of oxygen, leading to regions within tumours where oxygen
gradients fall to zero (180). Cells in hypoxic regions may be viable, but they are often
adjacent to regions of necrosis. Transient hypoxia is also common in tumours and results
from the temporary shutdown of blood vessels (132, 181).
Tumour hypoxia is an important mechanism of drug resistance. Resistance to
radiation is a well-known effect of hypoxia in solid tumours, but hypoxic cells may also
be resistant to most anticancer drugs for several reasons: first, hypoxic cells are distant
from blood vessels and, as a result, are not adequately exposed to some anticancer drugs
(182, 183); second, sustained hypoxia, together with low concentrations of nutrient
metabolites in hypoxic regions leads to inhibition of proliferation, and non-proliferating

43
cells are resistant to many anticancer drugs (184); third, hypoxia selects for cells that
have lost sensitivity to p53-mediated apoptosis, which might lessen sensitivity to some
anticancer agents; fourth, the action of some anticancer drugs resembles that of radiation
in that oxygen increases the cytotoxicity of DNA lesions they cause (185); fifth, hypoxia
up-regulates genes involved in drug resistance, including genes encoding PgP (186).
Thus, cells in chronically hypoxic regions are likely to be resistant to most anti-cancer
drugs.
1.7.4.1 Hypoxia as it relates to drug distribution
Fluctuations in blood flow that lead to transient hypoxia also lead to interruptions
in the delivery of drugs through the same blood vessels. As a result, the effect on overall
tumour sensitivity is likely to depend on the duration of the interruptions in blood flow
relative to the duration for which effective concentrations of the anticancer drug are
maintained in tumour blood vessels.
Some anticancer drugs generate free radicals that damage DNA. These drugs
accept electrons from sources within the cell and then transfer the electrons to oxygen
(187). Doxorubicin, for example, undergoes a chemical reduction to a semiquinone
radical which in turn reduces oxygen to a superoxide that may contribute to cytotoxicity
(188). Therefore drugs with limited distribution profiles such as doxorubicin are already
in low concentrations in regions of hypoxia, and with low oxygen concentrations their
activity is further reduced. An increasingly growing area of research is focussed on
developing agents that are activated under hypoxic conditions. Nontoxic pro-drugs can
be activated in a hypoxia-dependent manner. Essentially, hypoxia-selective cytotoxicity
requires one-electron reduction of a relatively non-toxic pro-drug to a radical that then

44
becomes a substrate for back-oxidation by oxygen to the original form. If the so-formed
radical or downstream products of the radical are much more toxic than the superoxide
generated by redox cycling in oxic cells, hypoxia-dependent cytotoxicity arises. These
pro-drugs can improve therapeutic index by complementing the selective activities of
radiotherapy for well-oxygenated cells and of chemotherapy for cells closer to blood
vessels. Tirapazamine was one of the first drugs to be developed specifically as a
hypoxic cytotoxin (189). Clinical trial results have shown conflicting results that may be
attributed to dose-limiting toxicities and the limited capacity of tirapazamine to penetrate
tumour tissue to reach the sensitive tumour cells (190-193). Other hypoxia-activated
agents such as AQ4N, PR-4, and TH-302 might have greater clinical potential because of
their ability to better penetrate into tissues. Drug distribution studies suggest that AQ4N
penetrates deep within experimental tumour tissue and selectively accumulates in
hypoxic tumour cells. Combination treatment with mitoxantrone which distributes
effectively in well-oxygenated regions of tumour (i.e. proximal to blood vessels), and
AQ4N to hypoxic regions results in effective drug distribution over the entire tumour
region (194). Thus agents that improve drug delivery or activity by targeting the tumour
microenvironment, especially in hypoxic regions of tumours, are likely to show more
promise in the clinical setting.
1.7.5 Tumour Acidity Compared to normal tissues, the microenvironment of most solid tumours is
acidic. Mechanisms leading to the acidic pH in tumours include environmental factors
that occur during tumour growth, such as: deficiencies in tumour perfusion, due to the
abnormal tumour vasculature, hypoxia and metabolic abnormalities associated with

45
transformation and uncontrolled cell growth, and possible increased capacity for
transmembrane pH regulation. Also, tumours may use glycolysis with the production of
lactate even under aerobic conditions, this is known as the Warburg hypothesis. Low
blood supply and hypoxia have been observed to translate to altered pH gradients
between the extracellular environment and the cytoplasm and between the cytoplasm and
the endolysosomal vesicles (195-197). As well, there is evidence that indicates that
hypoxia upregulates both the expression and activity of carbonic anhydrase in order to
enhance the extracellular acidification (198). An important mechanism of tumour acidity
is also through the production of lactate that occurs via glycolysis during anaerobic
metabolism. Through the upregulation of hypoxia-inducible factor 1-alpha (HIF1-α) and
the adaptation of a glycolytic phenotype with generation of lactate, tumour cells are
selected to be able to survive in a hypoxic-anoxic environment (199). These
environmental conditions favour the selection of highly malignant tumour cells that both
contribute to tumour progression and are increasingly resistant to a wide range of
chemotherapeutics.
The pH in the tumour microenvironment can also influence the cytotoxicity of
anticancer drugs. Low extracellular pH has the effect of decreasing the ionization of
weak acids and increasing the ionization of weak bases. Diffusion of drugs across the
cell membrane usually occurs in the uncharged form, so that low extracellular pH leads to
increased cellular uptake of weak acids (such as melphalan) and decreased cellular uptake
and activity of weak bases (such as doxorubicin) (136, 200).
As tumours have an acidic pH compared with normal tissues, alkalinization has a
greater effect on tumours compared with normal tissues and may be an area worth

46
exploiting for novel therapeutics. Alkalinizing treatment alone has no effect on growth
rates of tumours. This suggests that metabolic alkalosis may result in the enhancement of
antitumour activity for weakly basic chemotherapeutic drugs, while not enhancing the
toxicity to the host. In vitro alkalinisation may alter the homeostasis of human tumour
cells and this effect is consistent with in vivo sensitization of human tumours to cytotoxic
agents (197).
1.7.5.1 The effects of tumour acidity on drug distribution
The pH gradient between the cytoplasm and the intracellular organelles may also
be involved in resistance to anticancer drugs. The extracellular pH is often low in
tumours and the intracellular pH is more alkaline, and there is a strong pH gradient across
vesicular membranes of acidic organelles such as endosomes and lysosomes. Many
chemotherapeutic agents, such as the anthracyclines doxorubicin and daunorubicin,
vincristine, vinblastine, and mitoxantrone, are weak lipophilic bases. Since a substantial
fraction of these molecules are uncharged at normal intracellular pH, they are able to
freely penetrate the membranes of cytoplasmic organelles. When the drug encounters an
acidic environment, such as the interior of acidic vesicles, it is converted into a charged
form that is unable to cross internal membranes. This results in the sequestering and
accumulation of such anticancer drugs in these organelles. Tumour cells closest to blood
vessels receive the largest quantities of anticancer drugs. When drugs accumulate in the
organelles of tumour cells they are ineffective and result in less drug being available to
enter the nucleus to exert cytotoxic effects. Intracellular distribution is altered because of
drug sequestration in acidic vesicles such as endosomes. Due to the accumulation of
drug in tumour cells proximal to blood vessels, it is likely that less drug is available to

47
penetrate to cells distal from blood vessels in sufficient nuclear concentrations to cause
cell death (Figure 1.6). Thus, altered pH gradients in tumour cells are likely to be an
important factor in limiting drug distribution in solid tumours.
Agents that disrupt pH gradients in tumours may provide a strategy for
overcoming this type of drug resistance. One approach may be to inhibit the function of
the pumps that establish pH gradients. Vacuolar-H+-ATPases (V-H+-ATPases) represent
a major mechanism in the regulation of pH (201). V-H+-ATPases pump protons across
the membranes of intracellular compartments. Some human tumour cells, particularly
those exhibiting multidrug resistance, show enhanced V-H+-ATPase activity, and
increased acidity in intracellular vesicles (202, 203). Molecules that inhibit V-H+-
ATPases, such as proton pump inhibitors like omeprazole and pantoprazole, may reverse
tumour resistance to cytotoxic drugs by alkalinizing acidic vesicles and preventing drug
sequestration in these compartments (197, 204, 205). This approach may improve
intracellular and extracellular drug distribution in solid tumours and holds promise as an
effective method of overcoming drug resistance in some cancer patients (Figure 6).
Other agents such as chloroquine can neutralize acidic organelles by competing as a weak
base and potentially preventing drug sequestration.

48
Figure 1.6 Altered pH within tumour cells influences the intracellular distribution of basic anticancer drugs. When some drugs enter tumour cells proximal to blood vessels they are taken up into the nucleus as well as in acidic organelles such as endosomes (A). Drug molecules that are sequestered within endosomes are neither available to enter the nucleus to cause cell death nor are they available to distribute to cells distal from blood vessels (B).

49
1.7.6 Repopulation An additional cause of drug resistance that relates to the tumour
microenvironment is the repopulation of surviving tumour cells between courses of
chemotherapy. Chemotherapy schedules allow for the recovery and repopulation of
surviving cells in normal tissues (e.g.. bone-marrow stem cells). However, during this
period, repopulation of tumour cells also occurs, thereby increasing the number of tumour
cells that must be eradicated, and limiting the effectiveness of chemotherapy. Studies
have shown higher rates of proliferation of surviving tumour cells in chemotherapy
treated tumours compared to untreated controls (206). Models of repopulation during
courses of chemotherapy show that the rate of repopulation may increase in the intervals
between successive courses of treatment (207).
1.7.6.1 Repopulation and drug distribution
Studies investigating the spatial origins of cells that participate in accelerated
repopulation after treatment of multicellular tumour spheroids by chemotherapy show
that there is a gradient of decreasing cell proliferation with increasing distance from the
surface of spheroids, similar to that from tumour blood vessels (208-210). Most
anticancer drugs are preferentially toxic to proliferating cells that are usually located near
the tumour periphery or proximal to blood vessels. Therefore following chemotherapy,
tumour cells close to blood vessels are likely to be killed because of their higher rate of
proliferation, and better drug access. However, distal cells have the capacity to
proliferate and repopulate the tumour. Therefore it is important for distal cells to receive
cytotoxic concentrations of drug with each course of chemotherapy. . The problem of
repopulation is therefore exacerbated by limited drug distribution.

50
An approach to inhibiting repopulation in tumours may involve the use of
cytostatic molecular-targeted agents. Repopulation probably depends on the activation of
signalling pathways that stimulate the proliferation of tumour cells, and many molecular-
targeted agents have been developed that inhibit these pathways. One such pathway
involves the epidermal growth factor (EGFR). EGFR inhibitors such as gefinitib,
erlotinib and the monoclonal antibody cetuximab are examples of agents that have shown
some promise in the clinical setting. However, inhibition of repopulation by cytostatic
agents between cycles of chemotherapy that are more active against cycling cells is
complex and the outcome may greatly depend on treatment schedule. Combined
treatment of cytostatic and cytotoxic agents with the appropriate scheduling may
effectively sensitize tumours and circumvent this form of drug resistance (211).
1.8 METHODS FOR STUDYING DRUG DISTRIBUTION
1.8.1 In vitro models In vitro multicellular models can be used to assess drug distribution, and they
provide the 3-dimensional morphology of solid tumours that is lacking in monolayer
cultures. In monolayer cultures, drug exposure is homogenous to each cell and this is
quite different to the heterogeneity in drug concentration observed in solid tumours.
These 3-dimensional models do lack some of the features of solid tumours such as
extensive stroma, presence of vasculature and raised interstitial fluid pressure, and some
of them do closely model intracellular interactions and the tumour metabolic
environment. Solid tumours have large intercapillary distances and in vitro models can
mimic avascular regions of tumours and assess drug distribution through solid tumour

51
tissue. Although factors such as pharmacokinetics and hepatic metabolism are not
modelled by in vitro techniques, this may be advantageous to study drug distribution for
drug discovery and development without having to consider these complicating factors in
initial stages.
1.8.1.1 Spheroids
One approach to studying drug distribution of tumour microregions is to culture
cancer cells in the form of 3-dimensional multicellular spheroids that simulate
micrometastases and microregions of larger tumours (212-214). They are spherical
aggregates of tumour cells that grow in contact to form nodules in suspension culture
(Figure 1.7). This tumour model is intermediate in complexity between standard 2-
dimensional monolayer cultures in vitro and solid tumours in vivo. Similar to solid
tumours, spheroids show properties such as development of an ECM, tight junctions
between epithelial cells and gradients of nutrient concentration and cell proliferation from
the exterior to the centre (212). Larger spheroids show heterogeneous cell populations
with a necrotic core surrounded by a viable yet quiescent rim of cells and proliferating
cells in the outer 3-5 cell layers (213, 215, 216). The distribution of fluorescent or
radiolabelled drugs has been studied in spheroids (217-220). Penetration of a drug
through tissue can be measured by adding the drug to the media and assessing the
penetration of the drug through the spheroid using fluorescent imaging techniques.
Investigations using this method have indicated poor penetration within tumour tissue of
several drugs including doxorubicin and methotrexate (212, 221). These studies showed
that poor distribution of such drugs was due to rapid binding by cells in the outer layer of
spheroids.

52
1.8.1.2 Multilayered Cell Cultures
Quantitative assessment of drug distribution is limited in spheroids. A
conceptually simple technique was established by Wilson et al., that allows the direct
assessment of tissue penetration by anticancer drugs (222). Tumour cells are grown on a
collagen-coated microporous Teflon membrane as a multilayered cell culture (MCC) that
has similar characteristics to tumour tissue in vivo. MCCs typically achieve a thickness
of ~200µm, similar to the maximum distance between blood vessels and necrosis in
human tumours (223). Similar to spheroids, MCCs have been shown to reflect many of
the properties of solid tumours, including the generation of an ECM, gradients of nutrient
concentration and cell proliferation and regions of hypoxia and necrosis in thicker layers
(224-226). To examine the penetration of an index drug, the compound is added on one
side of the MCC, and its appearance on the other side of the MCC is measured by
appropriate analytical methods (Figure 7). Since drugs must move through the cell layers
and into the receiving reservoir, this model permits direct assessment of penetration of
drugs through tumour tissue as a function of time (227). MCCs can also be sectioned and
the distribution of fluorescent drugs can be visualized directly. Previous studies have
shown poor penetration of many commonly used anticancer drugs, such as doxorubicin
and 5-fluoruracil, through MCCs generated from several human and murine cell lines
(224, 228). Using this model system, it has been established that cells close to the source
of drug are exposed to high concentrations, whereas distal cells are likely to experience
only low concentrations of drug. Cells distal from blood vessels are likely to have
minimal drug available for uptake.

53
Figure 7. In vitro models to study drug distribution include multicellular spheroids (A), and multilayered cell cultures (MCCs) (B). The set up of MCCs allows for quantitative measurements of drug penetration as a function of time (C).

54
1.8.2 In vivo models Pharmacokinetic studies attempt to quantify total drug concentrations in tumours
using high performance liquid chromatography (HPLC) or mass spectrometry. These
analytical methods are able to measure mean drug concentration within solid tumours as
a function of time, and to distinguish between the parent compound and its metabolic
products. However, these methods do not assess drug distribution within tumours
because they do not provide a spatial representation of drug distribution. Large drug
concentrations in cells proximal to blood vessels with minimal to no drug in distal cells
may average to adequate levels in the tumour as a whole. However, it is important for
adequate concentrations of drug to reach all viable cells.
Initial studies of drug distribution in solid tumours used the auto-fluorescent drug
doxorubicin (229). The spatial distribution of doxorubicin relative to blood vessels was
first assessed in breast tumour biopsies by overlaying digital images of doxorubicin with
immunostained images of endothelial cells (stained with CD31 antibody) using
fluorescence microscopy (230). Studies in our laboratory have used this method to
generate gradients of drug distribution in relation to blood vessels in solid tumours
extracted from subcutaneous mouse models. Drug distribution profiles are overlaid with
blood vessels and these composite images are quantified using sophisticated algorithms.
In our laboratory, this algorithm calculates the intensity of every pixel, its distance from
the nearest blood vessel and then sums thes over defined regions of interest in a tumour
section. Markers of hypoxia, such as EF5, can also be injected to enable the recognition
of hypoxic regions using a fluorescent-labelled antibody applied to the same sections.
As well, markers of blood flow such as Hoescht 33342, lectins, or DiOC7, can be
55
injected into mice just prior to tumour extraction to visualize functional blood vessels.
Studies in our laboratory have used this method to quantify doxorubicin distribution in
relation to blood vessels in xenografts and have shown that doxorubicin intensity
decreases to half at approximately 40-50μm from the nearest blood vessels such that
many viable cells are not exposed to detectable concentrations of drug after a single
injection (231). Using this method of overlaying drug fluorescence with blood vessels
and hypoxic regions, photomicrographs can also be generated to qualitatively assess drug
distribution in solid tumours (Figure 1.8).

56
Figure 1.8 Photomicrograph of doxorubicin distribution in a 16C mouse mammary tumour xenograft. Ten minutes after drug administration, doxorubicin fluorescence (blue) is observed mostly in regions proximal to blood vessels (red). There are large regions of viable cells between blood vessels and hypoxic regions (green) that show little to no drug. (Adapted from Primeau et al., 2005; (231)).

57
1.9 RATIONALE
A large research effort has been devoted to understanding the multifactorial
causes of drug resistance. Most of the literature has emphasized cellular and molecular
causes of resistance, and although understanding these factors is essential for the
development of novel treatment strategies, mechanisms related to the microenvironment
of solid tumours may also have a profound effect on the sensitivity of tumours to
chemotherapeutic agents. Drug distribution is likely to be an important cause of drug
resistance since large numbers of tumour cells receive little to no drug. Vascular
structure and function in tumours is different to that in normal tissue; tumour vessels are
observed to be leaky, often tortuous and highly permeable (137). These abnormalities
result in irregular blood flow and high interstitial fluid pressure within the tumour, which
can impair the delivery of oxygen (a known radiation sensitizer) and drugs to the tumour.
Cellular uptake of anticancer drugs in cells proximal to blood vessels, leaves less drug
available for distribution to more distal cells. Drug efflux pumps such as P-glycoprotein
prevent cellular accumulation of drugs by their active removal from cells, and have been
shown to alter drug penetration in MCCs (232). However, it is unclear whether this
applies to solid tumours and whether quantitative fluorescence microscopy of solid
tumour sections is sufficiently sensitive to detect changes in drug distribution. Increased
cellular uptake of basic drugs may be due to their sequestration in acidic compartments
such as endosomes, where they are not thought to exert cytotoxic effects (204, 233, 234).
Such uptake and sequestration may limit the amount of drug that is available to distal
cells. Obtaining information about the factors that affect drug distribution is important
because from these studies a potential strategy to improve drug distribution may be

58
found. Since vascular access is far more limited in tumours than in normal tissues,
strategies to improve drug distribution are likely to have a much greater effect on tumour
growth delay than on toxicity to normal tissues, and may be expected to improve the
therapeutic index. One potential strategy to improve drug distribution in solid tumour
tissue involves the inhibition of the sequestration of basic anti-cancer drugs in acidic
compartments.
In this thesis, I have undertaken studies to gain insight as to how drug distribution
differs between normal and tumour tissue, whether drug distribution within solid tumours
is modifiable, and whether there are agents that can overcome specific limiting factors,
enhance drug distribution, and improve therapeutic efficacy of the anticancer drug
doxorubicin.
1.10 HYPOTHESES 1. The distribution of anticancer drugs from blood vessels is better in normal tissues,
such as the heart and liver compared to the distribution in solid tumours.
2. The distribution of doxorubicin in solid tumours is increased if tumour cells
express high levels PgP, and decreased by agents that inhibit the function of PgP
3. The distribution of doxorubicin in solid tumours is improved by pre-treatment
with the agent pantoprazole, which inhibits sequestration of basic drugs in acidic
endosomes of cells.

59
1.11 OBJECTIVES & SPECIFIC AIMS
The aims of this thesis are to assess the distribution of anticancer drugs in normal
tissues and tumour tissue, determine the effect of altered cellular uptake due to P-
glycoprotein on drug distribution in tumour tissue and to evaluate whether inhibition of
drug sequestration can improve drug distribution in solid tumours and enhance tumour
growth delay.
Objectives:
I. To qualitatively and quantitatively compare the distribution of three anti-
cancer drugs in normal tissue versus tumour tissue over time
II. To determine whether PgP overexpression alters drug distribution in solid
tumours and establish whether changes in drug distribution can be
quantified in experimental tumours
III. To evaluate the effect of pantoprazole pre-treatment on distribution and
activity of doxorubicin in solid tumours

60
1.12 REFERENCES
1. Tannock I, Hill, RP, Bristow, RG, Harrington, L. The Basic Science of Oncology. Toronto: McGraw-Hill: Medical Publishing Division; 2005. 2. Steel GG, Peckham MJ. Exploitable mechanisms in combined radiotherapy-chemotherapy: the concept of additivity. Int J Radiat Oncol Biol Phys 1979;5(1):85-91. 3. Hall AG, Tilby MJ. Mechanisms of action of, and modes of resistance to, alkylating agents used in the treatment of haematological malignancies. Blood reviews 1992;6(3):163-73. 4. Roberts JJ, Brent TP, Crathorn AR. The mechanism of the cytotoxic action of alkylating agents in mammalian cells. In: Campbell PN, editor. The interaction of drugs and subcellular components in animal cells. London: Churchill; 1968. p. 5-27. 5. Rosenberg B, Van Camp L, Grimley EB, Thomson AJ. The inhibition of growth or cell division in Escherichia coli by different ionic species of platinum(IV) complexes. The Journal of biological chemistry 1967;242(6):1347-52. 6. Rosenberg B, Vancamp L, Krigas T. Inhibition of Cell Division in Escherichia Coli by Electrolysis Products from a Platinum Electrode. Nature 1965;205:698-9. 7. Gewirtz DA. A critical evaluation of the mechanisms of action proposed for the antitumor effects of the anthracycline antibiotics adriamycin and daunorubicin. Biochemical pharmacology 1999;57(7):727-41. 8. Plooy AC, van Dijk M, Lohman PH. Induction and repair of DNA cross-links in chinese hamster ovary cells treated with various platinum coordination compounds in relation to platinum binding to DNA, cytotoxicity, mutagenicity, and antitumor activity. Cancer research 1984;44(5):2043-51. 9. Zwelling LA, Michaels S, Schwartz H, Dobson PP, Kohn KW. DNA cross-linking as an indicator of sensitivity and resistance of mouse L1210 leukemia to cis-diamminedichloroplatinum(II) and L-phenylalanine mustard. Cancer research 1981;41(2):640-9. 10. Ozols RF, Bundy BN, Greer BE, et al. Phase III trial of carboplatin and paclitaxel compared with cisplatin and paclitaxel in patients with optimally resected stage III ovarian cancer: a Gynecologic Oncology Group study. J Clin Oncol 2003;21(17):3194-200. 11. Wagner AD, Schneider PM, Fleig WE. The role of chemotherapy in patients with established gastric cancer. Best practice & research 2006;20(4):789-99. 12. Kaye SB. New antimetabolites in cancer chemotherapy and their clinical impact. British journal of cancer 1998;78 Suppl 3:1-7. 13. Jolivet J, Cowan KH, Curt GA, Clendeninn NJ, Chabner BA. The pharmacology and clinical use of methotrexate. The New England journal of medicine 1983;309(18):1094-104. 14. Gellert M. DNA topoisomerases. Annual review of biochemistry 1981;50:879-910. 15. Halligan BD, Edwards KA, Liu LF. Purification and characterization of a type II DNA topoisomerase from bovine calf thymus. The Journal of biological chemistry 1985;260(4):2475-82.

61
16. Liu LF. DNA topoisomerase poisons as antitumor drugs. Annual review of biochemistry 1989;58:351-75. 17. Wang JC. DNA topoisomerases. Annual review of biochemistry 1985;54:665-97. 18. Chen AY, Liu LF. DNA topoisomerases: essential enzymes and lethal targets. Annual review of pharmacology and toxicology 1994;34:191-218. 19. D'Arpa P, Beardmore C, Liu LF. Involvement of nucleic acid synthesis in cell killing mechanisms of topoisomerase poisons. Cancer research 1990;50(21):6919-24. 20. De Isabella P, Capranico G, Palumbo M, Sissi C, Krapcho AP, Zunino F. Sequence selectivity of topoisomerase II DNA cleavage stimulated by mitoxantrone derivatives: relationships to drug DNA binding and cellular effects. Molecular pharmacology 1993;43(5):715-21. 21. Gewirtz DA. Does bulk damage to DNA explain the cytostatic and cytotoxic effects of topoisomerase II inhibitors? Biochemical pharmacology 1991;42(12):2253-8. 22. Duguet M, Lavenot C, Harper F, Mirambeau G, De Recondo AM. DNA topoisomerases from rat liver: physiological variations. Nucleic acids research 1983;11(4):1059-75. 23. Heck MM, Hittelman WN, Earnshaw WC. Differential expression of DNA topoisomerases I and II during the eukaryotic cell cycle. Proceedings of the National Academy of Sciences of the United States of America 1988;85(4):1086-90. 24. Pommier Y. DNA topoisomerase I and II in cancer chemotherapy: update and perspectives. Cancer Chemother Pharmacol 1993;32(2):103-8. 25. Gordon AN, Fleagle JT, Guthrie D, Parkin DE, Gore ME, Lacave AJ. Recurrent epithelial ovarian carcinoma: a randomized phase III study of pegylated liposomal doxorubicin versus topotecan. J Clin Oncol 2001;19(14):3312-22. 26. von Pawel J, Schiller JH, Shepherd FA, et al. Topotecan versus cyclophosphamide, doxorubicin, and vincristine for the treatment of recurrent small-cell lung cancer. J Clin Oncol 1999;17(2):658-67. 27. Douillard JY, Cunningham D, Roth AD, et al. Irinotecan combined with fluorouracil compared with fluorouracil alone as first-line treatment for metastatic colorectal cancer: a multicentre randomised trial. Lancet 2000;355(9209):1041-7. 28. Saltz LB, Cox JV, Blanke C, et al. Irinotecan plus fluorouracil and leucovorin for metastatic colorectal cancer. Irinotecan Study Group. The New England journal of medicine 2000;343(13):905-14. 29. Hsiang YH, Wu HY, Liu LF. Proliferation-dependent regulation of DNA topoisomerase II in cultured human cells. Cancer research 1988;48(11):3230-5. 30. Hwang JL, Shyy SH, Chen AY, Juan CC, Whang-Peng J. Studies of topoisomerase-specific antitumor drugs in human lymphocytes using rabbit antisera against recombinant human topoisomerase II polypeptide. Cancer research 1989;49(4):958-62. 31. Rowinsky EaD, R. Cancer Chemotherapy and Biotherapy. Philadelphia: Lippinscott; 1996. 32. Rowinsky EK, Donehower RC. Paclitaxel (taxol). The New England journal of medicine 1995;332(15):1004-14. 33. Hong WK, Sporn MB. Recent advances in chemoprevention of cancer. Science 1997;278(5340):1073-7.

62
34. Chames P, Van Regenmortel M, Weiss E, Baty D. Therapeutic antibodies: successes, limitations and hopes for the future. British journal of pharmacology 2009;157(2):220-33. 35. Barinaga M. From bench top to bedside. Science 1997;278(5340):1036-9. 36. Nabholtz JM, Slamon D. New adjuvant strategies for breast cancer: meeting the challenge of integrating chemotherapy and trastuzumab (Herceptin). Semin Oncol 2001;28(1 Suppl 3):1-12. 37. Pastan II, Kreitman RJ. Immunotoxins for targeted cancer therapy. Adv Drug Deliv Rev 1998;31(1-2):53-88. 38. Druker BJ, Sawyers CL, Kantarjian H, et al. Activity of a specific inhibitor of the BCR-ABL tyrosine kinase in the blast crisis of chronic myeloid leukemia and acute lymphoblastic leukemia with the Philadelphia chromosome. The New England journal of medicine 2001;344(14):1038-42. 39. Gottesman MM. Mechanisms of cancer drug resistance. Annu Rev Med 2002;53:615-27. 40. Longo-Sorbello GS, Bertino JR. Current understanding of methotrexate pharmacology and efficacy in acute leukemias. Use of newer antifolates in clinical trials. Haematologica 2001;86(2):121-7. 41. Gately DP, Howell SB. Cellular accumulation of the anticancer agent cisplatin: a review. British journal of cancer 1993;67(6):1171-6. 42. Johnson SW, Laub PB, Beesley JS, Ozols RF, Hamilton TC. Increased platinum-DNA damage tolerance is associated with cisplatin resistance and cross-resistance to various chemotherapeutic agents in unrelated human ovarian cancer cell lines. Cancer research 1997;57(5):850-6. 43. Twentyman PR, Wright KA, Mistry P, Kelland LR, Murrer BA. Sensitivity to novel platinum compounds of panels of human lung cancer cell lines with acquired and inherent resistance to cisplatin. Cancer research 1992;52(20):5674-80. 44. Kuo MT, Chen HH, Song IS, Savaraj N, Ishikawa T. The roles of copper transporters in cisplatin resistance. Cancer Metastasis Rev 2007;26(1):71-83. 45. Ishida S, Lee J, Thiele DJ, Herskowitz I. Uptake of the anticancer drug cisplatin mediated by the copper transporter Ctr1 in yeast and mammals. Proceedings of the National Academy of Sciences of the United States of America 2002;99(22):14298-302. 46. Lyall RM, Hwang JL, Cardarelli C, et al. Isolation of human KB cell lines resistant to epidermal growth factor-Pseudomonas exotoxin conjugates. Cancer research 1987;47(11):2961-6. 47. Krishna R, Mayer LD. Multidrug resistance (MDR) in cancer. Mechanisms, reversal using modulators of MDR and the role of MDR modulators in influencing the pharmacokinetics of anticancer drugs. Eur J Pharm Sci 2000;11(4):265-83. 48. Ambudkar SV, Dey S, Hrycyna CA, Ramachandra M, Pastan I, Gottesman MM. Biochemical, cellular, and pharmacological aspects of the multidrug transporter. Annual review of pharmacology and toxicology 1999;39:361-98. 49. Willingham MC, Richert ND, Cornwell MM, et al. Immunocytochemical localization of P170 at the plasma membrane of multidrug-resistant human cells. J Histochem Cytochem 1987;35(12):1451-6. 50. Thiebaut F, Tsuruo T, Hamada H, Gottesman MM, Pastan I, Willingham MC. Cellular localization of the multidrug-resistance gene product P-glycoprotein in normal

63
human tissues. Proceedings of the National Academy of Sciences of the United States of America 1987;84(21):7735-8. 51. Fardel O, Lecureur V, Guillouzo A. The P-glycoprotein multidrug transporter. General pharmacology 1996;27(8):1283-91. 52. Kruh GD, Gaughan KT, Godwin A, Chan A. Expression pattern of MRP in human tissues and adult solid tumor cell lines. Journal of the National Cancer Institute 1995;87(16):1256-8. 53. Kuwano M, Toh S, Uchiumi T, Takano H, Kohno K, Wada M. Multidrug resistance-associated protein subfamily transporters and drug resistance. Anti-cancer drug design 1999;14(2):123-31. 54. Marbeuf-Gueye C, Broxterman HJ, Dubru F, Priebe W, Garnier-Suillerot A. Kinetics of anthracycline efflux from multidrug resistance protein-expressing cancer cells compared with P-glycoprotein-expressing cancer cells. Molecular pharmacology 1998;53(1):141-7. 55. Renes J, de Vries EG, Nienhuis EF, Jansen PL, Muller M. ATP- and glutathione-dependent transport of chemotherapeutic drugs by the multidrug resistance protein MRP1. British journal of pharmacology 1999;126(3):681-8. 56. Jedlitschky G, Leier I, Buchholz U, Barnouin K, Kurz G, Keppler D. Transport of glutathione, glucuronate, and sulfate conjugates by the MRP gene-encoded conjugate export pump. Cancer research 1996;56(5):988-94. 57. Boumendjel A, Baubichon-Cortay H, Trompier D, Perrotton T, Di Pietro A. Anticancer multidrug resistance mediated by MRP1: recent advances in the discovery of reversal agents. Medicinal research reviews 2005;25(4):453-72. 58. Hooijberg JH, Broxterman HJ, Scheffer GL, et al. Potent interaction of flavopiridol with MRP1. British journal of cancer 1999;81(2):269-76. 59. Wang S, Folkes A, Chuckowree I, et al. Studies on pyrrolopyrimidines as selective inhibitors of multidrug-resistance-associated protein in multidrug resistance. J Med Chem 2004;47(6):1329-38. 60. Wang S, Wan NC, Harrison J, et al. Design and synthesis of new templates derived from pyrrolopyrimidine as selective multidrug-resistance-associated protein inhibitors in multidrug resistance. J Med Chem 2004;47(6):1339-50. 61. Chan HS, Haddad G, Thorner PS, et al. P-glycoprotein expression as a predictor of the outcome of therapy for neuroblastoma. The New England journal of medicine 1991;325(23):1608-14. 62. Chan HS, Thorner PS, Haddad G, Ling V. Immunohistochemical detection of P-glycoprotein: prognostic correlation in soft tissue sarcoma of childhood. J Clin Oncol 1990;8(4):689-704. 63. Ferry DR, Traunecker H, Kerr DJ. Clinical trials of P-glycoprotein reversal in solid tumours. Eur J Cancer 1996;32A(6):1070-81. 64. Morrow CS, Cowan KH. Drug resistance and its clinical circumvention. In: Holland JF, Frei E, Bast JC, Kufe DW, Morton DL, Weichselbaum RR, editors. Cancer Medicine. 4th ed: Williams & Wilkins; 2005. p. 799-815. 65. Advani R, Fisher GA, Lum BL, et al. A phase I trial of doxorubicin, paclitaxel, and valspodar (PSC 833), a modulator of multidrug resistance. Clin Cancer Res 2001;7(5):1221-9.

64
66. Baekelandt M, Lehne G, Trope CG, et al. Phase I/II trial of the multidrug-resistance modulator valspodar combined with cisplatin and doxorubicin in refractory ovarian cancer. J Clin Oncol 2001;19(12):2983-93. 67. Fracasso PM, Brady MF, Moore DH, et al. Phase II study of paclitaxel and valspodar (PSC 833) in refractory ovarian carcinoma: a gynecologic oncology group study. J Clin Oncol 2001;19(12):2975-82. 68. Fracasso PM, Westervelt P, Fears CL, et al. Phase I study of paclitaxel in combination with a multidrug resistance modulator, PSC 833 (Valspodar), in refractory malignancies. J Clin Oncol 2000;18(5):1124-34. 69. Giaccone G, Linn SC, Welink J, et al. A dose-finding and pharmacokinetic study of reversal of multidrug resistance with SDZ PSC 833 in combination with doxorubicin in patients with solid tumors. Clin Cancer Res 1997;3(11):2005-15. 70. Twentyman PR, Bleehen NM. Resistance modification by PSC-833, a novel non-immunosuppressive cyclosporin [corrected]. Eur J Cancer 1991;27(12):1639-42. 71. Thomas H, Coley HM. Overcoming multidrug resistance in cancer: an update on the clinical strategy of inhibiting p-glycoprotein. Cancer Control 2003;10(2):159-65. 72. Fischer V, Rodriguez-Gascon A, Heitz F, et al. The multidrug resistance modulator valspodar (PSC 833) is metabolized by human cytochrome P450 3A. Implications for drug-drug interactions and pharmacological activity of the main metabolite. Drug metabolism and disposition: the biological fate of chemicals 1998;26(8):802-11. 73. Rowinsky EK, Smith L, Wang YM, et al. Phase I and pharmacokinetic study of paclitaxel in combination with biricodar, a novel agent that reverses multidrug resistance conferred by overexpression of both MDR1 and MRP. J Clin Oncol 1998;16(9):2964-76. 74. Wandel C, Kim RB, Kajiji S, Guengerich P, Wilkinson GR, Wood AJ. P-glycoprotein and cytochrome P-450 3A inhibition: dissociation of inhibitory potencies. Cancer research 1999;59(16):3944-8. 75. Martin C, Berridge G, Mistry P, Higgins C, Charlton P, Callaghan R. The molecular interaction of the high affinity reversal agent XR9576 with P-glycoprotein. British journal of pharmacology 1999;128(2):403-11. 76. Pusztai L, Wagner P, Ibrahim N, et al. Phase II study of tariquidar, a selective P-glycoprotein inhibitor, in patients with chemotherapy-resistant, advanced breast carcinoma. Cancer 2005;104(4):682-91. 77. Tunggal JK, Melo T, Ballinger JR, Tannock IF. The influence of expression of P-glycoprotein on the penetration of anticancer drugs through multicellular layers. Int J Cancer 2000;86(1):101-7. 78. Mannervik B, Jensson H. Binary combinations of four protein subunits with different catalytic specificities explain the relationship between six basic glutathione S-transferases in rat liver cytosol. The Journal of biological chemistry 1982;257(17):9909-12. 79. Hao XY, Widersten M, Ridderstrom M, Hellman U, Mannervik B. Co-variation of glutathione transferase expression and cytostatic drug resistance in HeLa cells: establishment of class Mu glutathione transferase M3-3 as the dominating isoenzyme. The Biochemical journal 1994;297 ( Pt 1):59-67.

65
80. Lewis AD, Forrester LM, Hayes JD, et al. Glutathione S-transferase isoenzymes in human tumours and tumour derived cell lines. British journal of cancer 1989;60(3):327-31. 81. Batist G, Tulpule A, Sinha BK, Katki AG, Myers CE, Cowan KH. Overexpression of a novel anionic glutathione transferase in multidrug-resistant human breast cancer cells. The Journal of biological chemistry 1986;261(33):15544-9. 82. Chao CC, Huang YT, Ma CM, Chou WY, Lin-Chao S. Overexpression of glutathione S-transferase and elevation of thiol pools in a multidrug-resistant human colon cancer cell line. Molecular pharmacology 1992;41(1):69-75. 83. Raghu G, Pierre-Jerome M, Dordal MS, Simonian P, Bauer KD, Winter JN. P-glycoprotein and alterations in the glutathione/glutathione-peroxidase cycle underlie doxorubicin resistance in HL-60-R, a subclone of the HL-60 human leukemia cell line. Int J Cancer 1993;53(5):804-11. 84. Barnouin K, Leier I, Jedlitschky G, et al. Multidrug resistance protein-mediated transport of chlorambucil and melphalan conjugated to glutathione. British journal of cancer 1998;77(2):201-9. 85. Black SM, Beggs JD, Hayes JD, et al. Expression of human glutathione S-transferases in Saccharomyces cerevisiae confers resistance to the anticancer drugs adriamycin and chlorambucil. The Biochemical journal 1990;268(2):309-15. 86. Beaumont PO, Moore MJ, Ahmad K, Payne MM, Lee C, Riddick DS. Role of glutathione S-transferases in the resistance of human colon cancer cell lines to doxorubicin. Cancer research 1998;58(5):947-55. 87. Meister A, Anderson ME. Glutathione. Annual review of biochemistry 1983;52:711-60. 88. Goddard P, Valenti M, Kelland LR. The role of glutathione (GSH) in determining sensitivity to platinum drugs in vivo in platinum-sensitive and -resistant murine leukaemia and plasmacytoma and human ovarian carcinoma xenografts. Anticancer Res 1994;14(3A):1065-70. 89. Ross W, Rowe T, Glisson B, Yalowich J, Liu L. Role of topoisomerase II in mediating epipodophyllotoxin-induced DNA cleavage. Cancer research 1984;44(12 Pt 1):5857-60. 90. Tewey KM, Rowe TC, Yang L, Halligan BD, Liu LF. Adriamycin-induced DNA damage mediated by mammalian DNA topoisomerase II. Science 1984;226(4673):466-8. 91. Mattern MR, Hofmann GA, McCabe FL, Johnson RK. Synergistic cell killing by ionizing radiation and topoisomerase I inhibitor topotecan (SK&F 104864). Cancer research 1991;51(21):5813-6. 92. Matsuo K, Kohno K, Takano H, Sato S, Kiue A, Kuwano M. Reduction of drug accumulation and DNA topoisomerase II activity in acquired teniposide-resistant human cancer KB cell lines. Cancer research 1990;50(18):5819-24. 93. Tan KB, Mattern MR, Eng WK, McCabe FL, Johnson RK. Nonproductive rearrangement of DNA topoisomerase I and II genes: correlation with resistance to topoisomerase inhibitors. Journal of the National Cancer Institute 1989;81(22):1732-5. 94. Sugimoto Y, Tsukahara S, Oh-hara T, Liu LF, Tsuruo T. Elevated expression of DNA topoisomerase II in camptothecin-resistant human tumor cell lines. Cancer research 1990;50(24):7962-5.

66
95. Aisner J, Musanti R, Beers S, Smith S, Locsin S, Rubin EH. Sequencing topotecan and etoposide plus cisplatin to overcome topoisomerase I and II resistance: a pharmacodynamically based Phase I trial. Clin Cancer Res 2003;9(7):2504-9. 96. Gorlick R, Goker E, Trippett T, Waltham M, Banerjee D, Bertino JR. Intrinsic and acquired resistance to methotrexate in acute leukemia. The New England journal of medicine 1996;335(14):1041-8. 97. Haber M, Burkhart CA, Regl DL, Madafiglio J, Norris MD, Horwitz SB. Altered expression of M beta 2, the class II beta-tubulin isotype, in a murine J774.2 cell line with a high level of taxol resistance. The Journal of biological chemistry 1995;270(52):31269-75. 98. Kavallaris M, Tait AS, Walsh BJ, et al. Multiple microtubule alterations are associated with Vinca alkaloid resistance in human leukemia cells. Cancer research 2001;61(15):5803-9. 99. Goncalves A, Braguer D, Kamath K, et al. Resistance to Taxol in lung cancer cells associated with increased microtubule dynamics. Proceedings of the National Academy of Sciences of the United States of America 2001;98(20):11737-42. 100. Giannakakou P, Sackett DL, Kang YK, et al. Paclitaxel-resistant human ovarian cancer cells have mutant beta-tubulins that exhibit impaired paclitaxel-driven polymerization. The Journal of biological chemistry 1997;272(27):17118-25. 101. Gonzalez-Garay ML, Chang L, Blade K, Menick DR, Cabral F. A beta-tubulin leucine cluster involved in microtubule assembly and paclitaxel resistance. The Journal of biological chemistry 1999;274(34):23875-82. 102. Wang Y, O'Brate A, Zhou W, Giannakakou P. Resistance to microtubule-stabilizing drugs involves two events: beta-tubulin mutation in one allele followed by loss of the second allele. Cell cycle (Georgetown, Tex 2005;4(12):1847-53. 103. Bollag DM, McQueney PA, Zhu J, et al. Epothilones, a new class of microtubule-stabilizing agents with a taxol-like mechanism of action. Cancer research 1995;55(11):2325-33. 104. Lee FY, Borzilleri R, Fairchild CR, et al. BMS-247550: a novel epothilone analog with a mode of action similar to paclitaxel but possessing superior antitumor efficacy. Clin Cancer Res 2001;7(5):1429-37. 105. Kelley MR, Fishel ML. DNA repair proteins as molecular targets for cancer therapeutics. Anti-cancer agents in medicinal chemistry 2008;8(4):417-25. 106. Ding J, Miao ZH, Meng LH, Geng MY. Emerging cancer therapeutic opportunities target DNA-repair systems. Trends in pharmacological sciences 2006;27(6):338-44. 107. Gerson SL. Clinical relevance of MGMT in the treatment of cancer. J Clin Oncol 2002;20(9):2388-99. 108. Gerson SL. MGMT: its role in cancer aetiology and cancer therapeutics. Nat Rev Cancer 2004;4(4):296-307. 109. Gonzaga PE, Potter PM, Niu TQ, et al. Identification of the cross-link between human O6-methylguanine-DNA methyltransferase and chloroethylnitrosourea-treated DNA. Cancer research 1992;52(21):6052-8. 110. Kaufmann SH, Vaux DL. Alterations in the apoptotic machinery and their potential role in anticancer drug resistance. Oncogene 2003;22(47):7414-30.

67
111. Walton MI, Whysong D, O'Connor PM, Hockenbery D, Korsmeyer SJ, Kohn KW. Constitutive expression of human Bcl-2 modulates nitrogen mustard and camptothecin induced apoptosis. Cancer research 1993;53(8):1853-61. 112. Del Poeta G, Venditti A, Del Principe MI, et al. Amount of spontaneous apoptosis detected by Bax/Bcl-2 ratio predicts outcome in acute myeloid leukemia (AML). Blood 2003;101(6):2125-31. 113. Karakas T, Maurer U, Weidmann E, Miething CC, Hoelzer D, Bergmann L. High expression of bcl-2 mRNA as a determinant of poor prognosis in acute myeloid leukemia. Ann Oncol 1998;9(2):159-65. 114. Reed JC. Bcl-2: prevention of apoptosis as a mechanism of drug resistance. Hematology/oncology clinics of North America 1995;9(2):451-73. 115. Yamanaka K, Rocchi P, Miyake H, et al. Induction of apoptosis and enhancement of chemosensitivity in human prostate cancer LNCaP cells using bispecific antisense oligonucleotide targeting Bcl-2 and Bcl-xL genes. BJU international 2006;97(6):1300-8. 116. Yamanaka K, Rocchi P, Miyake H, et al. A novel antisense oligonucleotide inhibiting several antiapoptotic Bcl-2 family members induces apoptosis and enhances chemosensitivity in androgen-independent human prostate cancer PC3 cells. Mol Cancer Ther 2005;4(11):1689-98. 117. Lowe SW, Ruley HE, Jacks T, Housman DE. p53-dependent apoptosis modulates the cytotoxicity of anticancer agents. Cell 1993;74(6):957-67. 118. Miyashita T, Krajewski S, Krajewska M, et al. Tumor suppressor p53 is a regulator of bcl-2 and bax gene expression in vitro and in vivo. Oncogene 1994;9(6):1799-805. 119. Fojo T. Cancer, DNA repair mechanisms, and resistance to chemotherapy. Journal of the National Cancer Institute 2001;93(19):1434-6. 120. Rantanen V, Engblom P, Raitanen M, et al. Mutations of TP53 do not correlate with the sensitivity to paclitaxel--a study using 27 gynaecological cancer cell lines. Eur J Cancer 2002;38(13):1783-91. 121. Tannock IF, Lee C. Evidence against apoptosis as a major mechanism for reproductive cell death following treatment of cell lines with anti-cancer drugs. British journal of cancer 2001;84(1):100-5. 122. Brown JM, Wouters BG. Apoptosis, p53, and tumor cell sensitivity to anticancer agents. Cancer research 1999;59(7):1391-9. 123. Joensuu H, Pylkkanen L, Toikkanen S. Bcl-2 protein expression and long-term survival in breast cancer. The American journal of pathology 1994;145(5):1191-8. 124. Tannock IF. Tumor physiology and drug resistance. Cancer Metastasis Rev 2001;20(1-2):123-32. 125. Danesi R, Fogli S, Gennari A, Conte P, Del Tacca M. Pharmacokinetic-pharmacodynamic relationships of the anthracycline anticancer drugs. Clin Pharmacokinet 2002;41(6):431-44. 126. Tosoni A, Ermani M, Brandes AA. The pathogenesis and treatment of brain metastases: a comprehensive review. Crit Rev Oncol Hematol 2004;52(3):199-215. 127. Ballabh P, Braun A, Nedergaard M. The blood-brain barrier: an overview: structure, regulation, and clinical implications. Neurobiology of disease 2004;16(1):1-13. 128. Shen S, Zhang W. ABC transporters and drug efflux at the blood-brain barrier. Reviews in the neurosciences;21(1):29-53.

68
129. Thomlinson RH, Gray LH. The histological structure of some human lung cancers and the possible implications for radiotherapy. British journal of cancer 1955;9(4):539-49. 130. Brown JM, Giaccia AJ. The unique physiology of solid tumors: opportunities (and problems) for cancer therapy. Cancer research 1998;58(7):1408-16. 131. Less JR, Skalak TC, Sevick EM, Jain RK. Microvascular architecture in a mammary carcinoma: branching patterns and vessel dimensions. Cancer research 1991;51(1):265-73. 132. Chaplin DJ, Trotter MJ, Durand RE, Olive PL, Minchinton AI. Evidence for intermittent radiobiological hypoxia in experimental tumour systems. Biomedica biochimica acta 1989;48(2-3):S255-9. 133. Chaplin DJ, Olive PL, Durand RE. Intermittent blood flow in a murine tumor: radiobiological effects. Cancer research 1987;47(2):597-601. 134. Padera TP, Stoll BR, Tooredman JB, Capen D, di Tomaso E, Jain RK. Pathology: cancer cells compress intratumour vessels. Nature 2004;427(6976):695. 135. Tannock I. Cell kinetics and chemotherapy: a critical review. Cancer treatment reports 1978;62(8):1117-33. 136. Tannock IF, Rotin D. Acid pH in tumors and its potential for therapeutic exploitation. Cancer research 1989;49(16):4373-84. 137. Jain RK. Barriers to drug delivery in solid tumors. Sci Am 1994;271(1):58-65. 138. Tredan O, Galmarini CM, Patel K, Tannock IF. Drug resistance and the solid tumor microenvironment. Journal of the National Cancer Institute 2007;99(19):1441-54. 139. Nelson CM, Bissell MJ. Of extracellular matrix, scaffolds, and signaling: tissue architecture regulates development, homeostasis, and cancer. Annual review of cell and developmental biology 2006;22:287-309. 140. Pupa SM, Menard S, Forti S, Tagliabue E. New insights into the role of extracellular matrix during tumor onset and progression. Journal of cellular physiology 2002;192(3):259-67. 141. Sethi T, Rintoul RC, Moore SM, et al. Extracellular matrix proteins protect small cell lung cancer cells against apoptosis: a mechanism for small cell lung cancer growth and drug resistance in vivo. Nat Med 1999;5(6):662-8. 142. Conacci-Sorrell M, Zhurinsky J, Ben-Ze'ev A. The cadherin-catenin adhesion system in signaling and cancer. J Clin Invest 2002;109(8):987-91. 143. Juliano RL. Signal transduction by cell adhesion receptors and the cytoskeleton: functions of integrins, cadherins, selectins, and immunoglobulin-superfamily members. Annual review of pharmacology and toxicology 2002;42:283-323. 144. Eikenes L, Bruland OS, Brekken C, Davies Cde L. Collagenase increases the transcapillary pressure gradient and improves the uptake and distribution of monoclonal antibodies in human osteosarcoma xenografts. Cancer research 2004;64(14):4768-73. 145. Kuh HJ, Jang SH, Wientjes MG, Weaver JR, Au JL. Determinants of paclitaxel penetration and accumulation in human solid tumor. J Pharmacol Exp Ther 1999;290(2):871-80. 146. Jang SH, Wientjes MG, Au JL. Enhancement of paclitaxel delivery to solid tumors by apoptosis-inducing pretreatment: effect of treatment schedule. J Pharmacol Exp Ther 2001;296(3):1035-42.

69
147. Au JL, Jang SH, Wientjes MG. Clinical aspects of drug delivery to tumors. J Control Release 2002;78(1-3):81-95. 148. Grantab R, Sivananthan S, Tannock IF. The penetration of anticancer drugs through tumor tissue as a function of cellular adhesion and packing density of tumor cells. Cancer research 2006;66(2):1033-9. 149. Hanahan D, Weinberg RA. The hallmarks of cancer. Cell 2000;100(1):57-70. 150. Carmeliet P, Jain RK. Angiogenesis in cancer and other diseases. Nature 2000;407(6801):249-57. 151. Hanahan D, Christofori G, Naik P, Arbeit J. Transgenic mouse models of tumour angiogenesis: the angiogenic switch, its molecular controls, and prospects for preclinical therapeutic models. Eur J Cancer 1996;32A(14):2386-93. 152. Bergers G, Benjamin LE. Tumorigenesis and the angiogenic switch. Nat Rev Cancer 2003;3(6):401-10. 153. Forsythe JA, Jiang BH, Iyer NV, et al. Activation of vascular endothelial growth factor gene transcription by hypoxia-inducible factor 1. Molecular and cellular biology 1996;16(9):4604-13. 154. Shi Q, Le X, Wang B, et al. Regulation of vascular endothelial growth factor expression by acidosis in human cancer cells. Oncogene 2001;20(28):3751-6. 155. Shweiki D, Neeman M, Itin A, Keshet E. Induction of vascular endothelial growth factor expression by hypoxia and by glucose deficiency in multicell spheroids: implications for tumor angiogenesis. Proceedings of the National Academy of Sciences of the United States of America 1995;92(3):768-72. 156. Fukumura D, Jain RK. Tumor microenvironment abnormalities: causes, consequences, and strategies to normalize. Journal of cellular biochemistry 2007;101(4):937-49. 157. Eliceiri BP, Cheresh DA. Adhesion events in angiogenesis. Current opinion in cell biology 2001;13(5):563-8. 158. Jain RK. Determinants of tumor blood flow: a review. Cancer research 1988;48(10):2641-58. 159. Giatromanolaki A, Sivridis E, Koukourakis MI. Tumour angiogenesis: vascular growth and survival. Apmis 2004;112(7-8):431-40. 160. Thompson WD. Tumour versus patient: vascular and tumour survival versus prognosis. The Journal of pathology 2001;193(4):425-6. 161. Jain RK, Munn LL, Fukumura D. Dissecting tumour pathophysiology using intravital microscopy. Nat Rev Cancer 2002;2(4):266-76. 162. Leu AJ, Berk DA, Lymboussaki A, Alitalo K, Jain RK. Absence of functional lymphatics within a murine sarcoma: a molecular and functional evaluation. Cancer research 2000;60(16):4324-7. 163. Jain RK. Delivery of molecular and cellular medicine to solid tumors. Adv Drug Deliv Rev 1997;26(2-3):71-90. 164. Milosevic MF, Fyles AW, Wong R, et al. Interstitial fluid pressure in cervical carcinoma: within tumor heterogeneity, and relation to oxygen tension. Cancer 1998;82(12):2418-26. 165. Taghian AG, Abi-Raad R, Assaad SI, et al. Paclitaxel decreases the interstitial fluid pressure and improves oxygenation in breast cancers in patients treated with neoadjuvant chemotherapy: clinical implications. J Clin Oncol 2005;23(9):1951-61.
70
166. Gutmann R, Leunig M, Feyh J, et al. Interstitial hypertension in head and neck tumors in patients: correlation with tumor size. Cancer research 1992;52(7):1993-5. 167. Heldin CH, Rubin K, Pietras K, Ostman A. High interstitial fluid pressure - an obstacle in cancer therapy. Nat Rev Cancer 2004;4(10):806-13. 168. Rippe B, Haraldsson B. Transport of macromolecules across microvascular walls: the two-pore theory. Physiological reviews 1994;74(1):163-219. 169. Willett CG, Boucher Y, di Tomaso E, et al. Direct evidence that the VEGF-specific antibody bevacizumab has antivascular effects in human rectal cancer. Nat Med 2004;10(2):145-7. 170. Pietras K, Rubin K, Sjoblom T, et al. Inhibition of PDGF receptor signaling in tumor stroma enhances antitumor effect of chemotherapy. Cancer research 2002;62(19):5476-84. 171. Lammerts E, Roswall P, Sundberg C, et al. Interference with TGF-beta1 and -beta3 in tumor stroma lowers tumor interstitial fluid pressure independently of growth in experimental carcinoma. Int J Cancer 2002;102(5):453-62. 172. Brekken C, de Lange Davies C. Hyaluronidase reduces the interstitial fluid pressure in solid tumours in a non-linear concentration-dependent manner. Cancer Lett 1998;131(1):65-70. 173. Rubin K, Sjoquist M, Gustafsson AM, Isaksson B, Salvessen G, Reed RK. Lowering of tumoral interstitial fluid pressure by prostaglandin E(1) is paralleled by an increased uptake of (51)Cr-EDTA. Int J Cancer 2000;86(5):636-43. 174. Murata R, Nishimura Y, Hiraoka M. An antiangiogenic agent (TNP-470) inhibited reoxygenation during fractionated radiotherapy of murine mammary carcinoma. Int J Radiat Oncol Biol Phys 1997;37(5):1107-13. 175. Ma J, Pulfer S, Li S, Chu J, Reed K, Gallo JM. Pharmacodynamic-mediated reduction of temozolomide tumor concentrations by the angiogenesis inhibitor TNP-470. Cancer research 2001;61(14):5491-8. 176. Fenton BM, Paoni SF, Ding I. Effect of VEGF receptor-2 antibody on vascular function and oxygenation in spontaneous and transplanted tumors. Radiother Oncol 2004;72(2):221-30. 177. Jain RK. Normalizing tumor vasculature with anti-angiogenic therapy: a new paradigm for combination therapy. Nat Med 2001;7(9):987-9. 178. Tong RT, Boucher Y, Kozin SV, Winkler F, Hicklin DJ, Jain RK. Vascular normalization by vascular endothelial growth factor receptor 2 blockade induces a pressure gradient across the vasculature and improves drug penetration in tumors. Cancer research 2004;64(11):3731-6. 179. Horsman MR, Siemann DW. Pathophysiologic effects of vascular-targeting agents and the implications for combination with conventional therapies. Cancer research 2006;66(24):11520-39. 180. Vaupel P. Tumor microenvironmental physiology and its implications for radiation oncology. Seminars in radiation oncology 2004;14(3):198-206. 181. Durand RE, LePard NE. Contribution of transient blood flow to tumour hypoxia in mice. Acta oncologica (Stockholm, Sweden) 1995;34(3):317-23. 182. Durand RE. The influence of microenvironmental factors during cancer therapy. In vivo (Athens, Greece) 1994;8(5):691-702.

71
183. Tannock IF. Conventional cancer therapy: promise broken or promise delayed? Lancet 1998;351 Suppl 2:SII9-16. 184. Tannock IF. The relation between cell proliferation and the vascular system in a transplanted mouse mammary tumour. British journal of cancer 1968;22(2):258-73. 185. Teicher BA, Lazo JS, Sartorelli AC. Classification of antineoplastic agents by their selective toxicities toward oxygenated and hypoxic tumor cells. Cancer research 1981;41(1):73-81. 186. Wartenberg M, Ling FC, Muschen M, et al. Regulation of the multidrug resistance transporter P-glycoprotein in multicellular tumor spheroids by hypoxia-inducible factor (HIF-1) and reactive oxygen species. Faseb J 2003;17(3):503-5. 187. Kovacic P, Osuna JA, Jr. Mechanisms of anti-cancer agents: emphasis on oxidative stress and electron transfer. Curr Pharm Des 2000;6(3):277-309. 188. Wardman P. Electron transfer and oxidative stress as key factors in the design of drugs selectively active in hypoxia. Current medicinal chemistry 2001;8(7):739-61. 189. Zeman EM, Brown JM, Lemmon MJ, Hirst VK, Lee WW. SR-4233: a new bioreductive agent with high selective toxicity for hypoxic mammalian cells. Int J Radiat Oncol Biol Phys 1986;12(7):1239-42. 190. Williamson SK, Crowley JJ, Lara PN, Jr., et al. Phase III trial of paclitaxel plus carboplatin with or without tirapazamine in advanced non-small-cell lung cancer: Southwest Oncology Group Trial S0003. J Clin Oncol 2005;23(36):9097-104. 191. von Pawel J, von Roemeling R, Gatzemeier U, et al. Tirapazamine plus cisplatin versus cisplatin in advanced non-small-cell lung cancer: A report of the international CATAPULT I study group. Cisplatin and Tirapazamine in Subjects with Advanced Previously Untreated Non-Small-Cell Lung Tumors. J Clin Oncol 2000;18(6):1351-9. 192. Kyle AH, Minchinton AI. Measurement of delivery and metabolism of tirapazamine to tumour tissue using the multilayered cell culture model. Cancer Chemother Pharmacol 1999;43(3):213-20. 193. Hicks KO, Pruijn FB, Sturman JR, Denny WA, Wilson WR. Multicellular resistance to tirapazamine is due to restricted extravascular transport: a pharmacokinetic/pharmacodynamic study in HT29 multicellular layer cultures. Cancer research 2003;63(18):5970-7. 194. Tredan O, Garbens AB, Lalani AS, Tannock IF. The hypoxia-activated ProDrug AQ4N penetrates deeply in tumor tissues and complements the limited distribution of mitoxantrone. Cancer research 2009;69(3):940-7. 195. Simon S, Roy D, Schindler M. Intracellular pH and the control of multidrug resistance. Proceedings of the National Academy of Sciences of the United States of America 1994;91(3):1128-32. 196. Mahoney BP, Raghunand N, Baggett B, Gillies RJ. Tumor acidity, ion trapping and chemotherapeutics. I. Acid pH affects the distribution of chemotherapeutic agents in vitro. Biochemical pharmacology 2003;66(7):1207-18. 197. Luciani F, Spada M, De Milito A, et al. Effect of proton pump inhibitor pretreatment on resistance of solid tumors to cytotoxic drugs. Journal of the National Cancer Institute 2004;96(22):1702-13. 198. Svastova E, Hulikova A, Rafajova M, et al. Hypoxia activates the capacity of tumor-associated carbonic anhydrase IX to acidify extracellular pH. FEBS letters 2004;577(3):439-45.

72
199. Gatenby RA, Gillies RJ. Why do cancers have high aerobic glycolysis? Nat Rev Cancer 2004;4(11):891-9. 200. Vukovic V, Tannock IF. Influence of low pH on cytotoxicity of paclitaxel, mitoxantrone and topotecan. British journal of cancer 1997;75(8):1167-72. 201. Nishi T, Forgac M. The vacuolar (H+)-ATPases--nature's most versatile proton pumps. Nat Rev Mol Cell Biol 2002;3(2):94-103. 202. Murakami T, Shibuya I, Ise T, et al. Elevated expression of vacuolar proton pump genes and cellular PH in cisplatin resistance. Int J Cancer 2001;93(6):869-74. 203. Martinez-Zaguilan R, Lynch RM, Martinez GM, Gillies RJ. Vacuolar-type H(+)-ATPases are functionally expressed in plasma membranes of human tumor cells. Am J Physiol 1993;265(4 Pt 1):C1015-29. 204. Raghunand N, He X, van Sluis R, et al. Enhancement of chemotherapy by manipulation of tumour pH. British journal of cancer 1999;80(7):1005-11. 205. Ouar Z, Bens M, Vignes C, et al. Inhibitors of vacuolar H+-ATPase impair the preferential accumulation of daunomycin in lysosomes and reverse the resistance to anthracyclines in drug-resistant renal epithelial cells. The Biochemical journal 2003;370(Pt 1):185-93. 206. Milas L, Nakayama T, Hunter N, et al. Dynamics of tumor cell clonogen repopulation in a murine sarcoma treated with cyclophosphamide. Radiother Oncol 1994;30(3):247-53. 207. Kim JJ, Tannock IF. Repopulation of cancer cells during therapy: an important cause of treatment failure. Nat Rev Cancer 2005;5(7):516-25. 208. Freyer JP, Sutherland RM. Proliferative and clonogenic heterogeneity of cells from EMT6/Ro multicellular spheroids induced by the glucose and oxygen supply. Cancer research 1986;46(7):3513-20. 209. Durand RE, Vanderbyl SL. Tumor resistance to therapy: a genetic or kinetic problem? Cancer Commun 1989;1(5):277-83. 210. Durand RE. Multicell spheroids as a model for cell kinetic studies. Cell and tissue kinetics 1990;23(3):141-59. 211. Fung AS, Wu L, Tannock IF. Concurrent and sequential administration of chemotherapy and the Mammalian target of rapamycin inhibitor temsirolimus in human cancer cells and xenografts. Clin Cancer Res 2009;15(17):5389-95. 212. Sutherland RM. Cell and environment interactions in tumor microregions: the multicell spheroid model. Science 1988;240(4849):177-84. 213. Sutherland RM. Importance of critical metabolites and cellular interactions in the biology of microregions of tumors. Cancer 1986;58(8):1668-80. 214. Mueller-Klieser W. Multicellular spheroids. A review on cellular aggregates in cancer research. J Cancer Res Clin Oncol 1987;113(2):101-22. 215. Luk CK, Sutherland RM. Nutrient modification of proliferation and radiation response in EMT6/Ro spheroids. Int J Radiat Oncol Biol Phys 1987;13(6):885-95. 216. Bauer KD, Keng PC, Sutherland RM. Isolation of quiescent cells from multicellular tumor spheroids using centrifugal elutriation. Cancer research 1982;42(1):72-8. 217. Nederman T, Carlsson J, Kuoppa K. Penetration of substances into tumour tissue. Model studies using saccharides, thymidine and thymidine-5'-triphosphate in cellular spheroids. Cancer Chemother Pharmacol 1988;22(1):21-5.

73
218. Kerr DJ, Wheldon TE, Hydns S, Kaye SB. Cytotoxic drug penetration studies in multicellular tumour spheroids. Xenobiotica 1988;18(6):641-8. 219. Sutherland RM, Eddy HA, Bareham B, Reich K, Vanantwerp D. Resistance to adriamycin in multicellular spheroids. Int J Radiat Oncol Biol Phys 1979;5(8):1225-30. 220. Erlichman C, Vidgen D. Cytotoxicity of adriamycin in MGH-U1 cells grown as monolayer cultures, spheroids, and xenografts in immune-deprived mice. Cancer Res 1984;44(11):5369-75. 221. Durand RE. Distribution and activity of antineoplastic drugs in a tumor model. J Natl Cancer Inst 1989;81(2):146-52. 222. Hicks KO, Ohms SJ, van Zijl PL, Denny WA, Hunter PJ, Wilson WR. An experimental and mathematical model for the extravascular transport of a DNA intercalator in tumours. Br J Cancer 1997;76(7):894-903. 223. Fenton BM, Paoni SF, Beauchamp BK, Ding I. Zonal image analysis of tumour vascular perfusion, hypoxia, and necrosis. Br J Cancer 2002;86(11):1831-6. 224. Tannock IF, Lee CM, Tunggal JK, Cowan DS, Egorin MJ. Limited penetration of anticancer drugs through tumor tissue: a potential cause of resistance of solid tumors to chemotherapy. Clin Cancer Res 2002;8(3):878-84. 225. Minchinton AI, Wendt KR, Clow KA, Fryer KH. Multilayers of cells growing on a permeable support. An in vitro tumour model. Acta oncologica (Stockholm, Sweden) 1997;36(1):13-6. 226. Cowan DS, Hicks KO, Wilson WR. Multicellular membranes as an in vitro model for extravascular diffusion in tumours. The British journal of cancer 1996;27:S28-31. 227. Wilson WR, Hicks KO. Measurement of extravascular drug diffusion in multicellular layers. Br J Cancer 1999;79(9-10):1623-6. 228. Tunggal JK, Cowan DS, Shaikh H, Tannock IF. Penetration of anticancer drugs through solid tissue: a factor that limits the effectiveness of chemotherapy for solid tumors. Clin Cancer Res 1999;5(6):1583-6. 229. Egorin MJ, Hildebrand RC, Cimino EF, Bachur NR. Cytofluorescence localization of adriamycin and daunorubicin. Cancer research 1974;34(9):2243-5. 230. Lankelma J, Dekker H, Luque FR, et al. Doxorubicin gradients in human breast cancer. Clin Cancer Res 1999;5(7):1703-7. 231. Primeau AJ, Rendon A, Hedley D, Lilge L, Tannock IF. The distribution of the anticancer drug Doxorubicin in relation to blood vessels in solid tumors. Clin Cancer Res 2005;11(24 Pt 1):8782-8. 232. Larsen AK, Escargueil AE, Skladanowski A. Resistance mechanisms associated with altered intracellular distribution of anticancer agents. Pharmacol Ther 2000;85(3):217-29. 233. Raghunand N, Martinez-Zaguilan R, Wright SH, Gillies RJ. pH and drug resistance. II. Turnover of acidic vesicles and resistance to weakly basic chemotherapeutic drugs. Biochem Pharmacol 1999;57(9):1047-58. 234. Schindler M, Grabski S, Hoff E, Simon SM. Defective pH regulation of acidic compartments in human breast cancer cells (MCF-7) is normalized in adriamycin-resistant cells (MCF-7adr). Biochemistry 1996;35(9):2811-7.

74

75
CHAPTER 2
DISTRIBUTION OF ANTICANCER DRUGS IN TUMOURS AND NORMAL TISSUES
Krupa J. Patel and Ian F. Tannock

76
2.1 ABSTRACT Background: The effectiveness of chemotherapy is limited by drug resistance and by
toxicity to normal tissues. While pharmacokinetic analyses can estimate the mean
concentration of drug within a given tissue, they do not give information about the spatial
distribution of drugs. Here, we compare the time-dependent spatial distribution of three
different anticancer drugs within tumours and normal tissues.
Methods: Mice bearing various human tumour xenografts were treated with doxorubicin,
mitoxantrone or topotecan, all of which are autofluorescent, thus allowing their
quantification in tissue sections by immunohistochemistry. After 10 mins, 3 hours or 24
hours, tumours and samples of heart, kidney, liver and brain were excised and frozen.
Tissue sections were analyzed for drug fluorescence in relation to distance from the
nearest blood vessel. Hypoxic regions were also identified within tumour tissue by
uptake of EF5.
Results: The distribution of doxorubicin within solid tumours was limited to perivascular
regions but was relatively uniform in the heart, kidney and liver. Little to no drug
fluorescence was observed in the brain. Gradients of drug distribution in tumours were
steep at 10 minutes after drug administration and become shallower over time, with a
decrease in overall fluorescence. All three drugs led to increased regions of hypoxia in
tumours at 3 hours after treatment, but the extent of hypoxia decreased after 24 hours.
Drug-associated fluorescence decreased with time in the heart, kidney and liver.
Conclusions: Spatial distributions of anticancer drugs can provide important information
about limitations of drug delivery to tumours and about toxicity within normal tissue.

77
2.2 INTRODUCTION
Effective treatment of solid tumours with anticancer drugs requires both that
constituent cells are sensitive to the drug and that the drug achieves a concentration
within the tumour cells sufficient to cause cytotoxicity. The ability of anti-cancer drugs
to gain access to solid tumours depends on efficient delivery of drugs through the
vascular system of the tumour, and penetration of drugs to tumour cells that are distant
from blood vessels.
Toxicity to normal tissue limits the dose of a drug that can be administered.
Drugs are distributed in the blood, which is likely to provide greater access to well-
perfused organs such as the heart, liver and kidney as compared to poorly perfused
tumours.
The distribution of a drug within the body is governed by factors such as blood
flow to different organs, diffusion, protein and tissue binding, and lipid solubility. In
general, drugs with extensive binding to tissues (e.g. doxorubicin) or with high lipid
solubility will tend to exhibit prolonged elimination phases because there is slow release
from tissues. Metabolism of drugs takes place primarily in the liver and consists of
oxidative and reductive reactions via the cytochrome P-450 system. Most drugs are
eventually eliminated from the body by the kidney or through the biliary tract.
Doxorubicin is a naturally occurring anthracycline that has cytotoxic effects
attributed to DNA intercalation and alkylation, generation of reactive oxygen species,
interference with RNA and DNA polymerase and inhibition of topoisomerase II (1, 2)
Doxorubicin has been used for many years as part of combination chemotherapy
regimens in the treatment of lymphomas, leukemias and solid tumours (3). The initial

78
distribution half-life (tα) of doxorubicin in mice is approximately 4-5 minutes (4), and in
humans approximately 11 minutes (5). Dose-limiting toxicities are myelosuppression
and dose-dependent cardiac toxicity (3, 6-8). Mitoxantrone is an anthracenedione that
differs from the anthracyclines in lacking the sugar and the tetracyclic ring. It is a
synthetic drug with three planar rings that intercalates into DNA and inhibits
topoisomerase II. Mitoxantrone has been used in chemotherapy regimens for leukemia,
lymphoma, breast and prostate cancer, and to treat multiple sclerosis (9-11). The mean tα
of mitoxantrone ranges from 6-12 minutes in mice and 6 minutes in humans (12).
Myelosuppression and dose-dependent cardiomyopathy are major toxicities (13).
Topotecan is a semisynthetic, water-soluble derivative of camptothecin and is a potent
inhibitor of topoisomerase I (14, 15). It is primarily used for the treatment of ovarian
cancer and small cell lung cancer (16-19). The tα of topotecan in mice is approximately
30 minutes (20) and 6 minutes in humans (21) and the major toxicity is myelosuppression
(22).
In various pharmacokinetic studies, doxorubicin, mitoxantrone and topotecan
have attained quite high concentration in normal tissues such as the liver, kidney and
heart (23-25). These studies utilized techniques such as high performance liquid
chromatography (HPLC) or liquid scintillation to determine mean concentration of drug
within normal and tumour tissues as a function of time after drug administration.
However, these techniques do not give information about the distribution of drug within
that tissue. Studies examining the distribution of various anti-cancer drugs in solid
tumours have shown limited penetration in relation to blood vessels (26-31). Compared
to tumours, drug delivery to normal tissues, such as the liver, kidney and heart, is likely

79
to be more efficient due to a highly organized vascular structure and large pressure
gradients across the endothelial membrane. In contrast, the brain has been reported to
have limited accumulation of drug due to various mechanisms utilized by the blood-brain
barrier (BBB) to exclude toxic substances (32).
In the present study we examine the time-dependent distribution of three anti-cancer
drugs, doxorubicin, mitoxantrone and topotecan, in a human tumour xenograft model, and
compare drug distribution in tumours with that in the liver, kidney, heart and brain.
2.3 MATERIALS AND METHODS
2.3.1 Drugs and reagents
Doxorubicin (Pharmacia, Mississauga, Canada) was purchased from the hospital
pharmacy as a solution diluted in 0.9% sodium chloride to a concentration of 2 mg/mL.
Mitoxantrone (Mayne Pharma) was obtained from the hospital pharmacy as a solution
diluted in 0.8% sodium chloride at a concentration of 2mg/mL. Topotecan was also
obtained from the hospital pharmacy as a powder and was dissolved in phosphate-
buffered saline (PBS) to a concentration of 1mg/mL. Purified rat anti-mouse CD31
(platelet/endothelial adhesion molecule 1) monoclonal antibody was purchased from BD
PharmMingen (Mississauga, Canada), and Cy3-conjugated goat anti-rat IgG secondary
antibody was purchased from Jackson Immuno Research Laboratories, Inc.
(Pennsylvania, USA). The hypoxia-selective agent EF5 and Cy5-conjugated anti-EF5
antibody were provided by Dr. C.J. Koch (University of Pennsylvania).

80
2.3.2 Cell lines The human breast cancer cells MDA-MB-231 and MCF-7, the human vulvar
epidermoid carcinoma cell line A431 and the prostate cancer cells PC-3 and DU145 were
purchased from the American Type Culture Collection (ATCC; Virginia, USA). MDA-
MB-231, MCF-7 and DU145 cells were maintained in α-MEM (Life Technologies, Inc),
A431 cells were maintained in Dulbecco’s Modified Eagle’s Medium (Life
Technologies, Inc), and PC-3 cells were maintained in Ham's F-12K medium (Life
Technologies, Inc.). All media were supplemented with 10% fetal bovine serum (FBS;
Hyclone) at 37°C in a humidified atmosphere of 95% air plus 5% CO2.
2.3.4 Mice Athymic nude female mice were purchased from Harlan Sprague-Dawley
Laboratory Center at about 6 weeks of age. Mice were housed five per cage and allowed
1 week to acclimatize in our animal colony before experimentation. The animals
received filtered sterilized water and sterile rodent food ad libitum. Tumours were
generated by subcutaneous injection of 1 x 10⁶ exponentially growing cells into the left
and right flank regions. Drug distribution studies were initiated when tumour diameters
reached approximately 6-8 mm. All procedures were carried out following approval of
the Institutional Animal Care Committee in accordance with the Canadian Council on
Animal Care guidelines (Animal Protocal # 12329).
2.3.5 Evaluation of drug distribution Tumour-bearing mice were treated intravenously with 25 mg/kg of doxorubicin,
mitoxantrone or topotecan, with the exception of PC-3 and DU145 tumour-bearing mice
which were treated with 40mg/kg of mitoxantrone to facilitate detection and
81
quantification of drug auto-fluorescence. Mice in the control group were treated with
phosphate-buffered saline. Mice also received 0.2mL of a 10 mM solution of EF5
intraperitoneally 2-3 hours prior to being killed to identify hypoxic tumour regions.
Animals were killed at10 minutes, 3 or 24 hours after drug injection. The tumours, liver,
kidney, heart and brain were excised and the tissues were embedded immediately in OCT
compound, frozen in liquid nitrogen, and stored at -70°C prior to tissue sectioning and
immunohistochemical staining. From each tissue cryostat sections 10 µm thick were cut
at 3 levels approximately 100 µm apart, mounted on glass slides and allowed to air dry.
2.3.6 Fluorescence imaging
Fluorescence was quantified utilizing an Olympus Upright BX50 microscope
with a 100W HBO mercury light source using the Olympus UplanSApo 10X/0.40
objective lenses. Tissue sections were imaged with a Photometrics CoolSNAP HQ2
(monochrome for fluorescence imaging) camera, keeping exposure settings the
consistent, and tiled using a motorized stage so that the distribution of drug was measured
across the entire tissue section. Doxorubicin was imaged using the Cy3 (530-560 nm
excitation/573-647 nm emission) filter set, mitoxantrone and topotecan were imaged
using the FITC (490 nm excitation/ 525 nm emission) filter set. All images were
captured at 8-bit signal depth and subsequently pseudo-coloured. Sections were then
stained for blood vessels using antibodies specific for the endothelial cell marker CD31
[rat anti-CD31 primary antibody (1:100); BD Biosciences, and C73-conjugated goat anti-
rat IgG secondary antibody (1:400)], hypoxic regions were identified using a Cy5-
conjugat4d mouse anti-EF5 antibody (1:50). Tumour sections were imaged for CD31

82
using the Cy3 (530-560 nm excitation/573-647 nm emission) filter set, and EF5 using the
Cy5 far-red filter set.
2.3.7 Image analysis Composite images of drug and CD31 were generated utilizing Media Cybernetics
Image Pro PLUS software (version 5.0). Images displaying anti-CD31 staining were
converted to a black and white binary image, and small white objects were removed as
artifacts based on conservative estimation of minimal capillary diameter (33). The
resultant image was overlaid with the corresponding field of view displaying drug
fluorescence resulting in an 8 bit black and white image with blood vessels identified by
pixels with intensities between 250 and 255 (white) and fluorescence representing drug
concentration ranging from 0-249. Several regions, 1.6 mm2 in area, with moderate
blood vessel density were selected from each tissue section. Areas of necrosis and
staining artifact were excluded. To minimize noise from tissue auto-fluorescence a
minimum signal level just below threshold for detection of drug was set for each tissue
section; this was based on an average background reading from regions without nuclear
fluorescence/staining. The pixel intensity (the area of each pixel was 0.4 μm2) and
distance to the nearest vessel for all pixels within the selected region of interest above
threshold were measured with a customized algorithm. Drug intensity (I) was averaged
over all pixels at a given distance (x) from the nearest vessel and plotted as a function of
distance to the nearest vessel. Linear regression was performed to correlate the average
drug fluorescence intensity with distance from the nearest blood vessel. The gradient was
determined from the slope of the linear regression. The fluorescence intensity in regions
closest to blood vessels was determined from the y-intercept of the linear regressions.

83
The area under the curve was calculated for tumour tissue with a maximum distance from
the nearest vessel in the section of 120μm and for normal tissue with a maximum distance
of 60μm because of noise of close-by adjacent vessels.
The concentration of blood vessels per tumour area was determined by counting
the number of “objects” that fell within the 250-255 pixel intensity range. “Objects” are
made up of adjacent pixels that have the same range in intensity, and those with an area
below 62 μm2 were gated out using ImagePro Plus Software. The number of “objects”
(blood vessels) was divided by the area of the tumour region being quantified. To
quantify hypoxic regions, a threshold range between 30-50 intensity units was set for
images with EF5 staining. The area of positive staining within this intensity was
calculated and divided by the tumour area.
The slopes of the gradient, y-intercept, area under the curve, quantity of blood
vessels per tumour area and hypoxic regions per tumour area were tested for statistical
significance using one-way ANOVA tests (assuming unequal variances between groups),
and subsequent t-tests.
Coloured photomicrographs were generated using ImagePro Plus software.
Grayscale images were converted to RGB 24 bit images and pseudo-coloured.
2.4 RESULTS
2.4.1 Distribution of drugs in tumours Photomicrographs of various tumours indicate limited distribution of doxorubicin
and mitoxantrone such that the majority of fluorescence due to the drug is localized near
blood vessels and areas away from vessels show little or no drug (Figure 2.1a-d). There

84
are steep gradients of drug distribution with decreasing fluorescence intensity at
increasing distance from the nearest blood vessel. The distances at which drug
fluorescence falls to half are within a small range among the four tumour lines (Table
2.1).
Table 2.1 Drug distribution gradients and distance at half intensity in PC3 and DU145 tumours treated with mitoxantrone and A431 and MCF-7 tumours treated with doxorubicin
Tumour Regression Slope of Distance at Iα Type - Drug Coefficient Gradient
PC3 – MITOX 0.95 -0.22 50 DU145 – MITOX 0.99 -0.23 50
A431 – DOX 0.99 -0.089 50 MCF-7 - DOX 0.91 -0.13 59
Iα – distance (µm) at which fluorescence intensity falls to half
Images showing the time-dependent distribution of doxorubicin, mitoxantrone
and topotecan in MDA-MB-231 xenografts after injection of equal doses into mice are
shown in Figure 2.2. These images demonstrate limited penetration of these anticancer
drugs to tumour regions far from blood vessels. At ten minutes after injection,
mitoxantrone had a gradient of decreasing fluorescence in relation to distance to the
nearest blood vessel that was much steeper than for either doxorubicin or topotecan. The
total fluorescence intensity of mitoxantrone in relation to blood vessels (area under the
curve) was higher than that of doxorubicin by 5-fold (p<0.01), and topotecan by 3-fold
(p<0.01) (Figure 2.3a). Similarly, 3 hours after drug administration, mitoxantrone had
steeper gradients of decreasing fluorescence with distance from blood vessels, and higher
total fluorescence compared to doxorubicin and topotecan (p<0.05) (Figure 2.3b). After
24 hours, all three drugs show similar gradients of decreasing fluorescence, but total

85
mitoxantrone fluorescence in relation to blood vessels remained consistently higher than
that of doxorubicin (p<0.05) (Figure 2.3c).
For all three drugs, fluorescence in regions adjacent to blood vessels was maximal
at 10 mins, and decreased thereafter (Table 2.2). Total fluorescence of each drug in
tumours decreased significantly between 10 minutes and 3 hours (p<0.01) and for
mitoxantrone from 3 hours to 24 hours as well (p<0.05). Among the three drugs,
doxorubicin showed a 4-fold shallower fluorescence gradient at 24 hours compared to at
3 hours (p<0.05), and subtle decreases in fluorescence in regions adjacent to blood
vessels over time (Table 2.2). In contrast, mitoxantrone showed an approximately 10-
fold shallower distribution gradient between 10 mins and 3 hours and a 6-fold decrease
between 3 hours and 24 hours (p<0.05 for both).
a,b,c,d indicate statistical significance between the pairs of means (p< 0.05)
2.4.2 Change in tumour vasculature and hypoxia following drug treatment
The concentration of blood vessels was compared with the 10 minute time point,
since this reflects the control value for untreated tumours; we did not evaluate blood flow
Table 2.2 Characteristics of drug distribution gradients in relation to distance to the nearest blood vessel
Time Slope Fluorescence Adjacent Drug After Injection of Gradient to Blood Vessels
Doxorubicin 10 mins -0.013 ± 0.013 6.9 ± 1.1 3 hrs -0.012 ± 0.003 5.2 ± 0.51 24 hrs -0.003 ± 0.003 4.0 ± 0.48
Mitoxantrone 10 mins -0.42 ± 0.070a 61 ± 9.6c
3 hrs -0.04 ± 0.010a 9.0 ± 0.46c
24 hrs -0.007 ± 0.002a 6.2 ± 0.07 Topotecan 10 mins -0.024 ± 0.0004 14 ± 1.9d
3 hrs 0.003 ± 0.004b 4.3 ± 0.39d 24 hrs 0.002 ± 0.002b 4.4 ± 0.19

86
which might have changed within this short interval. Twenty-four hours after doxorubicin
treatment, there was a decrease in the number of total blood vessels per tumour area
(p<0.05) compared to 3 hours post-treatment. After mitoxantrone and topotecan
treatment there was no significant change in the number of blood vessels over time
(Figure 2.4a).
Large regions of hypoxia were visible in tumour tissue at all three time points,
and there was a consistent trend of increased hypoxia at 3 hours compared to 10 minutes
after administration of for all three drugs (p=0.07 for doxorubicin and topotecan).
Twenty-four hours after any of the three drug treatments there were substantially fewer
regions of hypoxia (p<0.01), although there remained more hypoxia in doxorubicin
treated tumours compared to those treated with either mitoxantrone or topotecan
(p<0.001) (Figure 2.4b).
2.4.3 Drug distribution in heart, kidney and liver
In contrast to tumour tissue, doxorubicin fluorescence was observed throughout
heart, kidney and liver tissue (Figure 2.5a-d). Perivascular fluorescence of doxorubicin
was much higher in the normal tissues than in the tumour at 10 minutes after injection
(Figure 2.6a). There were steep gradients of decreasing fluorescence with increasing
distance from blood vessels in the heart, kidney and liver at 10 minutes after injection of
doxorubicin to a maximum of 60μm. At distances from blood vessels greater than 60μm,
fluorescence signal from nearby vessels created noise in the fluorescent intensity gradient
(Figure 2.5e).

87
The concentration of blood vessels in liver tissue was less than in the kidney and
tumour (p<0.05) with the concentration in the heart being intermediate (Figure 2.6b).
The much lower perivascular concentration of drug in the tumour therefore implies much
reduced net delivery of drug to the tumour.
Photomicrographs of doxorubicin distribution in the heart, kidney and liver, 10
minutes, 3 hours and 24 hours after administration show decreasing fluorescence over
time (Figure 2.7). Ten minutes after doxorubicin is given, fluorescence intensity is
observed throughout the normal tissues. After 3 hours doxorubicin fluorescence intensity
is decreased slightly and after 24 hours it is substantially lower (Figure 2.7).
Mitoxantrone fluorescence was observed throughout the heart, kidney and liver 3
and 24 hours after intravenous administration (Figure 2.8). Similarly, topotecan
fluorescence was observed in these tissues at 10 minutes, 3 and 24 hours after
intravenous administration (Figure 2.9). As in the tumours, doxorubicin and mitoxantrone
staining within the liver and heart is localized within the nucleus, whereas in the kidney,
the staining appears more diffuse throughout the cell. Topotecan fluorescence is not
confined to the nucleus and has more diffuse staining in the heart, kidney and liver.
In all normal tissues at 10 minutes after drug administration, the steepest gradients
of decreasing fluorescence occurred within the first 30μm from blood vessels. At greater
distances, there was a substantially shallower gradient of decreasing fluorescence
intensity. Similar patterns were observed at 3 hours and 24 hours within the first 30μm,
but the gradients were much shallower than at 10 minutes. Gradients for the heart and
kidney were not evident at distances greater than 60μm due to fluorescence noise from
neighbouring vessels. This effect was less evident in liver, probably because of the

88
organization of blood vessels into portal triads and there were fluorescence signals up
to100μm away from blood vessels. Twenty-four hours after drug administration,
fluorescence distributions in normal tissues are fairly uniform, with the exception of
mitoxantrone in the liver (Figure 2.10).
Comparing total drug fluorescence in relation to blood vessels over time,
topotecan was observed to have the lowest levels of drug after all three time points in the
heart and kidney and the highest levels in the liver. Mitoxantrone showed a decrease in
total drug fluorescence over time in the kidney and the liver and not in the heart. All
three drugs had the highest total fluorescence in the liver compared to the heart and
kidney, probably reflecting their clearance through the biliary tract (Figure 2.11).
The contrast in drug distribution between liver and metastatic tumour in the liver
is illustrated for mitoxantrone in Figure 2.12. Regions of tumour have markedly less
fluorescence than regions of normal liver tissue despite the presence of blood vessels in
both. In the central area of the tumour no blood vessels are visible and this area is likely
necrotic.
2.4.4 Drug distribution in the brain
Blood vessels within the brain show a high level of organization, consistent
thickness and structured branching patterns. Drug distribution within the brain however,
is very limited. While some drug fluorescence was observed within blood vessels, little
to no doxorubicin, mitoxantrone or topotecan fluorescence was observed in cells of the
brain 10 minutes, 3 hours or 24 hours after administration (Figure 2.13).

89
2.5 DISCUSSION
Drug delivery to tissues involves three processes: distribution through the
vascular space, transport across microvessel walls, and diffusion and/or convection
through tissue (34). Tumour vasculature has distinct characteristics compared to normal
blood vessels that lead to unique drug distribution profiles within tumour tissue. Blood
vessels in tumours are often dilated, convoluted and highly branched (35), flow through
them is irregular and frequently static, and the vessel walls may have fenestrations,
inconsistent basement membranes, and few pericytes (36, 37). These abnormalities tend
to result in leaky tumour vessels that create variable permeability within tumours (38). In
normal tissues, fluid is removed through a network of lymphatic vessels and through
veins. Solid tumours often lack functional lymph vessels which may lead to increased
interstitial fluid pressure, leading to inhibition of the distribution of larger molecules by
convection (39, 40). The penetration of most small molecule drugs relies on diffusion,
which is dependent on molecular properties such as size, charge and solubility, and on
avidity of binding in tissue. Poor diffusion, particularly for agents that are bound to or
within proximal cells is likely to lead to poor drug delivery to cells distal from blood
vessels. Our studies and others have shown limited drug distribution in various solid
tumour models such that much of the drug that is delivered to the tumour remains
localized in areas closest to blood vessels (28, 29, 41, 42). The predominant perivascular
localization of drugs after only 10 minutes may be due to their binding properties.
Studies using tumour cell spheroids show that drug binding affects drug penetration such
that drugs that do not bind to cellular macromolecules (such as 5-fluorouracil, cisplatin
and monoclonal antibodies) readily penetrate spheroids (43). In contrast, drugs with high

90
binding affinities, such as methotrexate, vinblastine, paclitaxel and the ones used in our
study, remain localized in the periphery of spheroids (43, 44). Interestingly, measures of
average drug concentration in spheroids indicate that high-binding drugs show higher
concentrations than low-binding drugs. This implies that average tumour concentration is
not a good indicator of drug distribution within tumour tissue and studies of spatial
distribution are necessary.
In our studies the gradients of decreasing drug fluorescence in relation to distance
to nearest blood vessels are likely to be even steeper than we demonstrate due to (i) some
non-perfused blood vessels within the tumour tissue being averaged with the perfused
vessels, and (ii) the presence of neighbouring blood vessels outside of the tissue section.
Both of these effects will lead to flattening of the apparent gradient of distribution within
tumour tissue.
Multiple factors affect drug distribution. In addition to physicochemical
properties of the drug/macromolecule such as binding affinity and diffusion coefficients,
biological properties of a tumour are also important. These include . blood flow,
interstitial fluid pressure, regional vessel distribution, cell density, and the extracellular
matrix. Some of these properties of tumours are dynamic and change with time, and
drug distribution is also therefore a dynamic process that may change with time after drug
administration. The intensity of drug fluorescence may be strongly time-dependent due
to the changing concentration of the drug in circulation over time. Our studies show a
dramatic decrease in total fluorescence due to doxorubicin, mitoxantrone or topotecan in
solid tumours between 10 minutes and 3 hours after each drug is given. The gradient of
drug concentration in relation to blood vessels also decreases with time for all three drugs

91
and most sharply for mitoxantrone. Twenty-four hours after drug treatment, shallow
gradients imply more even distribution than at earlier time points, but the total amount of
drug fluorescence shows substantially less drug within the tumours compared to the
amount of drug fluorescence at 10 minutes.
Our results indicate an increase in hypoxia, 3 hours after treatment for all three
drugs. Doxorubicin has been previously reported to alter tumour blood flow and
subsequently lead to an increase in acute hypoxia (45). Doxorubicin also caused a
reduction in the concentration of total blood vessels, but use of perfusion markers such
Hoescht 33342 and DiOC7 would be needed to demonstrate alterations in blood flow over
time. The anti-angiogenic effects of chemotherapeutic agents have been reported using
both in vitro and in vivo models (46, 47) and are likely to influence levels of hypoxia.
Varying blood flow and hypoxic levels in tumours have major implications for
effectiveness of treatment with both chemotherapy and radiotherapy.
In normal tissue the vascular system is more orderly and functional leading to
more homogeneous drug distribution. We found that the distribution of drugs in normal
tissue was more uniform than in the tumour with a higher level of tissue exposure.
Although there are steep gradients of decreasing drug concentration in relation to blood
vessels at 10 minutes after injection, especially for doxorubicin, by 3 hours the drugs are
fairly evenly distributed. While drug concentration decreases over time, there are still
large quantities of drug within normal tissues even at 24 hours. The plasma kinetics of
doxorubicin following a bolus injection have been shown to exhibit a rapid initial decline
followed by a slow decline in plasma concentration which has been ascribed to the ability
of tissues to rapidly accumulate the drug intracellularly followed by a slow release of the

92
drug from tissue stores as plasma levels decline due to drug elimination (48). Although
there are many routes of elimination, the primary clearance of doxorubicin is through
biliary elimination (49), clearance of mitoxantrone is biliary and fecal and of topotecan is
through biliary and urinary elimination (50).
Drug delivery in the brain is unlike that of other normal tissues or tumour tissue
due to the presence of the blood brain barrier (BBB). The function of the BBB is to
maintain a constant internal environment inside the brain by strictly regulating the
extracellular fluid composition and to protect the brain against potentially toxic
substances. Endothelial cells of the capillaries in the brain form the BBB that is
impermeable due to the presence of tight junctions between endothelial cells and the
absence of fenestrations (57). Due to limited mechanisms of transport through the BBB,
such as passive diffusion of small molecules, endocytosis and carrier-mediated efflux
(e.g. P-glycoprotein), most anticancer drugs are unable to gain access to the brain (58).
Topotecan, however has been reported to be present in the extracellular fluid of the brain
in pharmacokinetic studies using high performance liquid chromatography (59). Our
results complement this study by showing that although topotecan may cross the BBB, it
achieves only low concentration and its distribution within the brain is limited.
One of the limitations of this study is the doses of drugs that were used. In order
to visualize the fluorescence signal of each drug, high doses of each drug were used and
in order to compare fluorescence distribution patterns, equal doses of each drug were
used. In fact, in the clinical setting, there is quite a range of doses among the three drugs.
Doxorubicin is typically given at 60-75mg/m2 (48), mitoxantrone at 12mg/m2

93
(12) and topotecan at 2mg/m2 (50). Although our doses do not reflect the clinical doses,
the fluorescence distributions in tumour compared to normal tissue over time are relevant
and important. As well, during tissue processing (e.g. primary and secondary antibody
staining), the autofluorescence of the drug may be affected and this may depend on drug
properties such as binding and stability. This could also partially account for differences
in cellular fluorescence between drugs.
The present study shows marked difference in the spatial distributions of three
anticancer drugs within tumour tissue and normal tissues over time, with greater exposure
to most normal tissues and limited drug distribution to many cells in tumours. The
tumour microenvironment is dynamic and efforts to improve therapeutic efficacy might
be achieved by modifying these dynamic processes to enhance drug delivery. Studies of
the spatial distribution of drugs are required to complement pharmacokinetic data in order
to better understand and predict drug effects and toxicities.
Acknowledgements Mouse experiments using mitoxantrone and topotecan were done in collaboration with Dr. Olivier Tredan.

94
2.6 FIGURES

Figure 2.1 Drug distribution in tumour sections at 10 minutes after intravenous administration. Mice bearing (A) A431 and (B) MCF-7 tumours were treated with doxorubicin and mice bearing (C)PC-3, and (D) DU145 tumours were treated with mitoxantrone. Drug (blue), blood vessels (red). (Scale bar represents 100µm). (E) Gradients of fluorescence intensity due to the drugs are plotted in relation to distance from the nearest blood vessel.
0
10
20
30
40
50
60
70
0 20 40 60 80 100 120
Fluo
resc
ence
Inte
nsity
(i.u
.)
Distance to the nearest blood vessel (µm)
PC-3 - MitoxDU145 - MitoxA431 - DoxMCF-7 - Dox
E
A B
C D
95

Figure 2.2 Time-dependent drug distribution in tumour tissue. MDA-MB-231 tumour-bearing mice were treated intravenously with either doxorubicin, mitoxantrone or topotecan. After 10 minutes, 3 hours or 24 hours, tumours were excised, sectioned and imaged for drug (blue = DOX; cyan = MITOX; yellow = TOPO), blood vessels (red) and hypoxia (green). (Scale bar represents 100µm).
DOX MITOX TOPO
10 mins
3 hrs
24 hrs
96

Figure 2.3 Drug distribution in MDA-MB-231 tumour tissue in relation to distance to the nearest blood vessel. Fluorescence intensity gradients of (A) doxorubicin, (B) mitoxantrone and (C) topotecan in relation to distance to the nearest blood vessel are shown in left panels at 10 minutes, 3 hours and 24 hours after intravenous administration. A measure of total drug concentration in the tumour (AUC) is shown in right panels. (Data represent mean ± SE for 3-10 tumours; * indicate p<0.05).
A
B
C
0
1
2
3
4
5
6
7
8
9
10
0 20 40 60 80 100 120
Fluo
resc
ence
Inte
nsity
(i.u
.)
Distance to the nearest blood vessel (µm)
10 min3 hrs24 hrs
0
10
20
30
40
50
60
70
80
0 20 40 60 80 100 120
Fluo
resc
ence
Inte
nsity
(i.u
.)
Distance to the nearest blood vessel (µm)
10 min3 hrs24 hrs
0
2
4
6
8
10
12
14
16
18
20
0 20 40 60 80 100 120
Fluo
resc
ence
Inte
nsity
(i.u
.)
Distance to the nearest blood vessel (µm)
10 min3 hrs24 hrs
0
1000
2000
3000
4000
5000
6000
7000
10 min 3 hrs 24 hrs
Fluo
resc
ence
Inte
nsity
in R
elat
ion
to
Dist
ance
to th
e N
eare
st B
lood
Ves
sel (
area
un
der t
he c
urve
)
0
500
1000
1500
2000
2500
10 min 3 hrs 24 hrs
Fluo
resc
ence
Inte
nsity
in R
elat
ion
to
Dist
ance
to th
e N
eare
st B
lood
Ves
sel (
area
un
der t
he c
urve
)
0
200
400
600
800
1000
1200
10 min 3 hrs 24 hrs
Fluo
resc
ence
Inte
nsity
in R
elat
ion
to
Dist
ance
to th
e N
eare
st B
lood
Ves
sel (
area
un
der t
he c
urve
)
***
***
***
*****
****
***
***
97

Figure 2.4 Time-dependent effects of the anticancer drugs on blood vessels and hypoxia in MDA-MB-231 tumours. (A) Blood vessels and (B) hypoxic regions per tumour area were quantified. Within each drug the first bar is after 10 minutes, second bar after 3 hours and third bar after 24 hours. (Data represents mean ± SE for 3-8 tumours).
0
1
2
3
4
5
6
7
8
9
Control DOX MITOX TOPO
Hypo
xia
per T
umou
r Are
a
0
0.005
0.01
0.015
0.02
0.025
Control DOX MITOX TOPO
Bloo
d Ve
ssel
s per
Tum
our A
rea
A B
98

Figure 2.5 Doxorubicin distribution in tumour and normal tissue in MDA-MB-231 tumour bearing mice at 10 minutes after injection. Photomicrographs of heart (A), kidney (B), liver (C) and tumour (D) tissues are shown. Doxorubicin (blue), blood vessels (red) and hypoxic regions (green). Fluorescence intensity gradients are shown in relation to distance to the nearest blood vessel for all tissues (E) and on an expanded scale for tumours (F). (Scale bar represents 100µm).
A B
C D
0
50
100
150
200
250
0 20 40 60 80 100
Dox
orub
icin
Flu
ores
cenc
e In
tens
ity (i
.u.)
Distance (um)
HeartKidneyLiverTumour
0
1
2
3
4
5
6
7
8
9
10
0 20 40 60 80 100
Dox
orub
icin
Flu
ores
cenc
e In
tens
ity (i
.u.)
Distance (um)
E F
99

Figure 2.6 Perivascular doxorubicin distribution and blood vessel density in normal and tumour tissue at 10 minutes after injection. (A) Quantification of doxorubicin fluorescence the regions closest to blood vessels and (B) total number of blood vessels (CD31) per tissue area. (Data represents mean ± SE; for 3-7 normal and tumour tissues).
0
20
40
60
80
100
120
140
160
Heart Kidney Liver Tumour
Dox
orub
icin
Flu
orsc
ence
Inte
nsity
Cl
oses
t to
Bloo
d Ve
ssel
s
0
0.004
0.008
0.012
0.016
0.02
0.024
Heart Kidney Liver Tumour
Bloo
d Ve
ssel
s per
Tis
sue
Area
A
B
*
* *
100
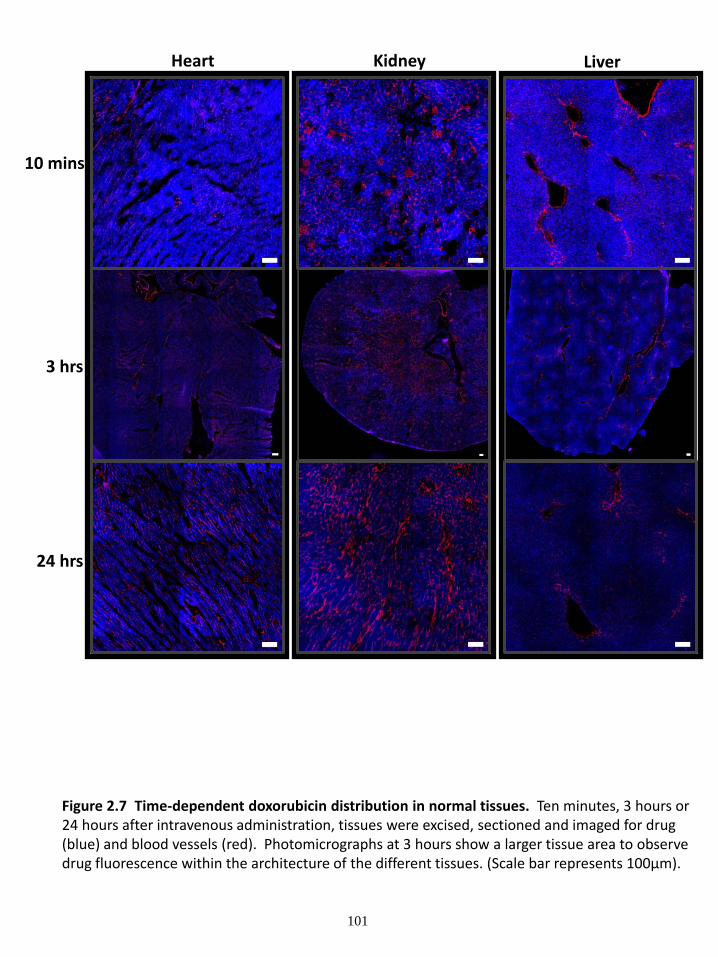
Figure 2.7 Time-dependent doxorubicin distribution in normal tissues. Ten minutes, 3 hours or 24 hours after intravenous administration, tissues were excised, sectioned and imaged for drug (blue) and blood vessels (red). Photomicrographs at 3 hours show a larger tissue area to observe drug fluorescence within the architecture of the different tissues. (Scale bar represents 100µm).
Heart LiverKidney
10 mins
3 hrs
24 hrs
101

Figure 2.8 Time-dependent mitoxantrone distribution in normal tissues. Three hours and 24 hours after intravenous administration, tissues were excised, sectioned and imaged for drug (cyan) and blood vessels (red). Photomicrographs at 3 hours show a larger tissue area to observe drug fluorescence within the architecture of the different tissues (Scale bar represents 100µm).
Heart LiverKidney
3 hrs
24 hrs
102

Figure 2.9 Time-dependent topotecan distribution in normal tissues. Ten minutes, 3 hours or 24 hours after intravenous administration, tissues were excised, sectioned and imaged for drug (yellow) and blood vessels (red). Photomicrographs at 3 hours show a larger tissue area to observe drug fluorescence within the architecture of the different tissues(Scale bar represents 100µm).
Heart LiverKidney
10 mins
3 hrs
24 hrs
103

Figure 2.10 Drug distribution in normal tissues in relation to distance to the nearest blood vessel. Fluorescence intensity gradients of the drugs in relation to distance to the nearest blood vessel are shown 10 minutes, 3 hours and 24 hours after intravenous administration. (Data represents mean ± SE; n = 3 (for each drug and each normal tissue)).
DOX MITOX TOPO
10 mins
0
50
100
150
200
0 20 40 60 80 100
Doxo
rubi
cin
Fluo
resc
ence
Inte
nsity
(i.u
.)
Distance to the nearest blood vessel (um)
HeartKidneyLiver
0
50
100
150
200
0 20 40 60 80 100
Doxo
rubi
cin
Fluo
resc
ence
Inte
nsity
(i.u
.)
Distance to the nearest blood vessel (um)
HeartKidneyLiver
0
50
100
150
200
0 20 40 60 80 100Do
xoru
bici
n Fl
uore
scen
ce In
tens
ity (i
.u.)
Distance to the nearest blood vessel (um)
HeartKidneyLiver
0
50
100
150
200
0 20 40 60 80 100
Doxo
rubi
cin
Fluo
resc
ence
Inte
nsity
(i.u
.)
Distance to the nearest blood vessel (um)
HeartKidneyLiver
0
50
100
150
200
0 20 40 60 80 100
Doxo
rubi
cin
Fluo
resc
ence
Inte
nsity
(i.u
.)
Distance to the nearest blood vessel (um)
HeartKidneyLiver
0
50
100
150
200
0 20 40 60 80 100
Doxo
rubi
cin
Fluo
resc
ence
Inte
nsity
(i.u
.)
Distance to the nearest blood vessel (um)
HeartKidneyLiver
0
50
100
150
200
0 20 40 60 80 100
Doxo
rubi
cin
Fluo
resc
ence
Inte
nsity
(i.u
.)
Distance to the nearest blood vessel (um)
Liver
0
50
100
150
200
0 20 40 60 80 100
Doxo
rubi
cin
Fluo
resc
ence
Inte
nsity
(i.u
.)
Distance to the nearest blood vessel (um)
HeartKidneyLiver
0
50
100
150
200
0 20 40 60 80 100
Doxo
rubi
cin
Fluo
resc
ence
Inte
nsity
(i.u
.)
Distance to the nearest blood vessel (um)
HeartKidneyLiver
3 hrs
24 hrs
104

Figure 2.11 Time dependent drug concentrations in normal tissue. A measure of total (A) doxorubicin (B) mitoxantrone and (C) toptecan concentration 10 minutes, 3 hours and 24 hours after drug treatment . (Data represents mean ± SE for 3 samples per drug per tissue).
0
2000
4000
6000
8000
10000
12000
14000
16000
Heart Kidney Liver
Fluo
rsce
nce
Inte
nsity
in R
elat
ion
to th
e N
eare
st B
lood
Ve
ssel
(are
a un
der t
he c
urve
)
A
B
C
0
2000
4000
6000
8000
10000
12000
Heart Kidney Liver
Fluo
rsce
nce
Inte
nsity
in R
elat
ion
to th
e N
eare
st B
lood
Ve
ssel
(are
a un
der t
he c
urve
)0
1000
2000
3000
4000
5000
6000
7000
8000
Heart Kidney Liver
Fluo
rsce
nce
Inte
nsity
in R
elat
ion
to th
e N
eare
st B
lood
Ve
ssel
(are
a un
der t
he c
urve
)
105

Figure 2.12 Mitoxantrone distribution in mouse liver with a secondary tumour. Drug distribution 3 hours after treatment is observed in regions of normal liver tissue compared to regions of tumour tissue. Drug is shown in cyan and blood vessels are shown in red. Two sections that were either predominantly liver (A) and predominantly tumour (B) were quantified for fluorescence distribution in relation to the nearest blood vessel (C), and the number of blood vessels per tissue area (D). (Scale bar represents 100µm).
0
10
20
30
40
50
60
70
0 20 40 60 80 100
Doxo
rubi
cin
Fluo
resc
ence
Inte
nsity
(i.u
.)
Distance to the nearest blood vessel (um)
TumourLiver
0
20
40
60
80
100
120
140
160
180
Liver Tumour
Bloo
d Ve
ssel
s per
Tis
sue
Area
A
B
C D
106

Figure 2.13 Drug distribution in the brain. Nude mice were treated intravenously with either doxorubicin, mitoxantrone or topotecan. Photomicrographs represent drug (doxorubicin (blue), mitoxantrone (cyan), topotecan (yellow)) distribution in the brain 3 hours after treatment. (Scale bar represents 100µm).
DOX MITOX TOPO
Brain
107

108
2.7 REFERENCES 1. Gewirtz DA. A critical evaluation of the mechanisms of action proposed for the antitumor effects of the anthracycline antibiotics adriamycin and daunorubicin. Biochemical pharmacology 1999;57(7):727-41. 2. Sartiano GP, Lynch WE, Bullington WD. Mechanism of action of the anthracycline anti-tumor antibiotics, doxorubicin, daunomycin and rubidazone: preferential inhibition of DNA polymerase alpha. The Journal of antibiotics 1979;32(10):1038-45. 3. Young RC, Ozols RF, Myers CE. The anthracycline antineoplastic drugs. The New England journal of medicine 1981;305(3):139-53. 4. Gustafson DL, Rastatter JC, Colombo T, Long ME. Doxorubicin pharmacokinetics: Macromolecule binding, metabolism, and excretion in the context of a physiologic model. Journal of pharmaceutical sciences 2002;91(6):1488-501. 5. Benjamin RS, Riggs CE, Jr., Bachur NR. Plasma pharmacokinetics of adriamycin and its metabolites in humans with normal hepatic and renal function. Cancer research 1977;37(5):1416-20. 6. Hortobagyi GN. Anthracyclines in the treatment of cancer. An overview. Drugs 1997;54 Suppl 4:1-7. 7. Licata S, Saponiero A, Mordente A, Minotti G. Doxorubicin metabolism and toxicity in human myocardium: role of cytoplasmic deglycosidation and carbonyl reduction. Chemical research in toxicology 2000;13(5):414-20. 8. Lown JW. Anthracycline and anthraquinone anticancer agents: current status and recent developments. Pharmacol Ther 1993;60(2):185-214. 9. Faulds D, Balfour JA, Chrisp P, Langtry HD. Mitoxantrone. A review of its pharmacodynamic and pharmacokinetic properties, and therapeutic potential in the chemotherapy of cancer. Drugs 1991;41(3):400-49. 10. Jain KK. Evaluation of mitoxantrone for the treatment of multiple sclerosis. Expert Opin Investig Drugs 2000;9(5):1139-49. 11. Shenkenberg TD, Von Hoff DD. Mitoxantrone: a new anticancer drug with significant clinical activity. Annals of internal medicine 1986;105(1):67-81. 12. Alberts DS, Peng YM, Bowden GT, Dalton WS, Mackel C. Pharmacology of mitoxantrone: mode of action and pharmacokinetics. Invest New Drugs 1985;3(2):101-7. 13. Johnson JL, Ahmad A, Khan S, et al. Improved liquid chromatographic method for mitoxantrone quantification in mouse plasma and tissues to study the pharmacokinetics of a liposome entrapped mitoxantrone formulation. Journal of chromatography 2004;799(1):149-55. 14. Hsiang YH, Hertzberg R, Hecht S, Liu LF. Camptothecin induces protein-linked DNA breaks via mammalian DNA topoisomerase I. The Journal of biological chemistry 1985;260(27):14873-8. 15. Liu LF. DNA topoisomerase poisons as antitumor drugs. Annual review of biochemistry 1989;58:351-75. 16. Gordon AN, Fleagle JT, Guthrie D, Parkin DE, Gore ME, Lacave AJ. Recurrent epithelial ovarian carcinoma: a randomized phase III study of pegylated liposomal doxorubicin versus topotecan. J Clin Oncol 2001;19(14):3312-22. 17. von Pawel J, Schiller JH, Shepherd FA, et al. Topotecan versus cyclophosphamide, doxorubicin, and vincristine for the treatment of recurrent small-cell lung cancer. J Clin Oncol 1999;17(2):658-67.

109
18. Ardizzoni A, Hansen H, Dombernowsky P, et al. Topotecan, a new active drug in the second-line treatment of small-cell lung cancer: a phase II study in patients with refractory and sensitive disease. The European Organization for Research and Treatment of Cancer Early Clinical Studies Group and New Drug Development Office, and the Lung Cancer Cooperative Group. J Clin Oncol 1997;15(5):2090-6. 19. Carmichael J, Ozols RF. Topotecan, an active new antineoplastic agent: review and current status. Expert Opin Investig Drugs 1997;6(5):593-608. 20. Fujita H, Okamoto M, Takao A, Abe H, Ishii R, Takeda K. [Pharmacokinetics of SK & F 104864 in experimental animals. I. Plasma level]. Gan To Kagaku Ryoho 1995;22(12):1783-7. 21. Rowinsky EK, Grochow LB, Hendricks CB, et al. Phase I and pharmacologic study of topotecan: a novel topoisomerase I inhibitor. J Clin Oncol 1992;10(4):647-56. 22. De Cesare M, Zunino F, Pace S, Pisano C, Pratesi G. Efficacy and toxicity profile of oral topotecan in a panel of human tumour xenografts. Eur J Cancer 2000;36(12):1558-64. 23. de Vries NA, Ouwehand M, Buckle T, Beijnen JH, van Tellingen O. Determination of topotecan in human and mouse plasma and in mouse tissue homogenates by reversed-phase high-performance liquid chromatography. Biomed Chromatogr 2007;21(11):1191-200. 24. Urva SR, Shin BS, Yang VC, Balthasar JP. Sensitive high performance liquid chromatographic assay for assessment of doxorubicin pharmacokinetics in mouse plasma and tissues. Journal of chromatography 2009;877(8-9):837-41. 25. Rentsch KM, Horber DH, Schwendener RA, Wunderli-Allenspach H, Hanseler E. Comparative pharmacokinetic and cytotoxic analysis of three different formulations of mitoxantrone in mice. British journal of cancer 1997;75(7):986-92. 26. Grantab R, Sivananthan S, Tannock IF. The penetration of anticancer drugs through tumor tissue as a function of cellular adhesion and packing density of tumor cells. Cancer research 2006;66(2):1033-9. 27. Jain RK. Barriers to drug delivery in solid tumors. Sci Am 1994;271(1):58-65. 28. Lankelma J, Dekker H, Luque FR, et al. Doxorubicin gradients in human breast cancer. Clin Cancer Res 1999;5(7):1703-7. 29. Primeau AJ, Rendon A, Hedley D, Lilge L, Tannock IF. The distribution of the anticancer drug Doxorubicin in relation to blood vessels in solid tumors. Clin Cancer Res 2005;11(24 Pt 1):8782-8. 30. Tannock IF, Lee CM, Tunggal JK, Cowan DS, Egorin MJ. Limited penetration of anticancer drugs through tumor tissue: a potential cause of resistance of solid tumors to chemotherapy. Clin Cancer Res 2002;8(3):878-84. 31. Tredan O, Garbens AB, Lalani AS, Tannock IF. The hypoxia-activated ProDrug AQ4N penetrates deeply in tumor tissues and complements the limited distribution of mitoxantrone. Cancer research 2009;69(3):940-7. 32. Tosoni A, Ermani M, Brandes AA. The pathogenesis and treatment of brain metastases: a comprehensive review. Crit Rev Oncol Hematol 2004;52(3):199-215. 33. Less JR, Skalak TC, Sevick EM, Jain RK. Microvascular architecture in a mammary carcinoma: branching patterns and vessel dimensions. Cancer research 1991;51(1):265-73. 34. Jain RK. Delivery of molecular medicine to solid tumors. Science 1996;271(5252):1079-80. 35. Jain RK. Determinants of tumor blood flow: a review. Cancer research 1988;48(10):2641-58.

110
36. Benjamin LE, Golijanin D, Itin A, Pode D, Keshet E. Selective ablation of immature blood vessels in established human tumors follows vascular endothelial growth factor withdrawal. J Clin Invest 1999;103(2):159-65. 37. Carmeliet P, Jain RK. Angiogenesis in cancer and other diseases. Nature 2000;407(6801):249-57. 38. Hashizume H, Baluk P, Morikawa S, et al. Openings between defective endothelial cells explain tumor vessel leakiness. The American journal of pathology 2000;156(4):1363-80. 39. Heldin CH, Rubin K, Pietras K, Ostman A. High interstitial fluid pressure - an obstacle in cancer therapy. Nat Rev Cancer 2004;4(10):806-13. 40. Milosevic MF, Fyles AW, Wong R, et al. Interstitial fluid pressure in cervical carcinoma: within tumor heterogeneity, and relation to oxygen tension. Cancer 1998;82(12):2418-26. 41. Tunggal JK, Cowan DS, Shaikh H, Tannock IF. Penetration of anticancer drugs through solid tissue: a factor that limits the effectiveness of chemotherapy for solid tumors. Clin Cancer Res 1999;5(6):1583-6. 42. Zheng JH, Chen CT, Au JL, Wientjes MG. Time- and concentration-dependent penetration of doxorubicin in prostate tumors. AAPS PharmSci 2001;3(2):E15. 43. Nederman T, Carlsson J. Penetration and binding of vinblastine and 5-fluorouracil in cellular spheroids. Cancer Chemother Pharmacol 1984;13(2):131-5. 44. Erlanson M, Daniel-Szolgay E, Carlsson J. Relations between the penetration, binding and average concentration of cytostatic drugs in human tumour spheroids. Cancer Chemother Pharmacol 1992;29(5):343-53. 45. Durand RE, LePard NE. Modulation of tumor hypoxia by conventional chemotherapeutic agents. Int J Radiat Oncol Biol Phys 1994;29(3):481-6. 46. Bocci G, Nicolaou KC, Kerbel RS. Protracted low-dose effects on human endothelial cell proliferation and survival in vitro reveal a selective antiangiogenic window for various chemotherapeutic drugs. Cancer research 2002;62(23):6938-43. 47. Miller KD, Sweeney CJ, Sledge GW, Jr. Redefining the target: chemotherapeutics as antiangiogenics. J Clin Oncol 2001;19(4):1195-206. 48. Greene RF, Collins JM, Jenkins JF, Speyer JL, Myers CE. Plasma pharmacokinetics of adriamycin and adriamycinol: implications for the design of in vitro experiments and treatment protocols. Cancer research 1983;43(7):3417-21. 49. Wilkinson PM, Israel M, Pegg WJ, Frei E, 3rd. Comparative metabolism and excretion of adriamycin in man, monkey, and rat. Cancer Chemother Pharmacol 1979;2(2):121-5. 50. Haas NB, LaCreta FP, Walczak J, et al. Phase I/pharmacokinetic study of topotecan by 24-hour continuous infusion weekly. Cancer research 1994;54(5):1220-6. 51. Dorr RT. Cytoprotective agents for anthracyclines. Semin Oncol 1996;23(4 Suppl 8):23-34. 52. Weiss RB. The anthracyclines: will we ever find a better doxorubicin? Semin Oncol 1992;19(6):670-86. 53. Gonzalez-Paz O, Polizzi D, De Cesare M, et al. Tissue distribution, antitumour activity and in vivo apoptosis induction by MEN10755 in nude mice. Eur J Cancer 2001;37(3):431-7. 54. Devalapally H, Rajan KS, Akkinepally RR, Devarakonda RK. Safety, pharmacokinetics and biodistribution studies of a beta-galactoside prodrug of doxorubicin for improvement of tumor selective chemotherapy. Drug development and industrial pharmacy 2008;34(8):789-95. 55. Alberts DS, Peng YM, Leigh S, Davis TP, Woodward DL. Disposition of mitoxantrone in cancer patients. Cancer research 1985;45(4):1879-84.

111
56. Crawford AR, Lin XZ, Crawford JM. The normal adult human liver biopsy: a quantitative reference standard. Hepatology (Baltimore, Md 1998;28(2):323-31. 57. Rubin LL, Staddon JM. The cell biology of the blood-brain barrier. Annual review of neuroscience 1999;22:11-28. 58. Kemper EM, Boogerd W, Thuis I, Beijnen JH, van Tellingen O. Modulation of the blood-brain barrier in oncology: therapeutic opportunities for the treatment of brain tumours? Cancer treatment reviews 2004;30(5):415-23. 59. El-Gizawy SA, Hedaya MA. Comparative brain tissue distribution of camptothecin and topotecan in the rat. Cancer Chemother Pharmacol 1999;43(5):364-70.

112
CHAPTER 3
THE INFLUENCE OF P-GLYCOPROTEIN EXPRESSION AND ITS INHIBITORS ON THE DISTRIBUTION OF DOXORUBICIN
IN BREAST TUMOURS
Krupa J. Patel1 and Ian F. Tannock1,2
1 Department of Medical Biophysics, University of Toronto, Toronto, ON, Canada
2 Medical Oncology and Hematology, Princess Margaret Hospital and University of Toronto, Toronto, ON, Canada
This data chapter was published in BioMed Central Cancer: Patel, KP and Tannock IF. The influence of P-glycoprotein expression and its inhibitors on the distribution of doxorubicin in breast tumors. BMC Cancer. 2009; 9(356): 1-10

113
3.1 ABSTRACT
Background: Anti-cancer drugs access solid tumours via blood vessels, and must penetrate
tumour tissue to reach all cancer cells. Previous studies have demonstrated steep gradients of
decreasing doxorubicin fluorescence with increasing distance from blood vessels, such that many
tumour cells are not exposed to drug. Studies using multilayered cell cultures show that
increased P-glycoprotein (PgP) is associated with better penetration of doxorubicin, while PgP
inhibitors decrease drug penetration in tumour tissue. Here we evaluate the effect of PgP
expression on doxorubicin distribution in vivo.
Methods: Mice bearing tumour sublines with either high or low expression of PgP were treated
with doxorubicin, with or without pre-treatment with the PgP inhibitors verapamil or PSC 833.
The distribution of doxorubicin in relation to tumour blood vessels was quantified using
immunofluorescence.
Results: Our results indicate greater uptake of doxorubicin by cells near blood vessels in wild
type as compared to PgP-overexpressing tumours, and pre-treatment with verapamil or PSC 833
increased uptake in PgP-overexpressing tumours. However, there were steeper gradients of
decreasing doxorubicin fluorescence in wild-type tumours compared to PgP overexpressing
tumours, and treatment of PgP overexpressing tumours with PgP inhibitors led to steeper
gradients and greater heterogeneity in the distribution of doxorubicin.
Conclusions: PgP inhibitors increase uptake of doxorubicin in cells close to blood vessels, have
little effect on drug uptake into cells at intermediate distances, and might have a paradoxical
effect to decrease doxorubicin uptake into distal cells. This effect probably contributes to the
limited success of PgP inhibitors in clinical trials.

114
3.2 INTRODUCTION
Effective systemic treatment of solid tumours requires that constituent cells be sensitive to
the drug(s) used and that the drug(s) be able to achieve a concentration within the cells sufficient
to cause cytotoxicity. The ability of anti-cancer drugs to gain access to all of the viable cells in
solid tumours depends on efficient delivery of drugs through the vascular system, and on
penetration of drugs to tumour cells that are distant from blood vessels. Solid tumours have an
inefficient bloody supply with tortuous and leaky vessels, large intercapillary distances and
intermittent blood flow. There is evidence that several anticancer drugs have poor penetration of
tumour tissue from blood vessels [1-5]. In particular there are steep gradients of decreasing
doxorubicin fluorescence with increasing distance from blood vessels in tumours grown in mice
and in human breast cancer, suggesting that limited drug penetration may be an important cause
of resistance to treatment [6, 7].
Many of the anticancer drugs in clinical use are natural products, or derivatives of natural
products (e.g. anthracyclines such as doxorubicin, vinca alkaloids such as vincristine and taxanes)
and they share common mechanisms of resistance. Many of these drugs are high affinity
substrates for energy-dependent membrane transporter proteins that act to pump drugs out of
cells. The best characterized of these drug efflux pumps is P-glycoprotein (PgP) [8-10]. P-
glycoprotein is widely expressed in many human cancers including those of the liver, pancreas,
kidney, ovary and breast. PgP is encoded by the multidrug resistance (MDR1) gene in humans
and is a member of a large family of ATP-dependent transporters known as the ATP-binding
cassette (ABC) family. Levels of PgP correlate with drug resistance in several different cancers
[11, 12]. This has led to the development of agents that reverse resistance to PgP substrates by
inhibiting the action of the pump. However, while phase II studies have suggested that PgP

115
inhibitors might increase drug sensitivity [13, 14], the majority of randomized controlled trials
evaluating PgP substrate drugs used in combination with or without PgP modulators, have not
shown significant improvements in outcome [15]. Various factors have been attributed to the
failure of PgP modulators in clinical trials such as high levels of toxicity and pharmacokinetic
interactions with the anticancer drugs [15, 16]. In the last decade novel techniques using
liposome-encapsulated doxorubicin in combination with PgP inhibitors such as verapamil and
PSC 833 have been developed to increase intracellular drug concentration and minimize toxicity
[17-19], however clinical data showing significant improvements in outcome have yet to be
reported. Thus, other factors may also contribute in explaining the limited effectiveness of PgP
inhibitors in vivo.
Studies have revealed differences in drug distribution within ex vivo tumour tissue models
containing cells expressing low levels of PgP and those with high PgP expression, and these
distributions can be modified by PgP inhibitors [20, 21]. The role of PgP and its inhibitors to
affect drug distribution within the microenvironment of solid tumours has not been studied. In
tumours that express low levels of PgP, it has been demonstrated that large quantities of drug
remain in the cell layers closest to blood vessels, while distal cells acquire little to no drug [7,
22]. We hypothesized that PgP, by preventing cellular accumulation of drug in cells close to
blood vessels would allow greater quantities of drug to be available to distal cells. Studies of
drug penetration through multilayered cell cultures (MCC) support this hypothesis [20].
Although cellular accumulation of drug is important for cytotoxicity, if it is localized to
perivascular regions, then there is likely to be a limited overall therapeutic effect on the tumour.
Here we examine in solid tumour models the trade-off between drug uptake and drug distribution
that is presented by PgP overexpression and PgP inhibitors.

116
3.3 MATERIALS AND METHODS 3.3.1 Drugs and reagents Doxorubicin (Pharmacia, Mississauga, Canada) was purchased from the hospital
pharmacy as a solution at a concentration of 2 mg/mL. Purified rat anti-mouse CD31
(platelet/endothelial adhesion molecule 1) monoclonal antibody was purchased from BD
PharmMingen (Mississauga, Canada), and Cy3-conjugated goat anti-rat IgG secondary antibody
was purchased from Jackson ImmunoResearch Laboratories, Inc. (Pennsylvania, USA). The
first-generation PgP inhibitor, verapamil was purchased from Sigma Laboratories (Oakville,
Canada). The second-generation inhibitor, PSC 833 or valspodar, was generously provided by
Novartis (Basel, Switzerland).
3.3.2 Tumour model The mouse mammary sarcoma EMT6, and its PgP-upregulated variant AR1, were
provided originally by Dr Peter Twentyman, Cambridge UK. The human breast cancer cell line
MCF-7 was obtained from the American Type Culture Collection (ATCC; Virginia, USA), and
its PgP upregulated variants BC19 and MCF-ADR were provided by Dr. Marilyn Morris
(Buffalo, NY), and Dr. Kenneth Cowan (Nebraska).
EMT6 and MCF-7 cells were maintained as monolayers in α-MEM and RPMI media
respectively, supplemented with 10% FCS at 37°C in a humidified atmosphere of 95% air plus
5% CO2. The AR1, BC19 and MCF-7/ADR cell lines were maintained in similar conditions to
the parental lines with the exception that the media contained 10µg/mL doxorubicin.
Tumours were generated by subcutaneous injection of 1 – 5 x 10⁶ exponentially growing
cells into the left and right flank regions of 6-8 week old Balb/C (EMT6 and AR1) or athymic
nude (MCF-7, BC19 and MCF-7/ADR) female mice. Mice were housed five per cage in our

117
animal colony. Sterile water and food were given ad libitum. All procedures were carried out
following approval of the Institutional Animal Care Committee.
3.3.3 Evaluation of doxorubicin distribution
Tumour-bearing mice were divided randomly into groups of five and were treated when
the mean tumour diameter was in the range of 8-12 mm. Animals were treated with doxorubicin,
doxorubicin and a PgP inhibitor, or phosphate-buffered saline (CaCl2-MgCl2). Doxorubicin was
given intravenously at a dose of 25mg/kg to facilitate detection and quantification of drug auto-
fluorescence. Each PgP inhibitor was administered intraperitoneally two hours prior to
doxorubicin treatment at a dose of 25 mg/kg. Animals were killed 10 minutes after doxorubicin
injection and the tumours were excised. The tissues were embedded immediately in optimal
cutting temperature (OCT) compound, frozen in liquid nitrogen, and stored at -70°C prior to
tissue sectioning and immunohistochemical staining. Cryostat sections 10 µm thick were cut at 3
levels approximately 100 µm apart from each tumour, mounted on glass slides and allowed to air
dry.
3.3.4 Fluorescence imaging
Doxorubicin fluorescence was detected utilizing an Olympus Upright BX50 microscope
with a 100W HBO mercury light source equipped with 530 to 560 nm excitation and 573 to 647
nm emission filter sets. Tissue sections were imaged with a Photometrics CoolSNAP HQ2
(monochrome for fluorescence imaging) camera and tiled using a motorized stage so that the
distribution of doxorubicin was obtained for the entire tissue section. All images were captured
in 8-bit signal depth and subsequently pseudo-colored.
Blood vessels in tissue sections were recognized by the expression of CD31 on
endothelial cells. Subsequent to imaging of doxorubicin, tissue sections were stained with a rat

118
anti-CD31 antibody (1/100) followed by a Cy3-conjugated goat anti-rat IgG secondary antibody
(1/400). Tissue sections were re-imaged in an identical way to that used to capture doxorubicin
fluorescence.
3.3.5 Image analysis
Composite images of doxorubicin and CD31 were generated utilizing Media Cybernetics
Image Pro PLUS software (version 5.0). Images displaying anti-CD31 staining were converted to
a black and white binary image, and small white objects were removed as artifacts based on
conservative estimation of minimal capillary diameter [23]. The resultant image was overlaid
with the corresponding field of view displaying doxorubicin fluorescence resulting in an 8 bit
black and white image with blood vessels identified by pixels with intensities between 250-255
(white) and doxorubicin ranging from 0-249. Several regions, 1.6 mm2 in area, with moderate
blood vessel density were selected from each tissue section. Blood vessel density was
determined by quantifying the number of pixels with intensities between 250-255 as a percent of
the number of pixels with intensities from 1-249 using Image J software. Areas of necrosis and
staining artifact were excluded. To minimize noise from tissue auto-fluorescence a minimum
signal level just below threshold for detection of doxorubicin was set for each tissue section; this
was based on an average background reading from regions without nuclear fluorescence/staining.
The pixel intensity (the area of each pixel was 0.4 μm2) and distance to the nearest vessel for all
pixels within the selected region of interest above threshold were measured with a customized
algorithm.
Doxorubicin intensity (I) was averaged over all pixels at a given distance (x) from the
nearest vessel and plotted as a function of distance to the nearest vessel. Linear regression was
performed to correlate the average doxorubicin fluorescence intensity with distance from the

119
nearest blood vessel; the slope of the linear regression was statistically compared between
treatment groups using ANOVA and subsequent t-tests. All linear regressions were statistically
significant and residual plots showed no consistent patterns.
A model comparing doxorubicin distribution in PgP overexpressing tumours pre-treated
with either saline or a PgP inhibitor was generated using the mean slope and y-intercept from the
linear regressions for both the murine and xenograft tumour types.
3.3.6 Growth delay studies
Mice bearing EMT6 or AR1 tumours were divided into six groups of 4-5 mice each and
treated with either saline, doxorubicin alone (8mg/kg i.v., verapamil alone (25mg/kg i.p.), PSC
833 alone (25mg/kg), verapamil + doxorubicin (25mg/kg + 8 mg/kg) or PSC 833 + doxorubicin
(25mg/kg + 8 mg/kg). In the latter two groups mice were treated with the PgP inhibitor 2 hours
prior to doxorubicin treatment. Every 2-3 days the length and width of the tumours were
measured using calipers and tumour volume was calculated. Measurements were taken until
tumours reached their maximum limit in size. The body weight of the mice was also measured.
3.4 RESULTS
3.4.1 Blood vessel density
Blood vessel density within areas of interest was measured and found to be within a small
range. Murine tumours are significantly more vascular than the xenografts (Table 3.1). Within a
given tumour section there are small areas with high blood vessel density where no gradients of
decreasing doxorubicin fluorescence are observed, but the majority of the tumour section is
composed of areas of moderate blood vessel density with gradients of decreasing doxorubicin
fluorescence with increasing distance from vessels.

120
Table 3.1 Characteristics of wild-type (EMT6, MCF-7) and PgP overexpressing tumours (AR1, BC19) at 10 minutes after treatment with doxorubicin (DOX) or with pre-treatment 2 hours earlier with inhibitors of PgP.
Tumour Type
PgP vs. Wild-type
Treatment Blood Vessel
Density (# of BV)
DOX uptake at distance from the nearest blood vessel (intensity units) 10-20μm 50-60μm 110-120μm
Gradient of Decreasing
DOX Intensity*
EMT6 Wild Type DOX 4.7 ± 1.2 29.4 ± 6.1a 15.6 ± 1.9 11.3 ± 2.4 -0.23 ± 0.08c
AR1 Overexpress PgP
DOX 6.0 ± 1.4
17.1 ± 2.9ab 10.5 ± 2.8c 7.4 ± 1.6 -0.11 ± 0.03cde
AR1 Overexpress PgP
Verapamil + DOX
4.4 ± 1.1 24.7 ± 8.3 13.7 ± 4.2 9.2 ± 4.0 -0.18 ± 0.06d
AR1 Overexpress PgP
PSC 833 + DOX
4.7 ± 1.3 34.0 ± 4.3b 16.4 ± 2.3c 12.1 ± 3.7 -0.27 ± 0.04e
MCF-7 Wild Type DOX 2.6 ± 0.7 23.8 ± 4.2f 13.7 ± 2.5 10.4 ± 2.3 -0.16 ± 0.05h
BC19 Overexpress PgP
DOX 2.7 ± 0.4
13.0 ± 4.3fg 9.6 ± 2.8 8.7 ± 3.5 -0.05 ± 0.03hij
BC19 Overexpress PgP
Verapamil + DOX
3.6 ± 0.8 22.1 ± 5.9 13.9 ± 3.7 9.2 ± 1.1 -0.14 ± 0.04i
BC19
Overexpress PgP
PSC 833 + DOX
2.9 ± 0.7 24.2 ± 4.1g 14.4 ± 2.5 10.9 ± 3.6 -0.17 ± 0.05j
Top and bottom panels were tested separately for significant differences using ANOVA and subsequent t-tests Within the top panel, a-e represent the pairs of data that are statistically significant (p < 0.05) Within the bottom panel, f-j represent the pairs of data that are statistically significant (p < 0.05) *Gradient represents the slopes of regression lines of decreasing doxorobucin fluorescence in relation to distance to the nearest blood vessel

121
3.4.2 PgP overexpression and doxorubicin distribution Representative composite images showing the distribution of doxorubicin 10 minutes
after administration in relation to blood vessels of wild-type EMT6 tumours, and in tumours
derived from cells that over-express PgP are shown in Figures 3.1a-b; similar images for
MCF7/BC19 xenografts are shown in Figures 3.1c-d. A summary of data obtained from these
sections is provided in Table 1. In PgP overexpressing tumours, a more homogeneous
distribution of doxorubicin is observed as compared to wild-type tumours of both murine and
human origin (Figure 3.1). The gradient of decreasing doxorubicin fluorescence intensity is
significantly greater in wild-type tumours that have low levels of PgP expression (Table 3.1).
Whereas wild-type tumours show an exponential decrease in doxorubicin fluorescence with
distance from blood vessels, PgP overexpressing tumours show a more linear decrease (Figure
3.2). Close to blood vessels (i.e. in the first 10μm), doxorubicin uptake is significantly lower in
tumours that overexpress PgP, but at 50-60μm from blood vessels, the difference in doxorubicin
uptake is less and by 110-120μm, there is no significant difference (Table 3.1 and Figure 3.2).
3.4.3 PgP inhibitors and doxorubicin penetration
The effects of verapamil and PSC 833 on distribution of doxorubicin in PgP-
overexpressing AR1 tumours are shown in Figures 3A and 3B, and for corresponding BC19
xenografts in Figures 3.3c-d. Both PgP inhibitors lead to an increase in uptake of doxorubicin by
cells close to blood vessels, but increase the gradient of decreasing intensity so that the
distribution is more heterogeneous and similar to that of wild-type tumours (Table 3.1). Figure
3.4 shows the distribution of doxorubicin in PgP overexpressing tumours with or without
pretreatment with PgP inhibitors. Doxorubicin fluorescence intensity in the first 10 µm from
blood vessels is significantly greater in PgP overexpressing tumours that were pretreated with

122
verapamil and PSC 833 in the murine tumour model, and with PSC 833 in the xenograft model.
At further distances (110-120μm), no significant difference is observed in doxorubicin uptake
between control tumours and tumours pretreated with PgP inhibitors (Table 3.1 and Figure 3.4).
At distances greater than about 90 - 100μm from blood vessels estimates of doxorubicin
fluorescence are subject to noise, most likely due to the influence of closer blood vessels out of
the plane of the sections. While in some areas of the tumours, neighboring vessels may
contribute doxorubicin fluorescence in distal cells, in other areas this may not be the case and
there may be a sharp decrease in doxorubicin. We have shown the average doxorubicin
distribution taken from several areas of interest. Modeling from this data by removing noise
from neighboring vessels suggests that the use of potent PgP inhibitors, such as PSC 833 might
lead to a paradoxical decrease in the uptake of doxorubicin in tumour cells situated more distant
from tumour blood vessels (Figure 3.4c). According to the model, at around 90-100μm in the
murine model and 100-115μm in the xenograft model doxorubicin fluorescence intensity is
greater in the PgP overexpressing tumours that are treated with doxorubicin alone compared to
those pretreated with a PgP inhibitor.
3.4.4 Growth delay and toxicity
Doxorubicin led to modest delay in growth of wild-type EMT6 tumours (Figure 3.5a) but
had no significant effect on PgP overexpressing AR1 tumours. The PgP inhibitors did not
modify growth delay for either type of tumour. Body weight was used as an indication of
toxicity. Most treatments were well tolerated and caused no significant loss of body weight after
treatment. The combination of doxorubicin and PSC 833 was toxic to mice and caused a 20-25%

123
reduction in body weight within the first 3-5 days. Mice in this group were killed after 5 days
because of this toxicity.
3.5 DISCUSSION
In order for chemotherapy to have an optimal effect against solid tumours, there must be
adequate distribution of drugs, such that there is accumulation of drug within all cancer cell
populations that can regenerate the tumour. Repopulation of surviving tumour cells between
courses of chemotherapy is an important mechanism of drug resistance [24-28], and viable cells
distal from blood vessels that do not receive cytotoxic concentrations of drug might be an
important source of such repopulation [29].
Drug distribution may be influenced in tumour tissue by the presence of high interstitial
fluid pressure, an extensive extracellular matrix, cell-cell contact and the expression of efflux
pumps such as PgP on the cell surface. It has been proposed that since PgP and other drug
transporters reduce cellular accumulation of their substrates, they might assist in transporting the
drugs to neighboring cells farther away from blood vessels, resulting in a net increase in tissue
penetration of chemotherapeutic agents [2]. This hypothesis has been supported by the
observation of increased penetration of [14C] doxorubicin through drug-resistant MCCs (PgP
overexpressing) compared to drug-sensitive MCCs (wild-type) [20]; inhibitors of PgP stimulated
cellular accumulation of drugs, but resulted in reduced penetration through tumour tissue in this
model [20]. While using MCCs provides insight into the penetration of drugs through solid
tissue, they lack the 3-dimensional heterogeneity of solid tumours. In studies based on
multicellular spheroids, verapamil showed limited reversal of resistance by doxorubicin likely
due to its small diameter (approx. 100µm) and acidic microenvironmental affects on verapamil

124
activity [30, 31]. When a wide array of PgP reversal agents including cyclosporin A, verapamil,
quinidine, and sodium orthovanadate were used in larger spheroids an increase in doxorubicin
fluorescence as far as 80µm was observed. However, doxorubicin retention at these depths was
correlated with an increase in PgP expression, therefore changes in doxorubicin distribution
patterns throughout the spheroid tissue due to PgP overexpression and inhibitors could not be
assessed [32]. Multicellular spheroids allow good insight into drug fluorescence however, they
lack vasculature and certain microenvironmental conditions that lead to specific phenotypes such
as multidrug resistance and tumour acidity.
Here, we have investigated the effects of PgP overexpression and PgP inhibitors on
doxorubicin distribution in solid tumours grown in mice. The distribution of doxorubicin is quite
variable within tumour tissue. In well-vascularized areas drug distribution is relatively uniform;
however in most areas of the tumour where there are few blood vessels, distribution to cells distal
from blood vessels is limited so that many viable tumour cells have minimal exposure to drug,
allowing them to survive and proliferate. For this reason, we selected areas of interest within a
tumour section that had low vascular density. We examined doxorubicin distribution 10 minutes
after intravenous administration because previous studies in our laboratory have shown no
difference in doxorubicin distribution in relation to the nearest blood vessel beyond this time
point [7].
Similar to data for MCCs, our results show an increase in doxorubicin distribution in the
PgP overexpressing tumours AR1 and MCF-7/ADR compared to their wild-type variants EMT6
and MCF-7, respectively. There is rapid cellular uptake of doxorubicin in wild-type cells and
this is largely due to its ability to bind tightly to DNA [33], and in tumours derived from them,
large amounts of drug accumulate in cells closest to blood vessels. Doxorubicin is a PgP

125
substrate, that is efficiently pumped out of tumour cells where PgP is highly expressed [16].
Thus, in PgP overexpressing tumours there is less uptake and binding into proximal cells,
resulting in a shallower gradient of decreasing doxorubicin fluorescence with increasing distance
from tumour blood vessels. These results do not imply that PgP overexpressing tumours allow
for more effective drug treatment, since cellular accumulation of drug is essential for
cytotoxicity, and PgP expression will decrease relative uptake of substrate drugs in all tumour
cells. However, our results demonstrate that PgP efflux can significantly alter the biodistribution
of chemotherapeutic agents, such that decreased proximal uptake of drug may be counter-
balanced by greater amounts of doxorubicin available to distal cells in solid tumours.
Methods of inhibiting PgP have been studied extensively for over two decades. Many
agents that modulate PgP transport such as verapamil and cyclosporin were identified in the
1980s, and were evaluated as chemosensitizing agents. These agents produced disappointing
results in clinical trials in part because their low binding affinities necessitated the use of high
doses, resulting in unacceptable toxicities [15]. In our studies, a relatively low dose of verapamil
(25mg/kg) was used to determine its effect on drug distribution. While toxicity is likely to be the
primary cause of the ineffectiveness of verapamil to improve the sensitivity of tumours to
substrate drugs, our studies show that modification of doxorubicin distribution in tumours might
be an additional cause of their failure to improve tumour response to chemotherapy.
Second generation PgP modulators include valspodar (PSC 833), biricodar, and
dexniguldipine. These agents are more potent and specific than first generation inhibitors [16].
Valspodar has been studied in clinical trials in combination with cytotoxic agents [14, 34]. A
study by Coley et al [35], that used fresh tumour material from patients with soft-tissue sarcomas
indicated that valspodar at 1nM had a modest effect to increase anthracycline accumulation (by ~

126
20%) in PgP positive samples. In a study of women with epithelial ovarian cancer, the effect was
of a similar magnitude; these limited effects might explain in part the disappointing results of
clinical trials. Some second generation PgP inhibitors are also, like cytotoxic agents, substrates
of cytochrome P450 3A4, an important enzyme involved in metabolism, and the competition
between cytotoxic drugs and PgP inhibitors for cytochrome P450 activity has resulted in
unpredictable pharmacokinetic interactions. Here we found substantial toxicity when a low dose
of PSC 833 was combined with doxorubicin. Marked pharmacologic interactions have been
observed in patients treated with this combination, leading to substantial increases in hematologic
toxicity [34], and requiring use of lower doses of anticancer drugs when used in combination.
Although cytotoxicity and pharmacokinetic interactions explain partially why PgP
inhibitors have not been very effective in clinical trials, a clear explanation for the minimal
effects to increase mean cellular accumulation of drug has yet to be provided. Studies to
determine cellular accumulation often involve homogenizing tumour tissue and conducting high-
performance liquid chromatography (HPLC) [36, 37]. This method is limiting, because it does
not give an indication of the distribution of drug.
Our study uses a non-orthotopic tumour mouse model to show that tumour cells in areas
far from blood vessels where PgP inhibitors have no effect (or possibly even a negative effect)
due to changes in distribution of doxorubicin, might counterbalance areas close to blood vessels
where uptake of doxorubicin into tumour cells is increased, thus limiting the effectiveness of
these inhibitors. While tumour dynamics, vasculature and heterogeneity affect drug distribution,
this non-orthotopic mouse model is still limited in fully representing the conditions in human
patients.

127
Computer- simulated mathematical models have shown that adequate drug distribution is
a crucial factor in determining drug effectiveness [38]. One model has demonstrated that drug
efflux from cells, enhanced by PgP, will result in a longer diffusion length [39]. These
mathematical models are powerful tools that can provide important insights about drug
distribution, because they can take into account drug pharmacodynamics [40], the spatio-
temporal accumulation of drug [41], the link between multiscale approaches [42, 43], and the
effects of local drug, oxygen and nutrient gradients on tumour growth and response [44]. Future
studies integrating our data with computer-simulated mathematical models may be a powerful
tool in determining drug distribution and its association with drug effectiveness in human
patients.
3.6 CONCLUSIONS
We have shown that PgP expression and inhibitors of PgP function can influence
doxorubicin distribution in some solid tumours. The distribution of doxorubicin is more
heterogeneous in wild-type tumours, than in those where constituent cells express PgP: drug
uptake is higher in cells close to blood vessels in wild-type tumours, but there are minimal
differences in drug uptake by more distal cells. Both the first-generation inhibitor verapamil and
the second-generation inhibitor valspodar alter drug penetration in both a murine tumour and a
human xenograft, leading to improved uptake of doxorubicin only in tumour cells within a
restricted radius around functional blood vessels. Whether PgP overexpressing tumours are
treated with a PgP inhibitor or not, cells distal to blood vessels at approximately 50-120μm, show
no significant difference in doxorubicin fluorescence (Table 1). Our modeling suggests the
possibility of a paradoxical effect of PgP inhibitors to cause PgP overexpressing tumours to have
128
increased uptake of doxorubicin in proximal cells, minimal or no effect on drug uptake at
intermediate distances from blood vessels but decreased drug uptake in more distal cells (Figure
4c). These results emphasize that while limited cellular accumulation of a drug is an important
mechanism of drug resistance, if there is a trade-off between uptake into proximal cells and
penetration to distal cells, therapeutic effectiveness may be limited, especially for drugs like
doxorubicin that have a short half-life in the circulation. Repopulation of tumour cells has been
shown to occur in regions far from blood vessels [29], and it is important to consider factors that
affect the distribution of chemotherapeutic agents in solid tumours. Numerous clinical trials
evaluating the effects of verapamil or valspodar in combination with chemotherapeutic agents
such as doxorubicin, vincristine, dexamethasone, cyclophosphamide, paclitaxel have shown that
patients given concurrent administration of PgP inhibitors with chemotherapeutic agents have an
increased toxicity and show modest or no increase in survival [45-49]. These results provide
insight into an important limitation of PgP inhibitors and this principle is likely to be applicable
to other membrane-based drug efflux proteins such as multiple drug resistance protein-1 (MRP-1)
and suggest the importance of considering drug distribution in the design and development of
novel treatment strategies.
Competing interests The author has no competing interests. Authors' contributions KJP participated in designing, planning and carrying out in vivo drug distribution studies, imaging, analysis and growth delay studies as well as drafting and revising the manuscript. IFT conceived the concepts underlying the study, designed the experiments, revised the manuscript and provided funding, grant support and oversight. Acknowledgements We would like to acknowledge the Pathology Research Program, the Advanced Optical Microscopy Facility, for their technical support and services. As well, the Canadian Institutes of Health Research for grant support.

129
3.7 FIGURES

A B
C D
130
Figure 3.1 Distribution of doxorubicin in solid tumours. Murine tumours EMT6 (A) and its PgP overexpressing subline AR1 (B) and MCF-7 human breast cancer xenograft (C) and its PgP overexpressing subline BC19 (D) were resected from Balb/C and nude mice, respectively. Doxorubicin is shown in blue and blood vessels are shown in red. Note more uniform distribution of doxorubicin in the PgP overexpressing tumours. (Scale bars = 100µm).

A
B
131
Figure 3.2 The gradient of doxorubicin fluorescence intensity in relation to distance from the nearest blood vessel. Mice-bearing either EMT6 or AR1 tumours (A) (n = 6 tumours each) or MCF-7 or BC19 xenografts (B) (n = 11 and 5 tumours, respectively) were treated with doxorubicin and their tumours were resected, sectioned and imaged. Image analysis was undertaken using customized algorithms. (Data represents mean ± SE).

A B
C D
132
Figure 3.3 Distribution of doxorubicin in solid tumours. Murine AR1 tumours were treated with either doxorubicin (A) or PSC 833 and doxorubicin (C). Similarly, BC19 xenografts were treated with either doxorubicin (B) or PSC 833 and doxorubicin (D). Doxorubicin is shown in blue and blood vessels are shown in red. (Scale bars = 100 µm).

B
A
Distance to the nearest blood vessel (μm)0 20 40 60 80 100 120 140 160Do
xoru
bici
n Fl
uore
scen
ce In
tens
ity (i
.u.)
50
40
30
20
10
PgP++ with inhibitor
PgP++
133
Figure 3.4 The gradient of doxorubicin fluorescence intensity in relation to distance from the nearest blood vessel and a model of doxorubicin distribution in solid tumours. Mice-bearing AR1 tumours (A) or BC19 xenografts (B) were treated with either doxorubicin alone, or pretreated with verapamil or PSC 833 and doxorubicin. Tumours were resected, sectioned and imaged. Image analysis was undertaken using customized algorithms (data represents mean ±SE). In panel A, 6, 10 and 9 tumours were analyzed, respectively. In panel B, 6, 7 and 6 tumours were analyzed, respectively. (C) represents a model of doxorubicin distribution without fluorescence interference from neighboring out-of-section blood vessels.

134
Figure 3.5 Tumour growth delay and toxicity studies. Mice-bearing EMT6 tumours (A) or AR1 tumours (B) were treated with either saline, doxorubicin alone, verapamil alone, PSC 833 alone or pretreated with verapamil or PSC 833 in combination with doxorubicin. Tumour volume and body weight was measured every 2-3 days. (Data represents mean ± SE; n = 5).

135
3.8 REFERENCES 1. Baguley BC, Finlay GJ: Pharmacokinetic/cytokinetic principles in the
chemotherapy of solid tumours. Clinical and experimental pharmacology & physiology 1995, 22(11):825-828.
2. Durand RE: Slow penetration of anthracyclines into spheroids and tumours: a therapeutic advantage? Cancer chemotherapy and pharmacology 1990, 26(3):198-204.
3. Erlanson M, Daniel-Szolgay E, Carlsson J: Relations between the penetration, binding and average concentration of cytostatic drugs in human tumour spheroids. Cancer chemotherapy and pharmacology 1992, 29(5):343-353.
4. Kerr DJ, Kaye SB: Aspects of cytotoxic drug penetration, with particular reference to anthracyclines. Cancer chemotherapy and pharmacology 1987, 19(1):1-5.
5. Tunggal JK, Cowan DS, Shaikh H, Tannock IF: Penetration of anticancer drugs through solid tissue: a factor that limits the effectiveness of chemotherapy for solid tumours. Clin Cancer Res 1999, 5(6):1583-1586.
6. Lankelma J, Dekker H, Luque FR, Luykx S, Hoekman K, van der Valk P, van Diest PJ, Pinedo HM: Doxorubicin gradients in human breast cancer. Clin Cancer Res 1999, 5(7):1703-1707.
7. Primeau AJ, Rendon A, Hedley D, Lilge L, Tannock IF: The distribution of the anticancer drug Doxorubicin in relation to blood vessels in solid tumours. Clin Cancer Res 2005, 11(24 Pt 1):8782-8788.
8. Juranka PF, Zastawny RL, Ling V: P-glycoprotein: multidrug-resistance and a superfamily of membrane-associated transport proteins. Faseb J 1989, 3(14):2583-2592.
9. Ling V: Charles F. Kettering Prize. P-glycoprotein and resistance to anticancer drugs. Cancer 1992, 69(10):2603-2609.
10. Gottesman MM, Fojo T, Bates SE: Multidrug resistance in cancer: role of ATP-dependent transporters. Nature reviews 2002, 2(1):48-58.
11. Goldstein LJ, Galski H, Fojo A, Willingham M, Lai SL, Gazdar A, Pirker R, Green A, Crist W, Brodeur GM et al: Expression of a multidrug resistance gene in human cancers. J Natl Cancer Inst 1989, 81(2):116-124.
12. Bradley G, Ling V: P-glycoprotein, multidrug resistance and tumour progression. Cancer Metastasis Rev 1994, 13(2):223-233.
13. Chico I, Kang MH, Bergan R, Abraham J, Bakke S, Meadows B, Rutt A, Robey R, Choyke P, Merino M et al: Phase I study of infusional paclitaxel in combination with the P-glycoprotein antagonist PSC 833. J Clin Oncol 2001, 19(3):832-842.
14. Bates S, Kang M, Meadows B, Bakke S, Choyke P, Merino M, Goldspiel B, Chico I, Smith T, Chen C et al: A Phase I study of infusional vinblastine in combination with the P-glycoprotein antagonist PSC 833 (valspodar). Cancer 2001, 92(6):1577-1590.
15. Ferry DR, Traunecker H, Kerr DJ: Clinical trials of P-glycoprotein reversal in solid tumours. Eur J Cancer 1996, 32A(6):1070-1081.

136
16. Krishna R, Mayer LD: Multidrug resistance (MDR) in cancer. Mechanisms, reversal using modulators of MDR and the role of MDR modulators in influencing the pharmacokinetics of anticancer drugs. Eur J Pharm Sci 2000, 11(4):265-283.
17. Krishna R, Mayer LD: Liposomal doxorubicin circumvents PSC 833-free drug interactions, resulting in effective therapy of multidrug-resistant solid tumours. Cancer research 1997, 57(23):5246-5253.
18. Krishna R, St-Louis M, Mayer LD: Increased intracellular drug accumulation and complete chemosensitization achieved in multidrug-resistant solid tumours by co-administering valspodar (PSC 833) with sterically stabilized liposomal doxorubicin. Int J Cancer 2000, 85(1):131-141.
19. Wang JC, Liu XY, Lu WL, Chang A, Zhang Q, Goh BC, Lee HS: Pharmacokinetics of intravenously administered stealth liposomal doxorubicin modulated with verapamil in rats. Eur J Pharm Biopharm 2006, 62(1):44-51.
20. Tunggal JK, Melo T, Ballinger JR, Tannock IF: The influence of expression of P-glycoprotein on the penetration of anticancer drugs through multicellular layers. Int J Cancer 2000, 86(1):101-107.
21. Martin C, Walker J, Rothnie A, Callaghan R: The expression of P-glycoprotein does influence the distribution of novel fluorescent compounds in solid tumour models. British journal of cancer 2003, 89(8):1581-1589.
22. Kyle AH, Huxham LA, Yeoman DM, Minchinton AI: Limited tissue penetration of taxanes: a mechanism for resistance in solid tumours. Clin Cancer Res 2007, 13(9):2804-2810.
23. Less JR, Skalak TC, Sevick EM, Jain RK: Microvascular architecture in a mammary carcinoma: branching patterns and vessel dimensions. Cancer research 1991, 51(1):265-273.
24. Stephens TC, Peacock JH: Tumour volume response, initial cell kill and cellular repopulation in B16 melanoma treated with cyclophosphamide and 1-(2-chloroethyl)-3-cyclohexyl-1-nitrosourea. British journal of cancer 1977, 36(3):313-321.
25. Milas L, Nakayama T, Hunter N, Jones S, Lin TM, Yamada S, Thames H, Peters L: Dynamics of tumour cell clonogen repopulation in a murine sarcoma treated with cyclophosphamide. Radiother Oncol 1994, 30(3):247-253.
26. Davis AJ, Tannock JF: Repopulation of tumour cells between cycles of chemotherapy: a neglected factor. The lancet oncology 2000, 1:86-93.
27. Wu L, Tannock IF: Effect of the selective estrogen receptor modulator arzoxifene on repopulation of hormone-responsive breast cancer xenografts between courses of chemotherapy. Clin Cancer Res 2005, 11(22):8195-8200.
28. Wu L, Tannock IF: Repopulation in murine breast tumours during and after sequential treatments with cyclophosphamide and 5-fluorouracil. Cancer research 2003, 63(9):2134-2138.
29. Huxham LA, Kyle AH, Baker JH, Nykilchuk LK, Minchinton AI: Microregional effects of gemcitabine in HCT-116 xenografts. Cancer research 2004, 64(18):6537-6541.

137
30. Sakata K, Kwok TT, Gordon GR, Waleh NS, Sutherland RM: Resistance to verapamil sensitization of multidrug-resistant cells grown as multicellular spheroids. Int J Cancer 1994, 59(2):282-286.
31. Zacherl J, Hamilton G, Thalhammer T, Riegler M, Cosentini EP, Ellinger A, Bischof G, Schweitzer M, Teleky B, Koperna T et al: Inhibition of P-glycoprotein-mediated vinblastine transport across HCT-8 intestinal carcinoma monolayers by verapamil, cyclosporine A and SDZ PSC 833 in dependence on extracellular pH. Cancer Chemother Pharmacol 1994, 34(2):125-132.
32. Wartenberg M, Frey C, Diedershagen H, Ritgen J, Hescheler J, Sauer H: Development of an intrinsic P-glycoprotein-mediated doxorubicin resistance in quiescent cell layers of large, multicellular prostate tumour spheroids. Int J Cancer 1998, 75(6):855-863.
33. Ouar Z, Bens M, Vignes C, Paulais M, Pringel C, Fleury J, Cluzeaud F, Lacave R, Vandewalle A: Inhibitors of vacuolar H+-ATPase impair the preferential accumulation of daunomycin in lysosomes and reverse the resistance to anthracyclines in drug-resistant renal epithelial cells. The Biochemical journal 2003, 370(Pt 1):185-193.
34. Giaccone G, Linn SC, Welink J, Catimel G, Stieltjes H, van der Vijgh WJ, Eeltink C, Vermorken JB, Pinedo HM: A dose-finding and pharmacokinetic study of reversal of multidrug resistance with SDZ PSC 833 in combination with doxorubicin in patients with solid tumours. Clin Cancer Res 1997, 3(11):2005-2015.
35. Colley, MW V, SE G: Incidence of P-glycoprotein over epxression and multidrug resistance (MDR) reversal in adult soft tissue sarcoma. European Journal of Cancer 2000, 36:881-888.
36. Tidefelt U, Sundman-Engberg B, Paul C: Intracellular uptake and cytotoxic effect in vitro of doxorubicin and epirubicin in human leukemic and normal hematopoietic cells. Cancer chemotherapy and pharmacology 1991, 29(1):7-12.
37. Mayer LD, Lim KT, Hartley D: Identification of two distinct intracellular sites that contribute to the modulation of multidrug resistance in P388/ADR cells expressing P-glycoprotein. Journal of experimental therapeutics & oncology 2002, 2(2):107-120.
38. Ward JP, King JR: Mathematical modelling of drug transport in tumour multicell spheroids and monolayer cultures. Math Biosci 2003, 181(2):177-207.
39. Sinek JP, Sanga S, Zheng X, Frieboes HB, Ferrari M, Cristini V: Predicting drug pharmacokinetics and effect in vascularized tumours using computer simulation. Journal of mathematical biology 2009, 58(4-5):485-510.
40. El-Kareh AW, Secomb TW: Two-mechanism peak concentration model for cellular pharmacodynamics of Doxorubicin. Neoplasia (New York, NY 2005, 7(7):705-713.
41. Jackson TL: Intracellular accumulation and mechanism of action of doxorubicin in a spatio-temporal tumour model. J Theor Biol 2003, 220(2):201-213.

138
42. Alarcon T, Byrne HM, Maini PK: A mathematical model of the effects of hypoxia on the cell-cycle of normal and cancer cells. J Theor Biol 2004, 229(3):395-411.
43. Alarcon T, Byrne HM, Maini PK: Towards whole-organ modelling of tumour growth. Progress in biophysics and molecular biology 2004, 85(2-3):451-472.
44. Frieboes HB, Edgerton ME, Fruehauf JP, Rose FR, Worrall LK, Gatenby RA, Ferrari M, Cristini V: Prediction of drug response in breast cancer using integrative experimental/computational modeling. Cancer research 2009, 69(10):4484-4492.
45. Belpomme D, Gauthier S, Pujade-Lauraine E, Facchini T, Goudier MJ, Krakowski I, Netter-Pinon G, Frenay M, Gousset C, Marie FN et al: Verapamil increases the survival of patients with anthracycline-resistant metastatic breast carcinoma. Ann Oncol 2000, 11(11):1471-1476.
46. Carlson RW, O'Neill AM, Goldstein LJ, Sikic BI, Abramson N, Stewart JA, Davidson NE, Wood WC: A pilot phase II trial of valspodar modulation of multidrug resistance to paclitaxel in the treatment of metastatic carcinoma of the breast (E1195): a trial of the Eastern Cooperative Oncology Group. Cancer investigation 2006, 24(7):677-681.
47. Ries F, Dicato M: Treatment of advanced and refractory breast cancer with doxorubicin, vincristine and continuous infusion of verapamil. A phase I-II clinical trial. Medical oncology and tumour pharmacotherapy 1991, 8(1):39-43.
48. Taylor CW, Dalton WS, Mosley K, Dorr RT, Salmon SE: Combination chemotherapy with cyclophosphamide, vincristine, adriamycin, and dexamethasone (CVAD) plus oral quinine and verapamil in patients with advanced breast cancer. Breast Cancer Res Treat 1997, 42(1):7-14.
49. ten Tije AJ, Synold TW, Spicer D, Verweij J, Doroshow JH, Sparreboom A: Effect of valspodar on the pharmacokinetics of unbound paclitaxel. Invest New Drugs 2003, 21(3):291-298.

139
CHAPTER 4
INFLUENCE OF PANTOPRAZOLE ON DISTRIBUTION AND ACTIVITY OF DOXORUBICIN IN CELL CULTURE AND IN SOLID
TUMOURS
Krupa J. Patel and Ian F. Tannock

140
4.1 ABSTRACT Background: Limited drug distribution within solid tumours is an important cause of drug
resistance. Basic drugs (e.g. doxorubicin) may be sequestered in acidic organelles thereby
limiting drug distribution to distal cells and diverting drugs from their target DNA. Here we
investigate the effects of pantoprazole, a proton pump inhibitor, on endosomal pH, doxorubicin
uptake, and doxorubicin penetration and activity using in vitro and murine models.
Methods: Wild-type EMT-6 and MCF-7, and their P-glycoprotein (PgP) over-expressing variant
cells were treated with pantoprazole to evaluate changes is endosomal pH using fluorescence
spectroscopy, and uptake of doxorubicin using flow cytometry. Effects of pantoprazole on tissue
penetration of doxorubicin were evaluated in multilayered cell cultures (MCCs), and in solid
tumours using immunohistochemistry. Effects of pantoprazole to influence tumour growth delay
and toxicity due to doxorubicin were evaluated in mice.
Results: Pantoprazole (>200μM) increased endosomal pH in all cells, and increased nuclear
uptake of doxorubicin in three of four cell lines. Pretreatment with pantoprazole increased
penetration of doxorubicin in both wild-type and PgP-overexpressing MCCs. Pantoprazole
increased doxorubicin distribution and tumour growth delay in wild-type but not PgP expressing
NCI solid tumours, without apparent increase in toxicity.
Conclusions: Use of pantoprazole to enhance the distribution and cytotoxicity of anticancer
drugs in solid tumours might be a novel treatment strategy to improve their therapeutic index.
141
4.2 INTRODUCTION
Initial or acquired drug resistance limits treatment of cancer by chemotherapy. Studies of
drug resistance have focused on cellular and molecular mechanisms, but there is increasing
evidence that the tumour microenvironment plays an important role in resistance to
chemotherapy. For a tumour to respond to chemotherapy a drug must leave tumour blood
vessels efficiently and distribute throughout tumour tissue to reach all cancer cells in
concentrations that will lead to cytotoxicity (1, 2). The distribution of anticancer drugs such as
doxorubicin is limited in solid tumours and this limited distribution may be an important
mechanism of drug resistance (3-7).
Many solid tumours develop regions of extracellular acidity due to production and poor
clearance of carbonic and lactic acid (8, 9). The pH gradient between an acidic extracellular
environment and a neutral-alkaline intracellular pH may influence drug uptake and activity.
Also, cells may contain acidic organelles such as lysosomes and endosomes (10-12). Since many
chemotherapeutic drugs such as anthracyclines and vinca alkaloids are weak lipophilic bases,
they readily enter acidic organelles where they are protonated and sequestered (13).
Vacuolar-H+-ATPases (V-H+-ATPases) are the major mechanism for regulation of
endosomal pH (14). V-H+-ATPases pump H+ ions across the membranes of a wide array of
intracellular compartments. Agents that disrupt the pH gradient between the cytoplasm and
endosomes in tumours might decrease the sequestration of basic anticancer drugs and render
cells more sensitive to the drug. A class of H+-ATPase inhibitors, called proton pump inhibitors
(PPIs), inhibit acidification of cells in the wall of the stomach and are used clinically for treating
patients with peptic ulcer disease. These agents also inhibit V-H+-ATPase albeit at somewhat
higher concentration than is required to inhibit acidification in the stomach (15). PPIs

142
accumulate selectively in acidic spaces and with the inhibition of V-H+-ATPase activity, increase
both extracellular pH and the pH of acidic organelles (16). Pretreatment with a PPI might alter
intracellular drug distribution by inhibiting drug sequestration. This would allow more drug to
be available both to enter the nucleus and cause cytotoxicity, and to exit the cell and be taken up
by cells distant from blood vessels. We hypothesized that preventing sequestration of drug in
acidic endosomes would improve extracellular drug distribution. In support of this hypothesis
modest improvements in drug distribution have been observed in multilayered cell cultures
(MCCs) pretreated with chloroquine and the PPI, omeprazole (17).
There is evidence that PPIs such as omeprazole and pantoprazole are substrates and
inhibitors of the drug export pump P-glycoprotein (PgP) (18). P-glycoprotein belongs to the
ATP-binding cassette (ABC) family of transporter proteins that can export anticancer drugs (e.g.
doxorubicin, paclitaxel, vincristine and many others) from cells and thereby cause multidrug
resistance (MDR) (19, 20). Studies in our laboratory suggest that PgP overexpressing tumours
have better distribution of doxorubicin to cells distal to blood vessels as compared to wild-type
tumours (21). A possible interaction between PPIs and PgP activity might influence drug
distribution and activity in solid tumours.
Here we describe and evaluate several agents that have been reported (or might be
expected) to increase endosomal pH for their effects on uptake of doxorubicin into tumour cells,
and its distribution within them. We then describe more extensive experiments to characterize
the effects of pantoprazole to modify the distribution and activity of doxorubicin in solid tumours
derived from wild-type and PgP overexpressing cells.
The goals of the present study were (i) to determine whether inhibiting sequestration of
drug in endosomes using the PPI pantoprazole would improve drug distribution in MCCs and in

143
solid tumours, and (ii) to distinguish effects of pantoprazole on wild type and PgP
overexpressing MCCs and solid tumours.
4.3 MATERIALS AND METHODS 4.3.1 Drugs and reagents
Doxorubicin (Pharmacia, Mississauga, Canada) was purchased from the hospital
pharmacy as a solution at a concentration of 2 mg/mL. Purified rat anti-mouse CD31
(platelet/endothelial adhesion molecule 1) monoclonal antibody was purchased from BD
PharmMingen (Mississauga, Canada), and Cy3-conjugated goat anti-rat IgG secondary antibody
was purchased from Jackson ImmunoResearch Laboratories, Inc. (Pennsylvania, USA).
Pantoprazole (Nycomed, Oakville, Canada) was purchased from the hospital pharmacy as a
lyophilized powder and dissolved in 0.9% saline. Radiolabeled doxorubicin was obtained from
Amersham Life Sciences (Buckinghamshire, United Kingdom). Lansoprazole was purchased
from Sigma (St. Louis, MO) and dissolved in ethanol. Tamoxifen was obtained from Sigma (St.
Louis, MO) and dissolved in ethanol.
4.3.2 Cell lines
The mouse mammary sarcoma EMT6, and its PgP-upregulated variant AR1, were provided
originally by Dr Peter Twentyman, Cambridge UK. The human breast cancer cell line MCF-7
was obtained from the American Type Culture Collection (ATCC; Virginia, USA), and its PgP
upregulated variant NCI-ADR was purchased from the National Cancer Institute (Bethesda,
Maryland, United States of America). The human vulvar epidermoid carcinoma cell line A431
was purchased from ATCC.

144
EMT6 and MCF-7 cells were maintained as monolayers in α-MEM media, supplemented
with 10% fetal bovine serum, (FBS; Hyclone, Logan, UT). The AR1 and NCI cell lines were
maintained in similar conditions to the parental lines with the exception that the media contained
10µg/mL doxorubicin. NCI cells were maintained in RPMI media. A431 cells were maintained
in Dulbecco’s Modified Eagle’s Medium supplemented with 10% FBS. All media were obtained
from the hospital media facility. Cells were grown in a humidified atmosphere of 95% air and
5% CO2 at 37˚C. Routine tests to exclude mycoplasma were performed.
Tumours were generated by subcutaneous injection of 1 – 5 x 10⁶ exponentially growing
cells into the left and right flank regions of female athymic nude mice (MCF7) or syngeneic
Balb/C mice (EMT6). Estrogen pellets were implanted into the nude mice one day prior to
injection of MCF-7 tumour cells. All procedures were carried out following approval of the
Institutional Animal Care Committee.
4.3.3 Measurement of endosomal pH
To measure endosomal pH, cells (106/ml) were treated with varying concentrations of
lansoprazole, pantoprazole, or tamoxifen (included because of prior reports of effects to raise
endosomal pH, (22)). They were incubated for 3 hours with dextran-fluorescein-
tetramethylrhodamine 10,000 MW, anionic (FITC/TMR-dextran, Molecular Probes, Inc. Eugene,
OR) which is taken up into endosomes, followed by exposure to media for 2 hours. Fluorescence
was measured using a Coulter Epics Elite flow cytometer (Beckman Coulter, Miami, FL)
equipped with an argon laser emitting at 488nm. The argon laser was used to excite FITC and
TMR with emission evaluated at 525nm (pH-dependent) and 575nm (pH-independent)
respectively. Calibration of fluorescence measurements was performed using the ionophore
nigericin (Sigma, St. Louis, MO) in buffers of known pH (23).

145
4.3.4 Doxorubicin uptake
Uptake of radiolabeled doxorubicin
The uptake into cells of radiolabeled 14C-doxorubicin (Amersham, Buckinghamshire,
United Kingdom) was studied using a spin-through-oil technique (24, 25). Stirred suspensions
of single cells, in the presence or absence of modifiers, were exposed to the radiolabeled drugs.
Aliquots (100 µl) were removed as a function of time and layered on top of a mixture of
dibutylphthalate and corn oil (4:1) in microcentrifuge tubes. The tubes were then spun at 14,000
rpm for 5 minutes, and the cells were pelleted at the bottom of the tube. The medium and then
the oil were aspirated and the cell-associated radioactivity was determined by liquid scintillation
counting.
Cells attached to a chambered cover glass were pre-treated with pantoprazole (1mM) for
2 hours and then incubated in media containing 2µg/ml doxorubicin for 1 hour. The drugs were
washed out and the fluorescence signal was recorded with excitation at 514nm and emission at
488nm using a Zeiss Axiovert 200M fluorescence inverted microscope and the fluorescence
signals were captured with a Roper Scientific CoolSnap HQ CCD camera. To visualize
endosomes, the cells were exposed to the pH-sensitive endosomal dye, LysoSensor Yellow/Blue
DND-160 (Molecular Probe, Inc. Eugene, OR) at a concentration of 5µM for 15 min. The
fluorescent signal was measured with excitation at 360nm and emission at 420nm.
Flow cytometry
For each of the four cell lines, 106 cells were treated in vials with either saline or
pantoprazole (1mM). After 2 hours, doxorubicin was added to each vial and incubated for 1
hour and then washed twice with PBS. Mean doxorubicin fluorescence was measured using the

146
Becton Dickinson FACScan (Franklin Lakes, NJ), and Cell Quest software. The FL1 filter
(530nm) was used to detect doxorubicin fluorescence.
4.3.5 Evaluation of doxorubicin penetration in multilayered cell cultures
Drug penetration was evaluated in an in vitro tumour-like environment using
multilayered cell cultures (26, 27). Approximately 2 x 10⁵ cells were seeded on collagen-coated
microporous teflon membranes (Millipore, Bedford, MA) and given 4-6 hours to attach. The
membranes were immersed in α-MEM media in a large vessel with continuous stirring and
allowed to incubate at 37°C for approximately 6-8 days; this led to the formation of MCCs
containing approximately 5 x 10⁶ cells. The MCCs were incubated in either media alone or
media containing 1mM pantoprazole for 2 hours. The penetration experiments were performed
at 37°C in an atmosphere of 95% air and 5% CO2. Solutions containing 10µmol/L radiolabeled
doxorubicin were prepared in 2 x α-MEM (without FBS) and mixed in a 1:1 ratio with 1% agar
solution; the agar is added to prevent convection. A volume of 0.5mL of this mixture was added
to one side of the MCC. The membranes were then floated in glass polyshell vials containing
18mL of α-MEM media. A cell-free membrane insert was included in all experiments as a
control. The drug, after penetrating through the MCC, appeared in the compartment below and
150µL samples were taken from this compartment over time and assessed by liquid scintillation
counting. 3H-sucrose was used as an internal standard at a concentration of 2µmol/L to ensure
minimal interexperimental variations of the MCC thickness.
Fluorescent micrographs of MCCs were generated after exposure to doxorubicin. After 1
hour of incubation, MCCs were removed and frozen, 10μm sections were imaged using an
Olympus Upright BX50 microscope with a 100W HBO mercury light source equipped with 530

147
to 560 nm excitation and 573 to 647 nm emission filter sets. Images were pseudo-coloured using
Image Pro Plus software.
4.3.6 Plasma concentrations of pantoprazole in mice
At various times after Balb/C mice were treated with pantoprazole (200mg/kg), blood
was collected using cardiac puncture in heparin-coated tubes on ice, and the mice were killed.
Whole blood was spun at 16000 RPM for 10 minutes and the plasma was isolated and frozen.
Pantoprazole concentration was determined using high-performance liquid chromatography
(HPLC). Stock solutions of pantoprazole were prepared in methanol–water (50:50 v/v) at
concentrations of 1mg/mL. Calibration curves of pantoprazole were prepared by spiking the
blank plasma at concentrations of 2.5, 5, 10, 20, 50, 100, 200, 1000 and 2000 ng/ml. The frozen
plasma samples were thawed and centrifuged for 5 minutes at 2550 g at 4°C to precipitate solids.
Fifty microliters of the internal standard solution were added to a 200-μl aliquot of plasma. The
tubes were briefly mixed with a vortex and the compounds of interest were extracted with 4 ml
of a mixture of diethyl-ether/dichloromethane (70:30; v/v). The mixture was mixed for
approximately 40 s, and the organic phase was evaporated under N2 at 37°C. The dry residues
were reconstituted to 200-μl with a solution of CH3CH and H2O (90:10; v/v) containing 2.5mM
of ammonia and mixed with a vortex for 15 s. The solutions were then transferred to auto-
injector microvials. Shimadzu SIL-20-AC autoinjector and Shimadzulc-20AD pumps were used
for HPLC-MS/MS analysis and Applied Biosystem MDS Sciex (Concord, Ontario, Canada)
API3200 tandem mass spectrometry equipped with a TurboIonSpray interface was used
subsequently. The data were processed using Analyst 1.4.2 software (Applied Biosystem MDS
Sciex).

148
4.3.7 Evaluation of doxorubicin distribution in solid tumours
Mice bearing EMT-6, AR1, MCF-7 or NCI subcutaneous tumours in the left and right
flank regions were divided randomly into groups of five and were treated when the mean tumour
diameter was in the range of 8-12 mm. Animals were treated with phosphate-buffered saline
containing CaCl2 and MgCl2, doxorubicin alone, or pantoprazole prior to doxorubicin.
Doxorubicin was given intravenously at a dose of 25mg/kg to facilitate detection and
quantification of drug auto-fluorescence. Pantoprazole was administered intraperitoneally two
hours prior to doxorubicin treatment at a dose of 200 mg/kg. To detect hypoxia and functional
blood vessels, EF5 was injected intraperitoneally approximately two hours prior to killing the
mice (0.2mL of a 10mM stock per mouse), and the perfusion marker DiOC7 (1 mg/kg) was
injected and intravenously1 minute prior to killing the mice. Mice were killed 10 minutes after
doxorubicin injection and the tumours were excised. The tissues were embedded immediately in
OCT compound, frozen in liquid nitrogen, and stored at -70°C. Cryostat sections 10 µm thick
were cut at 3 levels approximately 100 µm apart from each tumour, mounted on glass slides.
Fluorescence imaging
Doxorubicin fluorescence was detected utilizing an Olympus Upright BX50 microscope
with a 100W HBO mercury light source equipped with 530-560 nm excitation/573-647 nm
emission filter sets. Tissue sections were imaged with a Photometrics CoolSNAP HQ2
(monochrome for fluorescence imaging) camera and tiled using a motorized stage so that the
distribution of doxorubicin was obtained for the entire tissue section. All images were captured
in 8-bit signal depth and subsequently pseudo-colored.
Tumour sections were first imaged for doxorubicin and the perfusion marker DiOC7
using a TRITC and FITC filter set, respectively. Sections were then stained for blood vessels

149
using antibodies specific for the endothelial cell marker CD31 [rat anti-CD31 primary antibody
(1:100); BD Biosciences, and C73-conjugated goat anti-rat IgG secondary antibody (1:400)],
hypoxic regions were identified using a Cy5-conjugat4d mouse anti-EF5 antibody (1:50).
Tumour sections were imaged for CD31 using the Cy3 (530-560 nm excitation/573-647 nm
emission) filter set, and EF5 using the Cy5 far-red filter set.
Image analysis and quantification
Composite images of doxorubicin and CD31 were generated utilizing Media Cybernetics
Image Pro PLUS software (version 5.0). Images displaying anti-CD31 staining were converted to
a black and white binary image, and small white objects were removed as artifacts based on
conservative estimation of minimal capillary diameter (28). The resultant image was overlaid
with the corresponding field of view displaying doxorubicin fluorescence resulting in an 8 bit
black and white image with blood vessels identified by pixels with intensities between 250-255
(white) and doxorubicin ranging from 0-249. Several regions, 1.6 mm2 in area, with moderate
blood vessel density were selected from each tissue section. Areas of necrosis and staining
artifact were excluded. To minimize noise from tissue auto-fluorescence a minimum signal level
just below threshold for detection of doxorubicin was set for each tissue section; this was based
on an average background reading from regions without nuclear fluorescence/staining. The pixel
intensity (the area of each pixel was 0.4 μm2) and distance to the nearest vessel for all pixels
within the selected region of interest above threshold were measured with a customized
algorithm. Doxorubicin intensity (I) was averaged over all pixels at a given distance (x) from the
nearest vessel and plotted as a function of distance to the nearest vessel. Linear regression was
performed to correlate the average doxorubicin fluorescence intensity with distance from the
nearest blood vessel.

150
Quantification of blood vessels and hypoxia
Tumour vasculature and hypoxia were quantified using Media Cybernetics Image Pro
PLUS Software. The total number of blood vessels was measured by setting a threshold for
CD31 positive pixel intensity and minimum blood vessel area (62 μm2) and counting the number
of objects within these settings. Objects above this threshold range but below the minimum area
were removed as artifacts (28). The tumour area was recorded and areas of necrosis and artifact
were excluded. The mean number of total blood vessels per tumour area was determined. The
number of functional blood vessels per tumour area was calculated in a similar manner using
DiOC7 positive pixels. Hypoxic regions were quantified by calculating the area of pixels with
anti-EF5 fluorescence above a set threshold and dividing this region by the area of the entire
tumour section.
4.3.8 Growth delay studies
Tumours were impanted on both flanks of mice as described above. Two perpendicular
diameters were measured with a caliper and treatment began once tumours reached a diameter of
5-8 mm. Tumour volume was estimated using the formula: 0.5(ab2), where a is the longest
diameter, and b is the shortest diameter.
To determine the effects of pantoprazole, mice were divided into four groups of 4-5 mice
each and treated with either saline, doxorubicin alone (8mg/kg) administered intravenously,
pantoprazole alone (200mg/kg) administered intraperitoneally or pantoprazole 2 hours prior to
doxorubicin (200mg/kg + 8 mg/kg). Every 2-3 days the tumour volume and body weight were
measured. Measurements were taken until tumours reached a maximum diameter of 1.2cm or
began to ulcerate, when mice were killed humanely. All mice were ear tagged and randomized
to avoid bias with measurements.

151
4.3.9 Statistical analysis
A one-way ANOVA, followed by a post hoc t-test were performed to determine
statistical differences between treatment groups, and P<0.05 was used to indicate statistical
significance. For drug uptake using flow cytometry and quantification of functional tumour
vasculature and hypoxia, t-tests were performed to determine significant differences between
treatment groups. P<0.05 was used to indicate statistical significance.
4.4 RESULTS
4.4.1 Proton pump inhibitors increase endosomal pH in tumour cells
Pantoprazole, lansoprazole or tamoxifen led to concentration-dependent increases in
endosomal pH in EMT-6 cells; increases in endosomal pH were observed with concentrations of
tamoxifen above 10μM, and with lansoprazole and pantoprazole at concentrations above 200μM
(Figure 4.1a). Although basal pH levels differed slightly between the four cell lines, the effects
of pantoprazole were consistent in increasing endosomal pH at concentrations above 200μM
(Figure 4.1b).
4.4.2 Pantoprazole pre-treatment alters doxorubicin uptake in tumour cells in culture
Uptake of radiolabeled doxorubicin increased approximately 2-3 fold when cells were
pretreated with either pantoprazole, lansoprazole or tamoxifen compared to cells treated with
doxorubicin alone (Figure 4.2a). Photomicrographs of fluorescence in EMT-6 cells exposed to
doxorubicin alone, show the drug to be present in the nucleus and in punctuate compartments
within the cytoplasm (Figure 4.2a, panel i); and co-staining of cells with doxorubicin and

152
lysosensor gives evidence of endosomal sequestration of doxorubicin (Figure 4.2b, panel ii).
Treatment with 1mM pantoprazole reduces the amount of doxorubicin fluorescence in the
cytoplasm while it is retained within the nucleus (Figure 4,2b, panel iii).
Doxorubicin uptake within cells pre-treated with either saline or pantoprazole (1mM) was
measured using flow cytometry. Uptake of doxorubicin under control conditions was higher in
MCF-7 cells compared to EMT-6, AR1 or NCI cells (p<0.001). In PgP-overexpressing cells,
doxorubicin fluorescence increased by approximately 2-fold in pantoprazole-pre-treated samples
(p<0.05), consistent with an effect of pantoprazole to inhibit the function of PgP. In MCF-7 cells
doxorubicin fluorescence decreased 1.2-fold with pantoprazole pre-treatment (Figure 4.3a;
p=0.06). When cells were treated with a lower concentration of pantoprazole (100µM), similar
patterns in the changes in uptake of doxorubicin were observed, where EMT-6, AR1 and MCF-7
cells showed a 1.3-1.7-fold increase in doxorubicin fluorescence after pantoprazole pre-treatment
and a 1.2-fold decrease in MCF-7 cells, but these results were not significant (Figure 4.3b). The
effect of the PgP inhibitor verapamil on doxorubicin uptake was determined to compare and
contrast PgP activity between cell lines. Verapamil (100µM) increased doxorubicin uptake in
EMT-6, AR1 and NCI cells by 2-3 fold (p<0.05), but in MCF-7 cells, verapamil pre-treatment
decreased doxorubicin uptake by one-third (p<0.05) (Figure 4.3b).

153
4.4.3 Doxorubicin penetration increases in multilayered cell cultures pre-treated with pantoprazole The penetration of doxorubicin alone through MCCs derived from EMT-6 and AR1 cells
was similar. In contrast, the penetration of doxorubicin through MCCs derived from MCF-7
cells was slower than those MCCs derived from the PgP-overexpressing variant NCI cells
(p<0.05). When MCCs were pre-treated with 1mM pantoprazole there was a greater than 2-fold
increase in doxorubicin penetration for those grown from EMT-6 and AR1 cells (p<0.05) and
~1.3-fold increase through those grown from NCI and MCF-7 cells (p<0.02) (Figure 4.4a-d).
Internal standards indicated by 3H-sucrose penetration were used to control for variations in
thickness of the cell cultures, and showed < 10% variation.
Photomicrographs of MCCs indicate an increase in doxorubicin fluorescence in cells
more distal from the source of drug that are pre-treated with pantoprazole compared to control
MCCs at 2 hours after the start of doxorubicin exposure (Figure 4.4e-f).
4.4.4 Plasma concentration of pantoprazole and toxicity in mice
After intraperitoneal administration of 200mg/kg pantoprazole in Balb/C mice, the peak
plasma concentration was ~300μM within the first hour after administration, and ~150 μM after
2 hours. After 5 hours the concentration in the plasma decreased to less than 1% of the
maximum concentration in the blood and by 24 hours less than 0.01 μM of pantoprazole was
detectable (Figure 4.5).
There was no significant change in body weight of mice after a single treatment with
pantoprazole (200mg/kg) or of doxorubicin (8mg/kg), but a combination of the two drugs
consistently showed a temporary decrease in body weight (~15%) within the first 5-8 days after
treatment. After 8 days, mice quickly regained their original body weight (Figure 4.6).

154
4.4.5 Effect of pantoprazole on doxorubicin penetration in MCF-7 xenografts
The distribution of doxorubicin was quantified in EMT-6, AR1, MCF-7 and NCI tumours
in mice at 10 minutes after injection. Fluorescence intensity of doxorubicin was determined in
relation to distance to the nearest blood vessel within areas of interest (AOIs). Blood vessel
densities between AOIs in different treatment groups were not significantly different from each
other. In all tumours there were steep gradients of decreasing fluorescence due to doxorubicin
in relation to distance from the nearest functional blood vessel in the section. In EMT-6 tumours
and PgP-expressing AR1 and NCI tumours, there was no significant difference in drug
distribution between treatment groups (Figure 4.7a,d; 4.8d). In MCF-7 tumours, there was a
shallower gradient of decrease in doxorubicin distribution in the tumours pre-treated with
pantoprazole compared to the tumours treated with doxorubicin alone (p<0.05) (Figure 4.8a). .
Photomicrographs taken from MCF-7 tumours confirm substantial increases in doxorubicin
fluorescence in tumours in mice pre-treated with pantoprazole, compared to mice treated with
doxorubicin alone (Figure 4.8b-c).
4.4.6 Effect of pantoprazole on vasculature and hypoxia in solid tumours As expected, there was no significant difference in the total number of blood vessels per
unit area of sections in tumours treated with doxorubicin alone, or with doxorubicin plus
pantoprazole, in any of the five tumours that were studied (Figures 4.9-4.11). However, the
concentration of functional blood vessels per unit area was higher in EMT-6 tumours treated
with pantoprazole + doxorubicin (as compared with those treated with doxorubicin alone) by
approximately two-fold (p<0.01) (Figure 4.9b), whereas in MCF-7 xenografts the number of
functional blood vessels per tumour area decreased by one-third (p<0.05) (Figure 4.10b). The
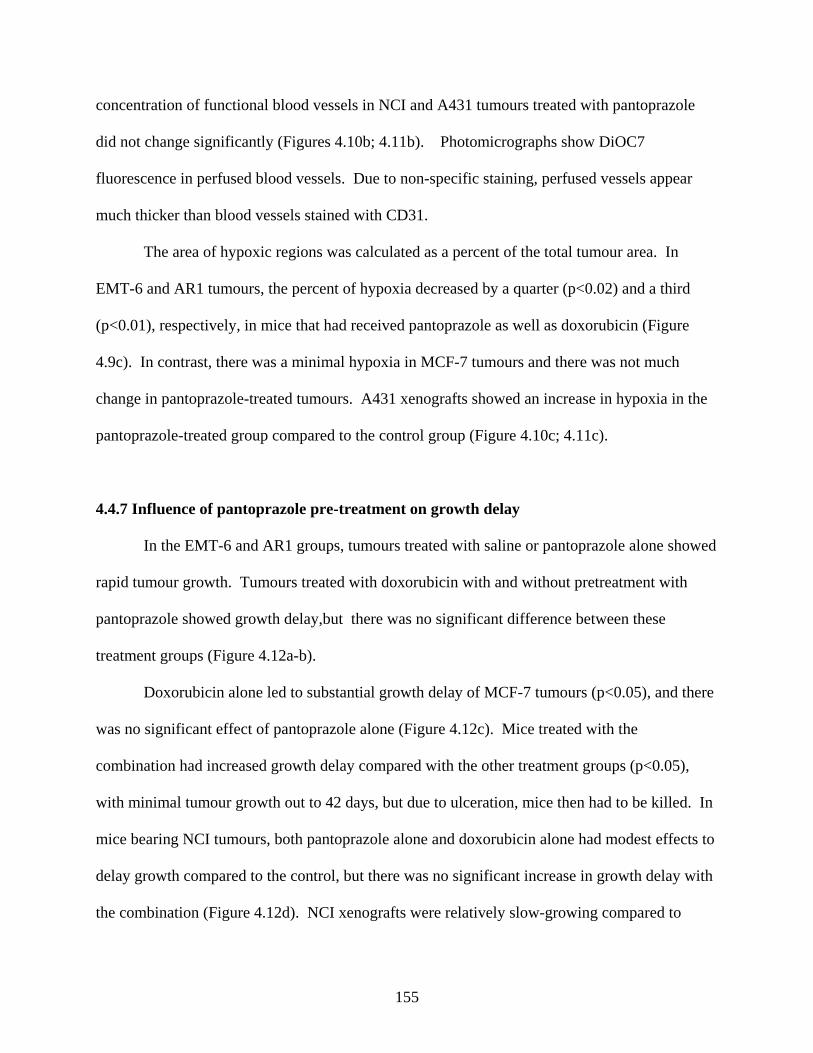
155
concentration of functional blood vessels in NCI and A431 tumours treated with pantoprazole
did not change significantly (Figures 4.10b; 4.11b). Photomicrographs show DiOC7
fluorescence in perfused blood vessels. Due to non-specific staining, perfused vessels appear
much thicker than blood vessels stained with CD31.
The area of hypoxic regions was calculated as a percent of the total tumour area. In
EMT-6 and AR1 tumours, the percent of hypoxia decreased by a quarter (p<0.02) and a third
(p<0.01), respectively, in mice that had received pantoprazole as well as doxorubicin (Figure
4.9c). In contrast, there was a minimal hypoxia in MCF-7 tumours and there was not much
change in pantoprazole-treated tumours. A431 xenografts showed an increase in hypoxia in the
pantoprazole-treated group compared to the control group (Figure 4.10c; 4.11c).
4.4.7 Influence of pantoprazole pre-treatment on growth delay In the EMT-6 and AR1 groups, tumours treated with saline or pantoprazole alone showed
rapid tumour growth. Tumours treated with doxorubicin with and without pretreatment with
pantoprazole showed growth delay,but there was no significant difference between these
treatment groups (Figure 4.12a-b).
Doxorubicin alone led to substantial growth delay of MCF-7 tumours (p<0.05), and there
was no significant effect of pantoprazole alone (Figure 4.12c). Mice treated with the
combination had increased growth delay compared with the other treatment groups (p<0.05),
with minimal tumour growth out to 42 days, but due to ulceration, mice then had to be killed. In
mice bearing NCI tumours, both pantoprazole alone and doxorubicin alone had modest effects to
delay growth compared to the control, but there was no significant increase in growth delay with
the combination (Figure 4.12d). NCI xenografts were relatively slow-growing compared to

156
MCF-7 xenografts with higher chances of ulceration, requiring the experiments to be terminated
with smaller tumour volumes.
Growth delay studies were also carried out in xenografts derived from an epidermoid
carcinoma cell line A431 (Figure 4.12e). Tumours treated with pantoprazole and doxorubicin
were found to have increased growth delay compared to groups treated with the control (p=0.06)
or doxorubicin alone (p=0.05).
4.5 DISCUSSION
The acidic tumour microenvironment in solid tumours has been shown to have a role in
resistance to chemotherapy, proliferation and metastasis (29-31). The production of metabolic
acids (lactate and/or CO2) exported from cancer cells into the interstitial fluid is an important
contributor to low pH within tumours. There is poor clearance of H+ ions due to disorganized
vasculature of tumours, poor lymphatic drainage and elevated interstitial pressure (32), resulting
in an extracellular pH that is more acidic than that of normal tissues (33, 34). The intracellular
pH of cancer cells is maintained through up-regulation of membrane-based ion exchange
mechanisms including the sodium-proton exchanger and the sodium-dependent chloride-
bicarbonate exchanger (35, 36), leading to an increased pH gradient across the cell membrane.
The pH gradient between the cytoplasm and the intracellular organelles may also be modified in
cancer cells and this may lead to the sequestration of basic drugs (12, 37). Proton pump
inhibitors, which block the action of the V-H+-ATPase have been found to increase the pH in
acidic vesicles such as endosomes (38), inhibiting the accumulation of basic cytotoxic agents in
acidic organelles (39) and may even lead to apoptosis of cancer cells (40).

157
In the present study, we investigated the effect of tamoxifen and the PPIs, lansoprazole,
and pantoprazole on endosomal pH of cancer cells. Each of these agents was observed to
increase endosomal pH by blocking acidification in these intracellular compartments. We
observed the affects of pantoprazole on different cancer lines with varying PgP expression and
found increased endosomal pH in both sensitive and resistant cell lines at pantoprazole
concentrations of 500μM or higher. Cultured PgP-expressing cell lines have been observed to
display abnormally high cytoplasmic pH values indicating complex cellular mechanisms that
contribute to the resistant phenotype (41); these mechanisms may include effects of multidrug
transporters to cause alkalinization of the cytosol, causing larger pH gradients between acidic
vesicles and cytosol in resistant cells (41-43).
We observed increased uptake of doxorubicin in PgP overexpressing cells after
pantoprazole pretreatment. Although EMT-6 cells were studied as a lower PgP-expressing
variant compared to AR1 cells, the overall levels of PgP expressed in EMT6 cells were
considerably higher than in MCF-7 cells. This is evident from the similarity in patterns of
doxorubicin uptake in EMT-6 and AR1 cells treated with PgP inhibitors in contrast to that in
MCF-7 cells.
Previous studies comparing MCF-7 cells and their doxorubicin-resistant variants show
increased acidification of intracellular vesicles in the cytoplasm in resistant cell lines (42, 44).
Chemotherapeutic agents are basic and in their uncharged, hydrophobic form, can easily diffuse
across the lipid bilayers. Once they enter acidic compartments they become protonated and
sequestered (42, 44). Drug sequestration as a mechanism of multidrug resistance has been well
characterized and drugs have been observed to accumulate in endosomes, lysosomes (42, 45, 46)
and vesicles within the Golgi compartment (42, 47, 48), all of which are acidic organelles.

158
Sequestration of drugs may be increased within the larger volume of the endosome/lysosome
system that is often observed in resistant cells (45, 49, 50). Increased vesicular acidification in
resistant cells may occur due to the overexpression of endosome/lysosome proton pumps (51).
However, studies have shown that vesicular sequestration of drugs is not a necessary
characteristic of multidrug resistant cells and does occur in wild-type drug sensitive cells (52).
Proton pump inhibitors have been shown to increase the sensitivity of resistant tumour
cells to the cytotoxic effects of several drugs, including cisplatin, 5-flurouracil and vinblastine,
and increase the cytotoxicity of these agents in drug-sensitive cells (32). Our data indicate that
there are differences in the effects of PPIs between drug-sensitive and drug-resistant cells.
Pantoprazole is likely to increase drug uptake in drug-resistant cells for the reasons outlined
above. In the MCF-7 drug-sensitive cells we observed consistently decreased doxorubicin
uptake with pantoprazole pretreatment. In these cells, the nucleus may be saturated with drug
and excess concentrations are likely stored in acidic vesicles, while in PPI treated cells this
sequestration will be reduced leading to a decreased net uptake of drug. With decreased uptake
of drug, there is more drug available to penetrate to cells distal from blood vessels. Based on our
results, MCF-7 cells were expected to have greater drug penetration than EMT-6, ARI and NCI
cells because of the decreased drug uptake. Our in vitro data show an increase in drug
penetration in MCCs of all four cell lines. This may be due to both high concentrations of
pantoprazole (1mM) and easy access of drug to cells, which is not representative of conditions in
solid tumours where there is limited drug delivery by the imperfect vasculature. This easily
accessible drug may lead to saturation in cells close to the source of drug in MCCs, allowing
unsequestered drug to penetrate to distal cells.

159
In MCF-7 xenografts we observed a significant increase in drug distribution in relation to
the nearest blood vessel, but this effect was not observed in EMT-6 tumours that may express
higher levels of PgP and in drug-resistant NCI and ARI tumours. It has been proposed that
pantoprazole may act as a PgP inhibitor in drug-resistant cell lines (18). Previous studies in our
laboratory have shown that PgP inhibitors may decrease doxorubicin distribution in solid
tumours derived from PgP-expressing cells, most likely because they increase drug uptake in
cells close to blood vessels, such that there is less drug available to penetrate to distal cells (21,
53). An effect to inhibit sequestration in endosomes would have the opposite effect, such that if
pantoprazole decreases net drug uptake in cells close to blood vessels, there is likely to be
increased doxorubicin distribution to more distant cells distal and the gradient of decreasing
doxorubicin intensity will be significantly shallower. Improved drug distribution in MCF-7
xenografts might be due partly to changes in functional vasculature, however, the effect of
pantoprazole to decrease the proportion of functional blood vessels in MCF-7 and A431
xenografts at short intervals after drug administration suggests that this inhibitor may actually
have some antiangiogenic activity. The mitogen-activated protein kinase, extracellular signal-
regulated kinase ((MAPK ERK 1/2) has been shown to contribute to the expression of pro-
angiogenic factors such as vascular endothelial growth factor (VEGF) and interleukin-8 (IL-8) in
cancer cell lines (54). The potential involvement of PPIs in anti-angiogenesis has been reported
previously where pantoprazole effectively inhibited phosphorylation of MAPK ERK1/2 leading
to reduced expression of VEGF (55). A decrease in functional blood vessels was coupled with
an increase in hypoxia in pantoprazole treated MCF-7 and A431 xenografts, whereas in the
murine tumours, functional blood vessels increased with PPI treatment and the extent of hypoxic
regions decreased. Future studies on the effect of pantoprazole on functional blood vessels and
160
pro-angiogenic factors such as VEGF and IL-8 in the tumour models used in this study may shed
light on its role as a potential antiangiogenic agent.
Causes of drug resistance in tumours are both multifactorial and interconnected, so that
overcoming one mechanism may not improve drug resistance. An effective strategy is likely to
influence several processes that contribute to resistance to give an overall therapeutic benefit.
The effect of pantoprazole in MCF-7 cells and xenografts may improve therapeutic efficacy by
influencing the net effect of different mechanisms of resistance.
Our HPLC data indicate maximum levels of pantoprazole in the plasma of mice at
concentrations that are 5-fold lower than concentrations of pantoprazole administered in some of
the in vitro experiments. High concentrations of pantoprazole may account for increases in
doxorubicin penetration in MCCs, but in drug-sensitive xenografts, lower in vivo concentrations
of pantoprazole in combination with doxorubicin can still significantly alter drug distribution.
After 2 hours, plasma concentrations of pantoprazole are around 200μM. In drug uptake
experiments using flow cytometry, we observed that pantoprazole alters doxorubicin uptake into
cells at 1mM and at 100 μM, albeit to a lesser extent. The finding that lower doses of
pantoprazole are effective in vivo might be due to the role of the microenvironment and its
effects on ion gradients between intracellular and extracelluar pH. Within the tumour
microenvironment strong ion gradients are likely to occur between acidic vesicles and the
cytoplasm, and changes in pH due to lower doses of pantoprazole might be more likely to
produce significant alterations in sequestration of drug.
It has been suggested that modification of pH gradients across the cell membrane, and
between the cytoplasm and intracellular vesicles, in multi-drug resistant cell lines might restore
sensitivity in these cells and may be an important treatment strategy to consider in drug

161
development (18, 41, 44, 56-58). However, drug resistance is multifactorial and restoring
sensitivity using this strategy may not effectively overcome drug resistance due to other factors
such as limited distribution of drugs in solid tumours. Our studies of tumour growth delay do
not indicate a therapeutic advantage of using pantoprazole in combination with doxorubicin in
PgP-overexpressing tumours, whereas in wild-type MCF-7 xenografts there is a substantial
increase in growth delay. These experiments were repeated in another low-PgP expressing
xenograft model using A431 tumours. Pantoprazole combined with doxorubicin showed a
similar pattern to MCF-7 tumours of increased tumour growth delay, although the study was
limited by the formation of ulcerations characteristic of A431 xenografts.
Our data, and that of others (38), suggest that pretreatment with pantoprazole may be an
effective strategy to improve the therapeutic efficacy of doxorubicin in some solid tumours. Our
studies show that while drug export pumps such as PgP lead to drug resistance, other
mechanisms such as increased drug sequestration and limited drug distribution may also have
important roles in multifactorial drug resistance and must be considered when developing novel
therapeutics and novel treatment strategies. The strategy of administering pantoprazole prior to
doxorubicin is now being evaluated in a phase I trial supported by the Komen Breast Cancer
Foundation.
Acknowledgements I would like to acknowledge Carol Lee for her collaboration in the endosomal pH and radiolabeled drug uptake experiments. As well, I would like to acknowledge Dr. Eric Chen for providing support with the HPLC analysis.

162
4.6 FIGURES

Figure 4.1 Endosomal pH measurements in cancer cells. EMT-6 cells exposed to varying concentrations of lansoprazole (), pantoprazole (), and tamoxifen () (A) and EMT6, AR1, MCF-7, and NCI cells exposed to varying concentrations of pantoprazole (B). (Data represents mean ± SE; n=3)
Pantoprazole (µM)
1 10 100 1000 10000
Endo
som
al p
H
4.0
4.5
5.0
5.5
6.0
6.5
7.0
NCIMCF7EMT6AR1
Concentration (µM)
1 10 100 1000 10000
Endo
som
al p
H
4.0
4.5
5.0
5.5
6.0
6.5
7.0
7.5
A
B
163

Figure 4.2 Doxorubicin uptake in tumour cells in culture. (A) EMT-6 cells were incubated with either doxorubicin (DOX) alone or in combination with pantoprazole (PTP), lansoprazole (LPZ), or tamoxifen (TAM), and fluorescence was measured after 5 hours using an uptake assay of radiolabeled DOX. (Data represents mean ± SE; n=3). (B) Fluorescent micrographs show alterations in intracellular DOX distribution in cancer cells in culture with PTP pretreatment. EMT-6 cells were treated with (i) DOX, (ii) lysosensor or (iii) PTP prior to DOX.
A
0
10
20
30
4050
60
70
80
90
DOX DOX + PTP DOX + LPZ DOX + TMXTreatment
Mea
n DO
X Fl
uore
scen
ce
164

Figure 4.3 Doxorubicin fluorescence in cells pretreated with either saline or 1 mM pantoprazole measured using flow cytometry. EMT-6, AR1, MCF-7 and NCI cells were pretreated with either A) DOX alone or 1mM PTP prior to DOX or B) DOX alone, 100µM PTP or 100µM verapamil prior to DOX treatment. (Data represents mean ± SEM; n=3).
0
2
4
6
8
10
12
14
16
18
EMT6 AR1 MCF-7 NCI
Mea
n DO
X Fl
uour
esce
nce
Cell Lines
DOXPTP + DOX
0
20
40
60
80
100
120
140
EMT6 AR1 MCF-7 NCI
Mea
n DO
X Fl
uore
scen
ce
Cell Lines
DOXDOX + PTPDOX + Verapamil
A
B
165
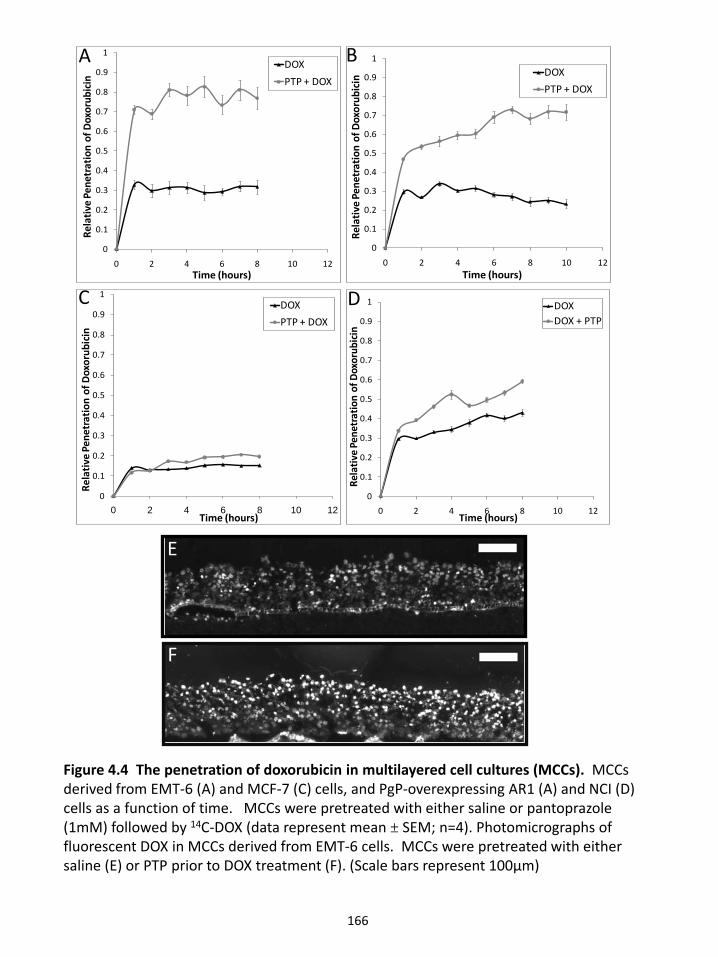
A B
D
D
E
F
Figure 4.4 The penetration of doxorubicin in multilayered cell cultures (MCCs). MCCs derived from EMT-6 (A) and MCF-7 (C) cells, and PgP-overexpressing AR1 (A) and NCI (D) cells as a function of time. MCCs were pretreated with either saline or pantoprazole (1mM) followed by 14C-DOX (data represent mean ± SEM; n=4). Photomicrographs of fluorescent DOX in MCCs derived from EMT-6 cells. MCCs were pretreated with either saline (E) or PTP prior to DOX treatment (F). (Scale bars represent 100µm)
C
E
F
166
0
0.1
0.2
0.3
0.4
0.5
0.6
0.7
0.8
0.9
1
0 2 4 6 8 10 12
Rela
tive
Pene
trat
ion
of D
oxor
ubic
in
Time (hours)
DOXDOX + PTP
0
0.1
0.2
0.3
0.4
0.5
0.6
0.7
0.8
0.9
1
0 2 4 6 8 10 12
Rela
tive
Pene
trat
ion
of D
oxor
ubic
in
Time (hours)
DOXPTP + DOX
0
0.1
0.2
0.3
0.4
0.5
0.6
0.7
0.8
0.9
1
0 2 4 6 8 10 12
Rela
tive
Pene
trat
ion
of D
oxor
ubic
in
Time (hours)
DOXPTP + DOX
A B
D
0
0.1
0.2
0.3
0.4
0.5
0.6
0.7
0.8
0.9
1
0 2 4 6 8 10 12
Rela
tive
Pene
trat
ion
of D
oxor
ubic
in
Time (hours)
DOXPTP + DOX
C

Figure 4.5 Plasma concentration of pantoprazole in nude mice at various time points after administration of 200mg/kg to Balb/C mice. Plasma levels of pantoprazole were determined by a validated HPLC method. (Data represents mean ± SEM; n=4)
167
0.001
0.01
0.1
1
10
100
0 5 10 15 20 25
Pant
opra
zole
Conc
entr
atio
n (µ
M)
Time (hrs)

Figure 4.6 Toxicity measurements of doxorubicin and pantoprazole treatments in nude mice. Mice were treated with either saline, DOX alone, PTP alone or a combination treatment and their body weight was measured every 2-3 days (Data represents mean ± SEM; n=4)
10
12
14
16
18
20
22
24
26
28
30
0 5 10 15 20 25 30 35 40 45Days
Body
Wei
ght (
g)
ControlDOXPTPDOX+PTP
168
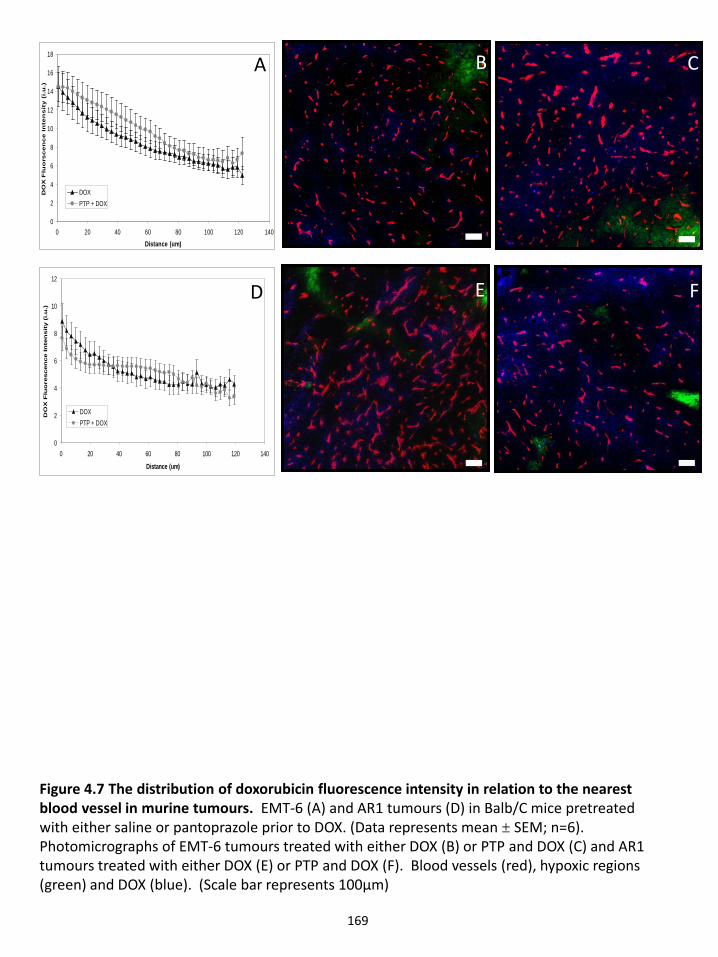
Figure 4.7 The distribution of doxorubicin fluorescence intensity in relation to the nearest blood vessel in murine tumours. EMT-6 (A) and AR1 tumours (D) in Balb/C mice pretreated with either saline or pantoprazole prior to DOX. (Data represents mean ± SEM; n=6). Photomicrographs of EMT-6 tumours treated with either DOX (B) or PTP and DOX (C) and AR1 tumours treated with either DOX (E) or PTP and DOX (F). Blood vessels (red), hypoxic regions (green) and DOX (blue). (Scale bar represents 100μm)
0
2
4
6
8
10
12
0 20 40 60 80 100 120 140
Distance (um)
DO
X F
luo
rescen
ce In
ten
sit
y (
i.u
.)
DOXPTP + DOX
0
2
4
6
8
10
12
14
16
18
0 20 40 60 80 100 120 140Distance (um)
DO
X F
luo
rsc
en
ce
In
ten
sit
y (
i.u
.)
DOXPTP + DOX
A
D
B
F
C
E
169

Figure 4.8 The distribution of doxorubicin fluorescence intensity in relation to the nearest blood vessel in xenografts. MCF-7 (A) and PgP overexpressing NCI xenografts (D) in nude mice (data represent mean ± SEM; n=6). Photomicrographs of MCF-7 tumours treated with either DOX (B) or PTP and DOX (C) and NCI tumours treated with either DOX (E) or PTP and DOX (F). Blood vessels (red), functional blood vessels (yellow), hypoxic regions (green) and DOX (blue). (Scale bar represents 100μm)
0
2
4
6
8
10
12
14
0 20 40 60 80 100 120 140Distance (um)
DO
X Fl
uore
scen
ce In
tens
ity (i
.u.)
DOXPTP + DOX
0
5
10
15
20
25
30
0 20 40 60 80 100 120 140Distance (um)
DO
X F
luor
esce
nce
Inte
nsit
y (i
.u.)
DOXPTP + DOX
A
B
CB
FE
170

0
0.002
0.004
0.006
0.008
0.01
EMT6
Func
tiona
l Ves
sel #
/ T
umor
Are
a
DOXPTP + DOX
Figure 4.9 The distribution of blood vessels and hypoxia following treatment of EMT6 and AR1 tumours. Tumour-bearing mice were pretreated with either saline or pantoprazole prior to doxorubicin. ((A) total blood vessels (B) functional blood vessels (C) hypoxia per area tumour) (Data represent mean ± SEM; EMT6: n=11; AR1: n=12).
0
0.002
0.004
0.006
0.008
0.01
0.012
0.014
0.016
0.018
EMT6 AR1
Tota
l Ves
sel #
/ T
umor
Are
aDOXPTP + DOX
0
2
4
6
8
10
12
EMT6 AR1
% E
F5 S
tain
ing
DOXPTP + DOX
A B C
171

Figure 4.10 The distribution of blood vessels and hypoxia following treatment of MCF-7 and NCI tumours. Tumour-bearing mice were pretreated with either saline or pantoprazole prior to doxorubicin. ((A) total blood vessels (B) functional blood vessels (C) hypoxia per area tumour). (Data represent mean ± SEM; MCF-7: n=11; NCI: n= 9). Photomicrographs of blood vessel (red) and hypoxia (green) distribution is shown in MCF-7 (D, E) xenografts treated with either DOX or PTP and DOX, respectively. (Scale bar represents 100μm)
0
0.002
0.004
0.006
0.008
0.01
0.012
0.014
0.016
0.018
MCF-7 NCI
Tota
l Ves
sel #
/ T
umor
Are
a
DOXPTP + DOX
0
2
4
6
8
10
12
MCF-7 NCI
% E
F5 S
tain
ing
DOXPTP + DOX
0
0.002
0.004
0.006
0.008
0.01
MCF-7 NCIFu
nctio
nal V
esse
l # /
Tum
or A
rea
DOXPTP + DOX
A B C
D E
172

Figure 4.11 The distribution of blood vessels and hypoxia following treatment of MCF-7 and NCI tumours. Tumour-bearing mice were pretreated with either saline or pantoprazole prior to doxorubicin. ((A) total blood vessels (B) functional blood vessels (C) hypoxia per area tumour). (Data represent mean ± SEM; n=7). Photomicrographs of blood vessel (red) and hypoxia (green) distribution is shown in A431 (D, E) xenografts treated with either DOX or PTP and DOX, respectively. (Scale bar represents 100μm)
0
0.002
0.004
0.006
0.008
0.01
0.012
0.014
0.016
0.018
A431
Tota
l Ves
sel #
/ T
umor
Are
a
DOXPTP + DOX
0
2
4
6
8
10
12
A431
% E
F5 S
tain
ing
DOXPTP + DOX
-2.08E-1
0.002
0.004
0.006
0.008
0.01
A431
Func
atio
nal
Vess
el #
/ T
umor
Are
a DOXPTP + DOX
A B
D E
C
173

Figure 4.12 Effect of pantoprazole and doxorubicin treatment on tumour growth in mice. Mice bearing EMT6 (A), AR1 (B), MCF-7 (C), NCI (D), or A431 (E) tumours were treated with either saline, DOX, PTP, or PTP pretreatment prior to DOX. Tumour volume in mice was measured every 2-4 days. (Data represent mean ± SEM; n=8)
10
100
1000
0 10 20 30
Mea
n Tu
mor
Vol
ume
(mm
3 )
Days
ControlDOXPTPDOX + PTP
10
100
1000
0 10 20 30
Mea
n Tu
mor
Vol
ume
(mm
3 )
Days
ControlDOXPTPDOX + PTP
10
100
1000
0 10 20 30 40 50
Mea
n Tu
mor
Vol
ume
(mm
3 )
Days
ControlDOXPTPDOX+PTP
10
100
1000
0 10 20 30 40 50
Mea
n Tu
mor
Vol
ume
(mm
3 )
Days
ControlDOXPTPDOX + PTP
10
100
1000
0 10 20 30
Mea
n Tu
mor
Vol
ume
(mm
3 )
Time (days)
ControlDOXPTPDOX + PTP
A B
C D
E
174

175
4.7 REFERENCES 1. Di Paolo A, Bocci G. Drug distribution in tumors: mechanisms, role in drug resistance, and methods for modification. Current oncology reports 2007;9(2):109-14. 2. Minchinton AI, Tannock IF. Drug penetration in solid tumours. Nature reviews 2006;6(8):583-92. 3. Eikenberry SE. A tumor cord model for doxorubicin delivery and dose optimization in solid tumors. Theoretical biology & medical modelling 2009;6(1):16. 4. Kyle AH, Huxham LA, Yeoman DM, Minchinton AI. Limited tissue penetration of taxanes: a mechanism for resistance in solid tumors. Clin Cancer Res 2007;13(9):2804-10. 5. Lankelma J, Dekker H, Luque FR, et al. Doxorubicin gradients in human breast cancer. Clin Cancer Res 1999;5(7):1703-7. 6. Primeau AJ, Rendon A, Hedley D, Lilge L, Tannock IF. The distribution of the anticancer drug Doxorubicin in relation to blood vessels in solid tumors. Clin Cancer Res 2005;11(24 Pt 1):8782-8. 7. Tunggal JK, Cowan DS, Shaikh H, Tannock IF. Penetration of anticancer drugs through solid tissue: a factor that limits the effectiveness of chemotherapy for solid tumors. Clin Cancer Res 1999;5(6):1583-6. 8. Mahoney BP, Raghunand N, Baggett B, Gillies RJ. Tumor acidity, ion trapping and chemotherapeutics. I. Acid pH affects the distribution of chemotherapeutic agents in vitro. Biochem Pharmacol 2003;66(7):1207-18. 9. Simon S, Roy D, Schindler M. Intracellular pH and the control of multidrug resistance. Proc Natl Acad Sci U S A 1994;91(3):1128-32. 10. Gillies RJ, Liu Z, Bhujwalla Z. 31P-MRS measurements of extracellular pH of tumors using 3-aminopropylphosphonate. Am J Physiol 1994;267(1 Pt 1):C195-203. 11. McCoy CL, Parkins CS, Chaplin DJ, Griffiths JR, Rodrigues LM, Stubbs M. The effect of blood flow modification on intra- and extracellular pH measured by 31P magnetic resonance spectroscopy in murine tumours. British journal of cancer 1995;72(4):905-11. 12. Raghunand N, He X, van Sluis R, et al. Enhancement of chemotherapy by manipulation of tumour pH. British journal of cancer 1999;80(7):1005-11. 13. Ouar Z, Lacave R, Bens M, Vandewalle A. Mechanisms of altered sequestration and efflux of chemotherapeutic drugs by multidrug-resistant cells. Cell Biol Toxicol 1999;15(2):91-100. 14. Nishi T, Forgac M. The vacuolar (H+)-ATPases--nature's most versatile proton pumps. Nat Rev Mol Cell Biol 2002;3(2):94-103. 15. Sabolic I, Brown D, Verbavatz JM, Kleinman J. H(+)-ATPases of renal cortical and medullary endosomes are differentially sensitive to Sch-28080 and omeprazole. Am J Physiol 1994;266(6 Pt 2):F868-77. 16. Larsson H, Mattson H, Sundell G, Carlsson E. Animal pharmacodynamics of omeprazole. A survey of its pharmacological properties in vivo. Scand J Gastroenterol Suppl 1985;108:23-35. 17. Lee CM, Tannock IF. Inhibition of endosomal sequestration of basic anticancer drugs: influence on cytotoxicity and tissue penetration. British journal of cancer 2006;94(6):863-9.

176
18. Pauli-Magnus C, Rekersbrink S, Klotz U, Fromm MF. Interaction of omeprazole, lansoprazole and pantoprazole with P-glycoprotein. Naunyn-Schmiedeberg's archives of pharmacology 2001;364(6):551-7. 19. Chang G. Multidrug resistance ABC transporters. FEBS letters 2003;555(1):102-5. 20. Higgins CF. ABC transporters: physiology, structure and mechanism--an overview. Research in microbiology 2001;152(3-4):205-10. 21. Patel KJ, Tannock IF. The influence of P-glycoprotein expression and its inhibitors on the distribution of doxorubicin in breast tumors. BMC cancer 2009;9:356. 22. Altan N, Chen Y, Schindler M, Simon SM. Tamoxifen inhibits acidification in cells independent of the estrogen receptor. Proceedings of the National Academy of Sciences of the United States of America 1999;96(8):4432-7. 23. Mayer LD, Bally MB, Cullis PR. Uptake of adriamycin into large unilamellar vesicles in response to a pH gradient. Biochimica et biophysica acta 1986;857(1):123-6. 24. Phillips RM, Loadman PM, Cronin BP. Evaluation of a novel in vitro assay for assessing drug penetration into avascular regions of tumours. British journal of cancer 1998;77(12):2112-9. 25. Poole B, Ohkuma S. Effect of weak bases on the intralysosomal pH in mouse peritoneal macrophages. The Journal of cell biology 1981;90(3):665-9. 26. Cowan DS, Hicks KO, Wilson WR. Multicellular membranes as an in vitro model for extravascular diffusion in tumours. The British journal of cancer 1996;27:S28-31. 27. Hicks KO, Ohms SJ, van Zijl PL, Denny WA, Hunter PJ, Wilson WR. An experimental and mathematical model for the extravascular transport of a DNA intercalator in tumours. British journal of cancer 1997;76(7):894-903. 28. Less JR, Skalak TC, Sevick EM, Jain RK. Microvascular architecture in a mammary carcinoma: branching patterns and vessel dimensions. Cancer research 1991;51(1):265-73. 29. Martinez-Zaguilan R, Seftor EA, Seftor RE, Chu YW, Gillies RJ, Hendrix MJ. Acidic pH enhances the invasive behavior of human melanoma cells. Clinical & experimental metastasis 1996;14(2):176-86. 30. Morita T, Nagaki T, Fukuda I, Okumura K. Clastogenicity of low pH to various cultured mammalian cells. Mutation research 1992;268(2):297-305. 31. Raghunand N, Mahoney B, van Sluis R, Baggett B, Gillies RJ. Acute metabolic alkalosis enhances response of C3H mouse mammary tumors to the weak base mitoxantrone. Neoplasia (New York, NY 2001;3(3):227-35. 32. De Milito A, Fais S. Tumor acidity, chemoresistance and proton pump inhibitors. Future oncology (London, England) 2005;1(6):779-86. 33. Izumi H, Torigoe T, Ishiguchi H, et al. Cellular pH regulators: potentially promising molecular targets for cancer chemotherapy. Cancer treatment reviews 2003;29(6):541-9. 34. Tannock IF, Rotin D. Acid pH in tumors and its potential for therapeutic exploitation. Cancer research 1989;49(16):4373-84. 35. Wong P, Kleemann HW, Tannock IF. Cytostatic potential of novel agents that inhibit the regulation of intracellular pH. British journal of cancer 2002;87(2):238-45. 36. Boyer MJ, Tannock IF. Regulation of intracellular pH in tumor cell lines: influence of microenvironmental conditions. Cancer research 1992;52(16):4441-7.

177
37. Raghunand N, Martinez-Zaguilan R, Wright SH, Gillies RJ. pH and drug resistance. II. Turnover of acidic vesicles and resistance to weakly basic chemotherapeutic drugs. Biochemical pharmacology 1999;57(9):1047-58. 38. Luciani F, Spada M, De Milito A, et al. Effect of proton pump inhibitor pretreatment on resistance of solid tumors to cytotoxic drugs. Journal of the National Cancer Institute 2004;96(22):1702-13. 39. Ouar Z, Bens M, Vignes C, et al. Inhibitors of vacuolar H+-ATPase impair the preferential accumulation of daunomycin in lysosomes and reverse the resistance to anthracyclines in drug-resistant renal epithelial cells. The Biochemical journal 2003;370(Pt 1):185-93. 40. Yeo M, Kim DK, Kim YB, et al. Selective induction of apoptosis with proton pump inhibitor in gastric cancer cells. Clin Cancer Res 2004;10(24):8687-96. 41. Thiebaut F, Currier SJ, Whitaker J, et al. Activity of the multidrug transporter results in alkalinization of the cytosol: measurement of cytosolic pH by microinjection of a pH-sensitive dye. J Histochem Cytochem 1990;38(5):685-90. 42. Altan N, Chen Y, Schindler M, Simon SM. Defective acidification in human breast tumor cells and implications for chemotherapy. The Journal of experimental medicine 1998;187(10):1583-98. 43. Benderra Z, Morjani H, Trussardi A, Manfait M. Characterization of H+-ATPase-dependent activity of multidrug resistance-associated protein in homoharringtonine-resistant human leukemic K562 cells. Leukemia 1998;12(10):1539-44. 44. Schindler M, Grabski S, Hoff E, Simon SM. Defective pH regulation of acidic compartments in human breast cancer cells (MCF-7) is normalized in adriamycin-resistant cells (MCF-7adr). Biochemistry 1996;35(9):2811-7. 45. Hurwitz SJ, Terashima M, Mizunuma N, Slapak CA. Vesicular anthracycline accumulation in doxorubicin-selected U-937 cells: participation of lysosomes. Blood 1997;89(10):3745-54. 46. Warren L, Jardillier JC, Ordentlich P. Secretion of lysosomal enzymes by drug-sensitive and multiple drug-resistant cells. Cancer research 1991;51(8):1996-2001. 47. Klohs WD, Steinkampf RW. The effect of lysosomotropic agents and secretory inhibitors on anthracycline retention and activity in multiple drug-resistant cells. Molecular pharmacology 1988;34(2):180-5. 48. Lautier D, Bailly JD, Demur C, Herbert JM, Bousquet C, Laurent G. Altered intracellular distribution of daunorubicin in immature acute myeloid leukemia cells. Int J Cancer 1997;71(2):292-9. 49. Sognier MA, Zhang Y, Eberle RL, Sweet KM, Altenberg GA, Belli JA. Sequestration of doxorubicin in vesicles in a multidrug-resistant cell line (LZ-100). Biochemical pharmacology 1994;48(2):391-401. 50. Zamora JM, Beck WT. Chloroquine enhancement of anticancer drug cytotoxicity in multiple drug resistant human leukemic cells. Biochemical pharmacology 1986;35(23):4303-10. 51. Ma L, Center MS. The gene encoding vacuolar H(+)-ATPase subunit C is overexpressed in multidrug-resistant HL60 cells. Biochemical and biophysical research communications 1992;182(2):675-81.

178
52. Wang E, Lee MD, Dunn KW. Lysosomal accumulation of drugs in drug-sensitive MES-SA but not multidrug-resistant MES-SA/Dx5 uterine sarcoma cells. Journal of cellular physiology 2000;184(2):263-74. 53. Tunggal JK, Melo T, Ballinger JR, Tannock IF. The influence of expression of P-glycoprotein on the penetration of anticancer drugs through multicellular layers. Int J Cancer 2000;86(1):101-7. 54. Bancroft CC, Chen Z, Dong G, et al. Coexpression of proangiogenic factors IL-8 and VEGF by human head and neck squamous cell carcinoma involves coactivation by MEK-MAPK and IKK-NF-kappaB signal pathways. Clin Cancer Res 2001;7(2):435-42. 55. Yeo M, Kim DK, Han SU, et al. Novel action of gastric proton pump inhibitor on suppression of Helicobacter pylori induced angiogenesis. Gut 2006;55(1):26-33. 56. Kim H, Barroso M, Samanta R, Greenberger L, Sztul E. Experimentally induced changes in the endocytic traffic of P-glycoprotein alter drug resistance of cancer cells. Am J Physiol 1997;273(2 Pt 1):C687-702. 57. Martinez-Zaguilan R, Raghunand N, Lynch RM, et al. pH and drug resistance. I. Functional expression of plasmalemmal V-type H+-ATPase in drug-resistant human breast carcinoma cell lines. Biochemical pharmacology 1999;57(9):1037-46. 58. Thews O, Gassner B, Kelleher DK, Schwerdt G, Gekle M. Impact of extracellular acidity on the activity of P-glycoprotein and the cytotoxicity of chemotherapeutic drugs. Neoplasia (New York, NY 2006;8(2):143-52.

179
CHAPTER 5
CONCLUSIONS & FUTURE DIRECTIONS

180
5.1 SUMMARY OF FINDINGS Chemotherapy is the most widely used treatment for many types of cancer.
Chemotherapy is also used to prevent disease recurrence after treatment by eradicating
micro-metastases and improving local control of the primary tumour. However, the
effectiveness of chemotherapy is greatly limited by drug resistance. In addition to
cellular and molecular causes, mechanisms of drug resistance that relate to the tumour
microenvironment are also likely to have a profound impact on the sensitivity of tumours
to chemotherapeutic agents. Drug distribution is likely to be an important
microenvironmental factor that limits the drug’s ability to reach all viable cancer cells in
sufficiently cytotoxic concentrations. By focusing our research efforts on understanding
drug distribution and determining whether it is a modifiable phenomenon, we can
determine whether improving drug distribution can improve chemotherapeutic efficacy in
patients.
This thesis focused on various aspects of drug distribution; in particular: (1) the
comparisons of drug distribution between normal and tumour tissue, and the change in
drug distribution over time in solid tumours; (2) the effects of drug efflux pumps and
their inhibitors on drug distribution in solid tumours, and whether these changes are
detectable and quantifiable; and, (3) the effects of inhibiting drug sequestration within
cellular organelles, through the use of proton pump inhibitors, on drug distribution in
solid tumours.

181
5.2 DISTRIBUTION OF ANTICANCER DRUGS IN NORMAL AND TUMOUR TISSUES 5.2.1 Summary of major findings
In Chapter 2, I examined the distribution over time of three anti-cancer drugs
(doxorubicin, mitoxantrone and topotecan) in human breast xenografts, and compared
drug distribution in the tumour with that in the liver, kidney, heart and brain. These anti-
cancer drugs are commonly used in the clinic as part of chemotherapy regimens in the
treatment of various types of cancer, including lymphomas, leukemias, breast and
prostate cancer, and ovarian and small cell lung cancer (1-6). Various HPLC-based
pharmacokinetic studies of doxorubicin, mitoxantrone and topotecan have yielded
valuable information such as total drug concentrations in normal tissues and tumour
tissues (7-9). Additionally, however, it is important to gain an understanding about the
spatial distributions of anticancer drugs and how they are affected by time and tissue
because it will broaden our understanding of drug distribution as a mechanism of drug
resistance in tumours and as an additional indicator of normal tissue toxicity.
The autofluorescent properties of the three drugs examined in this chapter allowed
for the determination of drug distribution gradients in relation to distance to the nearest
blood vessel. We hypothesized that drug distribution in the heart, liver and kidney would
be far more uniform than that in the tumour; however, the brain was likely to show the
least amount of drug. My data showed that, even 10 minutes after doxorubicin
administration, the perivascular doxorubicin fluorescence in tumour tissue was
substantially lower than in the heart, liver and kidney. As well, after 3 hours, the
fluorescence of all three drugs in the heart, liver and kidney decreased, and after 24 hours

182
this trend was more pronounced. Due to the organized nature of the vasculature in
normal tissues, distances between neighboring vessels are significantly less in normal
tissues than in tumours. In contrast to the heart, liver and kidney, drug distribution in the
brain was very low, due to the presence of the blood-brain barrier.
Within tumour tissue, the distance at which drug fluorescence intensity falls to
half is between 50-60μm amongst fourtypes of tumour lines. Doxorubicin, mitoxantrone
and topotecan all showed a time-dependent decrease in distribution in tumours from 10
minutes to 24 hours. At 24 hours, the gradient of decreasing fluorescence in relation to
distance to the nearest blood vessel is lower; however, the overall fluorescence is also
significantly less. Doxorubicin treatment appeared to decrease tumour vasculature 24
hours after treatment and cause a transient increase in hypoxia after 3 hours followed by a
significant decrease after 24 hours.
5.2.2 Implications of study
The majority of pharmacokinetic studies on anticancer drugs focus on using
HPLC as the sole determinant of drug concentration in various tissues. These studies are
good indicators of drug concentration; however, we showed that the distribution profiles
of anti-cancer drugs in various tissues can also provide valuable information. The
delivery of drugs to tissues involves three processes: distribution through vascular space,
transport across the microvessel walls, and diffusion and/or convection through tissue
(10). In normal tissues, drug delivery is efficient within these three processes, and
differences in fluorescence distribution profiles between drugs is likely predominantly
due to physiochemical properties of the drugs (e.g., binding affinities of drugs,

183
diffusivity). In contrast, limited drug delivery in solid tumours imply that drug
distribution profiles are likely dependent predominantly on biological properties of a
tumour (e.g., blood flow, interstitial fluid pressure, angiogenesis, vessel distribution, cell
density) in addition to physicochemical properties of the drugs. Thus, agents given in
conjunction with chemotherapy that alter the biological properties of a tumour, may not
alter drug distribution or have the same degree of cytotoxic effects in normal tissues.
Although this is a generalization, it proposes a promising area of drug development that
enhances tumour specificity and reduces normal tissue toxicity.
5.3 THE INFLUENCE OF PgP EXPRESSION AND ITS INHIBITORS ON DOXORUBICIN DISTRIBUTION 5.3.1 Summary of major findings
From the data in Chapter 2, in addition to work done by others, it is evident that
limited drug distribution in solid tumours is likely to play a major role in multifactorial
drug resistance (11-15). Since drug distribution involves the movement of drug from the
vascular space into the interstitium, and finally through the tissue, there are a multitude of
factors that are likely to affect this movement. In Chapter 3, I proposed a set of
experiments to determine whether drug distribution was in fact a modifiable phenomenon
and whether the solid tumour model system was sensitive enough to detect these changes.
Previous work in our lab using multilayered cell cultures showed that drug efflux pumps
such as PgP can alter drug penetration in this in vitro system (16). In this chapter, I
applied this model of drug efflux to alter drug distribution in solid tumours. From the
observation that doxorubicin remains highly restricted to areas proximal to blood vessels,
we hypothesized that, in tumours that overexpress PgP, the pump, while preventing
184
cellular accumulation of drug within cells, may actively work to distribute drug to areas
distal to blood vessels and improve drug distribution. If this held true, then the corollary
would be that inhibitors of PgP would keep drug within cells and restrict its distribution
to cells further away.
In Chapter 3, my data show that PgP overexpression alters the gradient of drug
distribution such that drug uptake in cells proximal to blood vessels is significantly less
and there is a shallower gradient of decreasing doxorubicin fluorescence with increasing
distance from the nearest blood vessel compared to wild type tumours. I showed that the
first and second generation inhibitors of PgP, verapamil and PSC 833, led to an increased
uptake of doxorubicin by cells close to blood vessels, but also increased the gradient of
doxorubicin intensity so that distribution was more heterogenous and similar to that of
wild-type tumours. Growth delay studies showed that there was no significant effect of
doxorubicin on the growth of both wild-type and PgP overexpressing tumours. The
combination of verapamil or PSC 833 with doxorubicin showed no increase in tumour
growth delay; however, these combinations exerted toxic side effects.
5.3.2 Implications of study
These data indicate that drug efflux pumps can alter drug distribution within a
solid tumour model. PgP overexpression is very common in certain types of cancer such
as liver, pancreas, kidney, ovary and breast (17, 18). Attempts to circumvent this type of
drug resistance have led to the development of three generations of inhibitors; however,
clinical trial data continues to provide disappointing results (19-25). While we have
shown that PgP may increase drug distribution in solid tumours, this does not suggest that

185
PgP is conducive to improved drug effects. In fact, increased drug distribution is at the
cost of limited cellular accumulation, and therefore this cannot lead to enhanced
chemotherapeutic effects. The data in this chapter have two major implications: (1) in
addition to toxic side effects and pharmacokinetic interactions, the inability of PgP
inhibitors to successfully enhance cytotoxicity of chemotherapeutic agents maybe also be
due to the fact that they limit drug distribution, such that the drug remains predominantly
in areas peripheral to blood vessels, thus preventing sufficient concentrations of drugs to
be available to viable cells more distally located; and, (2) drug distribution is a
modifiable phenomenon, which is detectable and quantifiable using our subcutaneous
solid tumour model system.
5.4 THE INFLUENCE OF PANTOPRAZOLE ON DOXORUBICIN DISTIRBUTION AND ACTIVITY IN CANCER 5.4.1 Summary of major findings
In the previous two chapters, I demonstrated that drug distribution was limited in
solid tumours, that it was modifiable, and that we could detect and quantify these
changes. In Chapter 4, I proposed a strategy to improve drug distribution and ultimately
improve therapeutic efficacy of doxorubicin. Tumour acidity was proposed as a
mechanism of drug resistance in part because of it leads to the sequestration of basic
drugs such as doxorubicin in acidic endosomes within tumour cells. Increased
acidification of organelles within tumour cells is facilitated by the expression of vacuolar-
H+-ATPases. Agents that disrupt the pH gradient between the cytoplasm and the
endosomes in tumours might decrease the sequestration of basic anticancer drugs. We
hypothesize that this may make cells and tumours more sensitive to drug because more

186
drug is able to enter the nucleus and cause cell death, and more drug is available to
penetrate to cells distal from blood vessels. In the data in Chapter 4, I show that the
proton pump inhibitor pantoprazole increases endosomal pH in tumour cells and that
pantoprazole pretreatment of cells in culture alters the uptake and intracellular
distribution of doxorubicin, so that it is predominantly located in the nucleus, as opposed
to diffusely present in cytoplasmic compartments. In wild-type, pantoprazole pretreated,
cells, doxorubicin uptake decreased slightly, whereas in pretreated PgP overexpressing
cells, doxorubicin uptake increased significantly. From this observation, we proposed
that reduced doxorubicin uptake in pantoprazole-pretreated cells may lead to improved
drug distribution compared to pretreated PgP overexpressing tumours. The MCC data
showed that pantoprazole pretreatment led to the enhanced drug distribution in both wild-
type and PgP-overexpressing tumour tissue. In solid tumours, however, a shallower
gradient, and thus, improved drug distribution was observed in only PgP wild-type
human xenografts. Growth delay studies indicate that only the PgP wild-type human
xenografts pretreated with pantoprazole and then doxorubicin showed a significant
increase in tumour growth delay, whereas wild-type murine and PgP overexpressing
murine and xenografts showed only modest improvements in growth delay.
5.4.2 Implications of study
The data in Chapter 4 suggest that agents that alter the pH gradients in tumour tissue may
influence both drug distribution and tumour growth delay. However, the data involving
PgP overexpression also suggests that there are more factors at play. For example,
pantoprazole may have an important interaction with PgP on the cell membrane that

187
alters doxorubicin activity, or the presence of PgP may lead to an altered pH profile than
in wildtype variants (26, 27). The results from the PgP tumours demonstrate the
complexity of multifactorial drug resistance. Though not universally applicable, the
results from the wild-type tumours are encouraging and suggest a possible strategy to
overcome multiple factors of drug resistance (ie. drug sequestration, intracellular
accumulation and extracellular distribution).
5.5 LIMITATIONS AND FUTURE DIRECTIONS
5.5.1 Drug fluorescence intensity and drug concentration
Our studies of drug distribution give fluorescence intensity profiles of drugs in
relation to distance from the nearest blood vessel. While changes in fluorescence
intensity reflect changes in drug concentration, it is difficult to determine the ranges of
fluorescent intensity that correlate with concentrations that lead to cytotoxicity. One
limitation of our in vivo studies is that we cannot correlation the drug distribution
gradients with concentration gradients. This correlation could provide additional
information, such as: the fraction of cells within a tumour section that receive sufficient
concentrations of drug to cause cell death; the fraction and location of cells that are likely
to develop intrinsic or extrinsic drug resistance because of exposure to low levels of drug,
and the fraction of cells that are likely to contribute to repopulation of the tumour because
of minimal exposure to drug.
One potential strategy that may be used to establish this correlation could involve
submerging small 2 mm tumour tissue pieces in various known concentrations of
fluorescent drug in vitro, in order to establish calibration curves for concentration vs.

188
fluorescence intensity gradients. After a given time, tissue pieces would be frozen,
sectioned and imaged. In this way, a range of fluorescence intensities may be correlated
with a range of drug concentrations, with values that are comparable to intensity values
obtained from tumours extracted from mice that were treated with the drug. This strategy
has been developed and used to associate patterns in hypoxia (using an EF5 marker) with
oxygen gradients within tumour tissue in an effective method referred to as cube
reference binding (CRB) (28, 29). It would be difficult to generate exact correlations
between drug fluorescence intensity and concentration using CRB due to factors such as
tissue thickness and method of drug exposure to the tissue; however, it may allow us to
develop a reference ‘ladder’ of decreasing fluorescence relating to decreasing
concentration, which can then be translated into the in vivo tumour model system with the
appropriate corrections. A similar concept can be applied to correlate drug fluorescence
with occurrence of cytotoxicity (through markers such as cleaved caspase-3 or gamma-
histone 2AX (γH2AX).
5.5.2 Quantification of drug intensity
Our analysis of drug distribution in tumour sections is limited to 2-dimensional
analysis, as representative of a 3-dimensional tumour. As a result of this, there is a bias
toward overestimating the distance of a pixel to its nearest blood vessel, particularly at
large distances, due to the presence of out-of-plane vessels. This bias leads to a more
uniform distribution profile than what may actually exist and implies that a 3-dimensional
analysis would indicate gradients of doxorubicin distribution that are steeper than what
have been represented in this thesis. To minimize the effect of this bias, and to reduce

189
the influence of ‘noise’ from non-specific fluorescence, we fitted data only to distances
between 100-120μm from blood vessels for most distributions.
The wide-field image analysis method was used in our studies to generate drug
distribution profiles. This method quantifies fluorescent pixel intensity due to drug, and
its distance to the nearest blood vessel, taking into account all pixels in a given region of
the tumour section. This is a robust and objective technique, because it takes into
consideration the distribution of drug relative to all vessels within the image. This
method of quantification generates a data matrix displaying the range of pixel intensities
for all pixels at a specific distance to the nearest blood vessel; the matrix is then plotted
as a 3-dimensional histogram, showing the distribution of pixel intensities for each
distance from the nearest blood vessel (Figure 5.1). The mean intensity for each
histogram (i.e. mean intensity at a given distance) can be plotted as a function of distance
to the nearest blood vessel. These are the distribution profiles that were used in our
studies. A limiting factor of this technique is that it is susceptible to artefact from
background autofluorescence of the tissue, drug signal due to distribution from out-of-
section blood vessels, or drug with no corresponding CD31 staining despite the fact that
the lumen of the vessel can be readily seen. The algorithm cannot distinguish signal from
artefact from that due to drug. Recognition of these limitations allows for their
identification such that images that are relatively void of such artefacts can be selected.
The algorithm computes pixel intensity and its distance to the nearest vessel and assumes,
sometimes incorrectly, that the nearest vessel is the source of the drug fluorescence.
While this is largely correct, the nearest vessel may be non-perfused and the detected
fluorescence may be from a more distal vessel. Use of a perfusion marker, such as

190
DiOC7, may circumvent this limitation; however the diffuse staining of non-binding
perfusion markers may overlay with drug fluorescence in the first few layers of cells and
alter distribution gradients in proximal regions. By averaging the mean intensities at a
given distance from several areas of interest within a tumour section and within tumours
of the same treatment group, the effects of fluorescence from artefacts and out-of-section
vessels do not strongly influence the overall distribution profiles.
Another limitation of this quantification method is that by taking the mean
intensities at a given distance from the nearest blood vessel, a large amount of the 3-
dimensional data matrix is not incorporated. Thus, our mean intensity distributions are
likely to be underestimated. Strategies to incorporate the entire data matrix by averaging
entire 3-dimensional histograms have been explored; however, there are challenges in
spatially averaging each pixel intensity and distance between numerous areas of interest.
Analysis programs that allow us to average multiple 3-dimensional data matrices while
correcting for user-defined specified factors depending on the area of interest within the
tumour, would create more accurate drug distribution profiles that may be even more
sensitive and allow us to detect even small changes in drug distribution between
treatment groups.

191
Figure 5.1 The 3-dimensional histogram displaying distribution of pixel intensities for a given distance to the nearest blood vessel. For each distance to the nearest blood vessel there exists a frequency of pixels with a range of intensities. These values are generated using a wide-field analysis algorithm for given areas of interest within a tumour section.

192
5.5.3 The influence of pH on drug fluorescence
In our studies of drug distribution, we examined changes in fluorescence intensity
in relation to distance to the nearest blood vessels. While changes in fluorescence
intensity implied changes in drug concentration at various distances, there are other
factors that can influence drug fluorescence intensity, and therefore pose as potential
limitations to these studies. In chapter 4, we showed that basic drugs such as doxorubicin
can become sequestered in acidic organelles. The altered pH in the tumour
microenvironment and the potential sequestration and protonation of such drugs in acidic
organelles could alter the fluorescence of these drugs. Changes in fluorescence intensity
due to factors such as pH can thus alter distribution profiles. It is important to know how
such factors can affect drug distribution, so that when changes in fluorescence are
detected, they can be attributed appropriately, either to physical and environmental
properties of drug and tumour, or to changes in distribution. One way to detect whether
factors such as pH affect drug fluorescence is to determine the emission spectra of the
drugs across a range of pHs. Preliminary studies measuring the emission fluorescence
intensities of doxorubicin, mitoxantrone and topotecan within their specified excitation
wavelength filter sets were done for the drugs in buffer solutions ranging in pH from 4-8.
This study showed that doxorubicin and mitoxantrone fluorescence are only slightly
affected by pH, however, topotecan fluorescence changes quite dramatically across the
pH range tested (Figure 5.2).

193
Figure 5.2 Fluorescence emission of drugs at various pHs. The fluorescence intensities integrated over excitation wavelengths specific to each drug were determined for doxorubicin (A), mitoxantrone (B) and topotecan (C) in buffer solutions with pHs ranging from 4-8.

194
These studies demonstrated that changes in drug fluorescence can be due to
physical and microenvironmental factors such as pH. Other factors such as: the type of
treatment strategy employed, bound drug versus free drug, and location of drug within
the cytoplasm, drug target or interstitium may also alter drug fluorescence intensity.
Future studies incorporating spectroscopic analyses of drug fluorescence are important to
ensure drug distribution profiles accurately reflect drug intensity within the appropriate
excitation and emission wavelengths.
5.5.4 Distribution of non-fluorescent drugs
We have shown that it is possible to detect and quantify the distribution of
fluorescent anticancer drugs within tissue sections from solid tumours. Future studies
will extend this technique to investigate distribution profiles for non-fluorescent drugs
and the degree to which they may be amenable to modification. Studies to evaluate
cisplatin distribution or the distribution of alkylating agents have been undertaken by
examining fluorescent antibodies targeting DNA-drug adducts as a surrogate marker of
drug distribution (30). Related techniques can identify additional surrogate markers of
drug distribution such as apoptotic and/or cell cycle markers. For example, it was shown
that cells located distal to the vasculature in human tumour xenografts had less
disturbance of the cell cycle than proximal cells following treatment with gemcitibine,
most likely due to limited distribution of the drug; the distal cells commenced cycling
sooner than proximal cells and were largely responsible for repopulating the tumour (31).
As demonstration of the utility of this surrogate marker approach, ongoing studies
in our laboratory have shown a positive correlation between doxorubicin fluorescence

195
intensity in relation to distance to the nearest blood vessel and the distribution γH2AX, a
marker of DNA double-strand breaks, at 10 minutes after drug administration.
Correlations between doxorubicin fluorescence gradients and markers for apoptosis (ex.
cleaved caspase-3) are also apparent, however only at longer time points beyond 3 hours.
Melphalan distribution, determined through the use of DNA-adducts and fluorescence
gradients, also correlated well with γH2AX distribution gradients.
The use of surrogate markers to evaluate distribution in non-fluorescent anti-
cancer drugs can be a powerful tool to determine whether limited drug distribution is
contributing to drug resistance and can further lead to strategies to overcome resistance
by tackling this microenvironmental mechanism.
5.5.5 Tumour model as a preclinical model
The present study examined drug distribution through the use of frozen tumour
tissue taken from tumours grown subcutaneously in mice. Some studies suggest that the
vasculature within spontaneous or orthotopic tumours is different from vessels in
transplanted subcutaneous tumours (32, 33). Therefore, due to the pivotal role tumour
blood vessels play in drug delivery and ultimately drug distribution, it will be important
to study drug distribution within the tumour microenvironments of other tumour models.
Future studies to determine drug distribution profiles in spontaneous or orthotopic
tumours, or in primary patient samples (if available), would broaden our understanding of
factors that affect drug distribution and how amenable they may be to modification.

196
As well, conditions in the tumour microenvironment change over time and
continue to change following drug treatment and this fluidity of the tumour
microenvironment is difficult to relay using the current methodology. In addition to
using a 3-dimensional model, using a real time in vivo model would be beneficial. With
advancements in imaging techniques it might now be feasible to measure changes
vasculature, hypoxia and drug distribution in solid tumours following chemotherapy in
live animals.
An example of one technique is the window-chamber model system. This system
allows for accessible imaging of changes in tumour cells and vasculature as well as the
movement of drug within a solid tumour; furthermore, since this technique is minimally
invasive and animals recover well from anesthesia used during imaging, animals could be
imaged at multiple time points following drug treatment in a continuous long-term study
(34, 35). Other imaging modalities, such as Doppler Optical Coherence Tomography
(DOCT), have been used to detect changes in blood vessel function in solid tissues grown
in the window-chamber model by measuring the flow velocity with a resolution of
<10μm (36). A potential disadvantage of this system is that a window-chamber system
provides an artificial environment for tumour growth, and tissue growth is limited (35).
Bioluminescence imaging is a potential tool for measuring changes in the tumour
in its innate environment. However, to date, the resolution of bioluminescence imaging
is not sensitive enough to detect changes at the cellular level (i.e. micrometer range).
Therefore, bioluminescence imaging might be used to determine how drugs are
distributed overall within tumour tissue; however, it is presently not feasible to evaluate

197
the spatial distribution of changes in fluorescence in relation to blood vessels using this
imaging modality.
5.5.6 Alternative strategies that may influence drug distribution
One avenue of improving the distribution of chemotherapeutic agents involves the
manner in which drugs are administered; specifically dose, schedule and duration of
therapy. In Chapter 4, we showed an improvement in drug distribution with a single dose
administration of pantoprozole prior to a single dose of doxorubicin. As well, this
treatment showed increased growth delay in a PgP wild-type xenograft model. One
strategy that may enhance tumour growth delay to a greater degree would be to treat
tumour-bearing mice with a multiple-dose schedule over a few weeks. This could
potentially reduce repopulation of viable cancer cells that do not receive a sufficient
concentration of drug to cause cytoxicity from the initial single dose. As well, with the
death of cells proximal to blood vessels from the first treatment, there may more access to
drugs from the second treatment by cells distal to blood vessels. This type of treatment
regimen would better reflect the dosing schedules utilized in the clinical setting.
Preliminary studies undertaken in our lab using a multiple dose treatment schedule of
pantoprazole in combination with doxorubicin indicate improved growth delay in PgP
wild-type xenografts. Further studies exploring different treatment schedules, doses and
tumour models will help elucidate the whether this is a promising strategy that can
translate into the clinic.
Other strategies to this effect are continuous infusion and metronomic
chemotherapy. Continuous infusion chemotherapy may be described as a prolonged
198
infusion of drug for 5 days or more (37). The rationale behind continuous infusion
chemotherapy is that if exposure to the cytotoxic agent can be prolonged over the
duration of the cell cycle, drugs that are cell-cycle specific should have improved
efficacy; by continuously exposed the tumour to drugs the tumour cells are more likely to
be killed. In contrast, administering drugs by bolus injection may lead to the majority of
tumour cells not being killed because they are not in their vulnerable phase (i.e. S or M
phase of the cell cycle). Also, with respect to improved drug distribution, continuous
infusion could lead to a more constant and prolonged pressure head that may enhance
drug distribution in tumour tissue versus the rapid rise and fall off in serum drug
concentrations that occurs with a single bolus injection.
The most frequently used drug for continuous infusion is 5-fluorouracil (5-FU)
(37-39). In a phase III study comparing 5-FU continuous infusion with 5-FU bolus
injection in colorectal cancer, the continuous infusion group showed a 44% response rate
versus 22% in the bolus injection group with a complete lack of haematological toxicity
in the continuous infusion group (39). However, while there seems to be a definite trend
toward increased response rate in these studies, no clear survival advantage has been
established (38-41).
Another drug administration strategy that may affect drug distribution is
metronomic therapy. This is a method of drug delivery in which low, well below the
maximum tolerated dose, of chemotherapeutic agents are given at frequent or even daily
intervals (42). The initial rationale for this type of therapy stems from evidence that
administering comparatively low doses of chemotherapy on a frequent or continuous
schedule, with no extended interruptions, has anti-angiogenic effects (42). In addition to

199
reduced acute toxicity, the efficacy of metronomic therapy seems to increase when
administered in combination with specific anti-angiogenic drugs, likely due to the
combined normalizing effect of low dose, steady chemotherapy treatment and anti-
angiogenic therapy.
The data presented in this thesis suggest that some chemotherapeutic agents such
as doxorubicin have poor drug distribution. This is due, in part, to increased consumption
by perivascular cells, which limits the availability of drug to cells further from blood
vessels. While metronomic therapy may not improve drug distribution, it could lead to
more efficient cell killing per dose of chemotherapy; this may progressively kill cell
layers proximal to blood vessels on a continuous basis and circumvent the issue of poor
drug distribution that can occur with single maximum tolerated doses of drugs.
5.6 CONCLUSIONS
In summary, work completed in this thesis has added knowledge to the field of cancer
biology by demonstrating that: drug distribution profiles in tumours are highly limited
compared to normal tissue; drug distribution can be modified in solid tumours; and,
improving drug distribution may be an effective strategy to overcome drug resistance as
well as enhance the therapeutic index of chemotherapy agents. I have established that the
spatial distribution of three anticancer drugs, doxorubicin, mitoxantrone and topotecan is
time-dependent and tissue-dependent, when comparing tumour, heart, kidney, liver and
brain tissue. Using P-glycoprotein expressing tumour models and PgP inhibitors, I
showed that there is a significant trade-off between high uptake of drugs in cells proximal
to blood vessels and distribution of drugs in cells distal to blood vessels. As well, with

200
this model, I demonstrated that drug distribution is modifiable in an in vivo system and
that these changes are detectable. Lastly, I studied a strategy to improve doxorubicin
distribution with the use of the proton pump inhibitor, pantoprazole. Pretreatment with
pantoprazole was shown to alter both intracellular and extracellular distribution of
doxorubicin within human tumour cells and xenografts. In addition to increased drug
distribution, there was also improved tumour growth delay suggesting that this may be an
effective treatment strategy in the treatment of solid tumours.
The work in this thesis highlights the complexity of the solid tumour
microenvironment, and illustrates the importance of examining mechanisms of drug
resistance that relate to it. The distribution of anticancer drugs can have a profound
impact on the effectiveness of the treatments. By broadening our understanding of
factors that can influence drug distribution and exploring various ways to improve it,
there is potential for developing optimal treatment strategies that may have promising
results in the clinic.

201
5.7 REFERENCES
1. Young RC, Ozols RF, Myers CE. The anthracycline antineoplastic drugs. The New England journal of medicine 1981;305(3):139-53. 2. Shenkenberg TD, Von Hoff DD. Mitoxantrone: a new anticancer drug with significant clinical activity. Annals of internal medicine 1986;105(1):67-81. 3. Gordon AN, Fleagle JT, Guthrie D, Parkin DE, Gore ME, Lacave AJ. Recurrent epithelial ovarian carcinoma: a randomized phase III study of pegylated liposomal doxorubicin versus topotecan. J Clin Oncol 2001;19(14):3312-22. 4. Faulds D, Balfour JA, Chrisp P, Langtry HD. Mitoxantrone. A review of its pharmacodynamic and pharmacokinetic properties, and therapeutic potential in the chemotherapy of cancer. Drugs 1991;41(3):400-49. 5. Carmichael J, Ozols RF. Topotecan, an active new antineoplastic agent: review and current status. Expert Opin Investig Drugs 1997;6(5):593-608. 6. Ardizzoni A, Hansen H, Dombernowsky P, et al. Topotecan, a new active drug in the second-line treatment of small-cell lung cancer: a phase II study in patients with refractory and sensitive disease. The European Organization for Research and Treatment of Cancer Early Clinical Studies Group and New Drug Development Office, and the Lung Cancer Cooperative Group. J Clin Oncol 1997;15(5):2090-6. 7. Urva SR, Shin BS, Yang VC, Balthasar JP. Sensitive high performance liquid chromatographic assay for assessment of doxorubicin pharmacokinetics in mouse plasma and tissues. Journal of chromatography 2009;877(8-9):837-41. 8. Rentsch KM, Horber DH, Schwendener RA, Wunderli-Allenspach H, Hanseler E. Comparative pharmacokinetic and cytotoxic analysis of three different formulations of mitoxantrone in mice. British journal of cancer 1997;75(7):986-92. 9. de Vries NA, Ouwehand M, Buckle T, Beijnen JH, van Tellingen O. Determination of topotecan in human and mouse plasma and in mouse tissue homogenates by reversed-phase high-performance liquid chromatography. Biomed Chromatogr 2007;21(11):1191-200. 10. Jain RK. Delivery of molecular medicine to solid tumors. Science 1996;271(5252):1079-80. 11. Tunggal JK, Cowan DS, Shaikh H, Tannock IF. Penetration of anticancer drugs through solid tissue: a factor that limits the effectiveness of chemotherapy for solid tumors. Clin Cancer Res 1999;5(6):1583-6. 12. Primeau AJ, Rendon A, Hedley D, Lilge L, Tannock IF. The distribution of the anticancer drug Doxorubicin in relation to blood vessels in solid tumors. Clin Cancer Res 2005;11(24 Pt 1):8782-8. 13. Lankelma J, Dekker H, Luque FR, et al. Doxorubicin gradients in human breast cancer. Clin Cancer Res 1999;5(7):1703-7. 14. Kerr DJ, Kaye SB. Aspects of cytotoxic drug penetration, with particular reference to anthracyclines. Cancer Chemother Pharmacol 1987;19(1):1-5. 15. Erlanson M, Daniel-Szolgay E, Carlsson J. Relations between the penetration, binding and average concentration of cytostatic drugs in human tumour spheroids. Cancer Chemother Pharmacol 1992;29(5):343-53.

202
16. Tunggal JK, Melo T, Ballinger JR, Tannock IF. The influence of expression of P-glycoprotein on the penetration of anticancer drugs through multicellular layers. Int J Cancer 2000;86(1):101-7. 17. Goldstein LJ, Galski H, Fojo A, et al. Expression of a multidrug resistance gene in human cancers. Journal of the National Cancer Institute 1989;81(2):116-24. 18. Bradley G, Ling V. P-glycoprotein, multidrug resistance and tumor progression. Cancer Metastasis Rev 1994;13(2):223-33. 19. Giaccone G, Linn SC, Welink J, et al. A dose-finding and pharmacokinetic study of reversal of multidrug resistance with SDZ PSC 833 in combination with doxorubicin in patients with solid tumors. Clin Cancer Res 1997;3(11):2005-15. 20. Ferry DR, Traunecker H, Kerr DJ. Clinical trials of P-glycoprotein reversal in solid tumours. Eur J Cancer 1996;32A(6):1070-81. 21. Bates S, Kang M, Meadows B, et al. A Phase I study of infusional vinblastine in combination with the P-glycoprotein antagonist PSC 833 (valspodar). Cancer 2001;92(6):1577-90. 22. ten Tije AJ, Synold TW, Spicer D, Verweij J, Doroshow JH, Sparreboom A. Effect of valspodar on the pharmacokinetics of unbound paclitaxel. Invest New Drugs 2003;21(3):291-8. 23. Taylor CW, Dalton WS, Mosley K, Dorr RT, Salmon SE. Combination chemotherapy with cyclophosphamide, vincristine, adriamycin, and dexamethasone (CVAD) plus oral quinine and verapamil in patients with advanced breast cancer. Breast Cancer Res Treat 1997;42(1):7-14. 24. Carlson RW, O'Neill AM, Goldstein LJ, et al. A pilot phase II trial of valspodar modulation of multidrug resistance to paclitaxel in the treatment of metastatic carcinoma of the breast (E1195): a trial of the Eastern Cooperative Oncology Group. Cancer investigation 2006;24(7):677-81. 25. Belpomme D, Gauthier S, Pujade-Lauraine E, et al. Verapamil increases the survival of patients with anthracycline-resistant metastatic breast carcinoma. Ann Oncol 2000;11(11):1471-6. 26. Schindler M, Grabski S, Hoff E, Simon SM. Defective pH regulation of acidic compartments in human breast cancer cells (MCF-7) is normalized in adriamycin-resistant cells (MCF-7adr). Biochemistry 1996;35(9):2811-7. 27. Altan N, Chen Y, Schindler M, Simon SM. Defective acidification in human breast tumor cells and implications for chemotherapy. The Journal of experimental medicine 1998;187(10):1583-98. 28. Evans SM, Jenkins KW, Jenkins WT, et al. Imaging and analytical methods as applied to the evaluation of vasculature and hypoxia in human brain tumors. Radiation research 2008;170(6):677-90. 29. Evans SM, Du KL, Chalian AA, et al. Patterns and levels of hypoxia in head and neck squamous cell carcinomas and their relationship to patient outcome. Int J Radiat Oncol Biol Phys 2007;69(4):1024-31. 30. Oldenburg J, Begg AC, van Vugt MJ, et al. Characterization of resistance mechanisms to cis-diamminedichloroplatinum(II) in three sublines of the CC531 colon adenocarcinoma cell line in vitro. Cancer research 1994;54(2):487-93. 31. Huxham LA, Kyle AH, Baker JH, Nykilchuk LK, Minchinton AI. Microregional effects of gemcitabine in HCT-116 xenografts. Cancer research 2004;64(18):6537-41.

203
32. Killion JJ, Radinsky R, Fidler IJ. Orthotopic models are necessary to predict therapy of transplantable tumors in mice. Cancer Metastasis Rev 1998;17(3):279-84. 33. Heijstek MW, Kranenburg O, Borel Rinkes IH. Mouse models of colorectal cancer and liver metastases. Digestive surgery 2005;22(1-2):16-25. 34. Tong RT, Boucher Y, Kozin SV, Winkler F, Hicklin DJ, Jain RK. Vascular normalization by vascular endothelial growth factor receptor 2 blockade induces a pressure gradient across the vasculature and improves drug penetration in tumors. Cancer research 2004;64(11):3731-6. 35. Khurana M, Moriyama EH, Mariampillai A, Wilson BC. Intravital high-resolution optical imaging of individual vessel response to photodynamic treatment. Journal of biomedical optics 2008;13(4):040502. 36. Mariampillai A, Standish BA, Moriyama EH, et al. Speckle variance detection of microvasculature using swept-source optical coherence tomography. Optics letters 2008;33(13):1530-2. 37. Poorter RL, Bakker PJ, Veenhof CH. Continuous infusion of chemotherapy: focus on 5-fluorouracil and fluorodeoxyuridine. Pharm World Sci 1998;20(2):45-59. 38. Seifert P, Baker LH, Reed ML, Vaitkevicius VK. Comparison of continuously infused 5-fluorouracil with bolus injection in treatment of patients with colorectal adenocarcinoma. Cancer 1975;36(1):123-8. 39. Lokich JJ, Ahlgren JD, Gullo JJ, Philips JA, Fryer JG. A prospective randomized comparison of continuous infusion fluorouracil with a conventional bolus schedule in metastatic colorectal carcinoma: a Mid-Atlantic Oncology Program Study. J Clin Oncol 1989;7(4):425-32. 40. Weinerman B, Shah A, Fields A, et al. Systemic infusion versus bolus chemotherapy with 5-fluorouracil in measurable metastatic colorectal cancer. American journal of clinical oncology 1992;15(6):518-23. 41. Caudry M, Bonnel C, Floquet A, et al. A randomized study of bolus fluorouracil plus folinic acid versus 21-day fluorouracil infusion alone or in association with cyclophosphamide and mitomycin C in advanced colorectal carcinoma. American journal of clinical oncology 1995;18(2):118-25. 42. Kerbel RS, Kamen BA. The anti-angiogenic basis of metronomic chemotherapy. Nat Rev Cancer 2004;4(6):423-36.

204
|| YATRA YOGESHWARO KRUSHNO YATRA PARTHO DHANURDHARA
TATRA SHRIR VIJAYO BHUTIR DHRUVA NITIR MATIR MAMA ||
Wherever there is God's grace and wherever there are human efforts
That is where victory will be
~ Shrimad Bhagwad Gita 18:78 ~