Distribution of Alpine Tundra in the Adirondack Mountains - BioOne
12
Distribution of Alpine Tundra in the Adirondack Mountains of New York, U.S.A. Bradley Z. Carlson*{ Jeffrey S. Munroe{ and Bill Hegman* *Department of Geography, Middlebury College, Middlebury, Vermont 05753, U.S.A. {Corresponding author: [email protected] {Department of Geology, Middlebury College, Middlebury, Vermont 05753, U.S.A. Abstract The distribution of alpine tundra in the Adirondack Mountains of New York was investigated through a combination of field mapping and GIS analysis. Alpine tundra vegetation covers 26.3 ha (65 acres). Tundra patches are rare below an elevation of 1350 m although significant differences exist in mean tundra elevation between summits reflecting overall summit morphology. Tundra is generally more abundant, and extends to lower elevations on windward slopes with northerly and northwesterly aspects. Tundra patches on leeward slopes are found at higher elevations and are considerably larger, reflecting increased fragmentation on windward slopes and development of snowbank communities on leeward slopes. At a regional scale, the percentage of high-elevation land covered by tundra decreases from the northwest to southeast across the study area, suggesting that mountains upwind along the prevailing winter wind vector shield downwind summits, underscoring the role of exposure in limiting the upward growth of trees. Because exposure exerts a fundamental control over patch boundaries, shifts in the balance between arboreal and non-arboreal vegetation over time could be expected if changes occur in the frequency of icing events, the severity of winter storms, temperature, cloudiness, or prevailing wind directions. DOI: 10.1657/1938-4246-43.3.331 Introduction A handful of mountain summits rise above the krummholz in the northeastern United States, supporting islands of alpine vegetation in an otherwise thickly forested region. These alpine outposts have long fascinated naturalists who recognized early on that the plants found on these summits are more typical of tundra environments at much higher latitudes (e.g. Bliss, 1963; Miller and Spear, 1999). Studies have identified a series of alpine plant communities in these environments including cushion-tussock tundra, heath-shrub-rush complexes, sedge meadows, alpine bogs, and snowbank communities, which is broadly consistent among separate summits throughout the region (e.g. Bliss, 1963; LeBlanc, 1981). It is generally accepted that these communities are remnants of lowland tundra that migrated upward in response to post-glacial climate amelioration and became stranded on mountain summits (Miller and Spear, 1999). Paleobotanical evidence indicates that climate changes shifted the relative dominance of herb-shrub tundra, bog vegetation, and krummholz during the post-glacial period and these fluctuations may have caused the extirpation of some species (Spear, 1989; Miller and Spear, 1999; Munroe, 2008). Changes in the elevation of alpine treeline may also have impacted the overall extent of alpine environments over time (Miller and Spear, 1999). However, the presence of these plants on so many widely scattered summits suggests that these environments have persisted at the highest elevations in the region throughout the Holocene. The climatic significance of alpine summits in this region, where treeline is notably low (,1300 m) for a mid-latitude location (,44uN), remains unclear. Growing season temperature is classically considered an overriding control on the elevation of alpine treeline, with trees giving way to alpine vegetation as mean summer temperatures drop below 10 uC (e.g. Daubenmire, 1954). However, other studies have stressed the influence of landscape position as a factor in exposure (e.g. Allen and Walsh, 1996; Elliott and Kipfmueller, 2010), and previous studies in the northeastern U.S.A. (e.g. Bliss, 1963; LeBlanc, 1981; Kimball and Weihrauch, 2000) have posited that exposure is the primary factor limiting the extent of trees on summits in this region. Measured rates of rime ice accumulation increase exponentially above ,800 m in this region (Ryerson, 1990) and trees at higher elevations can become encased in rime during winter. Under these conditions, trees are subject to severe mechanical damage when strong winds snap frozen limbs. Thus, plants of low stature, including tundra species common throughout the circumarctic, are at a competitive advantage in these locations. The largest areas of alpine habitat in the northeastern U.S.A. are found in New Hampshire (11.3 km 2 ) and Maine (7.3 km 2 ; Kimball and Weihrauch, 2000) where they are clustered in a few, widely separated massifs of sustained high elevation (Fig. 1, inset). Previous work has evaluated the role of exposure in these environments and has suggested that long-term monitoring could be a useful tool for documenting climate change impacts (Kimball and Weihrauch, 2000). However, because this work focused solely on the two most extensive alpine areas in the northeastern U.S.A. it is unclear how its interpretations bear on the numerous, smaller alpine areas in this region. The Green Mountains of Vermont, for instance, contain three similar alpine outposts (Thompson and Sorenson, 2000), and the High Peaks region of New York’s Adirondack Mountains contains numerous summits that support small areas of tundra, usually covering ,1 ha each (Fig. 1; Slack and Bell, 2006). The large number and wide distribution of tundra communities in the High Peaks in particular provide the opportunity to evaluate the environmental factors responsible for tundra occurrence through analysis of tundra patch distribution. Because these plant communities are located at high elevations that were not logged and are rarely, if ever, subjected to fire, this information could illuminate aspects of the natural history of these environments, including their origin and evolution over time. Improved understanding of the controls on the Arctic, Antarctic, and Alpine Research, Vol. 43, No. 3, 2011, pp. 331–342 E 2011 Regents of the University of Colorado B. Z. CARLSON ET AL. / 331 1523-0430/11 $7.00
Transcript of Distribution of Alpine Tundra in the Adirondack Mountains - BioOne
Distribution of Alpine Tundra in the Adirondack Mountains of New York, U.S.A.
Bradley Z. Carlson*{Jeffrey S. Munroe{ and
Bill Hegman*
*Department of Geography,
Middlebury College, Middlebury,
Vermont 05753, U.S.A.
{Corresponding author:
{Department of Geology, Middlebury
College, Middlebury, Vermont 05753,
U.S.A.
Abstract
The distribution of alpine tundra in the Adirondack Mountains of New York was
investigated through a combination of field mapping and GIS analysis. Alpine
tundra vegetation covers 26.3 ha (65 acres). Tundra patches are rare below an
elevation of 1350 m although significant differences exist in mean tundra elevation
between summits reflecting overall summit morphology. Tundra is generally more
abundant, and extends to lower elevations on windward slopes with northerly and
northwesterly aspects. Tundra patches on leeward slopes are found at higher
elevations and are considerably larger, reflecting increased fragmentation on
windward slopes and development of snowbank communities on leeward slopes.
At a regional scale, the percentage of high-elevation land covered by tundra
decreases from the northwest to southeast across the study area, suggesting that
mountains upwind along the prevailing winter wind vector shield downwind
summits, underscoring the role of exposure in limiting the upward growth of trees.
Because exposure exerts a fundamental control over patch boundaries, shifts in the
balance between arboreal and non-arboreal vegetation over time could be expected if
changes occur in the frequency of icing events, the severity of winter storms,
temperature, cloudiness, or prevailing wind directions.
DOI: 10.1657/1938-4246-43.3.331
Introduction
A handful of mountain summits rise above the krummholz in
the northeastern United States, supporting islands of alpine
vegetation in an otherwise thickly forested region. These alpine
outposts have long fascinated naturalists who recognized early on
that the plants found on these summits are more typical of tundra
environments at much higher latitudes (e.g. Bliss, 1963; Miller and
Spear, 1999). Studies have identified a series of alpine plant
communities in these environments including cushion-tussock
tundra, heath-shrub-rush complexes, sedge meadows, alpine bogs,
and snowbank communities, which is broadly consistent among
separate summits throughout the region (e.g. Bliss, 1963; LeBlanc,
1981). It is generally accepted that these communities are remnants
of lowland tundra that migrated upward in response to post-glacial
climate amelioration and became stranded on mountain summits
(Miller and Spear, 1999). Paleobotanical evidence indicates that
climate changes shifted the relative dominance of herb-shrub tundra,
bog vegetation, and krummholz during the post-glacial period and
these fluctuations may have caused the extirpation of some species
(Spear, 1989; Miller and Spear, 1999; Munroe, 2008). Changes in the
elevation of alpine treeline may also have impacted the overall extent
of alpine environments over time (Miller and Spear, 1999).
However, the presence of these plants on so many widely scattered
summits suggests that these environments have persisted at the
highest elevations in the region throughout the Holocene.
The climatic significance of alpine summits in this region, where
treeline is notably low (,1300 m) for a mid-latitude location
(,44uN), remains unclear. Growing season temperature is classically
considered an overriding control on the elevation of alpine treeline,
with trees giving way to alpine vegetation as mean summer
temperatures drop below 10 uC (e.g. Daubenmire, 1954). However,
other studies have stressed the influence of landscape position as a
factor in exposure (e.g. Allen and Walsh, 1996; Elliott and
Kipfmueller, 2010), and previous studies in the northeastern
U.S.A. (e.g. Bliss, 1963; LeBlanc, 1981; Kimball and Weihrauch,
2000) have posited that exposure is the primary factor limiting the
extent of trees on summits in this region. Measured rates of rime ice
accumulation increase exponentially above ,800 m in this region
(Ryerson, 1990) and trees at higher elevations can become encased in
rime during winter. Under these conditions, trees are subject to severe
mechanical damage when strong winds snap frozen limbs. Thus,
plants of low stature, including tundra species common throughout
the circumarctic, are at a competitive advantage in these locations.
The largest areas of alpine habitat in the northeastern U.S.A. are
found in New Hampshire (11.3 km2) and Maine (7.3 km2; Kimball and
Weihrauch, 2000) where they are clustered in a few, widely separated
massifs of sustained high elevation (Fig. 1, inset). Previous work has
evaluated the role of exposure in these environments and has suggested
that long-term monitoring could be a useful tool for documenting
climate change impacts (Kimball and Weihrauch, 2000). However,
because this work focused solely on the two most extensive alpine areas
in the northeastern U.S.A. it is unclear how its interpretations bear on
the numerous, smaller alpine areas in this region. The Green Mountains
of Vermont, for instance, contain three similar alpine outposts
(Thompson and Sorenson, 2000), and the High Peaks region of New
York’s Adirondack Mountains contains numerous summits that
support small areas of tundra, usually covering ,1 ha each (Fig. 1;
Slack and Bell, 2006). The large number and wide distribution of tundra
communities in the High Peaks in particular provide the opportunity to
evaluate the environmental factors responsible for tundra occurrence
through analysis of tundra patch distribution. Because these plant
communities are located at high elevations that were not logged and are
rarely, if ever, subjected to fire, this information could illuminate aspects
of the natural history of these environments, including their origin and
evolution over time. Improved understanding of the controls on the
Arctic, Antarctic, and Alpine Research, Vol. 43, No. 3, 2011, pp. 331–342
E 2011 Regents of the University of Colorado B. Z. CARLSON ET AL. / 3311523-0430/11 $7.00
distribution of these environments might also be useful for predicting
their vulnerability to future climate change.
The overall goal of this study was to delineate, with high
spatial resolution, the patches of alpine vegetation in the High
Peaks region of the Adirondack Mountains. Unlike previous work
in the region, which relied heavily on the interpretation of aerial
photographs, mapping for this project was conducted entirely in
the field using a GPS-enabled approach combined with a
Geographic Information Systems (GIS) analysis. The project
had three main objectives, including:
(1) calculate the total area of alpine tundra in the High Peaks,
(2) determine the distribution of tundra patches in the High
Peaks, and
(3) evaluate the possible effect of environmental variables,
including elevation, slope, aspect, and exposure on tundra
patch distribution.
Methods
FIELD METHODS
Previous studies attempting to calculate the area of alpine
tundra on high summits in the northeastern U.S.A. combined
interpretation of high-resolution aerial photographs with limited
field mapping. For instance, Kimball and Weihrauch (2000)
utilized this approach to map the alpine zone in New
Hampshire’s White Mountains and on Maine’s Mount Katahdin
with a minimum mapping unit of 100 m2. The Adirondack
region, however, is not covered by aerial photographs of
sufficiently large scale to allow for precise demarcation of alpine
vegetation in the absence of field investigations. Furthermore,
alpine tundra in the High Peaks forms small patches rather than
extensive, contiguous units as in the higher mountains of New
Hampshire and Maine. As a result, an approach that relied
heavily on aerial photogrammetry would be insufficient to
adequately measure the fine-scale distribution of Adirondack
alpine tundra unless the imagery was of sufficiently high
resolution (sub-meter) and was accurately orthorectified and
documented. Instead, a new methodology based heavily on field
measurements was developed for this study.
In the summer of 2009, twenty summits in the High Peaks
region were visited with the goal of comprehensively mapping the
boundaries between alpine vegetation, bare rock, and krummholz.
These summits include all of the major concentrations of alpine
tundra in the Adirondack Mountains with the exception of
Whiteface, which has been heavily impacted by development. All
of the studied summits have been impacted to some degree by foot
traffic; however, away from the main trail corridor these impacts
are relatively minor.
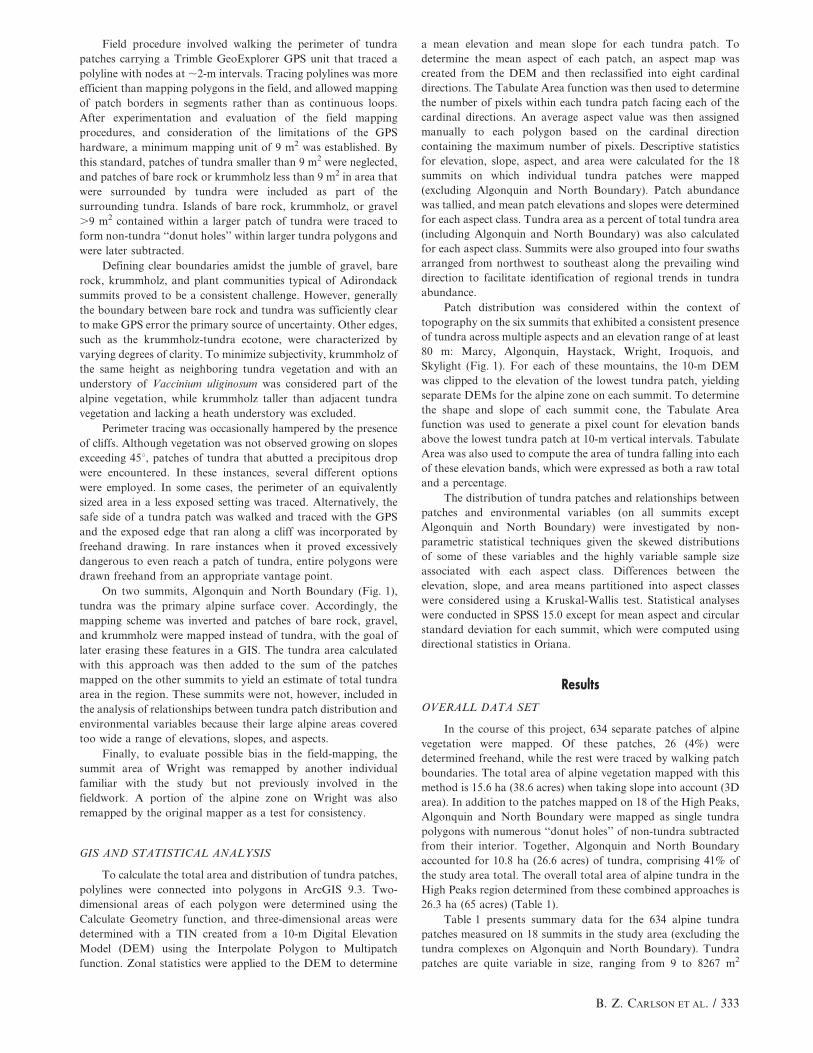
FIGURE 1. Inset: Location map of the High Peaks region in northeastern New York. Stars mark other major concentrations of alpinetundra in the region. Large map: major summits considered in this project (elevations in meters). Alpine tundra polygons are shown in black.Dashed lines delineate four swath groupings of summits discussed in text and later figures. Inset lower right: example of alpine tundra polygonsmapped on Wright, enlarged to show detail. Inset lower left: results of remapping effort on Wright by same operator illustrating reproducibilityof mapping.
332 / ARCTIC, ANTARCTIC, AND ALPINE RESEARCH
Field procedure involved walking the perimeter of tundra
patches carrying a Trimble GeoExplorer GPS unit that traced a
polyline with nodes at ,2-m intervals. Tracing polylines was more
efficient than mapping polygons in the field, and allowed mapping
of patch borders in segments rather than as continuous loops.
After experimentation and evaluation of the field mapping
procedures, and consideration of the limitations of the GPS
hardware, a minimum mapping unit of 9 m2 was established. By
this standard, patches of tundra smaller than 9 m2 were neglected,
and patches of bare rock or krummholz less than 9 m2 in area that
were surrounded by tundra were included as part of the
surrounding tundra. Islands of bare rock, krummholz, or gravel
.9 m2 contained within a larger patch of tundra were traced to
form non-tundra ‘‘donut holes’’ within larger tundra polygons and
were later subtracted.
Defining clear boundaries amidst the jumble of gravel, bare
rock, krummholz, and plant communities typical of Adirondack
summits proved to be a consistent challenge. However, generally
the boundary between bare rock and tundra was sufficiently clear
to make GPS error the primary source of uncertainty. Other edges,
such as the krummholz-tundra ecotone, were characterized by
varying degrees of clarity. To minimize subjectivity, krummholz of
the same height as neighboring tundra vegetation and with an
understory of Vaccinium uliginosum was considered part of the
alpine vegetation, while krummholz taller than adjacent tundra
vegetation and lacking a heath understory was excluded.
Perimeter tracing was occasionally hampered by the presence
of cliffs. Although vegetation was not observed growing on slopes
exceeding 45u, patches of tundra that abutted a precipitous drop
were encountered. In these instances, several different options
were employed. In some cases, the perimeter of an equivalently
sized area in a less exposed setting was traced. Alternatively, the
safe side of a tundra patch was walked and traced with the GPS
and the exposed edge that ran along a cliff was incorporated by
freehand drawing. In rare instances when it proved excessively
dangerous to even reach a patch of tundra, entire polygons were
drawn freehand from an appropriate vantage point.
On two summits, Algonquin and North Boundary (Fig. 1),
tundra was the primary alpine surface cover. Accordingly, the
mapping scheme was inverted and patches of bare rock, gravel,
and krummholz were mapped instead of tundra, with the goal of
later erasing these features in a GIS. The tundra area calculated
with this approach was then added to the sum of the patches
mapped on the other summits to yield an estimate of total tundra
area in the region. These summits were not, however, included in
the analysis of relationships between tundra patch distribution and
environmental variables because their large alpine areas covered
too wide a range of elevations, slopes, and aspects.
Finally, to evaluate possible bias in the field-mapping, the
summit area of Wright was remapped by another individual
familiar with the study but not previously involved in the
fieldwork. A portion of the alpine zone on Wright was also
remapped by the original mapper as a test for consistency.
GIS AND STATISTICAL ANALYSIS
To calculate the total area and distribution of tundra patches,
polylines were connected into polygons in ArcGIS 9.3. Two-
dimensional areas of each polygon were determined using the
Calculate Geometry function, and three-dimensional areas were
determined with a TIN created from a 10-m Digital Elevation
Model (DEM) using the Interpolate Polygon to Multipatch
function. Zonal statistics were applied to the DEM to determine
a mean elevation and mean slope for each tundra patch. To
determine the mean aspect of each patch, an aspect map was
created from the DEM and then reclassified into eight cardinal
directions. The Tabulate Area function was then used to determine
the number of pixels within each tundra patch facing each of the
cardinal directions. An average aspect value was then assigned
manually to each polygon based on the cardinal direction
containing the maximum number of pixels. Descriptive statistics
for elevation, slope, aspect, and area were calculated for the 18
summits on which individual tundra patches were mapped
(excluding Algonquin and North Boundary). Patch abundance
was tallied, and mean patch elevations and slopes were determined
for each aspect class. Tundra area as a percent of total tundra area
(including Algonquin and North Boundary) was also calculated
for each aspect class. Summits were also grouped into four swaths
arranged from northwest to southeast along the prevailing wind
direction to facilitate identification of regional trends in tundra
abundance.
Patch distribution was considered within the context of
topography on the six summits that exhibited a consistent presence
of tundra across multiple aspects and an elevation range of at least
80 m: Marcy, Algonquin, Haystack, Wright, Iroquois, and
Skylight (Fig. 1). For each of these mountains, the 10-m DEM
was clipped to the elevation of the lowest tundra patch, yielding
separate DEMs for the alpine zone on each summit. To determine
the shape and slope of each summit cone, the Tabulate Area
function was used to generate a pixel count for elevation bands
above the lowest tundra patch at 10-m vertical intervals. Tabulate
Area was also used to compute the area of tundra falling into each
of these elevation bands, which were expressed as both a raw total
and a percentage.
The distribution of tundra patches and relationships between
patches and environmental variables (on all summits except
Algonquin and North Boundary) were investigated by non-
parametric statistical techniques given the skewed distributions
of some of these variables and the highly variable sample size
associated with each aspect class. Differences between the
elevation, slope, and area means partitioned into aspect classes
were considered using a Kruskal-Wallis test. Statistical analyses
were conducted in SPSS 15.0 except for mean aspect and circular
standard deviation for each summit, which were computed using
directional statistics in Oriana.
Results
OVERALL DATA SET
In the course of this project, 634 separate patches of alpine
vegetation were mapped. Of these patches, 26 (4%) were
determined freehand, while the rest were traced by walking patch
boundaries. The total area of alpine vegetation mapped with this
method is 15.6 ha (38.6 acres) when taking slope into account (3D
area). In addition to the patches mapped on 18 of the High Peaks,
Algonquin and North Boundary were mapped as single tundra
polygons with numerous ‘‘donut holes’’ of non-tundra subtracted
from their interior. Together, Algonquin and North Boundary
accounted for 10.8 ha (26.6 acres) of tundra, comprising 41% of
the study area total. The overall total area of alpine tundra in the
High Peaks region determined from these combined approaches is
26.3 ha (65 acres) (Table 1).
Table 1 presents summary data for the 634 alpine tundra
patches measured on 18 summits in the study area (excluding the
tundra complexes on Algonquin and North Boundary). Tundra
patches are quite variable in size, ranging from 9 to 8267 m2
B. Z. CARLSON ET AL. / 333
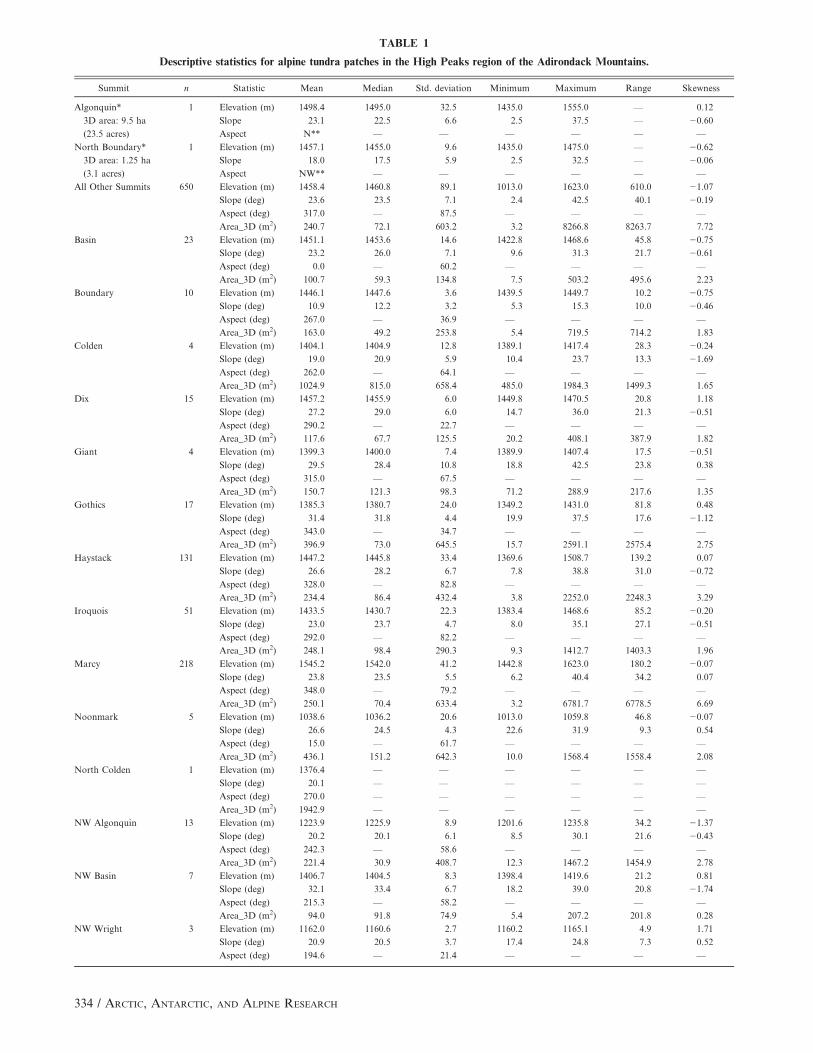
TABLE 1
Descriptive statistics for alpine tundra patches in the High Peaks region of the Adirondack Mountains.
Summit n Statistic Mean Median Std. deviation Minimum Maximum Range Skewness
Algonquin* 1 Elevation (m) 1498.4 1495.0 32.5 1435.0 1555.0 — 0.12
3D area: 9.5 ha Slope 23.1 22.5 6.6 2.5 37.5 — 20.60
(23.5 acres) Aspect N** — — — — — —
North Boundary* 1 Elevation (m) 1457.1 1455.0 9.6 1435.0 1475.0 — 20.62
3D area: 1.25 ha Slope 18.0 17.5 5.9 2.5 32.5 — 20.06
(3.1 acres) Aspect NW** — — — — — —
All Other Summits 650 Elevation (m) 1458.4 1460.8 89.1 1013.0 1623.0 610.0 21.07
Slope (deg) 23.6 23.5 7.1 2.4 42.5 40.1 20.19
Aspect (deg) 317.0 — 87.5 — — — —
Area_3D (m2) 240.7 72.1 603.2 3.2 8266.8 8263.7 7.72
Basin 23 Elevation (m) 1451.1 1453.6 14.6 1422.8 1468.6 45.8 20.75
Slope (deg) 23.2 26.0 7.1 9.6 31.3 21.7 20.61
Aspect (deg) 0.0 — 60.2 — — — —
Area_3D (m2) 100.7 59.3 134.8 7.5 503.2 495.6 2.23
Boundary 10 Elevation (m) 1446.1 1447.6 3.6 1439.5 1449.7 10.2 20.75
Slope (deg) 10.9 12.2 3.2 5.3 15.3 10.0 20.46
Aspect (deg) 267.0 — 36.9 — — — —
Area_3D (m2) 163.0 49.2 253.8 5.4 719.5 714.2 1.83
Colden 4 Elevation (m) 1404.1 1404.9 12.8 1389.1 1417.4 28.3 20.24
Slope (deg) 19.0 20.9 5.9 10.4 23.7 13.3 21.69
Aspect (deg) 262.0 — 64.1 — — — —
Area_3D (m2) 1024.9 815.0 658.4 485.0 1984.3 1499.3 1.65
Dix 15 Elevation (m) 1457.2 1455.9 6.0 1449.8 1470.5 20.8 1.18
Slope (deg) 27.2 29.0 6.0 14.7 36.0 21.3 20.51
Aspect (deg) 290.2 — 22.7 — — — —
Area_3D (m2) 117.6 67.7 125.5 20.2 408.1 387.9 1.82
Giant 4 Elevation (m) 1399.3 1400.0 7.4 1389.9 1407.4 17.5 20.51
Slope (deg) 29.5 28.4 10.8 18.8 42.5 23.8 0.38
Aspect (deg) 315.0 — 67.5 — — — —
Area_3D (m2) 150.7 121.3 98.3 71.2 288.9 217.6 1.35
Gothics 17 Elevation (m) 1385.3 1380.7 24.0 1349.2 1431.0 81.8 0.48
Slope (deg) 31.4 31.8 4.4 19.9 37.5 17.6 21.12
Aspect (deg) 343.0 — 34.7 — — — —
Area_3D (m2) 396.9 73.0 645.5 15.7 2591.1 2575.4 2.75
Haystack 131 Elevation (m) 1447.2 1445.8 33.4 1369.6 1508.7 139.2 0.07
Slope (deg) 26.6 28.2 6.7 7.8 38.8 31.0 20.72
Aspect (deg) 328.0 — 82.8 — — — —
Area_3D (m2) 234.4 86.4 432.4 3.8 2252.0 2248.3 3.29
Iroquois 51 Elevation (m) 1433.5 1430.7 22.3 1383.4 1468.6 85.2 20.20
Slope (deg) 23.0 23.7 4.7 8.0 35.1 27.1 20.51
Aspect (deg) 292.0 — 82.2 — — — —
Area_3D (m2) 248.1 98.4 290.3 9.3 1412.7 1403.3 1.96
Marcy 218 Elevation (m) 1545.2 1542.0 41.2 1442.8 1623.0 180.2 20.07
Slope (deg) 23.8 23.5 5.5 6.2 40.4 34.2 0.07
Aspect (deg) 348.0 — 79.2 — — — —
Area_3D (m2) 250.1 70.4 633.4 3.2 6781.7 6778.5 6.69
Noonmark 5 Elevation (m) 1038.6 1036.2 20.6 1013.0 1059.8 46.8 20.07
Slope (deg) 26.6 24.5 4.3 22.6 31.9 9.3 0.54
Aspect (deg) 15.0 — 61.7 — — — —
Area_3D (m2) 436.1 151.2 642.3 10.0 1568.4 1558.4 2.08
North Colden 1 Elevation (m) 1376.4 — — — — — —
Slope (deg) 20.1 — — — — — —
Aspect (deg) 270.0 — — — — — —
Area_3D (m2) 1942.9 — — — — — —
NW Algonquin 13 Elevation (m) 1223.9 1225.9 8.9 1201.6 1235.8 34.2 21.37
Slope (deg) 20.2 20.1 6.1 8.5 30.1 21.6 20.43
Aspect (deg) 242.3 — 58.6 — — — —
Area_3D (m2) 221.4 30.9 408.7 12.3 1467.2 1454.9 2.78
NW Basin 7 Elevation (m) 1406.7 1404.5 8.3 1398.4 1419.6 21.2 0.81
Slope (deg) 32.1 33.4 6.7 18.2 39.0 20.8 21.74
Aspect (deg) 215.3 — 58.2 — — — —
Area_3D (m2) 94.0 91.8 74.9 5.4 207.2 201.8 0.28
NW Wright 3 Elevation (m) 1162.0 1160.6 2.7 1160.2 1165.1 4.9 1.71
Slope (deg) 20.9 20.5 3.7 17.4 24.8 7.3 0.52
Aspect (deg) 194.6 — 21.4 — — — —
334 / ARCTIC, ANTARCTIC, AND ALPINE RESEARCH
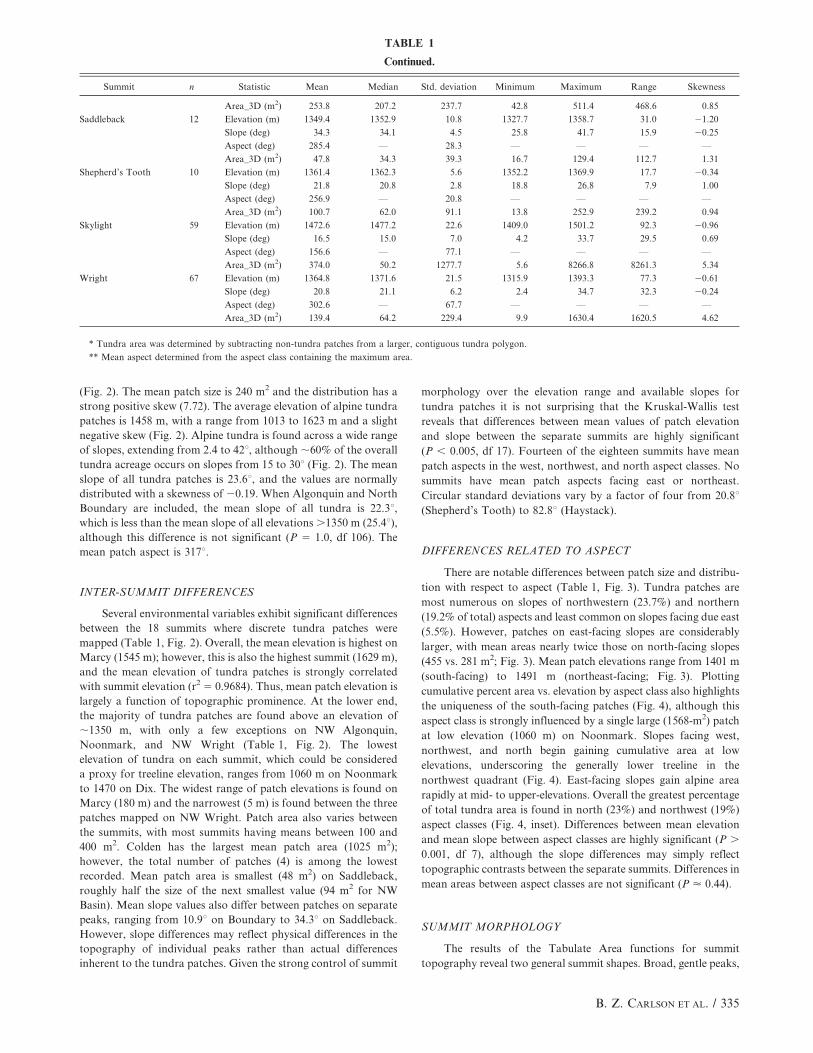
(Fig. 2). The mean patch size is 240 m2 and the distribution has a
strong positive skew (7.72). The average elevation of alpine tundra
patches is 1458 m, with a range from 1013 to 1623 m and a slight
negative skew (Fig. 2). Alpine tundra is found across a wide range
of slopes, extending from 2.4 to 42u, although ,60% of the overall
tundra acreage occurs on slopes from 15 to 30u (Fig. 2). The mean
slope of all tundra patches is 23.6u, and the values are normally
distributed with a skewness of 20.19. When Algonquin and North
Boundary are included, the mean slope of all tundra is 22.3u,which is less than the mean slope of all elevations .1350 m (25.4u),although this difference is not significant (P 5 1.0, df 106). The
mean patch aspect is 317u.
INTER-SUMMIT DIFFERENCES
Several environmental variables exhibit significant differences
between the 18 summits where discrete tundra patches were
mapped (Table 1, Fig. 2). Overall, the mean elevation is highest on
Marcy (1545 m); however, this is also the highest summit (1629 m),
and the mean elevation of tundra patches is strongly correlated
with summit elevation (r2 5 0.9684). Thus, mean patch elevation is
largely a function of topographic prominence. At the lower end,
the majority of tundra patches are found above an elevation of
,1350 m, with only a few exceptions on NW Algonquin,
Noonmark, and NW Wright (Table 1, Fig. 2). The lowest
elevation of tundra on each summit, which could be considered
a proxy for treeline elevation, ranges from 1060 m on Noonmark
to 1470 on Dix. The widest range of patch elevations is found on
Marcy (180 m) and the narrowest (5 m) is found between the three
patches mapped on NW Wright. Patch area also varies between
the summits, with most summits having means between 100 and
400 m2. Colden has the largest mean patch area (1025 m2);
however, the total number of patches (4) is among the lowest
recorded. Mean patch area is smallest (48 m2) on Saddleback,
roughly half the size of the next smallest value (94 m2 for NW
Basin). Mean slope values also differ between patches on separate
peaks, ranging from 10.9u on Boundary to 34.3u on Saddleback.
However, slope differences may reflect physical differences in the
topography of individual peaks rather than actual differences
inherent to the tundra patches. Given the strong control of summit
morphology over the elevation range and available slopes for
tundra patches it is not surprising that the Kruskal-Wallis test
reveals that differences between mean values of patch elevation
and slope between the separate summits are highly significant
(P , 0.005, df 17). Fourteen of the eighteen summits have mean
patch aspects in the west, northwest, and north aspect classes. No
summits have mean patch aspects facing east or northeast.
Circular standard deviations vary by a factor of four from 20.8u(Shepherd’s Tooth) to 82.8u (Haystack).
DIFFERENCES RELATED TO ASPECT
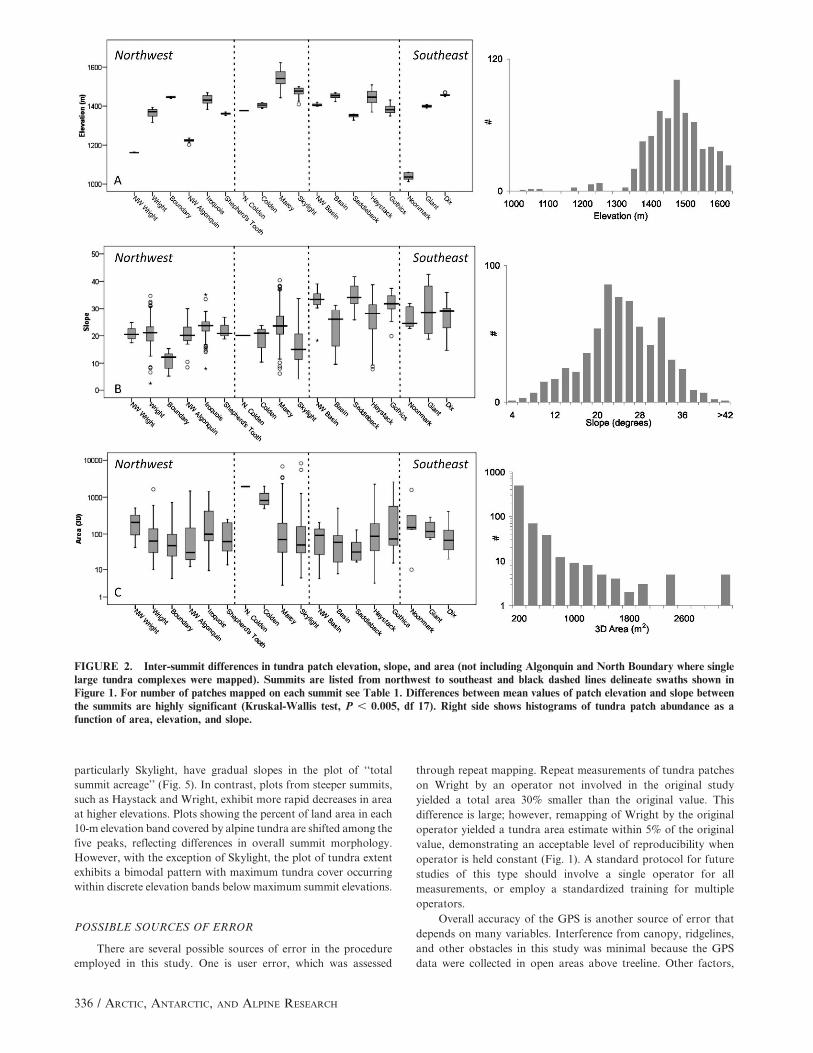
There are notable differences between patch size and distribu-
tion with respect to aspect (Table 1, Fig. 3). Tundra patches are
most numerous on slopes of northwestern (23.7%) and northern
(19.2% of total) aspects and least common on slopes facing due east
(5.5%). However, patches on east-facing slopes are considerably
larger, with mean areas nearly twice those on north-facing slopes
(455 vs. 281 m2; Fig. 3). Mean patch elevations range from 1401 m
(south-facing) to 1491 m (northeast-facing; Fig. 3). Plotting
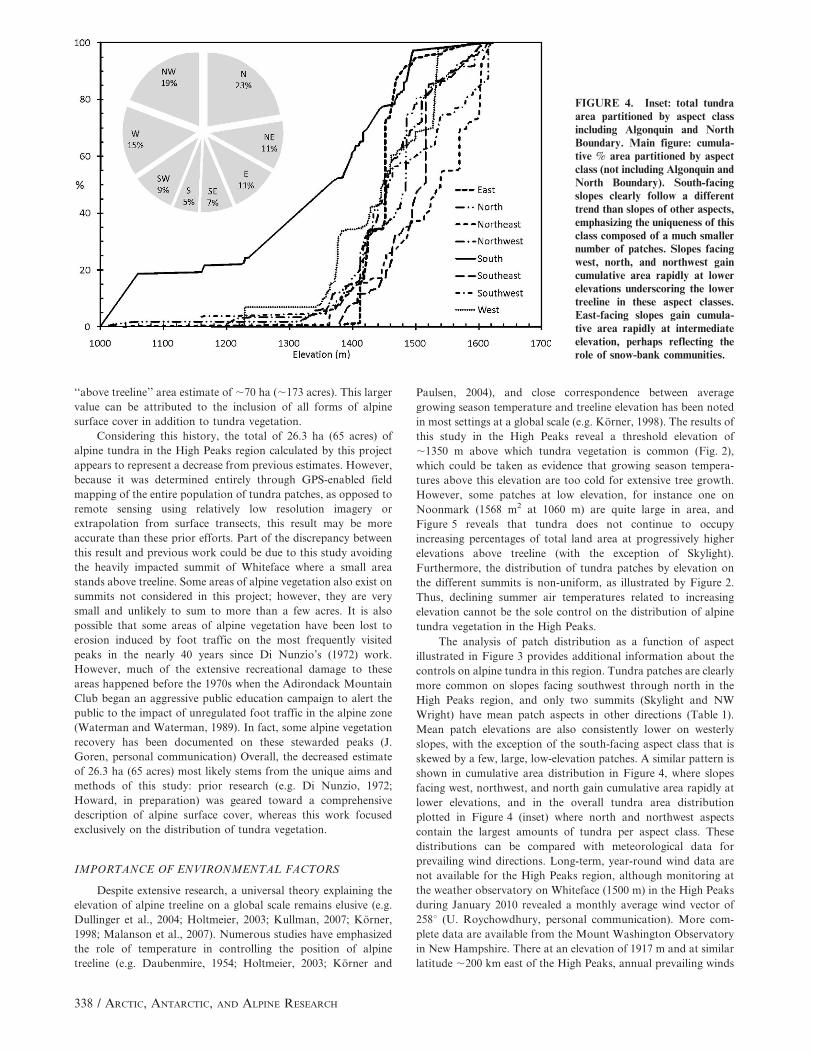
cumulative percent area vs. elevation by aspect class also highlights
the uniqueness of the south-facing patches (Fig. 4), although this
aspect class is strongly influenced by a single large (1568-m2) patch
at low elevation (1060 m) on Noonmark. Slopes facing west,
northwest, and north begin gaining cumulative area at low
elevations, underscoring the generally lower treeline in the
northwest quadrant (Fig. 4). East-facing slopes gain alpine area
rapidly at mid- to upper-elevations. Overall the greatest percentage
of total tundra area is found in north (23%) and northwest (19%)
aspect classes (Fig. 4, inset). Differences between mean elevation
and mean slope between aspect classes are highly significant (P .
0.001, df 7), although the slope differences may simply reflect
topographic contrasts between the separate summits. Differences in
mean areas between aspect classes are not significant (P < 0.44).
SUMMIT MORPHOLOGY
The results of the Tabulate Area functions for summit
topography reveal two general summit shapes. Broad, gentle peaks,
TABLE 1
Continued.
Summit n Statistic Mean Median Std. deviation Minimum Maximum Range Skewness
Area_3D (m2) 253.8 207.2 237.7 42.8 511.4 468.6 0.85
Saddleback 12 Elevation (m) 1349.4 1352.9 10.8 1327.7 1358.7 31.0 21.20
Slope (deg) 34.3 34.1 4.5 25.8 41.7 15.9 20.25
Aspect (deg) 285.4 — 28.3 — — — —
Area_3D (m2) 47.8 34.3 39.3 16.7 129.4 112.7 1.31
Shepherd’s Tooth 10 Elevation (m) 1361.4 1362.3 5.6 1352.2 1369.9 17.7 20.34
Slope (deg) 21.8 20.8 2.8 18.8 26.8 7.9 1.00
Aspect (deg) 256.9 — 20.8 — — — —
Area_3D (m2) 100.7 62.0 91.1 13.8 252.9 239.2 0.94
Skylight 59 Elevation (m) 1472.6 1477.2 22.6 1409.0 1501.2 92.3 20.96
Slope (deg) 16.5 15.0 7.0 4.2 33.7 29.5 0.69
Aspect (deg) 156.6 — 77.1 — — — —
Area_3D (m2) 374.0 50.2 1277.7 5.6 8266.8 8261.3 5.34
Wright 67 Elevation (m) 1364.8 1371.6 21.5 1315.9 1393.3 77.3 20.61
Slope (deg) 20.8 21.1 6.2 2.4 34.7 32.3 20.24
Aspect (deg) 302.6 — 67.7 — — — —
Area_3D (m2) 139.4 64.2 229.4 9.9 1630.4 1620.5 4.62
* Tundra area was determined by subtracting non-tundra patches from a larger, contiguous tundra polygon.
** Mean aspect determined from the aspect class containing the maximum area.
B. Z. CARLSON ET AL. / 335
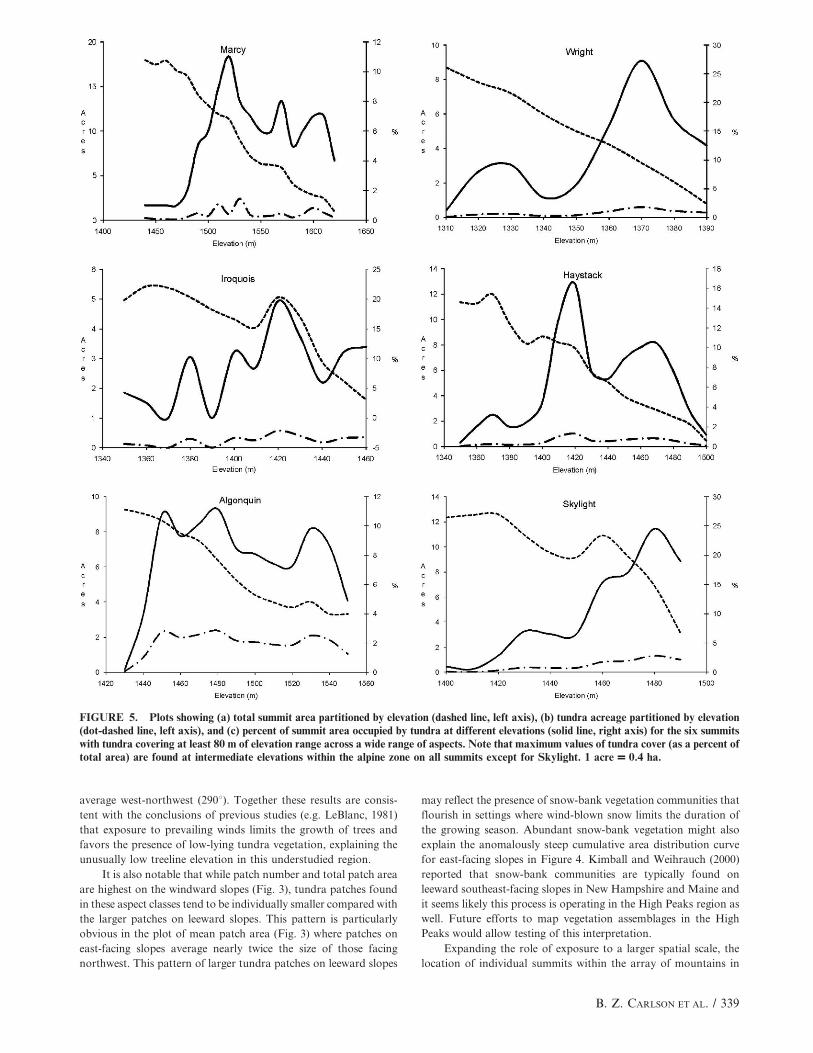
particularly Skylight, have gradual slopes in the plot of ‘‘total
summit acreage’’ (Fig. 5). In contrast, plots from steeper summits,
such as Haystack and Wright, exhibit more rapid decreases in area
at higher elevations. Plots showing the percent of land area in each
10-m elevation band covered by alpine tundra are shifted among the
five peaks, reflecting differences in overall summit morphology.
However, with the exception of Skylight, the plot of tundra extent
exhibits a bimodal pattern with maximum tundra cover occurring
within discrete elevation bands below maximum summit elevations.
POSSIBLE SOURCES OF ERROR
There are several possible sources of error in the procedure
employed in this study. One is user error, which was assessed
through repeat mapping. Repeat measurements of tundra patches
on Wright by an operator not involved in the original study
yielded a total area 30% smaller than the original value. This
difference is large; however, remapping of Wright by the original
operator yielded a tundra area estimate within 5% of the original
value, demonstrating an acceptable level of reproducibility when
operator is held constant (Fig. 1). A standard protocol for future
studies of this type should involve a single operator for all
measurements, or employ a standardized training for multiple
operators.
Overall accuracy of the GPS is another source of error that
depends on many variables. Interference from canopy, ridgelines,
and other obstacles in this study was minimal because the GPS
data were collected in open areas above treeline. Other factors,
FIGURE 2. Inter-summit differences in tundra patch elevation, slope, and area (not including Algonquin and North Boundary where singlelarge tundra complexes were mapped). Summits are listed from northwest to southeast and black dashed lines delineate swaths shown inFigure 1. For number of patches mapped on each summit see Table 1. Differences between mean values of patch elevation and slope betweenthe summits are highly significant (Kruskal-Wallis test, P , 0.005, df 17). Right side shows histograms of tundra patch abundance as afunction of area, elevation, and slope.
336 / ARCTIC, ANTARCTIC, AND ALPINE RESEARCH

however, were uncontrollable including satellite configurations,
atmospheric disturbances, and receiver noise. Differential correc-
tion can be employed to minimize these problems, although the
data used in this study were not corrected. The implications of
using uncorrected GPS data were assessed by correcting a subset
of the mapping using the Ray Brook, NY, base station.
Uncorrected and corresponding corrected patches of alpine tundra
were digitized for parts of Algonquin, Basin, Little Haystack,
Marcy, and Wright. These summits were selected because the base
data were available and the original mapping times varied by date
and time of day, providing a diverse sample. A total of 95 patches
(15% of the total number) covering 2.1 ha (5.2 acres) were
compared. The total area shifted by ,1% following correction and
individual patch size varied by ,5%. All corrected and non-
corrected patches of alpine meadow overlapped, and total
coincidence was 84% by area. No corrected and uncorrected
patch boundary differed more than 3 m and most differed by
much less. Overall this accuracy assessment strongly supports the
validity of the GPS mapping in its uncorrected form.
All of the GIS operations (aside from the calculation of 2D
area) were constrained to the precision of the original 10-m DEM
which was acquired from the U.S. Geological Survey National
Elevation Dataset (NED) 1/3 Arc Second dataset. While there are
known and documented problems with horizontal and vertical
accuracy in this dataset as a whole, it was the best available at the
time of the study. The smallest tundra patches mapped were 9-m2,
but most were much larger, thus it is reasonable to conclude that
the vertical and horizontal accuracy of the DEM did not overly
compromise the accuracy of the results for calculating the
elevation, slope, and aspect of tundra patches. The most
problematic tundra patches were a few large polygons draped
over ridgelines that spanned multiple aspects, slope angles, and
elevations. However, similar to the observations of Kimball and
Weihrauch (2000) in New Hampshire and Maine, alpine tundra
communities in the High Peaks are rarely found on convex
ridgelines. Thus, the overall dataset is likely to be free of bias that
could have been generated if a large number of polygons were
found in this position.
Discussion
TOTAL TUNDRA AREA
Despite the difficulties of quantifying the extent of alpine
tundra in the High Peaks, two efforts to inventory alpine areas
have been undertaken over the past 40 years. Di Nunzio (1972)
estimated the area of alpine tundra in the High Peaks region by
using surface cover transects to quantify the relative proportions
of bare rock, krummholz, and alpine tundra. This work is the
basis for the widely cited estimate of ‘‘85 acres’’ (34.4 ha) of alpine
vegetation in the High Peaks that has been adopted by
conservation organizations and literature describing the natural
history of this region (e.g. Slack and Bell, 2006). More recently,
Howard (in preparation) used aerial photographs and GPS field
checking to delineate the alpine treeline ecotone, yielding a total
r
FIGURE 3. Tundra patch characteristics partitioned by aspectclass. Patches are most common on northwest-facing slopes;however, they are generally smaller in these locations. The largestpatches are found on leeward slopes. The pronounced low in meanpatch elevation on south-facing slopes is an artifact of a single large,anomalously low patch on Noonmark (see Fig. 2).
B. Z. CARLSON ET AL. / 337
‘‘above treeline’’ area estimate of ,70 ha (,173 acres). This larger
value can be attributed to the inclusion of all forms of alpine
surface cover in addition to tundra vegetation.
Considering this history, the total of 26.3 ha (65 acres) of
alpine tundra in the High Peaks region calculated by this project
appears to represent a decrease from previous estimates. However,
because it was determined entirely through GPS-enabled field
mapping of the entire population of tundra patches, as opposed to
remote sensing using relatively low resolution imagery or
extrapolation from surface transects, this result may be more
accurate than these prior efforts. Part of the discrepancy between
this result and previous work could be due to this study avoiding
the heavily impacted summit of Whiteface where a small area
stands above treeline. Some areas of alpine vegetation also exist on
summits not considered in this project; however, they are very
small and unlikely to sum to more than a few acres. It is also
possible that some areas of alpine vegetation have been lost to
erosion induced by foot traffic on the most frequently visited
peaks in the nearly 40 years since Di Nunzio’s (1972) work.
However, much of the extensive recreational damage to these
areas happened before the 1970s when the Adirondack Mountain
Club began an aggressive public education campaign to alert the
public to the impact of unregulated foot traffic in the alpine zone
(Waterman and Waterman, 1989). In fact, some alpine vegetation
recovery has been documented on these stewarded peaks (J.
Goren, personal communication) Overall, the decreased estimate
of 26.3 ha (65 acres) most likely stems from the unique aims and
methods of this study: prior research (e.g. Di Nunzio, 1972;
Howard, in preparation) was geared toward a comprehensive
description of alpine surface cover, whereas this work focused
exclusively on the distribution of tundra vegetation.
IMPORTANCE OF ENVIRONMENTAL FACTORS
Despite extensive research, a universal theory explaining the
elevation of alpine treeline on a global scale remains elusive (e.g.
Dullinger et al., 2004; Holtmeier, 2003; Kullman, 2007; Korner,
1998; Malanson et al., 2007). Numerous studies have emphasized
the role of temperature in controlling the position of alpine
treeline (e.g. Daubenmire, 1954; Holtmeier, 2003; Korner and
Paulsen, 2004), and close correspondence between average
growing season temperature and treeline elevation has been noted
in most settings at a global scale (e.g. Korner, 1998). The results of
this study in the High Peaks reveal a threshold elevation of
,1350 m above which tundra vegetation is common (Fig. 2),
which could be taken as evidence that growing season tempera-
tures above this elevation are too cold for extensive tree growth.
However, some patches at low elevation, for instance one on
Noonmark (1568 m2 at 1060 m) are quite large in area, and
Figure 5 reveals that tundra does not continue to occupy
increasing percentages of total land area at progressively higher
elevations above treeline (with the exception of Skylight).
Furthermore, the distribution of tundra patches by elevation on
the different summits is non-uniform, as illustrated by Figure 2.
Thus, declining summer air temperatures related to increasing
elevation cannot be the sole control on the distribution of alpine
tundra vegetation in the High Peaks.
The analysis of patch distribution as a function of aspect
illustrated in Figure 3 provides additional information about the
controls on alpine tundra in this region. Tundra patches are clearly
more common on slopes facing southwest through north in the
High Peaks region, and only two summits (Skylight and NW
Wright) have mean patch aspects in other directions (Table 1).
Mean patch elevations are also consistently lower on westerly
slopes, with the exception of the south-facing aspect class that is
skewed by a few, large, low-elevation patches. A similar pattern is
shown in cumulative area distribution in Figure 4, where slopes
facing west, northwest, and north gain cumulative area rapidly at
lower elevations, and in the overall tundra area distribution
plotted in Figure 4 (inset) where north and northwest aspects
contain the largest amounts of tundra per aspect class. These
distributions can be compared with meteorological data for
prevailing wind directions. Long-term, year-round wind data are
not available for the High Peaks region, although monitoring at
the weather observatory on Whiteface (1500 m) in the High Peaks
during January 2010 revealed a monthly average wind vector of
258u (U. Roychowdhury, personal communication). More com-
plete data are available from the Mount Washington Observatory
in New Hampshire. There at an elevation of 1917 m and at similar
latitude ,200 km east of the High Peaks, annual prevailing winds
FIGURE 4. Inset: total tundraarea partitioned by aspect classincluding Algonquin and NorthBoundary. Main figure: cumula-tive % area partitioned by aspectclass (not including Algonquin andNorth Boundary). South-facingslopes clearly follow a differenttrend than slopes of other aspects,emphasizing the uniqueness of thisclass composed of a much smallernumber of patches. Slopes facingwest, north, and northwest gaincumulative area rapidly at lowerelevations underscoring the lowertreeline in these aspect classes.East-facing slopes gain cumula-tive area rapidly at intermediateelevation, perhaps reflecting therole of snow-bank communities.
338 / ARCTIC, ANTARCTIC, AND ALPINE RESEARCH
average west-northwest (290u). Together these results are consis-
tent with the conclusions of previous studies (e.g. LeBlanc, 1981)
that exposure to prevailing winds limits the growth of trees and
favors the presence of low-lying tundra vegetation, explaining the
unusually low treeline elevation in this understudied region.
It is also notable that while patch number and total patch area
are highest on the windward slopes (Fig. 3), tundra patches found
in these aspect classes tend to be individually smaller compared with
the larger patches on leeward slopes. This pattern is particularly
obvious in the plot of mean patch area (Fig. 3) where patches on
east-facing slopes average nearly twice the size of those facing
northwest. This pattern of larger tundra patches on leeward slopes
may reflect the presence of snow-bank vegetation communities that
flourish in settings where wind-blown snow limits the duration of
the growing season. Abundant snow-bank vegetation might also
explain the anomalously steep cumulative area distribution curve
for east-facing slopes in Figure 4. Kimball and Weihrauch (2000)
reported that snow-bank communities are typically found on
leeward southeast-facing slopes in New Hampshire and Maine and
it seems likely this process is operating in the High Peaks region as
well. Future efforts to map vegetation assemblages in the High
Peaks would allow testing of this interpretation.
Expanding the role of exposure to a larger spatial scale, the
location of individual summits within the array of mountains in
FIGURE 5. Plots showing (a) total summit area partitioned by elevation (dashed line, left axis), (b) tundra acreage partitioned by elevation(dot-dashed line, left axis), and (c) percent of summit area occupied by tundra at different elevations (solid line, right axis) for the six summitswith tundra covering at least 80 m of elevation range across a wide range of aspects. Note that maximum values of tundra cover (as a percent oftotal area) are found at intermediate elevations within the alpine zone on all summits except for Skylight. 1 acre = 0.4 ha.
B. Z. CARLSON ET AL. / 339
the High Peaks region might also play a role in governing the
abundance of alpine tundra vegetation (Fig. 1). When the tundra
complexes on Algonquin and North Boundary are considered, the
cluster of alpine summits at the western end of the study area
contains more than 50% of all the tundra in the High Peaks
region, even though maximum elevations are greatest farther to
the east around Marcy. In contrast, summits at similar elevations
at the far eastern end such as Giant and Dix contain less than 3%
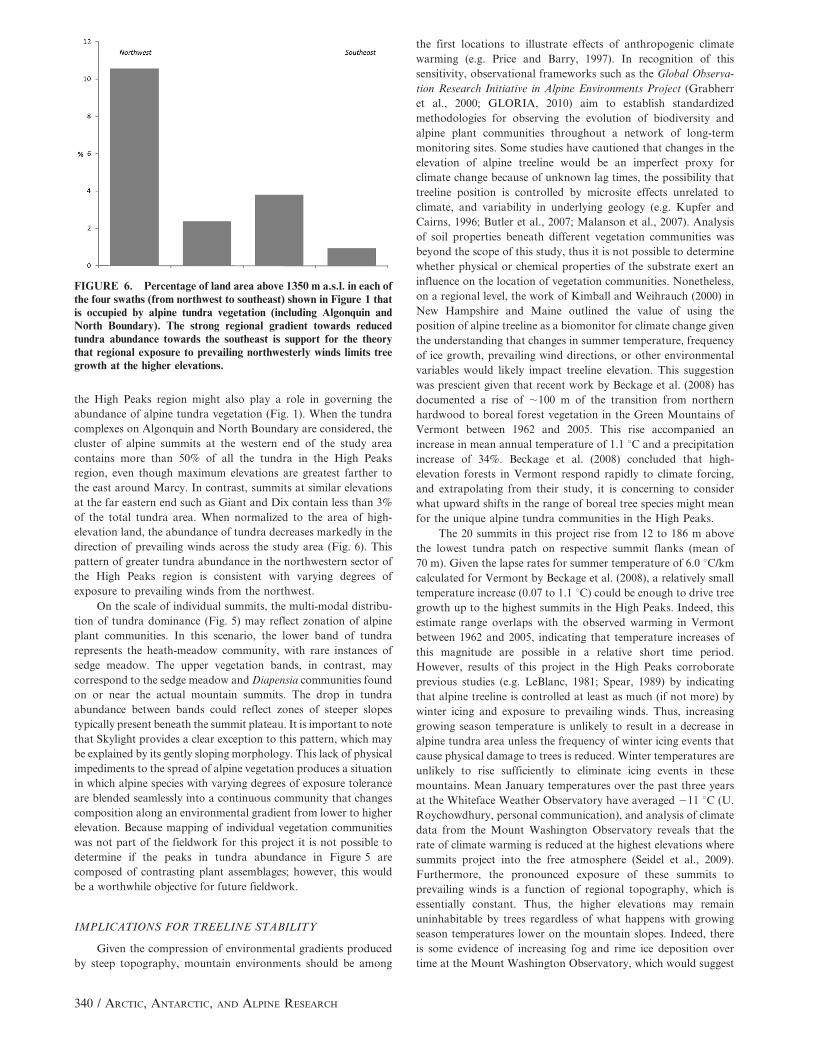
of the total tundra area. When normalized to the area of high-
elevation land, the abundance of tundra decreases markedly in the
direction of prevailing winds across the study area (Fig. 6). This
pattern of greater tundra abundance in the northwestern sector of
the High Peaks region is consistent with varying degrees of
exposure to prevailing winds from the northwest.
On the scale of individual summits, the multi-modal distribu-
tion of tundra dominance (Fig. 5) may reflect zonation of alpine
plant communities. In this scenario, the lower band of tundra
represents the heath-meadow community, with rare instances of
sedge meadow. The upper vegetation bands, in contrast, may
correspond to the sedge meadow and Diapensia communities found
on or near the actual mountain summits. The drop in tundra
abundance between bands could reflect zones of steeper slopes
typically present beneath the summit plateau. It is important to note
that Skylight provides a clear exception to this pattern, which may
be explained by its gently sloping morphology. This lack of physical
impediments to the spread of alpine vegetation produces a situation
in which alpine species with varying degrees of exposure tolerance
are blended seamlessly into a continuous community that changes
composition along an environmental gradient from lower to higher
elevation. Because mapping of individual vegetation communities
was not part of the fieldwork for this project it is not possible to
determine if the peaks in tundra abundance in Figure 5 are
composed of contrasting plant assemblages; however, this would
be a worthwhile objective for future fieldwork.
IMPLICATIONS FOR TREELINE STABILITY
Given the compression of environmental gradients produced
by steep topography, mountain environments should be among
the first locations to illustrate effects of anthropogenic climate
warming (e.g. Price and Barry, 1997). In recognition of this
sensitivity, observational frameworks such as the Global Observa-
tion Research Initiative in Alpine Environments Project (Grabherr
et al., 2000; GLORIA, 2010) aim to establish standardized
methodologies for observing the evolution of biodiversity and
alpine plant communities throughout a network of long-term
monitoring sites. Some studies have cautioned that changes in the
elevation of alpine treeline would be an imperfect proxy for
climate change because of unknown lag times, the possibility that
treeline position is controlled by microsite effects unrelated to
climate, and variability in underlying geology (e.g. Kupfer and
Cairns, 1996; Butler et al., 2007; Malanson et al., 2007). Analysis
of soil properties beneath different vegetation communities was
beyond the scope of this study, thus it is not possible to determine
whether physical or chemical properties of the substrate exert an
influence on the location of vegetation communities. Nonetheless,
on a regional level, the work of Kimball and Weihrauch (2000) in
New Hampshire and Maine outlined the value of using the
position of alpine treeline as a biomonitor for climate change given
the understanding that changes in summer temperature, frequency
of ice growth, prevailing wind directions, or other environmental
variables would likely impact treeline elevation. This suggestion
was prescient given that recent work by Beckage et al. (2008) has
documented a rise of ,100 m of the transition from northern
hardwood to boreal forest vegetation in the Green Mountains of
Vermont between 1962 and 2005. This rise accompanied an
increase in mean annual temperature of 1.1 uC and a precipitation
increase of 34%. Beckage et al. (2008) concluded that high-
elevation forests in Vermont respond rapidly to climate forcing,
and extrapolating from their study, it is concerning to consider
what upward shifts in the range of boreal tree species might mean
for the unique alpine tundra communities in the High Peaks.
The 20 summits in this project rise from 12 to 186 m above
the lowest tundra patch on respective summit flanks (mean of
70 m). Given the lapse rates for summer temperature of 6.0 uC/km
calculated for Vermont by Beckage et al. (2008), a relatively small
temperature increase (0.07 to 1.1 uC) could be enough to drive tree
growth up to the highest summits in the High Peaks. Indeed, this
estimate range overlaps with the observed warming in Vermont
between 1962 and 2005, indicating that temperature increases of
this magnitude are possible in a relative short time period.
However, results of this project in the High Peaks corroborate
previous studies (e.g. LeBlanc, 1981; Spear, 1989) by indicating
that alpine treeline is controlled at least as much (if not more) by
winter icing and exposure to prevailing winds. Thus, increasing
growing season temperature is unlikely to result in a decrease in
alpine tundra area unless the frequency of winter icing events that
cause physical damage to trees is reduced. Winter temperatures are
unlikely to rise sufficiently to eliminate icing events in these
mountains. Mean January temperatures over the past three years
at the Whiteface Weather Observatory have averaged 211 uC (U.
Roychowdhury, personal communication), and analysis of climate
data from the Mount Washington Observatory reveals that the
rate of climate warming is reduced at the highest elevations where
summits project into the free atmosphere (Seidel et al., 2009).
Furthermore, the pronounced exposure of these summits to
prevailing winds is a function of regional topography, which is
essentially constant. Thus, the higher elevations may remain
uninhabitable by trees regardless of what happens with growing
season temperatures lower on the mountain slopes. Indeed, there
is some evidence of increasing fog and rime ice deposition over
time at the Mount Washington Observatory, which would suggest
FIGURE 6. Percentage of land area above 1350 m a.s.l. in each ofthe four swaths (from northwest to southeast) shown in Figure 1 thatis occupied by alpine tundra vegetation (including Algonquin andNorth Boundary). The strong regional gradient towards reducedtundra abundance towards the southeast is support for the theorythat regional exposure to prevailing northwesterly winds limits treegrowth at the higher elevations.
340 / ARCTIC, ANTARCTIC, AND ALPINE RESEARCH
that the highest elevations are not growing more amenable to tree
growth (Seidel et al., 2007).
Work from other settings has underscored the non-climatic
challenges faced by trees attempting to migrate upward into alpine
tundra including inter-species competition, seed supply, microcli-
mate effects, lack of exposed mineral soil, and slow growth rates
(e.g. Malanson and Butler, 1994; Malanson et al., 2007). In light of
these, some studies have concluded that alpine treeline has strong
inertia to upward movement (Theurillat and Guisan, 2001;
Dullinger et al., 2003, 2004) or that treeline is controlled so strongly
by microsite characteristics that treeline could never rise uniformly
at a regional scale (Malanson et al., 2007). When combined with the
evidence that exposure to icing events and winter winds limits
upward tree growth in the High Peaks, this interpretation raises the
somewhat counterintuitive possibility that the boreal forest zone on
these mountains may be more endangered by climate change than
the higher alpine tundra. If northern hardwood vegetation
continues to rise higher at the expense of boreal forest, as
documented for Vermont by Beckage et al. (2008), but alpine
treeline is unable to rise because of the frequency of icing events or
other factors, then the boreal zone may be squeezed from below and
reduced in overall extent (e.g. Tang and Beckage, 2010).
Conclusion
Detailed GPS-enabled field mapping reveals that the High
Peaks region of the Adirondack Mountains contains 26.3 ha
(65 acres) of alpine tundra. This value is less than the often
presented estimate of 34.4 ha (85 acres) and is considerably less
than the total estimated by a previous attempt to delineate the
alpine treeline ecotone. These differences likely reflect a combina-
tion of disparate techniques and mapping subjectivity. Analysis of
634 individual patches of tundra vegetation in the context of
environmental variables reveals that exposure is the dominant
factor influencing the alpine vegetation distribution at regional,
summit, and micro-terrain scales. This result is consistent with
previous work in New Hampshire and Maine that used a related
methodology with less reliance on field mapping (Kimball and
Weihrauch, 2000). A major benefit of the entirely field-based
approach employed in this study is the delineation of tundra
patches down to 9 m2 in area. The greatly increased presence of
these patches on windward slopes and the increased dominance of
tundra vegetation at the northwestern extent of the study area
underscore the controlling role of exposure to winter winds in
limiting growth of trees at higher elevations.
Small tundra patches such as those mapped in the Adiron-
dacks should be particularly sensitive to changing environmental
conditions. Climate changes that alter the frequency of icing
events, the severity of winter storms, cloudiness, or prevailing
wind directions could all be expected to shift the balance between
arboreal and alpine vegetation. These changes could be detected
by careful repeat mapping, and the methodology developed in this
study, especially if combined with differential GPS surveying
techniques, could be reapplied to monitor potential vegetation
shifts over time. Given that climate change impacts on vegetation
communities are likely to be felt first along ecotones and in
marginal environments, alpine vegetation monitoring in the
Adirondack High Peaks should be a priority for future research.
Acknowledgments
The authors thank J. Goren (Adirondack Summit StewardsProgram), T. Howard (New York Natural Heritage Program),
and G. Goodwin (Middlebury College) for help with the design
and implementation of this project. Utpal Roychowdhury kindly
provided summary data for the Whiteface Mountain Observatory.
References Cited
Allen, T. R., and Walsh, S. J., 1996: Spatial and compositional
pattern of alpine treeline, Glacier National Park, Montana.
Photogrammetric Engineering & Remote Sensing, 62(11):
1261–1268.
Beckage, B., Osborne, B., Gavin, D. G., Pucko, C., Siccama, T.,
and Perkins, T., 2008: A rapid upward shift of a forest ecotone
during 40 years of warming in the Green Mountains of
Vermont. Proceedings of the National Academy of Sciences,
105(11): 4197–4202.
Bliss, L. C., 1963: Alpine plant communities of the Presidential
Range, New Hampshire. Ecology, 44(4): 678–697.
Butler, D. R., Malanson, G. P., Walsh, S. J., and Fagre, D. B.,
2007: Influences of geomorphology and geology on alpine
treeline in the American West—More important than climatic
influences? Physical Geography, 28: 434–450.
Daubenmire, R. F., 1954: Alpine timberlines in the Americas and
their interpretation. Butler University Botanical Studies, 11:
119–136.
Di Nunzio, M. G., 1972: A vegetational survey of the alpine zone
in the Adirondack Mountains, New York. M.S. thesis, State
University College of Forestry at Syracuse University, Syracuse,
New York.
Dullinger, S., Dirnbock, T., and Grabherr, G., 2003: Patterns of
shrub invasion into high mountain grasslands of the Northern
Calcareous Alps (Austria). Arctic, Antarctic, and Alpine
Research, 35: 434–441.
Dullinger, S., Dirnbock, T., and Grabherr, G., 2004: Modelling
climate change-driven treeline shifts: relative effects of temper-
ature increase, dispersal and invasibility. Journal of Ecology, 92:
241–252.
Elliott, G. P., and Kipfmueller, K. F., 2010: Multi-scale influences
of slope aspect and spatial pattern on ecotonal dynamics at
upper treeline in the Southern Rocky Mountains, U.S.A. Arctic,
Antarctic, and Alpine Research, 42: 45–56.
GLORIA [Global Observation Research Initiative in Alpine
Environments], 2010: ,http://www.gloria.ac.at/., accessed
October 2010.
Grabherr, G., Gottfried, M., and Pauli, H., 2000: GLORIA: a
Global Observation Research Initiative in Alpine Environ-
ments. Mountain Research and Development, 20: 190–192.
Holtmeier, F. K., 2003: Mountain Timberlines: Ecology, Patchi-
ness, and Dynamics. Dordrecht, The Netherlands: Kluwer, 437
pp.
Howard, T., in preparation: Vegetation communities in the
Adirondack Alpine Zone. Albany, New York: New York
Natural Heritage Program.
Kimball, K. D., and Weihrauch, D. M., 2000: Alpine vegetation
communities and the alpine-treeline ecotone boundary in New
England as biomonitors for climate change. USDA Forest
Service Proceedings, 3(5): 93–101.
Korner, C., 1998: A reassessment of high elevation treeline
positions and their explanation. Oecologia, 115: 445–459.
Korner, C., and Paulsen, J., 2004: A world-wide study of high
altitude treeline temperatures. Journal of Biogeography, 31:
713–732.
Kullman, L., 2007: Tree line population monitoring of Pinus
sylvestris in the Swedish Scandes, 1973–2005: implications for
tree line theory and climate change ecology. Journal of Ecology,
95: 41–52.
Kupfer, J. A., and Cairns, D. M., 1996: The suitability of montane
ecotones as biomonitors of global climate change. Progress in
Physical Geography, 20(3): 253–272.
B. Z. CARLSON ET AL. / 341

LeBlanc, D. C., 1981: Ecological studies on the alpine vegetationof the Adirondack Mountains of New York. M.A. thesis, StateUniversity of New York at Plattsburg, 130 pp.
Malanson, G. P., and Butler, D. R., 1994: Tree-tundra competitivehierarchies, soil fertility gradients, and the elevation of treelinein Glacier National Park, Montana. Physical Geography, 15:166–180.
Malanson, G. P., Butler, B. R., Fagre, D. B., Walsh, S. J.,Tomback, D. F., Daniels, L. D., Resler, L. M., Smith, W. K.,Weiss, D. J., Peterson, D. L., Bunn, A. G., Hiemstra, C. A.,Liptzin, D., Bourgeron, P. S., Shen, S., and Millar, C. I., 2007:Alpine treeline of western North America: linking organism-to-landscape dynamics. Physical Geography, 28(5): 378–396.
Miller, N. G., and Spear, R. W., 1999: Late-Quaternary history ofthe alpine flora of the New Hampshire White Mountains.Geographie Physique et Quaternaire, 53(1): 137–157.
Munroe, J. S., 2008: Alpine soils on Mt. Mansfield, Vermont,USA: pedology, history, and intraregional comparison. SoilScience Society of America Journal, 72(2): 524–533.
Price, M. F., and Barry, R. G., 1997: Climate change. InMesserli, B., and Ives, J. D. (eds.), Mountains of the World.New York: Parthenon Publishing, 409–445.
Ryerson, C. C., 1990: Atmospheric icing rates with elevation onnorthern New England mountains. Arctic and Alpine Research,22(1): 90–97.
Seidel, T. M., Grant, A. N., Pszenny, A. A. P., and Allman, D. J.,2007: Dew point and humidity measurements and trends at thesummit of Mountain Washington, N.H. 1935–2004. Journal ofClimate, 20: 5629–5641.
Seidel, T. M., Weihrauch, D. M., Kimball, K. D., Pszenny, A. A.P., Soboleski, R., Crete, E., and Murray, G., 2009: Evidence ofclimate change declines with elevation based on temperatureand snow records from 1930s to 2006 on Mount Washington,New Hampshire, U.S.A. Arctic, Antarctic, and Alpine Research,41: 362–372.
Slack, N. G., and Bell, A. W., 2006: Adirondack Alpine Summits:an Ecological Field Guide. Lake George, New York: AdirondackMountain Club, 80 pp.
Spear, R. W., 1989: Late-Quaternary history of high-elevationvegetation in the White Mountains of New Hampshire.Ecological Monographs, 59: 125–151.
Tang, G., and Beckage, B., 2010: Projecting the distribution offorests in New England in response to climate change. Diversityand Distributions, 16: 144–158.
Theurillat, J. P., and Guisan, A., 2001: Potential impact of climatechange on vegetation in the European Alps: a review. ClimateChange, 50: 77–109.
Thompson, E. H., and Sorenson, E. R., 2000: Wetland, Woodland,Wildland: a Guide to the Natural Communities of Vermont.Hanover, New Hampshire: University Press of New England,456 pp.
Waterman, L., and Waterman, G., 1989: Forest and Crag: a Historyof Hiking, Trail Blazing, and Adventure in the NortheastMountains. Boston: Appalachian Mountain Club, 888 pp.
MS accepted January 2011
342 / ARCTIC, ANTARCTIC, AND ALPINE RESEARCH