DISTRIBUTION AND GENETICS OF THE RED FOX › content › genetics › 30 › 1 › 39.full.pdf · T...
12
DISTRIBUTION AND GENETICS OF THE COLOR PHASES OF THE RED FOX I N CANADA' L. BUTLER Hudson's Bay Company, Winnepeg, M0nitoba Received June IS, 1944 H E colored fox (Vzclpesfulva) and its geographic races exists throughout T most of its range in three main color phases: (I) The red fox is reddish brown to yellow with black markings on the feet and the ears. There is an area of pure white hairs on the mid-ventral line and on the tip of the tail. (2) The silver fox has all the reddish brown hairs replaced by black ones or black with a white band. The width of the band and the distribution of the white-banded hairs determines whether a fox of this phase is a black, one- quarter silver, three-quarters silver, etc. Most of the farmed foxes have been selectiveIy bred so that from three-quarters to the whole of their body is covered with these silvery hairs. The pure white portion of the body remains unchanged. I n farmed types such as white faces, ring neck and platinums this white area has been much enlarged. (3) The cross fox is a mixture of the other two types. There is a great deal of variation in foxes of this type. A typical specimen has red flanks, shoulders and cheeks, and silver or black back and neck. The darkened lengthwise line down the back and the dark fur on the neck form a cross from which the animal derives its name. Some foxes are very similar to the red phase but have a smoky appearance because of the number of black hairs scattered through the pelt. These are spoken of in the trade as bastard foxes. Breeding experiments a t the HUDSON'S BAY COMPANY fur farm indicate that these foxes are similar to cross fox in their two main coat color factors. The fox population fluctuates markedly, with peak numbers every ten years in most of its range' and every four years in northern Quebec and Labrador. The population has increased over IOO per cent in the past 20 years. The peak years do not coincide in different parts of the country. There is migration from areas of high density, as witnessed by the appearance of runs of northern or western types of fur in places where they are not native. GENETICS OF THE COLOR PHASES Early in the history of fur farming it was observed that silvers appeared in the progeny of cross fox parents, and soon a mono-factoral hypothesis was proposed as follows: Red, SS; Cross, Ss; Silver, ss. Later ILJINA (1934, 1935) proposed a slightly more complicated system with a modifier making different types of cross as follows: Red, rr; Smoky red, Rr dd; Cross, Rr Dd; Cross, Rr DD; Silver, RR. As more animals were raised in captivity, it was found that the above The writer wishes to acknowledge the helpful suggestions and criticisms received from Dr. J. W. MacArthur of the University of Toronto. GENETICS 30: 39 Jan. 1945
Transcript of DISTRIBUTION AND GENETICS OF THE RED FOX › content › genetics › 30 › 1 › 39.full.pdf · T...
DISTRIBUTION AND GENETICS OF T H E COLOR PHASES OF THE RED FOX I N CANADA'
L. BUTLER Hudson's Bay Company, Winnepeg, M0nitoba
Received June IS, 1944
H E colored fox (Vzclpesfulva) and its geographic races exists throughout T most of its range in three main color phases: (I) The red fox is reddish brown to yellow with black markings on the feet and the ears. There is an area of pure white hairs on the mid-ventral line and on the tip of the tail. ( 2 ) The silver fox has all the reddish brown hairs replaced by black ones or black with a white band. The width of the band and the distribution of the white-banded hairs determines whether a fox of this phase is a black, one- quarter silver, three-quarters silver, etc. Most of the farmed foxes have been selectiveIy bred so that from three-quarters to the whole of their body is covered with these silvery hairs. The pure white portion of the body remains unchanged. I n farmed types such as white faces, ring neck and platinums this white area has been much enlarged. ( 3 ) The cross fox is a mixture of the other two types. There is a great deal of variation in foxes of this type. A typical specimen has red flanks, shoulders and cheeks, and silver or black back and neck. The darkened lengthwise line down the back and the dark fur on the neck form a cross from which the animal derives its name. Some foxes are very similar to the red phase but have a smoky appearance because of the number of black hairs scattered through the pelt. These are spoken of in the trade as bastard foxes. Breeding experiments a t the HUDSON'S BAY COMPANY fur farm indicate that these foxes are similar to cross fox in their two main coat color factors.
The fox population fluctuates markedly, with peak numbers every ten years in most of its range' and every four years in northern Quebec and Labrador. The population has increased over IOO per cent in the past 2 0 years. The peak years do not coincide in different parts of the country. There is migration from areas of high density, as witnessed by the appearance of runs of northern or western types of fur in places where they are not native.
GENETICS OF THE COLOR PHASES
Early in the history of fur farming it was observed that silvers appeared in the progeny of cross fox parents, and soon a mono-factoral hypothesis was proposed as follows: Red, SS; Cross, Ss; Silver, ss.
Later ILJINA (1934, 1935) proposed a slightly more complicated system with a modifier making different types of cross as follows: Red, rr; Smoky red, Rr dd; Cross, Rr Dd; Cross, Rr DD; Silver, RR.
As more animals were raised in captivity, it was found that the above
The writer wishes to acknowledge the helpful suggestions and criticisms received from Dr. J. W. MacArthur of the University of Toronto.
GENETICS 30: 39 Jan. 1945
40 L. BUTLER . schemes would not hold. Cross foxes were often found in the litters of two silver parents. To take care of these exceptions WARWICK and HANSON (1937) proposed a two factor hypothesis. According to their hypothesis the factor combinations for the three phenotypes are:
Red Cross Silver A A B B red AaBB cross AAbb aaBB AABb smoky red AaBb blended cross Aabb aaBb
(These five combinations of silver represent different grades of silver.)
aabb
POPULATIONS GENETICS
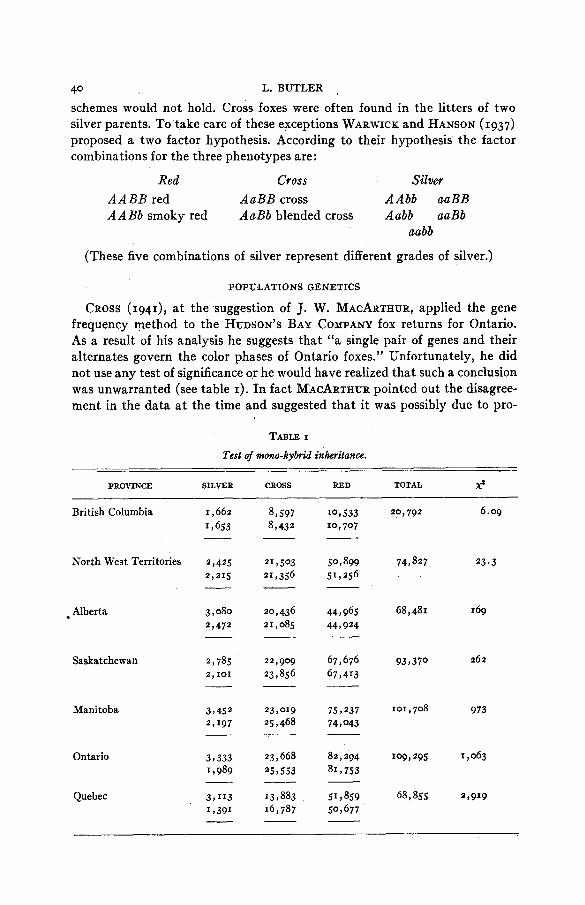
CROSS (1941), a t the suggestion of J. W. MACARTHUR, applied the gene frequency method to the HUDSON’S BAY COMPANY fox returns for Ontario. As a result of his analysis he suggests that “a single pair of genes and their alternates govern the color phases of Ontario foxes.” Unfortunately, he did not use any test of significance or he would have realized that such a conclusion was unwarranted (see table I). In fact MACARTHUR pointed out the disagree- ment in the data a t the time and suggested that it was possibly due to pro-
TABLE I
Test of mono-hybrid inheritance.
PROVINCE SILVER CROSS RED TOTAL x’
British Columbia
North West Territories
Alberta
Saskatchewan
Manitoba
Ontario
Quebec
8,597 8,432
20,436 21,085
22,909 23 9 856
23 , 668 25 , 553

COLOR PHASES OF RED FOX 41
gressive selection against the more valuable silvers, but this is not mentioned in CRoss’,paper. ELTON and HALDANE (1942) have both dealt with the fox color types data from the standpoint of selection, and their findings will be discussed in a later section.
The theoretical basis for this study is that the frequency “p” of the domi- nant gene and the frequency “q” of the recessive gene have mathematical relationships which can be demonstrated for all populations. The mono- hybrid relationship for foxes would be: reds “p2,” cross “npq,” silver “q2.”
Or with the ILJINA scheme it would be:- red smoky red zpqy2 cross dI-Yy2)Pq silver q2
Where ‘y” is the frequency of the gene modifier D and is found from the equation :
where c = percentage of cross and s =percentage of y = 441-3h) silver
For a dihybrid relationship we get the-more complicated arrangement which is given below:
B B Bb bb P2 2P9 q2
A A A A B B AABb AAbb red smoky red silver
m2 p2m2 2 (Pq) m2 m2q2
Aa AaBB AaBb Aabb cross cross silver
2mn 2 (mn)p2 4mnpq z(mn)q2
aa aaBB aaBb aabb
n2 n2p2 2 (Pq) n2 n2q2 silver silver silver
This gives : red p2m2+ 2(pq)m2 cross z ( mn)p2+4mnpq silver I - (reds+cross)
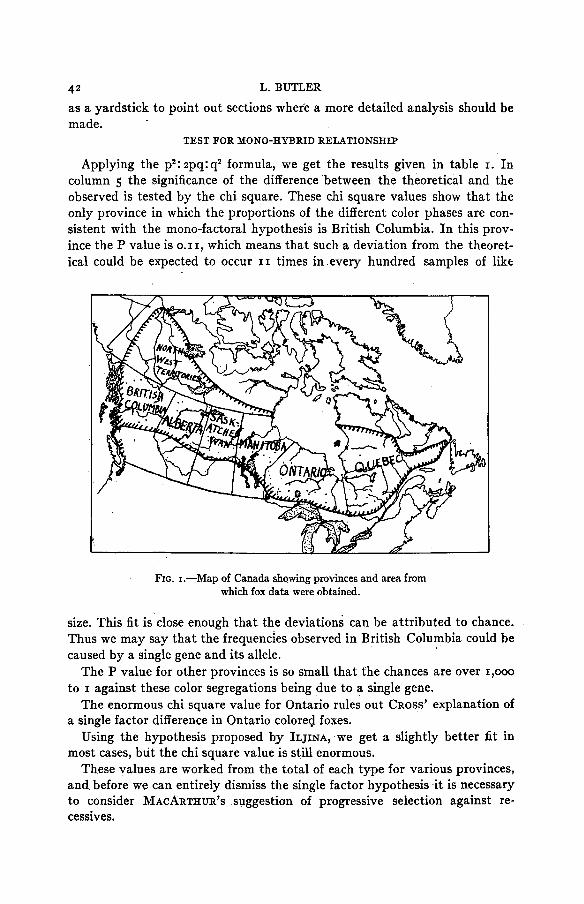
In the following tables and graphs the above criteria are applied to the HUDSON’S BAY COMPANY fur returns from 1915 to date. The figures, which pertain to more than 700,000 fox pelts, are divided into seven major groups representing the foxes taken in the different provinces. The position of these provinces and the area covered by these fur returns is given in the map, figure I. The provincial boundary lines are used not because they constitute biological divisions but because they are easily found on the map and serve
42 L. BUTLER
as a yardstick to point out sections where a more detailed analysis should be made.
TEST FOR MONO-HYBRID RELATIONSHIP
Applying the p2:zpq:q2 formula, we get the results given in table I. In column 5 the significance of the difference between the theoretical and the observed is tested by the chi square. These chi square values show that the only province in which the proportions of the different color phases are con- sistent with the mono-factoral hypothesis is British Columbia. In this prov- ince the P value is 0.11, which means that such a deviation from the theoret- ical could be expected to occur 11 times in every hundred samples of like
FIG. 1.-Map of Canada showing provinces and area from which fox data were obtained.
size. This fit is close enough that the deviations can be attributed to chance. Thus we may say that the frequencies observed in British Columbia could be caused by a single gene and its allele.
The P value for other provinces is so small that the chances are over 1,000 to I against these color segregations being due to a single gene.
The enormous chi square value for Ontario rules out CROSS’ explanation of a single factor difference in Ontario colored foxes.
Using the hypothesis proposed by ILJINA, we get a slightly better fit in most cases, but the chi square value is still enormous.
These values are worked from the total of each type for various provinces, and before we can entirely dismiss the single factor hypothesis .it is necessary to consider MACARTHUR’S suggestion of progressive selection against re- cessives.
COLOR PHASES OF RED FOX 43 SELECTION AND CHANGES I N THE PERCENTAGE OF SILVERS
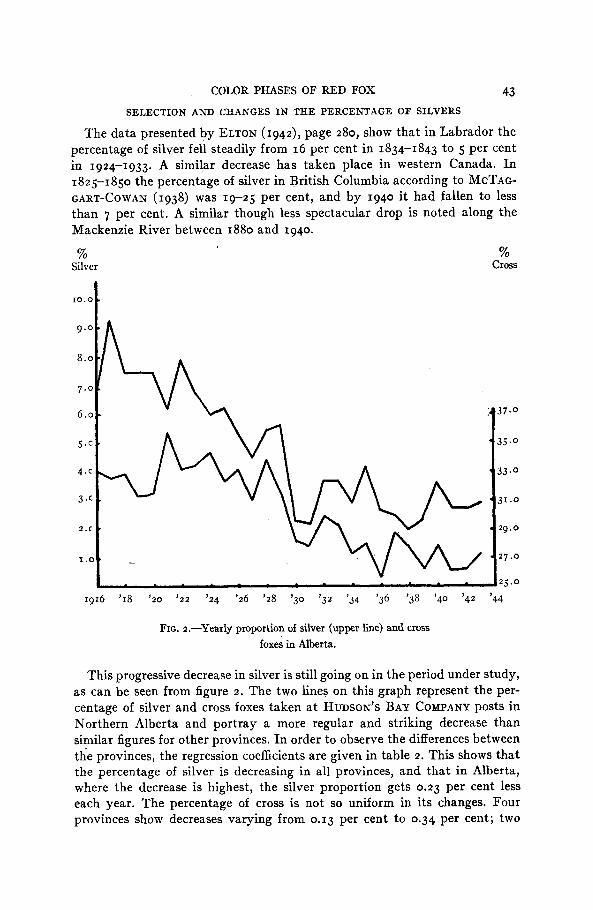
The data presented by ELTON (1942), page 280, show that in Labrador the percentage of silver fell steadily from 16 per cent in 1834-1843 to 5 per cent in 1924-1933. A similar decrease has taken place in western Canada. In 1825-1850 the percentage of silver in British Columbia according to MCTAG- GART-COWAN (1938) was 19-25 per cent, and by 1940 it had fallen to less than 7 per cent. A similar though less spectacular drop is noted along the Mackenzie River between 1880 and 1940.
% Silver
% Cross
1916 '18 '20 '22 '24 '26 '28 '30 '32 '34 '36 '38 '40 '42 '44
FIG. 2.-Yearly proportion of silver (upper line) and cross foxes in Alberta.
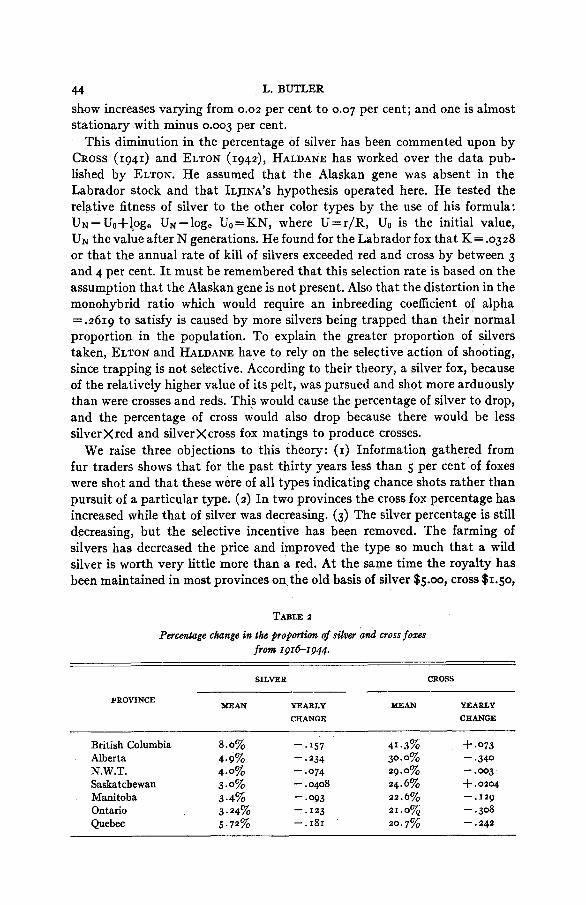
This progressive decrease in silver is still going on in the period under study, as can be seen from figure 2. The two lines on this graph represent the per- centage of silver and cross foxes taken a t HUDSON'S BAY COMPANY posts in Northern Alberta and portray a more regular and striking decrease than similar figures for other provinces. In order to observe the differences between the provinces, the regression coefficients are given in table 2. This shows that the percentage of silver is decreasing in all provinces, and that in Alberta, where the decrease is highest, the silver proportion gets 0.23 per cent less each year. The percentage of cross is not so uniform in its changes. Four provinces show decreases varying from 0.13 per cent to 0.34 per cent; two
44 L. BUTLER
show increases varying from 0.02 per cent to 0.07 per cent; and one is almost stationary with minus 0.003 per cent.
This diminution in the percentage of silver has been commented upon by CROSS (1941) and ELTON (1942), HALDANE has worked over the data pub- lished by ELTON. He assumed that the Alaskan gene was absent in the Labrador stock and that ILJINA'S hypothesis operated here. He tested the relative fitness of silver to the other color types by the use of his formula: U~-Uof]og, UN-loge Uo=KN, where U=r/R, U0 is the initial value, UN the value after N generations. He found for the Labrador fox that K = .0328 or that the annual rate of kill of silvers exceeded red and cross by between 3 and 4 per cent. It must be remembered that this selection rate is based on the assumption that the Alaskan gene is not present. Also that the distortion in the monohybrid ratio which would require an inbreeding coefficient of alpha = .2619 to satisfy is caused by more silvers being trapped than their normal proportion in the population. To explain the greater proportion of silvers taken, ELTON and HALDANE have to rely on the selective action of shooting, since trapping is not selective. According to their theory, a silver fox, because of the relatively higher value of its pelt, was pursued and shot more arduously than were crosses and reds. This would cause the percentage of silver to drop, and the percentage of cross would also drop because there would be less silver Xred and silver X cross fox matings to produce crosses.
We raise three objections to this theory: (I) Informatioq gathered from fur traders shows that for the past thirty years less than 5 per cent of foxes were shot and that these were of all types indicating chance shots rather than pursuit of a particular type. (2) In two provinces the cross fox percentage has increased while that of silver was decreasing. (3) The silver percentage is still decreasing, but the selective incentive has been removed. The farming of silvers has decreased the price and improved the type so much that a wild silver is worth very little more than a red. At the same time the royalty has been maintained in most provinces on the old basis of silver $5.00, cross $1.50,
TABLE 2
Percentage change in the proportion of silver and cross foxes from I9I6I944.
SILVER moss --
MEAN YEARLY MEAN YEARLY
CHANGE CHANGE
PROVINCE
British Columbia 8.0% - . '57 41.3% +.073
N.W.T. 4.0% - -074 29.0% - .CO3 Alberta 4.9% - .234 30.0% -.340
Saskatchewan 3.0% - .0408 24.6% + .0204 Manitoba 3.4% - -093 22.6% -.129
Ontario 3.24% -. 123 21.0% - .308 Quebec 5.72% -.I81 20.7% - .242
COLOR PHASES OF RED FOX 45 red $0.50. Thus a t average values a red a t $9.00-.50=$8.50, and a silver a t $13.00-$5.00=$8.00 puts the silver in the same price bracket as reds or often discounts against them. As a corollary of this royalty/price relationship it is to be expected that classification has become discriminating against silvers and crosses. When any doubt exists about the color phase of a skin it is placed in the lower royalty class.
If because of the aforementioned points we discard selection by man, then we have the following alternatives: (I) Silver foxes are not so prolific, and HALDANE’S K really measures their breeding and survival rate as compared with other types. I n favor of this point is the fact that platinums and other mutant types have lower fecundity, and that the decrease in percentage of silver is accompanied by a great increase in population and catch of foxes. (2)
The intermingling of the Alaskan and Canadian genes may have had more to do with the decrease in silver than selection by man. I n favor of this is the fact that the silvers have decreased a t different rates in different provinces (see ta- ble 2, 3); also that the dedrease in silvers was sometimes accompanied by an increase in cross fox.
I n considering these decreases it should be borne in mind that a north-south gradient did and does exist in silver foxes. Silvers are more abundant in the north than in the south. With the northward advance of settlement, foxes with their love of forest clearings have also moved north and increased in number. Evidence of this northward migration is seen in the increasing numbers of red fox that are being taken in the white fox country, Given this mixing of south- ern types with their lower recessive frequency, the number of silvers in the northern population was bound to decrease. However, there is not enough defi- nite evidence to entirely rule out some selection against the recessive genes, but from a practical standpoint we think any such selection must have been from differential birth or mortality rates between types rather than from selec- tive shooting by man.
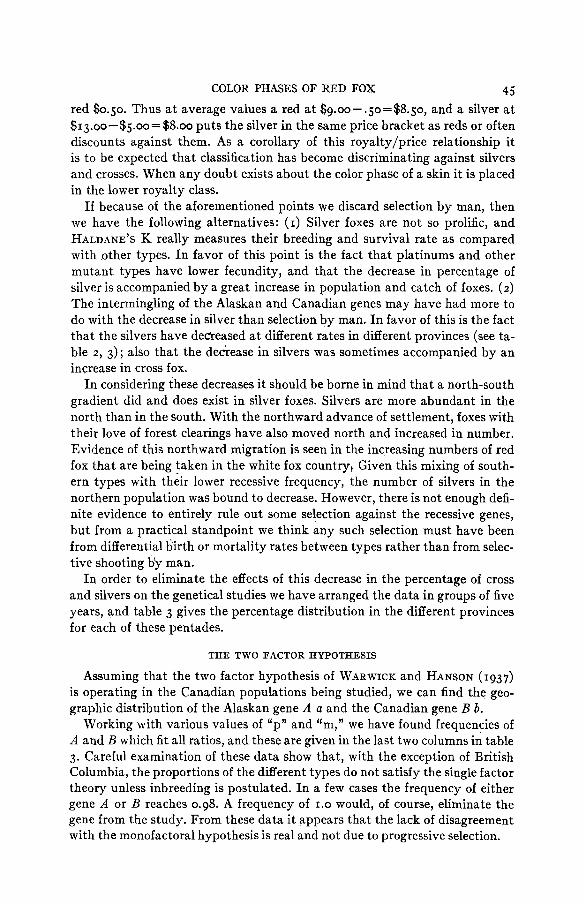
I n order to eliminate the effects of this decrease in the percentage of cross and silvers on the genetical studies we have arranged the data in groups of five years, and table 3 gives the percentage distribution in the different provinces for each of these pentades.
THE TWO FACTOR HYPOTHESIS
Assuming that the two factor hypothesis of WARWICK and HANSON (1937) is operating in the Canadian populations being studied, we can find the geo- graphic distribution of the Alaskan gene A a and the Canadian gene B b.
Working with various values of “p” and “m,” we have found frequencies of A and B which fit all ratios, and these are given in the last two columns in table 3. Careful examination of these data show that, with the exception of British Columbia, the proportions of the different types do not satisfy the single factor theory unless inbreeding is postulated. In a few cases the frequency of either gene A or B reaches 0.98. A frequency of 1.0 would, of course, eliminate the gene from the study. From these data it appears that the lack of disagreement with the monofactoral hypothesis is real and not due to progressive selection.
46 L. BUTLER
TABLE 3 Distribution of color phases in Canadian
Provinces by Pentades.
Silver Cross Total A B
1916-1925 1926-1930 1931-1935 1936-1940
1916-1920 1921-1925 I 926-1930 1931-1935 1936-1 940
1916-1920 1921-1925 1926-1930 I93 1-1935 1936-1940
1916-1920 1921-1925 1926-1930 '931-I935 1936-1940
1916-1920 1921-1925 1926-1930 I93 1-193 5 1936-1940
Ig16-Ig20 1921-1925 1926-1930 193I--I935 1936-1940
1916-1920 1921-1925 1926-1930 193 1-1935 1936-1940
5.4% 3.5 4.8 3.2 3.6
3.80% 3.84 3.64 2.73 2.93
5.1% 4.36 3.28 2.63 3.38
4.4% 3.95 3.9 2.7 1.88
5.9% 7.0 5.3 5 . 0 3.5
29.5% 24.9 29.6 28.8 28.7
Saskatchewan 22.1%
23.7 24.7 23.1 27.3
Manitoba 24.6 25 -4 23.3 21.7 22.7
Ontario
23.8 23.4 20.5 18.0
Quebec 22.4% 24.5
23.9%
22.2
2 0 . 2
18.3
7 9 546 8,584 9,372 46,658 46,511
4,517 14,941 9,637 24,058 17,596
7,601 14,013 16,870 27,577 20,364
12,167 11,356 28,303 21,478 28,331
6 9 249 5 9 048 16,368 10,935 22,378
r
British Columbia 8.6% 41 .o% 41512
9.0 43.0 5 9 489 7.3 39.4 4,825 7.8 41.8 49637
8.0% 35.2% 5,331 Alberta
6.1 33.4 20,885 4.75 32.7 13,725 3.55 28.0 20,214
2.8 27.3 6,198
North West Territories .8I .84 .82
.83
.83
.87
.86
.85
.86
.83
.85
.85
.86
.87
.86
.86
.86
.86
.88 -90
.86
.85
.87
.88
.90
1.0
I .o I .o I .o
* 90 .90 -90 e90 97
COLOR PHASES OF RED FOX 47
GENE A-ALASKAN
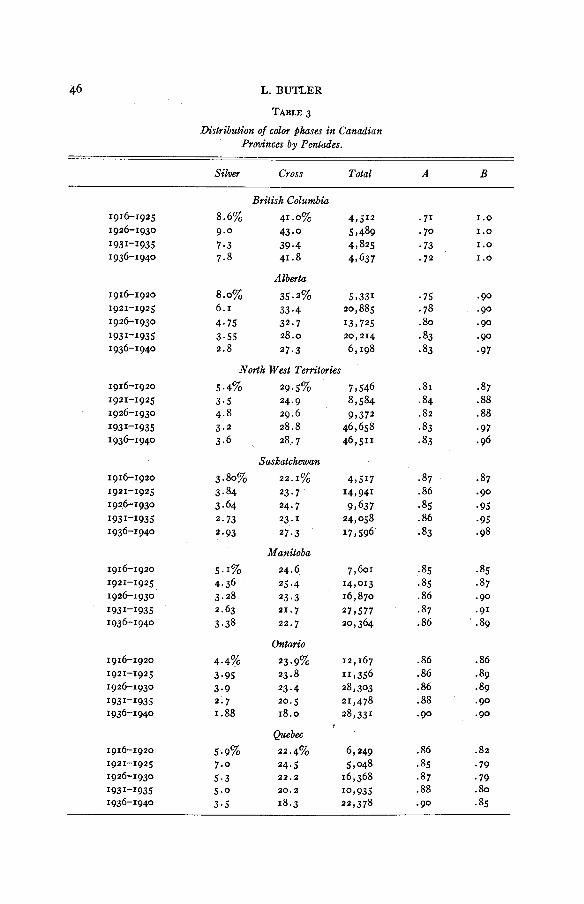
The recessive gene a which is responsible for silvers is most abundant in the west from which it derives its name. The frequency of A in British Columbia is 0.70-0.73 and the recessive falls off rapidly as one moves eastward until A reaches a high of 0.85-0. go in Ootario and Quebec (see fig. 3). The'variation in frequency in the different pentades is small, showing no definite trend and re-
A
B
. . 1
British Alberta N.W.T. Saskatchewan Manitoba Ontario Quebec Columbia
FIG. 3.-The frequencies of genes A and B by provinces.
quires no explanation for British Columbia, North West Territories, and Mani- toba. Saskatchewan shows only a slightly larger amount of variation than the previous three, but it exhibits a definite trend. The frequency of A has de- creased from 0.87 to 0.83, whereas in the other provinces the gene A has in- creased. This anomaly in Saskatchewan is probably due to the pivotal position of the province with respect to the geographical distribution of frequencies of the genes A and B . In Ontario and Quebec the gene A has increased from 0.85- 0.90, and in Alberta it has increased from 0.75-0.84.
48 L. BUTLER GENE B-CANADIAN
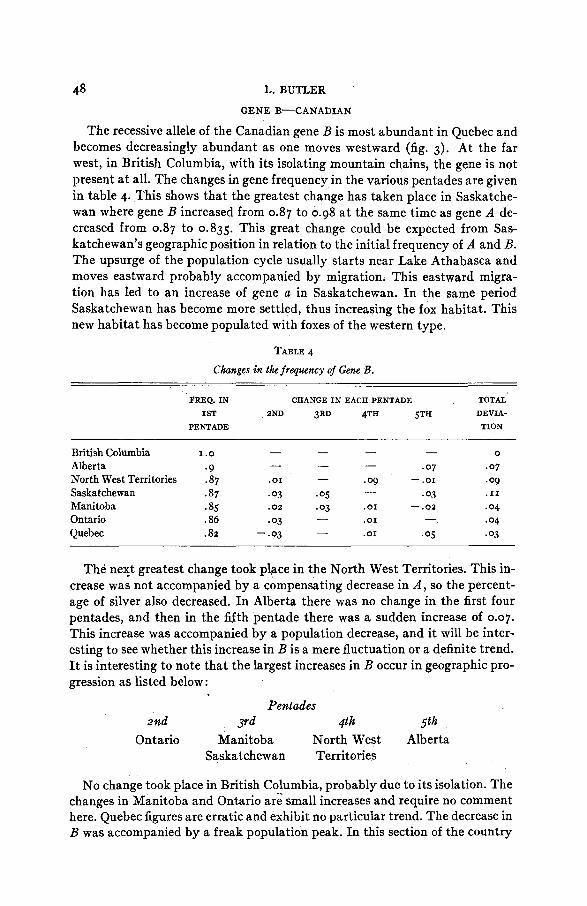
The recessive allele of the Canadian gene B is most abundant in Quebec and becomes decreasingly abundant as one moves westward (fig. 3). At the far west, in British Columbia, with its isolating mountain chains, the gene is not present a t all. The changes in gene frequency in the various pentades are given in table 4. This shows that the greatest change has taken place in Saskatche- wan where gene B increased from 0.87 to 0.98 a t the same time as gene A de- creased from 0.87 to 0.835. This great change could be expected from Sas- katchewan’s geographic position in relation to the initial frequency of A and B. The upsurge of the population cycle usually starts near Lake Athabasca and moves eastward probably accompanied by migration. This eastward migra- tion has led to an increase of gene a in Saskatchewan. In the same period Saskatchewan has become more settled, thus increasing the fox habitat. This new habitat has become populated with foxes of the western type.
TABLE 4
Changes in the frequency of Gene B .
FREQ. IN CHANGE IN EACH PENTADE TOTAL
I ST 2ND 3RD 4TH 5TH DEVIA- PENTADE TION
- - - - British Columbia I .o 0
.07 * 07 Alberta . 9 North West Territories .87 * 01 -09 -.or .09 Saskatchewan * 87 .03 .os .03 . I1
Ontario .86 -03 Quebec .82 - .03 .or .os .03
- - - -
- Manitoba .85 .02 -03 .OI - .02 .04
.04 - .OI - -
The nelft greatest change took place in the North West Territories. This in- crease was not accompanied by a compensating decrease in A , so the percent- age of silver also decreased. In Alberta there was no change in the first four pentades, and then in the sfth pentade there was a sudden increase of 0.07. This increase was accompanied by a population decrease, and it will be inter- esting to see whether this increase in B is a mere fluctuation or a definite trend. It is interesting to note that the largest increases in B occur in geographic pro- gression as listed below:
Pentades
Ontario Manitoba North West Alberta Saskatchewan Territories
2nd Yd 4th 5th
No change took place in British Columbia, probably due to its isolation. The changes in Manitoba and Ontario are small increases and require no comment here. Quebec figures are erratic and exhibit no particular trend. The decrease in B was accompanied by a freak population peak. In this section of the country
COLOR PHASES OF RED FOX 49 we have a four year cycle in the north and a ten year cycle in the south. South- ward migrations after northern peak years and northward migrations after southern peak years have so mixed the fur returns for each part of the province that changes over short periods such as five years are not reliable unless they exhibit a definite trend. Silvers exist in the greatest proportion when the cycle is a t its lowest ebb, and most of the foxes caught are of the northern type.
DISCUSSION
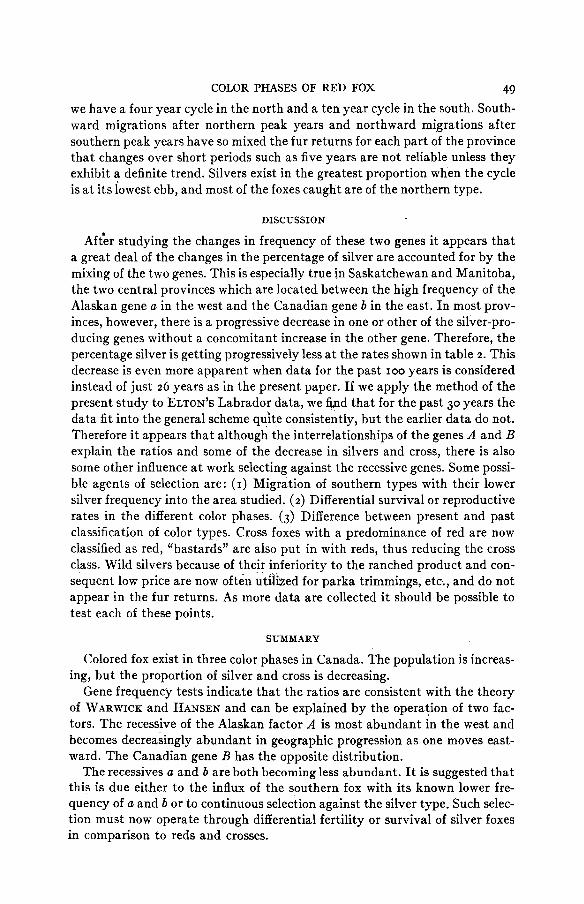
Aftkr studying the changes in frequency of these two genes it appears that a great deal of the changes in the percentage of silver are accounted for by the mixing of the two genes. This is especially true in Saskatchewan and Manitoba, the two central provinces which are located between the high frequency of the Alaskan gene a in the west and the Canadian gene b in the east. In most prov- inces, however, there is a progressive decrease in one or other of the silver-pro- ducing genes without a concomitant increase in the other gene. Therefore, the percentage silver is getting progressively less a t the rates shown in table 2. This decrease is even more apparent when data for the past 100 years is considered instead of just 2 6 years as in the present paper. If we apply the method of the present study to ELTON’S Labrador data, we 61d that for the past 30 years the data fit into the general scheme quite consistently, but the earlier data do not. Therefore it appears that although the interrelationships of the genes A and B explain the ratios and some of the decrease in silvers and cross, there is also some other influence a t work selecting against the recessive genes. Some possi- ble agents of selection are: (I) Migration of southern types with their lower silver frequency into the area studied. ( 2 ) Differential survival or reproductive rates in the different color phases. (3) Difference between present and past classification of color types. Cross foxes with a predominance of red are now classified as red, “bastards” are also put in with reds, thus reducing the cross class. Wild silvers because of their inferiority to the ranched product and con- sequent low price are now often utihzed for parka trimmings, etc., and do not appear in the fur returns. As more data are collected it should be possible to test each of these points.
SUMMARY
Colored fox exist in three color phases in Canada. The population is increas- ing, but the proportion of silver and cross is decreasing.
Gene frequency tests indicate that the ratios are consistent with the theory of WARWICK and HANSEN and can be explained by the operation of two fac- tors. The recessive of the Alaskan factor A is most abundant in the west and becomes decreasingly abundant in geographic progression as one moves east- ward. The Canadian gene B has the opposite distribution.
The recessives a and b are both becoming less abundant. It is suggested that this is due either to the influx of the southern fox with its known lower fre- quency of a and b or to continuous selection against the silver type. Such selec- tion must now operate through differential fertility or survival of silver foxes in comparison to reds and crosses.
50 L. BUTLER
LITERATURE CITED
COWAN, I. McT., 1938 Geographic distribution of colour phases of the red fox and black bear
CROSS, E. C., 1941 Colour phases of the red fox (Vdpesfdoa) in Ontario. J. Mammal. 22(1):
ELTON, C. S., 1942 Voles, mice, and lemmings. Oxford: Clarendon Press. HALDANE, J. B. S., 1942 The selective elimination of silver foxes in eastern Canada. J. Genet.
ILJINA, E. D., 1934 Nasledovanie osnovnoiokraski lisic. Zool. Zh. 13: 701-708.
WARWICK, B. L. AND, K. B. HANSON, 1937 Yearbook of Agriculture, U. S. Dept. Agric. 1937:
in the PacificNorthwest. J. Mammal. ~g(z) : 202-206.
25-39.
4: 296-304.
1935 Osnovy genetiki i selekeil pusnyh zverei. Moscow. . 1388-1394.