Distribution and Fate of Energetics on DoD Test and ... · Draft Annual Report 2 March 2002...
149
Draft Annual Report 2 March 2002 Distribution and Fate of Energetics on DoD Test and Training Ranges: Interim Report 2 by Judith C. Pennington, James M. Brannon, June E. Mirecki U. S. Army Engineer Research and Development Center Environmental Laboratory Waterways Experiment Station 3909 Halls Ferry Road Vicksburg, MS 39180-6199 Thomas F. Jenkins, Thomas A. Ranney, Jeffrey A. Stark, Marianne E. Walsh, Allen D. Hewitt, Nancy Perron U. S. Army Engineer Research and Development Center Cold Regions Research and Development Laboratory 72 Lyme Road Hanover, NH 03755-1290 Guy Ampleman, Sonia Thiboutot, Jeff Lewis Defence Research Establishment Valcartier 2459 Pie XI Blvd North, Val-Bélair, Québec, Canada, G3J 1X5 LTC Jason Lynch, Joseph J. Delfino Environmental Engineering Science University of Florida Gainesville, FL Jay Clausen AMEC Earth and Environment 110 Littleton Road, Suite 1B Westford, MA 01886 Charolett A. Hayes DynTel 3530 Manor Dr., Suite 4 Vicksburg, MS 39180 Annual Technical Report Prepared for Strategic Environmental Research and Development Program Arlington, VA 22203
Transcript of Distribution and Fate of Energetics on DoD Test and ... · Draft Annual Report 2 March 2002...

Draft Annual Report 2 March 2002 Distribution and Fate of Energetics on DoD Test and Training Ranges: Interim Report 2
by Judith C. Pennington, James M. Brannon, June E. Mirecki
U. S. Army Engineer Research and Development Center Environmental Laboratory Waterways Experiment Station 3909 Halls Ferry Road Vicksburg, MS 39180-6199 Thomas F. Jenkins, Thomas A. Ranney, Jeffrey A. Stark, Marianne E. Walsh, Allen D. Hewitt, Nancy Perron U. S. Army Engineer Research and Development Center Cold Regions Research and Development Laboratory 72 Lyme Road Hanover, NH 03755-1290 Guy Ampleman, Sonia Thiboutot, Jeff Lewis Defence Research Establishment Valcartier 2459 Pie XI Blvd North, Val-Bélair, Québec, Canada, G3J 1X5 LTC Jason Lynch, Joseph J. Delfino Environmental Engineering Science University of Florida Gainesville, FL Jay Clausen AMEC Earth and Environment 110 Littleton Road, Suite 1B Westford, MA 01886 Charolett A. Hayes DynTel 3530 Manor Dr., Suite 4 Vicksburg, MS 39180 Annual Technical Report Prepared for Strategic Environmental Research and Development Program Arlington, VA 22203

2
Contents Preface ................................................................................................................... 3
1—Introduction...................................................................................................... 7
Background ..................................................................................................... 7
Related On-Going and Leveraged Studies .................................................... 14
Scope of Project............................................................................................. 15
Objectives...................................................................................................... 17
Summary of Results of Previous Year .......................................................... 17
2—Characterization of Explosives Contamination at Military Firing Ranges .... 20
Introduction ................................................................................................... 20
Yakima Training Center, WA ....................................................................... 22
Camp Guernsey, WY .................................................................................... 26
Materials and Methods .................................................................................. 29
Results and Discussion .................................................................................. 32
Conclusions………………………………………………………………….45
Literature cited………………………………………………………………47
Tables………………………………………………………………………..50
Figures………………………………………………………………………68
3— Assessment of CFB Shilo Training Areas .................................................... 82
Introduction ................................................................................................... 82
Sampling Strategies ....................................................................................... 85
Parameters Monitored and Analytical Methods ............................................ 89
Magnitude of Study ....................................................................................... 89
Conclusion…………………………………………………………………..93
4— Transport Parameters for Firing Ranges Summary....................................... 94
Background ................................................................................................... 94
Objectives...................................................................................................... 95
Materials and Methods………………………………………………………95
Results and Discussion……………………………………………………..102

3
Summary and Conclusions………………………………………………….108
Referenced…………………………………………………………………..112
Tables………………………………………………………………………..115
Figures……………………………………………………………………….122
5— Conclusions………………………………………………………………….123

4
Abbreviations
AcN Acetonitrile
ADNTs Aminodinitrotoluenes
2ADNT 2-amino-4,6-dinitrotoluene
4ADNT 4-amino-2,6-dinitrotoluene
2A4NT 2-amino-4-nitrotoluene
4A2NT 4-amino-2-nitrotoluene
CG Camp Guernsey, Wyoming
CRREL Cold Regions Research and Engineering Laboratory
3,5DNA 3,5-dinitroaniline
1,3DNB 1,3-dinitrobenzene
2,4DNT 2,4-dinitrotoluene
DREV Defence Research Establishment Valcartier (Canada)
EL Environmental Laboratory
EOD Explosive ordnance disposal
ERDC Engineer Research and Development Center
GC-ECD Gas chromatography-electron capture detection
HMX Octahydro-1,3,5,7-tetranitro-1,3,5,7-tetrazocine
LAW Light Antitank Weapon
MMR Massachusetts Military Reservation
3-NA 3-nitroaniline
NG Nitroglycerin
RDX Hexahydro-1,3,5-trinitro-1,3,5-triazine
RP-HPLC-UV Reversed-phase high performance liquid chromatography
ultraviolet detection
SARM Standard Analytical Reference Materials
TNB 1,3,5-trinitrobenzene
TNT 2,4,6-trinitrotoluene
UXO Unexploded ordnance
YTC Yakima Training Center, Washington

5
Preface
This report was prepared by the U. S. Army Engineer Research and Development Center (ERDC)
in partnership with the Defence Research Establishment Valcartier (DREV), Canada, the University of
Florida and AMEC Earth and Science, Inc. (AMEC). The research was sponsored by the Strategic
Environmental Research and Development Program, Arlington, VA, Mr. Bradley P. Smith, Executive
Director, and Dr. Jeff Marqusee, Technical Director, under Compliance Project Number CP1155. The
principal investigator was Dr. Judith C. Pennington, Research Biologist, Environmental Processes and
Engineering Division (EPED), Environmental Laboratory (EL), ERDC, Vicksburg, MS. Co-principal
investigators were Dr. Thomas F. Jenkins, Research Chemist, Environmental Sciences Branch (ESB),
Cold Regions Research and Engineering Laboratory, ERDC, Hanover, NH; Dr. James M. Brannon,
Geochemist, EPED, ERDC, EL; Drs. Guy Ampleman and Sonia Thiboutot, Defence Research
Establishment Valcartier, Québec, Canada; LTC Jason Lynch, University of Florida, Gainesville, FL, and
Mr. Jay Clausen, AMEC, Westford, MA.
Range soil characterization research reported in Chapter 2 was conducted by Dr. Jenkins, Ms. Marianne
E. Walsh, Research Chemical Engineer, Mr. Alan D. Hewitt, Research Physical Scientist, Environmental
Sciences Branch; Mr. Jeffrey A. Stark, Physical Sciences Technician, Civil Engineering Research Branch; and
Ms. Nancy Perron, Physical Sciences Technician, Snow and Ice Branch, ERDC, CRREL; Dr. Pennington and Dr.
June E. Mirecki, Geochemist, ERDC, EL; Mr. Thomas A. Ranney, Staff Scientist, Science and Technology
Corporation, Lebanon, NH; and Ms. Charlotte A. Hayes, Staff Scientist, DynTel, Vicksburg, MS.
Characterization of Canadian ranges reported in Chapter 3 was conducted by Drs. Ampleman and Thiboutot, and
Mr. Jeff Lewis, DREV. Research on soil partitioning and explosives dissolution reported in Chapter 4 was
conducted by Dr. James M. Brannon, ERDC, EL; LTC Jason Lynch and Dr. Joseph J. Delfino, University of
Florida, Gainesville, FL, and Ms. Hayes, DynTel.
The authors gratefully acknowledge the assistance provided by Mr. Dale Tadewald, Range Manager, and
Mr. Lawrence B. Fain, Environmental Compliance Manager, Yakima Training Center. This study could not have
been conducted without their active support and assistance. The authors also acknowledge SSG. Michael
Terhorst and SSG. John Szillinsky, 53rd EOD, for identifying the munitions responsible for creating various
craters within the artillery impact area and for providing overall EOD support. In addition we thank LTC Robert
E. Kempfe, Commander YTC for his support in conducting this research.

6
The authors acknowledge the active participation of Col. Joe Michaels, Facility Manager, Mr. Frank
Seifert, Hazardous Waste Manager, and MSG Danny Moss, Environmental Engineer, from the Wyoming
National Guard, and Mr. John A. Moser, Geohydrologist, U.S. Army Center for Health Promotion and Preventive
Medicine, Aberdeen Proving Ground, MD, who assisted in soil and water sample collection during the sampling
activity at Camp Guernsey, Wyoming. In addition, we would like to thank CW4 David Beach and MSG Brad
Boyer from 3rd BN 10th SFG (A), Fort Carson CO, and SFC Guy Mosier and SGT Tim Walker from HQ STARC,
Wyoming National Guard, who conducted detonations of UXO items in support of this study. Col. Michaels and
MSG Danny Moss are specially acknowledged for collection of the firing point soil samples at Camp Guernsey.
This report was reviewed by Drs. Terry Sobecki and Jeff Davis, ERDC, EL. The study was
conducted under the direct supervision of Dr. Richard E. Price, Chief, EPED, EL, Dr. Edwin A. Theriot,
Director, ERDC, EL, Dr. J. C. Tatinclaux, Chief, ESB, CRREL, and Dr. Barbara Sotirin, Director, ERDC,
CRREL.
At the time of publication of this report, Director of ERDC was Dr. James R. Houston. Commander was COL John W. Morris, III. This report may be cited as one document or by chapters as follows: Whole report:
Pennington, J. C., Jenkins, T. F., Ampleman, G., Thiboutot, S., Brannon, J. M. Lynch, J.,
Ranney, T. A., Stark, J. A., Walsh, M. E., Lewis, J., Hayes, C. A., Mirecki, J. E. Hewitt,
A. D., Perron, N., Clausen, J. and Delfino, J. J. (2002). “Distribution and fate of
energetics on DoD test and training ranges: Interim Report 2,” ERDC TR-02-XX, U. S.
Army Engineer Research and Development Center, Environmental Laboratory,
Vicksburg, MS.
Chapter 1 Pennington, J. C., and Clausen, J. (2002). “Introduction,” Chapter 1, Distribution and fate
of energetics on DoD test and training ranges: Interim Report 2, ERDC TR-02-XX, U. S.
Army Engineer Research and Development Center, Environmental Laboratory,
Vicksburg, MS.
7
Chapter 2: Jenkins, T. F., Pennington, J. C., Ranney T. A., Stark, J. A., Walsh, M. E., Hayes, C. A.,
Mirecki, J. E., Hewitt, A. D., and Perron, N. M. (2002). “Characterization of explosives
contamination at military firing ranges: Part 2, Yakima Training Center, WA, and Camp
Guernsey, WY,” Chapter 2, Distribution and fate of energetics on DoD test and training
ranges: Interim Report 2, ERDC TR-02-XX, U. S. Army Engineer Research and
Development Center, Environmental Laboratory, Vicksburg, MS.
Chapter 3: Ampleman, G., Thiboutot, S., and Lewis, J. (2002). “Assessment of CFB Shilo Training
Areas contamination by explosives and other contaminants,” Chapter 3, Distribution and
fate of energetics on DoD test and training ranges: Interim Report 2, ERDC TR-02-XX,
U. S. Army Engineer Research and Development Center, Environmental Laboratory,
Vicksburg, MS.
Chapter 4: Brannon, J. A., Lynch, J. and Hayes, C. A. (2002). “Transport parameters for firing range
residues,” Chapter 4, Distribution and fate of energetics on DoD test and training ranges:
Interim Report 2, ERDC TR-02-XX, U. S. Army Engineer Research and Development
Center, Environmental Laboratory, Vicksburg, MS.
Chapter 5: Pennington, J. C., Jenkins, T. F., Ampleman, G., Thiboutot, S., Brannon, J. A., and
Lynch, J. (2002). “Conclusions,” Chapter 5, Distribution and fate of energetics on DoD
test and training ranges: Interim Report 2, ERDC TR-02-XX, U. S. Army Engineer
Research and Development Center, Environmental Laboratory, Vicksburg, MS.

8
1 Introduction
Background
Testing and training ranges are essential to maintaining the readiness of the Armed Forces of the
United States. Recently, concerns have arisen over potential environmental contamination from residues
of energetic materials at impact ranges. The current state of knowledge concerning the nature, extent, and
fate of contamination is inadequate to ensure sound management of ranges as sustainable resources. The
potential for environmental impacts, including contamination of drinking water supplies, mandates that
DoD demonstrate responsible management of these facilities in order to continue testing and training
activities.
Regulatory precedent
In January, 2000, the U. S. Environmental Protection Agency (EPA) Region I issued an
Administrative Order for Response Action in the matter of “Training Range and Impact Area,
Massachusetts Military Reservation” to the National Guard Bureau and the Massachusetts National Guard
under authority of Section 1431(a) of the Safe Drinking Water Act, 42U.S.C.§ 300i(a) (USEPA 2000).
The purpose of the Order was to require the respondents to “undertake Rapid Response Actions and
Feasibility Studies, Design and Remedial Actions to abate the threat to public health presented by the
contamination from past and present activities and sources at and emanating from the Massachusetts
Military Reservation (MMR) Training Range and Impact Area.” This is an important precedent for
suspension of military training due to environmental contamination of soils and groundwater.
The MMR is a 21,000-acre installation located on Cape Cod, MA. The Training Ranges and
Central Impact Area is approximately 14,000 acres located on the Camp Edwards portion of the
installation. The Central Impact Area, approximately 2,000 acres, has artillery and mortar targets and is

9
surrounded by firing ranges, artillery and mortar positions, and training areas (AMEC 2001). The Cape
Cod Aquifer, a sole source aquifer for western Cape Cod, lies directly beneath the Training Ranges and
Central Impact Area. Based on the findings of lead, explosives, explosives-related compounds, pesticides
and other organic contaminants in soils, and RDX, TNT, HMX and some organics in groundwater, the
USEPA ordered the respondents to conduct feasibility studies at several MMR areas including the Central
Impact Area (USEPA 2000). The order also required rapid response actions for contaminated soils at
several gun positions, target positions, and for contaminated sediments at a wetland site.
MMR Update
The following is a brief summary of the last five years of work conducted at the Massachusetts
Military Reservation. The goal of the Impact Area Groundwater Study Program (IAGWSP) is to assess
and clean up the impacts of certain types of historic training activities conducted at the Camp Edwards’
Impact Area and training ranges. These areas lie directly over the Sagamore Lens, the most productive
part of the Cape Cod Aquifer. The National Guard Bureau is required by EPA to conduct the project and
is overseen by both the EPA and the Massachusetts Department of Environmental Protection.
Administrative Order No. 4 (AO4) was issued on January 4, 2001 under the Resource
Conservation and Recovery Act (RCRA) to the National Guard Bureau. This order requires that
munitions found subsurface or in burial pits be properly stored and disposed of in a Contained Detonation
Chamber (CDC), or by other means which prevent the release of explosives, metals and other
contaminants into the environment. As of June 2001, 1703 items had been destroyed using the CDC with
additional items awaiting disposal.
More than 170 monitoring wells have been installed and over 300 soil samples collected
throughout the 15,000-acre training ranges and Impact Area as part of the program. As a result of the
investigation, several sites/areas of Camp Edwards are being more closely examined to assess the nature
and extent of contamination from past military activities. The following major sites are under
investigation:
Demolition Area 1
Southeast Corner of the Ranges
Central Impact Area
Gun and Mortar Firing Positions

10
Chemical Spill-19
For each major site, a feasibility study must be prepared to evaluate potential alternatives for
conducting groundwater and soil cleanup. A feasibility study evaluates technologies and alternatives to be
used for the containment, treatment and/or removal of contamination from a site. In addition, the
IAGWSP is conducting an investigation and a feasibility study to address potential environmental impacts
from unexploded ordnance throughout Camp Edwards.
Demolition Area 1. Soil and groundwater investigations have been conducted at Demolition
Area 1 to identify the nature and extent of contamination at the site. Investigations began in June of 1997
and continue. For groundwater, the contaminants of concern (COCs) are the explosive compounds –
RDX, TNT, HMX, 2ADNT, 4ADNT, 2,4DNT, and perchlorate.
RDX and perchlorate have migrated the farthest in the groundwater. Plumes of these compounds
as currently defined extend about 5,500 feet west of Demo Area 1 and are about 400 feet wide and 100
feet deep in the aquifer. The maximum measured groundwater contamination found is 370 parts per
billion (ppb) for RDX and 300 ppb for perchlorate. The lifetime health advisory for RDX in drinking
water is 2 ppb (USEPA 1988b). No federal or state drinking water standard has been set for perchlorate,
but the EPA has calculated that a safe exposure level in drinking water for perchlorate is in the range of 4
– 18 ppb. A detailed evaluation of six remedial technologies for these constituents is currently under
discussion with the regulatory agencies.
The 12 contaminants of concern for soil are under review by the regulatory agencies. They are
primarily explosives and propellants, but also include several other contaminants such as metals, semi-
volatile organic compounds (SVOCs), and dioxin. Once approved by the agencies, the selected COCs will
form the basis for evaluating the cleanup alternatives for the soil contamination.
Southeast corner of the ranges. Explosives have been detected in groundwater and soil
southeast of the Impact Area and north of Snake Pond. This area lies at the top of the groundwater mound
of the Sagamore Lens of Cape Cod’s sole source aquifer. Groundwater flows out radially from this area.
This area contains three former defense contractor test ranges (the “J” Ranges) and one Massachusetts
Army National Guard range (the “L” Range). The U.S. Army - from the 1930s to the 1950s - extensively
used this entire area for training. Existing documentation on defense contractor activities at the J Ranges

11
suggests that bulk explosives were disposed of to the ground surface as well as below ground into holding
tanks. Open burn/open detonation disposal of munitions also occurred in numerous locations throughout
the J Ranges. In addition, buried caches totaling approximately 1700 mortar rounds have been exhumed
from locations since 1998. Also various test firings and research and development activities by numerous
contractors occurred in this area. The L Range was utilized for training with high explosives during the
1940s and from the 1970s to the 1980s.
Central Impact Area. Detections of explosives at various depths and locations in the aquifer
track back to, or originate from, the Central Impact Area where mortar and artillery rounds were fired for
many years. To date, an area of groundwater containing primarily RDX and HMX, has been delineated
as extending as far as 11,000 feet northwest from its probable source. The groundwater contamination
underlies an area of approximately 621 acres with approximately 880 million to 1.3 billion gallons of
water having been affected above the 2 ppb health advisory for RDX. The main source for the explosives
in groundwater appears to be an area along Turpentine Road and Tank Alley, which coincides with the
location of the targets for the Central Impact Area. The source likely covers about 440 acres of land
within the Central Impact Area.
Gun and mortar firing positions. Camp Edwards contains approximately 36 current and former
locations from which artillery and mortar rounds were fired. EPA requested that NGB conduct detailed
evaluations of these positions based on detections in soil of elevated levels of the propellant and explosive
compound 2,4DNT in addition to several metals, SVOCs and pesticides. The IAGWSP is evaluating
contamination at these positions and will begin developing remedial alternatives for cleanup in the near
future.
Chemical Spill-19 (CS-19). The CS-19 site is a small area in the west-central region of the
Impact Area. The area was used for the burial and burning of ordnance. The highest concentration of
RDX detected in groundwater at this location was 20 ppb in the central area of CS-19. Elevated levels of
explosives, metals and SVOCs have also been found in soils at this location. Groundwater contamination
in this area, which is currently known to extend 2,500 feet west and is underlain by contamination
originating further up gradient in the Central Impact Area, is currently being addressed by the Air Force
under the Installation Restoration Program (IRP) through a Remedial Investigation/Feasibility Study.

12
Administrative Order No. 3 identified several rapid response actions required to protect the
groundwater at Camp Edwards. The first round of rapid response actions has been completed. The areas
included contaminated soils at the:
KD range firing points and target areas
Gun position 7
Armored Personnel Carrier
J-3 Wetland
Study Area 2 of the Impact Area
These areas are located within the training ranges and Impact Area and have been investigated as
part of the ongoing IAGWSP. The results of these investigations have identified explosives, metals,
propellants, and pesticides in soil and sediment. Several of the areas had concentrations of contaminants
detected above Massachusetts Contingency Plan (MCP) Reportable Concentration Soil-1 (RCS-1) levels.
The RCS-1 levels are concentrations that, when exceeded, require notification of MADEP and may
require further investigation and remediation of contamination.
A soil-sampling program was conducted to determine the extent of soil contamination within five
rapid response areas that exceeded the proposed soil cleanup goals. Results of the sampling program
identified approximately 810 cubic yards of contaminated soil that exceeded the Rapid Response Action
(RRA) soil cleanup goals.
The RRA addressed the following requirements:
Elimination of current and potential sources of contaminants to the aquifer from soils and sediment
in the areas
Development and implementation of a monitoring plan to assess compliance with the cleanup goals
for source control measures
Excavation, treatment and/or disposal of contaminated sediments, soils, debris and other materials
generated during the RRA
Restoration of areas disturbed by the removal actions, particularly vegetation and habitat
A second round of Rapid Response Actions to address contamination at Mortar Target 9 and the
former H Range is currently underway.
13
An extensive Munitions Survey Project (MSP) has been underway since July of 1998 in addition
to the investigation and remediation of soil and groundwater contamination at Camp Edwards. The MSP
was designed to locate buried munitions at locations on Camp Edwards. Phase I of the project was
intended to investigate selected sites by conducting geophysical surveys to detect subsurface metallic
objects (anomalies or targets). Phase II of the MSP will involve investigations of other sites at Camp
Edwards. To verify the geophysical surveys, a limited number of subsurface validations have been
performed during Phase I of the MSP. Before field investigations for the MSP began, several sites,
locations, and functional areas were selected for investigations. Those areas included selected gun and
mortar positions, Demolition Area 1, Central Impact Area, the High Use Target Area, a slit trench,
selected water bodies, and portions of the J Ranges.
The MSP was designed to acquire data that could be used to support the groundwater study. In
particular, it was intended to fill significant gaps in data relevant to the issue of ordnance, buried
munitions, and burial pits at Camp Edwards. The intention of the MSP was to provide to stakeholders
information about the current condition of the ranges and locations at Camp Edwards. The original set of
tasks drafted in mid-1999 has been refined and modified as new information about buried ordnance at
Camp Edwards has been discovered and analyzed.
The survey focuses on locating large burial pits or disposal sites because such sites were assumed
to be potential sources of explosive chemicals detected in groundwater. Preliminary findings suggest that
smaller burial sites or even individual unexploded ordnance can be located using geophysical techniques.
All of the information gathered as part of the MSP will be utilized to support the UXO Feasibility Study
required by the EPA Administrative Order No. 3.
Characterization investigations prior to project CP1155 initiation
Antitank ranges. Extensive range characterization research has been conducted by the
Canadian Force Base (CFB) Valcartier, Quebec (Thiboutot et al. 1997, 1998, 2000, Ampleman et al.
2000, Dubé et al. 1999). Characterization of a light antitank weapon (LAW) rocket ranges at Fort Ord,
CA, and at CFB Valcartier have also been studies by U. S. scientists (Jenkins et al. 1997, 1998). Results
of chemical analyses at the LAW rocket sites indicated explosives residues deposited on the surface soils
due to high use of the rocket. The main charge in the LAW rockets is octol, which is composed of 60
percent HMX and 40 percent TNT. Accumulations of HMX near tank targets were as high as 1,640,000

14
:g kg-1 in surface soils at Valcartier, and as high as 587,000 :g kg-1 in surface soils at Fort Ord. However,
TNT concentrations were only about one one-hundredth that of HMX concentrations at both sites.
Thiboutot et al. (1998) sampled four antitank ranges in addition to the range at Valcartier, two at
Western Area Training Center, Wainwright, Alberta, and two at Canadian Force Ammunition Depot
(CFAD), Dundurn, Quebec. Results were similar to those reported for Valcartier, i.e., relatively high
levels of HMX in surface soils, but much lower levels of TNT. The highest concentration of HMX
detected at these ranges was 3,700,000 :g kg-1 at Range 13, Wainwright. HMX concentrations were much
lower at the other ranges due to much lower usage.
Heavy artillery ranges. Thiboutot and Ampleman (2000) collected 87 composite soil samples at
Canadian Force Training Range Tracadie, New Brunswick. The range had been used for artillery, gun and
mortar firing, and was heavily contaminated with unexploded ordnance (UXO). Nevertheless, no
explosives residues were detected in soils by Standard Method 8330 analysis (USEPA 1994). Ampleman
et al. (2000) collected soil samples at several ranges at Canadian Force Base Chilliwack, British
Columbia. Soils associated with craters were sampled at the Slesse Range, and concrete, steel and
woodcuttings were sampled at another area. Low concentrations of TNT and RDX were found in both
areas. Low levels of RDX and HMX were also found at the Vokes Grenade range. However, visual
observation at a propellant burning area at CFAD, Rocky Point, indicated that the site was littered with
partially burned propellant grains. These propellant grains contain nitroglycerin, nitrocellulose, and/or
nitroguanidine. The U.S. Army Center for Health Promotion and Preventative Medicine (CHPPM)
conducted a study at the artillery impact area at Camp Shelby, MS (U. S. Army Center for Health
Protection and Preventative Medicine, in press). Analysis of surface soil samples collected in a grid
pattern over a large area using Method 8330 (detection limits of about 250 :g kg-1) indicated very little
detectable residues of explosives-related contaminants.
Previous fate and transport studies
Important processes affecting environmental fate and transport of explosives include dissolution
rate, and soil adsorption and desorption. Studies to define dissolution of explosives have been confined to
individual explosives compounds (Taylor and Rinkenbach 1923, Verschueren 1983, Spanggord et al.
1983, Hale, Stanford, and Taft 1979, Ro et al. 1996). These studies have limited applicability for
dissolution of explosives residues on ranges because explosives are typically formulated with binders,
waxes, stabilizer and other compounds when they are added to munitions. Dissolution of these
15
formulations is likely to proceed more slowly than anticipated on the basis of solubility of pure
compound. Extensive studies have been conducted on soil adsorption and desorption (Haderlein,
Weissmahr, and Schwarzenbach 1996, Pennington and Patrick 1990, Ainsworth et al. 1993; Xue,
Iskandar, and Selim 1995; Comfort et al. 1995, Leggett 1985; Selim and Iskandar 1994; Myers et al.
1998; Price, Brannon, and Yost 1998; Brannon, Price and Hayes 1997), transformation (McCormick,
Feeherry, and Levinson 1976; Kaplan and Kaplan 1982; Townsend, Myers, and Adrian 1995; Price,
Brannon, and Hayes 1997; Comfort et al. 1995; Selim, Xue, and Iskandar 1995; Xue, Iskandar, and Selim
1995; Haderlein, Weissmahr, and Schwarzenbach 1996; Myers et al.1998; Riefler and Smets 2000),
degradation (McCormick, Feeherry, and Levinson 1976; McCormick, Cornell and Kaplan 1981, 1985;
Lewis et al. 1996; Funk et al. 1993; Crawford 1995; Pennington et al. 2001; Regan and Crawford 1994;
Coleman, Nelson, and Duxburg 1998; Kaplan 1993; Hawari et al. 2000; McCormick, Cornell and Kaplan
1985; Spanggord et al. 1983) and chemical reactions with soil components (Kaplan and Kaplan 1982,
Caton, Williams, and Griest 1994, Pennington et al. 1995a, 1997, 1998, Thorne and Leggett 1997, Thorn
1997, Haderlein, Weissmahr, and Schwarzenbach 1996).
These studies have been focused on the principal high explosives contamination typically
resulting from manufacturing and from loading, assembling and packaging (LAP) of explosives into
casings. The primary difference between fate and transport of explosives residues on ranges and
contamination associated with LAP facilities is the integrity of the delivery system, the transport of
explosives from the munitions, and the environment (aquatic, terrestrial, wetland, etc.) in which the
delivery system comes to rest. Instead of solubilized explosives concentrated in lagoons and washout
areas as has been observed at LAP facilities, firing ranges present more diffuse sources that are less
readily characterized. In addition to contaminated soil, explosives are also present in munitions at various
states of integrity (solid formulations) that may completely or partially confine the explosives. Since fate
and transport processes have not been studied in the context of range contamination, data for process
descriptors are incomplete or lacking for some relevant explosives compounds, propellants and detonation
by-products.
Related on-going and leveraged studies
Range characterization
U. S. Army Alaska Public Works. The ERDC-CRREL has an agreement with the U. S. Army
Alaska Public Works to conduct site investigations at four firing ranges, Range Alpha and Stuart Creek at

16
Fort Wainwright, and Washington and Delta Creek Ranges at Fort Greeley. These site investigations will
be leveraged to provide additional data on concentrations of explosives residues in surface soils due to
training range activities.
Army Environmental Center. The Army Environmental Center is conducting a SERDP-
sponsored project, CP 1226 “UXO Corrosion – Potential Contamination Source” to identify the type,
character, and rate of perforations in casings of UXO underlying soil at U.S. military installations. The
goal of the corrosion project is to examine approximately 200 pieces of ordnance during the study. Soils
collected in proximity to UXO will be analyzed at ERDC. Data will be leveraged with data amassed in
CP 1155. The Army Environmental Center is also conducting a “Range Sustainment Program” to
proactively ensure access to ranges and to protect drinking water sources on active ranges. Project CP
1155 has been coordinated with this project and will share site access with this project whenever possible
to benefit both efforts. Coordination with the AEC firing points emissions study, which will define
airborne emissions from firings of various munitions, has also been achieved.
Confined Burn Facilities Projects. Efforts have been made over the last several years to find
alternative to incineration, or open burning and open detonation of unnecessary munitions and explosives.
Unlike SERDP Project CP1155, which focuses on post blast residues of munitions under active firing,
these studies are focused primarily on air quality when disposing of unneeded munitions by burning or
detonating. The Tooele Army Depot, Tooele, UT, has used various incineration technologies including a
furnace capable of burning 140-180 kg of energetics material per hour, and the so-called “bang box”
configurations for confined burning to capture air emissions for further treatment. A 1000 cubic meter
“bang box” that can test 227 g of explosives or 2.27 kg of propellants has also been used at the Dugway
Proving Ground, UT. The box, formally known as the Propellant, Explosive, and Pyrotechnic Thermal
Treatment Evaluation and Test Facility, is instrumented to measure emissions. The Naval Sea System
(NAVSEA) Surface Warfare Center Division, Indian Head, MD, also has a Confined Burn Facility (CBF)
where they are conducting a project sponsored by ESTCP, “Confined Burn Facility Open Burning
Ground Replacement Technology,” the goal of which is to develop an environmentally acceptable,
economical, and proven alternative to open burning of munitions.
Fate and transport studies
Army Environmental Quality Technology Program. Two studies are currently under
execution at the ERDC-EL concerning fate and transport processes for explosives. The studies are funded

17
under the Installation Restoration Research Program (IRRP) of the Army Environmental Quality
Technology Program. One work unit, A835/301X/UX001, “Characterization and Mobilization of
Unexploded Ordnance,” is quantifying chemical signatures emanating from UXO under various
environmental and geophysical conditions. The purpose of the study is to provide the technical basis for
chemical sensor development, for discrimination between UXO and innocuous clutter, and for refinement
in the classification of detected UXO. The other work unit, A835/309E/RE004, “Fate and Transport of
Explosives Contaminants,” is developing screening level and comprehensive fate and transport models
and process descriptors for UXO in soil, aquifer, and aquatic environments for use in the exposure
assessment phase of risk assessments. These work units are concerned with explosives from UXO rather
than from the more diffuse and diverse explosives residues that exist at firing ranges. However, transport
parameters developed under these work units will be used in this project to insure a comprehensive and
unified database. Approximately 10 percent of the funds for defining fate and transport parameters will be
contributed by the SERDP project.
UXO in marine environments. The Naval Facilities Engineering Service Center, Port Huene,
CA, and the Space and Naval Warfare Systems Center, San Diego, CA, are conducting a study in
conjunction with the ERDC Environmental Laboratory to determine toxicological and geochemical
interactions of ordnance and explosives in marine environments. Geochemical studies will determine
dissolution, adsorption, and transformation rates of explosives in marine environments. Process
descriptors determined in freshwater will be compared with those determined in salt water to determine
what descriptors are affected by salinity. Process descriptors for any explosives unique to marine
activities will also be determined. The toxicology studies will focus on toxicity, bioaccumulation, trophic
transfer, and tissue concentrations of explosives in marine environments, and the toxic effects of mixtures
of explosives on marine organisms.
Scope of project CP1155
This project was designed to develop techniques for assessing the potential for environmental
contamination from energetic materials on testing and training ranges. Techniques will be developed to
define the physical and chemical properties, concentration, and distribution of energetics and residues of
energetics in soils, and the potential for transport of these materials to groundwater. Other issues, such as
off-site transport in surface runoff, or as a component of airborne dust, are also important, but are beyond
the scope of the project.

18
The study will be executed in two parts; range characterization, and fate and transport parameters
for explosives residues. To characterize ranges, heavy artillery impact and firing points, and hand grenade
ranges will be sampled. Where possible, groundwater associated with the ranges will also be sampled.
Chemical residues from live fire or demolitions of specific rounds will be assessed by detonations on
snow cover. To fill data gaps in transport parameters, such as dissolution kinetics and partitioning
coefficients, laboratory scale batch tests will be conducted.
Objectives
The primary objective of the study is to provide the DoD with techniques to assess the potential
for groundwater contamination from residues of high explosives (TNT, PETN, RDX, and HMX) at
testing and training ranges. Results of the project will facilitate informed management decision-making,
minimize environmental impacts of testing and training, and contribute to continued operation of ranges.
Specific objectives include the following:
(1) Provide a unified database system that will include (a) a listing of the energetic materials
used in current and past munitions systems that are known or expected to be present in UXO
items on testing and training ranges and whose use may have resulted in diffuse low-level
contamination of soils, and (b) a specific protocol that can be used to determine the nature
and extent of surface soil contamination around impact areas to include the sampling strategy
and analytical methods best suited to this application.
(2) Provide source term estimates for post blast residues based on the extent of surface soil
contamination and the attributes of dissolution and release to fate and transport processes.
(3) Provide new data for the relevant environmental processes controlling the fate and transport
of residues of high explosives on ranges.
Summary of previous year (FY00) results
Three training areas were sampled at Fort Lewis, WA; an impact area within the hand grenade
range, a 105-mm howitzer firing point, and a portion of the impact area within the heavy artillery and
mortar ranges. A set of eleven water samples from monitoring wells and seeps adjacent to the artillery

19
impact area were also analyzed. Soil samples were also collected at a hand grenade range at Fort
Richardson, AK.
RDX was detected in all 96 soil samples, both surface and shallow subsurface, at the two hand
grenade ranges. Concentrations in surface soils ranged up to 51,200 :g kg-1 at Fort Lewis, and 518 :g kg-
1 at Fort Richardson. TNT and HMX concentrations were also detectable in most soils from these two
grenade ranges. Whether these residues are a result of the large number of high-order detonations of hand
grenades, or the much lower number of low-order detonations is uncertain. Overall, concentrations of
explosives-related contaminants were an order of magnitude higher at the Fort Lewis than at the Fort
Richardson hand grenade range. This may be due to higher use at Fort Lewis. While RDX concentrations
were moderate, removal of the contaminant to prevent potential groundwater contamination would not be
difficult because these ranges are relatively small.
At the Fort Lewis artillery range where surface and near surface soil samples were collected at a
105-mm howitzer firing point, 2,4DNT, a component of the single-based propellant, was found at
concentrations as high as 237,000 :g kg-1. Whether 2,4DNT is leaching deeper into the soil profile is
uncertain, because only two shallow subsurface samples were analyzed.
In the artillery range impact area at Fort Lewis, concentrations of explosives residues associated
with craters formed by high order detonations were very low, often below a detection limit of 1 :g kg-1 (1
part per billion). RDX, the analyte of most concern for groundwater contamination, was always less than
100 µg kg-1 (ppb) in these soil samples. Concentrations of TNT were extremely high (1.5%) in the surface
soil under a 155-mm round that had undergone a low-order detonation, and remained substantial in soils
collected beneath this round at 5- and 10-cm depths. Clearly, the residues of explosives resulting from
low-order detonations are many orders of magnitude higher than those that result from high-order
detonations. Therefore, efforts should be made to locate and eliminate the main charge debris resulting
from low-order detonations.
Results of analysis of water samples obtained from 5 monitoring wells and 5 seeps that border the
artillery range at Fort Lewis indicated a low level of RDX contamination (<1 ppb). The source of this
contamination is uncertain. Results from Fort Lewis and Fort Richardson suggest that very low
concentrations of explosives residues are widespread at testing and training ranges. The use of an
analytical method that has lower detection limits than the current standard method for explosives residues,
SW846 Method 8330 (USEPA 1994), detection limit of 250 µg kg-1, allowed delineation of

20
contamination at training ranges. The GC-ECD method developed recently by Walsh and Ranney (1999)
has detection limits near 1 :g kg-1 for many explosives residues and is particularly appropriate for use in
range characterizations studies.
The distribution of explosives residues at all the ranges investigated was spatially very
heterogeneous. Concentrations of explosives-related compounds in soils collected less than a meter apart
differed by over two orders of magnitude at hand grenade ranges, and by as much as an order of
magnitude at artillery firing points. The spatial heterogeneity at artillery impact areas was large as well,
although difficult to define numerically since many of the concentrations were below detection limits.
Areas that were visibly free of craters, however, often exhibited explosives concentrations as high as or
higher than soils collected from the rim of a fresh crater. Thus sampling methods, such as compositing in
order to provide representative samples for a given area, may be extremely important for optimizing
impact range characterization.
From preliminary estimates of residues produced from high order detonations and the frequency
of low-order detonations, low-order detonations seem to contribute a significant portion of the residues
deposited on surface soils in artillery impact areas. Development of better estimates of the residues
produced from detonations of various military munitions is crucial. Development of these estimates is
proposed under the addition to this project.
Examination of existing environmental transport parameter data showed that process information
was almost totally lacking on nitrobenzene, tetryl, nitroglycerin, and PETN. Process information on
2,4DNT, 2,6DNT, 1,3,5DNT, 1,3DNB, 3,5DNA, and picric acid were incomplete. Process information
for 2,4DNT, 2,6DNT, 1,3,5DNT, and 1,3DNB were obtained during this and the IRRP studies. Results
for transformation rate and adsorption coefficients indicate that 2,4DNT, 2,6DNT, 1,3,5TNB, and
1,3DNB disappear faster and adsorb more in surface than in aquifer soils.
Dissolution kinetics showed that the surface area estimation procedures were reproducible and
accurately estimated the surface area of different amounts of explosives. Increased temperature and stir
rate resulted in increased dissolution rates for TNT, RDX, and HMX. Dissolution rates for TNT, RDX,
and HMX decreased in the order TNT>HMX>RDX at 10oC and 150 rpm. This indicates that TNT will be
mobilized faster than RDX and HMX. However, this does not mean that higher concentrations of TNT
than RDX or HMX will be observed in groundwater. That will depend on the relative stability of the
compounds once they are exposed to soils. TNT is less stable in soil than is RDX or HMX.

21
References AMEC. 2001. Impact Area Groundwater Study Program (IAGWSP), Technical Team Memorandum 01-
6, Central Impact Area Groundwater Report, draft, AMEC Earth and Environment, Inc.,
Westford, MA.
Ainsworth, C. C., Harvey, S. D., Szecsody, J. E., Simmons, M. A., Cullinan, V. I., Resch, C. T., and
Mong, G. H. 1993. Relationship between the leachability characteristics of unique energetic
compounds and soil properties, Final Report, Project Order No. 91PP1800, U. S. Army
Biomedical Research and Development Laboratory, Fort Detrick, Frederick, MD.
Ampleman, G., Thiboutot, S., Désilets, S., Gagnon, A. and Marois, A. 2000. Evaluation of the soils
contamination by explosives at CFB Chilliwack and CFAD Rocky Point, DREV Report TR-
2000-103, Defence Research Establishment Valcartier, Quebec.
Brannon, J. M., Price, C. B., and Hayes, C. A. 1997. Abiotic and biotic TNT transformations, Technical
Report EL-97-3, U. S. Army Engineer Waterways Experiment Station, Vicksburg, MS.
Caton, J. E., Ho, C. -h., Williams, R. T., and Griest, W. H. 1994. Characterization of insoluble fractions
of TNT transformed by composting, Journal of Environmental Science and Health, A29(4):659-
670.
Coleman, N. V., Nelson, D. R., and Duxbury, T. 1998. Aerobic biodegradation of hexahydro-1,3,5-
trinitro-1,3,5-triazine (RDX) as a nitrogen source by a Rhodococcus sp., strain DN22, Soil
Biology and Biochemistry, 308/9:1159-1167.
Comfort, S. D., Shea, P. J., Hundal, L. S., Li, Z., Woodbury, B. L., Martin, J. L., and Powers, W. L. 1995.
TNT transport and fate in contaminated soil, Journal of Environmental Quality, 24:1174-1182.
Crawford, R. L. 1995. Biodegradation of nitrated munitions compounds and herbicides by obligately
anaerobic bacteria, Biodegradation of Nitroaromatic Compounds, J. C. Spain, ed., Plenum Press,
NY, 87-98.
Dubé, P., Ampleman, G., Thiboutot, S., Gagnon, A. and Marois, A 1999. Characterization of potentially
explosives-contaminated sites at CFB Gagetown, 14 Wing Greenwood and CFAD Bedford,
DREV Report TR-99137, Defence Research Establishment Valcartier, Quebec.
Funk, S. B., Roberts, D. J., Crawford, D. L., and Crawford, R. L. 1993. Initial-phase optimization for
bioremediation of munition compound-contaminated soils, Applied and Environmental
Microbiology, 597:2171-2177.
Haderlein, S. B., Weissmahr, K. W., and Schwarzenbach, R. P. 1996. Specific adsorption of nitroaromatic
explosives and pesticides to clay minerals, Environmental Science and Technology, 30:612-622.

22
Hale, V. Q., Stanford, T. B., Taft, L. G. 1979. Evaluation of the environmental fate of munition
compounds in soil, Final Report AD-A082874, U. S. Army Medical Research and Development
Command, Fort Detrick, Frederick, MD.
Hawari, J., Halasz, A., Sheremata, T., Beaudet, S., Groom, C., Paquet, L., Rhofir, C., Ampleman, G., and
Thiboutot, S. 2000. Characterization of metabolites during biodegradation of hexahydro-1,3,5-
trinitro-1,3,5-triazine (RDX) with municipal anaerobic sludge, Applied and Environmental
Microbiology, 66:2652-2657.
Jenkins, T. F., Walsh, M. E., Thorne, P. G., Thiboutot, S., Ampleman, G., Ranney, T. A., and Grant, C. L.
1997. Assessment of sampling error associated with the collection and analysis of soil samples at
a firing range contaminated with HMX, Special Report 97-22, U. S. Army Cold Regions
Research and Engineering Laboratory, Hanover, NH.
Jenkins, T. F., Walsh, M. E., Thorne, P. G., Miyares, P. H., Ranney, T. A., Grant, C. L., and Esparza J.
1998. Site characterization at the inland firing range impact area at Fort Ord, Special Report 98-9,
U. S. Army Cold Regions Research and Engineering Laboratory, Hanover, NH.
Kaplan, D. L. 1993. Biotechnology and bioremediation for organic energetic compounds, in Organic
Energetic Compounds, Paul Marikas, ed., Nova Science Publishers, Inc., NY.
Kaplan, D. L., and Kaplan, A. M. 1982. Thermophilic biotransformations of 2,4,6-trinitrotoluene under
simulated composting conditions, Applied and Environmental Microbiology, 44(3), 757-760.
Leggett, D. C. 1985. Sorption of military explosive contaminants on bentonite drilling muds, CRREL
Report 85-18, U. S. Army Cold Regions Research and Engineering Laboratory, Hanover, NH.
Lewis, T. A., Goszczynski, S., Crawford, R. L., Korus, R. A., and Admassu, W. 1996. Products of
anaerobic 2,4,6-trinitrotoluene (TNT) transformation by Clostridium bifermentans, Applied and
Environmental Microbiology, 62:4669-4674.
McCormick, N. G., Cornell, J. H., and Kaplan, A. M. 1981. Biodegradation of hexahydro-1,3,5-trinitro-
1,3,5-triazine, Applied and Environmental Microbiology, 42(5):817-823.
McCormick, N. G., Cornell, J. H., and Kaplan, A. M. 1985. The anaerobic biotransformation of RDX,
HMX, and their acetylated derivatives, Technical Report 85-007, U. S. Army Natick Research,
Development and Engineering Center, Natick, MA.
McCormick, N. G., Feeherry, F. E., and Levinson, H. S. 1976. Microbial transformation of 2,4,6-
trinitrotoluene and other nitroaromatic compounds, Applied and Environmental Microbiology,
31(6):949-958.
Myers, T. E., Brannon, J. M., Pennington, J. C, Townsend, D. M., Davis, W. M., Ochman, M. K., Hayes,
C. A., and Myers, K. F. 1998. Laboratory studies of soil sorption/transformation of TNT, RDX,
23
and HMX, Technical Report IRRP-98-8, U. S. Army Engineer Waterways Experiment Station,
Vicksburg, MS.
Pennington, J. C., Brannon, J. M., Gunnison, D., Harrelson, D. W., Zakikhani, M., Miyares, P., Jenkins,
T. F., Clarke, J., Hayes, C., Ringleberg, D., and Perkins, E. 2001. Monitored natural attenuation
of explosives, Soil and Sediment Contamination: An International Journal, Natural Attenuation
Special Issue, January, 2000.
Pennington, J. C., Hayes, C. A., Myers, K. F., Ochman, M., Gunnison, D., Felt, D. R., and McCormick,
E. F. 1995. Fate of 2,4,6-trinitrotoluene in a simulated compost system, Chemosphere, 30:429-
438.
Pennington, J. C., Honeycutt, M. E., Li, A. Z., Thorne, P. G., Felt, D. R., Allersmeier, D. R., Jarvis, A. S.,
Marx, K. A., Leggett, D. C., Hayes, C. A., McFarland, V. A., Walker, J., Porter, B. E., Kaplan, D.
L., Gunnison, D., Fredrickson, H., and Thorn, K. A. 1997. Explosives conjugation products in
remediation matrices, Technical Report SERDP-97-7, U. S. Army Engineer Waterways
Experiment Station, Vicksburg, MS.
Pennington, J. C., and Patrick, W. H., Jr. 1990. Adsorption and desorption of 2,4,6-trinitrotoluene by
soils, Journal of Environmental Quality, 19:559-567.
Pennington, J. C., Thorn, K. A., Gunnison, D., McFarland, V. A., Thorne, P. G., Inouye, L. S.,
Fredrickson, H., Leggett, D. C., Ringleberg, D., Jarvis, A. S., Felt, D. R., Lutz, C. H., Hayes, C.
A., Clarke, J. U., Richmond, M., O’Neal, B., and Porter, B. E. 1998. Explosives conjugation
products in remediation matrices: Interim Report 2, Technical Report SERDP-98-12, U. S. Army
Engineer Waterways Experiment Station, Vicksburg, MS.
Price, C. B., Brannon, J. M., and Hayes, C. 1997. Effect of redox potential and pH on TNT transformation
in soil-water slurries, Journal of Environmental Engineering, 123:988-992.
Price, C. B., Brannon, J. M., and Yost, S. 1998. Transformation of RDX and HMX under controlled
Eh/pH conditions, Technical Report IRRP-98-2, U. S. Army Engineer Waterways Experiment
Station, Vicksburg, MS.
Regan, K. M., and Crawford, R. L. 1994. Characterization of Clostridium bifermentans and its
biotransformation of 2,4,6-trinitrotoluene (TNT) and 1,3,5-triaza-1,3,5-trinitrocyclohexane,
(RDX), Biotechnology Letters, 1610:1081-1086.
Riefler, R. G., and Smets, B. F. 2000. Enzymatic reduction of 2,4,6-trinitrotoluene and related
nitroarenes: Kinetics linked to one-electron redox potential, Environmental Science and
Technology, 34:3900-3906.

24
Ro, K. S., Venugopal, A., Adrian, D. D., Constant, D., Qaisi, K., Valsaraj, K. T., Thibodeaux, L. J., and
Roy, D. 1996. Solubility of 2,4,6-trinitrotoluene (TNT) in water, Journal of Chemical
Engineering Data, 41:758-761.
Selim, H. M. and Iskandar, I. K. 1994. Sorption-desorption and transport of TNT and RDX in soils,
CRREL Report 94-7, U. S. Army Cold Regions Research and Engineering Laboratory, Hanover,
NH.
Selim, H. M., Xue, S. K., and Iskandar, I. K. 1995. Transport of 2,4,6-trinitrotoluene and hexahydro-
1,3,5-trinitro-1,3,5-triazine in soils, Soil Science, 160:328-339.
Spanggord, R. J., Mabey, W. R., Mill, T., Chou, T. W., Smith, J. H., Lee, S., Robert, D. 1983.
Environmental fate studies on certain munitions wastewater constituents, LSU-7934, AD-
A138550, SRI International, Menlo Park, CA.
Taylor, C. A., and Rinkenbach, W. H. 1923. The solubility of trinitrotoluene in organic solvents, Journal
of the American Chemical Society, 45:44-59.
Thiboutot, S. and G. Ampleman. 2000. Characterization of an UXO impacted range (Tracadie Range) for
potential contamination by energetic materials, Proceeding of the Fifth International Symposium
and Exhibition on Environmental Contamination in Central and Eastern Europe, Prague, Czech
Republic, Sept 2000.
Thiboutot, S., Ampleman, G., Dubé, P., Hawari, J., Spencer, B. and Paquet, L. 1997. Protocol for the
characterization of explosives-contaminated sites, DREV-R-9721, Defence Research
Establishment, Valcartier, Quebec.
Thiboutot, S., G. Ampleman, A. Gagnon, A. Marois, T. F. Jenkins, M. E. Walsh, P. G. Thorne and T. A.
Ranney. 1998. Characterization of antitank firing ranges at CFB Valcartier, WATC Wainwright
and CFAD Dundurn, DREV-R-9809, Defence Research Establishment, Valcartier, Quebec.
Thiboutot, S., Ampleman, G., Gagnon, A. and Marois, A. 2000. Characterization of an unexploded
ordnance contaminated range (Tracadie Range) for potential contamination by energetic
materials, DREV Report TR-2000-102, Defence Research Establishment Valcartier, Quebec.
Townsend, D. M., Myers, T. E., and Adrian, D. D. 1995. 2,4,6-Trinitrotoluene (TNT)
transformation/sorption in thin-disk soil columns, Technical Report IRRP-95-4, U. S. Army
Engineer Waterways Experiment Station, Vicksburg, MS.
Thorn, K. A. 1997. Covalent binding of the reductive degradation products of TNT to humic substances
examined by N-15 NMR, American Chemical Society Abstracts, 37:305-306.

25
Thorne, P. G., and Leggett, D. C. 1997. Hydrolytic release of bound residues from composted soil
contaminated with 2,4,6-trinitrotoluene, Environmental Toxicology and Chemistry, 16(6):1132-
1134.
U. S. Army Center for Health Protection and Preventative Medicine. (in press) Geohydrologic Study No.
38-EH-8879-99, Training range site characterization and risk screening, Camp Shelby, MS, 7-23
September 1999.
U. S. Environmental Protection Agency. 1994. Nitro aromatics and nitramines by HPLC, 2nd update,
SW846, Method 8330, September 1994, Office of Solid Waste and Emergency Response,
Washington, DC.
U. S. Environmental Protection Agency. 2000. Administration Order for Response Action EPA Docket
Number SDWA-1-2000-0014 USEPA Region 1 in the Matter of Training Range and Impact
Area, Massachusetts Military Reservation, January, 2000.
Xue, S. K., Iskandar, I. K., and Selim, H. M. 1995. Adsorption-desorption of 2,4,6-trinitrotoluene and
hexahydro-1,3,5-trinitro-1,3,5-triazine in soils, Soil Science, 160:317-327.
26
2 Characterization of Explosives Contamination at Military Firing Ranges:
Yakima Training Center, Washington Camp Guernsey, Wyoming
Introduction Background In the first year of this project, training ranges at Ft. Lewis, WA, were sampled to assess the
potential for contamination of groundwater with explosives-related contaminants on military training
ranges (Jenkins et al. 2001, Pennington et al. 2001). This included surface soil samples collected at three
functional areas within the Ft. Lewis range complex; a hand grenade range impact area, a firing point for
105-mm howitzers, and a portion of the artillery and mortar impact area. Groundwater was sampled from
monitoring wells and seepage areas around the periphery of the artillery range. Historical firing records
from an electronic database were reviewed to determine the kinds of munitions items that had been fired
on the heavy artillery range over time. Surface soil samples were also collected from a second hand
grenade range at Ft. Richardson, Alaska. All of these samples were analyzed for the presence of
explosives residues using a new GC-ECD method (SW846 Method 8095, USEPA 1999, Draft) that
provides detection limits about two orders of magnitude lower than SW846 Method 8330 (USEPA 1994),
the method commonly used for the analysis of explosives in soil and water.
RDX was detected in all of the soil samples, both surface and shallow subsurface, at both hand
grenade ranges. Concentrations in surface soils ranged up to 51,200-µg kg-1 at Fort Lewis, and 518-µg
kg-1 at Fort Richardson. TNT and HMX were also detectable in most soils from these two grenade ranges.
Recent results from detonations of hand grenades on a snow-covered range suggest that these residues
were not due to high order detonation of grenades that functioned as engineered, but to the relatively few

27
low-order detonations of grenades that did not detonate when thrown and were subsequently detonated by
EOD personnel. Overall, concentrations of explosives-related contaminants were an order of magnitude
higher at the Fort Lewis grenade range than at the Fort Richardson grenade range, probably due to higher
usage of the Fort Lewis range. While RDX concentrations were moderate, removal of the contaminant to
prevent potential groundwater contamination should not be difficult because the size of ranges,
particularly compared with the artillery range impact areas, are quite small.
At the Ft. Lewis artillery range, surface and near surface soil samples were collected at a 105-mm
howitzer firing point and in the main impact area. At the firing point, samples were collected in front of
two howitzers that had each fired about 600 rounds from the same position. Samples were collected at
distances out to 10m and 20m for the two guns. Overall, 2,4-DNT, a component of single-based
propellant was found at concentrations as high as 237,000 µg/kg in surface soil.
At the Fort Lewis artillery range impact area, soil samples were collected in and around craters
formed by detonation of various artillery and mortar rounds. Concentrations of explosives residues
associated with these high order detonations were very low, often below a detection limit of 1 µg/kg (1
part-per-billion). RDX, the analyte of most concern for groundwater contamination, was always less than
100 µg/kg in these soil samples.
Soil samples were also collected under and adjacent to a l55-mm round that had undergone a low-
order detonation. In this case, the concentration of TNT was extremely high in the surface soil under the
round (1.5%) and was still substantial in soils collected at 5- and 10-cm depths. Residues of explosives
resulting from low-order detonations are many orders of magnitude higher than residues that result from
high-order detonations.
Results of analysis of the water samples obtained from 5 monitoring wells and 5 seeps that border
the artillery range at Fort Lewis indicated a low level (<1 µg/L) of RDX contamination (Jenkins et al
2001, Pennington et al. 2001). The source of this contamination was not determined. Results of soil
analyses from Fort Lewis and Fort Greeley indicate that very low concentrations of explosives residues
are more widely spread at testing and training ranges than observed previously (Jenkins et al 2001,
Pennington et al. 2001, Walsh et al. 2001). The use of an analytical method that has lower detection
limits than the current standard method for explosives residues, SW846 Method 8330 (USEPA 1994),
detection limit of 250 µg/kg, allowed delineation of contamination at training ranges. The GC-ECD
method developed recently by Walsh and Ranney (1999) has detection limits near 1 µg/kg for many
explosives residues and is particularly appropriate for use in range characterization studies. Method 8330

28
has been adequate for characterization of explosives contamination at Army ammunition plants and
depots, where concentrations were much higher, but these limits may be inadequate to delineate
contamination at many areas within training ranges.
The distribution of explosives residues at all the ranges investigated was spatially very
heterogeneous. Concentrations of explosives-related compounds in soils collected less than a meter apart
at hand grenade ranges differed by over two orders of magnitude. At artillery firing points,
concentrations of propellant residues differed by as much as an order of magnitude over the same
distance. At artillery impact areas, the spatial heterogeneity was large as well, although it is difficult to
define numerically since many of the concentrations were below detection limits. Concentrations of
explosives residues for soils collected in areas that were visibly free of craters, however, often had
explosives concentrations as high or higher than soils collected from the rim of a fresh crater. Thus site
characterization using discrete samples will not provide representative samples even over fairly small
areas, and a sampling strategy employing multi-increment (or composite) samples will be necessary to
provide quality data for making important range management and /or remediation decisions.
Objectives
The overall objective of the range characterization portion of this project was to assess the
potential for contamination of groundwater with explosives-related contaminants on military training
ranges. Objectives for the FY 2001 study were to sample two additional installations with various types of
range activities. This was to include both firing points and impact areas for artillery and mortars, and an
antitank firing range. A specific objective was to test the use of composite sampling as a means of
collecting representative samples in areas with various contamination sources. An addition objective was
to determine whether surface intact and ruptured UXO items were localized contamination sources at the
various types of ranges. These sampling studies at firing points and impact ranges will also be used to
determine if the conclusions obtained at the Fort Lewis artillery ranges can be generalized to other sites.
Yakima Training Center, WA Location Yakima Training Center occupies most of the land between the Columbia River and Interstate
Highways 90 and 82, in central Washington state (Figure 1). The 510-square-mile facility includes one of
the two largest unaltered shrub-steppe habitats in Washington state (the other is the Hanford Reservation).
Shrub-steppe in Washington is characterized by generally dry areas of sagebrush and bunchgrass. Military

29
training has taken place at the center since 1942. The climate is arid with an annual rainfall of 7.9 inches,
measured in the city of Yakima.
Approach Surface soils were sampled at several different types of ranges at YTC in May 2001. These
locations include the following: a firing point and an impact area at an antitank range, firing points and
impact areas for 155-mm howitzers, a firing point for the 120-mm main tank gun, and the detonation
point for a Claymore mine. Surface water samples were collected at several points where surface streams
were found either in or on the boundary of the Central Impact Area. Several potable water wells were also
sampled.
Antitank range Initial sampling was conducted at Range 7, which is used for practice with light anti armor
weapons (LAW), AT-4 antitank rockets, and 40-mm grenades, including those filled with high explosives
(HE). Soil sampling at this site included surface composite samples and discrete samples from the
surface to depths as deep as 15 cm. Surface samples were collected from 0–1 cm.
The area around one of the most heavily impacted targets, an armored personnel carrier (APC),
was selected for intensive sampling (Figure 2). Duplicate surface composite samples were collected
around the perimeter of this target within distance intervals from the edge of the APC of 0-2m, 2-5m, 5-
10m and 10-15m (Figure 3). Discrete surface and shallow subsurface samples (to 5 cm) were also
collected at several points within this area. Discrete and shallow subsurface samples were also collected
next to an intact 40-mm (HE-filled) grenade, and a cracked HE-filled LAW rocket (Figure 4). Duplicate
surface composite soil samples were collected in an area 5–10 m in front of the firing point for LAW and
AT-4 rockets at Range 7.
Multi-Purpose Range Complex, 120-mm tank firing point The next range sampled was referred to as the Multi-Purpose Range Complex (MPRC). This
range is set up as a battle run for tanks. The main tank gun (120-mm) was fired at several fixed positions
against an array of moving targets (Figure 5). One of the fixed firing points at this range was sampled as
shown in Figure 6. Surface composite, surface discrete, and several shallow subsurface discrete samples
(1–2 cm) were collected for this firing point, up to 75 m from the muzzle position. Apparently, both
single- and double-based propellants are used with this weapon.

30
155-mm howitzer firing points
Several firing point positions recently used for practice firing of 155-mm howitzers were visually
inspected. The gun positions used at these firing points were located by finding the disturbed soils
resulting from the rear spades that are used to absorb the gun recoil. Several of these gun positions were
clearly identifiable by the deep indentations in the soil. Based on the dimensions of the howitzers, the
position of the muzzle and the direction of fire were estimated. From the soil conditions and information
from range control, these firing activities were determined to have occurred within the past several
months.
Surface composite samples were collected in several zones at distances of 5, 10, 20 and 50 meters
for one gun position as shown in Figure 7. Discrete surface and shallow subsurface samples (as deep as 5
cm) were also collected as shown. Duplicate surface soil composites were collected in an identical
pattern at a second gun position. No discrete samples were collected at this position.
Apparently, both single- and triple-based propellant are used for 155-mm howitzers. The major
component of single-based propellant is nitrocellulose, while 2,4DNT is used as a plasticizer. The major
components of triple-based propellants are nitrocellulose, nitroglycerine (NG), and nitroguanidine.
A set of composite and discrete samples were also collected at the recently used firing point of a
M 198 (155-mm) direct fire gun. Four composite and 12 discrete surface samples were collected as
shown at distances as great as 32 m from the firing pad (Figure 8).
Mortar firing point A portion of the range used for practice firing of various types of mortars was sampled. As with
the artillery firing points, the exact positions of individual mortars were unknown. Visual reconnaissance
was used to locate and identify an individual position, which appeared to be a firing position for an 81-
mm mortar. Figure 9 shows the exact layout for surface composite and discrete samples collected at this
site. Samples were collected as far as 20 m from the firing point at this location. The double-based
propellant for 81-mm mortars is composed of 57.75% nitrocellulose, 40.0% NG, 1.5% potassium nitrate
and 0.75% ethyl centralite (diethyldiphenyl urea
HEP 105-mm round Two discrete samples were collected under a HEP (high explosive plastic) 105-mm round that

31
was found between OP-1 (observation point 1) and OP-2. The first sample was collected directly under
the round (0–1 cm) and the second was collected at the 1–2 cm depth. It appeared that the round had been
blown in place using C4, but was not totally destroyed.
Central impact area Several sets of samples were collected in areas that had recently been targeted with 155-mm
howitzer fire in the Central Impact Area. The first area was within an old bomb crater and around a
recent 155-mm crater that was 9 meters from a tank target (Figure 10). Four discrete samples were
collected around the crater rim at the cardinal directions. Duplicate surface composites were collected
around the perimeter of the crater, 1-m from the edge of the rim.
A second set of samples was collected around the rim of a single 155-mm crater. Four discrete
surface samples were collected as discussed above. Four composite samples were also collected at
distances as far as 8 m from the center of the crater (Figure 11).
Several discrete samples were collected near a 155-mm white phosphorus (WP) dud and near a
new 155-mm HE (intact) round. A discrete surface soil sample and two depth samples (as deep as 5 cm)
were collected in the area of a 155-mm low order illumination round. A corroded 105-mm dud was also
observed in this area as well. Surface discrete samples were collected next to the nose and tail of this
round.
A discrete sample was collected in the center and four discrete samples were collected around the
rim of a 155-mm crater. Two discrete surface samples were collected next to an illumination round
located next to the 155-mm crater (Figure 12). Five discrete samples were collected around a second
crater in an identical manner. One composite sample was collected in a 1-m perimeter around this second
crater (Figure 13).
Four discrete surface samples and a single composite sample were collected near a ruptured 81-
mm illumination mortar round in a crater. One surface sample was collected under the round.
32
Claymore mine detonation area The final area sampled at YTC was on the edge of the central impact area where a Claymore mine
had been detonated within the previous week. Four composite and 12 discrete surface samples were at
distances as great as 30 m from the point of detonation (Figure 14).
Water sampling
Three potable water wells and three surface water locations were sampled. The potable water
wells included one inside the pump house near Yakima Research Station, one at the intersection of
Training Areas 2A and 3B, and one at the intersection of Training Areas 8B and 11B. These were
sampled by tapping the spigots. Surface water was sampled at Selah Creek in Range 10, in Lmumma
Creek just off the road at the northwestern edge of Range 19, and in Lmumma Creek on the Central
Impact Area near the lowest point on the range in a stand of willows and reeds. Surface water was
sampled by placing the sample container into the stream. Samples were collected in a single 4-L brown
glass bottle, thoroughly mixed, and subdivided into separate bottles already containing appropriate
preservatives for the specific analyses (analytical chemistry described under Materials and Methods). The
subsamples were distributed as follows: two 1-L samples for explosives; a 500-mL sample for
nitrate/nitrite, total organic carbon, total iron, calcium, magnesium and manganese; and a 100-mL sample
for sulfate and chloride.
Camp Guernsey, WY Location and setting Camp Guernsey has been a component of the Wyoming National Guard since 1939. It is located
in Southeastern Wyoming on the North Platte River about 90 miles north of Cheyenne. It encompasses
about 34,000 acres of which 31,360 acres are available for training. The climate in the summer is
generally dry with warm days and cool nights. The total annual precipitation is 9 inches with 70% of that
falling during the growing season. The terrain consists of rolling hills covered with blue gramma, buffalo
grass and sagebrush. The soil is predominantly sandy loam. The elevation ranges from 4300 to 5280
feet.
Soil sampling at Camp Guernsey was concentrated at the artillery impact area and was conducted
the week of September 17, 2001 (Figure 15), and at an artillery firing point where 155-mm howitzers
were fired on October 1, 2001. Surface water samples were also collected on September 24, 2001.

33
Approach Just before our sampling activities the artillery range had been used for training by various units
with 155-mm howitzers using HE, WP and illumination rounds. Several unexploded 155-mm rounds of
various types were found and identified by EOD personnel from the Wyoming National Guard.
Artillery impact area There are a number of individual targets in the artillery impact area at Camp Guernsey. These
targets are vehicles of various types (trucks, armored personnel carriers, etc.) and were used primarily for
target practice using 155-mm howitzers and various types of mortars. One truck target was selected at
random which appeared to have been used to about the same degree as others within the area based on
debris and target damage (Figure 16).
Duplicate surface composite samples were collected in an elliptical pattern at distances averaging
1, 5, 10 and 15±1 m from the truck target. Each composite sample was made up of 30 individual
increments collected within the top 1.0 cm of soil. Discrete surface and shallow subsurface soil samples
were also collected at 1, 5, 10 and 15 m from the target. The depths of individual samples were in most
cases 0-1 cm, 1-5 cm, 5-10 cm, and 10-15 cm.
A set of core samples was collected at depths from the surface to 16 cm adjacent to a broken 155-
mm round.
Low order rounds and a low order 500-lb bomb Perimeter composite samples were collected as described above at distances of 3, 5, and 10
meters from an unexploded 155-mm HE round (UXO 1). Duplicate discrete samples were also collected
at these same distances from the round; duplicates were collected a meter apart.
Discrete and composite samples were collected in an identical manner around a second
unexploded 155-mm round (UXO 2) and around an unexploded 81-mm mortar round and a 155-mm
round lying together (UXO 3).
Soil samples were collected around a low-order 500-lb bomb (Mark 82) estimated by personnel
from the Wyoming National Guard to have been on site for at least 2 years (Figure 17). The explosive

34
that remained in the bomb (estimated at 50 lb) had turned red in the sun suggesting that the main charge
was TNT. Reddish colored surface soil was observed in several locations at distances as far as 4.7 meters
from the bomb. Discrete surface and subsurface soil samples were collected in areas where the reddish
colored soils were observed. Composite soil samples were also collected around the perimeter of this
low-order detonation at 3, 5, and 10 meters from the bomb.
Blow-in-place of UXO items and low order 500-lb bomb After the soil samples were collected around these items, a team of personnel from the Wyoming
National Guard and Special Forces 3rd BN 10th SFG (A) detonated UXO 1, 2, and 3 and the low order
500-lb bomb on the afternoon of 19 September. For UXO 1 and 2, two 1.25-lb blocks of C4 were used.
For UXO 3, four C4 blocks were used, and for the 500-lb bomb, three C4 blocks were used.
The following morning duplicate composite and discrete soil samples were collected in and
around the craters formed from these detonations. For UXO 1, surface composites were collected around
the perimeter of the crater at distances of 3, 5, and 10 meters. Discrete surface samples were collected in
the center and around the perimeter of the crater at 70 cm (four samples in the cardinal directions).
Duplicate surface discrete samples were also collected at 3, 5, and 10 m southwest of the center of the
crater as described above.
At the craters formed from the detonation of UXOs 2 and 3, duplicate surface composites were
collected at 3, 5 and 10 meters. Discrete surface samples were collected around the crater, either 50 cm or
1.5 m from the center and duplicate discrete samples were collected at 3, 5, and 10 meters as described
above.
For the crater formed from the detonation of the bomb, duplicate surface composite samples were
collected at distances of 3, 5, and 10 meters from the crater. Surface discrete samples were collected at
the center of the crater and around the rim in the four cardinal directions. Duplicate discrete samples
were also collected at 3, 5, and 10 m south of the crater. A set of 7 discrete samples was collected using a
wheel pattern (4 ft diameter) centered at 3.5 m southeast of the crater (Figure 18) (Jenkins et al. 1997a).

35
Artillery firing points Since no firing activity took place during the week we sampled at Camp Guernsey, Col. Joe
Michaels, Facility Manager at Camp Guernsey, volunteered to collect soil samples before and after firing
of 155-mm howitzers using our sampling design (Figure 19). This activity was conducted two weeks
after the primary sampling event.
To collect firing point samples, two gun positions were set and centerlines established from the
muzzle in the direction of fire. A set of duplicate composite surface soil samples were collected for each
gun position, prior to firing, perpendicular to the center line at distances 0, 5, 10, 20, and 50 meter from
the muzzle. The 0-m samples were collected at a distance of three meters on both sides of the centerline.
The 5- and 10-m samples were collected five meters on both sides of the centerline, and the 20- and 50-m
samples were collected 10 m on both sides of the centerline. At least 30 increments were collected per
sample.
After the three 155-mm howitzer battery had fired 43 rounds, samples were collected in an
identical manner in front of both guns. All rounds fired used green bag charge 3 (D540 M3), single-based
propellant. Samples were shipped on ice to CRREL by overnight carrier.
Surface water sampling
Surface water samples were collected at the same sites included on the facility routine monitoring
plan. These included the following springs: Deer Corn and Ryan Springs in the North Training Area,
Sawmill Springs in Sawmill Canyon just northwest of the Artillery Range Impact Area, and Pet Springs
just south of the Artillery Range Impact Area (Figure 15).
Materials and Methods Soil sample collection and shipment All surface composite soil samples at YTC and CG were collected using stainless steel hand
shovels, which were carefully wiped with clean towels, washed with acetone, and air dried between
samples. Each sample was composed of at least 30 individual increments collected randomly within the
area sampled. Individual increments were collected from 0–1 cm from the surface. As individual
increments were collected, they were placed into polyethylene plastic bags, which were sealed with twist
ties once all increments for a given composite were collected. Each bag was placed in a zip-lock bag and

36
shipped to the laboratory in ice filled coolers (FedEx overnight). Upon arrival at CRREL the samples
were frozen at –30°C until extracted and analyzed.
Surface discrete samples were collected in an identical manner as individual increments for the
composites. Depth samples were collected using a 3/4-inch stainless steel soil corer. Sampling devices
were cleaned as described above between samples. Discrete samples were placed into glass jars, enclosed
within a zip lock bag, shipped to CRREL, and frozen as described above.
Soil extraction Soil samples were allowed to warm to room temperature, and air-dried. Dried soils were either
homogenized within the laboratory, or ground using a Lab Tech ESTA Vibratory Ring Mill (grinding was
conducted by Chuck Ramsey) prior to subsampling. Whether soils were ground or not, subsampling was
conducted by spreading the soil into a thin layer in an aluminum pie pan, mixing thoroughly, and
randomly collecting at least 10 individual portions using a stainless steel spatula to create a 10-g
subsample. Each subsample was placed into a 40-ml glass vial and a 20-ml aliquot of acetonitrile (AcN)
was added. The vials were then individually placed on a vortex mixer for 30 seconds to suspend the soil
particles, and the vials were placed in an ultrasonic bath for 18 hours. The temperature of the bath was
maintained at less than 25°C with cooling water. The vials were then removed from the bath and allowed
to stand undisturbed for at least 30 minutes. For samples to be analyzed by gas chromatography (GC),
the extracts were filtered through a 25-mm Millex-FH (0.45 µm) disposable filter, discarding the first
milliliter and collecting the remainder in a clean autosampler vial. For samples to be analyzed by
reversed-phase high performance liquid chromatography (RP-HPLC), a 1.0-ml portion of the filtered
extract was mixed with 4.0 mL of reagent grade water. These processed extracts were refrigerated until
analyzed. Most samples from YTC and CG were analyzed by GC. High concentration samples were
analyzed by RP-HPLC. The decision on which type of analysis to conduct first was made based on our
knowledge of the concentrations of analytes that would likely be present for a given type of sample. For
instance, results from previous investigations indicated that concentrations of HMX in soil samples from
antitank rocket ranges were often in the 10,000 to 100,000 µg/kg range (Jenkins et al. 1997b; Jenkins et
al. 1998). This is well above the linear range of the GC-ECD detector, but easily analyzed by RP-HPLC-
UV. For artillery ranges, however, results from the work at Ft. Lewis indicated that the concentrations of
explosives in most samples are below 50 µg/kg (Jenkins et al. 2001; Pennington et al. 2001), too low for
RP-HPLC-UV analysis, but detectable using GC-ECD.

37
GC-ECD analysis The autosampler vials containing the acetonitrile soil extracts were placed into GC autosampler
trays that were continuously refrigerated by circulating 0°C glycol/water through the trays. The samples
were injected into an HP-6890 GC equipped with a micro cell Ni63 micro-electron capture detector (GC-
µECD). Results were obtained according to the general procedure outlined in EPA SW846 Method 8095
(EPA 1999, Draft). Direct injection of 1 µL of soil extract was made into a purged packed inlet port
(250°C) equipped with a deactivated Restek Uniliner. Primary analysis was conducted on a 6-m x 0.32-
mm ID fused-silica column, with a 1.5-µm film thickness of 5%-(phenyl)-methylsiloxane (RTX-5 from
Restek, Bellefonte, PA). The GC oven was temperature programmed as follows: 100°C for 2 min,
10°C/min ramp to 260°C, 2-min hold. The carrier gas was helium at 10 mL/min (linear velocity
approximately 90 cm/sec). The ECD makeup gas was nitrogen flowing at 40 mL/min. If a peak was
observed in the retention window for a specific signature compound, the extract was reanalyzed on a
confirmation column, 6 m x 0.53 mm ID having a 0.1-µm film thickness of 50 % cyanopropylmethyl – 50
% phenylmethyl-polysiloxane (RTX-225 from Restek). Further details of the procedure may be found in
SW-846 Method 8095 (USEPA 1999, Draft). If analyte concentrations were within the linear range of the
ECD, concentrations reported were taken from the determination on the primary column, unless there
appeared to be co-elution with another compound. In such cases, reported concentrations were taken from
the determination of the confirmation column. Estimated detection limits for the GC-ECD analysis are
given in Table 1.
RP-HPLC analysis Extracts were also analyzed by RP-HPLC according to the general outline provide in SW846
Method 8330 (USEPA 1994). When samples were analyzed by both GC-ECD and RP-HPLC,
concentrations above 500 µg/kg were taken from the HPLC analysis, which had a higher range of
linearity. RP-HPLC analysis was conducted on either a SpectraSystem AS3000 set at 254 nm, or a
modular system composed of a Spectra-Physics Model SP8800 ternary HPLC pump, a Spectra-Physics
Spectra 100 variable wavelength UV detector set at 254 nm (cell path 1 cm), a Dynatech Model LC241
auto sampler equipped with a Rheodyne Model 7125 sample loop injector, and a Hewlett-Packard 3396A
digital integrator set to measure peak heights. Separations were conducted on a 15-cm × 3.9 mm NovaPak
C-8 column (Waters, Milford, MA) eluted with 85/15 water/isopropanol (v/v) at 1.4 mL/min. Samples
were introduced by overfilling a 100-µL sampling loop. Concentrations were estimated against a
multianalyte standard using peak heights. Estimated detection limits for the RP-HPLC method are
presented in Table 1.

38
Soil geochemistry Selected composite soil samples were analyzed for pH (Mehlich 1984), total Kjeldahl nitrogen
and total organic carbon (TOC) (American Public Health Association 1985), particle-size distribution
(Day 1956 as modified by Patrick 1958, Gee and Bauder 1986), cation exchange capacity (CEC)
(Rhoades 1982), and total iron (Olson and Ellis 1982).
Analyses of water
Laboratory analyses for geochemical parameters included total iron, calcium, magnesium and
manganese (Method 6010, USEPA 1988a), nitrate-nitrite nitrogen (Method 353.2, USEPA 1982), sulfate
(Method 375.2, USEPA 1982), and chloride (Method 325.2, USEPA 1979). Samples for total iron,
calcium, magnesium, and manganese, total organic carbon, and nitrate-nitrite nitrogen were preserved
with 0.4 g NaHSO4 to 250 mL of water. Samples for sulfate and chloride were not preserved.
Analysis of water samples for explosives was conducted by GC-ECD according to SW846
Method 8095 (USEPA 1999, draft). Samples were extracted using solid phase extraction and eluted with
acetonitrile. Extracts were analyzed by GC-ECD as described above. Analytes and method detection
limits are provided in Table 1.
Results and Discussion Yakima Training Center, WA Antitank Range Analytical results from discrete and composite soil samples collected at the antitank firing range
at Yakima Training Center are presented in Table 2. HMX was the analyte found at highest concentration
in nearly every soil sample collected near the armored personnel carrier (APC) target. Mean HMX
surface concentrations in the composite samples collected at distances from the APC decreased from
about 47,000 µg/kg at 0-2 m, to 16,000 µg/kg at 2-5 m, to 6,300 µg/kg at 5-10 m, and to 3,600 µg/kg at
10-15 m. High concentrations of HMX in soils at antitank ranges have been observed at Canadian Force
Base Valcartier (Jenkins et al. 1997b, Thiboutot et al. 1998), Ft. Ord (Jenkins et al. 1998), and at several
other Canadian antitank ranges (Thiboutot et al. 1998). The presence of HMX as the major contaminant at
antitank ranges is consistent with the use of LAW and AT-4 rockets on these ranges. High concentrations
in surface soils are thought to arise due to the high incidence of rupture of these rockets without
detonation, spreading the explosive fill onto the soil. The explosive fill for these rockets is octol, which is

39
70 % military grade HMX and 30 % military grade TNT. According to specification, RDX in military
Grade A HMX cannot exceed 7 %; in Grade B HMX, RDX cannot exceed 2 % (U.S. Army 1984).
The concentration of HMX in shallow subsurface soils is also presented in Table 2. At a distance
of 1 m from the APC, for example, HMX concentrations at depths of 0-1 cm, 1-3 cm, 3-7 cm and 7-10 cm
were 53,500, 18,200, 26,700, and 1,180 µg/kg, respectively. Except for samples collected very close to
the APC (0.5 m), concentrations generally decline substantially in going from the surface to depth. HMX
concentrations in soil collected next to a broken LAW rocket were much higher, ranging from 10,400,000
µg/kg in surface soil, 1,020,000 µg/kg in soil at 2-6 cm depth, and 49,300 µg/kg at a 6-10 cm depth.
Mean RDX concentrations in the surface composite samples decline regularly from 1,930 µg/kg
at a distance of 0-2 m from the target to 88 µg/kg at a distance of 10-15 m. RDX concentrations also
decline with depth. For example, the concentration of RDX in a core sample collected 1 m from the
target decline from 7,070 µg/kg in the surface soil to only 315 µg/kg at a depth of 7-10 cm (Table 2).
Similarly, RDX declines from 45,700 µg/kg at the surface, to 4,760 µg/kg at the 2-6 cm depth, and to
1,530 µg/kg at the 6-10 cm depth for samples collected next to a broken LAW rocket. While RDX
concentrations are generally much lower than HMX, RDX may be of greater concern since RDX has a
higher reported toxicity than HMX and is the contaminant of most concern in the ground water at MMR
(USEPA 1988b, 2000).
In the mean composite samples RDX concentrations range from 1.9 to 6.6 % of the HMX
present. These values are within the range expected if the RDX originated as an impurity in military
grade HMX. However, results from the discrete samples indicate that the percentage of RDX relative to
HMX ranges as high as 121% for surface samples collected about 50 cm from the target. In addition, the
percent of RDX relative to HMX generally increases at depth, probably due to the higher solubility of
RDX relative to HMX (about 60 mg/L for RDX and about 5 mg/L for HMX) (Burrows et al. 1989). Thus
there must be another source of RDX contamination at this range. This source of RDX may be either 40-
mm grenades, which are also fired at this range, or C4, which is used to dispose of duds that are
encountered by EOD personnel. Many 40-mm practice rounds were found on the site as well as one live,
intact 40-mm HE filled grenade (Figure 20).
Despite the high concentration of TNT in octol (30%), concentrations of TNT, and the major
TNT transformation products (4-ADNT and 2-ADNT), were much lower than either HMX or RDX in the
antitank ranges soils. The exception was for a soil sample collected next to a ruptured LAW rocket where

40
TNT was present at very high concentration (358,000 µg/kg) and the HMX/TNT ratio was only slightly
lower than that in octol. Generally the concentrations of TNT, 4ADNT, and 2ADNT were below RP-
HPLC detection limits of about 100 µg/kg. These antitank range soils were not analyzed by GC-ECD due
to the very high HMX and RDX concentrations, which could contaminate the injector and electron
capture detector, and result in excessive instrument down time. The much lower TNT concentration in
these soils, relative to HMX, is consistent with results from the Arnhem antitank range at CFB Valcartier
(Jenkins et al. 1997b) and the antitank range at Ft. Ord (Jenkins et al. 1998). This is likely due to
environmental transformation of TNT to its mono amino derivatives (4ADNT and 2ADNT) and
subsequent humification of these compounds (Thorne and Leggett 1997). Under the aerobic conditions
generally present in surface soils in the arid environment at Yakima, HMX and RDX will not be subject
to these types of degradative processes. In addition, HMX and RDX have lower water solubilities than
TNT, dissolve much slower into water than TNT, and hence a greater percentage remains at the surface
where they were deposited (Lynch et al. 2001).
Relatively low concentrations of 2,4DNT (generally less than 100 µg/kg) were detectable in
composite samples near the tank target. Concentrations were higher than those found for TNT in many of
these samples. Initially its source was attributed to single based propellant where it is used as a
plasticizer. However, the concentrations of 2,4DNT in surface composites near the firing point were
either below or just above the detection limit (about 1 µg/kg). Therefore, it does not appear that
propellant can be the source of 2,4DNT in this case.
Nitroglycerine (NG) was also found in all of the composite and in several discrete samples
collected near the target area of the antitank range. In the composite samples, however, the NG was
distributed differently than the HMX. For example, there is no apparent concentration decrease as sample
distances from the target increases. Unlike 2,4DNT the source of the NG is probably the propellant used
for the antitank rockets which is triple based and contains about 20% NG. In previous studies of antitank
ranges, data were not reported for NG (Jenkins et al. 1997b, Thiboutot et al. 1998). However, when GC-
ECD chromatograms for samples from the Arnhem range at CFB Valcartier were re-examined, peaks for
NG were observed. Therefore, NG is likely to be present at other antitank ranges as well.
Two composite surface soil samples were also collected 5-10 m in front of the LAW and Rocket
firing points (Table 2). This location was at least 100 m from the impact area; hence, any compounds
detected should be associated with firing activities rather than detonations. NG was the only target
analyte detected in these samples above analytical detection limits. The mean concentration of NG in this
41
region was 2,740 µg/kg. The source of NG at the firing points must be the propellants used in these
munitions.
Multi-Purpose Range Complex (MPRC), 120-mm tank firing point Analytical results for soil samples collected in front of the tank firing position on the MPRC are
presented in Table 3. Two components of gun propellants, NG and 2,4DNT, were found 10 meters in
front of the firing position at concentrations as high as 17,000 µg/kg and 33,000 µg/kg, respectively. This
confirms that both single-and double-based propellants are used at this range. Detectable concentrations
of both analytes were still detectable 75 m from the firing point, the farthest distance sampled. These
analytes were detected over the width sampled, which was 30 meters (15 meters to either side of our
center line drawn from the firing point to the nearest target). Based on these results two types of
propellant were used at this firing point, single-based propellant in which 2,4DNT is used as a plasticizer,
and triple-based propellant which is composed of NG, nitrocellulose and nitroguanidine. The area in
which these residues were deposited appears to be quite large, at least 2,600 m2.
2,6DNT was also detected in most of the samples collected at this firing point. 2,6DNT is an
impurity in military grade 2,4DNT. The ratio of 2,4- to 2,6DNT in the five discrete samples where the
2,6DNT was present above 100 µg/kg was 68±14 µg/kg. Recent results from biodegradation studies by
Spain (Personal communication*) indicate that 2,6DNT does not degrade to any extent when 2,4DNT is
present and the ratio of 2,4- to 2,6DNT decreases as biodegradation takes place. The ratio of 68 indicated
that this material had undergone very little degradation since being deposited from firing activities.
Concentrations of NG in the surface soils (0-2.5 cm) 20-m from the firing position ranged from
442 to 6,610 µg/kg for NG while samples collected at the 2.5- to 5-cm depth ranged from 62 to 1,400
µg/kg. Likewise for 2,4DNT, concentrations in the top 2.5 cm ranged from 660 to 9,360 µg/kg, while at
the 2.5-5-cm depth they ranged from 149 to 5,300 µg/kg. Thus, some downward transport of these
compounds has occurred even at this arid site. Deeper samples were not collected due to concerns about
the possible presence of UXO.
* Dr. James Spain, US Air Force Research Laboratory, Tyndall Air Force Base, Florida, personal
communication, 2001.

42
The mean 2,4- to 2,6DNT ratio in the five subsurface soil samples was 76±16. This ratio
indicated that very little biodegradation of the 2,4DNT had occurred in the subsoil at the time these
samples were collected.
The only other energetics-related compounds detected at the MPRC were in a few samples,
generally near the firing point, where low concentrations of TNT and RDX were detected. The samples
where TNT was detected generally had 2,4DNT concentrations in excess of 3,000 µg/kg indicating that
the TNT was probably an impurity in the military grade 2,4DNT. The source of the low levels of RDX in
a few of these soil samples is unknown.
155-mm howitzer firing points Results from the analysis of discrete and composite soil samples from two 155-mm howitzer
firing points are shown in Table 4. No target analytes were detected in composite samples collected at
Gun Position 1. In the composites from Gun Position 2, 2,4DNT was found in 5 of the 13 samples. This
included both duplicates at distances of 5 and 10 m from the muzzle, and one of the two duplicates
collected at 20 m from the muzzle. Concentrations in these samples ranged from 11 to 94 µg/kg. No NG
or other explosives-related analytes were detected in any of these composites.
In the discrete samples from Gun Position 1, 2,4DNT was detected in 6 of the 23 surface samples.
The highest concentration was 2,670 µg/kg for a sample right under the muzzle. Concentrations of
2,4DNT in the remaining 6 samples ranged from 5 to 185 µg/kg with these positive samples located
randomly over the area sampled and as far from the muzzle position as 50 m. 2,4DNT was not detected
in the five shallow subsurface samples.
NG was not detected in any of the discrete or composite samples. RDX was detected in two
discrete samples, but the concentrations were only 5 and 9 µg/kg, respectively.
Overall, the concentrations of explosives and propellant residues at the 155-mm firing point were
very low, even when detectable using GC-ECD Method 8095. This result agrees with that found at Camp
Shelby, MS (CHPPM 2000), where almost all results were below the detection limit of the analytical
method used (RP-HPLC Method 8330). The fact that 2,4DNT was detected at the Yakima firing points
and NG was not indicates that the propellant used at these firing points was probably single-based, where
2,4DNT is the plasticizer with nitrocellulose as the main component.

43
The final firing point position sampled at YTC was a position used for direct fire of 155-mm
howitzers. This position was within a hundred meters of the central impact area and had recently been
used for firing activity. Four composite samples were collected at distances ranging from 7 to 32 m from
the firing pad. Analysis of these samples indicated the presence of NG and 2,4DNT, but the deposition
pattern appears to indicate independent deposition of the two propellant-related analytes (Table 5). For
NG, the concentrations decline at increasing distance from the firing pad; for 2,4DNT, the concentrations
are only detectable at distances of 22 and 32 m from the pad. Thus it appears that triple-based propellant
was used for the direct fire of the 155-mm howitzers and that some other firing activity also took place at
this location, depositing 2,4DNT.
Results from analysis of the 12 discrete samples collected at this area are consistent with the
results from the composite samples. Again NG and 2,4DNT were detected in many of these samples with
the highest 2,4DNT concentrations for samples collected at 22 and 32 m from the firing pad. The
concentration gradient for NG, as a function of distance from the pad, was not identifiable in the discrete
samples. The highest concentrations for NG in the discrete samples were found at 12 and 22 m from the
pad.
Mortar firing point The results from analysis of surface soil samples from the 81-mm mortar firing position are
presented in Table 6. Four composite samples were collected 5, 10, 15, and 20 m from the position of the
base plate, as indicated by physical soil disturbance. NG was detected in three of the four samples at
distances as far as 10 m from the base plate position at concentrations ranging from 2 to 246 µg/kg. No
other target analytes were detected. These results were consistent with the composition of the double-
based propellant used with 81-mm mortars.
A set of 13 discrete samples was also collected within the same area. NG was detected in 7 of the
13 at distances as far as 20 m from the base plate location, but concentrations were always less than 45
µg/kg. NG was detected in some samples at a given distance, but not in others from the same distance.
The lack of a discernable pattern to this deposition indicates that the deposition was spatially random. As
with the composite samples, no other target analytes were detected in any of these discrete samples.
If samples from this location had been analyzed by RP-HPLC, NG would not have been detected,
even if a modification to Method 8330 had been employed in which a lower wavelength was used on the
UV detector.

44
Central impact area Several target analytes were detected in one or more of the eight samples collected in and near
four detonation craters at the artillery range impact area. However, concentrations were always less than
25 µg/kg (Table 7). RDX was detected in four of these samples with a maximum concentration of 17
µg/kg. NG was detected in two samples, and 2ADNT and 4ADNT were detected in one.
Results for the discrete samples collected around the same four craters, plus a fifth one, confirm
that target analyte concentrations are very low. RDX was detected in 1 of the 22 crater samples, but the
concentration was only 8 µg/kg. No other target analytes were detected in these samples.
Samples were also collected in the impact area around various types of objects that we observed
during range reconnaissance. Surface soil was sampled under the nose of relatively recent in tact 155-mm
howitzer round that we observed on the surface. Analysis indicated that RDX was present at 719 µg/kg.
In addition, 2ADNT and 4ADNT, transformation products of TNT, were found at 49 and 58 µg/kg,
respectively. The presence of the environmental transformation products of TNT demonstrated that while
TNT was not detected, it had been present at some point in the past.
Soil samples were collected under the front and back of a corroded 155-mm dud that was
tentatively identified by EOD personnel as a WP round. Concentrations of RDX were 6,720 and 53,500
µg/kg for soils collected under the front and back of the round, respectively. RDX is used in the burster
for this round. Water had apparently entered the round and leached RDX into the soil beneath. HMX, a
manufacturing impurity of RDX, was present in the soil as well.
Using the more sensitive GC-ECD method, no target analytes were detected in the set of surface
and shallow subsurface soils beneath a 155-mm illumination round.
Several target analytes were detected in two surface soil samples collected next to a very
corroded 105-mm HE dud that was sitting on the surface. These included RDX, 2,4DNT, 2,6T, 2ADNT,
4ADNT and PETN. The highest concentration was for 2,4DNT at 144 µg/kg in one of the samples.
2,4DNT is not a component of the explosive in 105-mm howitzer rounds and was probably deposited
from a different source, such as propellant. The RDX concentrations in these two samples were 7 and 8
µg/kg. The concentrations of 2ADNT and 4ADNT were 9 and 5 µg/kg in one of the two samples. TNT
was not detected, but the presence of the monoamino transformation products indicated that it had been

45
present at one time. The low concentrations of RDX and the TNT transformation products could have
originated from Composition B in the 105-mm dud. However, the very low concentrations indicated that
the round is not yet a significant source of explosives residues to the site.
Except for a very small concentration of NG (4 µg/kg) in one of the two samples, no target
analytes were detected next to an Air Force illumination round. A low concentration of NG (12 µg/kg)
was detected in the surface soil next to a 105-mm HEP (high explosive plastic) round, but not in the
subsurface. No other target analytes were detected in these samples.
Claymore mine The results for the four surface composite samples collected in front of the detonation point for a
Claymore mine are presented in Table 8. The only target analytes detected in these samples were NG and
2,4DNT. Concentrations of NG in the 5-, 10-, and 15-m samples, were 1,270, 66, and 96 µg/kg while the
concentration at 20 m was less than the detection limit. For 2,4DNT, the concentration found at 10 m was
4 µg/kg, while at 15 m it was 3 µg/kg.
Nearly identical results were found from analysis of the 12 discrete samples collected in this same
area. Mean NG concentrations declined from 851 µg/kg at 5 m, to 151 µg/kg at 10 m, to 132 µg/kg at 15
m, and to 72 µg/kg at 20 m. 2,4DNT was detected in 7 of the 12 samples with concentrations randomly
varying from 4 to 18 µg/kg. The only other target analyte detected in these samples was RDX (2 µg/kg),
in one of the three samples collected at the 5-meter distance.
The Claymore mine that was detonated was placed along the fence line separating the impact area
of the range from the maneuver and firing point area. Since Claymore mines do not contain NG or
2,4DNT, their presence in these samples was not due to the detonation of the Claymore. Rather, these
compounds were undoubtedly deposited from propellants from artillery and mortars fired over the fence
line into the impact area. The small amount of RDX found in one sample may have originated from the
Claymore mine, but the inability to detect RDX in the other samples makes even that uncertain.
Soil geochemistry Soils at the Yakima Training Center are loam to sandy loam with a slightly acid pH (Table 9).
TOC and CEC are moderate, averaging less than 2 % and 10 meq 100 g-1, respectively. Soils are generally
typical of the region.

46
Potable and surface water Ground and surface water was generally soft (sum of Ca and Mg <50 mg L-1, Table 10). Total
iron was less than the EPA drinking water standard of 0.3 mg L-1, except in surface water from Lmumma
Creek on the impact area where it was only slightly higher (0.62 mg L-1). All other parameters were low
and typical of the environment. No explosives or degradation products of explosives were detected.
Camp Guernsey, WY Artillery impact area A set of multi-increment composite soil samples was collected as shown in Figure 21. The
results for the surface composites around the truck target selected on the artillery range at Camp Guernsey
indicated that the concentrations of explosives residues were quite low (Table 11). The highest
concentrations were for HMX in the samples nearest the target (1-m samples) with a mean concentration
for duplicates of 151 µg/kg. RDX, 2ADNT and 4ADNT were detected in most of these samples at
concentrations at or below 54 µg/kg. TNT was also detected in several of these samples, but the
concentrations were below 20 µg/kg.
Concentrations in the discrete samples collected as this site were also very low, always below 30
µg/kg except for a sample in the depth interval 5-10 cm collected 5 m from the target. In this samples, the
concentrations of TNT, 2ADNT, 4ADNT, and TNB were 22,700, 1080, 1080, and 200 µg/kg,
respectively. Concentrations for the other depth intervals for this sample, including those above and
below this sample were below 15 µg/kg in all cases. The reason why one subsurface sample had a much
greater concentration than any other is unclear.
Overall, concentrations of explosives-related analytes in these samples were very low. In fact, if
Method 8330 were used exclusively for these samples, almost all values would have been below
analytical detection limits. These results agree with those from Yakima, and those obtained by CHPPM
2000) for Camp Shelby, and indicate that explosives residues in most areas of artillery impact areas are
quite small, even near targets.
Characterization of area near low order 500-lb bomb prior to detonation During exploration of the artillery impact area at Camp Guernsey we noticed a large munitions
item that had apparently undergone a low order detonation (Figure 22). The item was subsequently

47
identified by EOD personnel as an Air Force 500-lb bomb (Mark 82). The bomb contained a large
amount of residual explosive, perhaps as much as half of the original explosive charge. The explosive
had been exposed to the light and had turned red in the sun indicating that at least a portion of the
explosive fill was TNT. Analysis of the explosive revealed that it was TNT with a few tenths of a percent
of TNB, a major photochemical degradation product of TNT. Because no Air Force bombing had
occurred in the last several years (according to EOD team), this ruptured bomb had been on site for at
least two years.
When the area near the bomb was explored, several areas of reddish stained soil were observed,
as far as 4.7 m from the bomb. Subsequent analysis of these soils indicated that this reddish stain was due
to the deposition of TNT, either when the bomb partially detonated, or when rainfall eroded and spread
the explosive fill downslope.
Analysis of the surface soil sample collected next to the ruptured bomb indicated a TNT
concentration of 9,440,000 µg/kg or 0.944% (Table 12). The TNT concentrations at the 1-3 cm, and 4-7
cm depths at this location were 240,000, and 42,000 µg/kg, respectively. Surface soil samples at 1, 2, and
4.7 m down slope were 467,000, 4,660, and 8,050, 000 µg/kg, respectively. Clearly the ruptured bomb
has caused substantial localized contamination with TNT. The major biotic, abiotic and photochemical
transformation products of TNT (2ADNT, 4ADNT, and TNB) were also found in these samples.
The mean concentrations of TNT in the duplicate surface composite samples collected at 3, 5, and
10 meters from the bomb were 13,000, 260, and 306 µg/kg, respectively. 2ADNT, 4ADNT and TNB
were also detected in these samples. The mean ratio of TNT/2ADNT for these composite samples was
about 6. This indicated that a substantial portion of the TNT that was deposited had been subject to
environmental transformation.
Characterization of area near low order 500-lb bomb after in was blown in place After the area around the 500-lb bomb was sampled, the EOD team destroyed this bomb using a
blow-in-place technique. Analysis of duplicate surface composites indicated that the TNT concentrations
after the detonation were 74,600, 10,200, and 943 µg/kg at 3, 5, and 10 m from the crater (Table 12).
These values increased from 13,000, 260, and 306 µg/kg, respectively, prior to detonation. The mean ratio
of TNT to its microbial degradation product, 2ADNT, increased in these samples from about 6 prior to
detonation to about 33 after detonation, confirming that much of the TNT found after detonation was
deposited by the blow-in-place detonation of the low-order bomb.

48
Concentrations of TNT in the discrete samples collected near the crater varied from 66,700 µg/kg
in the center of the crater to 3,980 µg/kg on the west rim of the crater. The mean ratio of TNT to 2ADNT
for these samples averaged about 6 indicating that much of the TNT found in the crater area had been
deposited prior to the blow-in-place detonation.
The concentrations of TNT in samples that were collected in the sampling wheel pattern, centered
a distance of 3.5 m from the crater, varied from 28,000 to 206,000 µg/kg. The mean TNT concentration
for these seven samples was 72,300 ± 62,300 µg/kg. The mean ratio for TNT/2ADNT for the five
samples was 27, an indication that the bulk of the TNT found at a distance of 3.5 m from the crater was
freshly deposited, rather than being present prior to detonation.
Overall, these results indicate that the blow-in-place detonation of this ruptured 500-lb bomb
resulted in TNT contamination at distances at least as far as 10 m from the location of the detonation.
Higher concentrations of TNT were found in surface soil at a distance of 3.5 m from the crater than within
or on the edge of the crater. This may be indicative of the so-called “halo” effect, where deposition
beyond a certain radius is higher than within that radius.
Soil samples collected before and after demolition of 155-mm duds A series of samples were collected in the impact area at Camp Guernsey at distances ranging
from 3 to 10 m from several 155-mm surface duds and one 81-mm dud. The area sampled was not
heavily cratered, and these samples could serve as typical background level samples for this impact range.
After these soil samples were collected, the rounds were detonated by EOD personnel with C4 and a
second set of composite surface samples were collected in an identical manner. Results of these analyses
are presented in Table 13.
Several analytes were detected in the samples collected around UXO #1, a 155-mm howitzer dud.
The analytes detected at highest concentration were 2ADNT, 4ADNT and TNT, which were present in all
six of the samples collected. Concentrations ranged from 67 to 268 µg/kg for the individual ADNTs with
a mean of about 170 µg/kg, and from 7 to 210 µg/kg for TNT with a mean of 55 µg/kg. Concentrations
just above analytical detection limits were observed for RDX, 2,4DNT and 2,6DNT in a few of these
samples. The concentrations of none of these analytes were correlated in any way with their position
relative to the 155-mm dud, and hence the source of these residues is unknown.

49
An identical set of surface composites were collected around UXO 2, also a 155-mm dud.
2ADNT and 4ADNT were again detected in all six samples, but the concentrations ranged from 4 to 12
µg/kg. No TNT was detected in these samples, but RDX was detected just above detection limits in five
of the samples and HMX was detected in one sample at 193 µg/kg.
A third set of six surface composites were collected in an area containing a 155-mm dud and an
81-mm dud, in an identical pattern as for UXO 1 and 2. HMX, RDX, TNT, 2ADNT and 4ADNT were
detectable in all six samples at concentrations ranging from 4 to 551 µg/kg. Mean concentrations for
HMX, RDX, TNT and the individual ADNTs were 248, 115, 129, and 136 µg/kg, respectively. Again,
the source of these residues was not obvious.
Results for samples collected the following day after all these rounds were destroyed by
detonating them in place using C4 are presented in Table 11. For the area around UXO 1, there was a
dramatic increase in the concentrations of RDX, TNT, and HMX. For example, the mean concentration
of RDX increased from 10 µg/kg prior to the detonation to 65,600 µg/kg after the detonation. Likewise,
the mean concentration of TNT and HMX increased from 55 mg/kg and less than detectable, respectively,
to 25,300 and 7,900 µg/kg. The relative concentrations of RDX, TNT and HMX in soil, after the blow-in-
place operation, were about the correct proportion for deposition of Composition B. While the
concentration of RDX, TNT, and HMX were much higher than prior to detonation, the concentrations of
2ADNT and 4ADNT did not increase, indicating that these compounds are not formed during detonation.
Analytical results for UXO 2 were quite different. Concentrations of RDX, TNT and HMX were
generally below detection limits prior to the blow-in-place operation and only TNT appears to have
increased to about 100 µg/kg due to the deposition from the detonation. For UXO 3, mean concentrations
of RDX, TNT, and HMX before the item was blown in place were 115, 129, and 248 µg/kg, respectively,
and 1150, 6,100, and 789 µg/kg after the blow-in-place operation.
Therefore it appears that the degree of deposition of explosives residues due to blow-in-place
operations is quite variable, sometimes resulting in only minor contamination of the area, and other times
resulting in substantial local contamination.
Artillery firing point, Camp Guernsey Analytical results for soils collected at the firing point of 155-mm howitzers indicated that no
propellant residues above the analytical detection limits for GC-ECD Method 8095 were found in any of

50
these samples, either before or after firing. Since the propellant used for this firing activity was single
based, we had expected to see detectable levels of 2,4DNT. Thus it appears that very little propellant
residues were deposited from this firing activity.
Surface water springs Groundwater geochemistry is typical of the geographic area (Table 14). Groundwater is generally
slightly hard (sum of calcium and magnesium greater than 50, but less than 100 mg L-1). One sample,
Ryan Springs, slightly exceeded the drinking water standard for total iron (0.3 mg L-1) and for manganese
(0.05 mg L-1). Nitrate/nitrite values were well within the range for natural waters (0.1 to 10 mg L-1,
Driscoll 1987). Although two samples contained chloride levels greater than typical for groundwater
(about 6 mg L-1, Tardy 1971), levels were not sufficient to cause concern. Sulfate levels were generally
normal (less than 100 mg L-1, Davis and DeWiest 1966). No explosives or explosives degradation
products were detected in Camp Guernsey springs.
Historical firing records Firing records at Yakima Training Center for the most heavily used high explosives rounds over a
33-month period indicated that the 155-, 81-, 120-, and 105-mm were fired most extensively (Table 15).
These rounds were also commonly fired at Ft. Lewis (Pennington et al. 2001) and at Camp Guernsey
(Table 16). An average of more than 3,000 155-mm howitzer rounds are fired each year at Yakima. Some
of these contain RDX and TNT, while others contain TNT only. If Composition B is used, 60 % of the
main charge is RDX and 39 % is TNT (Table 17). That means that 4,191 g of RDX is present in each
round. If 0.02 % of the 3,000 rounds fires low order (Table 18), less than one low order detonation occurs
each year. Since 9,082 rounds were fired over the 33-month period, only 2 low order detonations are
anticipated during that time. Although unrealistic to expect the maximum quantity of RDX to remain, if
this occurred the RDX quantity would be 8,382g. On the other hand, nearly 250, or 2.75 %, are likely to
be duds requiring post deposition detonation by EOD personnel. If as much as one percent of the main
charge fails to be expended by the detonation in place, 10,478 g of RDX and 6,812 g of TNT are
potentially deposited on the surface soil. These values indicate the importance of achieving complete
detonation when conducting range clearance for duds. Further, these data suggest that low order
detonations, while not necessarily posing an explosion hazard, should be managed rather than left behind
because they have the potential for posing an environmental hazard.
51
Conclusions
Various types of military testing and training ranges are quite different with respect to their
potential for contaminating underlying ground water resources with residues of explosives (CHPPM2000,
Jenkins et al. 1997a, 1997b, 1998, 2001, Pennington et al. 2001, Thiboutot et al. 1998, Walsh et al. 2001).
For example, at antitank rocket ranges, surface soils near targets have been found to be contaminated with
HMX residues at concentrations in the tens to thousands of parts-per-million. In contrast, soils near
targets at artillery ranges have concentrations of RDX and TNT in the low parts-per-billion range. In both
cases, though, soil concentrations of explosives-related residues can be in the percent level next to
ruptured ordnance. For artillery ranges it appears that the non-point source of explosives residues for
ground water contamination is quite low, with a number of much higher point sources randomly located
across the site
Adequate characterization of artillery ranges is impossible using small numbers of discrete
samples. Discrete samples are not representative of even small geographical areas. Much better
representation of the area can be obtained using multi-increment composite samples. Results to date
suggest that combining 30 individual increments to make up the composite sample results in adequate
reproducibility in many cases. The ability to reproduce samples with an acceptable level of uncertainty
provides confidence that the sample is representative of the area in question.
The results of this study indicate that the practice of detonating dud rounds using C4 sometimes
leads to substantial contamination with explosives residues. The degree of contamination is quite
variable, and the size of the contaminated areas is currently poorly defined. The use of C4 can result in
incomplete detonation, and C4 is composed of 91% RDX, a potentially significant groundwater
contaminant. Ground water contamination with RDX has resulted in the suspension of live fire training at
the Massachusetts Military Reservation (USEPA 2000), and has been found at low levels in ground water
at Ft. Lewis (Jenkins et al. 2001, Pennington et al. 2001). Increased consideration should be given to
improving the efficiency of detonation for blow-in-place operations, and the use of more environmentally
benign demolition charges.
52
Literature Cited
American Public Health Association. 1985. Standard Methods for the Examination of
Water and Wastewater, 16th ed., Washington, DC.
Center for Health Protection and Preventative Medicine (CHPPM). (2001). “Geohydrologic
Study No. 38-EH-8879-99, Training Range Site Characterization and Risk Screening,
Camp Shelby, Mississippi,” 7-23 September 1999.
Davis, S. N., and DeWiest, R. J. M. (1966). Hydrogeology. John Wiley and Sons, Inc., NY.
Day, P. R. (1956). “Report of the committee on physical analyses, 1954-1955,” Proceedings, Soil
Science Society of America, 167-169.
Driscoll, F. G. 1987. Groundwater and wells, 2nd ed., Johnson Division, St. Paul, MN.
Gee, G. W., and Bauder, J. W. (1986). “Particle-size analysis,” Methods of Soil Analysis, Part 1-
Physical and Mineralogical Methods, Second ed., A. Klute, ed., American Society of
Agronomy, Inc., Madison, WI.
Jenkins,T. F., Grant, C. L., Brar, G. S., Thorne, P. G., Schumacher, P. W., and Ranney, T. A.
(1997a). “Sampling error associated with collection and analysis of soil samples at TNT
contaminated sites,” Field Analytical Chemistry and Technology, 1, 151-163.
Jenkins, T. F., Walsh, M. E., Thorne, P. G., Thiboutot, S., Ampleman, G., Ranney, T. A. , and
Grant, C. L. (1997b). “Assessment of sampling error associated with the collection and
analysis of soil samples at a firing range contaminated with HMX,” Special Report 97-
22, U.S. Army Cold Regions Research and Engineering Laboratory, Hanover, NH.
Jenkins, T. F., Walsh, M.E., Thorne, P. G., Miyares, P. H., Ranney, T. A., Grant, C. L., and
Esparza, J. (1998). “Site characterization at the inland firing range impact area at Ft.
Ord,” Special Report 98-9, U.S. Army Cold Regions Research and Engineering
Laboratory, Hanover, NH.
Jenkins, T. F., Pennington, J. C., Ranney, T. A., Berry, T. E., Jr., Miyares, P. H., Walsh, M. E.,
Hewitt, A. D., Perron, N., Parker, L. V., Hayes, C. A., and Wahlgren, Maj. E. (2001).
“Characterization of explosives contamination at military firing ranges,” ERDC
Technical Report TR-01-05, U. S. Army Engineer Research and Development Center,
Cold Regions Research and Engineering Laboratory, Hanover, NH.
Lynch, J. C. Myers, K. F., Brannon, J. M., and Delfino, J. J. (2001). Effects of pH and
temperature on the aqueous solubility and dissolution rate of 2,4,6-trinitrotoluene (TNT),
hexahydro-1,3,5-trinitro-1,3,5-triazine (RDX), and octahydro-!,3,5,7-tetranitro-1,3,5,7-
tetrazocine (HMX),” Journal of Chemical and Engineering Data 46, 1549-1555.

53
Mehlich, A. (1984). “Mehlich 3 soil test extractant: A modification of Mehlich 2 extractant,”
Communications in Soil Science and Plant Analyses 15(12), 1406-1416.Olson, R. V., and
Ellis, R., Jr. (1982). “Iron,” Methods of Soil Analysis, Part 2-Chemical and
Microbiological Properties, 2nd ed., A. L. Page, R. H. Miller, and D. R. Keeney, eds.,
American Society of Agronomy, Inc., Madison, WI.
Olson, R. V., and Ellis, R., Jr. 1982. “Iron,” Methods of Soil Analysis: Parat 2. Chemical and
Microiological Properties, 2nd ed., Page, ed., American Society of Agronomy, Inc.,
Madison, WI, pp301-312.
Patrick, W. H., Jr. (1958). “Modification of method of particle size analysis,” Proceedings, Soil
Science Society of America 22, 366-332.
Pennington, J. C., Jenkins, T. F., Brannon, J. M., Lynch, J., Ranney, T. A. Berry, T. E., Hayes, C.
A., Miyares, P. H., Walsh, M. E., Hewitt, A. D., Perron, N., and Delfino, J. J. (2001).
“Distribution and fate of energetics on DoD test and training ranges: Interim report 1,”
ERDC Report TR-01-13, U. S. Army Engineer Research and Development Center,
Environmental Laboratory, Vicksburg, MS.
Rhoades, J. D. (1982). “Cation exchange capacity,” Methods of Soil Analysis, Part 2-Chemical
and Microbiological Properties, 2nd ed., A. L. Page, R. H. Miller, and D. R. Keeney, eds.,
American Society of Agronomy, Inc., Madison, WI.
Tardy, Y. (1971). Characterization of the principal weathering types by the geochemistry of
waters from some European and African crystalline massifs, Chemical Geology, 7:253-
271.
Thiboutot, S., Ampleman, G., Gagnon, A., Marois, A., Jenkins, T. F., Walsh, M. E., Thorne, P.G.,
and Ranney, T. A. (1998). “Characterization of antitank firing ranges at CFB Valcartier,
WATC Wainwright and CFAD Dundurn,” Report # DREV-R-9809, Defence Research
Establishment Valcartier, Quebec. Thorne, P. G., and Leggett, D. C. (1997). “Hydrolytic
release of bound residues from composted soil contaminated with 2,4,6-trinitrotoluene,”
Environmental Toxicology and Chemistry 16, 1132-1134.
Thorne, P. G., and Leggett, D. C. 1997. Hydrolytic release of bound residues from composted soil
contaminated with 2,4,6-trinitrotoluene, Environmental Toxicology and Chemistry,
16(6):1132-1134.
U. S. Army. (1994). “Army Ammunition Reference Sheets for Artillery Ammunition: Guns,
Howitzers, Mortars, Recoilless Rifles, Grenade Launchers and Artillery Fuzes,”
Technical Manual TM 43-0001-28, Armament Research, Development and Engineering
Center, Picatinny Arsenal, NJ.

54
U. S. Army Center for Health Protection and Preventative Medicine. 2000. Geohydrologic Study
No. 38-EH-8879-99, Training range site characterization and risk screening, Camp
Shelby, MS, 7-23 September 1999.
U. S. Environmental Protection Agency. (1979). Chemistry laboratory manual for bottom
sediment and elutriate testing. Region V, Central Regional Laboratory, Chicago, IL.
U. S. Environmental Protection Agency. (1982). Methods for chemical analysis of water and
wastes. EPA 600/4-79-020, March 1979 and EPA 600/4-82-055 Dec 1982,
Environmental Monitoring and Support Laboratory, Cincinnati, OH.
U. S. Environmental Protection Agency. (1988a). Test Methods for Evaluating Solid Waste, SW-
846 3d ed., November 1986 with December 1988 Revisions, Office of Solid Waste and
Emergency Response, Washington, DC.
U. S. Environmental Protection Agency. (1988b). “Health advisory for RDX,” U. S.
Environmental Protections Agency, Criteria and Standards Division, Office of drinking
Water, Washington, DC.
U. S. Environmental Protection Agency. (1994). “Nitroaromatics and nitramines by HPLC,”
Second Update SW846 Method 8330, September 1994, Office of Solid Waste and
Emergency Response, Washington, DC.
U. S. Environmental Protection Agency. (1999). “Nitroaromatics and nitramines by GC-ECD,”
Fourth Update SW846 Method 8095 (Draft) 1999, Office of Solid Waste and Emergency
Response, Washington, DC.
U. S. Environmental Protection Agency. (2000). “Administration Order for Response Action
EPA Docket Number SDWA-1-2000-0014 USEPA Region 1 In the Matter of Training
Range and Impact Area, Massachusetts Military Reservation,” January 2000, Boston,
MA.
Walsh, M. E., and Ranney, T. A. (1999). “Determination of nitroaromatic, nitramine, and nitrate
ester explosives in soils using GC-ECD,” CRREL Report 99-12, U. S. Army Cold
Regions Research and Engineering Laboratory, Hanover, NH.
Walsh, M. E, Collins, C. M., Racine, C. H., Jenkins, T. F., Gelvin, A. B., and Ranney, T. A.
(2001). “Sampling for explosives residues at Fort Greely, Alaska: Reconnaissance Visit
July 2000,” Technical Report ERDC/CRREL-01-15, U. S. Army Engineer Research and
Development Center, Cold Regions Research and Engineering Laboratory, Hanover, NH.
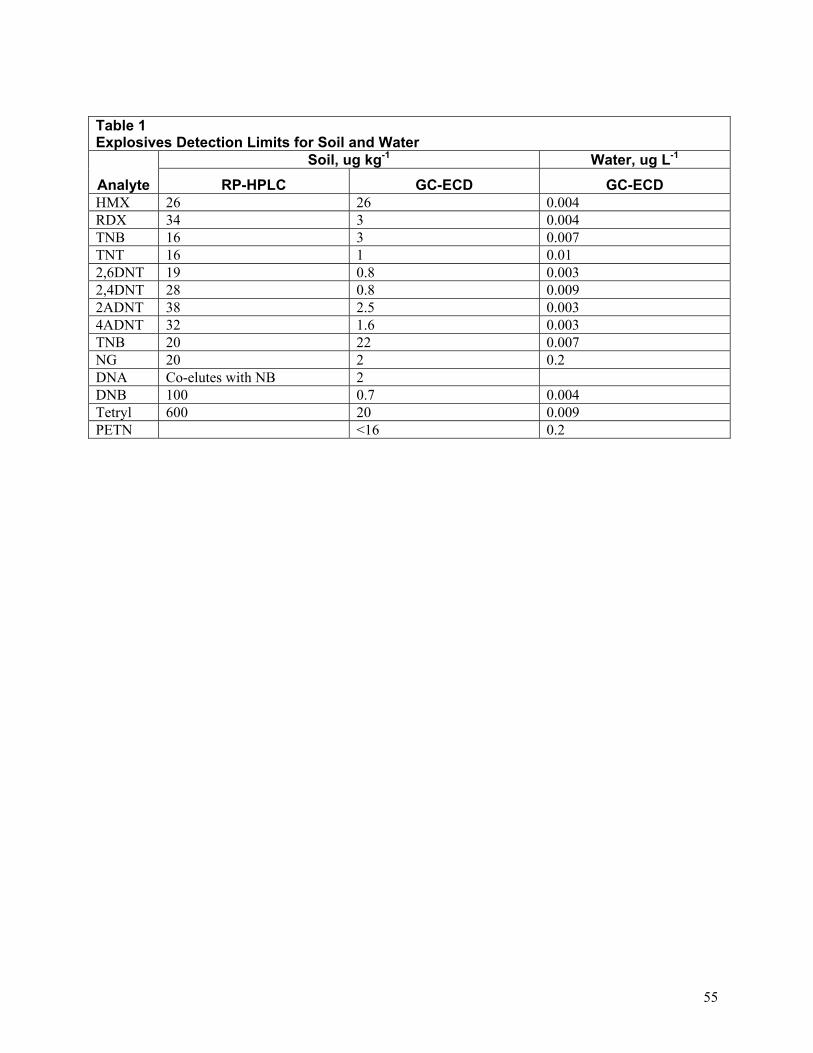
55
Table 1 Explosives Detection Limits for Soil and Water
Soil, ug kg-1 Water, ug L-1 Analyte RP-HPLC GC-ECD GC-ECD HMX 26 26 0.004 RDX 34 3 0.004 TNB 16 3 0.007 TNT 16 1 0.01 2,6DNT 19 0.8 0.003 2,4DNT 28 0.8 0.009 2ADNT 38 2.5 0.003 4ADNT 32 1.6 0.003 TNB 20 22 0.007 NG 20 2 0.2 DNA Co-elutes with NB 2 DNB 100 0.7 0.004 Tetryl 600 20 0.009 PETN <16 0.2

56
Table 2 Explosives Concentrations in Soils from Yakima Anti-Tank Firing Range1, µg kg-1
Sample Number
Munitions/Target
Sample
Location2
Sample Depth,
cm
HMX
RDX
TNT
NG
2,4DNT
2ADNT
4ADNT Discrete Samples
Y1 40-mm grenade near intact 0-0.5 6380 8210 <16 102 <28 <38 <32 Y2 40-mm grenade near intact 0.5-2.5 1440 563 <16 7850 150 <38 <32 Y3 Artillery Target 50 cm NE Surface 75000 90400 <16 <20 <28 <38 <32 Y4 Artillery Target 50 cm NE 0.5-1.0 17900 13100 <16 <20 <28 <38 <32 Y5 Artillery Target 50 cm NE 1.0-4.0 19900 4290 <16 <20 <28 <38 <32 Y6 Artillery Target 50 cm NE 4.0-7.0 19400 3540 <16 <20 <28 <38 <32 Y7 Artillery Target 50 cm NE 7.0-10.0 20500 4040 <16 <20 1510 <38 <32 Y8 Artillery Target 1 m N Surface 53500 7070 <16 <20 <28 <38 <32 Y9 Artillery Target 1 m N 1.0-3.0 18200 6060 <16 <20 <28 <38 <32 Y10 Artillery Target 1 m N 3.0-7.0 26700 6800 <16 <20 <28 <38 <32 Y11 Artillery Target 1 m N 7.0-10.0 1180 315 <16 <20 <28 <38 <32 Y12 Artillery Target 4 m N Surface 19000 215 <16 200 <28 17.5 100 Y13 Artillery Target 4 m N 1.0-3.0 4240 125 <16 175 <28 47.5 25 Y14 Artillery Target 4 m N 3.0-7.0 4530 97.5 <16 <20 <28 <38 <32 Y15 Artillery Target 4 m N 7.0-10.0 1120 80.0 <16 <20 <28 <38 <32 Y16 Artillery Target 8 m N Surface 1900 775 55.0 13000 480 20.0 72.5 Y17 Artillery Target 8 m N 1.0-3.0 338 293 <16 <20 <28 <38 <32 Y18 Artillery Target 8 m N 3.0-7.0 298 62.5 <16 <20 800 <38 <32 Y19 Artillery Target 8 m N 7.0-10.0 27.5 <16 <20 <28 <38 <32 Y20 Artillery Target 12 m N 0-2.0 2940 <34 37.5 4120 208 72.5 75 Y21 Artillery Target 12 m N 7.0-10.0 153 195 <16 10600 163 <38 <32 Y22 Artillery Target 12 m N 7.0-10.0 43 87.5 <16 <20 <28 <38 <32
Y23 Ruptured Law Rocket
Next to 0-0.5 10400000 45700 358000 <20 1770 17700 24700
Y24 Ruptured Law Rocket Next to 2.0-6.0 1020000 4760 41700 1260 483 4380 5580
Y25 Ruptured Law Rocket Next to 6.0-10.0 49300 1530 1720 895 183 1700 1820
Composite Samples YC1 Artillery Target 0.2 m Surface 35600 3130 <16 <20 <28 <38 <32 YC2 Artillery Target 0-2 m Surface 58000 736 61.4 270 52 333 459 YC3 Artillery Target 2-5 m Surface 11700 259 73.1 1100 148 114 133 YC4 Artillery Target 2.5 m Surface 20800 344 35 1300 88 118 152 YC5 Artillery Target 5-10 m Surface 1760 115 14 92 <28 11 <32 YC6 Artillery Target 5-10 m Surface 10800 196 47 467 17 93 78 YC7 Artillery Target 10-15 m Surface 6510 83 117 7 8 32 27 YC8 Artillery Target 10-15 m Surface 771 92 12 2750 98 <38 <32
YC9 Rocket Firing Position
Front 5-10 m Surface <26 <34 <16 1840 6 <38 <32
YC10 Rocket Firing Position
Front 5-10 m Surface <26 3 <0.8 3630 <28 <38 <32
1 The following undetected analytes were excluded from the table: 2,6DNT, 1,3DNB, 1,3,5TNB, 3,5DNA, PETN. All shaded data were generated using RP-HPLC analysis. All other data were generated using GC-ECD. 2 Upper case abbreviations indicate cardinal directions relative to munitions or target; numerals indicate distance from munitions or target.

57
Table 3 Explosives Concentrations in Soils near a Tank Firing Point at Yakima Multi-Purpose Range Complex1, µg kg-1
Sample Number
Sample Location2
Sample Depth, cm
RDX
TNT
NG
2,4DNT
2,6DNT
Discrete Samples: 120-mm Tank Gun Y95 10 m F, 10 m R Surface5 <34 4 1540 8620 138 Y96 10 m F, 5 m R Surface 142 34 17000 30500 376 Y97 10 m F, C Surface 25 27 5370 30400 552 Y98 10 m F, 10 m L Surface 113 29 6560 33000 392 Y99 10 m F, 5 m L Surface 3 4 1600 3280 16 Y100 20 m F, 10 m R Surface 2 <16 6610 2530 16 Y124 20 m F, 10 m R 2.5-5 <3 <1 972 149 2 Y101 20 m F, 5 m R Surface <34 <16 4050 6160 32 Y125 20 m F, 5 m R 2.5-5 <34 1 1400 5300 60 Y102 20 m F, C Surface <3 <1 442 660 <0.8 Y126 20 m F, C 2.5-5 <34 <16 448 904 14 Y103 20 m F, 5 m L Surface <34 2 646 4180 63 Y127 20 m F, 5 m L 2.5-5 <34 <16 342 668 7 Y104 20 m F, 10 m L Surface 4 6 2070 9360 162 Y128 20 m F, 10 m L 2.5-5 <3 <1 62 344 6 Y105 30 m F, 5 m R Surface <34 <16 862 1340 20 Y106 30 m F, 10 m R Surface <3 <1 356 280 4 Y107 30 m F, C Surface 2 <1 880 216 <0.8 Y108 30 m F, 5 m L Surface 2 <1 668 698 7 Y109 30 m F, 10 m L Surface <3 <1 270 157 1 Y110 50 m F, 15 m, R Surface <3 <1 547 114 1 Y111 50 m F, 10 m R Surface 1 <16 1110 2150 7 Y112 50 m F, 5 m R Surface <3 <1 280 356 2 Y113 50 m F, C Surface <3 <1 308 54 <0.8 Y114 50 m F, 5 m L Surface 1 <16 568 1340 3 Y115 50 m F, 10 m L Surface <3 <1 56 40 <0.8 Y116 50 m F, 15 m L Surface <3 <1 320 56 <0.8 Y117 75 m F, 15 m R Surface <34 <16 2650 801 8 Y118 75 m F, 10 m R Surface 6 <16 2250 258 <0.8 Y119 75 m F, 5 m R Surface <3 <1 1090 130 2 Y120 75 m F, C Surface <3 <1 860 442 5 Y121 75 m F, 5 m L Surface <3 <1 114 3 <0.8 Y122 75 m F, 10 m L Surface <3 <1 152 8 <0.8 Y123 75 m F, 15 m L Surface <3 <1 16 <0.8 <0.8
Composite Samples: 120-mm Tank Gun YC28 10 m F Surface <100 <100 6030 26500 392 YC33 10 m F Surface <100 <100 3090 22200 418 YC29 20 m F Surface <100 <100 1890 5550 32 YC30 20 m F Surface <100 <100 705 10900 230 YC36 30 m F Surface <34 1 604 480 2 YC37 30 m F Surface <100 <100 669 3860 <19 YC31 50 m F Surface <34 <16 306 14 <19 YC32 50 m F Surface <100 <100 348 1350 <19 YC34 75 m F Surface <34 <16 496 56 <19 YC35 75 m F Surface <34 <16 513 319 <19 1 The following undetected analytes were excluded from the table: TNB, PETN, 4ADNT, 2ADNT, HMX, DNA, DNB, Tetryl. All shaded data were generated using RP-HPLC analysis. All other data were generated using GC-ECD. 2 Sample location is relative to munitions or target; F = Front, R = Right, C = Center, L = Left.

58
Table 4 Explosives Concentrations in Soils at Two 155-mm Howitzer Firing Points, Yakima Training Center1, µg kg-1 Sample Number Sample Location2 Sample Depth, cm HMX RDX 2,4DNT
Discrete Samples: Howitzer Firing Point # 1 Y26 5 m W Surface <26 <3 24 Y27 At muzzle Surface 7 9 <0.8 Y28 5 m E Surface <26 <3 <0.8 Y29 5 m W Surface <26 <3 <0.8 Y30 C, 5 m out Surface <26 <3 <0.8 Y31 5 m E, 5 m out Surface <26 <3 24 Y32 10 m W, 10 m out 0.0-2.5 <26 <3 <0.8 Y33 10 m W, 10 m out 2.5-5.5 <26 <3 <0.8 Y34 5 m W, 10 m out 0.0-2.5 <26 <3 <0.8 Y35 5 m W, 10 m out 2.5-5.5 <26 <3 <0.8 Y36 C, 10 m out 0.0-2.5 <26 <3 <0.8 Y37 C, 10 m out 2.5-5.5 <26 <3 <0.8 Y38 5 m E, 10 m out 0.0-2.5 <26 <3 <0.8 Y39 5 m E, 10 m out 2.5-5.5 <26 <3 <0.8 Y40 10 m E, 10 m out 0.0-2.5 <26 5 5 Y41 10 m E, 10 m out 2.5-5.5 <26 <3 <0.8 Y42 10 m W, 20 m out Surface <26 <3 <0.8 Y43 5 m W, 20 m out Surface <26 <3 5 Y44 C, 20 m out Surface <26 <3 185 Y45 5 m E, 20 m out Surface <26 <3 <0.8 Y46 10 m E, 20 m out Surface <26 <3 <0.8 Y47 15 m W, 50 m out Surface <26 <3 <0.8 Y48 10 m W, 50 m out Surface <26 <3 <0.8 Y49 5 m W, 50 m out Surface <26 <3 6 Y50 C, 50 m out Surface <26 <3 <0.8 Y51 5 m E, 50 m out Surface <26 <3 <0.8 Y52 10 m E, 50 m out Surface <26 <3 <0.8 Y53 15 m E, 50 m out Surface <26 <3 <0.8
Composite Samples: Howitzer Firing Point # 1 YC11 5 m Surface <26 <3 <0.8 YC12 10 m Surface <26 <3 <0.8 YC13 20 m Surface <26 <3 <0.8 YC14 50 m Surface <26 <3 <0.8
Composite Samples: Howitzer Firing Point # 2 YC16 5 m Surface <26 <3 19 YC17 5 Surface <26 <3 11 YC18 10 m Surface <26 <3 65 YC19 10 m Surface <26 <3 16 YC20 20 m Surface <26 <3 94 YC21 20 m Surface <26 <3 <0.8 YC22 50 m Surface <26 <3 <0.8 YC23 50 m Surface <26 <3 <0.8 1 The following undetected analytes were excluded from the table: TNT, NG, 2,6DNT, 2ADNT, 4ADNT, TNB, PETN, DNA, DNB, Tetryl. All data were generated using GC-ECD analysis. 2 Sample location is relative to the Howitzer muzzle; W = West, E = East, C = Center.

59
Table 5 Explosives Concentrations in Soils at Direct Fire 155-mm Firing Point near Central Impact Area, Yakima Training Center1, µg kg-1
Sample Number
Sample Location2
Sample Depth, cm NG 2,4DNT 2,6DNT
Discrete Samples Y153 7 m, 5 m R of C Surface 1220 52 <0.8 Y154 7 m C Surface 45 3 <0.8 Y155 7 m, 5 m L of C Surface 75 <0.8 <0.8 Y156 12 m, 5 m R of C Surface 1250 <0.8 <0.8 Y157 12 m, C Surface 2610 <0.8 <0.8 Y158 12 m, 5 m L of C Surface 20100 <0.8 <0.8 Y159 22 m, 5 m R of C Surface 5900 <0.8 <0.8 Y160 22 m, C Surface 9430 11 <0.8 Y161 22 m, 5 m L of C Surface 11800 8250 190 Y162 32 m-5 m R of C Surface 1160 10 <0.8 Y163 32 m, C Surface 9660 240 <0.8 Y164 32 m, 5 m L of C Surface 12300 12 <0.8
Composite Samples YC60 7 m Surface 25700 <28 <19 YC61 12 m Surface 2952 <28 <19 YC62 22 m Surface 6012 3225 50 YC63 32 m Surface 1852 266 <19 1 The following undetected analytes were excluded from the table: HMX, RDX, TNT, 2ADNT, 4ADNT, TNB, PETN, DNA, DNB, Tetryl. All shaded data were generated using RP-HPLC analysis. All other data were generated using GC-ECD. 2 The sample location is relative to the firing pad. The first number is out from the firing pad and the next number is the cardinal direction from the firing pad; R = Right, L = Left, C = Center.

60
Table 6 Explosives Concentrations in Surface Soil at an 81-mm Mortar Firing Point, Yakima Training Center1, µg kg-1
Sample Number Sample Location2 NG Discrete Samples
Y58 1 m F <22 Y59 3 m L, 5 m out 45 Y60 C <22 Y61 3m R, 5 m out 32 Y62 5 m L, 10 m out 40 Y63 C, 10 m out 26 Y64 5 m R, 10 m out <22 Y65 5 m L, 15 m out <22 Y66 C, 15 m out 11 Y67 5 m R, 15 m out 40 Y68 5 m L, 20 m out <22 Y69 C, 20 m out 23 Y70 5 m R, 20 m out 8
Composite Samples YC24 5 m 13 YC25 10 m 246 YC26 15 m 2 YC27 20 m <22 1 The following undetected analytes were excluded from the table: HMX, RDX, TNT, 2,4DNT, 2,6DNT, 2ADNT, 4ADNT, TNB, PETN, DNA, DNB, Tetryl. All data were generated using GC-ECD analysis. 2 Sample location is in reference to the base plate of 81-mm mortar firing point; F = Front, L = Left, C = Center, R = Right.

61
Table 7 Explosives Concentrations in Soils collected at Yakima Central Impact Area Range 261, µg kg-1
Sample
No.
Munitions/
Target
Sample
Location2
Sample Depth,
cm
HMX
RDX
NG
2,4DNT
2,6DNT
2ADNT
4ADNT
PETN Discrete Samples
Y71 81mm IR3 Ru4 Surface <26 <3 <22 <0.8 <0.8 <2.5 <1.6 <16
Y72 155-mm #1 E Surface <26 <3 <22 <0.8 <0.8 <2.5 <1.6 <16 Y73 155-mm #1 N Surface <26 <3 <22 <0.8 <0.8 <2.5 <1.6 <16 Y74 155-mm #1 W Surface <26 <3 <22 <0.8 <0.8 <2.5 <1.6 <16 Y75 155-mm #1 S Surface <26 <3 <22 <0.8 <0.8 <2.5 <1.6 <16 Y76 155-mm #2 E Surface <26 <3 <22 <0.8 <0.8 <2.5 <1.6 <16 Y77 155-mm #2 S Surface <26 <3 <22 <0.8 <0.8 <2.5 <1.6 <16 Y78 155-mm #2 N Surface <26 <3 <22 <0.8 <0.8 <2.5 <1.6 <16 Y79 155-mm #2 W Surface 26 8 <22 <0.8 <0.8 <2.5 <1.6 <16 Y80 155-mm #3 N Surface <26 <3 <22 <0.8 <0.8 <2.5 <1.6 <16 Y81 155-mm #3 W Surface <26 <3 <22 <0.8 <0.8 <2.5 <1.6 <16 Y82 155-mm #3 S Surface <26 <3 <22 <0.8 <0.8 <2.5 <1.6 <16 Y83 155-mm #3 E Surface <26 <3 <22 <0.8 <0.8 <2.5 <1.6 <16 Y92 155-mm #4 C Surface <26 <3 <22 <0.8 <0.8 <2.5 <1.6 <16 Y93 155-mm #4 W Surface <26 <3 <22 <0.8 <0.8 <2.5 <1.6 <16 Y94 155-mm #4 N Surface <26 <3 <22 <0.8 <0.8 <2.5 <1.6 <16 Y129 155-mm #4 W Surface <26 <3 <22 <0.8 <0.8 <2.5 <1.6 <16 Y130 155-mm #4 S Surface <26 <3 <22 <0.8 <0.8 <2.5 <1.6 <16 Y133 155-mm #5 C Surface <26 <3 <22 <0.8 <0.8 <2.5 <1.6 <16 Y134 155-mm #5 N Surface <26 <3 <22 <0.8 <0.8 <2.5 <1.6 <16 Y135 155-mm #5 E Surface <26 <3 <22 <0.8 <0.8 <2.5 <1.6 <16 Y136 155-mm #5 S Surface <26 <3 <22 <0.8 <0.8 <2.5 <1.6 <16 Y137 155-mm #5 W Surface <26 <3 <22 <0.8 <0.8 <2.5 <1.6 <16
Y84 New 155-mm, dud
Under Nose Surface 26 719 7 3 49 58 <16
Y85 155-mm, WP FR Surface 1770 6720 3 22 0.8 0.8 2.5 <16
Y86 155-mm, WP BR Surface 5240 53500 3 22 0.8 0.8 2.5 <16
Y87
155-mm, IR Broken HE charge in sample F Surface <26 <3 <22 <0.8 <0.8 <2.5 <1.6 <16
Y88
155-mm, IR Broken HE charge in sample F 1.0 <26 <3 <22 <0.8 <0.8 <2.5 <1.6 <16
Y89
155-mm, IR Broken HE charge in sample F 5.0 <26 <3 <22 <0.8 <0.8 <2.5 <1.6 <16
Y90 105-mm, HE filled, Rusty Nose Surface <26 8 <22 144 3 9 5 115
Y91 105-mm, HE filled, Rusty Tail Surface <26 7 <22 <0.8 <0.8 <2.5 <1.6 <16
Y131 AFI5 Broken Casing Surface <26 <3 <22 <0.8 <0.8 <2.5 <1.6 <16 Y132 AFI Broken Casing Surface <26 <3 4 <0.8 <0.8 <2.5 <1.6 <16
Y56 105-mm Under HEP Surface <26 <3 12 <0.8 <0.8 <2.5 <1.6 <16
Y57 105-mm Under 2.5 <26 <3 12 <0.8 <0.8 <2.5 <1.6 <16

62
HEP
Sample No.
Munitions/
Target
Sample Location,6
m
Sample Depth,
cm
HMX
RDX
NG 2,4DNT
2,6DNT
2ADNT
4ADNT
PETN Composite Samples
YC38 155-mm #1 0-1.0 Surface <26 17 22 <0.8 <0.8 3 4 <16 YC39 155-mm #2 1.0 Surface <26 <3 <22 <0.8 <0.8 <2.5 <1.6 <16 YC40 155-mm #2 1.0 Surface <26 <3 <22 <0.8 <0.8 <2.5 <1.6 <16 YC41 155-mm #3 1.0 Surface <26 <3 <22 <0.8 <0.8 <2.5 <1.6 <16 YC42 155-mm #3 2.0-3.0 Surface <26 14 <22 <0.8 <0.8 <2.5 <1.6 <16 YC43 155-mm #3 5.0-6.0 Surface <26 15 <22 <0.8 <0.8 <2.5 <1.6 <16 YC44 155-mm #3 7.0-8.0 Surface <26 15 15 <0.8 <0.8 <2.5 <1.6 <16 YC50 155-mm #5 1.0 Surface <26 <3 <22 <0.8 <0.8 <2.5 <1.6 <16 1 The following undetected analytes were excluded from the table: TNT, TNB, DNA, DNB, Tetryl. All data were generated using GC- ECD analysis. 2 Sample location is relative to crater of particular munitions; E = East, N = North, W =West, S = South, C = Center, FR = Front of Round, BR = Back of Round 3 Illumination round. 4 Ruptured. 5 Air Force illumination round 6 Sample location is in reference to crater.
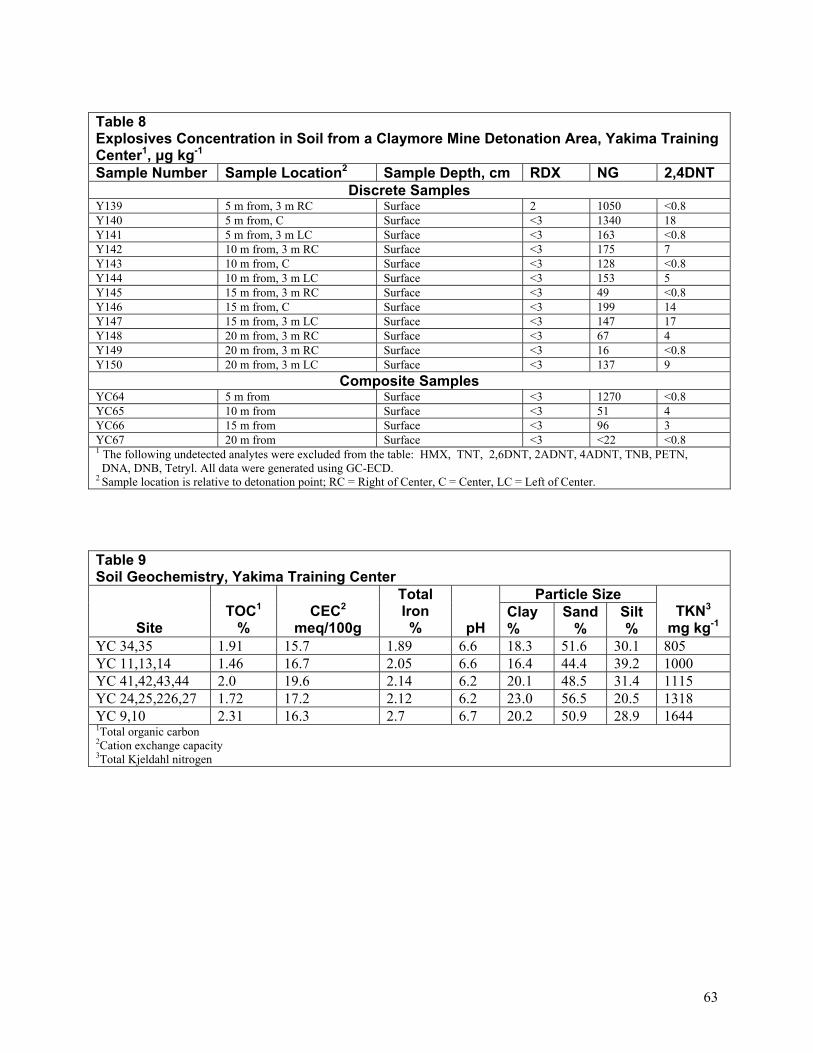
63
Table 8 Explosives Concentration in Soil from a Claymore Mine Detonation Area, Yakima Training Center1, µg kg-1 Sample Number Sample Location2 Sample Depth, cm RDX NG 2,4DNT
Discrete Samples Y139 5 m from, 3 m RC Surface 2 1050 <0.8 Y140 5 m from, C Surface <3 1340 18 Y141 5 m from, 3 m LC Surface <3 163 <0.8 Y142 10 m from, 3 m RC Surface <3 175 7 Y143 10 m from, C Surface <3 128 <0.8 Y144 10 m from, 3 m LC Surface <3 153 5 Y145 15 m from, 3 m RC Surface <3 49 <0.8 Y146 15 m from, C Surface <3 199 14 Y147 15 m from, 3 m LC Surface <3 147 17 Y148 20 m from, 3 m RC Surface <3 67 4 Y149 20 m from, 3 m RC Surface <3 16 <0.8 Y150 20 m from, 3 m LC Surface <3 137 9
Composite Samples YC64 5 m from Surface <3 1270 <0.8 YC65 10 m from Surface <3 51 4 YC66 15 m from Surface <3 96 3 YC67 20 m from Surface <3 <22 <0.8 1 The following undetected analytes were excluded from the table: HMX, TNT, 2,6DNT, 2ADNT, 4ADNT, TNB, PETN, DNA, DNB, Tetryl. All data were generated using GC-ECD. 2 Sample location is relative to detonation point; RC = Right of Center, C = Center, LC = Left of Center. Table 9 Soil Geochemistry, Yakima Training Center
Particle Size
Site TOC1
% CEC2
meq/100g
Total Iron %
pH
Clay %
Sand%
Silt%
TKN3 mg kg-1
YC 34,35 1.91 15.7 1.89 6.6 18.3 51.6 30.1 805 YC 11,13,14 1.46 16.7 2.05 6.6 16.4 44.4 39.2 1000 YC 41,42,43,44 2.0 19.6 2.14 6.2 20.1 48.5 31.4 1115 YC 24,25,226,27 1.72 17.2 2.12 6.2 23.0 56.5 20.5 1318 YC 9,10 2.31 16.3 2.7 6.7 20.2 50.9 28.9 1644 1Total organic carbon 2Cation exchange capacity 3Total Kjeldahl nitrogen

64
Table 10 Geochemistry of Water Samples, Yakima Training Center, mg L-1
Sample Location Ca Fe Mg Mn NO2/NO3 SO4 Cl YRS Well 23.3 <0.120 14.2 <0.004 0.13 14 J 7.8 Lmumma Creek 40.9 0.070 J 19.4 0.0082 <0.10 30 21 Range 55 18.8 0.150 9.30 0.0043 0.91 15 J 6.4 Selah Creek 21.4 0.250 10.8 0.0308 <0.10 12 J 7.1 Range 19 32.8 <0.120 17.2 0.0083 0.33 23 16 Lmumma Creek Impact Area 27.1 0.620 14.6 0.0828 0.24 15 J 10

65
Table 11 Explosives Concentrations in Soils at the Artillery Impact Area at Camp Guernsey1, µg kg-
1
Sample No. Sample
Location2 Sample Depth,
cm HMX RDX TNT 2ADNT 4ADNT TNB Discrete Samples
G1 1 m Surface-1.0 <26 <3 <1 11 10 <3 G2 1 m 1.0-5.0 <26 <3 <1 <2.5 <1.6 <3 G3 1 m 5.0-10.0 3 <3 <1 <2.5 <1.6 <3 G4 5 m Surface-1.0 <26 <3 <1 7 10 <3 G5 5 m 1.0-2.0 4 4 <1 5 9 <3 G6 5 m 2.0-5.0 <26 <3 <1 11 14 <3 G7 5 m 5.0-10.0 <26 <34 22700 1080 1080 200 G8 5 m 10.0-17.0 2 <3 <1 4 5 <3 G41 1 m, D Surface 4 13 <1 8 12 <3 G42 1 m, D Surface <26 <3 <1 <2.5 <1.6 <3 G43 5 m, D Surface <26 8 <1 6 10 <3 G44 5 m, D Surface <26 <3 <1 11 18 <3 G45 10 m, D 0.0-1.0 <26 <3 <1 6 10 <3 G46 10 m, D 1.0-5.0 <26 <3 <1 5 9 <3 G47 10 m, D 5.0-10.0 <26 <3 <1 6 10 <3 G48 10 m, D 10.0-15.0 <26 <3 <1 <2.5 <1.6 <3 G49 15 m, D 0.0-1.0 <26 <3 <1 11 15 <3 G50 15 m, D 1.0-5.0 <26 <3 <1 15 17 <3 G51 15 m, D 5.0-10.0 29 <3 <1 10 19 <3 G52 15 m, D 10.0-15.0 25 12 <1 3 6 <3
Composite Samples GC1 1 m Surface 116 <34 <16 <38 <32 <16 GC2 1 m Surface 186 <34 <16 <38 <32 <16 GC3 5 m Surface <26 3 6 11 19 <3 GC4 5 m Surface <26 4 <1 8 11 <3 GC5 10 m Surface <26 3 13 40 54 <3 GC6 10 m Surface <26 <3 13 14 23 <3 GC7 15 m Surface <26 <3 <1 6 11 <3 GC8 15 m Surface <26 3 <1 7 13 <3 1 The following undetected analytes were excluded from the table: 2,6DNT, 2,4DNT, TNB, PETN, DNA, DNB, Tetryl. All shaded data were generated using RP-HPLC analysis. All other data were generated using GC-ECD. 2 Sample location is relative to truck target; D = Down slope.

66
Table 12 Explosives Concentrations in Soils Near a Ruptured 500-lb Bomb, Camp Guernsey1, µg kg-1
Sample Number
Sample
Location2
Sample Depth,
cm
HMX
RDX
TNT
2,4DNT
2,6DNT
2ADNT
4ADNT
TNB
DNA Discrete Samples: Low Order 500-lb Bomb Prior to Detonation with C4
G63 4.7 m Surface <10000 <10000 8050000 <10000 <10000 <10000 <10000 48000 <10000 G64 2 m D Surface 204 38 4660 98 138 2980 4532 274 206 G65 1 m D Surface <2000 <2000 467000 <2000 <2000 9200 8000 3600 <2000 G66 ES Surface <10000 <10000 9440000 <10000 <10000 <10000 <10000 50000 <10000 G67 ES 1.0-3.0 4200 600 240000 <28 <19 <10000 <10000 3200 G68 ES 4.0-7.0 1280 <1000 42000 1960 <1000 19400 15900 960 <10000
G19
Piece of explosive in 500 lb bomb <0.1% <0.1% 99+% <0.1 % <0.1 % <0.1 % <0.1 % <0.2% <0.1 %
Sample Number
Sample
Location3
Sample Depth,
cm
HMX
RDX
TNT
2,4DNT
2,6DNT
2ADNT
4ADNT
TNB
DNA Discrete Samples after Bomb Detonated with C4
G24 Center Surface <2000 <2001 66700 <2000 <2000 7400 2900 1100 <2000 G69 NR Surface 178 <34 7400 <28 <19 10700 9190 202 G70 ER Surface <26 <34 45500 <28 <19 4360 2160 <16 G71 SR Surface <26 128 20500 246 98 5031 4040 340 142 G72 WR Surface <26 28 3980 <28 <19 1000 808 68 20 G90 3 m S Surface <2000 160 68000 <2000 <2000 2600 1360 560 <2000 G91 3 m S Surface <5000 <5000 150000 <5000 <5000 <5000 <5000 1200 <5000 G92 5 m S Surface <1000 <1000 29000 <1000 <1000 2160 1560 220 <1000 G93 5 m S Surface <1000 <1000 24100 <1000 <1000 1160 1860 200 <1000 G94 10 m S Surface <26 80 820 <28 <19 210 390 98 G95 10 m S Surface <26 14 482 <28 <19 <100 <100 <16
G96 WS, 3.5 m SW of C Surface <1000 120 28000 <1000 <1000 960 1160 160 <1000
G97 WS, 3.5 m from Edge Surface <2000 <2000 64350 <2000 <2000 2920 1920 600 <2000
G98 WS 3.5 m from Edge Surface <1000 <500 30200 <1000 <1000 3840 3320 220 <1000
G99 WS 3.5 m from Edge Surface <1000 140 34400 <1000 <1000 1960 1340 260 <1000
G100 WS 3.5 m from Edge Surface <2000 <2000 61500 <2000 <2000 1080 1240 360 <2000
G101 WS 3.5 m from Edge Surface <5000 <5000 81500 <5000 <5000 <5000 <5000 600 <5000
G102 WS 3.5 m from Edge Surface <10000 <10000 206000 <10000 <10000 <10000 <10000 1400 <10000
Sample Number
Sample
Location2
Sample Depth,
cm
HMX
RDX
TNT
2,4DNT
2,6DNT
2ADNT
4ADNT
TNB
DNA Composite Samples Prior to Detonation of Bomb
GC27 10 m from Surface <26 <34 602 <28 <19 34 60 8 GC28 10 m from Surface <26 <34 10 <28 <19 53 63 6 GC29 5 m from Surface <26 <34 320 <28 <19 270 348 <16 GC30 5 m from Surface <26 4 199 <28 6 180 254 9 GC31 3 m from Surface 18 134 4170 20 <19 808 990 98 48 GC32 3 m from Surface 44 36 21900 42 54 2070 2720 228
Sample
No.
Sample
Location3
Sample Depth,
cm
HMX
RDX
TNT
2,4DNT
2,6DNT
2ADNT
4ADNT
TNB
DNA

67
Composite Samples after Bomb Detonation with C4 GC51 3 m from Surface <26 <34 118000 146 96 1560 1730 878 120 GC52 3 m from Surface <26 <34 28000 <28 <19 740 840 220 <DL4 GC53 5 m from Surface <26 <34 13300 <28 <19 354 368 108 20 GC54 5 m from Surface <26 118 7010 <28 <19 246 704 84 16
GC55 10 m from Surface <26 <34 1120 <28 <19 50 44 <16 <DL
GC56 10 m from Surface <26 64 760 <28 <19 60 82 <16 <DL
1 The following undetected analytes were excluded from the table: NG, PETN, DNB, Tetryl. All shaded data were generated using RP- HPLC analysis. All other data were generated using GC-ECD. 2 Sample location is in reference to low order 500-lb bomb; D = Down slope, ES = Edge of shell. 3 Sample location is in reference to crater; C = Center, NR = North Rim, ER = East Rim, SR = South Rim, WR = West Rim, S = South, WS = Wheel Sample, SW = Southwest. 4 Less than detection limit. Co-elutes with NB; therefore, detection limits are uncertain.

68
Table 13 Explosives Concentrations in Soils near UXO Items Before and After Detonation with C4, Camp Guernsey1, µg kg-1 Sample
No. Munitions
/Target Sample
Location2
HMX
RDX
TNT
2,4DNT
2,6DNT
2ADNT
4ADNT
TNB Discrete Surface Samples Prior to Detonation with C4
G29 UXO 1, 155-mm3 3 m <26 <3 6 <0.8 9 279 316 <3 G30 UXO 1, 155-mm 3 m <26 <3 14 15 20 445 520 4 G31 UXO 1, 155-mm 5 m <26 <3 15 <0.8 <0.8 84 106 <3 G32 UXO 1, 155-mm 5 m <26 <3 7 <0.8 <0.8 36 58 <3 G33 UXO 1, 155-mm 10 m <26 <3 <1 <0.8 <0.8 6 12 <3 G34 UXO 1, 155-mm 10 m <26 <3 <1 <0.8 <0.8 9 16 <3 G35 UXO 2, 155-mm 3 m <26 6 <1 <0.8 <0.8 <2.5 <1.6 <3 G36 UXO 2, 155-mm 3 m <26 47 <1 <0.8 <0.8 <2.5 <1.6 <3 G37 UXO 2, 155-mm 5 m 4 <3 <1 <0.8 <0.8 4 7 <3 G38 UXO 2, 155-mm 5 m <26 <3 <1 <0.8 <0.8 <2.5 <1.6 <3 G39 UXO 2, 155-mm 10 m <26 <3 <1 <0.8 <0.8 <2.5 <1.6 <3 G40 UXO 2, 155-mm 10 m 2 <3 <0.8 <0.8 5 6 <3
G57 UXO 3, 155-mm, 81-mm 3 m 134 45 21 <0.8 <0.8 34 47 <3
G58 UXO 3, 155-mm, 81-mm 3 m 86 34 4 <0.8 <0.8 52 77 <3
G59 UXO 3, 155-mm, 81-mm 5 m 51 330 4 <0.8 <0.8 38 64 <3
G60 UXO 3, 155-mm, 81-mm 5 m 43 29 8 <0.8 <0.8 40 59 <3
G61 UXO 3, 155-mm, 81-mm 10 m 41 20 3 <0.8 <0.8 33 45 <3
G62 UXO 3, 155-mm, 81-mm 10 m 9 26 3 <0.8 <0.8 15 23 <3
Sample Number
Munitions /Target
Sample Location4
HMX
RDX
TNT
2,4DNT
2,6DNT
2ADNT
4ADNT
TNB
Discrete Surface Samples after Detonation with C4 G79 UXO 1, 155-mm 70 cm N 24200 173000 38600 <0.8 <0.8 <2.5 <1.6 <3 G80 UXO 1, 155-mm 70 cm E 20800 184000 50200 <0.8 <0.8 <2.5 <1.6 <3 G81 UXO 1, 155-mm 70 cm S 13000 118000 29700 <0.8 <0.8 <2.5 <1.6 <3 G82 UXO 1, 155-mm 70 cm W 32400 225000 84700 <0.8 <0.8 <2.5 <1.6 <3 G83 UXO 1, 155-mm C 82800 541000 294000 <0.8 <0.8 <2.5 <1.6 <3 G84 UXO 1, 155-mm 3 m SW 19400 124000 84800 <0.8 <0.8 <2.5 <1.6 <3 G85 UXO 1, 155-mm 3 m SW 2120 19100 9620 <0.8 <0.8 <2.5 <1.6 <3 G86 UXO 1, 155-mm 5 m SW 10600 77800 25600 <0.8 <2.5 <1.6 <3 G87 UXO 1, 155-mm 5 m SW 8840 46300 17200 <0.8 <0.8 <2.5 <1.6 <3 G88 UXO 1, 155-mm 10 m SW 3240 22000 11700 <0.8 <0.8 <2.5 <1.6 <3 G89 UXO 2, 155-mm 10 m SW 6000 36200 17600 <0.8 <0.8 <2.5 <1.6 <3 G20 UXO 2, 155-mm 50 cm N <26 <3 7 <0.8 <0.8 <2.5 <1.6 <3 G21 UXO 2, 155-mm 50 cm E 2 9 <1 <0.8 <0.8 2 6 <3 G22 UXO 2, 155-mm 50 cm S 33 <3 101 <0.8 <0.8 6 6 <3 G23 UXO 2, 155-mm 50 cm W 55 5 26 <0.8 <0.8 4 6 <3 G73 UXO 2, 155-mm 3 m <26 <34 2040 102 <19 <38 <32 <16 G74 UXO 2, 155-mm 3 m <26 <3 <1 <0.8 <0.8 <2.5 <1.6 <3 G75 UXO 2, 155-mm 5 m <26 <3 <1 <0.8 <0.8 <2.5 <1.6 <3 G76 UXO 2, 155-mm 5 m <26 4 281 <0.8 <0.8 56 50 <3 G77 UXO 2, 155-mm 10 m <26 <3 <1 <0.8 <0.8 <2.5 <1.6 <3 G78 UXO 2, 155-mm 10 m <26 <3 <1 <0.8 <0.8 <2.5 <1.6 <3
G9 UXO 3, 155-mm, 81-mm NR 708 540 518 <28 <19 202 156 50
G10 UXO 3, 155-mm, ER 111 928 78 <0.8 <0.8 <2.5 <1.6 <3

69
81-mm
G11 UXO 3, 155-mm, 81-mm SR 91 180 153 <0.8 <0.8 145 163 <3
G12 UXO 3, 155-mm, 81-mm WR 304 155 35 <28 <19 59 75 <16
G13 UXO 3, 155-mm, 81-mm 3 m 500 120 24700 <28 <19 1680 1720 240
G14 UXO 3, 155-mm, 81-mm 3 m 254 158 1340 <28 <19 1480 1540 28
G15 UXO 3, 155-mm, 81-mm 5 m 173 356 111 <0.8 <0.8 90 98 <3
G16 UXO 3, 155-mm, 81-mm 5 m 278 204 5740 <28 <19 332 456 48
G17 UXO 3, 155-mm, 81-mm 10 m 101 41 296 <0.8 <0.8 72 91 <3
G18 UXO 3, 155-mm, 81-mm 10 m 762 98 18 <0.8 <0.8 114 190 <3
Sample Number
Munitions /Target
Sample Location2
HMX
RDX
TNT
2,4DNT
2,6DNT
2ADNT
4ADNT
TNB
Composite Surface Samples Prior to Detonation with C4 GC9 UXO 1, 155-mm 3 m <26 3 8 5 <0.8 194 267 <3 GC10 UXO 1, 155-mm 3 m <26 <3 76 <0.8 5 145 179 <3 GC11 UXO 1, 155-mm 5 m <26 16 10 <0.8 <0.8 250 268 5 GC12 UXO 1, 155-mm 5 m <26 <3 18 5 <0.8 118 145 <3 GC13 UXO 1, 155-mm 10 m <26 <3 7 <0.8 3 67 89 <3 GC14 UXO 1, 155-mm 10 m <26 <3 210 <0.8 4 154 177 <3 GC15 UXO 2, 155-mm 3 m <26 2 <1 <0.8 <0.8 4 6 <3 GC16 UXO 2, 155-mm 3 m <26 3 <1 <0.8 <0.8 4 6 <3 GC17 UXO 2, 155-mm 5 m <26 4 <1 <0.8 <0.8 9 12 <3 GC18 UXO 2, 155-mm 5 m 193 2 <1 <0.8 <0.8 8 6 <3 GC19 UXO 2, 155-mm 10 m <26 <3 <1 <0.8 <0.8 5 7 <3 GC20 UXO 2, 155-mm 10 m <26 2 <1 <0.8 <0.8 7 7 <3
GC21 UXO 3, 155-mm, 81-mm 3 m 173 103 4 <0.8 <0.8 58 70 <3
GC22 UXO 3, 155-mm, 81-mm 3 m 66 39 29 <0.8 <0.8 43 61 <3
GC23 UXO 3, 155-mm, 81-mm 5 m 176 89 20 <0.8 <0.8 119 161 <3
GC24 UXO 3, 155-mm, 81-mm 5 m 530 299 551 4 3 222 436 11
GC25 UXO 3, 155-mm, 81-mm 10 m 216 70 128 <0.8 <0.8 84 119 6
GC26 UXO 3, 155-mm, 81-mm 10 m 324 92 40 <0.8 <0.8 111 147 <3
Sample Number
Munitions /Target
Sample Location3
HMX
RDX
TNT
2,4DNT
2,6DNT
2ADNT
4ADNT
TNB
Composite Surface Samples after Detonation with C4 GC45 UXO 1, 155-mm 3 m 17200 121000 60800 98 <0.8 110 98 <3 GC46 UXO 1, 155-mm 3 m 9800 89200 23500 84 <0.8 <2.5 112 <3 GC47 UXO 1, 155-mm 5 m 9000 72800 39100 64 <0.8 178 198 <3 GC48 UXO 1, 155-mm 5 m 8300 92300 19400 46 <0.8 92 22 <3 GC49 UXO 1, 155-mm 10 m 1530 1010 5741 <0.8 <0.8 <2.5 <1.6 <3 GC50 UXO 1, 155-mm 10 m 1870 8940 3060 <28 <19 54 80 26 GC39 UXO 2, 155-mm 3 m 3 3 145 8 3 10 12 <3 GC40 UXO 2, 155-mm 3 m 10 2 77 5 <0.8 5 6 <3 GC41 UXO 2, 155-mm 5 m <26 <3 92 5 <0.8 7 10 <3 GC42 UXO 2, 155-mm 5 m <26 <3 73 3 <0.8 6 10 <3 GC43 UXO 2, 155-mm 10 m <26 <3 <1 <0.8 <0.8 <2.5 <1.6 <3 GC44 UXO 2, 155-mm 10 m <26 <3 <1 <0.8 <0.8 <2.5 <1.6 <3

70
GC33 UXO 3, 155-mm, 81-mm 3 m 520 1000 844 <28 <19 286 290 34
GC34 UXO 3, 155-mm, 81-mm 3 m 152 174 29400 <28 <19 586 550 <16
GC35 UXO 3, 155-mm, 81-mm 5 m 3200 5480 6200 <28 <19 478 514 74
GC36 UXO 3, 155-mm, 81-mm 5 m 602 113 93 <28 <19 100 139 <16
GC37 UXO 3, 155-mm, 81-mm 10 m 180 80 38 <28 <19 57 85 <16
GC38 UXO 3, 155-mm, 81-mm 10 m 79 77 40 <28 <19 65 93 <16
1 The following undetected analytes were excluded from the table: NG, TNB, PETN, DNA, DNB, Tetryl. All shaded data were generated using RP-HPLC analysis. All other data were generated using GC-ECD. 2 Sample location is relative to the round. 3 The 155-mm is an artillery round; the 81-mm is a mortar round. 4 Sample location is relative to crater after detonation; N = North, E = East, S = South, W = West, C = Center, SW = Southwest. Table 14 Geochemistry of Groundwater at Camp Guernsey Springs, mg L-1
Sample Location Ca Fe Mg Mn NO2/NO3 SO4 Cl Deer Corn Springs 55.3 <0.120 25.2 <0.004 1.1 28 6.8 Ryan Springs 56.4 0.400 22.5 0.058 0.030 J 9.4 J 6.5 Sawmill Springs 56.9 0.130 25.8 0.002 J 0.96 18 J 5.1 Pet Springs 49.7 0.093 J 24.3 0.001 J 0.98 27 5.3 Table 15 Firing Record of the Most Commonly Fired Munitions for 1999-2001 at Yakima Training Center 1
Round DODIC Number 2 1999 2000 2001 3 Total 60-mm HE M720 B652 1049 116 1552 2717 66-mm rocket HE M72 H557 448 100 -- 548 Sum 81-mm HE C228, C236, C256 2634 1850 1904 6388 Sum 84-mm HE C382, C383, C995 418 227 238 883 90-mm HE C280, C282 165 -- -- 165 105-mm HE M1 C445 1413 2534 1918 165 106-mm HE AT M344A1 C650 36 -- -- 36 Sum 107-mm (4.2-in) HE C697, C699 412 -- 77 489 Sum 120-mm HE C379, C623, C787, C788 2663 1385 1923 5971 Sum 155-mm HE D510, D544, D563, D579 3530 2866 2686 9082 1 Records include data from the RFMS database acquired from January 1999 through September 2001 as provided by SFC Antonio Felix. 2 Department of Defense Identification Code. 3 Data through September 2001 only. 4 Indicates no record of firing this ammunition type during this year.

71
Table 16 Firing Record of the Most Commonly Fired Munitions for 1996-2001 at Guernsey Training Center 1
Round DODIC Number
2 1996 1997 1998 1999 2000 2001 3 Total Sum 60-mm HE B632, B642 204 368 453 250 72 -- 4 1347 81-mm HE M374 C256 46 373 191 300 184 300 1394 90-mm HEAT M371A1 C282 -- 413 -- -- -- -- 413 105-mm HE M1 C445 1250 2 -- -- 2060 -- 3312 107-mm (4.2-in) HE M392A2 C697 1842 240 800 2175 -- -- 5057 Sum 155-mm HE D510, D544 6681 2540 2573 5447 5684 2713 25638 8-in HE M106 D680 1201 -- -- 1 1 -- 1203 1 Records include data provided by Mr. Guy Mosier, Camp Guernsey Training Center. 2 Department of Defense Identification Code. 3 Data through October 2001 only. 4 Indicates no record of firing this ammunition type during this year.

72
Table 17 High Explosive Load Carried by Munitions Items Commonly Fired at Yakima Training Center and Camp Guernsey1
Main
Charge (g)
Supplement
al Charge
Pellet
Booster
Pellet Auxiliary Booster
Round
DODIC2 RDX TNT HE3 Wt, g HE Wt, g HE Wt, g
Main Charge Total, g
M72 H557 (213 HMX)4 90.7 - - Tetryl 5.60 - -
M106 D680 - 16,465 TNT 134 - - - - 16,465 60-mm B632 - 156 - - Tetryl 259 Tetryl 4.76 188 60-mm B6425 114 74 - - RDX 7.9 HMX 144 354 81-mm C2365 571 372 - - - - - - 943 81-mm C2565 571 372 - - RDX 23 RDX 0.14 943 84-mm C382 - - - - - - - - - 84-mm C383 - - - - - - - - - 84-mm C995 - - - - - - - - - 90-mm C280 - 934 - - Tetryl 351 Tetryl 3.8 934 90-mm C2825 467 304 - - Tetryl 7.9 Tetryl 0.95 771 105-mm C445 - 2086 TNT 136 - - - - 2086 105-mm C4455 1251 814 TNT 132 - - - - 2086 106-mm C6505 759 494 - - RDX 8.0 - - 1253 107-mm C6995 1565 1017 TNT 136 - - - - 2582 107-mm C6975 1565 1017 TNT 136 - - - - 2582 120-mm C6235 1790 1170 ?6 ? RDX 7.9 HMX 1.89 2990 120-mm C7877 ? - - - - - - - ? 120-mm C788 - 2100 - - RDX 12.5 - - 2100 155-mm D5105 4014 2609 - - - - - - 6623 155-mm D5445 4191 2725 TNT 136 - - - - 6916 155-mm D544 - 6622 TNT 136 - - - - 6622 155-mm D563 2805 - - - - - - - 2805 155-mm D5795 4082 2653 TNT 136 - - - - 6735 1 Sources of data are the Munitions Items Disposition Action System (MIDAS); personal communication Mr. Mark Serben, Office of the Product Manager for Mortar Systems, TACOM, Picatinny Arsenal, NJ, March 19, 2000; U. S. Army (1994). 2 Department of Defense Identification Code. 3 High explosive. 4 HMX, not RDX. 5 Main charge is Composition B, which is typically composed of 60 percent RDX and 39 percent TNT. 6 Unable to determine presence or quantity. 7 Composition A3 (91 %, 9 % wax). Mass of the HE was unavailable.

73
Table 18 Mean Dud and Low Order Detonation Rates for Munitions Items Commonly Used at Yakima Training Center and Camp Guernsey1
Round DODIC2 Items Tested DUDs, % Low Orders, % M72 H557 2,722 4.52 0.04 M1063 D680 160 0 0 M720 B652 3,838 1.07 0 60-mm4 B632 7,792 3.35 0 60-mm B642 3,838 1.07 0 81-mm5 C228 16,435 2.28 0.08 81-mm5 C236 16,435 2.28 0.08 81-mm6 C256 9,122 2.16 0.02 84-mm C382 U7 U U 84-mm C383 U U U 84-mm8 C995 658 0 0.15 90-mm C280 838 13.8 0 90-mm C282 870 2.76 0.80 105-mm9 C445 10,003 4.39 0.07 106-mm C650 1,065 3.66 0 107-mm C699 1,518 2.24 0.02 120-mm C379 U U U 120-mm C623 U U U 120-mm C787 U U U 120-mm C788 270 2.59 0 107-mm C697 U U U 155-mm D510 U U U 155-mm D544 6,216 2.75 0.02 155-mm D563 U U U 155-mm10 D579 1,152 0 0 1 Values based on test data acquired by U. S. Army Defense Ammunition Center, McAlester, OK (Dauphin and Doyle 2000). 2 Department of Defense Identification Code. 3 Dud and low order rates depend upon kind of fuze. With the M582 fuze the dud rate was 5.11% (9 fired) and the low order rate was zero. With other fuzes the dud and low order rates were zero. 4 Three models were tested. Values are derived from combining data for all models. 5 This specific DODIC numbered item was not tested. Values are derived from sum of all 81-mm mortars tested. 6 Four models were tested. Values are derived from combining data for all models. 7 Data were unavailable 8 Two models were tested. Values are derived from combining data for both. 9 One model was tested with nine fuzes. Values are derived from combining data for all. 10 Various models and fuzes were tested. Values are derived from combining data for all.

74
Figure 1. Location of Yakima Training Center, Washington
* Yakima Training Center

75
Figure 2. Antitank Range at Yakima Training Center, Washington, soil sampling near an armored
personnel carrier target.

76
Figure 3. Soil sampling locations around armored personnel carrier target at Yakima Antitiank Range.

77
Figure 4. Ruptured LAW Rocket at Yakima Antitiank Range.

78
Figure 5. MPRC tank firing range at Yakima Training Center. Figure 6. Soil sampling locations at tank firing point on MPRC Range at Yakima Training Center.

79
Figure 7. Soil sampling locations at the firing point of 155-mm howitzers at Yakima Training Center. Figure 8. Soil sampling locations at a direct fire 155-mm howitzer firing point, Yakima Training Center.

80
Figure 9. Soil sampling locations at a firing point for 81-mm mortars at Yakima Training Center. Figure 10. Soil sampling locations in an area of the Central Impact area at Yakima Training Center. Samples were collected within a bomb crater that also had a 155-mm crater within.
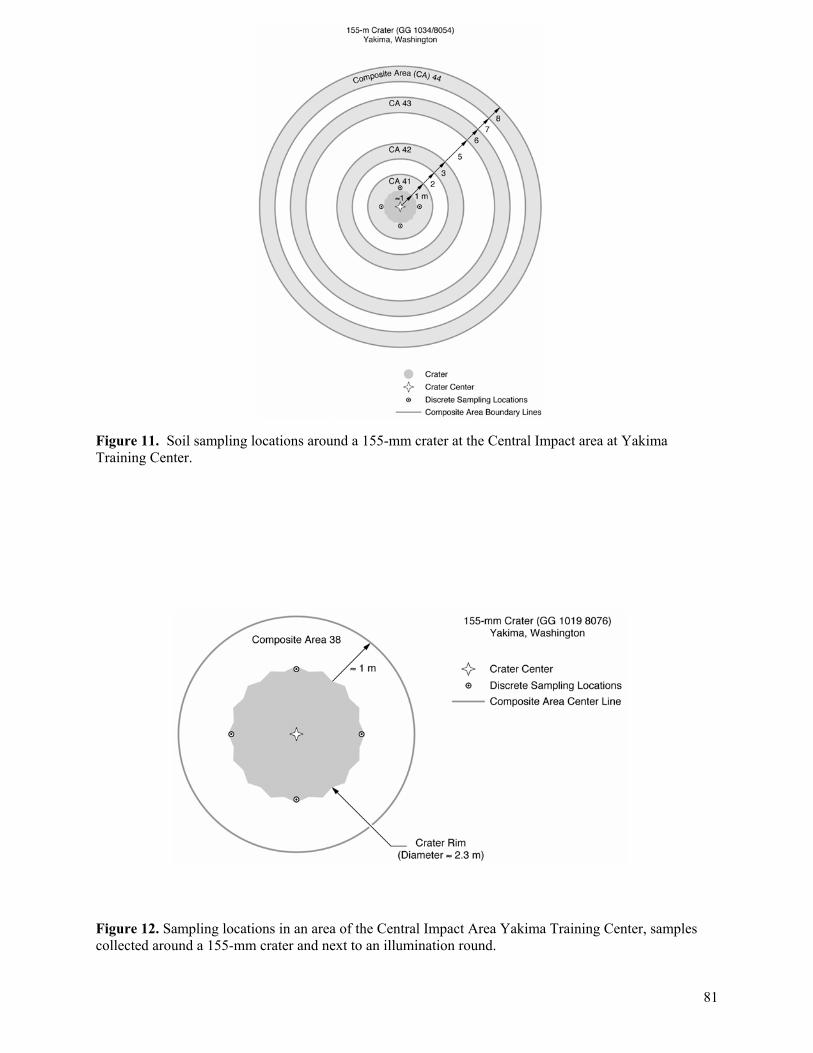
81
Figure 11. Soil sampling locations around a 155-mm crater at the Central Impact area at Yakima Training Center. Figure 12. Sampling locations in an area of the Central Impact Area Yakima Training Center, samples collected around a 155-mm crater and next to an illumination round.

82
Figure 13. Sampling location in an area of the Central Impact Area, Yakima Training Center, composite sample collected around a 155-mm crater Figure 14. Soil sampling locations in front of the location where a Claymore mine had been detonated at the Yakima Training Center.

83
Figure 15. Map of artillery impact area at Camp Guernsey, Wyoming. Figure 16. Artillery target at Camp Guernsey, Wyoming.
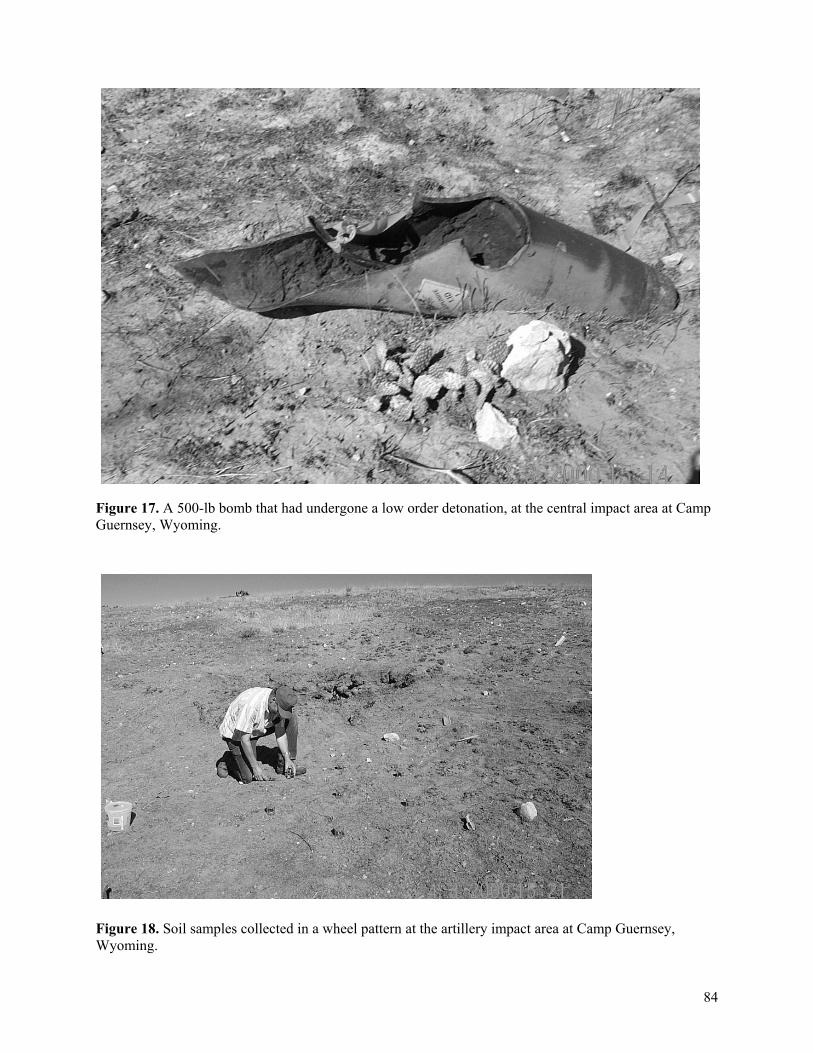
84
Figure 17. A 500-lb bomb that had undergone a low order detonation, at the central impact area at Camp Guernsey, Wyoming. Figure 18. Soil samples collected in a wheel pattern at the artillery impact area at Camp Guernsey, Wyoming.
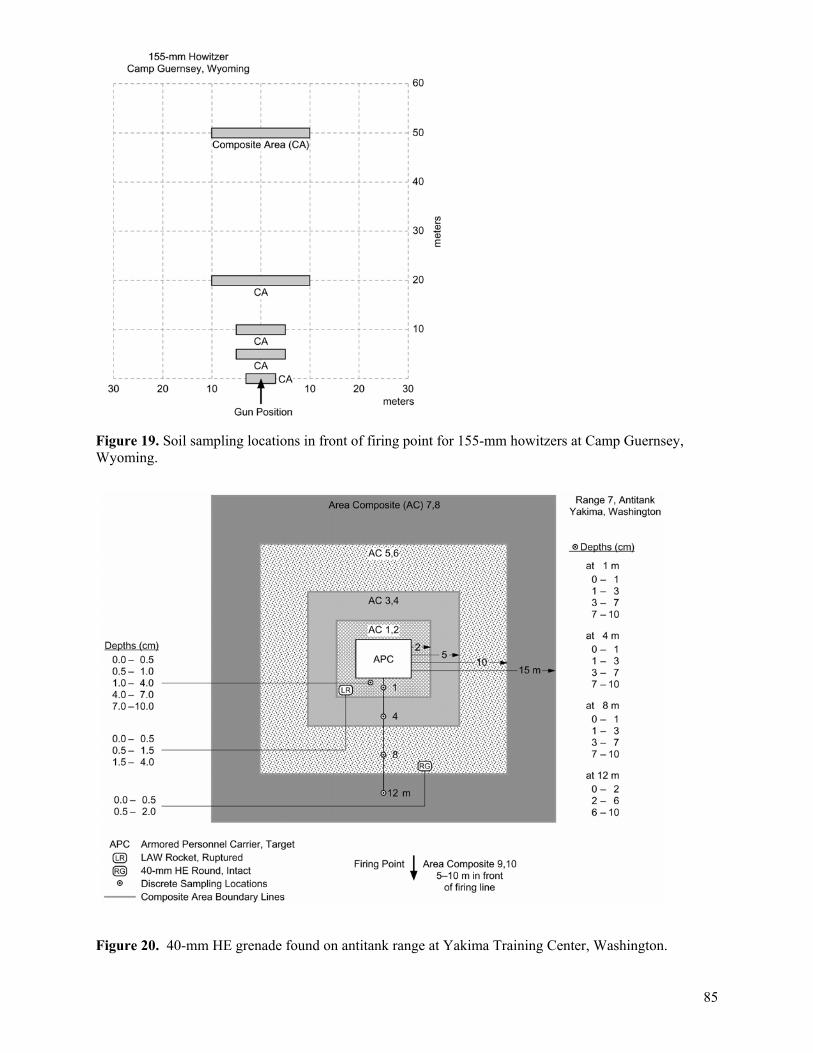
85
Figure 19. Soil sampling locations in front of firing point for 155-mm howitzers at Camp Guernsey, Wyoming. Figure 20. 40-mm HE grenade found on antitank range at Yakima Training Center, Washington.

86
Figure 21. Soil sampling locations around truck target at artillery impact area at Camp Guernsey, Wyoming. Figure 22. Soil sampling locations around low-order 500-lb bomb at Camp Guernsey, Wyoming.

87
3 Assessment of CFB Shilo Training Areas Contamination by Explosives and Other Contaminants
Introduction
A comprehensive environmental assessment was conducted at Canadian Forces Base (CFB) Shilo
during the month of September 2001(Phase II). Soil, biomass, groundwater and surface water were all
tested for a wide variety of contaminants. This report will outline the work performed and should provide
the reader with both an understanding of the methodology of the sampling campaign, and the historical
context of the contamination.
Range History Canadian Forces Base Shilo was established in 1910 when the rapid influx of settlers onto the
prairies persuaded the Militia Department (now the Department of National Defence) to secure areas of
the prairies for military exercises. Initially called Sewell Camp, Shilo was established about 200 km west
of Winnipeg on 96 000 acres of rolling prairie. Its size and location were carefully chosen to be
appropriate for use as an artillery training range, as well as for all arms maneuvers.
World War one saw the camp explode in size, reaching a peak of 30,000 all-ranks in 1917.
However, following the war it was reduced in size and again became seasonal. It was only in 1940 that a
permanent camp was constructed in preparation for the renewal of hostilities, and the base as it exists
today began to take shape. Following WWII, Shilo became the permanent home to the Royal Canadian
Artillery, and the Royal Canadian School of Artillery was established in 1960.

88
In 1965-66, a West German artillery unit carried out cold weather trials on their equipment at
Shilo. This marked the beginning of a long relationship with the German military. In 1974 mechanized
troops from the Federal Republic of Germany began training at Shilo under the GATES (German Army
Training Exchange Shilo) agreement. The closure of GATES in 2000 prompted an environmental study,
conducted by Defence Research Establishment Valcartier (DREV), to assess the impact that 25 years of
intensive armoured training had on the prairie ecosystem. Of particular concern were the MILAN
missiles that the Germans trained with as these contained Thorium 232, a radioactive element used as a
tracer in the guidance system.
The ammunition expended since 1910 is nothing less than astounding, and gives an excellent idea
of the magnitude of the Unexploded Ordnance (UXO) challenge. Canadian expenditures are estimated at
2,185,000 rounds, and German expenditures at 299,000 rounds for a total of nearly 2.5 million rounds.
Given a conservative dud rate of 5%, 125 000 rounds of dud munitions are left over an area of 96,000
acres. The majority of the ammunition that has been fired is either 105 or 155 mm artillery rounds and
105 mm tank rounds. These munitions are all quite large and contain several kilograms of explosive
filling. Even if level one clearance is done on a regular basis, the casual observer at Shilo will find
several unexploded munitions in the course of a day. As it is reasonable to assume that most of the dud
rounds are buried, the potential environmental impact is obvious. Therefore, the potential for the
contamination of the soils, biomass or groundwater by explosive is considered relatively high.
It should also be pointed out that prior to 1970, records were not kept with the same accuracy as
they are today, and in fact the numbers quoted here could be even higher. As well, experimental trials
have been conducted at CFB Shilo by both the Canadian and German military. These secret trials left no
record of either the number or the type of rounds that were fired.
There are thousands of unexploded rounds at CFB Shilo as a legacy of 90 years of military
training. The goal of the present study was to identify the environmental impacts these munitions are
causing, including the potential for explosive contamination of the training ranges and their surroundings.
Environmental assessment
In 2000, an environmental assessment of Canadian Forces Base Shilo was tasked to Defence
Research Establishment Valcartier by DGE, prior to the GATES closure. The first characterization of the
Shilo battleruns was accomplished in the fall of 2000 following the departure of Germans in order to
establish the impact of the past training activities on the environment. This initial work was done under

89
considerable time and funding constraints and indicated that a more extensive and detailed assessment
was necessary. This second phase of the characterization of Shilo training ranges was conducted in
September 2001 and is the subject of this report. Dr Guy Ampleman, Dr Sonia Thiboutot, Mr. Jeff Lewis
and André Marois from DREV were on site and led the characterization work. Dr Richard Martel, Jean-
Marc Ballard and Catherine Gauthier from Institut National de la Recherche Scientifique (INRS) led the
hydrogeological characterization work. Eight Defence Construction Canada employees were on site to
assist the field work and to lead the sub-contractors involved for the drilling of piezometers, proofing of
the drilling locations by electromagnometers (EM-61) and the analysis of samples for other parameters
than energetic materials.
Distinguishing between an environmental assessment and environmental remediation is
important. The work done at Shilo was purely a measurement of the contaminants present in the
environment at CFB Shilo. The purpose of this work was simply to identify the problem if present prior
to any cleanup. While assessments can be done in weeks or months, remediation efforts usually require
years. This environmental evaluation was initiated primarily to determine Germany’s share in any clean
up or remediation activities. Now the goal is more oriented to understanding and sustaining the training
activities as well as understanding the fate of explosives in the training area environment.
This assessment addressed four areas of concern, the contamination of surface soils, of the
aquifer, of the biomass and of the surface water. The contamination patterns of surface soils around
targets and in battleruns were evaluated. The unconfined aquifer underlying the training area was assessed
(hydrostratigraphy, hydraulic conductivity, groundwater flow direction) and the groundwater quality were
characterized. The extent of biomass contamination in the worst-case scenario locations (around targets)
and in battleruns was assessed and finally, the surface water quality was evaluated.
In previous DREV studies, surface soils were contaminated by energetic materials and metals in
training ranges, especially in anti-tank ranges. On the other hand characterizing the groundwater quality
is also critical, especially on such a large range. Metals and energetic materials are both mobile in sandy
environments and may, therefore, migrate with the groundwater, thus presenting a threat to human health
and the environment. Moreover, combined with groundwater quality, groundwater flow had to be
carefully assessed to determine its velocity and direction to evaluate the amplitude of a potential problem.
This groundwater serves as a drinking water source for the base, is used to sustain aquatic ecosystems,
and also serves for irrigation. Consequently, any contamination could impact human health, the irrigated
crops and the aquatic ecosystems. In fact, groundwater flowing under CFB Shilo discharges into surface

90
water in many springs southeast of the range discharging into the Assiniboine River and into the Marsh
Creek to the north of the range. Both are highly sensitive areas of potential wildlife and humans receptors.
Epinette Creek to the north is also used for irrigation. Biomass, such as prairie grass, has proven to bio-
accumulate both metals and energetic materials. Therefore, prairie grass could represent a high potential
intake source of these compounds for wildlife. Finally, the surface water quality had to be verified since
wildlife has access to it and it can also be used for irrigation.
Sampling strategies
Soil and biomass sampling was conducted under DREV’s supervision while surface water and
groundwater sampling was conducted with the guidance of INRS. DREV and INRS have both developed
expertise in the characterization and the environmental fate of energetic materials in Canadian Forces
training ranges and open detonation ranges. For this particular sampling campaign, Defence Construction
Canada (DCC) was supporting DREV and INRS during the phase II by hiring the drillers, all the
necessary personnel, supplying materials, etc. Funding was provided mainly from Defence Land Force
Requirement (DLFR) for the hydrogeologic portion of the study and from Stategic Environmental
Research and Development Programme (SERDP) for the surface soil and biomass sampling portion of the
study. The phase I of the Shilo characterization was performed during September-October 2000 following
Germans’ departure and the phase II was performed during September 2001. Drs. Judy Pennington and
Thomas Jenkins were supposed to attend the sampling campaign in mid-September, but due to the
September 11th events they were unfortunately not able to travel to Canada
Soils The Germans conducted the majority of their training at five battleruns at CFB Shilo. Three of
these battleruns were sampled during the first characterization (phase I)(Berlin, Deilinghofen and Essen).
These battleruns were the focus of the soil and biomass sampling campaigns. During the second phase,
the two remaining battleruns, Aachen and Cologne, rifle ranges, grenade ranges and a small part of Essen
named Klein Essen were sampled for biomass and soils. Since a pattern of contamination was observed
around targets in the battleruns during the first phase, more efforts were done during phase II to sample
biomass and soils around targets. A battlerun is a loosely defined area approximately 5 km long and up to
2 km wide where tanks and other armoured vehicles conduct mounted exercises. Various types of targets
were used, most of them were pop-up targets not designed to stop the rounds. Therefore, these rounds
could end up landing just about anywhere. If live firing leads to the accumulation of contaminants in
soils, higher levels should be found at the end of battleruns since the ammunition fired should end up

91
towards the far end. Therefore, the sampling involved the collection of linear composite samples at 20,
40, 60, 100 and 120 % of the length of each ranges as illustrated in figure 1. The start point for each of the
linear composite samples was pinpointed using a GPS, cross-referenced with a topographic map of the
base. From the start point, small amounts of soil were collected randomly while walking perpendicularly
across the battlerun. Each sample was normally approximately 1 kg, and was composed of a minimum of
20 discrete samples. A large effort was also dedicated to the identification of specific “hot-spots” such as
broken UXOs. Soil and biomass samples were then collected around these potential “hotspots”, such as
near UXOs that had broken open. Few of such hotspots were found. This can be explained by the type of
training conducted in battleruns. Pop-up targets do not stop rounds, which is quite different to the
situation on anti-tank training ranges. Anti-tank rocket ranges usually use static targets – often WW II
vintage tanks – and these massive targets often cause dud rounds to break open on impact. The situation
with pop-up targets is arguably better than that on anti- tank ranges because the explosive content of the
shell is not spread into the environment. A circular sampling strategy used around targets to collect
biomass and soil samples consisted in building composite samples out of 20 sub-samples of soils or
biomass collected at specific distances such as 0-1, 1-3, 3-5, 5-10 m as illustrated in figure 2.
Figure 1: Linear sampling used in battleruns for soils sampling
Battlerun
Park
plat
z
Access Road
20%
40%
60%
80%
100%
120%
1 km
2 km
End of battlerunBattlerun
Park
plat
z
Access Road
20%
40%
60%
80%
100%
120%
1 km
2 km
End of battlerun
Pop-up Target
3 m
5 m
10 m

92
Figure 2: Circular sampling around target in battleruns for soils and biomass sampling
Finally, specific soil samples were collected for thorium analyses in suspected areas where Milan missile
debris was found. In these instances, missile debris was used as sources for the circular sampling strategy.
When soils were taken as background samples, they were collected in a random manner, in a circular
pattern of approximately 20 meters. A minimum of 30 sub-samples was collected to form each
background sample.
Biomass As mentioned earlier, biomass samples were simply composite samples of different plant species.
Given the prairie ecosystem at Shilo, most of the plants collected were grasses or small shrubs. Only the
aboveground parts of the plant were sampled, no roots were included. Each composite sample was
composed of many different discrete samples taken in a roughly 10-meter diameter area. One composite
sample was generally around one litre in volume of compacted biomass. During Phase II, no biomass
sample was collected in the battleruns using the linear sampling strategy since no pattern of
contamination was observed during Phase I. Our efforts for biomass sampling during Phase II were
concentrated in backgrounds, around hot spots, around targets in battleruns, in rifle and grenade ranges.
Biomass provides a powerful indicator of whether contaminants are entering the food chain.
Herbivorous animals will consume contaminants, either in the cellular structure or on the surface of
plants. These contaminants will be concentrated in body tissues, and passed on to the carnivorous
animals that prey on the plant eaters, where they are concentrated again. The classic example of this
process is the peregrine falcon, which was pushed to the brink of extinction due to extremely high tissue
levels of the pesticide DDT.
No standard guidelines for the presence of various contaminants in biomass exist. Different
plants will absorb different levels of a given contaminant, making guidelines virtually impossible.
However, the simple presence of a contaminant in plant tissues gives a reasonable indication that the
contaminant may be in the food chain, and it may cause damage higher up the chain where it becomes
more concentrated.
Metals that could be either inside the plants following bio-accumulation (phytoremediation) or on
the plant (accumulated by deposition of dust) were evaluated by digesting the biomass samples or a
portion of the biomass samples was leached in distilled water and analysed. This was used to discriminate

93
the metal that was found in or on the plants. For energetic materials, lyophilisation of the entire biomass
material was done so the concentrations represent the total amounts in and on the plants.
Groundwater
Monitoring wells were installed according to the ASTM-D5092-90 standard. These wells were
placed according to available groundwater flow data obtained during phase I, and were spread throughout
the base to complete the piezometric map. Prior to sampling, each well was thoroughly developed.
Development involves the removal of the fine sedimentary particles in the soil which are present at the
level of the aquifer, and which would otherwise contaminate the sample. Once developed, water samples
were taken to test for explosive residues and thorium as well as more common contaminants such as
heavy metals and solvents.
Slug tests were done on all developed wells for an estimation of hydraulic conductivity of the
sand formation. This was done by injecting compressed air into the well in order to drop the water table
between 30 and 70 cm below its natural static level. After an instantaneous pressure release the rise in
water table was recorded with a Level Logger pressure gauge (from Solinst). Data interpretation was done
with the Bower Rice method to evaluate the hydraulic conductivity. As well, the horizontal component
of groundwater velocity and direction was measured in situ with a flowmeter (Geoflo 40L). The Geoflo
40L is a probe with eight thermistors placed around a heat source. The instrument measures the
propagation and the deformation of a heat pulse in the groundwater. In dynamic systems like an aquifer,
the heat pulse propagates with an elliptic shape and the long-axis is oriented in the groundwater flow
direction.
Water level measurements were made after well development. An electronic measuring tape
(RST) with a precision of ± 0.5 cm was used to record the water depth in every well in relation to the top
of the PVC tubing. As well, pH, conductivity, and redox potential were measured electronically at each
well. The position and elevation of the top of each well PVC casing was determined using the two GPS
technique. The GPS locations (northing and easting) of monitoring wells and the elevations of the top of
the PVC tubing served to construct the piezometric map. The error associated with GPS location is ± 2 m
whereas the precision on elevation was ± 0.01 m with this technique.
Surface Water Surface water was sampled from streams, rivers and springs, both on the base and outside its
boundaries as background samples. Surface water from these sources is replenished largely from

94
subsurface sources. Therefore, surface water can provide useful information without having to drill and
develop monitoring wells. In addition, samples can be taken in areas which otherwise could not be
sampled – such as on private land when the owners would be unlikely to authorize the drilling of a well.
Conductivity, redox potential and pH were measured at each site. The same series of samples were taken
as for subsurface groundwater, in order to allow the same testing.
Parameters monitored and analytical methods
Soil and biomass samples were analyzed for metals, energetic materials and specifically for
thorium-232. Groundwater and surface water samples were analyzed for heavy metals, anions, thorium,
energetic materials and other more common contaminants and parameters such as dissolved solids. As
opposed to Phase I, no parkplatz (staging area for fueling/refueling vehicles, tanks) was sampled, so no
petroleum, VOCs and BTEX were analysed in soils and groundwater. Metals were analysed by
Inductively Coupled Plasma Mass Spectrometry, (ICP/MS) and all the parameters available by this
method were included in the study. Energetic materials for soils and groundwater were analysed at DREV
by Gas Chromatography/ Electron Capture Detector, a method that leads to 1 ppb detection limit for
explosives. INRS conducted the following on site groundwater measurements: pH, electrical conductivity,
temperature, dissolved oxygen and Eh. Furthermore, water level measurements, in situ permeability tests
and groundwater flow direction and velocity measurements were also conducted. Thorium-232 was
analysed by the Geological Survey of Canada using ICP/MS with a detection limit of 5 ppt for aqueous
samples. All the results coming from these analyses are presently being compiled, analysed and will soon
be available in the final report.
Magnitude of the study
During the first phase of the characterization done in September 2000, a total of 83 soil (8
background), 34 biomass (4 background), 34 groundwater (3 background) and 11 surface water (2
background) samples were collected. Background soil samples are critical for establishing the
anthropogenic contribution versus the natural contribution for all parameters. A total of 18
background soils samples were also planned for collection. However, due to the same limiting
factors mentioned earlier, only 8 background samples were collected, all in the southern part of the
Shilo training area. All these samples were collected mainly in three battleruns and in parkplatz,
soils were sampled at each of the five battleruns for traces of volatile organic compounds (VOCs)
and BTEXs. Two composite samples were randomly collected at each parkplatz and named samples

95
A and B. The composite samples were formed of a minimum of 20 sub-samples. For thorium-232,
the target areas for the MILAN missiles were identified and the approach using the circular pattern
was applied to collect soil samples. 41 boreholes were drilled and observation wells were installed.
Out of these, because of the bad weather, only 36 wells were developed and groundwater was
collected in only 34 wells.
Soil sample results were compared to Canadian Council Ministers of Environment (CCME)
soil threshold criteria and also with the mean value of background sample results for some
representative metals. None of the soil samples collected exhibited contamination levels higher than
any of the CCME threshold criteria, even for agricultural soils. This indicated no major soil
contamination at either surface or sub-surface levels.
The analytical results for the parameters tested in all types of samples showed no major
environmental impacts related to the training activities. In soils, the accumulation of some heavy
metals associated with ammunitions was observed around pop-up targets, but did not reach levels of
concern. Neither surface nor sub-surface soil samples showed levels of metals higher than
agricultural CCME criteria. Our study clearly demonstrated that no major problems are associated
with soil contamination. The fact that higher levels of contaminants were encountered around
targets proved that the firing activity caused an accumulation of contaminants locally, but not at
levels of concerns. However, radioactive thorium accumulated near targets in both soils and
groundwater presenting a concern. Soil samples near targets presented statistically higher results
for 232Th, while results for groundwater showed ppb levels of radioactive compound, close to
identified impacted area with MILAN missiles. This highlights the fact that measurable impacts
were found related to the use of the missiles. Levels are still very low, both in soils and
groundwater, but considering the very long half-life of this particular contaminant, measurable
traces of this element are a matter of great concern. 232Th has accumulated around target impact area
and, even if this element has a very low solubility, the trace levels found in the groundwater might
migrate off range in a long-term scenario. Therefore, MILAN missile firings was recommended to
be discontinued at CFB Shilo. Collection and disposal of MILAN missile debris according to an
existing procedure for radioactive materials was also recommended.
All the analyses for explosives revealed no contamination in soils, groundwater and biomass

96
samples. Energetic materials analyses showed only traces levels of energetic residues, which were
under our quantification limits, in some water samples. This will be confirmed when a 1 ppb
detection and quantification levels will be obtained and will allow the certification that no traces
level of explosives are found in the Shilo groundwater. Confirmation of the absence of energetic
residues in the groundwater is still very important and will be completed in phase II.
Results obtained from the biomass samples, both for metals concentrations in plants
(extracts) and the metals dust on the plants (leachates) showed no levels of concerns for metals in
battleruns when compared to the biomass background mean values. Only five hits were encountered
in the Berlin range where some metals showed concentrations higher than for the background
samples. These hits were not considered critical. Higher levels of chromium and aluminium were
found in the 80 and 120 % transects where the highest concentrations of UXOs were expected to be
found. No hits were observed in the Essen or in the Deilinghofen battleruns.
No biomass samples were collected around targets for which systematic soil sampling was
carried out. This decision was based on discussions with range controls who believed that the
targets should not present the highest levels of UXOs concentration. Since the targets were pop-up
targets more than 90 % of the munitions fired at them did not stop, but continued towards the end of
the battleruns. The fact that we did not collect plants around targets was unfortunate, since a trend in
accumulation of metal was observed for soils and could have also been observed for the biomass.
This was corrected in phase II where many biomass samples were collected around targets.
For some groundwater and surface water samples, Al, Mn, Fe, Cr, Ag and Se exceeded
CCME threshold criteria. However, iron and manganese were found in background samples at high
levels and, therefore, were not considered as threats to the environment. Aluminum was found in
trip blanks (empty container sent along with the other samples to evaluate if contamination is
occurring during transportation of the samples to the lab) and field blanks at level as high as 60 ppb.
Therefore, levels lower than 60 ppb should be considered insignificant. Silver was detected at high
levels as outliers in some isolated replicates, but the remaining data revealed no detections
indicating that these high values were false. Chromium and selenium were detected at low levels
exceeding the lower limit interval of the aquatic threshold criteria and, therefore, should not be
considered a threat in groundwater media.

97
At the end of phase I, further work was recommended to fully characterize this very large
site. One should keep in mind that this study was made at a regional scale and that the sampling
was, therefore, not representative of the whole area. Point sources at the local scale could still be
found in the future. The training area can be considered as a weak source with various modes of
transportations for contaminants with no measurable impacts on environmental receptors outside of
the range.
Phase II was dedicated mainly to complete the work initiated during the first phase. This
resulted in more background sampling, more soil and biomass sampling around the targets to better
assess the pattern of contamination, more thorium sampling in suspected areas, sampling soils and
biomass in rifle and grenade ranges and completing the sampling of the two remaining battleruns.
During this phase, 162 soils samples including 23 as backgrounds, 64 biomass samples including 18
as backgrounds were collected. Forty supplementary wells were drilled and installed to complete
the piezometric map of the base. All the 80 wells were sampled for groundwater analyses and more
surface water samples were collected around the base. 132 groundwater samples including 12 as
backgrounds were collected and surface water samples were also collected to evaluate what is going
out of the ranges. All these results are being compiled and analysed for the writing of the final
report.

98
Conclusion The task of environmentally assessing a large area is enormous. This effort represents one of the
first efforts worldwide to comprehensively assess an active training base. The situation in battleruns using
pop-up targets is completely different from the one encountered in anti-tank training. The enormous
density of unexploded ordnance presents a huge environmental challenge, both in the immediate physical
danger of unexpected detonations and in the longer-term biological damage caused as the explosive and
metallic components of the munitions enter the environment. The nature of munitions as contamination
point sources makes the task of identifying all contaminated sites extremely difficult. The task of
assessing military sites is challenging, but must be done in the interest of sustaining the training activities
in the long-term.

99
4 Transport Parameters for Firing Range Residues Background
Dissolution of explosives residues from free product contained in cracked or partially fragmented
munitions is the primary method by which nonvolatile explosives contaminate firing ranges. Yet,
dissolution rates of explosives components of munitions have not been measured (Brannon et al., 1999).
Soils analysis show concentration gradients for HMX and TNT that are consistent with kinetic limitations
on solubilization (Jenkins et al. 1997). However, the information available on dissolution kinetics of
explosives residues is limited to a small amount of unpublished data by Jenkins that show pronounced
differences in the rates of TNT, RDX, and HMX movement into solution over time. Thiboutot et al.
(1998) show that for octol, the dissolution rates of TNT and HMX differ substantially. Gilcrease, Murphy,
and Reardon (1996) reported that surface area and mixing rate effects TNT dissolution rate. Accurate
dissolution rate kinetics for explosives and the main explosives formulations used in munitions are key
parameters for describing the fate and transport of explosives residues from firing ranges into
groundwater.
The main factors affecting fate and transport of explosives residues after they dissolve from solid
phase residues are adsorption, transformation and irreversible soil binding (Brannon and Myers 1997).
The fate and transport process descriptors are required for describing the movement of explosives
residues through soil and into groundwater are the adsorption coefficient and the transformation rate
coefficient. Process descriptors mathematically depict the impacts of interactions between soil and water
on explosives concentrations in water and soil. The adsorption coefficient is a mathematical expression
that describes the distribution of a chemical compound between soil and water when they are at
equilibrium. When transformation or irreversible sorption is significant, equilibrium is not attained and
the transformation rate coefficient is used to describe the fate and transport of an explosive contaminant.
The transformation rate coefficient is a kinetic parameter that describes the removal of a compound from
solution by transformation and sorption. The transformation rate coefficients generally follow first-order
kinetics (Brannon and Myers 1997). The amount of available data on fate and transport process
descriptors for explosives residues varies greatly. Most studies have been directed at TNT and its
transformation products, RDX, and to a lesser extent, HMX.

100
This chapter reports progress on development of environmental fate and transport parameters for
selected energetic residuals for which data are currently lacking or that have been detected on firing
ranges. Fate and transport parameters are used to evaluate the migration of explosives residues from the
solid phase residue into solution during rainfall events (dissolution kinetics) and the interactions of
explosives residues in solution with firing range soils that then occurs. This chapter presents new process
data leveraged with the Army Installation Restoration Research Program (IRRP) work unit titled “Fate
and Transport of Explosives Contaminants” (A835/309E/RE004) which provided 90% of the funding for
this effort. When completed, the dissolution data will be published as a separate “thesis” ERDC report.
Objectives
The objectives of this study were (1) to evaluate dissolution kinetics for the explosives
formulations Composition B, octol, and LX-14, (2) to determine dissolution kinetics and solubility for
TNT, RDX, and HMX, and (3) to determine process descriptors for selected explosives residues for
which data are lacking. Fate and transport process parameters were determined for nitroglycerine and the
mono-, di-, and tri-nitroso transformation products of RDX (MNX, DNX, TNX). In addition, site
specific process descriptors were determined for TNT, RDX, and HMX in Ft. Lewis soils.
Materials and Methods Explosives Dissolution: Kinetics
Three military grade explosives selected for this study were 2,4,6-trinitrotoluene (TNT),
hexahydro-1,3,5-trinitro-1,3,5-triazine (RDX), and octahydro-1,3,5,7-tetranitro-1,3,5,7-tetrazocine
(HMX). TNT is a nitroaromatic explosive while RDX and HMX are classified as nitramines (Figure 1).
The TNT used in this study is identified as Type I flake, the RDX is Type II, Class 3 crystals, and the
HMX is Grade B, Class 2 crystals. Military grade high explosives were used to replicate the nature of
explosives expected in a field environment (i.e. age, composition) and were deemed more representative
than pure individual compounds. These explosive compounds were used separately and in the
preparation of the non-bound explosive mixtures to compare with the explosive compounds in the
formulations Composition B, octol, and LX-14.

101
Environmental variables. The choice of experimental variables was based on key terms in Fick’s First
Law
( )bs CCahD
dtdCV −= (1)
where dC/dt = the change in concentration over time (mg s-1.L-1), V = volume of solvent (L), D =
diffusion coefficient (cm2 s-1), a = surface area (cm2), Cs = solubility (mg cm-3), Cb = concentration in bulk
liquid (mg cm-3); and h = stagnant layer thickness (cm).
This expression can be reduced to a zero order equation where the approximation of the hD term
under different environmental conditions is possible. To approximate a zero order equation, several of
the variables in Eq. (1) were assumed constant. In dilute solutions, Cb is small with respect to Cs and is
assumed negligible. Sampling intervals were therefore arranged to be complete before the predicted
Cb/Cs ratio reached 0.2. Experiments were also controlled so that changes in solvent volume (averaging a
1% loss from total sampling) and explosive compound surface areas (averaging a 5% loss from
dissolution) would be negligible. The need to maintain a dilute solution affected run times, ranging from
4.3 minutes for HMX at 30 oC (solubility less than 3 mg L-1) to 120 minutes for TNT at 10 oC (solubility
greater than 70 mg
L-1).
The three temperatures selected for this study (10, 20, 30 oC) are representative of the range of
ambient conditions where unexploded explosive compounds might be found in the environment.
Approximation of explosive surface areas was necessary because of the heterogeneity of particle
sizes and shapes (ranging from less than 0.04 mm in diameter for HMX crystals to greater than 4 mm in
length for TNT flakes). Surface areas for RDX and HMX were estimated using mass to surface area
ratios for each explosive based on military specifications for acceptable granulation distribution. These
nominal surface areas do not account for surface roughness that was seen microscopically on the
explosives. Based on a desired separation of approximately 20 % among the three sample surface areas
(to provide sufficient separation yet fit within the conditions of this study), RDX quantities that produced
sample surface areas of approximately 8, 10, and 12 cm2 were measured out using an estimated RDX
surface area to mass ratio of 100.4 cm2 g-1. Similarly, sufficient HMX was used to produce sample
surface areas of approximately 5, 6, and 7 cm2 based on an HMX surface area to mass ratio estimate of
598.5 cm2 g-1. Surface area effects on dissolution rate were normalized by dividing the dissolution rate

102
(mg min-1) by the nominal explosive surface area used in the run (cm2), resulting in a rate with units of
mg min-1 cm-2.
Measuring TNT flake areas under a microscope and then weighing these sets of flakes on a
balance yielded a reproducible surface area to mass ratio. This method yielded a surface area to mass
estimate of 23.28 cm2 g-1. Sufficient TNT was used to produce sample surface areas of approximately 5.8
cm2, 7.3 cm2, and 8.7 cm2.
The stagnant layer thickness represents the gradient zone in the solution between the surface of
the solid explosive (where the solution concentration is at the solubility limit) to a point in the solution
where the concentration equals that of the rest of the bulk solution. Since dissolution is affected by the
rate of transport from the surface of the explosive compound to the bulk solution, rates would increase if
the layer were thinner and the gradient steeper (Stumm and Morgan 1996). This condition can be
achieved by energy input in the form of agitation or stirring. Mixing rates of 90, 150, and 250 rpm were
selected to examine effects of mixing rate on dissolution rates.
Experimental design. To determine the impact of each variable on dissolution rate, one of the variables
was allowed to change while the other two were held constant. To limit TNT photolysis (Townsend and Myers
1996), experiments were performed under limited light conditions and samples were stored in the dark. The
experimental design is based on dissolution tests described in the United States Pharmacopeia Convention, Inc.
(1990).
Initially, 500 ml of demineralized (reverse osmosis) water in 600 ml beakers were covered with
aluminum foil and allowed to equilibrate for 15 hours to temperature in a water bath. The water
temperature was regulated using a Fisher Scientific Isotemp Refrigerated Circulator and insulated by a
floating layer of 20-mm hollow plastic balls.
Stirring propellers from overhead mounted Yamato Scientific StedFast Digital Lab Stirrers were
centered and lowered into the beakers, adjusted to the desired rpm, and raised to a height of 2.5 cm above
the beaker bottom. Once these conditions were achieved, the desired amount of dry explosive compound
was added to each beaker. While continuing to stir, five one-milliliter samples were periodically pipetted
from a zone midway between the surface of the solution and the top of the stirring propeller and midway
between the beaker wall and the propeller shaft.

103
Analytical methods. Pipetted 1 ml samples were immediately filtered using a disposable 3 ml
Luer-Lok syringe with attached Millex Millipore Filter unit (0.45 µm pore size). The filtrates were
combined with an equal volume of 0.45 µm-filtered acetonitrile, and capped in a 4 ml vial. The vial was
vortexed for five seconds and then stored quiescently for at least 25 minutes. Samples were analyzed
using a Waters High Performance Liquid Chromatograph (HPLC) following Method 8330 (USEPA,
1994).
Effects of pH on explosives solubility and dissolution
The Holston Army Ammunition Plant, Kingsport, Tennessee, provided experimental quantities of
TNT and the explosive formulations octol and composition B. Picatinny Arsenal, Picatinny, New Jersey,
provided experimental quantities of LX-14, RDX, and HMX. Demineralized water (reverse osmosis with
a pH of approximately 5.7) was used with the pH adjusted lower by addition of H2SO4 and HNO3 or
higher by the addition of Na2CO3 and NaOH. These chemicals were selected to replicate acid rain and
basic conditions expected in the natural environment.
Environmental variables. Environmental factors such as temperature and pH can affect
solubility and therefore chemical fate and toxicity (Huang et al. 2000). If ideal conditions are assumed,
solubility can be estimated using the equation (Atkins 1982):
−
∆−=
*11ln
TTR
Hx fus
B (2)
where xB = mole fraction of solute, ∆fusH = enthalpy of fusion of solute, R = ideal gas constant, T =
absolute temperature, and T* = solute melting temperature. Aqueous solutions of explosive compounds
are not ideal, but the general equation remains similar following the form
TBAS −=ln or
−∗=
TBAS exp (3)
where S = solubility, A and B = arbitrary constants, T = absolute temperature.
Taylor and Rinkenbach (1923) conducted one of the earliest studies on TNT aqueous solubility
over the temperature range 0 to 100 o C, but did not evaluate the effect of pH. Spanggord et al. (1983)
reported expressions for TNT and RDX solubility based on measurements at 10, 20, and 30 o C, but also
did not investigate pH. Ro et al. (1996) reported aqueous solubilites for TNT at differing pH levels and

104
temperatures. They proposed a solubility correlation and found that temperature had the greater impact
on solubility and that solubility varied widely at higher pH. Phelan and Barnett (2001) reported TNT pH
independent aqueous solubility values that agree with those reported by Spanggord et al. (1983). None of
the predictive solubility correlations were similar to the others. Townsend and Myers (1996) and Gibbs
and Popolato (1980) list solubilities from the literature for TNT, RDX, and HMX as a function of
temperature and independently of pH. These values will be shown later in figures compared with results
from this study. Here we re-evaluate TNT solubility as a function of temperature and pH, and add
evaluations of RDX and HMX solubility as a function of these same variables.
Dissolution is the primary mechanism allowing for transformation and transport of nonvolatile
explosive compounds. Dissolution rate and solubility control the persistence of the explosive at the
source and the degree of contamination at some distance away from this source. Fick’s Law can be used
to predict the concentration of explosive compounds dissolved in water as well as the time required to
reach solubility limits.
( )bsL CCaKdtdC
−= (4)
where dC/dt is the dissolution rate, KLa = overall mass transfer coefficient, Cs = solubility, and Cb =
concentration in bulk liquid. If the dissolution rate is known, equation 4 (Tchobanoglous and Schroeder
1987) can be integrated to identify the concentration, Ct, at any time:
( )taKst
LeCC )(1 −−= (5)
Information on high explosive dissolution rates is sparse. Gilcrease et al. (1996) reported that
increasing stirring rate increased dissolution of TNT and surface area by grinding of the particles during
mixing. The effects of pH have not been addressed. The zero-order, multivariable dissolution rate
(dC/dT) equations (in units of mg dissolved per minute) are
TNT
[ ] [ ] rpmcmsarpmcm
mgECtemprpmcmC
mgEdtdC
∗∗
−−−−∗
−−−−= 2
22 min54
min682.9 (6a)

105
RDX
[ ] [ ] rpmcmsarpmcm
mgECtemprpmcmC
mgEdtdC
∗∗
−−−−∗
−−−−= 2
22 min61.6
min649.1 (6b)
HMX
[ ] [ ] rpmcmsarpmcm
mgECtemprpmcmC
mgEdTdC
∗∗
−−−−∗
−−−−= 2
22 min78.7
min646.4 (6c)
where temp = temperature, sa = nominal surface area, and rpm = stirring rate in the experimental design.
Experimental design. Aqueous solutions with pH values of 4.2, 5.7, and 6.2 were used as the solvent for
the solid explosive dissolution experiments. An excess amount of solid explosive was added to 200 ml of pH
adjusted water in a 250 ml Erlenmeyer flask wrapped in aluminum foil to minimize photolysis (Townsend and
Myers 1996).
A magnetic stir bar was added to the flask, which was then sealed with parafilm. The solution
was stirred on a magnetic stirrer at a rate sufficient to maintain a deep vortex. Experiments were
performed in duplicate and at temperatures of 3.1 ± 0.8, 21.1 ± 1.4, and 33.3 ± 3.0 o C. Samples were
taken in replicate seven and 14 days after stirring began. Samples were immediately passed through a
0.45 µm pore size membrane filter and combined with an equal volume of 0.45 µm-filtered acetonitrile.
Procedures for dissolution rates, equipment, and analytical methodologies were as previously described.
Dissolution rates of military formulations
Experimental quantities of weapons grade RDX, HMX, and TNT were provided by the
Environmental Processes and Engineering Division, Environmental Laboratory, of the US Army Corps of
Engineers Engineer Research and Development Center, Vicksburg, Mississippi. These explosive
compounds were used separately and in the preparation of the non-bound explosive mixtures for
comparative purposes with the explosive compounds in the formulations.
Three samples of TNT and eight samples each of Composition B and octol were melt-poured at
the Holston plant into 5.5 cm diameter disk-shaped molds with an average thickness of 0.88 ± 0.08 cm2.
Octol is the formulation name given to a mixture of HMX and TNT (Gibbs and Popolato 1980). The
octol consisted of 70% HMX and 30% TNT by weight. Composition B is a mixture of TNT and RDX

106
that might also include a wax desensitizer (Gibbs and Popolato 1980). Composition B consisted of 59.5%
RDX, 39.5% TNT, and 1% wax by weight. Both octol and Composition B are prepared by stirring the
other components of the formulation into melted TNT and, after mixing, allowing the resulting
formulation to solidify. LX-14 is a plastic-bonded explosive consisting of 95.5% HMX and 4.5%
polyurethane by weight (trademarked as Estane). The components of LX-14 are bonded together using a
pressurization process.
The procedure for the dissolution rate experiments were as outlined previously for the pure
compounds with one modification. The width of the formulation disks required that the mold be added
first to the beaker and the 500 ml of water subsequently added at time zero while the stirring propellers
were turning.
Explosives partitioning
Adsorption kinetics An aquifer soil, LAAP –D, and two surface soils with different physical characteristics, Yokena
Clay and Picatinney, were used to measure adsorption kinetics (Table 1). The tests were conducted under
nitrogen in a glove box to simulate anaerobic aquifer conditions. Sufficient soil (4 g) and distilled,
deionized, deoxygenated water (16 mls) were added to 25 ml glass centrifuge tubes to make a soil-to-
water ratio of 1:4. For nitroglycerine testing, the distilled water added to the soil contained 1.47 mg L-1
nitroglycerine. The transformation products of RDX (MNX, DNX, and TNX) were spiked by adding 16
mls of a solution of either TNX or a mixture of MNX and DNX. The solution for MNX and DNX was a
mixture of the two compounds because they cannot be chemically separated at this time. The initial
concentration of TNX was 3 mg L-1, while the initial concentration of the mixture of MNX and DNX was
1.01 mg L-1 MNX and 1.71 mg L-1 DNX. Samples were placed on a reciprocating shaker at 180
excursions per minute. At predetermined sampling times (0.5, 1, 6, 12, 24, 72, 120, and 168 hrs for
nitroglycerine and 1, 6, 24, 48, 72, 96, and 120 hrs for MNX/DNX and TNX), triplicate tubes were
removed and centrifuged at 8,288 RCF for 30 minutes. Two mls of the aqueous sample was removed and
2-mls acetonitrile was added. The diluted samples were analyzed by HPLC using EPA SW846 Method
8330 (USEPA 1994).

107
Adsorption partitioning Adsorption partitioning was conducted with LAAP D, Yokena Clay, and Picatinney soils in a 1:4
ratio of soil to water in 25-ml glass centrifuge tubes. TNX samples were spiked at concentrations of 1.1,
2.8, 5.6, 8.3, and 11.1 mg L-1. The DNX/MNX samples were spiked at 0.4, 1, 2, 3, and 4 mg L-1 DNX and
0.2, 0.5, 1.1, 1.6, and 2.1 mg L-1 MNX. Nitroglycerine was spiked at concentrations of 1, 1.5, 2.0, 2.5,
and 2.0 mg L-1. Triplicate samples for nitroglycerine testing were shaken for 72 hrs for LAAP D soils
and 120 hrs for Picatinney soils on a reciprocating shaker at 180 excursions/min, centrifuged at 8,288
RCF for 60 minutes, and the aqueous phase removed and analyzed for nitroglycerine as previously
described for the kinetics tests. Yokena clay soil was not tested because steady-state nitroglycerine
solution concentrations were not attained. Triplicate TNX and DNX/MNX samples were shaken for 1 hr
on a reciprocating shaker at 180 excursions/min prior to centrifugation, preparation, and analysis as
previously described.
Desorption kinetics Fort Lewis soil (Table 1) from the hand grenade range contained 2.6 mg Kg-1 TNT, 22.5 mg Kg-1
RDX, and 3.5 mg Kg-1 HMX. Tests were prepared by loading 2.5 gms soil into 25 ml centrifuge tubes
and adding 10 mls of water. Samples were placed on a reciprocating shaker at 180 excursions per minute.
At sampling times (0.5, 1, 6, 24, and 48 hrs), duplicate tubes were removed and centrifuged at 8,288 RCF
for 30 minutes. Two mls of the aqueous sample was supplemented with 2 mls acetonitrile, then analyzed
by HPLC for TNT, RDX, and HMX using EPA SW846 Method 8330 (USEPA 1994).
Desorption partitioning Soil from the hand grenade range at Ft. Lewis (2.5 g) was loaded into two 25-ml centrifuge tubes.
Ten mls of water was added to the centrifuge tubes, shaken on a reciprocating box shaker at 180
excursions/min for 24 hours, and centrifuged at 8,288 RCF for 30 minutes. A 2-ml aqueous aliquot was
removed, 2 mls of acetonitrile were added to the aqueous aliquot and the samples were analyzed for TNT,
RDX, and HMX as previously described. Excess water was removed and replaced by 10 mls of fresh
water and the shaking and analytical procedures repeated three more times.
Results and Discussion Dissolution of primary explosives
Analysis of the dissolution data showed that linear regression adequately described explosives
dissolution. The mean r2 and standard deviation from the mean for each explosive dissolution rate
experiment was 0.986 and 0.008 for TNT, 0.989 and 0.014 for RDX and 0.746 and 0.096 for HMX,
108
respectively. Ten individual runs each were analyzed at 10 and 30 o C. Six individual runs were analyzed
at 20 o C for each explosive.
If the surface area approximations were reproducible, an evaluation of dissolution rate normalized
for surface area (mg min-1 cm-2) should yield similar rates if performed under the same conditions. To
check this premise, dissolution rates for the three explosives are shown in Figure 2. Results indicate that
the surface area estimation procedures were similar and reproducible. Dissolution rates as a function of
surface area at 150 rpm and 10, 20, and 30 o C are summarized in Table 2.
Dissolution rates as a function of temperature (mg min-1 oC-1) at 150 rpm and at specified
explosive surface areas are summarized in Table 3. Changes in temperature have the greatest effect on
TNT and the smallest effect on RDX dissolution rates. Dissolution rate increases with increases in
temperature, suggesting that dissolution of these explosives is an endothermic process.
The activation energies of dissolution were calculated using a form of the Arrhenius equation
(Henry and Heinke 1996):
−
=
21
2
1
11
ln
TT
kkR
Ea (7)
where Ea = activation energy, ki=1,2 = dissolution rate at conditions 1 and 2, R = universal gas constant,
Ti=1,2 = temperature in oK at conditions 1 and 2. Activation energies for TNT, RDX, and HMX were
calculated to be 55.6, 55.4, and 40.7 kJ mol-1, respectively. In agreement with the Arrhenius prediction
that dissolution rate doubles with a 10 o C increase in temperature, the experimental dissolution rates
increased by approximately 2.2 times for TNT and RDX and 1.8 times for HMX.
Dissolution rates as a function of mixing rpm at 10 and 30oC and an explosive compound surface
area equal to 7.3 cm2 for TNT, 10 cm2 for RDX and 6 cm2 for HMX are shown in Figure 3. Dissolution
rate correlations as a function of mixing rate are presented in Table 3. Given that zero agitation equates to
diffusion, linear regression trend lines of the data were not forced through zero. These y-intercepts in
Table 4 allow comparison of the “relative” diffusion rates of the three explosive compounds with TNT
having the apparent slowest diffusion rate followed by RDX and HMX with the highest diffusion rate.
Changes in stirring rate have the greatest effect on TNT and the smallest effect on HMX dissolution rates.

109
Using the mixing rates of 90, 150, and 210 rpm for HMX resulted in a linear regression trend line
with an r2 of only 0.58. This non-linearity suggested that increases in mixing speed over the experimental
range had reduced effects on increasing HMX dissolution rate. In theory, there should be a limit to how
much the stagnant layer thickness can be decreased as a result of increased energy input. A second
experiment using mixing rates of 35, 65. 95, and 150 rpm at 10oC and a surface area of 6 cm2 for HMX
was performed to test this theory. The resulting r2 for this correlation improved to 0.97 and is included in
Figure 3.
To relate rpm-based dissolution rates in a beaker to terms that are used in a process or natural
setting, mixing speed was correlated to two different terms. The first is the ε term (a mass normalized
energy dissipation rate) in the Levins- Glastonbury (1972b) correlation
HDDN
T
s2
53
≈ε (8)
where N = stirrer speed, Ds = stirrer diameter, DT = tank diameter, H = height of liquid. This term has
been used in tank reactors and is relevant in an equation to be presented later when comparing TNT
dissolution rate results of this study to that of Gilcrease et al. (1996).
The second correlation relates the power driven mixing rate to the “R” term (rainfall erosivity
index) in the Revised Universal Soil Loss Equation (RUSLE) (USDA 2001). The reason for pursuing this
relationship was to relate rainfall energy impinging on explosives in the field to the energy input variable
in the experimental design. This would permit the calculation of dissolution rates and contaminant
persistence resulting from rain falling on explosive compounds exposed on the soil surface. The R term,
a yearly average, is in units of hundreds foot tons-force inch acre-1 hour-1 year-1, or energy times a rainfall
rate over an area (Simanton 20001). The experimental design has similar units with power input
(energy/time) over an area (beaker area) in a certain depth (height of liquid in beaker). Mixing power
requirements assuming turbulent flow were estimated using the equation (Tchobanoglous and Schroeder
1987):
53
idnkp ρ= (9)
where p = power requirement, k = arbitrary constant estimated as 1 (Borsella, 20002), ρ = liquid density, n
= rotational speed, di = diameter of mixer impeller.
1 Simanton, R. 17 July 2000. Agricultural Research Service, Tucson, AZ. 2 Borsella, J. July, 2000. Yamato Scientific America, Inc., Orangeburg, NY.

110
After equating units, R-values in the RUSLE program (ranging from the 20s in Nevada to the
350s in Florida) were similar to the experimental energy input values selected for this study. For
example, an R-value of 250 hundred foot tons-force inch acre-1 hour-1 year-1 (representative of Tennessee)
from the RUSLE compares well to a mixing speed of approximately 120 rpm in the experimental design
using the equation 3/1
5i
2T2
.6
Hdk
Dcm
cmWatt10x182.1*R60rpm
ρ
Π=
−
(10)
with units for R = 100 foot-ton-force inch acre-1 hour-1 year-1, DT = cm, di = m, ρ = kg m-3, and H =cm.
Besides evaluating individual variable effects on explosive dissolution rates, the combination of
temperature, surface area, and mixing speed into a single correlation was investigated using three
different approaches. The first approach built on the single variable dissolution rate approach and
involved a series of linear regressions incorporating an additional variable at each regression, ultimately
yielding an expression for dissolution rate with units of mg min-1 cm-2 rpm-1 oC-1. Of the possible
combinations, the sequence of variables addition and regressions used in this study was from dissolution
rate expressed as mg min-1 to mg min-1 cm-2 to mg min-1 cm-2 rpm-1 to mg min-1 cm-2 rpm-1 oC-1. All
regressions except the last forced the y-intercept to zero. Other sequences for variable addition did not
yield a multi-variable equation that closely fit the experimental data. With respect to the variables
employed in this study, ranking from greatest to least impact on dissolution rate is temperature (oC),
followed by surface area (cm2), and then mixing speed (rpm). The multi-regression, multivariable
equations, whose solutions yield a dissolution rate in units of mg min-1, are presented below. The average
percent difference between raw data dissolution rates expressed as mg minute-1 and those calculated by
the multivariable equation averaged less than 10% for TNT and RDX and less than 15% for HMX.
TNT
m*a*rpmcmmin
mg5E3.4T*Crpmcmmin
mg5E0.1dtdm
2o2
−−−−
−−−−= (11a)
HMX
m*a*rpmcmmin
mg6E4.2T*Crpmcmmin
mg6E75.4dtdm
2o2
−−−−
−−−−= (11b)
RDX
m*a*rpmcmmin
mg6E5.6T*Crpmcmmin
mg6E49.1dtdm
2o2
−−−−
−−−−= (11c)
111
A second approach avoided the multiple regressions in favor of a single linear regression of
normalized dissolution rates and one variable. Dissolution rates were normalized by dividing each run’s
initial mg min-1 rate by two of the variable conditions used in that particular run (i.e. surface area and
rpm). These normalized rates were then regressed against the remaining variable (in this case
temperature). These linear regressions were not forced through zero. The first row in Table 5 identifies
the dissolution rate equation for the example given. This process was then repeated two more times, once
for rpm as the last included variable (row 2, Table 5) and again using surface area as the independent
variable (row 3, Table 5). Again, those correlation trend lines where temperature served as the
independent variable had the best fit to the data. This indicates that temperature has the greatest impact
on dissolution rate employing the units used in this study. The means of the average percent difference
between the described correlations and the experimental data for all the explosive compounds with
temperature as the independent variable was 10%, for surface area it was 15%, and for mixing speed it
was 450%.
Results from the multiple linear regression methodology for determining a correlation with
multiple variables are very similar to the single linear regression approach. Two validation runs were
performed for each explosive compound using different temperatures (15 and 25oC), surface area (6 cm2),
and mixing rate values (180 and 120 rpm) from those generating the correlations. The single regression
correlation line is included with the multiple regression correlation line for comparison with experimental
HMX data in Figure 4 as are the validation data points. All TNT (not shown) and HMX data and
validation points fell within the 99% confidence bands while all RDX data (not shown) and validation
points fell within the 95% confidence bands.
The last method for determining a multivariable dissolution rate expression used a correlation
developed by Levins and Glastonbury (1972a) describing spherical particle-liquid hydrodynamics and
mass transfer in a stirred vessel
36.017.062.03/13/4
47.02
+=
vT
Sp
v
p
Dv
DD
vd
Dkd ε
(12)
where k = mass transfer coefficient, dp = particle diameter, Dv = diffusivity, � = energy dissipation
rate/unit mass, ��kinematic viscosity, DS = stirrer diameter, and DT = tank diameter. Gilcrease, Murphy,
and Reardon (1996) used this method in their evaluation of TNT dissolution in reactors containing either
water or a water/Teflon bead slurry.

112
Comparisons between the Levins and Glastonbury (1972a) correlation and the experimental data
obtained in this study can be made by expressing the “k” term in EQ(12) in milligrams dissolved per
minute and comparing it to the rate determined from the data of each run. The dissolution rates for data
from this study, rates predicted by the multivariable equation derived in this study, and rates predicted by
the Levins and Glastonbury (1972a) correlation for TNT mixed at 150 rpm and 10 o C (lower set of data)
and 30 o C (upper set of data), are compared and presented in Figure 5. The average percent difference
between actual rates and those predicted using the Levins and Glastonbury correlation are slightly greater
than those based on the multivariable equation.
Gilcrease, Murphy, and Reardon. (2001) noted that the effectiveness of the k term in EQ(12)
depended on selecting an appropriate effective diffusivity value. Gilcrease, Murphy, and Reardon (1996)
successfully used the Levins and Glastonbury (1972a) approach in describing the dissolution of solid
TNT in both deionized water and in a Teflon chip/water slurry. For the best fit to their experimental
design, Gilcrease, Murphy, and Reardon (1996) selected a TNT diffusivity of 7.4E-6 cm2 s-1 at 25 C. For
our study, a diffusivity of 6.71E-6 cm2 s-1 at 25 o C (Townsend and Meyers 1996) was used.
The Levins and Glastonbury correlation did not prove as accurate in predicting dissolution rates
for either RDX or HMX compared to the multivariable equations developed in this study. Average
percent differences between prediction and actual rate exceeded 20% for each explosive compound, even
after modifying diffusivity values from those reported in the literature. Best-fit diffusivity values at 25 o C
were 2.2 E-6 cm2 s-1 and 1.5E-4 cm2 s-1 for RDX and HMX, respectively (vs. 7.15 E-6 and 6.02 E-6 cm2 s-
1, reported by Townsend and Meyers, 1996 at 25 oC). The “relative diffusivities” in Figure 3 show similar
orders of separation among explosives as those presented here.
Estimating a single particle diameter for RDX and HMX from a heterogeneous mix of crystal
sizes may have had a major impact on the applicability of the Levins and Glastonbury (1972a)
correlation. A comparison of rates among our experimental data, the temperature-based multivariable
equation, and the Levins and Glastonbury correlation k term is shown in Table 6. Use of an estimated
single particle size may also account for the discrepancies in the best-fit diffusivities.
Dissolution rates for TNT, RDX, and HMX as a function of temperature, surface area, and power
input are best represented by the first row of equations in Table 5 where temperature was the final
variable in rate determination. These equations can provide insight to expected changes in explosive

113
dissolution rates given changing seasonal temperatures and remaining explosive surface area. To predict
rainfall affects on expected dissolution rates, use EQ(10) which relates the RUSLE “R” term to mixing
rpm. EQ(8) can be used to relate study rpm to stirred reactors.
Limits exist for the use of these correlations, however. First, dissolution rates cannot exceed the
solubility limit of the explosive. Second, extrapolation outside the limits of the study boundaries is not
recommended. Third, as demonstrated by the HMX results, a point is reached where increased power
input results in only minimal changes in dissolution rate.
Effects of pH and temperature Solubility. The temperature range studied (3.1 oC to 33.3 C) is representative of ambient
conditions in most areas of the Continental United States where explosives residues are typically found.
The pH range was based on maximum and minimum pH values reported for rainfall in the Continental
United States (National Atmospheric Deposition Program, 1998). The experimental solubility data for
the three high explosives at three pH values and temperature are summarized in Table 7. To conform to
the format in equation 3, data were plotted as ln[S] versus 1 oK-1 and linearly regressed. Solubility of
TNT, RDX, or HMX at different pH values did not differ significantly (p < 0.05).
Solubilities for TNT compare favorably with those reported by Spanggord et al (1983) and Phelan
and Barnett (2001) (Figure 6). Solubilities for TNT were found to be less than those reported by Taylor
and Rinkenbach (1923), but higher than those reported by Ro et al (1996). Solubilities for RDX (Figure
7) again compare favorably with Spanggord et al. (1983) though generally less than those values reported
in the literature. Solubilities for HMX agree well with those values reported by Townsend and Meyers
(1996) (Figure 8). A correlation was made for solubilities reported by Spanggord et al. (1982) and cited
in Townsend and Meyers (1996) and plotted on this figure for comparative purposes. Composite
correlations that utilize all TNT, RDX, and HMX data to predict solubility are presented in Figure 9.
Dissolution. Evaluation of pH effects on dissolution rate was conducted at 30 oC because of
higher solubility values for each explosive at this temperature. Samples were taken at a rate and over a
time period selected so that sample concentrations would be well below solubility maxima, hence keeping
the solution dilute. The pH did not affect the dissolution rate of TNT, RDX, or HMX (Figure 10). In
general, TNT had the fastest dissolution rate, followed by HMX and RDX. Composite dissolution rates

114
incorporating all pH data for TNT, HMX, and RDX (Table 5) compared well to those predicted by
equation 10.
A reducing environment at pH 7 had a pronounced impact on TNT, RDX, and HMX stability in
soil (Price, Brannon, and Hayes 1997, Price, Brannon, and Yost 1998). Remediation strategies that rely
on high alkalinity (Heilmann, Wiesmann, and Stenstrom 1996) may be related to a reducing environment
by the Nerst equation where an increase in pH corresponds to a decrease in redox potential (Stumm and
Morgan, 1996), but the pH required (pH > 10) exceeds those normally encountered in the environment.
The combined ability to predict solubility and dissolution rate at a given temperature permits the
prediction of solution concentration at any given time using equation 5. This equation was used here to
confirm that solubility had been reached prior to the seventh day of stirring. Using a conservative mixing
rate of 210 rpm and 30 oC, HMX attained saturation in less than half a day, RDX in less than five days,
and TNT was 99.996% of saturation in seven days.
Dissolution rates of formulations
The dissolution rates for all analytical runs were recorded in units of mg cm-2 sec-1 to normalize
for the variations in solid surface area. TNT, RDX, and HMX were run independently in addition to the
formulations and mixtures to serve as a basis for dissolution rate comparison. The dissolution rates for
the formulations at 150 rpm and 20 o C are presented in Figures 11, 12, and 13 for TNT, HMX, and RDX,
respectively. Both the melt-pour process used in the preparation of octol and composition B and the
pressure binding process used in the production of LX-14 appear to have caused the inherent explosive
compounds to dissolve at rates lower than those of the pure compounds. TNT dissolution rates from octol
and Composition B molds were lower than those from a pure TNT mold (Figure 11). HMX dissolution
from LX-14 and octol were orders of magnitude lower than dissolution rates from pure HMX (Figure 12).
RDX showed a more than 50% decrease in dissolution rate from Composition B compared to the pure
compound (Figure 13).
Explosives partitioning Adsorption kinetics and partitioning
Solution nitroglycerine concentrations decreased over time when exposed to all tested soils
(Figure 14). Partitioning coefficients are not provided for Yokena Clay because steady-state conditions
did not develop. Half lives for nitroglycerine were 335 hrs, 84 hrs, and 7.3 hrs for LAAP D, Picatinney,

115
and Yokena Clay soils, respectively. Results suggest that nitroglycerine will be degraded and strongly
adsorbed in both aquifer and surface soils.
Concentrations of the RDX transformation products MNX (Figure 15), DNX (Figure 16), and
TNX (Figure 17) were generally stable in all three soils. Notable exceptions were MNX and DNX in
Yokena Clay soil. The half-lives shown in Figures 15 and 16 for Yokena Clay reflect first order
transformation coefficients of 0.225 h-1 (r2 = 0.754) and 0.333 h-1 (r2 = 0.76) for MNX and DNX,
respectively. Partitioning coefficients for LAAP D soil ranged from 0.29 to 0.85 L Kg-1 for MNX, DNX,
and TNX (Figure 18). This compares to a value of 0.33 L Kg-1 for RDX in LAAP D soil (Pennington et
al. 1999). These results indicate that adsorption coefficients for the major RDX transformation products
are similar to that of the parent compound. Partition coefficients for nitroglycerine were similar in the
two soils for which Kds could be determined (Figure 19).
Desorption kinetics and partitioning Concentrations of TNT, RDX, and HMX desorbed from the Ft. Lewis soil reached steady-state
concentrations in 6 hours (Figure 20). These results indicate that TNT, RDX, and HMX are rapidly
desorbed and mobilized from the soil. No decrease in solution concentrations was observed over the
course of two days following establishment of steady-state concentrations.
Partitioning coefficients were highest for HMX (3.5 + 0.6 L Kg-1), intermediate for TNT (1.6 +
0.8 L Kg-1), and lowest for RDX (0.6 + 0.2 L Kg-1). These results indicate that transport will be greatest
for RDX in this soil.
Summary and Conclusions
Dissolution rates of explosives increase with increases in surface area, temperature, and mixing
rate. Under the same experimental conditions, the order of dissolution rate (fastest to slowest) was TNT,
HMX, and RDX. Calculated activation energies for dissolution of TNT, RDX, and HMX in kJ mol-1
were 55.6, 55.4, and 40.7, respectively. Dissolution rates approximately double with every 10 o C increase
in temperature. Surface area estimates were reproducible and the RUSLE “R” values and experimental
energy input were comparable. At 25 o C and using the Levins-Glastonbury (1972a) correlation,
diffusivities were estimated at 6.71 E-6 cm2 s-1 for TNT, 2.2E-6 cm2 s-1 for RDX, and 1.5E-4 cm2 s-1 for
HMX.

116
The use of combined variable equations, such as those presented in Table 5 and EQ (10), are
representative of observed dissolution rates under various environmental conditions. Predicting
dissolution rates by performing multiple regressions of data was no improvement over normalizing these
data into the appropriate units for dissolution and performing a single regression. Regressing dissolution
in units of mg min-1 cm-2 rpm-1 versus temperature in oC provides the best multi-variable equation fit to
experimental data. The Levins-Glastonbury correlation was a viable method of estimating dissolution
rates when diffusivities were known and explosives were of uniform particle diameter. The relationships
developed in this study will serve as a first/worst case approximation of expected dissolution rates in a
field environment.
Solubilities and dissolution rates of TNT, RDX, and HMX were not significantly affected by pH
over the pH range (4.2 to 6.2), but were significantly affected by temperature over the range (3.1 o C to
33.3 C) studied. TNT was the most soluble and had the highest dissolution rate, while RDX had the
second highest solubility, but exhibited the slowest dissolution rate. Composite correlations incorporating
all pH data were presented to predict explosive solubility as a function of temperature and to identify
dissolution rates using specified variables. These equations can be used to predict the solubility of TNT,
RDX, and HMX, their dissolution rates, and solution concentrations over time.
The production process affects dissolution rates of the explosive compounds in the formulations.
Dissolution rates of explosives compounds are suppressed in LX-14, Composition B, and octol.
Adsorption kinetics and partitioning studies showed that nitroglycerine was degraded and
strongly adsorbed in both aquifer and surface soils. Therefore, it is not expected to persist in the
environment. The RDX transformation products, MNX, DNX, and TNX, were generally stable in all
tested soils. Adsorption coefficients for the RDX transformation products were similar to that of the
parent compound. Desorption partitioning with Ft. Lewis soil showed that steady-state solution
concentrations of TNT, RDX, and HMX were reached within six hours. RDX partitioned to this soil less
than TNT and HMX, indicating that RDX transport would be greatest.

117
References
Atkins, P. M. (1982). Physical Chemistry 2, W. H. Freeman and Company, San Francisco, CA.
Brannon, J. M., Deliman, P. N., Gerald, J. A., Ruiz, C. E., Price, C. B., Hayes, C., Yost, S., and Qasim,
M. (1999). “ Conceptual model and process descriptor formulations for fate and transport of
UXO,” Technical Report IRRP-99-1, U. S. Army Engineer Waterways Experiment Station
Vicksburg, MS.
Brannon, J. M. and Myers, T. E. (1997). "Review of fate and transport processes of explosives",
Technical Report IRRP-97-2, U. S. Army Engineer Waterways Experiment Station, Vicksburg,
MS.
Department of the Army n.d., Military Specification RDX, MIL-DTL-398D
Department of the Army, n.d., Military Specification HMX, MIL-DTL-45444C
Gibbs, T. R. and Popolato, A., Eds. LASL Explosive Property Data, (1980). University of California
Press, Berkeley, CA.
Gilcrease, P., Murphy, V. and Reardon, K. (1996). “Bioremediation of solid TNT particles in a soil slurry
reactor: Mass transfer considerations,” Proceedings of the HRSC/WERC Joint Conference on the
Environment, May 1996, Albuquerque, NM.
Gilcrease, P., Murphy, V., Reardon, K. (2001). “Simultaneous grinding and dissolution of TNT solids in
an agitated slurry, scheduled for publication in March 2001 issue of American Institute of
Chemical Engineering Journal.
Heilmann, H. M., Wiesmann, U., and Stenstrom, M. K. (1996). “Kinetics of the alkaline hydrolysis of
high explosives RDX and HMX in aqueous solution and adsorbed to activated carbon,”
Environmental Science and Technology, 30, 1485-1492.
Henry, J. G. and Heinke, G. W. (1996). Environmental Science and Engineering, 2nd ed, Prentice Hall,
Inc., New York, p 193.
Huang, G., Xiao, H., Chi, J., Shiu, W., MacKay, D. (2000). “Effects of pH on the aqueous solubility of
selected chlorinated phenols,” Journal of Chemical Engineering Data, 45, 411-414.
Jenkins, T. F., Walsh, M. E., Thorne, P. G., Thiboutot, S., Ampleman, G., Ranney, T. A., and Grant, C. L.
(1997). “Assessment of sampling error associated with the collection and analysis of soil sample
at a firing range contaminated with HMX,” Special Report 97-22, U. S. Army Cold
RegionsResearch and Engineering Laboratory, Hanover, NH.
Levins, D. and Glastonbury, J. (1972a). “Particle-Liquid hydrodynamics and mass transfer in a stirred
vessel, Part I – Particle-Liquid motion,” Transactions of the Institution of Chemical Engineers
50, 32-41.
118
Levins, D. and Glastonbury, J. (1972b). “ Particle-Liquid hydrodynamics and mass transfer in a stirred
vessel, Part II – Mass transfer,” Transactions of the Institution of Chemical Engineers 50, 132-
146.
National Atmospheric Deposition Program (1998). “Hydrogen ion concentration as pH from
measurements made at the field laboratories, Available from URL:
http://nadp.sws.uiuc.edu/isopleths/maps1998/phfield.gif [Accessed 5 May 2000].
Pennington, J. C., Gunnison, D., Harrelson, D. W., Brannon, J. M., Zakikhani, M., Jenkins, T. F., Clarke,
J. U., Hayes, C. A., Myers, T., Perkins, E., Ringelberg, D., Townsend, D. M., Fredrickson, H.,
May, J. H. (1999). “Natural Attenuation of Explosives in Soil and Water Systems at Department
of Defense Sites: Interim Report,” US Army Corps of Engineers. Technical Report EL-99-8, U.S.
Army Engineer Waterways Experiment Station, Vicksburg, MS.
Phelan, J. B. and Barnett, J. L. (2001). “Solubility of 2,4-dinitrotoluene and 2,4,6-trinitrotoluene in
water,” J. Chem. Eng. Data, 46, 375-376.
Price, C. B., Brannon, J. M., and Hayes, C. A. (1997). “Effect of redox potential and pH on TNT
transformation in soil-water slurries,” Journal of Environmental Engineering, 123, 988-992.
Price, C. B., Brannon, J. M., and Yost, S. L. (1998). “Transformation of RDX and HMX under
controlled Eh/pH conditions,” U.S. Army Engineer Waterways Experiment Station Technical
Report IRRP-99-1, Vicksburg, MS.
Ro, K. S., Venugopal, A., Adrian, D. D., Constant, D., Qaisi, K., Valsaraj, K. T., Thibodeaux, L.J., and
Roy, D. (1996). “Solubility of 2,4,6-trinitrotoluene (TNT) in water,” Journal of Chemical and
Engineering Data, 41, 758-761.
Spanggord, R. J., Mabey, R. W., Chou, T. W., Haynes, D. L., Alfernese, P. L., Tse, D. S., and Mill, T.
(1982). “Environmental fate studies of HMX, screening studies, Final report, Phase I –
Laboratory study. SRI Project LSU-4412, SRI International, Menlo Park, CA, for U.S. Army
Medical Research and Development Command, Fort Detrick, MD.
Spanggord, R. J., Mabey, W. R., Mill, T., Chou, T. W., Smith, J. H., Lee, S., and Robert, D. (1983). “
Environmental fate studies on certain munitions wastewater constituents,” LSU-7934, AD-
A138550, SRI International, Menlo Park, CA.
Stumm, W. and Morgan, J. (1996). “Kinetics at the solid-water interface: Adsorption, dissolution of
minerals, nucleation, and crystal growth,” In Aquatic Chemistry Chemical Equilibria and Rates
in Natural Waters, 3rd ed, John Wiley and Sons, NY.
Taylor, C. A. and Rinkenbach, W. H. (1923). “The solubility of trinitrotoluene in organic solvents,”
Journal of the American Chemical Society, 45, 44-59.
119
Tchobanoglous, G. and Schroeder, E. D. (1987). “Water quality characteristics, modeling, modification,”
Addison-Wesley Publishing Co., Reading, MA.
Thiboutot, S., Ampleman, G., Gagnon, A., Marois, A., Jenkins, T. F., Walsh, M. E., Thorne, P. G. and
Ranney, T. A. (1998). “Characterization of antitank firing ranges at CFB Valcartier, WATC
Wainwright and CFAD Dundurn,” DREV-R-9809, Defence Research Establishment, Valcartier,
Quebec.
Townsend, D. and Myers, T. (1996). “Recent developments in formulating model descriptors for
subsurface transformation and sorption of TNT, RDX, and HMX,” Technical Report IRRP-96-1,
U.S. Army Engineer Waterways Experiment Station Vicksburg, MS.
United States Pharmacopeial Convention, Inc. (1990). The United States Pharmacopeia, The National
Formulary, 22nd rev., 17th ed., Rockville, MD.
U. S. Department of Agriculture (2001). “Revised Universal Soil Loss Equation, [Online], Available
from: URL http://www.sedlab.olemiss.edu/rusle/ [Accessed 14 July, 2000].
U. S. Environmental Protection Agency (1994). Test Methods for Evaluating Solid Waste,
Physical/Chemical Methods SW-846, Third Edition, Update II, Washington, DC.

120
Table 1 Properties of soils used in adsorption and desorption testing
Soil TOC, %1 CEC2, meq 100g-1 pH Clay, % Sand, % Silt, % LAAP D 0.02 5.5 5.5 7.5 85 7.5 Yokena Clay 2.4 38.9 6.4 48.75 13.75 37.5 Picatinney 0.634 9.8 6.1 5 62.5 32.5 Ft. Lewis 0.26 6.8 6.8 9.9 82.3 7.8 1 Total organic carbon 2 Cation exchange capacity
Table 2 Dissolution rates as a function of surface area at 150 RPM and different temperatures 10 C 20 C 30 C mg min-1cm-2 r2 mg min-1cm-2 r2 mg min-1cm-2 r2 TNT 0.009 0.996 0.014 0.908 0.041 0.958 RDX 0.001 0.988 0.003 0.718 0.006 0.992 HMX 0.006 0.999 0.013 0.995 0.020 0.992
Table 3. Dissolution rates as a function of temperature at 150 RPM and different explosive surface areas
cm2
Mg min-1 C-1 r2 cm2
Mg min-1 C-1 r2 cm2
Mg min-1 C-1 r2
TNT 5.800 0.008 0.955 7.300 0.009 0.964 8.700 0.012 0.953 RDX 8.000 0.0015 0.961 10.000 0.0018 0.960 12.000 0.0023 0.957 HMX 4.800 0.003 0.996 6.000 0.004 0.999 7.100 0.005 0.998

121
Table 4 Dissolution Rates, r (mg min-1) as a Function of Mixing Rate, m (rpm), Using Middle Value Surface Areas and Specified Temperatures. Note how selection of study rpm values affects correlation r2 for HMX.
10oC 30oC Correlation r2 Correlation r2
TNT r = 5.0E-4 *m – 1.1E-2 0.99 r = 2.0E-3 * m – 2.9E-2 0.96 RDX r = 1.0E-4 * m – 6.7E-3 0.89 r = 5.0E-4 * m – 8.5E-3 0.99 HMX r = 1.0E-4 * m + 8.7E-3 0.97 r = 3.0E-4 * m + 7.4E-2 0.58
Table 5 Zero-order pH-related explosive dissolution rates measured at 30 oC, 150 rpm, and normalized solid explosive surface area. Method Dissolution rate/mg/cm-2 s-1 R2 Av % diffa
TNT Eq 5 Composite
= 0.00063 = 0.00069
n/ab
0.984 9.1 HMX Eq 5 Composite
= 0.00032 = 0.00029
n/ab
0.628 9.8 RDX Eq 5 Composite
= 0.000097 = 0.000096
n/ab
0.991 1.0

122

123
Table 6 Average percent difference comparisons between data from this study, the multiple regression multiple variable equation, the single regression multiple variable equation, and the Levins and Glastonbury (1972a) correlation for RDX dissolution rates
Dissolution Rate
mg min-1
Dissolution Rate
mg min-1
Dissolution Rate
mg min-1
Dissolution RateMg min-1
Run ID
Surface Area/rpm/oC1 Study Data
Multiple Variable
Eqn Avg %
Diff Single
Variable Eqn Avg %
Diff
Levins Glastonbury Correlation
Avg % Diff
M S/150/10 0.010 0.011 -6.3 0.011 -10.5 0.014 -29.2 O M/150/10 0.012 0.013 -3.5 0.013 -7.6 0.016 -26.4 P L/150/10 0.015 0.015 -2.1 0.016 -6.2 0.019 -25.16 R M/90/10 0.008 0.008 9.1 0.008 4.9 0.012 -34.0 S M/210/10 0.026 0.018 38.4 0.019 34.3 0.020 28.8
R1 S’/150/20 0.015 0.014 4.0 0.014 2.5 0.015 -2.5 R2 M’/150/20 0.015 0.018 -13.6 0.018 -15.1 0.019 -20.1 R3 L’/150/20 0.019 0.021 -8.7 0.021 -10.2 0.023 -15.1 R8 S/150/30 0.047 0.046 1.6 0.047 0.6 0.055 -15.0 R6 M/150/30 0.057 0.058 -1.0 0.058 -2.0 0.068 -17.6 R9 L/150/30 0.071 0.069 2.2 0.070 1.2 0.082 -14.4 R4 M/90/30 0.034 0.035 -2.9 0.035 -3.9 0.050 -39.4 R5 M/210/30 0.088 0.081 8.9 0.081 8.0 0.083 5.5
1 S=8, M=10, L=12 S’=4, M’=5, L’=6 cm2

124
Table 7 Solubilities of High Explosive Compounds At Specified pH and Temperature
TNT RDX HMX
pH 4.2 pH 5.7 pH 6.2 pH 4.2 pH 5.7 pH 6.2 pH 4.2 pH 5.7 pH 6.2
Tmp1 Sol2 Tmp Sol Tmp Sol Tmp Sol Tmp Sol Tmp Sol Tmp Sol Tmp Sol Tmp Sol oC mgL-1 oC mgL-1 oC mgL-1 oC mgL-1 oC mgL-1 oC mgL-1 oC mgL-1 oC mgL-1 oC mgL-1
2.3 49.5 2.3 54.5 2.4 55.9 2.7 13.5 2.5 12.6 2.1 13.1 2.7 0.81 2.5 0.77 2.1 0.77 2.3 50.5 2.3 54.2 2.4 56.4 2.7 13.0 2.5 12.8 2.1 13.5 2.7 0.80 2.5 0.77 2.1 0.77 2.6 54.9 2.3 47.5 2.4 54.9 2.7 13.3 2.6 13.8 2.6 12.9 2.7 0.76 2.7 0.77 2.6 0.60 2.6 55.7 2.3 47.3 2.4 55.4 2.7 13.2 2.6 13.7 2.6 13.3 2.7 0.78 2.7 0.78 2.6 0.65 4.2 57.6 4.1 47.9 4.7 56.7 2.8 13.5 2.7 13.2 2.9 13.7 3.6 0.92 3.6 1.01 3.6 0.98 4.2 57.7 4.1 48.2 4.7 57.4 2.8 12.9 2.7 13.2 2.9 13.9 3.6 0.91 3.6 0.95 3.6 0.93 4.2 45.7 4.6 58.1 5.2 56.7 3.2 13.9 3.5 13.6 3.9 14.1 3.6 0.89 3.7 0.90 3.6 0.93 4.2 48.4 4.6 59.1 5.2 56.1 3.2 14.0 3.5 13.9 3.9 13.5 3.6 0.91 3.7 0.99 3.6 0.94 20 100.7 20 96.7 20 99.6 20.1 38.9 20 37.7 20 37.5 22.6 3.82 22.7 3.84 22.5 3.88 20 99.0 20 98.7 20 100.2 20.1 36.8 20 37.8 20 37.6 22.6 3.84 22.7 3.82 22.5 3.88 20 99.2 20.1 98.9 20.1 99.5 20.1 38.6 20.2 38.0 20 38.2 22.8 3.68 22.8 3.88 22.7 3.80 20 101.7 20.1 100.6 20.1 96.3 20.1 38.3 20.2 38.0 20 38.8 22.8 3.68 22.8 3.89 22.7 3.79 20.1 96.3 20.2 98.8 20.1 99.5 20.2 35.8 20.4 35.4 20.4 35.5 23.1 3.87 23 3.94 23.4 3.93 20.1 95.9 20.2 99.8 20.1 99.8 20.2 35.7 20.4 35.6 20.4 35.3 23.1 3.85 23 3.95 23.4 3.72 20.1 96.0 20.2 97.5 20.2 94.6 20.2 36.0 20.4 35.1 20.4 36 23.7 3.94 23.5 3.90 23.7 3.75 20.1 97.8 20.2 100.4 20.2 97.2 20.2 36.3 20.4 35.6 20.4 36.1 23.7 3.97 23.5 3.94 23.7 3.89 36 211.7 35.7 208.5 35.9 216.5 31.6 65.1 31.7 62.5 31.7 67.6 28.5 5.35 28.5 5.40 28.5 6.21 36 213.1 35.7 213.5 35.9 213.9 31.6 65.4 31.7 62.2 31.7 68.1 28.5 5.55 28.5 5.43 28.5 6.10
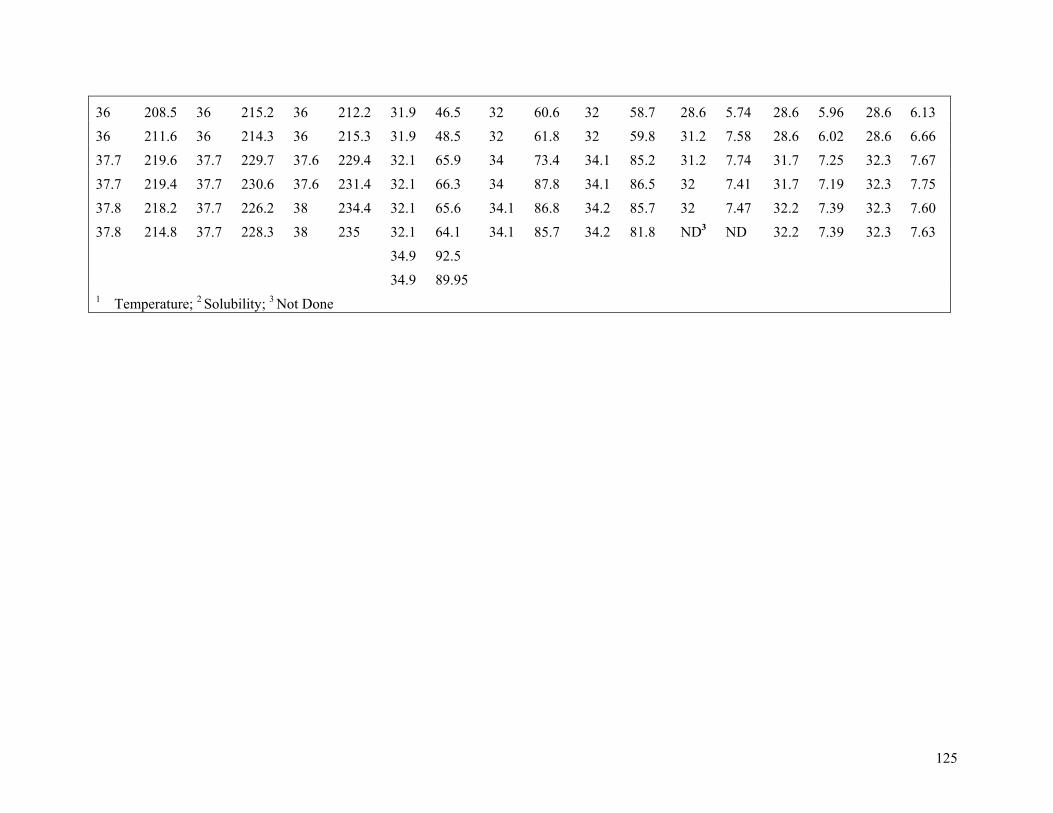
125
36 208.5 36 215.2 36 212.2 31.9 46.5 32 60.6 32 58.7 28.6 5.74 28.6 5.96 28.6 6.13 36 211.6 36 214.3 36 215.3 31.9 48.5 32 61.8 32 59.8 31.2 7.58 28.6 6.02 28.6 6.66 37.7 219.6 37.7 229.7 37.6 229.4 32.1 65.9 34 73.4 34.1 85.2 31.2 7.74 31.7 7.25 32.3 7.67 37.7 219.4 37.7 230.6 37.6 231.4 32.1 66.3 34 87.8 34.1 86.5 32 7.41 31.7 7.19 32.3 7.75 37.8 218.2 37.7 226.2 38 234.4 32.1 65.6 34.1 86.8 34.2 85.7 32 7.47 32.2 7.39 32.3 7.60 37.8 214.8 37.7 228.3 38 235 32.1 64.1 34.1 85.7 34.2 81.8 ND3 ND 32.2 7.39 32.3 7.63
34.9 92.5 34.9 89.95 1 Temperature; 2 Solubility; 3 Not Done

126
Figure Captions
Figure 1. TNT, RDX, and HMX molecular structures
Figure 2. Surface area comparison of explosives at 150 rpm and 10oC (◇ = TNT, □ = RDX, △ = HMX) Figure 3. Mixing speed comparison of middle-size surface area explosives (◊ = TNT, □ = RDX, △ = HMX, ____ = 30oC, _ _ _ = 10oC) Figure 4. Comparison of HMX multiple regression, multiple variable dissolution rate correlation (___) to the HMX single regression, multiple variable dissolution rate correlation (_ . ._ ). Note: Correlation data points (○) and validation points (□) Figure 5. Rate comparisons of study TNT data (□ = 30 oC data, ◊ = 10 oC data) to multiple regression-multiple variable regression line (____) and the Levins-Glastonbury regression line (_ _ _) Figure 6. Comparison of literature TNT solubility to this study. (____) Taylor and Rinkenbach (1923), (. . . . . ) Spanggord et al. (1983), (_ ... _) Ro et al. (1996), (■) Gibbs and Popolato (1980), (�) Phelan and Barnett (2001), ░ this study pH 4.2, ▒ this study pH 5.7, ▓ this study pH 6.2. Figure 7. Comparison of literature RDX solubility to this study. (__+__) Spanggord et al. (1983), (■) Gibbs and Popolato (1980), (�) Townsend and Meyers (1996), (____) this study pH 4.2, (_ _) this study pH 5.7, (.. .. ..) this study pH 6.2. Figure 8. Comparison of literature HMX solubility to this study. (__*__) Spanggord et al. (from Townsend and Meyers, 1996), (�) Townsend and Meyers (1996), (____) this study pH 4.2, (_ _) this study pH 5.7, (.. .. ..) this study pH 6.2. Figure 9. Composite explosive solubility prediction correlations. (____, ●) TNT, (. . . . , ▲) HMX, (_ _, ■) RDX. Figure 10. Comparison of explosive dissolution rates at three pH values. (�) TNT, (▲) HMX, (■) RDX. Figure 11. Comparison of TNT dissolution rates from pure TNT, Octol, and Composition B at 20 oC and 150 rpm Figure 12. Comparison of HMX dissolution rates from pure HMX, LX-14, and Octol at 20 oC and 150 rpm Figure 13. Comparison of RDX dissolution rates from pure RDX and Composition B at 20 oC and 150 rpm Figure 14. Adsorption kinetics of nitroglycerine in LAAP-D, Picatinney, and Yokena Clay soils. Figure 15. Adsorption kinetics of MNX in LAAP-D, Picatinny, and Yokena Clay soils. Figure 16. Adsorption kinetics of DNX in LAAP-D, Picatinny, and Yokena Clay soils.

127
Figure 17. Adsorption kinetics of TNX in LAAP-D, Picatinny, and Yokena Clay soils. Figure 18. Partitioning coefficients for MNX, DNX, and TNX in LAAP-D soil. Figure 19. Partitioning coefficients for nitroglycerine in LAAP-D and Picatinny soils. Figure 20. Desorption kinetics of TNT, RDX, and HMX in Ft. Lewis soil.

128
Figure 1. TNT, RDX, and HMX molecular structures
0
0.001
0.002
0.003
0.004
0.005
0.006
0.007
0.008
0.009
0.01
0 2 4 6 8 10 12 14
Surface Area (cm2)
Dis
solu
tion
rate
(mg
min
-1 c
m-2
)
Figure 2. Surface area comparison of explosives at 150 rpm and 10oC (◇ = TNT, □ = RDX, △ = HMX)

129
0
0.05
0.1
0.15
0.2
0.25
0.3
0.35
0.4
0.45
30 80 130 180 230
Mixing Speed (rpm)
Dis
solu
tion
rate
(mg
min
-1)
Figure 3. Mixing speed comparison of middle-size surface area explosives (◊ = TNT, □ = RDX, △ = HMX, ____ = 30oC, _ _ _ = 10oC)
0
0.00002
0.00004
0.00006
0.00008
0.0001
0.00012
0.00014
0.00016
0.00018
0.0002
5 10 15 20 25 30 35
Temperature (oC)
Dis
solu
tion
Rat
e (m
g m
in-1 c
m-2 rp
m-1)
Figure 4. Comparison of HMX multiple regression, multiple variable dissolution rate correlation (___) to the HMX single regression, multiple variable dissolution rate correlation (_ . ._ ). Note: Correlation data points (○) and validation points (□)

130
0
0.05
0.1
0.15
0.2
0.25
0.3
0.35
0.4
5.5 6 6.5 7 7.5 8 8.5 9
Surface Area (cm2)
Dis
solu
tion
Rat
e (m
g m
in-1
)
Figure 5. Rate comparisons of study TNT data (□ = 30 oC data, ◊ = 10 oC data) to multiple regression-multiple variable regression line (____) and the Levins-Glastonbury regression line (_ _ _)

131
Figure 6. Comparison of literature TNT solubility to this study. ▬▬ Taylor and Rinkenbach (1923), ▪▪▪▪▪ Spanggord et al. (1983), ▬ ... ▬ Ro et al. (1996), ■ Gibbs and Popolato (1980), △ Phelan and Barnett (2001), ____ this study pH 4.2 [ln (S/ mg L-1) = 16.895 – 3586.4 K/T, R2=0.9822]; _ _ this study pH 5.7 [ln (S/ mg L-1) = 17.263 – 3691.3 K/T, R2=0.9837], .. .. .. this study pH 6.2 [ln (S/ mg L-1) = 16.777 – 3542.5 K/T, R2=0.9785].
3.5
4
4.5
5
5.5
6
3.1 3.2 3.3 3.4 3.5 3.6 3.7
103T -1/K-1
lnS
/mg
L-1

132
Figure 7. Comparison of literature RDX solubility to this study. __+__ Spanggord et al. (1983), ■ Gibbs and Popolato (1980), △ Townsend and Meyers (1996), ____ this study pH 4.2 [ln (S/ mg L-1) = 19.087 – 4549.1 K/T, R2=0.987], _ _ this study pH 5.7. [ln (S/ mg L-1) = 19.718 – 4727.8 K/T, R2=0.995],, .. .. .. this study pH 6.2 [ln (S/ mg L-1) = 19.818 – 4753.2 K/T, R2=0.995].
2.5
3
3.5
4
4.5
5
3.1 3.2 3.3 3.4 3.5 3.6 3.7
103T -1/K-1
lnS
/mg
L-1
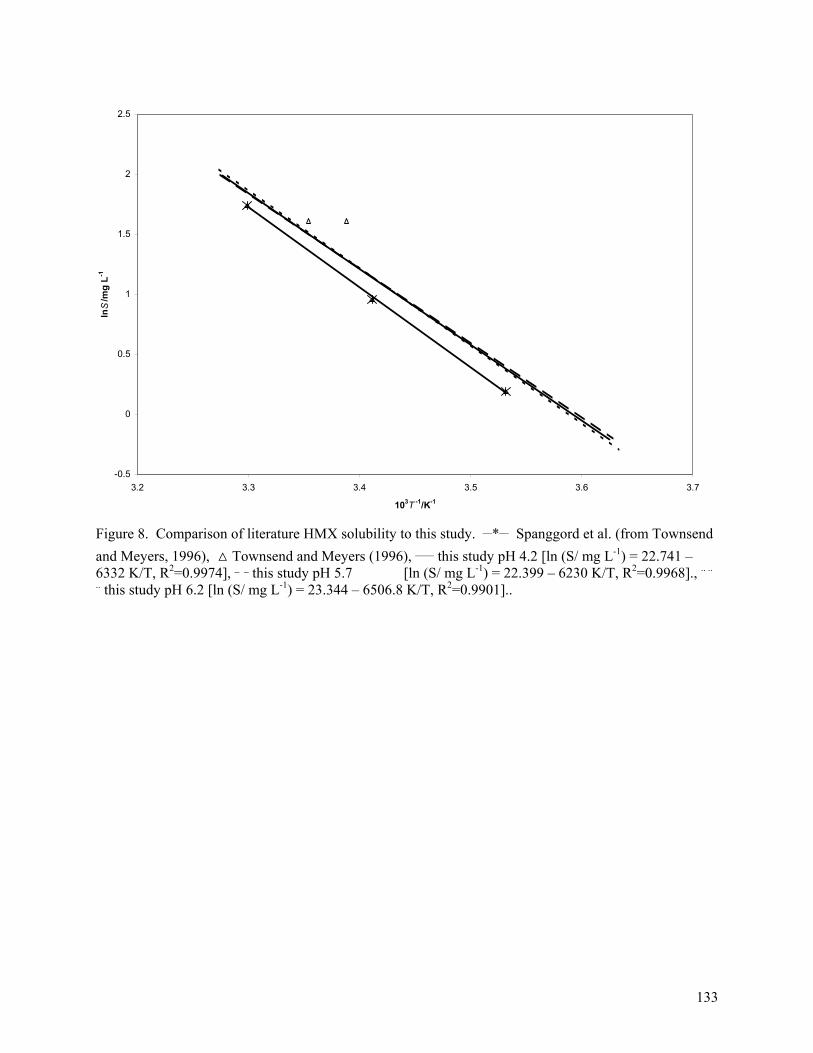
133
Figure 8. Comparison of literature HMX solubility to this study. __*__ Spanggord et al. (from Townsend and Meyers, 1996), △ Townsend and Meyers (1996), ____ this study pH 4.2 [ln (S/ mg L-1) = 22.741 – 6332 K/T, R2=0.9974], _ _ this study pH 5.7 [ln (S/ mg L-1) = 22.399 – 6230 K/T, R2=0.9968]., .. .. .. this study pH 6.2 [ln (S/ mg L-1) = 23.344 – 6506.8 K/T, R2=0.9901]..
-0.5
0
0.5
1
1.5
2
2.5
3.2 3.3 3.4 3.5 3.6 3.7
103T -1/K-1
lnS
/mg
L-1

134
Figure 9. Composite explosive solubility prediction correlations. ____, ● TNT [ln (S/ mg L-1) = 16.981 – 3607.5 K/T, R2=0.990], . . . . , ▲ HMX [ln (S/ mg L-1) = 22.825 – 6358.2 K/T, R2=0.997], _ _, ■ RDX [ln (S/ mg L-1) = 19.52 – 4670.9 K/T, R2=0.992].
-1
0
1
2
3
4
5
6
3.2 3.3 3.4 3.5 3.6 3.7
103T -1/K-1
lnS
/mg
L-1

135
Figure 10. Comparison of Explosive Dissolution Rates at Three pH Values. ◆ TNT, ▲ HMX, ■ RDX.
0
0.0001
0.0002
0.0003
0.0004
0.0005
0.0006
0.0007
0.0008
0.0009
4 4.5 5 5.5 6 6.5
pH
r/m
g s-1
cm
-2

136
TNT
FormulationNone Octol Comp B
TNT
Dis
solu
tion
rate
, ug
cm-2
sec-1
0.00
0.05
0.10
0.15
0.20
0.25
Figure 11. Comparison of TNT dissolution rates from pure TNT, Octol, and Composition B at 20 oC and 150 rpm

137
HMX
FormulationNone LX-14 Octol
HM
X D
isso
lutio
n ra
te, u
g cm
-2 se
c-1
0.00
0.02
0.04
0.06
0.08
0.10
0.12
0.14
0.16
0.18
Figure 12. Comparison of HMX dissolution rates from pure HMX, LX-14, and Octol at 20 oC and 150 rpm

138
RDX
FormulationNone Comp B
RD
X D
isso
lutio
n ra
te, u
g cm
-2 se
c-1
0.00
0.01
0.02
0.03
0.04
0.05
0.06
Figure 13. Comparison of RDX dissolution rates from pure RDX and Composition B at 20 oC and 150 rpm

139
TIME, DAYS
nitro.jnb graph1
0 1 2 3 4 5 6 7 80
1
2
LAAP DPicatinnyYokena Clay
CO
NC
ENTR
ATI
ON
, mg
L-1
Figure 14. Adsorption kinetics of nitroglycerine in LAAP-D, Picatinny, and Yokena Clay soils.

140
Time, Days0 1 2 3 4 5 6
MN
X C
once
ntra
tion,
mg
L-1
0.00
0.25
0.50
0.75
1.00
1.25
1.50
Laap D Yokena Clay Picatinny
t1/2 = 2.08 days
Figure 15. Adsorption kinetics of MNX in LAAP-D, Picatinny, and Yokena Clay soils.

141
Time, Days0 1 2 3 4 5 6
DN
X C
once
ntra
tion,
mg
L-1
0.00
0.25
0.50
0.75
1.00
1.25
1.50
1.75
2.00
LAAP D Yokena Clay Picatinny
t1/2 = 3.08 days
Figure 16. Adsorption kinetics of DNX in LAAP-D, Picatinny, and Yokena Clay soils.

142
Time, Days0 1 2 3 4 5 6
TNX
Con
cent
ratio
n, m
g L-1
1.75
2.00
2.25
2.50
2.75
LAAP D Yokena Clay Picatinny
Figure 17. Adsorption kinetics of TNX in LAAP-D, Picatinny, and Yokena Clay soils.

143
Solution Concentration, mg L-1
0 2 4 6 8 10 12
Soil
Con
cent
ratio
n, m
g K
g-1
0
1
2
3
4
DNXMNXTNXKd = 0.43
r2 = 0.94Kd = 0.85r2 = 0.96 Kd = 0.29
r2 = 0.50
Figure 18. Partitioning coefficients for MNX, DNX, and TNX in LAAP-D soil.

144
0.5 1.0 1.5 2.0 2.5 3.02
4
6
8
10
12
LAAP D PICATINNY
SOIL
CO
NC
ENTR
ATI
ON
, mg
Kg-1
WATER CONCENTRATION, mg L-1
Kd = 4.0 L Kg-1Kd = 3.8 L Kg-1
Figure 19. Partitioning coefficients for nitroglycerine in LAAP-D and Picatinny soils.

145
ftlewisdesorpt.jnb graph 2
Time, hours0 10 20 30 40 50 60
Solu
tion
Con
c., m
g L-1
0
1
2
3
4
5
6
HMXRDXTNT
Figure 20. Desorption kinetics of TNT, RDX, and HMX in Ft. Lewis soil.

146
5 Conclusions
Results of range characterization studies indicate that various types of military testing and
training ranges differ in the contaminants present. For example surface soils near targets on anti tank
rocket ranges are contaminated with extremely high concentrations (ppms) of HMX, while soils near
targets on artillery ranges exhibit extremely low concentrations (ppbs) of RDX and TNT. The
contamination associated with battle runs using pop-up targets is completely different from those
associated with fixed anti-tank targets. Consistently high concentrations (% levels) of explosives residues
were found near ruptured ordnance. Artillery ranges are a potentially very low non-point source of
explosives residues with higher point sources randomly scattered across the site. A multi-increment
composite sampling strategy is essential to adequately characterize the distribution of contaminants on
artillery ranges. Combining 30 individual increments into a composite sample in these studies resulted in
adequate reproducibility. The ability to reproduce data with an acceptable level of uncertainty provides
confidence that the sample is representative of the area.
The degree of contamination associated with detonation of dud rounds using C4 is a potential
concern. The use of C4 can result in incomplete detonations that scatter RDX across the soil. Since RDX
is an undesirable groundwater contaminant, consideration should be given to improving the efficiency of
blow-in-place disposal of dud rounds.
Dissolution rates of TNT, HMX, and RDX increased with surface area, temperature, and mixing
rates. TNT dissolved fastest, followed by HMX and RDX, respectively. Solubility and dissolution rates
were unaffected by pH, but increased slightly with temperature. Solubility and dissolution rates were not
always consistent with each other for a given analyte. Specifically, of the three primary explosives, TNT,
RDX, and HMX, TNT was the most soluble and had the highest dissolution rate, while RDX had the
second highest solubility, but exhibited the slowest dissolution rate. Dissolution rates of individual

147
explosives were suppressed in their formulations, i.e., LX-14, Composition B, and octol. Therefore,
explosives formulations would persist longer in surface soils than the parent compounds.
Nitroglycerine degraded rapidly in all soils tested; therefore, it is not expected to persist in surface
soils. The RDX transformation products, MNX, DNX, and TNX, were generally stable in all soils tested.
These compounds exhibit transport potential consistent with RDX. Transport parameters used to model
potential groundwater contamination and to evaluate environmental or human health risk should reflect
formulations of the explosives present and the dissolution rates as well as solubilities.

148
Abstract
Testing and training ranges are essential to maintaining the readiness of the Armed Forces of the
United States and Canada. Recently, concerns have arisen over potential environmental contamination
from residues of energetic materials at impact ranges. The current state of knowledge concerning the
nature, extent, and fate of contamination is inadequate to ensure sound management of ranges as
sustainable resources. This project was designed to develop techniques for assessing the potential for
environmental contamination from energetic materials on testing and training ranges. Techniques will be
developed to define the physical and chemical properties, concentration, and distribution of energetics
and residues of energetics in soils, and the potential for transport of these materials to groundwater.
The approach included characterization of two U. S. installations, Yakima Training Center, WA,
and Camp Guernsey, WY, and one Canadian installation, CFB Shilo. Post blast residues from various
heavy artillery munitions were characterized by sampling surface soils associated with firing positions
and with craters from both high- and low-order detonations. Where possible, ground and surface water
associated with the ranges was also sampled. Vegetation was characterized on the Canadian range. The
study also included determination of transport parameters for RDX transformation products, MNX, DNX,
and TNX and for nitroglycerin. Dissolution rates and solubilities of TNT, RDX, and HMX were
determined on the compound and on three explosives formulations, LX-14, Composition B, and octol.
Results of range characterization studies indicate that various types of military testing and
training ranges differ in the contaminants present. Consistently high concentrations (% levels) of
explosives residues were found near ruptured ordnance. Artillery ranges are a potentially very low non-
point source of explosives residues with higher point sources randomly scattered across the site. A multi-
increment composite sampling strategy is essential to adequately characterize the distribution of
contaminants on artillery ranges. Contamination associated with demolition detonation of duded rounds
using C4 is a potential concern. The use of C4 can result in incomplete detonations that scatter RDX
across the soil. Since RDX is an undesirable groundwater contaminant, consideration should be given to
improving the efficiency of blow-in-place disposal of duded rounds.
Dissolution rates of TNT, HMX, and RDX increased with surface area, temperature, and mixing
rates. Nitroglycerine degraded rapidly in all soils tested; therefore, it is not expected to persist in surface
soils. The RDX transformation products, MNX, DNX, and TNX, were generally stable in all soils tested.
These compounds exhibit transport potential consistent with RDX. Transport parameters used to model

149
potential groundwater contamination and to evaluate environmental or human health risk should reflect
formulations of the explosives present and the dissolution rates as well as solubilities.