Functional Links Between Aβ Toxicity, Endocytic Trafficking, and ...

IntroductionOrganelles of the endocytic pathway undergo active movementmediated by microtubule- or actin-dependent motors, anddisplay characteristic intracellular distributions in mostmammalian cells during interphase (reviewed by Schroer,2000). For instance, early endosomes containing the proteinmarker EEA1 (for ‘early endosome antigen 1’) tend todistribute more peripherally than late endocytic organelles (lateendosomes and lysosomes) containing Lamp1 (for ‘lysosome-associated membrane protein 1’), which normally accumulatein a juxtanuclear region around the microtubule-organizingcenter (MTOC) (Matteoni and Kreiss, 1987; Mu et al., 1995;Patki et al., 1997). The physiological significance of themovement and steady-state localization of these organellesremains incompletely understood, although it might contributeto the overall efficacy of the processes of organelle biogenesisand protein sorting.
The perinuclear steady-state distribution of lysosomes hasbeen shown to reflect a balance between long-range vectorialmovement towards the plus and minus ends of microtubules aswell as short-range movement on actin filaments (Matteoni andKreiss, 1987; Taunton et al., 2000; Cordonnier et al., 2001).Molecular motors implicated in the movement of lysosomes(and probably of late endosomes) include dynein and itsassociated dynactin complex (for movement towards the minusend of microtubules), kinesin superfamily members such asKIF2� and KIF1B�3 (for microtubule-dependent movementtowards the cell periphery) and myosin I� (for movement onactin filaments) (Burkhardt et al., 1997; Harada et al., 1998;Santama et al., 1998; Valetti et al., 1999; Cordonnier et al.,2001; Matsushita et al., 2004). Other factors include: Rab7 andits effector, Rab7-interacting lysosomal protein, which regulateattachment of late endocytic organelles to dynactin/dynein(Jordens et al., 2001); and MLN64, which regulates attachment
5243
Late endosomes and lysosomes of mammalian cells ininterphase tend to concentrate in the perinuclear regionthat harbors the microtubule-organizing center. We havepreviously reported abnormal distribution of theseorganelles – as judged by reduced percentages of cellsdisplaying pronounced perinuclear accumulation – inmutant fibroblasts lacking BLOC-3 (for ‘biogenesis oflysosome-related organelles complex 3’). BLOC-3 is aprotein complex that contains the products of the genesmutated in Hermansky-Pudlak syndrome types 1 and 4.Here, we developed a method based on image analysis toestimate the extent of organelle clustering in theperinuclear region of cultured cells. Using this method,we corroborated that the perinuclear clustering of lateendocytic organelles containing Lamp1 (for ‘lysosome-associated membrane protein 1’) is reduced in BLOC-3-deficient murine fibroblasts, and found that it is apparentlynormal in fibroblasts deficient in BLOC-1 or BLOC-2,which are another two protein complexes associated withHermansky-Pudlak syndrome. Wild-type and mutantfibroblasts were transfected to express human LAMP1fused at its cytoplasmic tail to green fluorescence protein(GFP). At low expression levels, LAMP1-GFP was targetedcorrectly to late endocytic organelles in both wild-type and
mutant cells. High levels of LAMP1-GFP overexpressionelicited aberrant aggregation of late endocytic organelles,a phenomenon that probably involved formation of anti-parallel dimers of LAMP1-GFP as it was not observed incells expressing comparable levels of a non-dimerizingmutant variant, LAMP1-mGFP. To test whether BLOC-3plays a role in the movement of late endocytic organelles,time-lapse fluorescence microscopy experiments wereperformed using live cells expressing low levels of LAMP1-GFP or LAMP1-mGFP. Although active movement of lateendocytic organelles was observed in both wild-typeand mutant fibroblasts, quantitative analyses revealeda relatively lower frequency of microtubule-dependentmovement events, either towards or away from theperinuclear region, within BLOC-3-deficient cells. Bycontrast, neither the duration nor the speed of thesemicrotubule-dependent events seemed to be affected by thelack of BLOC-3 function. These results suggest that BLOC-3 function is required, directly or indirectly, for optimalattachment of late endocytic organelles to microtubule-dependent motors.
Key words: Lysosomes, Endosomes, Microtubules, Time-lapsemicroscopy, Hermansky-Pudlak syndrome
Summary
Distribution and dynamics of Lamp1-containingendocytic organelles in fibroblasts deficient inBLOC-3Juan M. Falcón-Pérez, Ramin Nazarian, Chiara Sabatti and Esteban C. Dell’Angelica*Department of Human Genetics, University of California, Los Angeles, CA 90095, USA*Author for correspondence (e-mail: [email protected])
Accepted 12 August 2005Journal of Cell Science 118, 5243-5255 Published by The Company of Biologists 2005doi:10.1242/jcs.02633
Research Article
Jour
nal o
f Cel
l Sci
ence

5244
of these organelles to actin filaments (Hölttä-Vuori et al.,2005). Interference with the function of these proteins, eitherby loss-of-function or overexpression approaches, has beenreported to modify the steady-state distribution of lateendosomes and lysosomes, as inferred from fluorescencemicroscopic analyses (Burkhardt et al., 1997; Harada et al.,1998; Santama et al., 1998; Valetti et al., 1999; Bucci et al.,2000; Cantalupo et al., 2001; Cordonnier et al., 2001;Matsushita et al., 2004; Hölttä-Vuori et al., 2005).
We (Nazarian et al., 2003) and others (Chiang et al., 2003;Martina et al., 2003) have described a stable protein complex,named BLOC-3 (for ‘biogenesis of lysosome-relatedorganelles complex 3), which is expressed ubiquitously andcontains the products of the HPS1 and HPS4 genes mutatedin Hermansky-Pudlak syndrome (HPS) types 1 and 4,respectively. HPS is a group of autosomal recessive disordersinvolving defects in lysosome-related organelles (reviewed byDi Pietro and Dell’Angelica, 2005). Common to all forms ofHPS are albinism and bleeding diathesis, resulting fromabnormalities in melanosomes and platelet dense granules,respectively. Patients suffering from HPS-1 and HPS-4 are atrisk of developing progressive pulmonary fibrosis, whichmight arise from defects in another lysosome-relatedorganelle, the lamellar body of type II lung epithelial cells. Amild form of ceroid lipofuscinosis has also been described forHPS type 1 patients, suggesting that lysosomal degradativefunction might be compromised (reviewed by Gunay-Aygunet al., 2004). The murine orthologs of human HPS1 and HPS4are mutated in the pale ear and light ear strains, respectively,which serve as bona fide models of the disease (Li et al.,2004). Using immortalized fibroblasts derived from the skinof these mutant mice, we observed relatively reducedpercentages of cells displaying pronounced perinucleardistribution at steady-state of markers of late endosomes(lysobisphosphatidic acid), lysosomes (internalized dextran),or both (Lamp1). Colocalization experiments indicated thatthe observed differences were unlikely to be owing to proteinmissorting, suggesting that BLOC-3 might regulate themovement/distribution of late endosomes and lysosomes(Nazarian et al., 2003).
In this work, we sought to develop a quantitative method toestimate the extent of organelle clustering at the perinuclearregion of the cell, which has so far relied on intrinsicallysubjective approaches. We applied this method to the analysisof Lamp1-positive organelles in mutant fibroblasts deficient inBLOC-3 as well as in BLOC-1 or BLOC-2, another twoprotein complexes associated with HPS (Di Pietro andDell’Angelica, 2005). We also performed time-lapsemicroscopic experiments on live cells expressing humanLAMP1 fused to green fluorescence protein (GFP), to test thehypothesis that BLOC-3 plays a role in the regulation of themovement of late endocytic organelles. During the course ofthese experiments, we observed that high levels of LAMP1-GFP overexpression can elicit organelle aggregation, andexamined the possible mechanism of this phenomenon.
Materials and MethodsReagentsThe sources of primary and secondary antibodies used in this studywere described previously (Nazarian et al., 2003). Texas-Red- and
BODIPY-FL-conjugated fixable dextrans were purchased fromMolecular Probes. The human megakaryoblast cell line MEG-01 wasobtained from American Type Culture Collection. All media andreagents for tissue culture, as well as the TRIzol reagent, werepurchased from Invitrogen. The FuGENE 6 transfection reagent wasfrom Roche Diagnostics. Nocodazole was from Sigma-Aldrich. Allother reagents were of analytical grade.
DNA constructsTo generate an expression plasmid encoding the LAMP1-GFP fusionprotein, the complete open-reading frame of human LAMP1(GenBank accession number XM_052636) and portions of the 5� and3� untranslated regions were amplified by reverse-transcriptase PCRfrom total RNA purified from MEG-01 cells using the TRIzol reagent.The product was purified and used as template for nested PCR usingprimers designed to append an EcoRI site upstream of the Kozaksequence and to replace the translation termination site by a segmentencoding the linker sequence GSTGSTGSTGA (single-letter aminoacid code) followed by a SalI site. The nested PCR product was gelpurified and cloned in the EcoRI-SalI sites of the pEGFP-N3 vector(BD Biosciences Clontech). A variant construct expressing LAMP1-mGFP, in which the leucine residue at position 221 of the GFP domainwas replaced by lysine to avoid anti-parallel dimerization (Zachariaset al., 2002), was generated by site-directed mutagenesis using theQuickChange XL kit (Stratagene). Constructs were verified by DNAsequencing.
Cell culture, transfection and dextran internalizationThe generation and culture conditions of immortalized fibroblast linesderived from the skin of wild-type (C57BL/6J), pale ear (B6.C3Fe-Hps1ep/J), pallid (B6.Cg-Pldnpa/J) and cocoa (B6.B10-Hps3coa/J)mice were described previously (Nazarian et al., 2003; Di Pietro etal., 2004). Transient transfection using FuGENE 6 and labeling oflysosomes through internalization of Texas-Red-conjugated dextranwere performed as described (Nazarian et al., 2003).
For stable transfection, murine fibroblasts were grown at 37°C incomplete DMEM [Dulbecco’s modified Eagle medium supplementedwith 20% (v/v) fetal bovine serum, 2 mM glutamine, 0.1 mg/mlstreptomycin and 100 units/ml penicillin] to 60-70% confluency, andsubsequently transfected with the LAMP1-GFP-encoding plasmidusing FuGENE 6 in serum-free DMEM. The medium was changed tocomplete DMEM 5 hours after transfection, and to complete DMEMcontaining 2 g/l G418 one day later. Cells displaying resistance toG418 and expressing LAMP1-GFP (as judged by fluorescencemicroscopy) were cloned by limiting dilution and, in the cases of oneline derived from wild-type fibroblasts and one line derived from paleear fibroblasts, by preparative cell sorting on a BD FACSVantage SEflow cytometer (Becton Dickinson).
Fluorescence microscopy of fixed cellsImmunofluorescence staining of fixed/permeabilized cells was carriedout as described (Dell’Angelica et al., 1997). The samples wereexamined on a Zeiss Axioskop 2 microscope equipped with an Orca-ER digital camera (Carl Zeiss) or, for analyses requiring high opticalresolution (e.g. colocalization experiments), on a Leica TCS SPmultiphoton confocal microscope (Leica).
Determination of perinuclear clustering indexFixed/permeabilized fibroblasts from wild-type, pallid, cocoa andpale ear mice (three independent cell lines per strain) were stainedusing rat monoclonal antibody 1D4B against endogenous murineLamp1, followed by Cy3-conjugated secondary antibody against ratIgG. Digital images (1344�1024 pixels, 8 bits per pixel) ofrandomly selected cells were acquired on a Zeiss Axioskop 2
Journal of Cell Science 118 (22)
Jour
nal o
f Cel
l Sci
ence

5245BLOC-3 and endocytic organelle movement
microscope equipped with an Orca-ER digital camera, using a40� objective and appropriate filters. Two images were acquired foreach selected microscopic field; one was obtained under conditionsoptimized to prevent signal saturation, and the other wasoverexposed to facilitate delimitation of the cell perimeter. Theimages were saved as TIFF files using coded file names, to ensurethat the person(s) involved in subsequent image analysis couldreadily recognize which two files corresponded to the optimal andoverexposed versions of each image but could not establish theidentity of the cell line. Images were imported into NIH Image 1.62,using the Stacks option to align each pair of optimal andoverexposed images. For each cell in the image, the perimeter of thewhole cell (C) and that of the nucleus (N) were drawn by an operator(see, for example, Fig. 1A,B). Although drawing of these twoperimeters was based on the overexposed version of the image, allcalculations were performed using the optimal version. Additionalareas, including the nucleus and part of the perinuclear region of thecell (nucleus + perinuclear, or NP), were delimited according to thefollowing rules: (1) it must completely include the area delimited asthe nucleus; (2) it must not extend outside the cell; and (3) its shapeshould maximize inclusion of Lamp1 staining signal (for example,see Fig. 1C). For each delimited region, its size (S, in pixels) andmean fluorescence intensity (F, in arbitrary units) were measured,and multiplication of these two values allowed calculation of thetotal fluorescence signal of the region. To calculate the uncorrectedmean fluorescence intensity of the perinuclear (or cytoplasmic)regions, the total fluorescence signal of the N region was subtractedfrom that of the NP region (or of the C region), and the resultingvalue was divided by the size of NP (or of C) minus the size of N.A background mean fluorescence intensity, FB, was measured fromareas delimited at random places outside the cells and subtractedfrom the uncorrected mean fluorescence intensity values of theperinuclear and cytoplasmic regions. Hence, the perinuclear/
cytoplasmic Lamp1 staining ratio (R) was calculated using thefollowing equation:
R = [(FNP � SNP – FN � SN) / (SNP – SN) – FB] / [(FC � SC – FN � SN) / (SC – SN) – FB] . (1)
Because the value of R was heavily dependent on the relative size ofthe NP area (Fig. 1D), a series of NP areas of increasing size weredrawn for each cell, and those with relative area sizes (SNP/SC) in the0.15-0.25 range (at least three data points per cell) were used for least-square fitting of the data by the following equation:
R = A – PCI � (SNP / SC) , (2)
where PCI (perinuclear clustering index) and A are the constants ofthe fitted linear equation.
Time-lapse fluorescence microscopyFibroblasts were grown on glass-bottomed culture dishes (Mattek).Initial analyses of the dynamics of late endosomes and lysosomeswere carried out using wild-type and mutant fibroblast lines stablyexpressing LAMP1-GFP, and subsequent experiments wereperformed using fibroblasts that had been transiently transfected toexpress LAMP1-GFP or LAMP1-mGFP. In all cases, cells expressinglow levels of the fusion protein, as judged by GFP fluorescence, wereselected for imaging. To prepare cell samples for the analysisof lysosome dynamics, cells were first incubated for 8 hours incomplete DMEM containing 0.5 g/l BODIPY-FL-conjugated dextran,transferred to glass-bottomed culture dishes, and incubated foranother 12 hours in complete DMEM lacking dextran, at 37°C in atissue culture incubator.
For acquisition of time-lapse fluorescence images, the medium waschanged to complete DMEM lacking Phenol Red and containing 25mM Hepes buffer (pH 7.4), and the glass-bottomed culture dishes
Fig. 1. Quantitative analysis of the perinuclearclustering of endogenous Lamp1 from wild-type and BLOC-deficient fibroblasts.(A-C) Low-magnification fluorescence imagesof cells stained with anti-Lamp1 were acquiredusing a fluorescence microscope equipped witha digital camera. Images were processed tocalculate areas (in pixels) and meanfluorescence intensities (in arbitrary units) of(A) ‘whole cell’, (B) ‘nucleus’ and (C) ‘nucleus+ perinuclear region’, which were drawn(yellow lines) by an operator who was unawareof the identity of the sample. Bar, 20 �m.(D) Plot of the ratio between background-corrected, mean fluorescence values of theregions defined as perinuclear (i.e. ‘nucleus +perinuclear region’ minus ‘nucleus’) andcytoplasmic (i.e. ‘whole cell’ minus ‘nucleus’)as a function of the ratio between the areas of‘nucleus + perinuclear region’ and ‘whole cell’.Filled circles correspond to values derived fromthe cell shown in A-C. Open circles correspondto the analysis of another cell in which Lamp1staining was relatively less concentrated in theperinuclear area. For each cell, the perinuclearclustering index (PCI) was calculated as theslope obtained by linear regression of the datawithin the range of relative area sizes 0.15-0.25(gray in D), multiplied by –1 to render positive values. (E) PCI of immortalized skin fibroblast lines derived from mutant murine strainsdeficient in BLOC-1 (pallid), BLOC-2 (cocoa) and BLOC-3 (pale ear), as well as from a wild-type control strain. For each cell line, the PCI of20 randomly selected cells was averaged. Bars represent mean±standard error of three independent cell lines per strain. *P<0.05 (ANOVAfollowed by Tukey’s test).
Jour
nal o
f Cel
l Sci
ence

5246
were placed on the heating stage of a Leica DM-IRBE invertedmicroscope equipped with a 100� objective and Orca-ER digitalcamera, and controlled by SlideBook software (Intelligent ImagingInnovations, Denver, CO). The temperature of the sample was set to35°C. In typical experiments, images were acquired every 2 secondsfor 98 seconds, and pixel size was equivalent to 0.39�0.39 �m. Insome experiments, cells were pre-incubated for at least 90 minutes inthe presence of 30 �M nocodazole to disrupt microtubules.
For quantitative analysis of time-lapse experiments, 30 fluorescentorganelles per cell were selected at random among those that were notin overcrowded regions of the initial frame image, and their positionsdetermined in each subsequent frame by manual tracking. Becauseseveral organelles changed their shape during movement, theirposition was calculated as the center of mass of the fluorescencesignal. The two-dimensional displacement between consecutiveframes was calculated from the changes in X and Y positioncoordinates, using Pitagora’s equation (changes in Z position wereconsidered negligible due to the flat extended shape of the cells). Foreach organelle, the following values were calculated as defined:maximum speed (in �m/second) was defined as the highest value ofspeed (displacement divided by time) obtained between twoconsecutive frames; effective distance (in �m) was defined as themaximum distance between any two positions of the trajectory duringthe 98-second period; average speed on microtubules (in �m/second)was defined as the arithmetic average of all speed values betweenconsecutive frames that were equal or larger than 0.78 �m/second;percentage of time at speed �0.78 �m/second was defined as thepercentage of the 2-second intervals between frames in which thedisplacement was equal or larger than 1.56 �m; number of events withspeed increasing to �0.78 �m/second was defined as the number oftimes within 98 seconds in which a 2-second interval with speed <0.78�m/second was followed by another interval with speed �0.78�m/second; and duration of events with speed �0.78 �m/second (inseconds) was defined as the arithmetic average of the duration ofseries of consecutive 2-second intervals with speed �0.78 �m/second.
Statistical analysesStatistical analysis of the PCI data was performed using one-wayANOVA followed by a posteriori Tukey’s test, considering eachaverage value per cell line (out of 20 randomly selected cells) anindependent observation. For the analysis of data derived from time-lapse microscopic experiments, each median value per cell (out of 30randomly selected organelles) was considered an independentobservation. Ten cells were analyzed per cell line, and three (forLAMP1-GFP) or two (for LAMP1-mGFP) independent cell lineswere analyzed per murine strain (wild-type or pale ear). Themaximum speed, effective distance and average speed onmicrotubules data were analyzed using an ANOVA model uponlogarithmic transformation (to make the assumption of Gaussiandistributions appropriate). For the analysis of the percentage of timeat speed �0.78 �m/second and the number of events with speedincreasing to �0.78 �m/second data, the odds of obtaining zero asthe median value per cell were compared using Fisher’s exact test.The duration of events with speed �0.78 �m/second data wasanalyzed using both Kolmogorov-Smirnov test and Fisher’s exact test.
ResultsQuantitative analysis of perinuclear clusteringPrevious analyses on the clustering of late endocytic organellesat the perinuclear region of the cell has relied on intrinsicallysubjective approaches, such as estimating percentages ofcells that display pronounced perinuclear accumulation orperinuclear clustering as judged by an observer (e.g. Matteoniand Kreiss, 1987; Nazarian et al., 2003; Poupon et al., 2003;
Matsushita et al., 2004; Gissen et al., 2005; Hölttä-Vuori et al.,2005). Although such approaches are simple and may sufficein cases where differences between cell samples are readilyapparent, we sought to develop a quantitative method thatwould allow the study of perinuclear clustering in cases wheredifferences may be relatively less dramatic.
We focused our analysis on late endosomes and lysosomeslabeled with endogenously expressed Lamp1, which wepreviously reported to be relatively less concentrated in theperinuclear region of BLOC-3-deficient fibroblasts as inferredfrom reduced percentages of cells displaying pronouncedperinuclear accumulation (Nazarian et al., 2003). Our approachconsisted of estimating the concentration gradient of Lamp1staining from determinations of the perinuclear/cytoplasmicstaining ratio as a function of the relative size of the perinuclearregion. We obtained digital images of Lamp1-stained cellsunder conditions in which the whole cell was included (i.e. lowmagnification and no optical sectioning) and the fluorescencesignal intensities were within the dynamic range of the digitalcamera. To avoid bias in our analysis, the cells were randomlypicked for imaging, and the resulting images were processedfollowing a ‘blinded’ approach in which the operator wasunaware of the sample identity.
Our attempts to develop an algorithm for fully automaticanalysis of the images were hampered by the high variabilityin size and shape, not only of whole cells but also of theirperinuclear regions. As an alternative, we chose to have anoperator delimiting by hand (with the aid of a computer mouse)the whole cell (Fig. 1A), the nucleus (Fig. 1B) and a third areaincluding the nucleus and part of the perinuclear region(Fig. 1C). Whereas definition of the first two regions wasstraightforward, the third was more problematic because wecould not fit satisfactorily any simple geometrical shape to theNP region of most cells. Instead, the operator was allowed todelimit areas of any shape, with the main restriction thatinclusion of Lamp1 staining should be maximized (e.g. see Fig.1C). From each area we measured its size and meanfluorescence intensity, and using Equation 1 we calculated theperinuclear/cytoplasmic ratio of Lamp1 staining. As expected,this value was highly dependent on the relative size of the NPregion area and approached unity as the size of this areaapproached that of the whole cell (Fig. 1D). Similarcalculations performed for several cells led us to restrict ouranalysis to relative area sizes in the 0.15-0.25 range, in whichthe relationship between perinuclear/cytoplasmic staining ratioand relative area size could be fitted reasonably by a linearfunction (Fig. 1D, gray area). We defined the perinuclearclustering index (PCI) as the slope of the fitted linear function,multiplied by –1 to render positive values. Importantly, wefound that the role of the operator in deciding the shape of theNP region area was not a major source of error, as the operator-to-operator variability in the analysis of the same set of cells(11%) was lower than the cell-to-cell variability within afibroblast line (76%).
Using this quantitative approach, we re-examined the effectof BLOC-3 deficiency on perinuclear clustering of Lamp1-positive organelles in murine skin fibroblasts (Nazarian et al.,2003) and extended our analysis to fibroblasts deficient inBLOC-1 or -2, which are another two protein complexesof unknown molecular function but implicated in thepathogenesis of HPS. We used immortalized lines of skin
Journal of Cell Science 118 (22)
Jour
nal o
f Cel
l Sci
ence

5247BLOC-3 and endocytic organelle movement
fibroblasts derived from a wild-type strain andfrom the pallid, cocoa and pale ear strainsdeficient in BLOC-1, -2 and -3, respectively.We analyzed three independent cell lines(derived from different animals) per strain; foreach cell line, we calculated the PCI as theaverage of the values obtained for 20 randomlyselected cells. The results are shown in Fig. 1E.Consistent with our previous study (Nazarianet al., 2003), the PCI of Lamp1 staining wassignificantly reduced in cells deficient inBLOC-3. By contrast, the PCI was notsignificantly affected in cells deficient inBLOC-1 or -2. Hence, normal perinuclearclustering of Lamp1-positive organelles infibroblasts requires BLOC-3 function butseems not to depend on BLOC-1 or -2.
The LAMP1-GFP fusion protein localizesto late endocytic organelles at lowexpression levels but its overexpressioncauses abnormal organelle aggregationTo characterize further the effects of BLOC-3deficiency on Lamp1-positive late endosomesand lysosomes, we expressed a constructconsisting of the human ortholog of murineLamp1, LAMP1, fused at its cytoplasmiccarboxyl terminus to GFP. We chose to fuseGFP to human LAMP1, and not to the murineprotein, because of the availability of a species-specific rat monoclonal antibody, 1D4B, whichrecognizes mouse Lamp1 and not humanLAMP1 and thus allows detection ofendogenous Lamp1 in cells expressing theLAMP1-GFP construct. Control experimentsusing human M1 fibroblasts transfectedwith the LAMP1-GFP-encoding plasmidcorroborated that the monoclonal antibodydoes not significantly crossreact with LAMP1-GFP, even at the highest expression levelsachieved in this study (not shown). Fusion ofGFP at the carboxyl terminus of humanLAMP1 did not interfere with its subcellulartargeting, as judged by extensive colocalizationbetween LAMP1-GFP and endogenous Lamp1(Fig. 2A-C). As expected, the LAMP1-GFPfusion protein localized to most lysosomeslabeled with internalized dextran, as well as todextran-negative organelles that probablyrepresented late endosomes (Fig. 2D-F). Inagreement with a previous study using a GFP-tagged form of the avian Lamp1 homolog,lgp120 (Patterson and Lipincott-Schwartz,2002), LAMP1-GFP was also targeted to pre-formed lysosomes, as inferred from its partiallocalization to lysosomes that had been loadedwith dextran before transfection with theLAMP1-GFP-encoding plasmid (not shown).At low expression levels, LAMP1-GFP colocalized poorlywith the early endosomal marker EEA1 (Fig. 2G-I). The
degrees of colocalization of LAMP1-GFP with endogenousLamp1 (Fig. 2J-L), dextran-loaded lysosomes (Fig. 2M-O) and
Fig. 2. Localization of LAMP1-GFP fusion protein expressed in transfected murinefibroblasts. Immortalized skin fibroblasts derived from wild-type (A-I) or pale ear (J-O) mice were transfected with a plasmid encoding human LAMP1 fused to GFP(A,D,G,J,M and green in C,F,I,L,O). One day after transfection, the cells werefixed/permeabilized and stained with a species-specific antibody to murine Lamp1(B,K and red in C,L) or an antibody to EEA1 (H and red in I). Alternatively, cellswere allowed to internalize Texas-Red-conjugated dextran, followed by a 4-hourchase period to ensure specific labeling of mature lysosomes (E,N and red in F,O).Bar, 20 �m. The top-left region of panels A-C, which displays staining ofendogenous Lamp1 but not of LAMP1-GFP, corresponds to part of an untransfectedcell. Magnified views of selected areas are shown in the insets.
Jour
nal o
f Cel
l Sci
ence

5248
EEA1 (not shown) in BLOC-3-deficient fibroblasts weresimilar to those observed in wild-type fibroblasts, implying thatthe steady-state localization of LAMP1-GFP was notsignificantly affected by BLOC-3 deficiency.
High levels of LAMP1-GFP overexpression not only led toaccumulation of the chimeric protein at the cell surfaceand EEA1-positive compartments but, surprisingly, elicitedaggregation of late endocytic compartments. Organelleaggregation in LAMP1-GFP-overexpressing cells was inferredfrom immunostaining of endogenous mouse Lamp1 (Fig. 3A-D) or labeling of lysosomes with fluorescent dextran either
before (Fig. 3E,F) or after (not shown) transfection with theLAMP1-GFP-encoding plasmid. At low magnification, thestaining appeared as ‘chunky’ (see Fig. 3B,D,F, arrows);however, close examination at high optical resolution byconfocal microscopy revealed that the organelles wereaggregated but not fused with each other (Fig. 3F, inset, anddata not shown). A similar effect was observed uponexpression of high levels of LAMP1-GFP in BLOC-3-deficientfibroblasts (Fig. 3I-L), indicating that BLOC-3 function is notrequired for this phenomenon. Further analyses (not shown)demonstrated that the same effect can be elicited uponoverexpression of LAMP1-GFP in other cell lines (e.g. humanHeLa and M1 cells) or by overexpression of another Lamp(LAMP3/CD63) tagged with GFP, and that early and recyclingendosomes do not seem to be affected as judged by EEA1 andtransferrin receptor immunostaining in LAMP1-GFP-overexpressing cells.
Previous studies have shown that microinjection of divalentantibodies to the cytoplasmic domain of LAMP1 can elicitaggregation of lysosomes (Bakker et al., 1997), and thatoverexpression of endoplasmic reticulum (ER)-residentmembrane proteins fused to GFP at the cytoplasmic domaincan induce stacked ER membrane structures resulting fromlow-affinity, anti-parallel dimerization of the GFP tag (Snappet al., 2003). We hypothesized that the aberrant aggregation oflate endosomes and lysosomes observed in cells expressinghigh levels of LAMP1-GFP could be owing to low-affinitybinding of LAMP1-GFP from opposing membranes, throughdimerization of their GFP tags. To test this hypothesis, wesubstituted leucine 221 of the GFP domain with lysine, a pointmutation known to disrupt the ability of GFP to form anti-parallel dimers (Zacharias et al., 2002), and examined theability of the resulting fusion protein variant, LAMP1-mGFP,to elicit aggregation of late endocytic compartments. Wild-typemurine fibroblasts were transiently transfected with plasmidsencoding LAMP1-GFP or LAMP1-mGFP, and the followingday were fixed, permeabilized and subsequently stained forendogenous Lamp1 using Cy3-conjugated secondary antibody.Images of GFP and Cy3 fluorescence were obtained for eachof 117 and 134 randomly selected cells expressing LAMP1-GFP and LAMP1-mGFP, respectively, and saved using codedfile names. On the basis of GFP fluorescence intensity, weestimated that the expression levels of the two fusion proteins
Journal of Cell Science 118 (22)
Fig. 3. High levels of LAMP1-GFP overexpression elicit aggregationof late endocytic compartments. Immortalized skin fibroblasts fromwild-type (A-H) and pale ear (I-L) mice were transfected withplasmids encoding LAMP1 fused to either GFP or its non-dimerizingmutant form (mGFP). One day after transfection, cells werefixed/permeabilized and stained with the 1D4B antibody to mouseLamp1 (B,D,H,J). In some experiments, cells were first allowed tointernalize Texas-Red-conjugated dextran (F,L), transfected with theLAMP1-GFP-encoding plasmid, cultured for one day in mediumwithout dextran, and then fixed and processed for fluorescencemicroscopy. Arrows indicate cells expressing high levels of LAMP1-GFP or LAMP-mGFP, as judged by their GFP fluorescence signal(A,C,E,G,I,K). Asterisks in A and B denote a transfected cellexpressing LAMP1-GFP levels comparable with those of the cellsshown in Fig. 2. Bar, 20 �m. The inset in F shows a high-resolutionview of one of the dextran clusters as obtained by confocalmicroscopy, suggesting that the dextran-positive compartments haveaggregated but not fused with each other.
Jour
nal o
f Cel
l Sci
ence
5249BLOC-3 and endocytic organelle movement
were comparable; in arbitrary units, the median values were 33and 41, and the ranges were 9-144 and 20-189, for cellsexpressing LAMP1-GFP and LAMP1-mGFP, respectively.The Cy3 fluorescence images, corresponding to endogenousLamp1 staining, were scored by two observers who were notaware of the identity of the expressed construct or itsexpression level. Whereas 16 of the 117 LAMP1-GFP-expressing cells (14%) and 9 of the 11 cells expressing thehighest LAMP1-GFP levels (82%) were scored as having‘chunky’ Lamp1 staining by the two observers, none of the 134cells expressing LAMP1-mGFP displayed such phenotype(e.g. see Fig. 3G,H). Therefore, the abnormal aggregation oflysosomes and late endosomes caused by LAMP1-GFPoverexpression requires the ability of GFP to form dimers.
Dynamics of late endocytic organelles in wild-type andmutant fibroblastsTime-lapse fluorescence microscopy experiments wereperformed to test whether BLOC-3 is required for optimalmovement of late endocytic compartments. A first set ofexperiments was carried out using wild-type and pale earfibroblasts (three independent cell lines per strain) expressinglow LAMP1-GFP levels comparable with those of the cells
shown in Fig. 2. Subsequent experiments were carried outusing cells expressing the non-dimerizing LAMP1-mGFPvariant (two independent cell lines per strain) as well as cellsin which lysosomes were specifically labeled using BODIPY-FL-conjugated dextran (one cell line per strain). In each case,ten cells per fibroblast line were analyzed by acquiring 50consecutive GFP fluorescence images at 2-second intervals.
Fig. 4A shows a portion of the initial image acquired froma wild-type cell expressing LAMP1-GFP. Consistent withprevious studies on the dynamics of late endosomes andlysosomes (Matteoni and Kreiss, 1987; Cordonnier et al., 2001;Ko et al., 2001; Lebrand et al., 2002), the behavior of LAMP1-GFP-positive organelles was best described as a combinationof short- and long-range movement events together withperiods of no detectable movement, and the long-rangemovements required intact microtubules as judged by theirdramatic inhibition in fibroblasts treated with nocodazole (notshown). Instances in which LAMP1-GFP-positive organellesadopted tubular shapes were observed (Fig. 4A and data notshown). Although one might envision that changes in shapecould be a consequence of molecular motors pulling a largemembrane-bounded organelle, we could not find any clearcorrelation between change of shape and organelle speed (notshown). By visual inspection of the time-lapse movies, itbecame apparent that lysosomes specifically labeled withBODIPY-FL-conjugated dextran were relatively less dynamicthan LAMP1-GFP-positive organelles, suggesting that maturelysosomes might be less mobile than late endosomes or,alternatively, that loading of the lysosomal lumen with dextranmight affect lysosome dynamics.
For quantitative analyses, we randomly selected 30 LAMP1-GFP-labeled organelles per cell, and for each organelle wedetermined its position at each frame. Examples of two-dimensional projections of the trajectories of selected LAMP1-GFP-positive organelles are depicted in Fig. 4B. For eachorganelle we calculated the maximum speed and effectivedistance, the latter defined as the largest distance between anytwo positions in the trajectory. Fig. 5 shows the distributionsof maximum speed (panel A) and effective distance (panel B)corresponding to 900 LAMP1-GFP-positive organelles (30organelles � 10 cells � 3 cell lines) from wild-type fibroblastsand the same number of organelles from pale ear (BLOC-3-deficient) fibroblasts. Panels A and B of Fig. 5 also showthe corresponding distributions of LAMP1-GFP-positiveorganelles from wild-type cells treated with nocodazole, whichallowed us to infer the extent of microtubule-dependentmovement as assessed by our system. In particular, movementof LAMP1-GFP-positive organelles in nocodazole-treatedwild-type cells only rarely achieved or exceeded an instantspeed of 0.78 �m/second (corresponding under our imagingconditions to a displacement of 4 pixels between twoconsecutive frames; Fig. 5A) and never exceeded an effectivedistance of 4 �m (Fig. 5B). Interestingly, a relatively largerfraction of organelles from pale ear cells displayed maximumspeed values of less than 0.78 �m/second (Fig. 5A) andtraveled effective distances of less than 4 �m (Fig. 5B). Similarshifts in maximum speed and effective distance distributionswere observed in experiments using wild-type and pale earcells expressing the LAMP1-mGFP variant construct orlabeled with BODIPY-FL-conjugated dextran (not shown).
To test whether the observed differences in maximum speed
Fig. 4. Initial image (A) and examples of trajectories (B) observed ina representative time-lapse fluorescence microscopy experimentusing wild-type murine fibroblasts expressing LAMP1-GFP.Arrowheads indicate the approximate initial positions of selectedLAMP1-GFP-positive compartments that traveled significanteffective distances during the course of the experiment. Bars, 20 �m.
Jour
nal o
f Cel
l Sci
ence

5250
and effective distance were statistically significant, for eachvariable we calculated the median of the values obtained for30 organelles per cell. The resulting median values per cell,which we considered as independent measurements,
corresponded to different cell lines and fluorescent labels (i.e.LAMP1-GFP, LAMP1-mGFP and BODIPY-FL-conjugateddextran) and were characterized by substantial variance (Fig.5D,E and data not shown). Such variability might not only
Journal of Cell Science 118 (22)
A
0.39
0.78
1.17
1.56
1.95
2.34
2.73
3.12
3.51
3.90
4.29
4.68
5.07
5.46
0.00
GF
P-p
osit
ive
Org
anel
les
(%)
Maximum Speed (μμμμm/second)
0
10
20
40
60
30
50
70
GF
P-p
osit
ive
Org
anel
les
(%)
0
20
60
40
80
100
0 4 8 12 16 20 24 28 32 36 40 44 48 52 56Effective Distance (μμμμm)
B
GF
P-p
osit
ive
Org
anel
les
(%)
0.8
0.9
1.0
1.1
1.2
1.3
1.4
1.5
1.6
1.7
1.8
1.9
2.0
2.1
Average Speed on Microtubules (μμμμm/second)
C
0
10
20
30
wild typepale earwild type (+ nocodazole)
wild typepale earwild type (+ nocodazole)
wild typepale ear
Max
imum
Spe
ed (
μμμμ m/s
econ
d)
0.0
0.5
1.0
1.5
2.0
2.5pale ear vs wild type
P < 0.0001
D
pale ear wild type pale ear wild type
LAMP1-GFP LAMP1-mGFP
20
16
12
8
4
0
Eff
ecti
ve D
ista
nce
(μμμμm
)
Epale ear vs wild type
P < 0.0001
2.0
1.5
1.0
0.5
0.0
Ave
rage
Spe
ed (
μμμμ m/s
econ
d)
F
pale ear vs wild typeP > 0.8 (not significant)
pale ear wild type pale ear wild type
LAMP1-GFP LAMP1-mGFP
pale ear wild type pale ear wild type
LAMP1-GFP LAMP1-mGFP
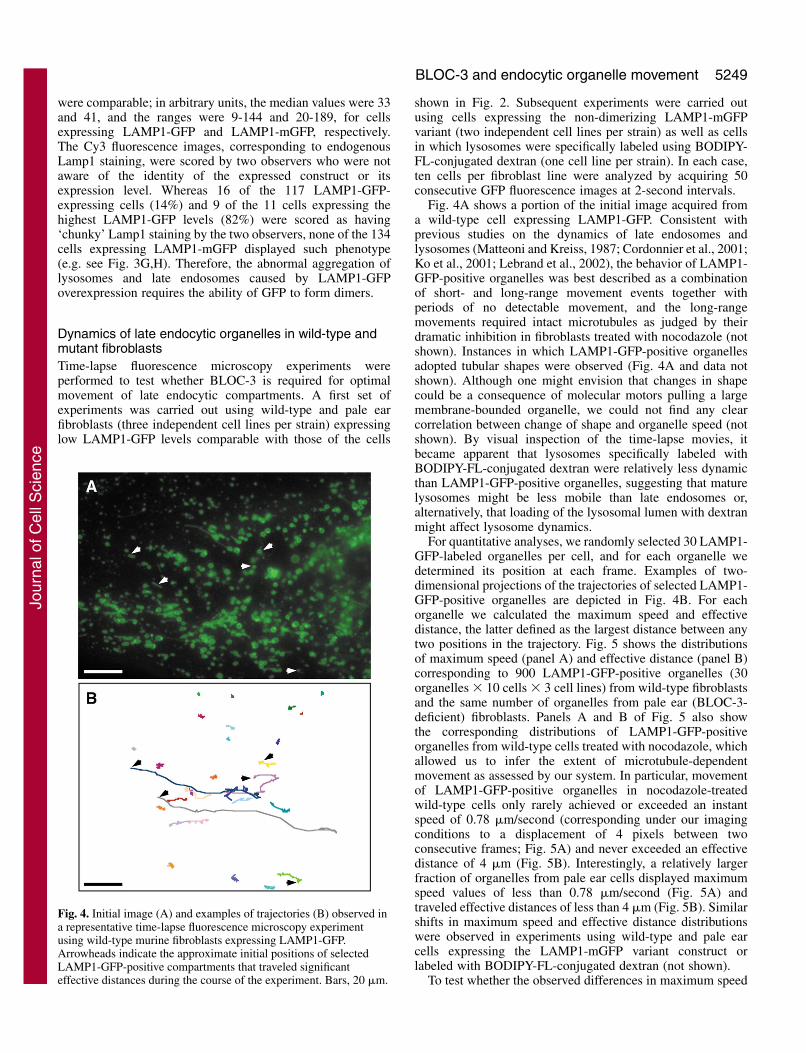
Fig. 5. Quantitative analyses of maximum speed (A,D), effective distance traveled during a 98-second period (B,E), and average speed ofmovements inferred to occur on microtubules based on instant speeds of at least 0.78 �m/second (C,F), obtained by time-lapse fluorescencemicroscopy analyses of LAMP1-GFP-positive organelles in fibroblasts derived from wild-type (open bars in A-C, open circles in D-F) and paleear (black bars in A-C, filled circles in D-F) murine strains. Three independent fibroblast lines were analyzed per strain. For each fibroblast line,10 cells expressing low LAMP1-GFP levels were examined by time-lapse fluorescence microscopy, and the movement of 30 randomly selected,LAMP1-GFP-positive organelles per cell was tracked and analyzed quantitatively. (A-C) Aggregate distributions of values obtained for 900LAMP1-GFP-positive organelles (30 organelles � 10 cells � 3 fibroblast lines) per strain. Numbers on the x-axis denote bin limits; the last binon the right includes all values greater than the upper limit of the previous bin, and the first bin on the left of C includes all values smaller than0.8 �m/second. For comparison, the distributions are also included of maximum speed (A) and effective distance (B) of 120 LAMP1-GFPpositive organelles (30 organelles � 4 cells) from wild-type fibroblasts that had been treated with nocodazole to disrupt microtubules (graybars). (D-F) Median values per cell were plotted as individual data points, where the position on the y-axis represents the median value per celland the position on the x-axis is arbitrarily chosen to group the data of the 10 cells analyzed for each fibroblast line. Median values obtained forcells expressing the LAMP1-mGFP variant construct and corresponding to two independent fibroblast lines derived from wild-type (opendiamonds) and pale ear (filled diamonds) strains are also represented. Horizontal lines represent median values per data group. Statisticalanalysis of the data represented in D-F was performed using an ANOVA model upon logarithmic transformation, as described under Materialsand Methods. The indicated P values correspond to the significance of ‘genotype’ (i.e. pale ear versus wild-type) as an explanatory variable.Exclusion of the data group highlighted by arrows in D and E from the ANOVA analysis did not modify the conclusion that the differencesbetween wild-type and pale ear cells were statistically significant.
Jour
nal o
f Cel
l Sci
ence

5251BLOC-3 and endocytic organelle movement
reflect cell-to-cell differences but also sampling error due tothe analysis of only 30 organelles per cell; nevertheless, wechose to analyze a large number of cells rather than moreorganelles from fewer cells. We noticed that the median valuesper cell of maximum speed and effective distance followednormal (Gaussian) distributions upon logarithmictransformation (data not shown), thus allowing statisticalanalysis using an ANOVA model. A good fit of the data wasobtained using genotype (i.e. wild-type and pale ear) andfluorescent label (i.e. LAMP1-GFP, LAMP1-mGFP andBODIPY-FL-conjugated dextran) as the explanatory variables;the fit improved only modestly upon consideration of ‘cell line’as an explanatory variable, implying that the first two variableswere sufficient to explain most of the variation in the data. Forboth maximum speed and effective distance, the effect ofBLOC-3 deficiency (i.e. genotype) was statistically significant(P<0.0001), and so was the use of BODIPY-FL-conjugateddextran as a label (P<0.0001) instead of either LAMP1-GFPor LAMP1-mGFP (differences between the two fluorescentLAMP1 constructs were statistically not significant). Wenoticed that the values obtained for one pale ear cell lineexpressing LAMP1-GFP (Fig. 5D,E, arrow) were lower thanthose obtained for the other two pale ear cell lines expressingthe same construct; nevertheless, exclusion of the data obtainedusing this cell line from the ANOVA analysis did not modifythe main conclusion that the effect of BLOC-3 deficiency wasstatistically significant (P<0.001 for both maximum speed andeffective distance). Consequently, we concluded that themaximum speed and effective distance of late endocyticcompartments were reduced, albeit not dramatically, in BLOC-3-deficient cells.
We next considered the possibility that the observeddifferences in the dynamics of late endosomes and lysosomesbetween normal and BLOC-3-deficient cells could reflectdeficiencies in their movement on microtubules. To addressthis possibility, we took advantage of the observation thatLAMP1-positive organelles almost never moved at 0.78�m/second or faster in nocodazole-treated cells (Fig. 5A). Wechose this speed value as a threshold with which to selectmovement events that most probably occurred onmicrotubules. For each of the LAMP1-GFP-positive andLAMP1-mGFP-positive organelles analyzed as describedabove, we calculated the fraction of time traveled at instantspeeds matching or exceeding the 0.78 �m/second threshold(Fig. 6A), as well as the average speed of this subset ofmovement events (referred to as average speed onmicrotubules; Fig. 5C and data not shown). For statisticalanalyses, median values per cell were calculated as describedabove for the other variables. The median values per cellcalculated for average speed on microtubules (Fig. 5F)followed normal distributions upon logarithmic transformationand, hence, could be analyzed using an ANOVA model. In thiscase, however, the effect of BLOC-3 deficiency wasstatistically not significant (P>0.8). By contrast, a relativelyhigher fraction of late endocytic compartments within pale earcells moved less than 2% of the time at the threshold speed orfaster, regardless of whether the compartments were labeledwith LAMP1-GFP or LAMP1-mGFP variants (Fig. 6A). Thedata obtained for this variable could not be analyzed using anANOVA model because a large fraction of the median valuesper cell were zero, thus making it impossible to achieve a
Gaussian distribution, even upon data transformation. For thisreason, and because the most salient characteristic of theresulting distributions of median values per cell was the zerovalue, we applied Fisher’s exact test to compare the relativeodds of obtaining such value for wild-type and pale ear cells.To maximize statistical power, data obtained using cellsexpressing LAMP1-GFP or LAMP1-mGFP were pooled. Theresulting pale ear/wild-type odds ratio was ~3.6, which wasstatistically significant (P=0.0057). Interestingly, similardifferences were observed when organelle movement at instant
A
Percentage of Time at Speed ≥ 0.78 μm/second
0 4 8 12 16 20 24
GF
P-p
osit
ive
Org
anel
les
(%)
0
10
20
30
40
50
60
70
2 6 10 14 18 22
Movement in all directions
B
0 4 8 12 16 20 24G
FP
-pos
itiv
e O
rgan
elle
s (%
)0
10
20
30
40
50
60
70
2 6 10 14 18 22
Movement towards nucleus
C
0 4 8 12 16 20 24
GF
P-p
osit
ive
Org
anel
les
(%)
0
10
20
30
40
50
60
70
2 6 10 14 18 22
Movement away from nucleus
Percentage of Time at Speed ≥ 0.78 μm/second
Percentage of Time at Speed ≥ 0.78 μm/second
LAMP1-mGFP
0
20
40
60
0 4 8 12 16 20 24
LAMP1-GFP
wild type pale ear
0
20
40
60
0 4 8 12 16 20 24
LAMP1-mGFPLAMP1-GFP
0
20
40
60
0 4 8 12 16 20 24
LAMP1-mGFPLAMP1-GFP
Fig. 6. Distributions of percentages of time in which 900 LAMP1-GFP-positive organelles within wild-type (open bars) or pale ear(closed bars) fibroblasts moved at instant speeds of 0.78 �m/secondor faster, in any direction (A), towards the nucleus (B), or away fromthe nucleus (C). Insets, comparable distributions obtained for 600organelles labeled with the LAMP1-mGFP variant constructexpressed in wild-type (open bars) or pale ear (closed bars)fibroblasts. Numbers on the x-axis denote bin limits; the last bin onthe right of each panel includes all values greater than 24%.
Jour
nal o
f Cel
l Sci
ence

5252
speeds matching or exceeding the 0.78 �m/second thresholdwas analyzed taking into account its directionality, i.e. whethersuch movement was towards (Fig. 6B) or away from (Fig. 6C)the nucleus. Upon calculation of median values per cell, theodds of obtaining zero as a result were significantly higheramong pale ear cells, both for movement towards the nucleus(odds ratio ~4.3, P=0.0016) and away from the nucleus (oddsratio ~3.7, P=0.0038). We also considered whether theobserved differences in percentages of time traveling at thethreshold speed or faster reflected a reduction in the number ofevents in which the organelle accelerated to match or exceedthe threshold speed, and/or the duration of such events. Thedistribution of numbers of events with speed increasing to�0.78 �m/second was shifted towards lower values in pale earcells as compared with wild-type cells (Fig. 7), and the oddsof obtaining zero as the median value per cell was significantlyhigher in pale ear cells (Fisher’s exact test, P=0.005). Bycontrast, the distributions of the duration of such eventsrevealed no statistical differences between wild-type and paleear cells (not shown). Taken together, these results suggest thatlack of BLOC-3 function negatively affects the ability of lateendocytic organelles to attach productively to microtubule-dependent motors but does not influence significantly theduration or speed of these movement events.
DiscussionIn this paper, we describe the use of image analysis to estimatethe degree of perinuclear accumulation of late endosomes andlysosomes in cells deficient in BLOC-1, -2 and -3. We alsoreport time-lapse microscopy experiments in which thedynamics of Lamp1-positive organelles have been examined inwild-type and BLOC-3-deficient cells, and provide statisticalevidence indicating that BLOC-3 function might regulate theability of late endocytic organelles to attach productively to
microtubule-dependent motors. Finally, we show thatoverexpression of LAMP1 fused to GFP at its cytoplasmicdomain can elicit aggregation of late endocytic organelles bya mechanism that depends on the ability of GFP to form anti-parallel dimers.
Previous studies on the perinuclear clustering of organelles,including our own (Nazarian et al., 2003), have relied on thesubjective judgement of an observer determining whether agiven cell displays pronounced perinuclear accumulation ornot, followed by comparison of different cell samples based onthe percentages of cells determined to display such phenotype(e.g. see Matteoni and Kreiss, 1987; Poupon et al., 2003;Matsushita et al., 2004; Gissen et al., 2005; Hölttä-Vuori et al.,2005). Here, we have chosen to estimate the concentrationgradient of the staining of an organelle marker around theperinuclear region as the PCI, thus allowing subsequentcomparison of cell samples on the basis of their averaged PCIvalues. It should be emphasized, however, that the PCI is anapproximation but not a real measure of such concentrationgradient. A second limitation is that subjective judgment is stillinvolved in delimiting the NP region areas necessary forcalculation of the PCI. Nevertheless, the fact that the operator-to-operator variability was significantly lower than the cell-to-cell variability implies that such a subjective component shouldnot have a major impact on the results. In any event, the imageswere analyzed following a ‘blinded’ approach in which theoperator was unaware of the sample identity. Anotherlimitation of the method described herein is that it is time-consuming. For these reasons, a fully automatic, image-processing method remains desirable. Finally, the methodmight not be sensitive enough to detect differences inperinuclear clustering of other organelle markers, or even ofLamp1 staining in cell types different from fibroblasts (e.g.cells that attach poorly to surfaces or with a high nucleus-to-cytoplasm ratio). Hence, its application to other systems mayrequire optimization of experimental and image processingconditions.
Using the PCI approach, we have corroborated our previousobservation that BLOC-3 deficiency results in decreasedperinuclear clustering of Lamp1-positive, late endocyticorganelles, and found no defects in perinuclear clustering ofthese organelles in mutant cells deficient in BLOC-1 or -2. Asin the case of BLOC-3, BLOC-1 and -2 are expressedubiquitously and mutations in the genes encoding at least somesubunits cause HPS in humans and/or mice. However, theirmolecular function remains obscure (reviewed by Li et al.,2004; Di Pietro and Dell’Angelica, 2005). Fibroblasts derivedfrom HPS patients bearing mutations in the gene encoding theHPS5 subunit of BLOC-2 have been shown to displayexacerbated perinuclear clustering of late endocytic organellescontaining LAMP3/CD63, with little or no staining observedin the vicinity of the plasma membrane (Huizing et al., 2004).By contrast, the same group reported that fibroblasts frompatients carrying mutations in the gene encoding the HPS3subunit of the same complex display normal distribution ofLAMP3/CD63 staining (Gunay-Aygun et al., 2004). Althoughthe PCI determined for three independent cell lines derivedfrom cocoa mice (carrying mutations in the HPS3-encodinggene) seemed to be somewhat higher than the average PCI ofwild-type cells (Fig. 1E), the differences were statistically notsignificant. In addition, we did not see any depletion of Lamp1
Journal of Cell Science 118 (22)
0 2 4 7 9 11 13
GF
P-p
osit
ive
Org
anel
les
(%)
0
10
20
30
40
50
60
1 3 6 8 10 12Number of Events with Speed Increasing to ≥ 0.78 μm/second
LAMP1-mGFP
0
20
40
60
0 4 6 8 10 12 14
LAMP1-GFP
wild type pale ear
415
2
Fig. 7. Distributions of the number of events during a 98-secondperiod in which the instant speed of each of 900 LAMP1-GFP-positive organelles within wild-type (open bars) or pale ear (closedbars) fibroblasts increased from less than 0.78 �m/second to reach orexceed this threshold speed. Insets, comparable distributionsobtained for 600 organelles labeled with the LAMP1-mGFP variantconstruct within wild-type or pale ear cells. Numbers on the x-axisdenote bin limits; the last bin on the right includes all values greaterthan 14.
Jour
nal o
f Cel
l Sci
ence

5253BLOC-3 and endocytic organelle movement
staining from the cell periphery of our cell samples. Thereasons for the above discrepancies remain unclear.
To test whether BLOC-3 regulates the movement of lateendosomes and lysosomes, we have performed time-lapseexperiments using live cells expressing LAMP1 fused to eitherGFP or its non-dimerizing L221K variant, referred herein to asmGFP. At low expression levels, both fusion proteins weretargeted correctly to late endocytic organelles, and nosignificant differences were observed in the dynamics oforganelles labeled with LAMP1-GFP versus LAMP1-mGFP.Given the heterogeneity of organelles labeled with LAMP1-GFP or its variant, as well as the intrinsic variability betweencells and between cell lines, large sets of time-lapsemicroscopic data were necessary to test for statisticallymeaningful differences between control and BLOC-3-deficientcells. For these analyses, we decided to consider each cell,rather than each tracked organelle, as an independentobservation. We detected statistically significant differencesbetween control and BLOC-3-deficient fibroblasts in themaximum speed and effective distance traveled by lateendocytic organelles, even when the numeric differences werenot too dramatic. Because these differences were suggestive ofpartial defects in organelle movement on microtubules, wedefined the speed of 0.78 �m/second as a threshold with whichto select those movement events that most probably occurredon microtubules. We realize that by using such a thresholdvalue we may have filtered out movement events that weremicrotubule dependent but slow; such a limitation must beborne in mind during interpretation of the data. We attemptedthe alternative approach of performing time-lapse experimentsusing cells treated with actin-depolymerizing drugs (e.g.Latrunculin A) and assuming that all movement observedunder these conditions would be microtubule dependent.However, the relatively large cells used in this study underwentsignificant changes of shape and partial detachment upon drugtreatment, thus precluding acquisition of high-quality images(data not shown). Notwithstanding the potential limitations ofusing a threshold speed to study microtubule-dependent events,we were able to detect a relative decrease in the frequency ofevents in which labeled organelles within BLOC-3-deficientcells traveled at instant speeds equal or higher than thethreshold. Interestingly, lack of BLOC-3 function affectedmovement on microtubules (i.e. at the threshold speed orhigher) both towards and away from the perinuclear region,suggesting that productive attachment of late endocyticorganelles to both dynein/dynactin and kinesins might becompromised. We considered the possibility that the observeddifferences could simply reflect the existence in BLOC-3-deficient cells of an extra pool of essentially immobileorganelles, together with organelles with dynamics identical tothose of control cells. However, upon exclusion of organellesthat never moved at the threshold speed or faster from the dataanalysis, the resulting distributions still demonstrated a shifttowards reduced frequencies of microtubule-dependentmovement events for late endocytic organelles within BLOC-3-deficient cells (data not shown).
By which mechanism does BLOC-3 regulate late endocyticorganelle movement? At least three scenarios can beconsidered. First, BLOC-3 could be directly involved in theattachment of these organelles to microtubule-dependentmotors, although our results suggest that, if so, it should
mediate attachment to both dynein and kinesin motors. Theability of a protein to regulate bidirectional, microtubule-dependent movement directly has previously been documentedfor dynactin and MEK/ERK bound to melanosomes (Deaconet al., 2003; Deacon et al., 2005), although not yet for proteinsassociated with late endosomes and lysosomes. Given thatsubstantial movement of late endosomes and lysosomes wasstill observed in pale ear fibroblasts, one must conclude thatBLOC-3 function is not essential for organelle attachment tomicrotubules. Hence, consideration of this first scenario wouldimply assuming that other cellular proteins can compensate inpart for the lack of BLOC-3. Second, BLOC-3 function couldbe important for detaching late endocytic organelles from actinfilaments. In such a scenario, lack of BLOC-3 function wouldincrease the fraction of time spent by late endosomes andlysosomes on actin filaments, thus decreasing the fraction oftime in which the organelles would be available for attachmentto microtubules. This second scenario would provide asatisfactory explanation for the observations that BLOC-3deficiency affected microtubule-dependent movement in bothdirections, and that the observed defects were partial. Third,BLOC-3 could play a rather indirect role, for instance bymediating the intracellular trafficking to late endosomes andlysosomes of a protein that, in turn, would be required fororganelle attachment to microtubules and/or detachment fromactin filaments. This third scenario, and not the first two, wouldbe compatible with the intracellular localization reported forthe HPS1 subunit of BLOC-3, which by immunogold labelingwas found to be associated with tubulovesicular membraneprofiles in the vicinity of the Golgi complex of lymphoblastoidcells (Oh et al., 2000). It is worth mentioning that a similarmechanism has been invoked to explain the defectivemovement of lytic granules, the lysosome-related organelles ofcytotoxic T cells, in patients suffering from HPS-2 resultingfrom mutations in the gene encoding the �3A subunit of AP-3, a protein complex directly involved in protein trafficking(Clark et al., 2003).
How can the phenotype of BLOC-3-deficient fibroblasts bereconciled with the clinical manifestations of HPS-1 and -4?As mentioned in the introductory section, the mainmanifestations of these two forms of HPS are due to defectsin cell-type-specific, lysosome-related organelles, namelymelanosomes, platelet dense granules and lamellar bodies.Mild ceroid lipofuscinosis has also been described, at least forHPS-1, which could reflect modest defects in lysosomalfunction due to the observed abnormalities in organellemovement and localization. Conceivably, BLOC-3 could berequired for normal movement and distribution of lysosome-related organelles and/or their precursors, and becausemelanosomes and platelet dense granules (and lamellarbodies?) co-exist with conventional lysosomes, one might evenspeculate that BLOC-3 could promote spatial segregation ofmaturing lysosomes and lysosome-related organelles to reducethe chances of heterotypic organelle fusion. Nevertheless, it isclear that future work will be necessary to establish themolecular function of BLOC-3 and its role in the pathogenesisof HPS.
During the course of this study, we noticed that high levelsof LAMP1-GFP overexpression induced aberrant aggregationof late endocytic organelles, both in wild-type and BLOC-3-deficient cells. We observed that LAMP1-GFP overexpression
Jour
nal o
f Cel
l Sci
ence

5254
was capable of inducing aggregation of pre-existinglysosomes, as inferred from experiments involving loading oflysosomes with fluorescent dextran prior to transfection withthe LAMP1-GFP-encoding plasmid (e.g. Fig. 3E,F). We alsoobserved the aggregation phenomenon using different celltypes and by overexpressing a construct consisting of humanLAMP3/CD63 fused at its cytoplasmic domain to GFP (notshown). Because GFP is capable of low-affinity self-association, we considered the possibility that the observedaggregation of late endocytic organelles could be causedby low-affinity, anti-parallel dimerization of LAMP1-GFPmolecules associated with the limiting membranes of opposingorganelles. An analogous mechanism has recently been shownto mediate the formation of stacked ER membranes induced byoverexpression of an ER-resident membrane protein taggedwith GFP at its cytoplasmic domain (Snapp et al., 2003). Inagreement with this idea, a point mutation introduced into theGFP domain of LAMP1-GFP to disrupt its ability to dimerizeresulted in a variant fusion protein, LAMP1-mGFP, whichfailed to induce aggregation of late endocytic organelles at thehighest expression levels achieved. Consequently, these resultsraise a note of caution on the interpretation of experiments inwhich aggregation of late endosomes and lysosomes is inducedby overexpression of GFP-fusion proteins, and suggest thatnon-dimerizing mutant forms of GFP would be moreappropriate tools for this type of experiments.
We thank M. J. Schibler at the Carol Moss Spivak Cell ImagingFacility for expert advice on time-lapse fluorescence microscopy, andS. M. Di Pietro for critical reading of the manuscript. This work wassupported in part by National Institutes of Health grant EY015143.
ReferencesBakker, A. C., Webster, P., Jacob, W. A. and Andrews, N. W. (1997).
Homotypic fusion between aggregated lysosomes triggered by elevated[Ca2+]i in fibroblasts. J. Cell Sci. 110, 2227-2238.
Bucci, C., Thomsen, P., Nicoziani, P., McCarthy, J. and van Deurs, B.(2000). Rab7: a key to lysosome biogenesis. Mol. Biol. Cell 11, 467-480.
Burkhardt, J. K., Echeverri, C. J., Nilsson, T. and Vallee, R. B. (1997).Overexpression of the dynamitin (p50) subunit of the dynactin complexdisrupts dynein-dependent maintenance of membrane organelle distribution.J. Cell Biol. 139, 469-484.
Cantalupo, G., Alifano, P., Roberti, V., Bruni, C. B. and Bucci, C. (2001).Rab-interacting lysosomal protein (RILP): the Rab7 effector required fortransport to lysosomes. EMBO J. 20, 683-693.
Chiang, P.-W., Oiso, N., Gautam, R., Suzuki, T., Swank, R. T. and Spritz,R. A. (2003). The Hermansky-Pudlak syndrome 1 (HPS1) and HPS4proteins are components of two complexes, BLOC-3 and BLOC-4, involvedin the biogenesis of lysosome-related organelles. J. Biol. Chem. 278, 20332-20337.
Clark, R. H., Stinchcombe, J. C., Day, A., Blott, E., Booth, S., Bossi, G.,Hamblin, T., Davies, E. G. and Griffiths, G. M. (2003). Adaptor protein3-dependent microtubule-mediated movement of lytic granules to theimmunological synapse. Nat. Immunol. 4, 1111-1120.
Cordonnier, M.-N., Dauzonne, D., Louvard, D. and Coudrier, E. (2001).Actin filaments and myosin I alpha cooperate with microtubules for themovement of lysosomes. Mol. Biol. Cell 12, 4013-4029.
Deacon, S. W., Serpinskaya, A. S., Vaughan, P. S., Fanarraga, M. L.,Vernos, I., Vaughan, K. T. and Gelfand, V. I. (2003). Dynactin is requiredfor bidirectional organelle transport. J. Cell Biol. 160, 297-301.
Deacon, S. W., Nascimento, A., Serpinskaya, A. S. and Gelfand, V. I.(2005). Regulation of bidirectional melanosome transport by organellebound MAP kinase. Curr. Biol. 15, 459-463.
Dell’Angelica, E. C., Ohno, H., Ooi, C. E., Rabinovich, E., Roche, K. W.and Bonifacino, J. S. (1997). AP-3: an adaptor-like protein complex withubiquitous expression. EMBO J. 16, 917-928.
Di Pietro, S. M., Falcón-Pérez, J. M. and Dell’Angelica, E. C. (2004).Characterization of BLOC-2, a complex containing the Hermansky-Pudlaksyndrome proteins HPS3, HPS5 and HPS6. Traffic 5, 276-283.
Di Pietro, S. M. and Dell’Angelica, E. C. (2005). The cell biology ofHermansky-Pudlak syndrome: recent advances. Traffic 6, 525-533.
Gissen, P., Johnson, C. A., Gentle, D., Hurst, L., Doherty, A., O’Kane, C.J., Kelly, D. A. and Maher, E. R. (2005). Comparative evolutionaryanalysis of VPS33 homologues: genetic and functional insights. Hum. Mol.Genet. 14, 1261-1270.
Gunay-Aygun, M., Huizing, M. and Gahl, W. A. (2004). Molecular defectsthat affect platelet dense granules. Semin. Thromb. Hemost. 30, 537-547.
Harada, A., Takei, Y., Kanai, Y., Tanaka, Y., Nonaka, S. and Hirokawa,N. (1998). Golgi vesiculation and lysosome dispersion in cells lackingcytoplasmic dynein. J. Cell Biol. 141, 51-59.
Hölttä-Vuori, M., Alpy, F., Tanhuanpää, K., Jokitalo, E., Mutka, A.-L. andIkonen, E. (2005). MLN64 is involved in actin-mediated dynamics of lateendocytic organelles. Mol. Biol. Cell 16, 3873-3886.
Huizing, M., Hess, R., Dorward, H., Claassen, D. A., Helip-Wooley, A.,Kleta, R., Kaiser-Kupfer, M. I., White, J. G. and Gahl, W. A. (2004).Cellular, molecular and clinical characterization of patients withHermansky-Pudlak syndrome type 5. Traffic 5, 711-722.
Jordens, I., Fernandez-Borja, M., Marsman, M., Dusseljee, S., Lansseen,L., Calafat, J., Janssen, H., Wubbolts, R. and Neefjes, J. (2001). TheRab7 effector protein RILP controls lysosomal transport by inducing therecruitment of dynein-dynactin motors. Curr. Biol. 11, 1680-1685.
Ko, D. C., Gordon, M. D., Jin, J. Y. and Scott, M. P. (2001). Dynamicmovements of organelles containing Niemann-Pick C1 protein: NPC1involvement in late endocytic events. Mol. Biol. Cell 12, 601-614.
Lebrand, C., Corti, M., Goodson, H., Cosson, P., Cavalli, V., Mayran, N.,Fauré, J. and Gruenberg, J. (2002). Late endosome motility depends onlipids via the small GTPase Rab7. EMBO J. 21, 1289-1300.
Li, W., Rusiniak, M. E., Chintala, S., Gautam, R., Novak, E. K. andSwank, R. T. (2004). Murine Hermansky-Pudlak syndrome genes:regulators of lysosome-related organelles. BioEssays 26, 616-628.
Martina, J. A., Moriyama, K. and Bonifacino, J. S. (2003). BLOC-3, aprotein complex containing the Hermansky-Pudlak syndrome gene productsHPS1 and HPS4. J. Biol. Chem. 278, 29376-29384.
Matsushita, M., Tanaka, S., Nakamura, N., Inoue, H. and Kanazawa, H.(2004). A novel kinesin-like protein, KIFB�3 is involved in the movementof lysosomes to the cell periphery in non-neuronal cells. Traffic 5, 140-151.
Matteoni, R. and Kreiss, T. E. (1987). Translocation and clustering ofendosomes and lysosomes depends on microtubules. J. Cell Biol. 105, 1253-1265.
Mu, F.-T., Callaghan, J. M., Steele-Mortimer, O., Stenmark, H., Parton,R. G., Campbell, P. L., McCluskey, J., Yeo, J.-P., Tock, E. P. C. and Toh,B.-H. (1995). EEA1, an early endosome-associated protein. EEA1 is aconserved �-helical peripheral membrane protein flanked by cysteine‘fingers’ and contains a calmodulin-binding IQ motif. J. Biol. Chem. 270,13503-13511.
Nazarian, R., Falcón-Pérez, J. M. and Dell’Angelica, E. C. (2003).Biogenesis of lysosome-related organelles complex 3 (BLOC-3): a complexcontaining the Hermansky-Pudlak syndrome (HPS) proteins HPS1 andHPS4. Proc. Natl. Acad. Sci. USA 100, 8770-8775.
Oh, J., Liu, Z.-X., Feng, G. H., Raposo, G. and Spritz, R. A. (2000). TheHermansky-Pudlak syndrome (HPS) protein is part of a high molecularweight complex involved in biogenesis of early melanosomes. Hum. Mol.Genet. 9, 375-385.
Patki, V., Virbasius, J., Lane, W. S., Toh, B.-H., Shpetner, H. S. andCorvera, S. (1997). Identification of an early endosomal protein regulatedby phosphatidylinositol 3-kinase. Proc. Natl. Acad. Sci. USA 94, 7326-7330.
Patterson, G. H. and Lippincot-Schwartz, J. (2002). A photoactivatableGFP for selective photolabeling of proteins and cells. Science 297, 1873-1877.
Poupon, V., Stewart, A., Gray, S. R., Piper, R. C. and Luzio, J. P. (2003).The role of mVps18p in clustering, fusion, and intracellular localization oflate endocytic organelles. Mol. Biol. Cell 14, 4015-4027.
Santama, N., Krijnse-Locker, J., Griffiths, G., Noda, Y., Hirokawa, N. andDotti, C. G. (1998). KIF2�, a new kinesin superfamily protein in non-neuronal cells, is associated with lysosomes and may be implicated in theircentrifugal translocation. EMBO J. 17, 5855-5867.
Schroer, T. A. (2000). Motors, clutches and brakes for membrane traffic: acommemorative review in honor of Thomas Kreiss. Traffic 1, 3-10.
Snapp, E. L., Hegde, R. S., Francolini, M., Lombardo, F., Colombo, S.,
Journal of Cell Science 118 (22)
Jour
nal o
f Cel
l Sci
ence

5255BLOC-3 and endocytic organelle movement
Pedrazzini, E., Borgese, N. and Lippincott-Schwartz, J. (2003).Formation of stacked ER cisternae by low affinity protein interactions. J.Cell Biol. 163, 257-269.
Taunton, J., Rowning, B. A., Coughlin, M. L., Wu, M., Moon, R. T.,Mitchison, T. J. and Larabell, C. A. (2000). Actin-dependent propulsionof endosomes and lysosomes by recruitment of N-WASP. J. Cell Biol. 148,519-530.
Valetti, C., Wetzel, D. M., Schrader, M., Hasbani, M. J., Gill, S. R., Kreiss,T. E. and Schroer, T. A. (1999). Role of dynactin in endocytic traffic:effects of dynamitin overexpression and colocalization with CLIP-170. Mol.Biol. Cell 10, 4107-4120.
Zacharias, D. A., Violin, J. D., Newton, A. C. and Tsien, R. Y. (2002).Partitioning of lipid-modified monomeric GFPs into membranemicrodomains of live cells. Science 296, 913-916.
Jour
nal o
f Cel
l Sci
ence