Distributed Energy Resource (DER) Integration … Energy Resource (DER) Integration Challenges 1...
39
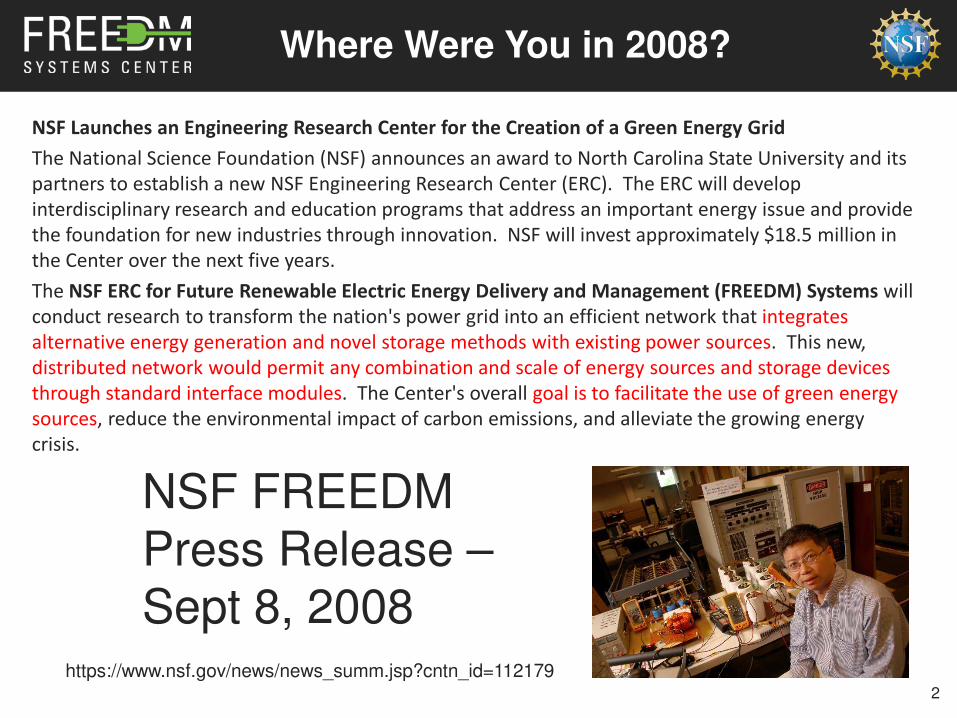
Dr. David Lubkeman Research Professor North Carolina State University Distributed Energy Resource (DER) Integration Challenges 1
Transcript of Distributed Energy Resource (DER) Integration … Energy Resource (DER) Integration Challenges 1...
Dr. David LubkemanResearch ProfessorNorth Carolina State University
Distributed Energy Resource (DER)
Integration Challenges
1
Where Were You in 2008?
NSF Launches an Engineering Research Center for the Creation of a Green Energy Grid
The National Science Foundation (NSF) announces an award to North Carolina State University and its
partners to establish a new NSF Engineering Research Center (ERC). The ERC will develop
interdisciplinary research and education programs that address an important energy issue and provide
the foundation for new industries through innovation. NSF will invest approximately $18.5 million in
the Center over the next five years.
The NSF ERC for Future Renewable Electric Energy Delivery and Management (FREEDM) Systems will
conduct research to transform the nation's power grid into an efficient network that integrates
alternative energy generation and novel storage methods with existing power sources. This new,
distributed network would permit any combination and scale of energy sources and storage devices
through standard interface modules. The Center's overall goal is to facilitate the use of green energy
sources, reduce the environmental impact of carbon emissions, and alleviate the growing energy
crisis.
2
https://www.nsf.gov/news/news_summ.jsp?cntn_id=112179
NSF FREEDM
Press Release –
Sept 8, 2008
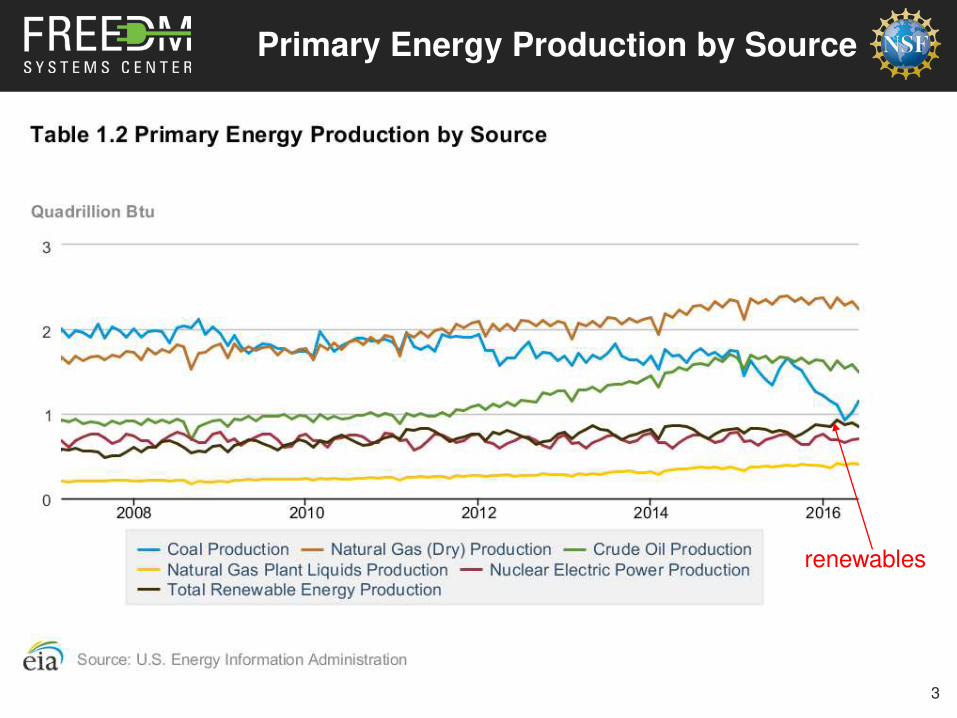
Primary Energy Production by Source
3
renewables

Number of PV Systems
• x
4
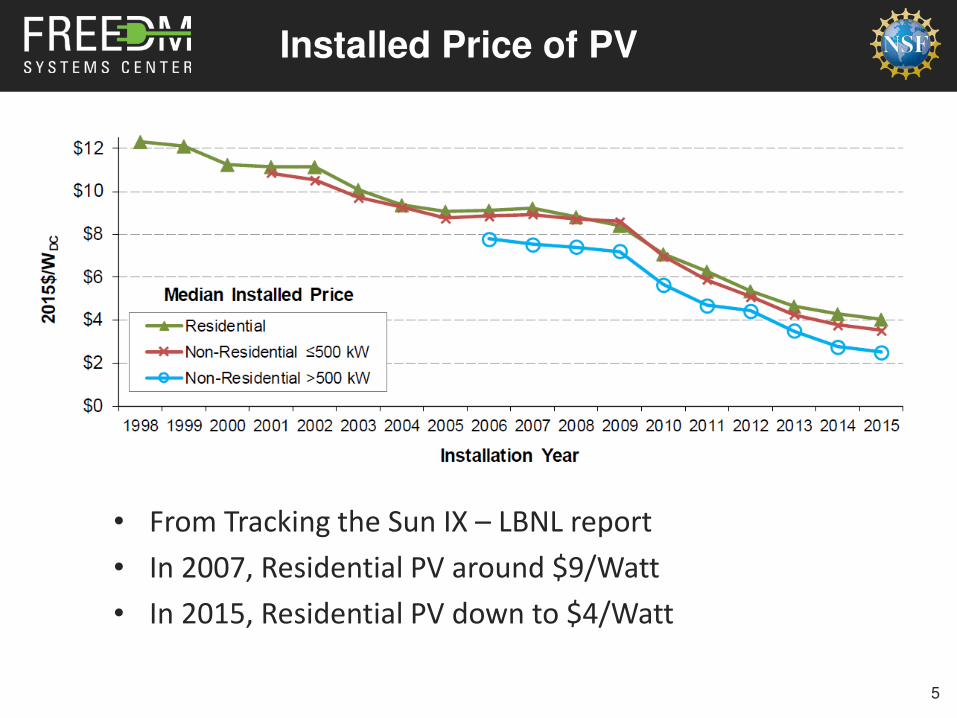
Installed Price of PV
• From Tracking the Sun IX – LBNL report
• In 2007, Residential PV around $9/Watt
• In 2015, Residential PV down to $4/Watt
5

Presentation Objective
Lay groundwork for following FREEDM webinars on
FREEDM technology by discussing:
• Overview of traditional distribution circuit
operation
• Circuit voltage regulation
• Distributed Generation integration issues, with
focus on photovoltaic energy
• Sample Circuit analysis results
• Traditional vs. FREEDM approach
6

Electric Power System
7
Source: Wikipedia – Electric power distribution
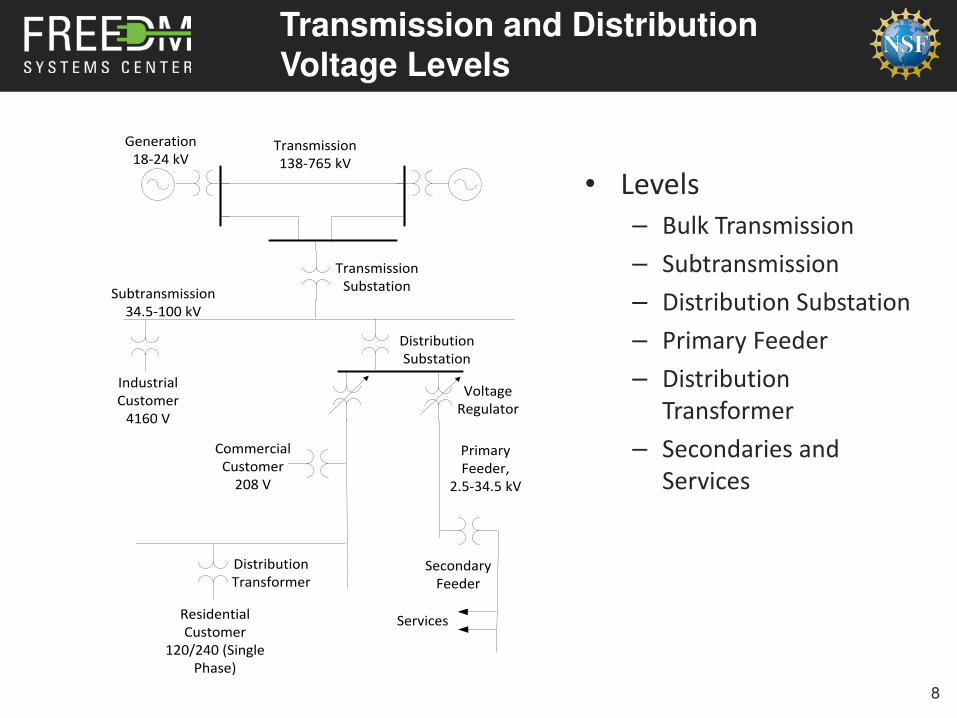
Transmission and Distribution Voltage Levels
• Levels
– Bulk Transmission
– Subtransmission
– Distribution Substation
– Primary Feeder
– Distribution
Transformer
– Secondaries and
Services
8
Transmission
138-765 kV
Transmission
Substation
Industrial
Customer
4160 V
Generation
18-24 kV
Subtransmission
34.5-100 kV
Voltage
Regulator
Commercial
Customer
208 V
Residential
Customer
120/240 (Single
Phase)
Distribution
Substation
Primary
Feeder,
2.5-34.5 kV
Distribution
TransformerSecondary
Feeder
Services

Distribution Substation
• Connects to a
transmission grid
• Transmission to
Distribution Primary
Voltage Conversion
• Voltage Control
• Feeder Protection
• Switching
9

Distribution Feeder Layout
• Substations connect to
transmission or
subtransmission.
• Each Feeder serves an area.
• Main Feeder typically follows
main roads.
• Laterals connect to individual
businesses or households.
• Laterals can be on streets but
can cut through other access
paths (alleys).
10
Substation
Three-Phase Main Feeder
Tapped Laterals
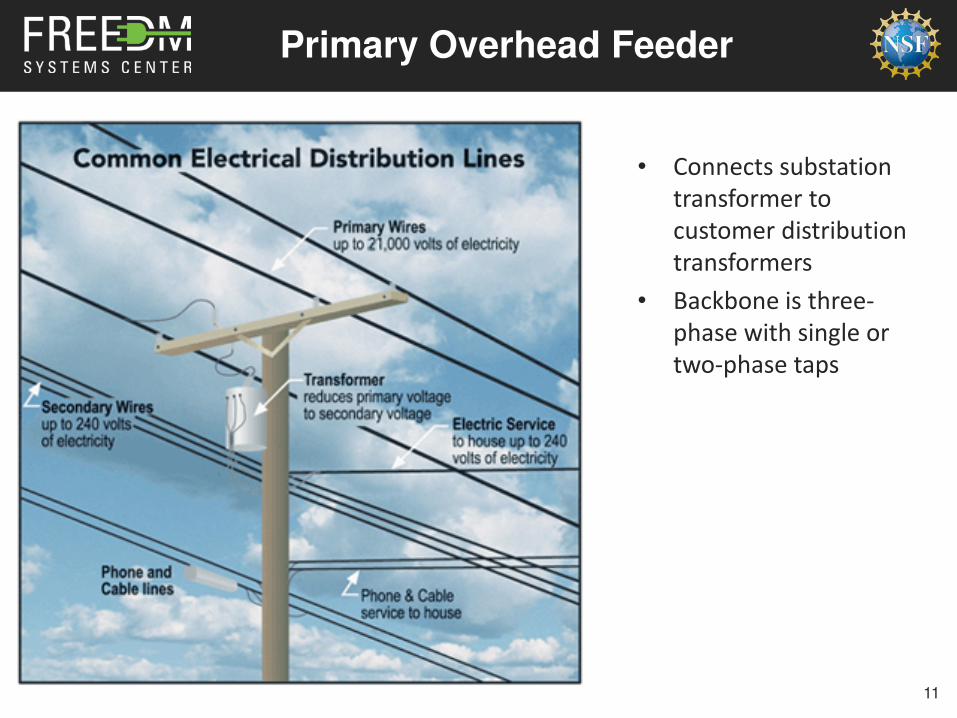
Primary Overhead Feeder
• Connects substation
transformer to
customer distribution
transformers
• Backbone is three-
phase with single or
two-phase taps
11

Overhead Distribution Transformer & Service
• Converts primary voltage to secondary level
• Secondary service connects to customer meter
• Note: customer voltage related to primary voltage by turns ratio of the transformer
12
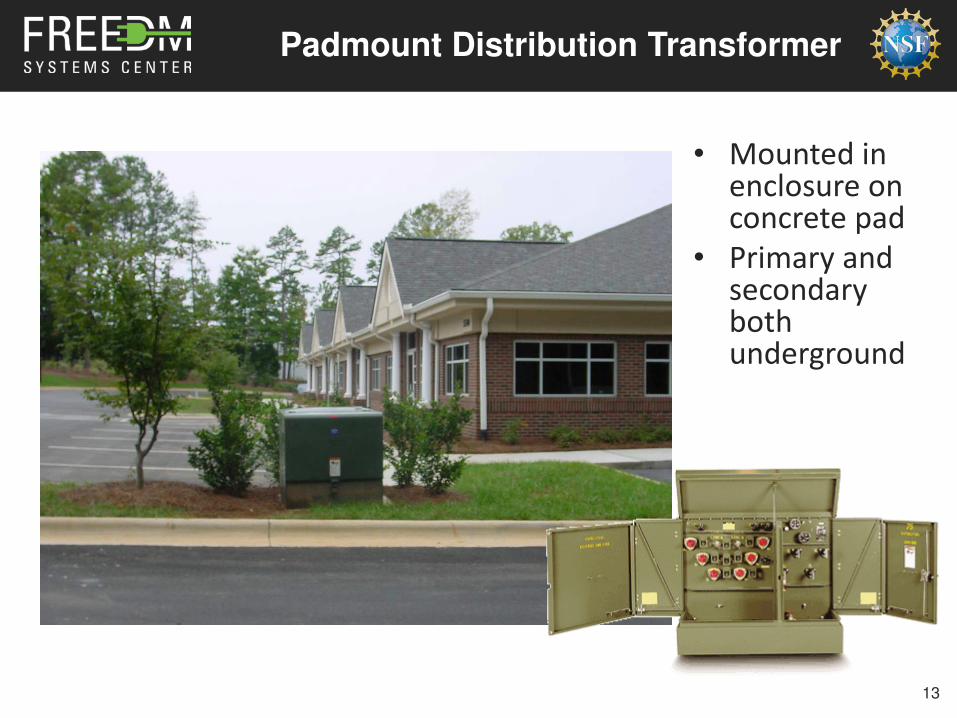
Padmount Distribution Transformer
• Mounted in enclosure on concrete pad
• Primary and secondary both underground
13
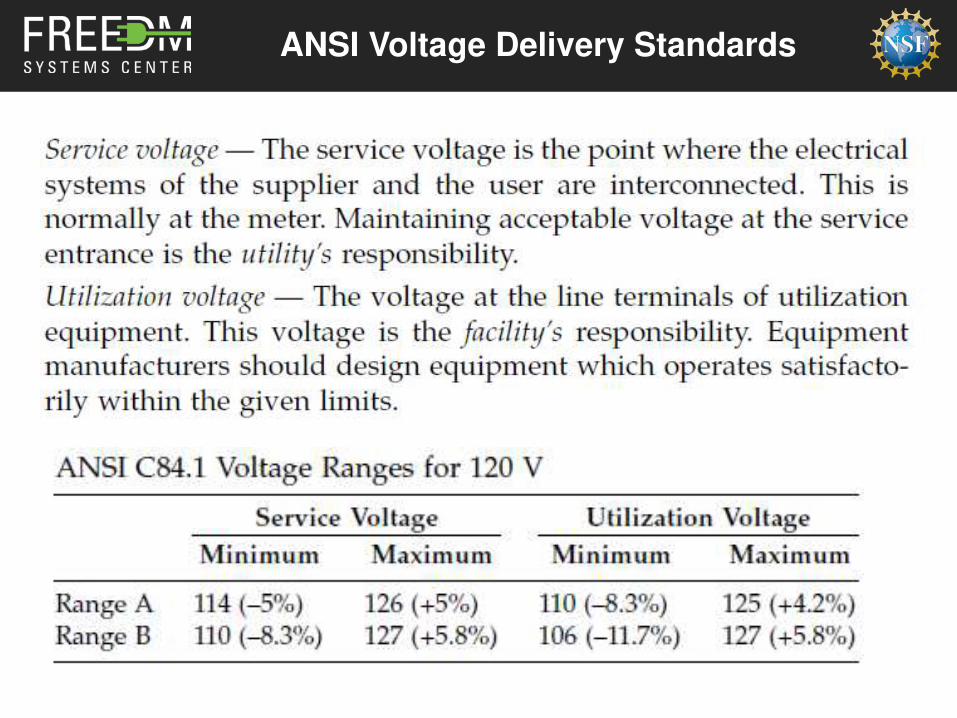
ANSI Voltage Delivery Standards
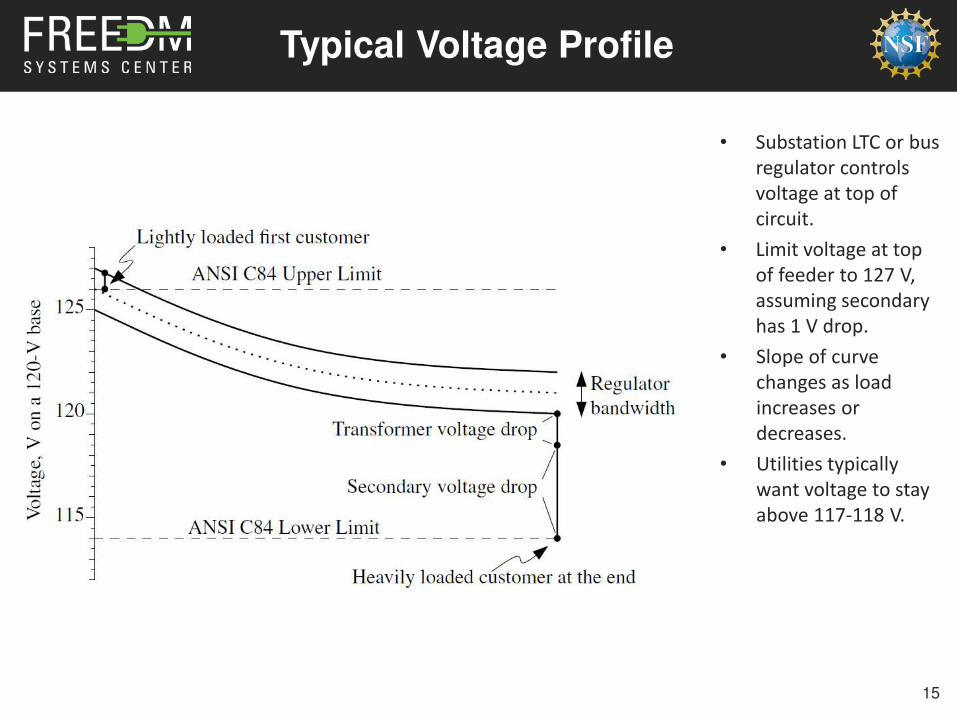
Typical Voltage Profile
• Substation LTC or bus
regulator controls
voltage at top of
circuit.
• Limit voltage at top
of feeder to 127 V,
assuming secondary
has 1 V drop.
• Slope of curve
changes as load
increases or
decreases.
• Utilities typically
want voltage to stay
above 117-118 V.
15
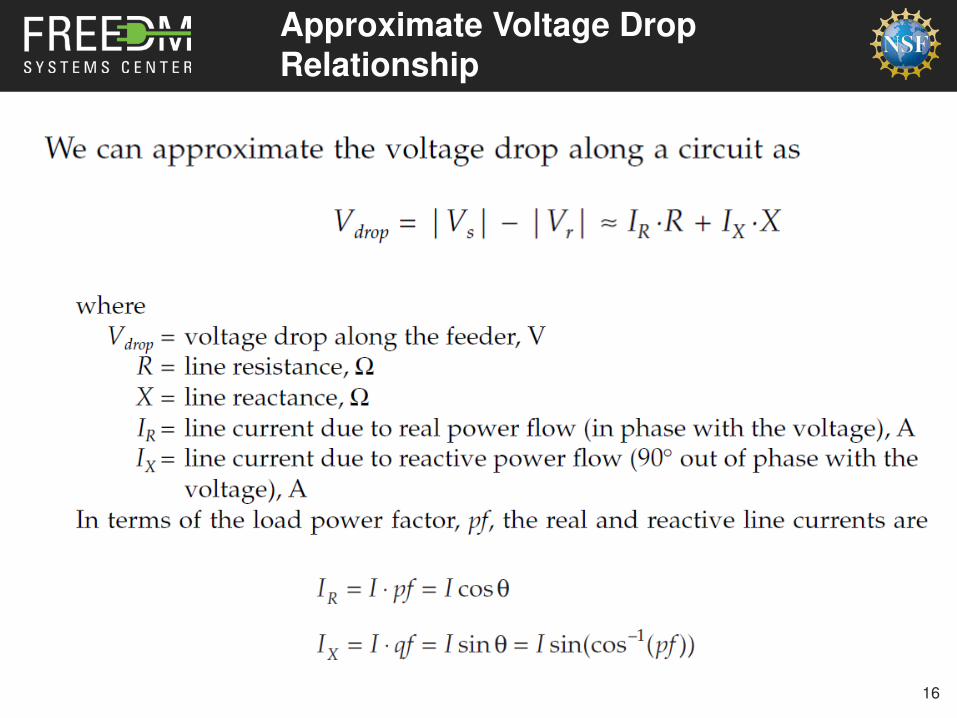
Approximate Voltage Drop Relationship
16
Notes about this Voltage Drop Relationship
• Resistive Load – for high power factor, voltage drop highly correlated to the resistance of the conductors.
• Reactive Load – for lower power factor, voltage drop highly correlated to reactance of conductors.
• Reactive power injection (negative VARs) due to capacitors will boost voltage.
• Real power injection (negative load) due to distributed generation will boost voltage.
17

Primary Distribution Voltage Controls
18
Options for Regulating Voltage on a
Feeder:
Substation load tap-changing
transformers
Substation feeder or bus voltage
regulators
Line voltage regulators
Fixed and switched capacitors
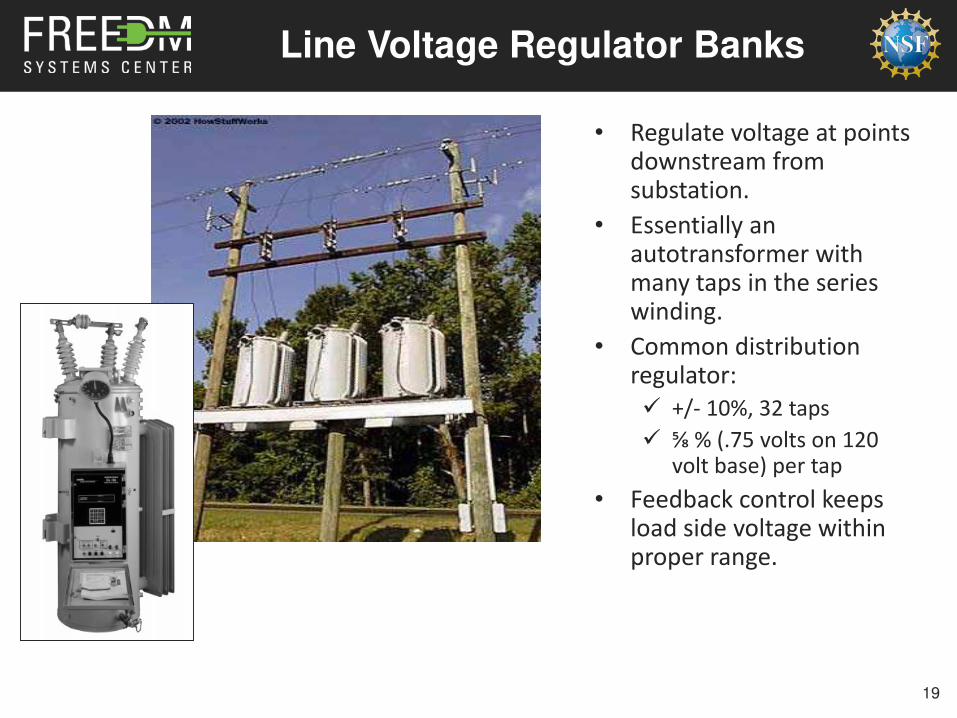
Line Voltage Regulator Banks
• Regulate voltage at points downstream from substation.
• Essentially an autotransformer with many taps in the series winding.
• Common distribution regulator:
+/- 10%, 32 taps
⅝ % (.75 volts on 120 volt base) per tap
• Feedback control keeps load side voltage within proper range.
19

Voltage Regulator Impact
20

Line Capacitors
• Fixed or Switched
Capacitor Banks
• Benefits: Power Factor Improvement
Voltage Improvement
Loss Reduction
21
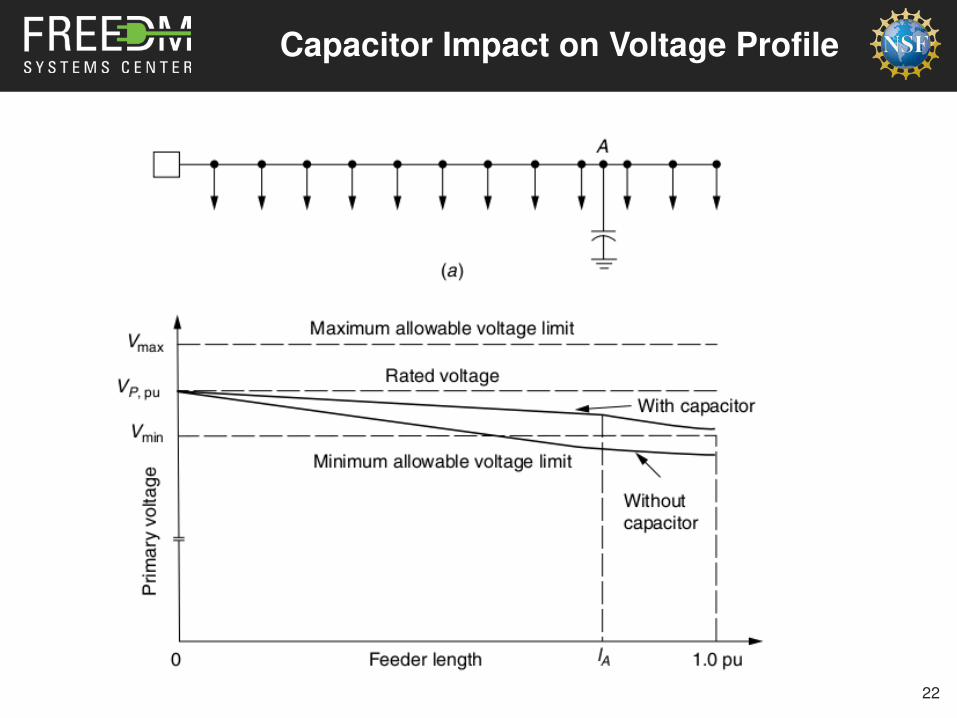
Capacitor Impact on Voltage Profile
22
Distributed Energy Resource (DER)
• A device that produces electricity, and is connected to the electrical system, either "behind the meter" in the customer's premise, or on the utility's primary distribution system.
• A Distributed Energy Resource (DER) can utilize a variety of energy inputs including:
– Natural Gas
– Biofuel
– Solar
– Wind
– Batteries
• In this presentation, will focus on impact of Photovoltaic (solar) Systems.
23
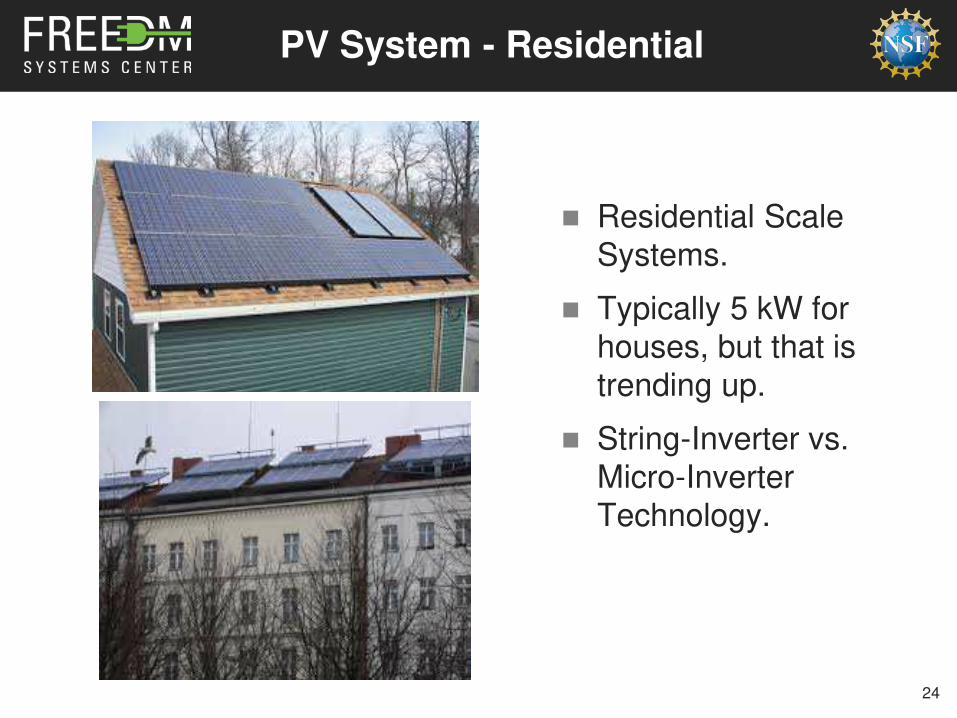
PV System - Residential
24
Residential Scale
Systems.
Typically 5 kW for
houses, but that is
trending up.
String-Inverter vs.
Micro-Inverter
Technology.
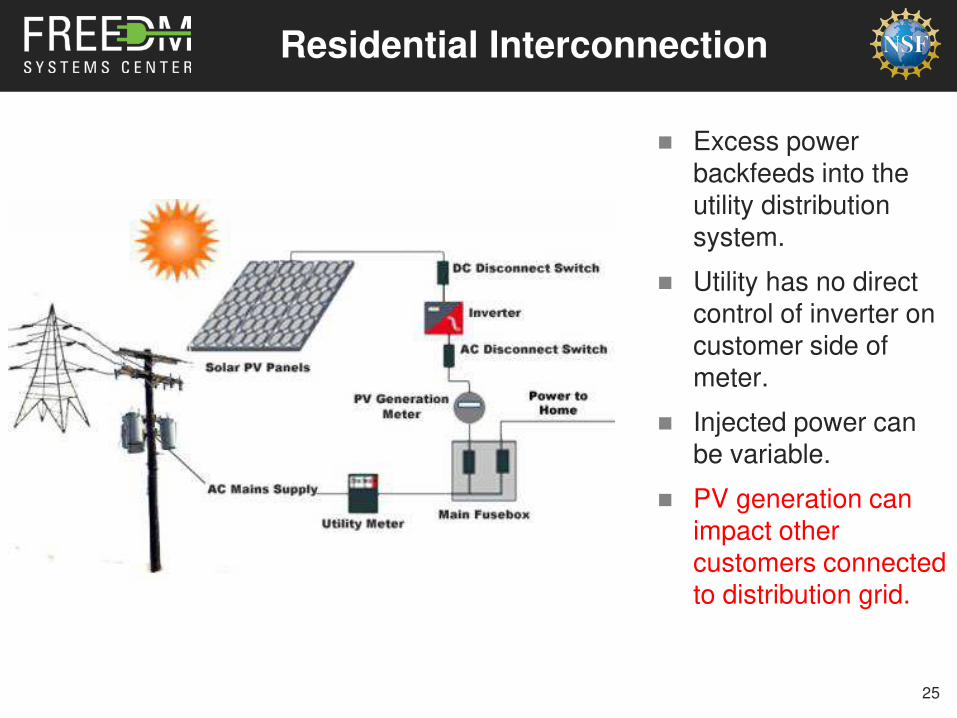
Residential Interconnection
25
Excess power backfeeds into the utility distribution system.
Utility has no direct control of inverter on customer side of meter.
Injected power can be variable.
PV generation can impact other customers connected to distribution grid.
Basic Issue: Changes in Radial Feeder Power Flows
• DER invalidates historical assumption of unidirectional power flow, which will perturb typical distribution system operations.
• System typically optimized for decreasing load density, with wire sizes dropping as we go further from the substation.
• System voltage regulation originally designed for voltage drop further from substation.
• Impact varies as we go from a few 5 kW residential systems to one or more 5 MW systems.
26

Distribution-Level PV Concerns
• Ability to properly
Control Voltage during
Reverse Power Flow
• Additional Wear on
Voltage Control Devices
• Voltage Flicker at
Customer Loads
• Coordination of
Protection Relays
• Constraints on Recloser
Operation
27
Substation
Switched
Capacitor
Voltage
Controlled
Bus
Primary
Feeders
Alternate
Backfeed
Source
Recloser
Voltage
Regulator
Tie
Switch
MW-Scale PV close
to substation
PV
PV PV
MW-Scale PV far
from substation
PV
Many 2-3 kW
Scale PV at
Residential
Load
Padmount
Transformer
10 kW – 100
kW Scale PV
at
Commercial
Load
PV
Sunny Day Impact of Cloud Cover

High Voltage due to DER
• Reverse power flow will cause voltage rise (negative voltage drop).
• Under light load conditions when primary voltage is high, voltage
rise can push voltage over ANSI voltage limits.
28
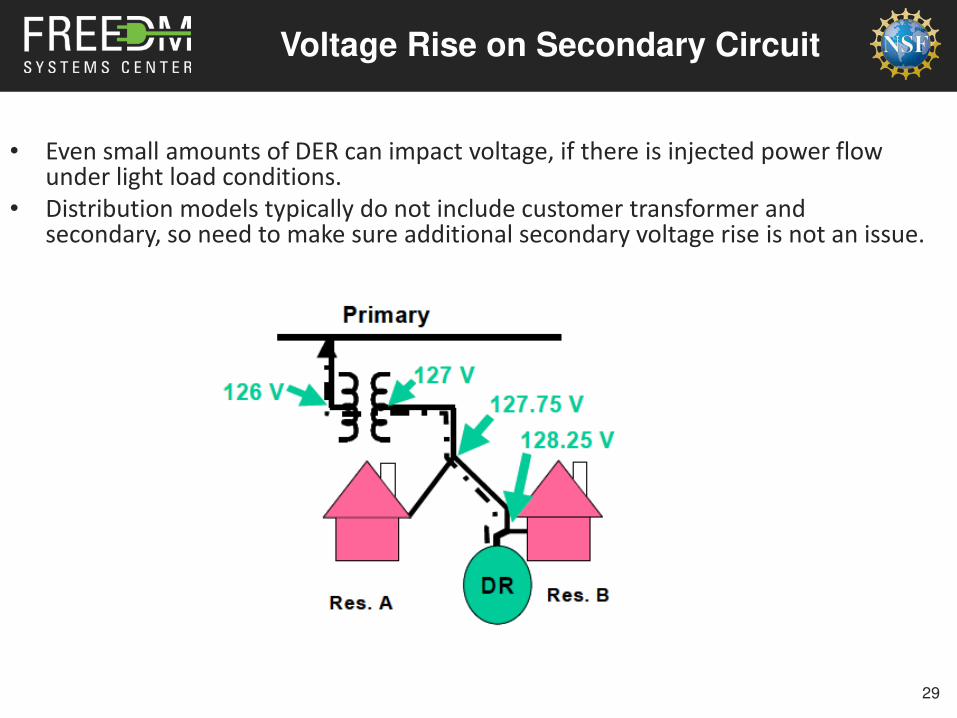
Voltage Rise on Secondary Circuit
• Even small amounts of DER can impact voltage, if there is injected power flow under light load conditions.
• Distribution models typically do not include customer transformer and secondary, so need to make sure additional secondary voltage rise is not an issue.
29

Interaction with Voltage Regulating Equipment
30
• If DER has time-varying output, will change system current flow enough to cause a regulator tap change or operation of a switched capacitor bank.
• Also DER with voltage control may not work well with utility regulation equipment.
• This leads to undesirable cycling of voltage regulators and voltage power quality degradation.

Voltage Flicker
• Intermittent DER
output is reflected in
both load current and
load voltage.
• Rapid fluctuations in
voltage referred to as
Voltage Flicker.
• Can measure this with
a Flicker Meter (IEC
Standard).
31Cloudy Day Profile
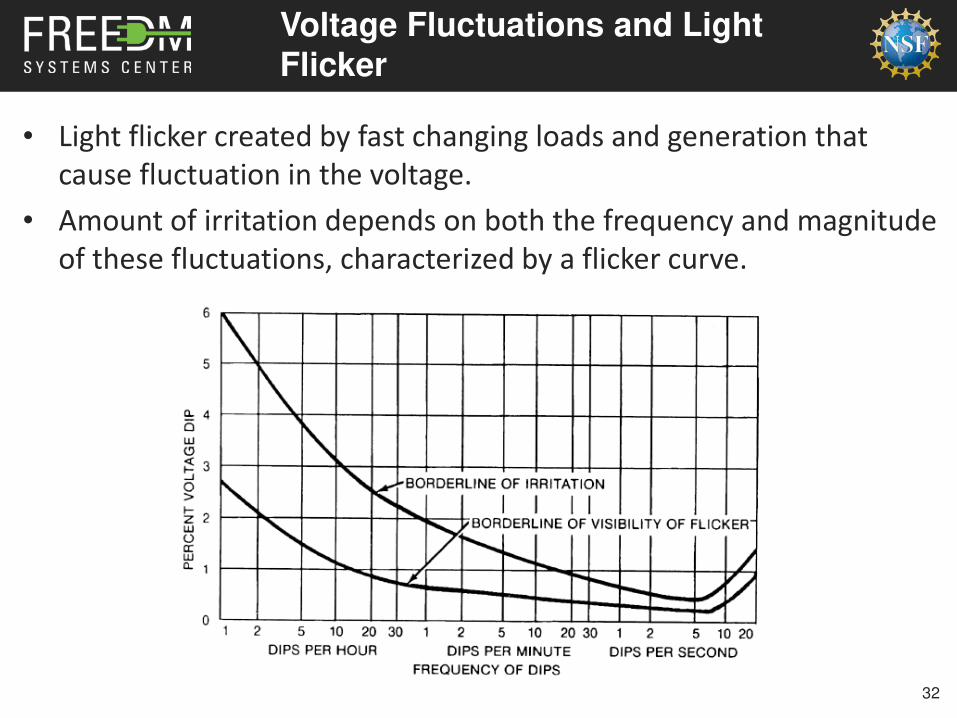
Voltage Fluctuations and Light Flicker
• Light flicker created by fast changing loads and generation that
cause fluctuation in the voltage.
• Amount of irritation depends on both the frequency and magnitude
of these fluctuations, characterized by a flicker curve.
32
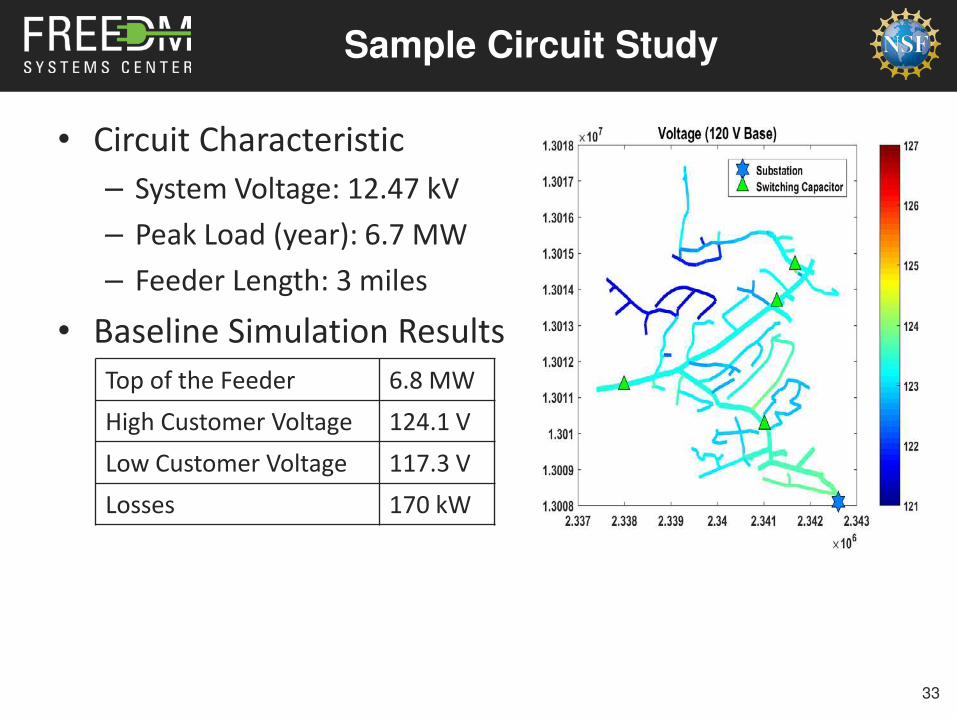
Sample Circuit Study
• Circuit Characteristic
– System Voltage: 12.47 kV
– Peak Load (year): 6.7 MW
– Feeder Length: 3 miles
• Baseline Simulation Results
33
Top of the Feeder 6.8 MW
High Customer Voltage 124.1 V
Low Customer Voltage 117.3 V
Losses 170 kW
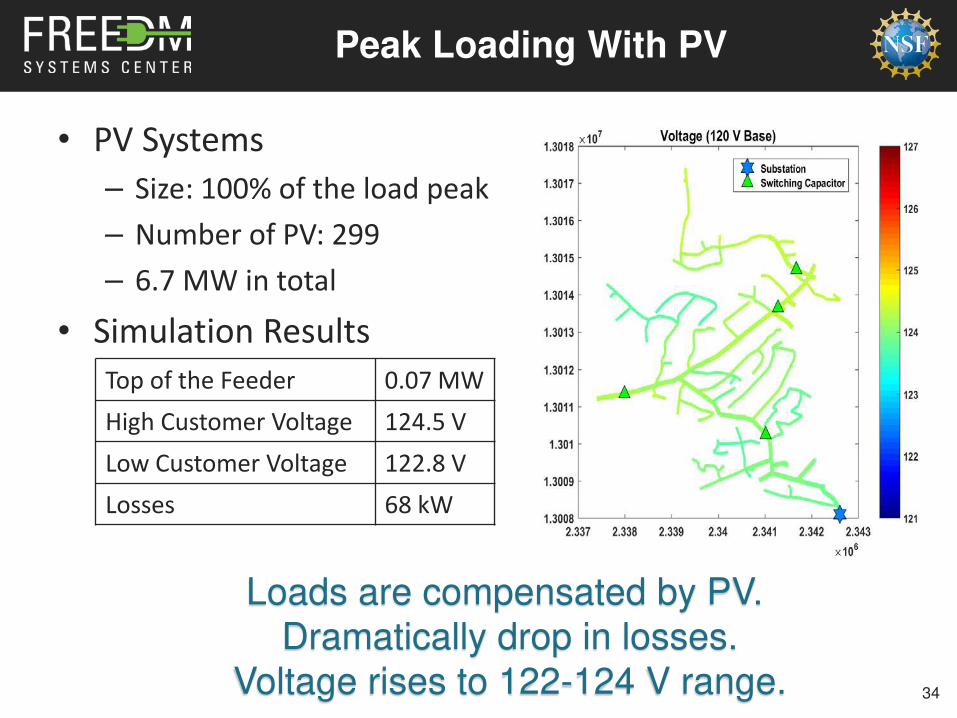
Peak Loading With PV
• PV Systems
– Size: 100% of the load peak
– Number of PV: 299
– 6.7 MW in total
• Simulation Results
34
Top of the Feeder 0.07 MW
High Customer Voltage 124.5 V
Low Customer Voltage 122.8 V
Losses 68 kW
Loads are compensated by PV.
Dramatically drop in losses.
Voltage rises to 122-124 V range.
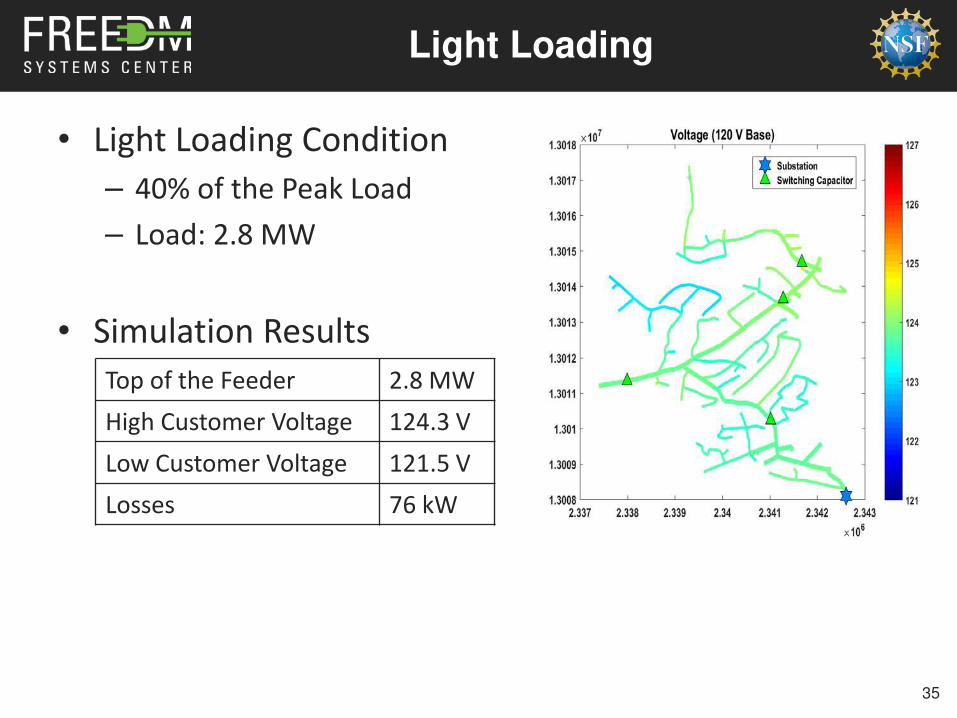
Light Loading
• Light Loading Condition
– 40% of the Peak Load
– Load: 2.8 MW
• Simulation Results
35
Top of the Feeder 2.8 MW
High Customer Voltage 124.3 V
Low Customer Voltage 121.5 V
Losses 76 kW
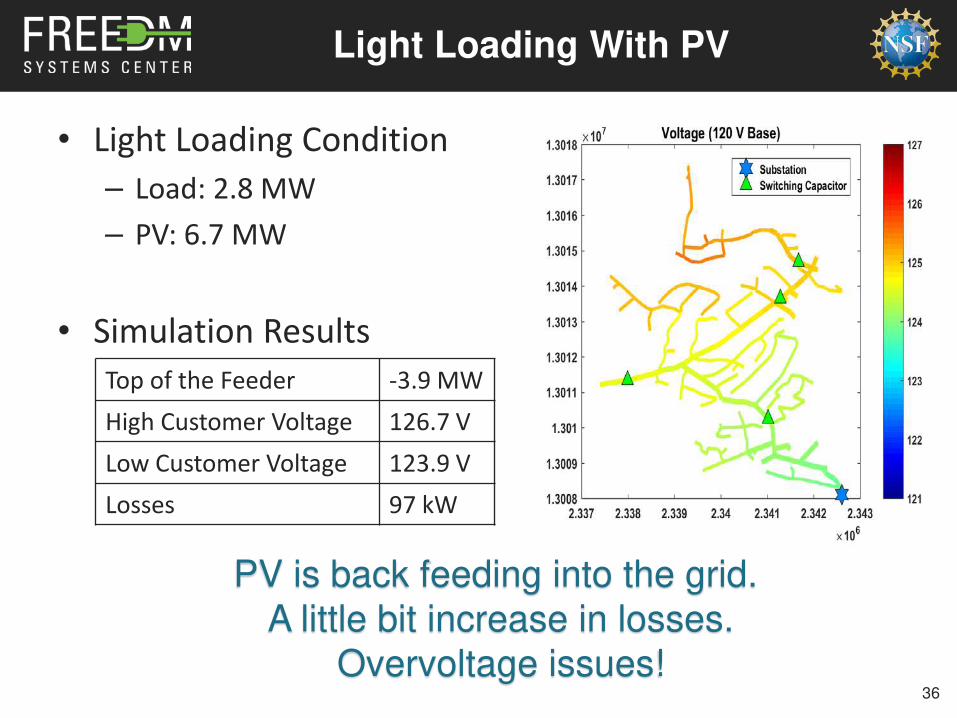
Light Loading With PV
• Light Loading Condition
– Load: 2.8 MW
– PV: 6.7 MW
• Simulation Results
36
Top of the Feeder -3.9 MW
High Customer Voltage 126.7 V
Low Customer Voltage 123.9 V
Losses 97 kW
PV is back feeding into the grid.
A little bit increase in losses.
Overvoltage issues!

Possible Mitigation Options with Today’s Technology
Distribution Circuit Upgrades ($$$ - Expensive to overbuild circuit)
Reconductor to lower voltage drop and increase ampacity
Relocate/Add line voltage regulators and capacitor banks
Feeder Device Controls ($ - Limit to simple changes that can be made)
Modify reference voltages, line drop compensation, bandwidth and
delays
DER Inverter Control ($$ - Stability issues for high penetration levels)
Operate leading power factor to help control voltage
Deploy active reactive power control (smart inverter)
Battery Energy Storage System compensation ($$$$ - Too Expensive for
power management only)
37
Today’s technology won’t get us to the very high-penetration scenarios being proposed for future grid systems.
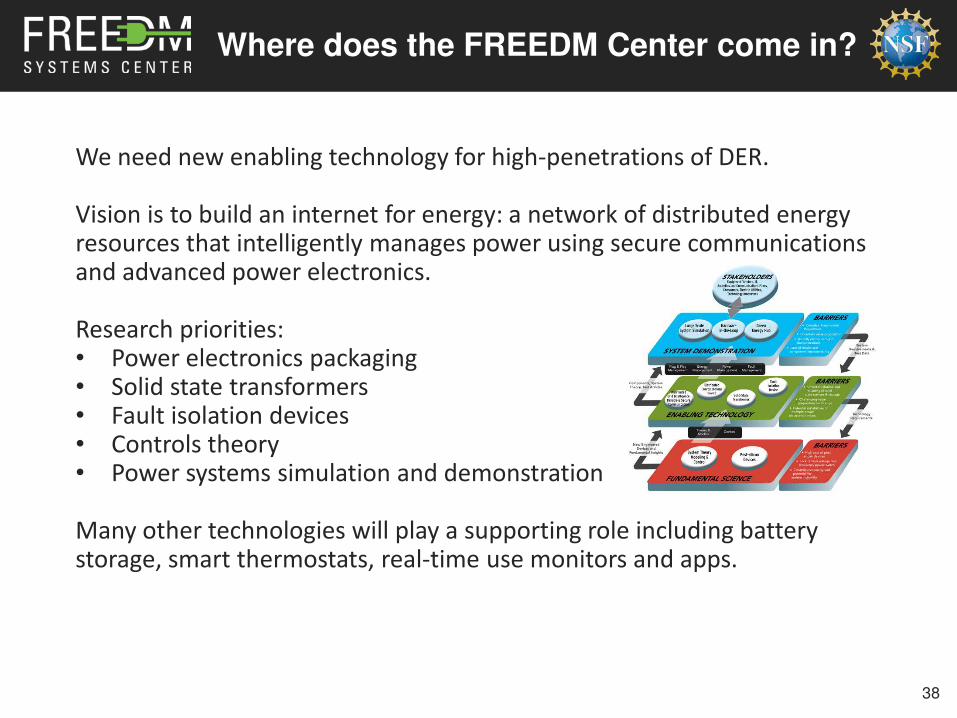
Where does the FREEDM Center come in?
We need new enabling technology for high-penetrations of DER.
Vision is to build an internet for energy: a network of distributed energy resources that intelligently manages power using secure communications and advanced power electronics.
Research priorities:• Power electronics packaging• Solid state transformers• Fault isolation devices• Controls theory• Power systems simulation and demonstration
Many other technologies will play a supporting role including battery storage, smart thermostats, real-time use monitors and apps.
38
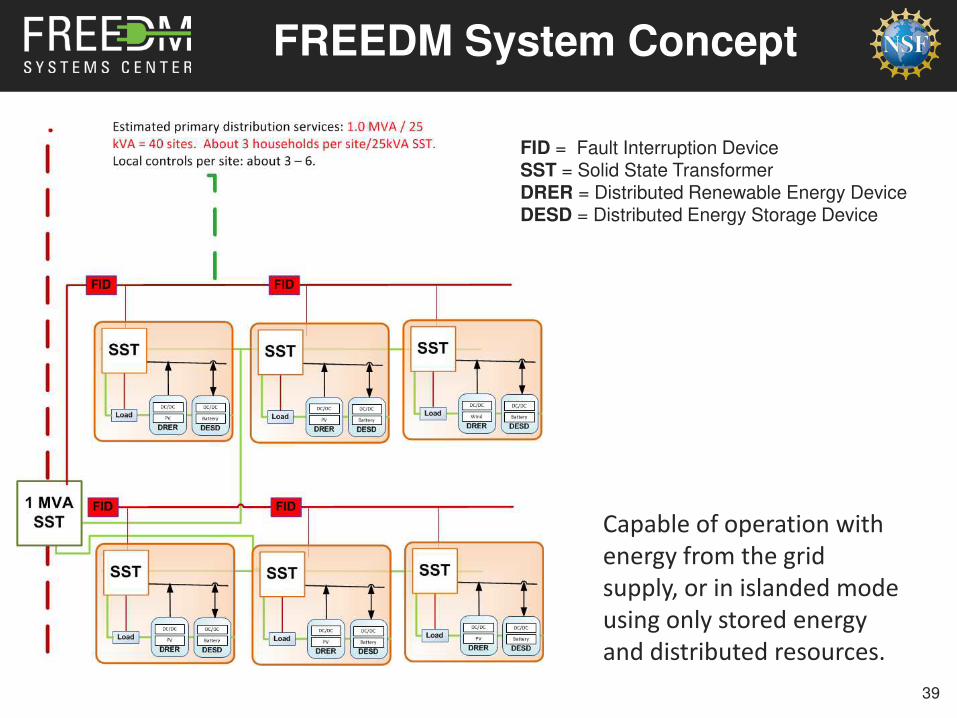
FREEDM System Concept
Capable of operation with
energy from the grid
supply, or in islanded mode
using only stored energy
and distributed resources.
FID = Fault Interruption DeviceSST = Solid State TransformerDRER = Distributed Renewable Energy DeviceDESD = Distributed Energy Storage Device
39