Distinctive patterns in habitat association and ...
15
ORIGINAL PAPER Distinctive patterns in habitat association and distribution of tiger beetles in the Shivalik landscape of North Western India Vinay Bhargav V. P. Uniyal K. Sivakumar Received: 15 February 2008 / Accepted: 29 October 2008 / Published online: 18 November 2008 Ó Springer Science+Business Media B.V. 2008 Abstract The purpose of the paper is (a) to describe the distribution pattern of tiger beetles in Shorea robusta domi- nated forest ecosystems at landscape level of north western Shivalik Himalaya in environmental space and (b) to evaluate the nature of microhabitat association amongst recorded species of tiger beetles. Twenty-five species of tiger beetles belonging to ten genera were recorded from six protected areas in the tropical dry deciduous Shivalik region with an altitudinal gradient of 350–1,400 m above mean sea level in north western India. Sampling for tiger beetles was carried out using strategically designed sample plot in ten distinct habitat types with five collection methods employed. Species composition of tiger beetles varied significantly between microhabitat types of the protected areas (Shannon H 0 = 0.436–1.069) and habitat specialists were found in only few of habitats. Bray–Curtis cluster analysis clustered the ten habitats into five cluster groups based upon the species composition with Shorea robusta most distinct from agri- cultural habitats. Riverine area was found to be the most diverse (with 18 or 72% of total species) as well as abundant (457 ± 33.61 SE individuals recorded per sample plot). Khair, Syzygium and pine forests were least rich and had only three species each. Two species J. crassipalpis and M. mel- ancholica were found only in riverine habitat. Though late summer to mid-monsoon was found most favorable for tiger beetles, only one species, C. chloris was persistently found even during modest winter months. Bulla’s diversity index showed that habitat breadth of species ranged from 0.00 to 6.66, an indicative of their habitat restrictiveness. Indicator species analysis revealed as many as 14 species indicative of particular habitat conditions. Descriptions of some important ecological and behavioral aspects are included for these species. The observed C-score (299.43330) showed that there is less co-occurrence among species pairs alongwith lower niche overlap (Pianka’s index = 0.14191) thereby illustrat- ing ample resource partitioning at microhabitat level. Further, co-occurrence index among guilds (C-score = 213.16250 with variance 1,949.76300) was found to be smaller than expected, revealing that feeding guilds are dif- fering significantly from one another in their levels of co- occurrence. Canonical correspondence analysis identified canopy cover, litter and average tree density as the most important habitat variable defining the distribution of tiger beetles in environmental space. Such assemblage patterns among species of tiger beetle would thus provide a solid basis to interpret changes in microclimatic conditions, caused by humans directly or through long term climate change and would thus help establishing a baseline in long term moni- toring of these forest ecosystems. Keywords Shivalik Protected areas Tiger beetles Sample plot Habitat types Wildlife sanctuary Sampling Diversity Specificity Habitat attributes and associations Introduction The tiger beetles (Coleoptera: Cicindelidae) constitute an insect group of considerable interest to many entomologists (considered by some as a subfamily or tribe within the Carabidae). Adult tiger beetles are colorful, elegant, fast- flying and fast-running insect predators that occupy diverse habitats in temperate and tropical areas. They are relatively easy to observe and generalizations of their biodiversity are reflected in other taxa (Pearson and Cassola 1992). The V. Bhargav V. P. Uniyal (&) K. Sivakumar Wildlife Institute of India, Chandrabani, Dehradun 248001, India e-mail: [email protected] 123 J Insect Conserv (2009) 13:459–473 DOI 10.1007/s10841-008-9193-y
Transcript of Distinctive patterns in habitat association and ...

ORIGINAL PAPER
Distinctive patterns in habitat association and distribution of tigerbeetles in the Shivalik landscape of North Western India
Vinay Bhargav Æ V. P. Uniyal Æ K. Sivakumar
Received: 15 February 2008 / Accepted: 29 October 2008 / Published online: 18 November 2008
� Springer Science+Business Media B.V. 2008
Abstract The purpose of the paper is (a) to describe the
distribution pattern of tiger beetles in Shorea robusta domi-
nated forest ecosystems at landscape level of north western
Shivalik Himalaya in environmental space and (b) to evaluate
the nature of microhabitat association amongst recorded
species of tiger beetles. Twenty-five species of tiger beetles
belonging to ten genera were recorded from six protected
areas in the tropical dry deciduous Shivalik region with an
altitudinal gradient of 350–1,400 m above mean sea level in
north western India. Sampling for tiger beetles was carried
out using strategically designed sample plot in ten distinct
habitat types with five collection methods employed. Species
composition of tiger beetles varied significantly between
microhabitat types of the protected areas (Shannon
H0 = 0.436–1.069) and habitat specialists were found in only
few of habitats. Bray–Curtis cluster analysis clustered the ten
habitats into five cluster groups based upon the species
composition with Shorea robusta most distinct from agri-
cultural habitats. Riverine area was found to be the most
diverse (with 18 or 72% of total species) as well as abundant
(457 ± 33.61 SE individuals recorded per sample plot).
Khair, Syzygium and pine forests were least rich and had only
three species each. Two species J. crassipalpis and M. mel-
ancholica were found only in riverine habitat. Though late
summer to mid-monsoon was found most favorable for tiger
beetles, only one species, C. chloris was persistently found
even during modest winter months. Bulla’s diversity index
showed that habitat breadth of species ranged from 0.00 to
6.66, an indicative of their habitat restrictiveness. Indicator
species analysis revealed as many as 14 species indicative of
particular habitat conditions. Descriptions of some important
ecological and behavioral aspects are included for these
species. The observed C-score (299.43330) showed that there
is less co-occurrence among species pairs alongwith lower
niche overlap (Pianka’s index = 0.14191) thereby illustrat-
ing ample resource partitioning at microhabitat level.
Further, co-occurrence index among guilds (C-score =
213.16250 with variance 1,949.76300) was found to be
smaller than expected, revealing that feeding guilds are dif-
fering significantly from one another in their levels of co-
occurrence. Canonical correspondence analysis identified
canopy cover, litter and average tree density as the most
important habitat variable defining the distribution of tiger
beetles in environmental space. Such assemblage patterns
among species of tiger beetle would thus provide a solid basis
to interpret changes in microclimatic conditions, caused by
humans directly or through long term climate change and
would thus help establishing a baseline in long term moni-
toring of these forest ecosystems.
Keywords Shivalik � Protected areas � Tiger beetles �Sample plot � Habitat types � Wildlife sanctuary �Sampling � Diversity � Specificity � Habitat
attributes and associations
Introduction
The tiger beetles (Coleoptera: Cicindelidae) constitute an
insect group of considerable interest to many entomologists
(considered by some as a subfamily or tribe within the
Carabidae). Adult tiger beetles are colorful, elegant, fast-
flying and fast-running insect predators that occupy diverse
habitats in temperate and tropical areas. They are relatively
easy to observe and generalizations of their biodiversity are
reflected in other taxa (Pearson and Cassola 1992). The
V. Bhargav � V. P. Uniyal (&) � K. Sivakumar
Wildlife Institute of India, Chandrabani, Dehradun 248001, India
e-mail: [email protected]
123
J Insect Conserv (2009) 13:459–473
DOI 10.1007/s10841-008-9193-y

taxonomy of this family is unusually well known worldwide
(Wiesner 1992). Moreover, the family’s size (around 2,600
species) is small enough to be studied by single specialist
authors but large enough to reveal useful and illuminating
patterns of biogeography and biology (Pearson and Vogler
2001).
Although some species of the family are arboreal,
occupying tree trunks, low bushes, hedges, and under story
growth (Naviaux 1994, 2002), the majority are terrestrial
(adults are active on soil and vegetation substrates while
the larvae hunt for prey from vertical burrows, primarily at
the soil surface). India (including the Andaman and Nic-
obar islands) with 208 species of tiger beetles has the
second highest number in the world (only Indonesia, with
237 species, has more). Of these, 52% (108 species) are
endemic to India (Acciavatti and Pearson 1989; Cassola
and Pearson 2000). The goal of the present study is to
examine the diversity patterns (spatial and temporal) of
tiger beetles in six protected areas across the Shivalik
landscape of the north western India.
Methods
Study areas
Shivaliks: The low mountains that make up the Shivalik
landscape were formed by a deposition of detritus and
sediment as a skirt at the southern base of the rising
Himalayas. This narrow strip is 2,000 kilometers long and
forms a continuous chain with an average elevation of
900–1,200 m above mean sea level and in places, a width
of only 16 km. Following study areas were selected in
Shivaliks for the purpose of present study (Fig. 1).
Pong Dam Wetland sanctuary (PWLS)
This sanctuary (31�500–32�070N and 75�580–76�250E) lies
in the Kangra district, Himachal Pradesh over an area of
307 sq. km. There is a little submerged aquatic vegetation
and shoreline does not support much emergent vegetation
due to the pronounced seasonal changes in water level.
There is an extensive swamp with river beds and grasslands
in the seepage area below the dam (Gaston 1985, 1986).
The surrounding hillsides support mixed deciduous and
chir pine forest. The dominant trees being chir pine (Pinus
roxburghii), khair (Acacia catechu), Mallotus philipennsis,
Cassia fistula, Bombax ceiba, and Ehretia laevis. The
undergrowth consisted of shrubs Murraya koenigii,
Adathoda vasica and Lantana camara.
Naina Devi wildlife sanctuary (NWLS)
The sanctuary (31�160–31�240N and 76�250–76�350E), lies in
Bilaspur district, Himachal Pradesh over an area of 123 sq.
km with an altitude gradient of 500–1,000 m. The vegetation
is mostly mixed deciduous forests with Mallotus philipenn-
sis, Ehretia laevis, Syzygium cumini and some Ficus sp.
Fig. 1 The study area along the
Shivalik Himalaya in north
western India showing location
of different protected areas
(small white dots)
460 J Insect Conserv (2009) 13:459–473
123

Nahan reserve forest (NRF)
These reserve forests (30�3704300N and 77�1701000E) consist
of pine (Pinus roxburghii) forests interspersed with Pyrus
sp. at an altitude between 1,200 and 1,400 m. The under-
growth mainly has shrubs such as Murraya koenigii,
Carissa carandus, Lantana camara, Rubus sp., Berberis
sp., and seedlings of Mallotus philipennsis and pine.
Renuka Wetland wildlife sanctuary (RWLS)
It is a small sanctuary (30�3505800–30�3700800N–77�2603400–78�2802100FE) occupying an area of 4 sq. km. in Sirmaur
district, Himachal Pradesh with a mean altitude of
220–880 m above mean sea level. The vegetation is mainly
dry mixed deciduous forest and submerged aquatic
vegetation.
Simbalbara wildlife sanctuary (SWLS)
This sanctuary (30�2402100–30�2801300N and 77�2701800–77�3102600E) is a representative of lower Shivalik region. It
lies in confluence of peninsular plains and main Shivalik
system and thus flora, fauna and physical features show
affinities to western Himalaya, Punjab plains and upper
Gangetic plains (Biogeographic zones 2B, 4A and 7A,
respectively, Rodgers et al. 2002). The altitudinal range is
350–700 m above mean sea level. The hills are composed
of unconsolidated sandstone and conglomerate that are
extremely prone to erosion. The soil here is extremely
porous and thereby highly drained. However, in many low-
lying areas springs emerge and create perennially moist
microhabitats for tiger beetles. Moist forests dominated by
dipterocarp tree species called Sal (Shorea robusta) and
northern dry mixed deciduous forests characterize much of
the sanctuary.
Chilla wildlife sanctuary (CWLS)
This sanctuary (148 sq. km) is a part of Rajaji National
Park (820 sq. km) (29�520–30�150N and 77�550–79�800E)
and situated at Shivalik foothills of Uttarakhand near river
Ganges. The altitudinal ranges from 300 to 1,350 m above
mean sea level. The area is hilly that is bisected by mon-
soon sandy river beds (raus), a prime habitat for tiger
beetles. CWLS is thickly foliated predominantly by the sal
(Shorea robusta) mixed forest and a number of other forest
types which includes the western Gangetic moist and
northern dry deciduous and khair-sissoo forests, and
interspersed Terai grasslands. Major tree species are Sho-
rea robusta, Mallotus philipennsis, Ehretia laevis, Tectona
grandis, and Haplophragma adenophyllum.
Sampling
Vegetation sampling
Vegetation for each transect was quantified using stratified
random sampling. Square plot of 10 m 9 10 m was laid on
either side of transect at 100 m interval to quantify trees.
Square plot 5 m 9 5 m were laid on either side of transect
at 100 m interval to quantify shrubs. In each of these plots,
two plots of 1 m 9 1 m were laid for estimating herb
abundance and grass cover including the grass height. The
following variables were measured in each vegetation plot
viz. average density of trees, shrubs, and herbs, grass cover,
snag, termite mound, tree height, average girth at breast
height (av. GBH), grass height, and canopy cover (using
canopy densitometer). IVI was calculated for each domi-
nant tree species in each transect (Curtis 1959).
In addition to major forest types found in these protected
areas, there are also small areas of mixed woodlands and
plantation forests. We observed and sampled tiger beetles in
ten distinctive habitats across the landscape based on
importance value index (IVI) (Curtis 1959) of dominant tree
species of each habitat types. Thus following habitats were
delineated based on IVI and sampled for tiger beetles viz. Sal
(Shorea robusta) forest (SF), Eucalyptus plantation mixed
forests (EP), Teak (Tectona grandis) mixed forests (TP),
Khair (Acacia catechu) mixed forest (KF), Riverine forests
(RP), Mixed forest (MF), Syzygium cumini mixed forest
(SY), Bamboo bambusae mixed forest (BF), Agricultural
land (AL), and Pine (Pinus roxburghii) forest (PM). We
conducted the study from September 2004 to August 2007 to
obtain reliable data from different years and seasons.
Habitat variables
Abiotic habitat variables such as temperature and relative
humidity (RH) were recorded using digital thermometer
and digital hygrometer (from Forestry suppliers, USA),
respectively. Other soil variables like percentage organic
content (% OC) (using Walkley and Black 1934), pH
(using digital soil pH meter), soil texture (using Bouyoucos
1962), and litter depth (using Faith et al. 1998) were also
recorded and/or calculated for each transect in field and in
the laboratory.
Tiger beetle sampling
Because of their agility and speed, we spent several days
learning to find and identify tiger beetles in the various
habitats. We sampled diurnal tiger beetles from 08:30 to
11:00 h, the period of maximum activity on most days.
Because many species of tiger beetles are attracted to night
lights (Pearson and Vogler 2001), we used light traps to
J Insect Conserv (2009) 13:459–473 461
123
measure their activity from 19:30 to 21:00 h in summer
and monsoon. During winter dormancy, we sampled adults
by looking for aggregations in different hibernation sites,
such as under stones, crevices, and below decaying logs.
For diurnal sampling during active seasons, we used sev-
eral methods to sample populations of tiger beetles within
each habitat type. These methods included beating trays
(BT) using a 1.8 9 1.2 m white insect collection sheet,
sweep net capture (SN) using standard sweeping net, hand
sorting (HS) by visual observation, and conventional pitfall
traps (PT) in each sample plot.
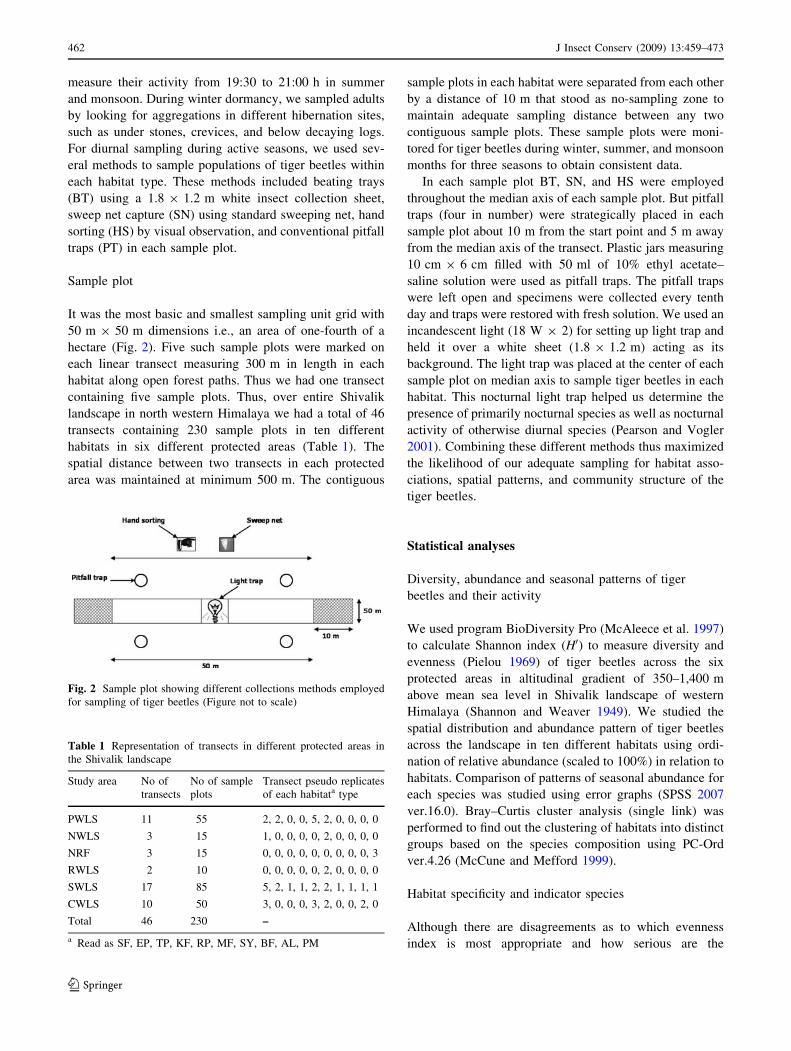
Sample plot
It was the most basic and smallest sampling unit grid with
50 m 9 50 m dimensions i.e., an area of one-fourth of a
hectare (Fig. 2). Five such sample plots were marked on
each linear transect measuring 300 m in length in each
habitat along open forest paths. Thus we had one transect
containing five sample plots. Thus, over entire Shivalik
landscape in north western Himalaya we had a total of 46
transects containing 230 sample plots in ten different
habitats in six different protected areas (Table 1). The
spatial distance between two transects in each protected
area was maintained at minimum 500 m. The contiguous
sample plots in each habitat were separated from each other
by a distance of 10 m that stood as no-sampling zone to
maintain adequate sampling distance between any two
contiguous sample plots. These sample plots were moni-
tored for tiger beetles during winter, summer, and monsoon
months for three seasons to obtain consistent data.
In each sample plot BT, SN, and HS were employed
throughout the median axis of each sample plot. But pitfall
traps (four in number) were strategically placed in each
sample plot about 10 m from the start point and 5 m away
from the median axis of the transect. Plastic jars measuring
10 cm 9 6 cm filled with 50 ml of 10% ethyl acetate–
saline solution were used as pitfall traps. The pitfall traps
were left open and specimens were collected every tenth
day and traps were restored with fresh solution. We used an
incandescent light (18 W 9 2) for setting up light trap and
held it over a white sheet (1.8 9 1.2 m) acting as its
background. The light trap was placed at the center of each
sample plot on median axis to sample tiger beetles in each
habitat. This nocturnal light trap helped us determine the
presence of primarily nocturnal species as well as nocturnal
activity of otherwise diurnal species (Pearson and Vogler
2001). Combining these different methods thus maximized
the likelihood of our adequate sampling for habitat asso-
ciations, spatial patterns, and community structure of the
tiger beetles.
Statistical analyses
Diversity, abundance and seasonal patterns of tiger
beetles and their activity
We used program BioDiversity Pro (McAleece et al. 1997)
to calculate Shannon index (H0) to measure diversity and
evenness (Pielou 1969) of tiger beetles across the six
protected areas in altitudinal gradient of 350–1,400 m
above mean sea level in Shivalik landscape of western
Himalaya (Shannon and Weaver 1949). We studied the
spatial distribution and abundance pattern of tiger beetles
across the landscape in ten different habitats using ordi-
nation of relative abundance (scaled to 100%) in relation to
habitats. Comparison of patterns of seasonal abundance for
each species was studied using error graphs (SPSS 2007
ver.16.0). Bray–Curtis cluster analysis (single link) was
performed to find out the clustering of habitats into distinct
groups based on the species composition using PC-Ord
ver.4.26 (McCune and Mefford 1999).
Habitat specificity and indicator species
Although there are disagreements as to which evenness
index is most appropriate and how serious are the
Fig. 2 Sample plot showing different collections methods employed
for sampling of tiger beetles (Figure not to scale)
Table 1 Representation of transects in different protected areas in
the Shivalik landscape
Study area No of
transects
No of sample
plots
Transect pseudo replicates
of each habitata type
PWLS 11 55 2, 2, 0, 0, 5, 2, 0, 0, 0, 0
NWLS 3 15 1, 0, 0, 0, 0, 2, 0, 0, 0, 0
NRF 3 15 0, 0, 0, 0, 0, 0, 0, 0, 0, 3
RWLS 2 10 0, 0, 0, 0, 0, 2, 0, 0, 0, 0
SWLS 17 85 5, 2, 1, 1, 2, 2, 1, 1, 1, 1
CWLS 10 50 3, 0, 0, 0, 3, 2, 0, 0, 2, 0
Total 46 230 –
a Read as SF, EP, TP, KF, RP, MF, SY, BF, AL, PM
462 J Insect Conserv (2009) 13:459–473
123

assumptions associated with each (Camargo 1995), we
applied Bulla’s index (Bulla 1994) as a relatively simple
quantification of habitat specialization for each species, as
a measure of habitat breadth (H) in different habitat types.
We used the data on relative frequency of each species in
each habitat type to calculate H. Thus, species restricted to
one habitat type have minimum habitat breadth, and have a
value of H equal to zero. While if a species is evenly
distributed across all habitat types, H would be equal to
total number of habitats. Indicator species analysis (Duf-
rene and Legendre 1997) was performed using PC-Ord
ver.4.26 (McCune and Mefford 1999) to determine tiger
beetle species characteristic of particular microhabitat
conditions. Monte-Carlo randomization test was used to
determine if the value is greater than expected by chance;
thus species with only one or a very few individuals are
unlikely to be considered indicators, even if they appear in
only one habitat type.
Habitat attributes and effect of habitat variables
For understanding co-occurrence amongst species, we
calculated the C-score value (Stone and Roberts 1990)
using Ecosim (Gotelli and Entsminger 2001) and main-
tained row and column totals in the simulation, so that the
numbers of occurrences of each species in the null com-
munities were the same as in the original data set. Niche
overlap between species was calculated from Pianka’s
index (Pianka 1973) using Ecosim and we followed ran-
domization algorithm (RA) 3 as it retains the niche breadth
of each species, and randomizes ‘‘which’’ particular
resource states are utilized. It also retains the amount of
specialization for each species, but allow it to potentially
use other resource states. Pianka’s niche overlap index
measures the relative amount of habitat overlap between
each pair of species and ranges from a minimum of 0.0 (no
shared habitats) to a maximum of 1.0 (identical habitat
use). Since tiger beetles are generalist carnivores, their
grouping into different feeding guilds was delineated using
the habitat use of each species in different season and
habitats. Further, an overall value integrating all feeding
guilds (including the testing of favored state hypothesis)
was calculated from C-score using Ecosim (Gotelli and
Entsminger 2001) as it tests whether the mean and the
variance co-occurrence index among guilds are larger or
smaller than expected by chance. Thus an unusually large
variance would mean that the guilds differ significantly
from one another in their levels of co-occurrence, while an
unusually small variance would mean that guilds are
strikingly similar to one another in the level of co-occur-
rence observed. Canonical correspondence analysis (CCA)
(ter Braak 1986) was performed using PC-Ord (McCune
and Mefford 1999) to find out the effect of habitat variables
and their importance in predicting distribution of tiger
beetles community composition in relation to environ-
mental variation.
Results
We surveyed a total of 46 transects with 230 permanently
marked sample plots across the Shivalik landscape of north
western India and recorded 25 species of tiger beetles
belonging to ten genera from six different protected areas
(Table 2).
Diversity, abundance and seasonal patterns of tiger
beetles and their activity
SWLS was found to be the richest as 18 (or 72%) of tiger
beetle species were recorded from there, followed by
CWLS with 12 (or 48%) species. RWLS was poorest with
three (or 12%) species followed by NRF with four (or 16%)
species (Table 2). Though it appears that with the increase
in altitude from 350–750 m (in SWLS) to 300 to 1,350 m
(in CWLS) to 500–1,000 m (in NWLS) and to 1,200–
1,400 m (in NRF), there is significant decline in species
richness (one way ANOVA, F value = 10.116, P value =
0.00518, Fcrit = 4.413) but it is inferred that tiger beetles
preferred open habitats like riverine tracts and/or forests
with open canopy cover found in some protected areas than
the upper hilly reaches. Further, the change in vegetation
composition is commendable with difference in dominant
tree species and this was reflected in the tiger beetle species
diversity. As it could be established that Shannon H0 and
Hmax varied significantly between different habitats (Fig. 3;
Table 3). It was maximum in RP (1.069), followed by MF
(1.039) and least in PM (0.436) and KF (0.465). Though
this landscape is dominated by sal (Shorea robusta) forests,
the diversity of tiger beetles in sal dominated habitats
(0.944) was low as compared to other habitats like RP and
MF suggesting preference of open and diverse habitat
conditions by these species.
Shannon evenness (J0) varied from 0.853 to 0.999
illustrating that proportional abundances are the same. But
the pattern of spatial distribution of abundance differed
considerably among the habitats in relation to species. All
ten habitats were occupied by tiger beetles, but not all were
relatively equally abundant (Fig. 4). Two habitats RP and
MF were dominated by maximum 18 and 12 species,
respectively. These were followed by SF (10 species), TP
(9 species), AL (8 species), BF (5 species), and EP (4
species). While three habitats were least dominated by
three species like KF by C. intermedia, C. plumigera, and
C. venosa; SY by C. grammophora, C. intermedia,
and C. plumigera; and PM by C. intermedia, H. pulchella,
J Insect Conserv (2009) 13:459–473 463
123

and L. striolata. Two species of tiger beetles were
restricted to a single habitat i.e., J. crassipalpis and M.
melancholica both recorded in RP.
Further, the mean abundance of tiger beetle species per
transect also showed distinct patterns of assemblage in
different habitats (Fig. 5). It was found that RP supported
Fig. 3 Shannon diversity (H0)measure in different habitat
types across study area
Table 2 Presence–absence
matrix of tiger beetles in
protected areas across Shivalik
landscape
*, Present, –, absent
S. no. Species PWLS NWLS NRF RWS SWLS CWLS
1 Calochroa bicolor – – – – * *
2 Calochroa flavomaculata * – – – – –
3 Calomera angulata * – – – * *
4 Calomera chloris * – – – * *
5 Calomera plumigera * – – – * *
6 Cicindela erudita – – – – * –
7 Cicindela fastidiosa – – – – – *
8 Cicindela multiguttata – – – – – *
9 Cicindela parvomaculata – – – – – *
10 Cicindela vigintiguttata – – – – – *
11 Cosmodela intermedia * * * * * *
12 Cylindera bigemina * – – – * –
13 Cylindera grammophora * – – – * –
14 Cylindera spinolae – – – – * –
15 Cylindera subtilesignata * * * * * –
16 Cylindera venosa – – – – * *
17 Cylindera viduata – – – – * –
18 Heptodonta pulchella – * * – – –
19 Jansenia chloropleura – * * – – *
20 Jansenia crassipalpis * – – – * –
21 Lophyra striolata – – – – * –
22 Myriochila melancholica * – – – * –
23 Myriochila undulata – – – – * *
24 Neocollyris bonellii – * – – * –
25 Neocollyris saphyrina – * – * * –
Grand total 10 6 4 3 18 12
464 J Insect Conserv (2009) 13:459–473
123

more than 26% (457 ± 33.61 SE specimens) while the SY
had less than 3% (only 26 ± 7.33 SE specimens) tiger
beetles recorded in the study. MF (351.2 ± 23.58 SE
specimens) supported more than the SF (241.6 ± 9 SE
specimens) dominant landscape. An interesting pattern of
assemblage, communal roosting, was also recorded
amongst tiger beetles in the riverine area. This behavior on
undergrowth plants occurred most commonly amongst C.
plumigera, C. angulata, and C. chloris in some of the
riverine area (Uniyal and Bhargav 2007). These large
roosts often included more than 5,000 individuals at its
peak activity, though fluctuating anywhere from 300 to
3,500. Usually, such tiger beetle communal roosts have
social function, for food information exchange, and popu-
lation regulation (Pearson and Anderson 1985). But in our
study, communal roosting was persistently associated with
overcast conditions, decreased temperature, and precipita-
tion for the purpose of protection from predation, and
ensuing thermoregulation advantages.
In total, C. angulata was the most abundant species with
264 specimens followed by C. plumigera 232 specimens
recorded in all habitats especially in RP. These were
followed by C. vigintiguttata (206 specimens) and
C. chloris (184 specimens). Three species M. melancholi-
ca (26 specimens), M. undulata (32 specimens) and
J. crassipalpis (37 specimens) were the least abundant.
Table 3 Comparison of species richness of tiger beetle assemblages in habitat types across Shivalik landscape
Index\habitats SF EP TP KF RP MF SY BF AL PM
Shannon H0 log base 10 0.944 0.574 0.898 0.477 1.069 1.039 0.465 0.596 0.794 0.436
Shannon Hmax log base 10 1 0.602 0.954 0.477 1.23 1.079 0.477 0.699 0.845 0.477
Shannon J0 0.944 0.953 0.941 0.999 0.869 0.963 0.974 0.853 0.939 0.914
Simpsons diversity (1/D) 8.861 4 7.403 3.182 10.106 10.462 3.122 3.49 6.883 2.565
Fig. 4 Habitats in the study
area showing the relative
composition of tiger beetle
species (mean abundance scaled
to 100% of relative proportion)
Fig. 5 Mean abundance of tiger
beetles per transect (error bars
are SE of mean)
J Insect Conserv (2009) 13:459–473 465
123

C. grammophora (164 specimens) was the most abundant
in MF and AL, H. pulchella (104 specimens) in PM, and N.
bonellii (138 specimens) and N. saphyrina (94 specimens)
were most abundant in MF.
In general all the tiger beetle species showed a spike in
activity with the onset of the monsoon as evident from the
mean abundance per transect at 95% CI pooled over three
seasons i.e., winter, summer, and monsoon. This spike was
large for some species, such as C. angulata, C. plumigera,
C. chloris, and C. vigintiguttata and smaller for other
species, such as M. melancholica and J. crassipalpis
(Fig. 6). During winter, the adult population size of tiger
beetle species fell to none or only a few, as most of the
species underwent hibernation. Although adults of some
species, such as C. angulata and C. chloris, were active
together on the riverine area throughout year, C. chloris
was particularly more abundant during the dry part of the
year, and in winter while C. angulata was predominant
during the monsoon season.
Sorensen (Bray–Curtis) similarity measure with flexible
b group linkage (distance, b = -0.25) was used for cluster
analysis based upon the species composition of tiger bee-
tles in ten different habitats to generate hierarchy of
clusters (Fig. 7). Five such cluster groups were obtained
Fig. 6 Mean abundance of tiger
beetles per transect (pooled
season wise data for each
species) at 95% confidence
interval
Fig. 7 Bray–Curtis cluster analysis dendrogram showing the distance relationship between habitats according to species assemblage
composition
466 J Insect Conserv (2009) 13:459–473
123

viz. cluster 1 includes SF, AL, and BF; cluster 2 includes
only RP as separate and distinct group; cluster 3 includes
TP and MF; cluster 4 includes EP, KF, and SY indicating
different patterns of species composition; and cluster 5
includes only PM as separate and distinct group.
Habitat specificity and indicator species
Based on combined capture data, we used Bullas’s diver-
sity index (Bulla 1994; Rodriguez et al. 1998) to calculate
the proportion of available habitat spectrum used by each
of the tiger beetle species as well as overlap among species
(Table 4). Two species J. crassipalpis and M. melancho-
lica were the most habitat specific/restricted (Habitat
breadth, H = 0). The remaining species used several hab-
itats, but none was present in all the habitat types, hence no
species could be found with H = 10. The most widely
occurring species was C. intermedia (H = 6.66), followed
by C. subtilesignata (H = 6.60) and C. plumigera (H =
5.88). H for 17 species (or 68%) ranged between 1 and 5
showing greater degree of habitat restriction in at least five
habitats; while H for four species ranged between 5 and 6
depicting lesser habitat specialization. Thus, habitat
breadth ranged from 0.00 to 6.66 for all the species
recorded and the different altitudes did not have any
bearing on habitat specialization unlike richness (one way
ANOVA, F value = 1.219, P value = 0.284, Fcrit =
4.413). H could thus be dependent on pertinent factors like
floral diversity, foliage density, shading, and microhabitat
conditions and/or indirectly on the diversity and abundance
of potential prey items for the tiger beetles, specific for
each protected area. Therefore, variations in species rich-
ness across the landscape were attributed to the differences
in the range of habitat types present in each of these pro-
tected areas. SWLS being a biogeographically significant
protected area (Bhargav and Uniyal 2008) and CWLS
offered different microhabitat conditions conducive for
many tiger beetle species to occur together, sharing similar
habitat but occupying different niches. NRF largely being
pine forest supported only three species like H. pulchella,
C. intermedia and L. striolata.
Thus indicator species analysis was performed to find out
the ‘‘genuine’’ species indicative of particular habitats
(Table 5). 14 (or 56%) out of total 25 species of tiger beetles
were found to be adequately representing particular habitat
conditions. One of the most important amongst them was
C. bicolor an indicator species for high canopy cover, as this
species was particularly found in mixed forests with more
than 32% closed canopy (one way ANOVA, F
value = 14.512, P value = 0.016, Fcrit = 10.116). Some
species like C. bigemina, C. erudita, C. venosa, and C.
vigintiguttata were particularly indicative of ecotones and
were found predominantly at interfaces of forest-agriculture
land, riverine-grassland, and riverine-agriculture areas.
Habitat attributes and effect of habitat variables
Abiotic variables did not differ significantly in their values
across different habitat types in the sampling seasons. This
was reflected in Pearson correlation (SPSS 2007 ver.16.0)
of mean species richness of tiger beetles with mean tem-
perature and relative humidity across habitats. It was found
that these abiotic factors temperature (r = 0.22, P \ 0.05)
and relative humidity(r = 0.17, P \ 0.05) did not con-
tribute significantly to the differences in species
composition across the habitats. Nevertheless, these vari-
ables did have a dramatic effect on the seasonal abundance
of tiger beetles. Soil variables were found frequently
associated with differences in species composition as
reflected from Pearson correlation with pH (r = 0.67,
P \ 0.05), organic content (r = 0.78, P \ 0.05) and litter
depth (r = 0.88, P \ 0.05) except for the soil texture
(plays an important factor during oviposition and
Table 4 Habitat breadth (using Bulla’s diversity index) of tiger
beetles in habitat types across Shivalik landscape
S. no Species N Habitat breadth (H)
1 Calochroa bicolor 78 3.33
2 Calochroa flavomaculata 148 5.67
3 Calomera angulata 264 2.51
4 Calomera chloris 184 2.22
5 Calomera plumigera 232 5.88
6 Cicindela erudita 53 1.31
7 Cicindela fastidiosa 116 3.60
8 Cicindela multiguttata 55 1.20
9 Cicindela parvomaculata 72 3.11
10 Cicindela vigintiguttata 206 4.91
11 Cosmodela intermedia 136 6.66
12 Cylindera bigemina 118 5.50
13 Cylindera grammophora 164 5.71
14 Cylindera spinolae 66 1.77
15 Cylindera subtilesignata 127 6.60
16 Cylindera venosa 152 1.90
17 Cylindera viduata 116 4.78
18 Heptodonta pulchella 104 2.06
19 Jansenia chloropleura 44 1.13
20 Jansenia crassipalpis 37 0.00
21 Lophyra striolata 72 1.54
22 Myriochila melancholica 26 0.00
23 Myriochila undulata 32 1.11
24 Neocollyris bonellii 138 1.67
25 Neocollyris saphyrina 94 1.43
Total 2,834 –
N number of specimens recorded per habitat
J Insect Conserv (2009) 13:459–473 467
123

construction of larval burrows, Hadley et al. 1990) in case
of adult tiger beetles. These soil variables correlations were
particularly accurate for major species of tiger beetles
inhabiting riverine area. Majority of the species like C.
angulata, C. plumigera, and C. chloris preferred open,
large riverine tracts without any forest cover. But the other
cardinal variables that were quintessentially associated
with tiger beetle species richness and habitat specificity
was vegetative cover i.e., average tree density (r = 0.95,
P \ 0.05), average shrub density (r = 0.85, P \ 0.05), and
canopy cover (r = 0.80, P \ 0.05). This was particularly
true for forest dwelling species like C. bicolor, N. saphy-
rina, and N. bonellii that particularly inhabited mixed
forest stands, latter two being arboreal. Further, habitat
types differed greatly in terms of composition of flora
mainly trees, under story growth, herbs and grasses and
foliage profile/density across the landscape. In some cases,
the overlap of species (H [ 3.00) was most like due, at
least in part, to the spatial proximity of several sample plots
and/or the similarity in floristics.
As far as co-occurrence amongst tiger beetles is con-
cerned, the observed C-score for co-occurrence for the tiger
beetles assemblage was 299.43330 (Table 6). In contrast,
the average of the 5,000 simulated matrices was
285.75390, and none of the simulated matrices had a C-
score larger than the observed. So, compared to the simu-
lated universe of random matrices with identical row and
column sums, there is much less co-occurrence in the tiger
beetles matrix than expected by chance (P = 0.0002). But
the observed niche overlap between each individual pair of
species was 0.14191 (Pianka’s index). The species pairs in
the matrix most similar in resource utilization (highest
Table 5 Indicator species analysis (after Dufrene and Legendre, 1997) computing indicator value (IV) coefficient of tiger beetles across Shivalik
landscape
Indicator values
S. no Column Maxgrp Observed indicator
value (IV)
IV from randomized groups P* Indicator habitat
Mean SD
1 C. angulata 9 57 10.1 5.63 0.001* Riverine
2 C. bicolor 3 40.7 9.4 5.99 0.002* High canopy cover
3 C. bigemina 8 40.9 10.7 5.33 0.001* Riverine–agriculture interface
4 C. chloris 9 47.4 10 5.82 0.001* Riverine
5 C. erudita 9 55.4 9.1 5.67 0.001* Forest–agriculture interface
6 C. fastidiosa 3 50.9 10.2 5.53 0.001* Riverine
7 C. flavomaculata 3 31.5 11.4 6.1 0.014 –
8 C. grammophora 9 59.4 11 5.47 0.001* Agriculture
9 C. intermedia 7 28.5 11.8 4.8 0.006 –
10 C. multiguttata 5 22.2 9.4 6.03 0.036 –
11 C. parvomaculata 9 73.2 9.9 6.01 0.001* Mixed forest
12 C. plumigera 9 29.6 11.5 6.05 0.02 –
13 C. spinolae 5 32.5 10.5 6.6 0.014 –
14 C. subtilesignata 9 54.9 11.8 5.71 0.001* Mixed forest
15 C. venosa 4 42.4 10.3 6.22 0.002* Riverine–grassland interface
16 C. viduata 3 55.4 12 5.58 0.001* Mixed forest
17 C. vigintiguttata 8 57 10.8 6.19 0.001* Riverine–grassland interface
18 H. pulchella 10 55.3 10.8 5.69 0.001* Pine
19 J. chloropleura 3 29.8 9.2 6.24 0.014 –
20 J. crassipalpis 5 16.7 8.6 5.16 0.035 –
21 L. striolata 10 28.4 10.4 5.92 0.024 –
22 M. melancholica 5 13.3 8.9 5.74 0.1331 –
23 M. undulata 3 31.3 9.1 5.75 0.008 –
24 N. bonelli 3 81.8 10.4 5.67 0.001* High shrub density
25 N. saphyrina 3 28.2 9.4 6 0.015 –
* Monte Carlo test of significance of observed maximum indicator value for species
999 permutations
Random number seed: 1,000
468 J Insect Conserv (2009) 13:459–473
123

overlap) were 0.5333 between C. subtilesignata and C.
grammophora; and the pair with most dissimilar resource
utilization (lowest overlap) was 0.0054 between C. flavo-
maculata and L. striolata. The third attribute analyzed was
ecological guilds that represent groups of species within a
community that share common resources. Hence, the spe-
cies within a guild may be more likely to interact or
compete for resources than are species in different guilds
and larger the C-score, the more segregation between
species. The observed C-score ranged from 99.33 for the
Cicindela guild to 457.66 for the Heptodonta guild. For the
1,000 simulated assemblages, the average C-score was
approximately 213.16 for all the eight guilds. Further, the
random result for the variance was quite high at
1,949.76300 meaning that the level of co-occurrence
among guilds is still less as would be expected if the
species were assigned randomly to different guilds. Lastly,
favored states analysis (Fox 1987, 1999; Fox and Brown
1993), that measures the distribution of species among
guilds, whether it is unusually uniform or even among
communities. Because if communities are formed by
sequentially adding species in different guilds or functional
groups, there should be an unusually large number of
favored states compared to the null model. The observed
index score was found to be 75.000 that illustrate an
unfavored state amongst tiger beetle guilds, because the
guilds were not filled as evenly as possible.
Broad assemblages of tiger beetle species in responses
to habitat variables are displayed in the form of a biplot
(biplot r2 cutoff = 0.25) derived from the canonical cor-
respondence analysis (CCA) (Fig. 8). The axis summary
statistics results of the CCA are presented in Table 7. The
arrows depict the relative influence of the habitat variables
on the composition of the tiger beetles assemblage, with
the line length relative to the other variables, rather than an
absolute degree of influence (ter Braak and Verdonschot
1995). Mixed forest habitats were characterized by high
tree and shrub density while riverine area was character-
ized by large open tracts with grass cover at the interfaces
with forest and agriculture land. Interset correlations
between habitat variables identified canopy cover (CC) and
litter as statistically significant variables and were found to
have significant influence on the species composition
across habitats (Table 7). Other habitat variables like
average tree and shrub density made only a minor signifi-
cant contribution to the observed differences in species
composition. The first axis of the CCA explained the most
variance in the data, while axes 2 explained relatively little
at the Monte-Carlo test at the 0.05 level (Table 8).
Discussion
The distribution range of tiger beetles is from about
3,500 m above mean sea level to -220 m below sea level
(Pearson and Cassola 1992) and tend to absent from
Table 6 Habitat attributes of tiger beetles across Shivalik landscape
Co occurrence
Index C-score
Observed index 299.43330
Mean of simulated indices 285.75390
Variance of simulated indices 1.18389
Niche overlap
Index Pianka index
Observed mean 0.14191
Mean of simulated indices 0.09836
Variance of simulated indices 0.00002
Guild structure
Index C-score
Observed index 213.16250
Mean of simulated indices 299.04710
Variance of simulated indices 1,949.76300
Favored state analysis
Index C-score
Observed index 75.0000
Mean of simulated indices 82.03200
Variance of simulated indices 10.66564Fig. 8 Biplot from canonical correspondence analysis showing the
distribution of 25 species of tiger beetles in relation to habitat
variables. The length of the arrow signifies the relative contribution of
that variable to the species composition, while the direction signifies
its contribution to the differences between assemblages
J Insect Conserv (2009) 13:459–473 469
123

habitats at extremely high altitudes because their fossorial
larvae cannot survive in soil that is too cold (Hadley et al.
1990). This is the first study for quantitative establishment
of these narrow habitat use patterns among tiger beetle
species of the Shivalik region in north western Himalaya.
The area is largely a sal dominated forest ecosystem and
forms an important transition point from the plains and
high mountainous regions. Further, the climatic conditions
and vegetation largely represents tropical dry deciduous
region, that favor increased insect diversity. Tiger beetles
are well known worldwide (Wiesner 1992) and general-
izations of their biodiversity are reflected in other taxa
(Pearson and Ghorpade 1989; Pearson and Cassola 1992;
Pearson and Carroll 1998, 2001), hence they are one of the
most studied taxa for conservation research. Pearson and
Cassola (1992) and Pearson (1994) have thus elaborated on
the usefulness of tiger beetles (Cicindelidae) as an indicator
taxon for monitoring and inventory studies.
The major finding of this research work is on under-
standing the habitat association of tiger beetles in relation
to key habitat variables that define their assemblage pat-
tern. It was observed that species diversity of tiger beetles
to be quite high in the riverine area irrespective of the
protected area sampled whether it was in SWLS, CWLS, or
PWLS though separated by more than hundred kilometers.
Present study of tiger beetles also provides a background
for identifying centers of species richness and abundance
within the protected areas of the Shivalik landscape. Such
studies can provide a more scientific basis by which to plan
and manage a system of protected areas around these
centers in accordance with the convention on biological
diversity (Glowka et al. 1994). Nevertheless, two habitats
stood out amongst others pertaining to the cumulative
abundance of tiger beetles viz. riverine area and mixed
forest area, as these two habitats were found to be the
repository of tiger beetles. The seasonality pattern shown
by tiger beetles was of a generalist nature, as may e found
Table 7 Results from canonical correspondence analysis (CCA) of
tiger beetle assemblage across Shivalik landscape
Axis summary statistics
Number of canonical axes 3
Total variance (‘‘inertia’’) in the species data 5.8125
Axis 1 Axis 2 Axis 3
Eigenvalue 0.540* 0.259 0.190
Variance in species data
Variance explained (%) 9.3 4.5 3.3
Cumulative explained (%) 9.3 13.8 17.0
Pearson correlation, Spp-Envt* 0.915* 0.707* 0.730
Kendall (rank) Corr., Spp-Envt 0.599* 0.457 0.417
Inter-set correlations for 9 habitat variables
Variable Correlations
Axis 1 Axis 2 Axis 3
1. Temperature -0.429 0.154 -0.156
2. Relative Humidity 0.593* -0.163 -0.064
3. pH -0.515 -0.429 -0.187
4. Org. content (%) 0.739* -0.259 0.266
5. Litter 0.868* -0.112 -0.066
6. Canopy cover 0.901* 0.016 -0.008
7. Av. GBH 0.585* 0.129 0.017
8. Average tree density 0.824* 0.101 0.056
9. Average shrub density 0.806* -0.125 0.044
Monte Carlo randomisation test, 998 runs
*P \ 0.001
Table 8 Results from canonical correspondence analysis (CCA) of tiger beetle assemblage showing correlations and biplot scores across
Shivalik landscape
Correlations and biplot scores for 9 variables
Variable Correlations* Biplot scores
Axis 1 Axis 2 Axis 3 Axis 1 Axis 2 Axis 3
1. Temperature -0.469 0.218 -0.214 -0.402 0.156 -0.141
2. Relative humidity 0.648* -0.231 -0.088 0.556* -0.165 -0.058
3. pH -0.563 -0.607 -0.257 -0.483 -0.433 -0.17
4. Org. content (%) 0.807* -0.366 0.365 0.692* -0.262 0.241
5. Litter 0.949* -0.158 -0.09 0.813* -0.113 -0.06
6. Canopy cover 0.985* 0.023 -0.011 0.844* 0.017 -0.007
7. Av. GBH 0.639* 0.182 0.024 0.548* 0.13 0.016
8. Average tree density 0.901* 0.142 0.077 0.772* 0.102 0.051
9. Average shrub density 0.881* -0.176 0.06 0.756* -0.126 0.039
Correlations are ‘‘intraset correlations’’ of ter Braak (1986)
*P \ 0.001
470 J Insect Conserv (2009) 13:459–473
123

for other insect group would do so, but the most important
thing was presence of some species like C. chloris even in
the winter season utilizing different habitat conditions.
Further, the species quickly emerged during summer sea-
son and gained peak in abundance concomitant to onset of
monsoon season. In spite of sal dominant forest ecosys-
tems, it was apparent that these were not the obvious
preference of tiger beetles. Analysis showed distinct pat-
terns of grouping amongst habitat types, and surprisingly
sal habitats were found most similar to agricultural habi-
tats. This has a severe conservation implication because
this is a direct instance of increased anthropogenic influ-
ence on forest ecosystems in these areas as species
composition was quite similar in these two habitats. Future
studies would thus give an insight into the degree of
landscape modification using tiger beetles as indicator
species. Another interesting aspect of distribution of tiger
beetles was their subdued presence in Eucalyptus, Khair
and Syzygium plantation mixed forest habitats. Again this
has some implication for the management of protected
areas for the park managers. It appears as if the habitat
conditions in these plantation mixed forests were not
appropriate for tiger beetles directly and indirectly for its
diverse prey species. Thus, for better conservation and
management of forests, it is thus indispensable to look for
the effects of plantations on local species. Though not
presented here, the authors have also observed a similar
pattern of decreased species diversity for other beetle
families like carabidae (ground beetles), scarabaeidae
(dung beetles), and stapylinidae (rove beetles) in managed
forests unlike natural stands. Further, though one would
expect tiger beetles more in open forest areas, but in our
study we found many species to be particularly fond of
forested habitats, so much so that one particular species
C. bicolor was found only in the forested habitats with
varying degree of canopy openness. Other belonging to the
genera Neocollyris preferred forested habitats with
reasonably good shrub cover to forage upon prey like
chrysomelids.
The study shows strong correlations of tiger beetle
richness with vegetation variables like floral diversity,
foliage density, shading and microhabitat temperature
(Fanelli et al. 2006) and thus indirectly on the diversity and
abundance of potential prey items for the tiger beetles.
There is considerable evidence from studies of tiger beetles
that prey abundance strongly influences the occurrence of
tiger beetle species (Pearson and Mury 1979; Pearson
1988; Pearson and Vogler 2001; Sinu et al. 2006). Inter-
esting aspect documented was the unique habitat utilization
by tiger beetles. Though all habitats had one or other kind
of species, their richness as well as abundance were quite
dissimilar. Increased habitat specificity, one of the cardinal
requirements of bioindicator species (Noss 1990; Pearson
and Cassola 1992; Pearson 1994), could be observed for
many species. Further, indicator species could be observed
for many habitat conditions, like canopy cover and eco-
tones. Although habitat loss is often a major cause of
biodiversity loss (Desender 1989), often by this time many
management options are no longer available. Using sensi-
tive bioindicators to detect more subtle and earlier
perturbations may be significant for habitat management by
making remedial action less costly and timelier. Such
habitat use patterns are thus critical both in justifying the
use of these tiger beetles as surrogates and in establishing a
baseline in long term monitoring.
In spite of good pragmatic abundance of tiger beetles,
they showed a low degree of co-occurrence and niche
overlap suggesting increased resource partitioning and
judicious microhabitat utilization by adult tiger beetles
along the lines of the Gause’s law of competitive dis-
placement (DeBach 1966). This was also reflected in the
feeding guilds, as many of the species though belonging to
same guild showed circadian and temporal variation and
occupying different microhabitats with respect to feeding
and reproduction. Also, many species were separated sea-
sonally and had different times of emergence and peak
populations. Present study also provide a firm basis to
interpret changes in microclimatic conditions, caused by
humans directly or though long term climate change by
monitoring these species. For example, if future fires, over
grazing, tourism pressure or other human perturbations are
imposed intentionally or unintentionally on forest ecosys-
tems of Shivalik Himalaya, we now have a barometer to
quickly and readily measure the cause and effect of
impacts. Presence-absence data as well as population
trends of the tiger beetle species in respective habitats can
warn us of impending changes to the entire habitat long
before they become evident in other inhabitants of these
habitats, such as the more long-lived and less sensitive
vertebrates and plants. In addition, results from studies at
this relatively small spatial scale may have ramifications
for other areas and at larger scales. Several of the tiger
beetle species observed in this study are widely distributed
across Asia. Their sensitivities and usefulness as bioindi-
cators of habitat perturbation might well extend over their
entire ranges (Carroll and Pearson 1998). So, tiger beetles
as bioindicators should be the excellent candidates for long
term monitoring of forest ecosystems, ecosystem health
and its measurement over a variety of landscapes.
Conservation implications
Future studies of tiger beetles as bioindicators also need to
focus on their response to specific prey and other less
defined biotic or abiotic factors, within the context of
J Insect Conserv (2009) 13:459–473 471
123

dynamic successional stages of each habitat, whether
naturally caused or from the influence of humans. Several
claims have been made that the larval forms of tiger
beetles are even more specialized in habitat than the
adults. The larvae in their tunnels are more difficult to
observe, but they are also easier to use in laboratory
experiments about the influence of feeding regimes,
temperature, predation and competition on survival and
fecundity (Pearson and Vogler 2001). An advantage of
such biomonitoring is its comparatively low cost and the
integrative recording character of ecosystems on the other
(Franzle 2006). Such ecological risk assessment and
environmental monitoring are potentially complimentary
activities (Suter 2001). Monitoring a few indicator species
therefore is a widely used method to measure the eco-
logical sustainability and ecosystem health since it is
often so difficult to measure and monitor the natural
or anthropogenic induced landscape modification and
their effects on all species or environmental conditions
(Landres et al. 1988; Kuliopulos 1990; Hilden and
Rapport 1993; Kremen et al. 1993). The high degree of
habitat specificity among the tiger beetle species in these
protected areas are similar to that found in tiger beetle
species around the world (Pearson and Vogler 2001).
Since specialization is usually associated with sensitivity
to habitat alteration (Pyle et al. 1981; Rosenberg et al.
1986; Pearson 1994), identifying the costs and benefits of
a monitoring program will assist in the prioritization
process more frequently, as the true costs of monitoring
are not recognized and are, therefore, underestimated.
Benefits from such monitoring studies are rarely evalu-
ated, because they are difficult to quantify (Caughlan and
Oakley 2001). An ecosystem health approach is thus
needed as it also allows for a more explicit connection
between the state of the environment and human well
being (Rapport et al. 1998; Rapport and Singh 2006).
Even though the current study has focused mainly on
protected areas in the Shivalik landscape with its diverse
habitat types, extrapolating the present study to different
forest habitat types in different parts of the landscape and
to even different geographical regions with different land
use patterns would definitely strengthen our knowledge of
response of bioindicators to various disturbance variables.
Environmental monitoring should thus determine the sta-
tus and trends to determine whether the environment is
improving or not (Montreal Process 2000). Continuous
efforts are a prerequisite to make gathering of future data
and continued monitoring as simple as possible. With this
quality added to the biological characters that make tiger
beetles so ideal, park guards, local volunteers, and resi-
dents can become involved with minimal training and
maximum input into management plans and execution.
Acknowledgments We are thankful to the Director and Dean,
Wildlife Institute of India and Himachal Pradesh forest department
for necessary financial, logistical support and permissions to carry out
the study. Thanks to Dr. P K. Mathur, Department of Landscape
Level Planning and Management for suggestions and guidance to
undertake the study in Shivalik landscape. We are also thankful to
Drs. P. Tiwari and H.R. Pajni, Punjab University, Chandigarh, for
identification of tiger beetles and Mr. Upamanyu Hore for fruitful
discussions on statistical analyses. R. Padmawathe and Swati Kittur
carried out the initial fieldwork under the project. Dr. D. L. Pearson,
Arizona State University, Arizona, USA, critically reviewed several
drafts of this article. The Department of Science and Technology
(DST), Ministry of Science and Technology, Government of India
and Ministry of Human Resource Development Group-Council for
Scientific and Industrial Research (HRDG-CSIR) funded this
research. We are also grateful to two anonymous referees for their
constructive comments that were of great help in finalizing the article.
References
Acciavatti RE, Pearson DL (1989) The tiger beetle genus Cicindela(Coleoptera, Insecta) from the Indian Subcontinent. Ann Carne-
gie Mus 58:77–353
Bhargav V, Uniyal VP (2008) Communal roosting of tiger beetles
(Cicindelidae: Coleoptera) in the Shivalik hills, Himachal
Pradesh, India. Cicindela 40:1–12
Bouyoucos GJ (1962) Hydrometer method improved for making
particle size analysis for soils. Agron J 54:464
Bulla L (1994) An index of evenness and its associated diversity
measure. Oikos 70:167–171
Camargo JA (1995) On measuring species evenness and other
associated parameters of community structure. Oikos 74:538–
542
Carroll SS, Pearson DL (1998) Spatial modeling of butterfly species
richness using tiger beetles (Cicindelidae) as a bioindicator
taxon. Ecol Appl 8:531–543
Cassola F, Pearson DL (2000) Global patterns of tiger beetle species
richness (Coleoptera: Cicindelidae): their use in conservation
planning. Biol Conserv 95:197–208
Caughlan L, Oakley KL (2001) Cost considerations for long-term
ecological monitoring. Ecol Indic 1:123–134
Curtis JT (1959) The vegetation of Wisconsin. An ordination of plant
communities. University Wisconsin press, Wisconsin
DeBach P (1966) The competitive displacement and coexistence
principles. Ann Rev Entomol 11:183–212
Desender K (1989) Loss of habitats and changes in the composition of
the ground and tiger beetle fauna in four western European
countries since 1950 (Coleoptera: Carabidae, Cicindelidae). Biol
Conserv 48:277–294
Dufrene M, Legendre P (1997) Species assemblages and indicator
species: the need for a flexible asymmetrical approach. Ecol
Monogr 67:345–366
Faith KH, Young TP, Carreiro MM (1998) Forest leaf litter quantity
and seedling occurrence along an urban-rural gradient. Urban
Ecosyst 2:263–278 Kluwer
Fanelli G, Tescarollo P, Testi A (2006) Ecological indicators applied
to urban and suburban floras. Ecol Indic 6:444–457
Fox BJ (1987) Species assembly and the evolution of community
structure. Evol Ecol 1:201–213
Fox BJ (1999) The genesis and development of guild assembly rules.
In: Weiher E, Keddy P (eds) Ecological assembly rules:
perspectives, advances retreats. Cambridge University Press,
Cambridge, pp 23–57
472 J Insect Conserv (2009) 13:459–473
123

Fox BJ, Brown JH (1993) Assembly rules for functional groups in
North American desert rodent communities. Oikos 67:358–370
Franzle O (2006) Complex bioindication and environmental stress
assessment. Ecol Indic 6:114–136
Gaston AJ (1985) Report on a visit to Pong Dam Lake, 2–3
December. Canadian Wildlife Service, Ottawa
Gaston AJ (1986) West Himalayan wildlife survey. Report on
activities in 1985
Glowka L, Burnhenne-Guilmin F, Synge H, Mc Neely JA, Gundling
L (1994) A guide to the convention on biological diversity.
IUCN, Gland
Gotelli NJ, Entsminger GL (2001) EcoSim: null models software for
ecology. Version 7.0. Acquired intelligence inc. and Kesey Bear.
Online at http://homepages.together.net/*gentsmin/ecosim.htm
Hadley NF, Knisley CB, Schultz TD, Pearson DL (1990) Water
relations of tiger beetle larvae (Cicindela marutha): correlations
with habitat microclimate and burrowing activity. J Arid Environ
19:189–197
Hilden M, Rapport DJ (1993) Four centuries of cumulative impacts
on a Finnish river and its estuary; an ecosystem health approach.
J Aquat Ecosyst Health 2:261–275
Kremen C, Colwell RK, Erwin TL, Murphy DD, Noss RF, Sanjayan
MA (1993) Terrestrial arthropod assemblages: their use in
conservation planning. Conserv Biol 7:796–808
Kuliopulos H (1990) Amazonian biodiversity. Science 248:1305
Landres PB, Verner J, Thomas JW (1988) Ecological uses of
vertebrate indicator species: a critique. Conserv Biol 2:316–328
McAleece N, Lambshead PJD, Paterson GLJ (1997) Natural history
museum and the Scottish association for marine Science.
http://www.nhm.ac.uk/zoology/bdpro
McCune B, Mefford MJ (1999) Multivariate analysis of ecological
data, version 4.26.MjM Software Design. Gleneden Beach,
Oregon
Montreal Process (2000) Montreal Process Year 2000. Progress
report: progress and innovation in implanting criteria and
indicators for the conservation of sustainable management of
temperate and boreal forests. The Montreal Process Liaison
Office, Canadian Forest Service, Ottawa, Canada
Naviaux R (1994) Les Collyris (Coleoptera, Cicindelidae): revison de
genres et description de nouveaux taxons. Soc linn de Lyon
63:106–290
Naviaux R (2002) Les Tricondylina (Coleoptera, Cicindelidae):
revison de genres Tricondyla Latreille et Derocrania Chaudoir
et descriptions de nouveaux taxons. Soc entomol France 5:1–106
Noss RF (1990) Indicators for monitoring biodiversity: a hierarchical
approach. Conserv Biol 4:355–364
Pearson DL (1988) Biology of tiger beetles. Ann Rev Entomol
33:123–147
Pearson DL (1994) Selecting indicator taxa for the quantitative
assessment of biodiversity. Philos Trans R Soc London B
345:75–79
Pearson DL, Anderson JJ (1985) Perching heights and nocturnal
communal roosts of some tiger beetles (Coleoptera: Cicindeli-
dae) in southeastern Peru. Biotropica 17:126–129
Pearson DL, Carroll SS (1998) Global patterns of species richness:
spatial models for conservation planning using bioindicator and
precipitation data. Conserv Biol 12:809–821
Pearson DL, Carroll SS (2001) Predicting patterns of tiger beetle
(Coleoptera: Cicindelidae) species richness in northwestern
South America. Stud Neotrop Fauna Environ 36:123–134
Pearson DL, Cassola F (1992) Worldwide species richness patterns of
tiger beetles (Coleoptera: Cicindelidae): indicator taxon for
biodiversity and conservation studies. Conserv Biol 6:376–391
Pearson DL, Ghorpade K (1989) Geographical distribution and
ecological history of tiger beetles (Coleoptera: Cicindelidae) of
the Indian subcontinent. J Biogeogr 16:333–344
Pearson DL, Mury EJ (1979) Character divergence and convergence
among tiger beetles (Coleoptera: Cicindelidae). Ecology 60:
557–566
Pearson DL, Vogler P (2001) Tiger beetles: the evolution, ecology,
and diversity of the cicindelids. Cornell University Press, Ithaca
Pianka ER (1973) The structure of lizard communities. Ann Rev Ecol
System 4:53–74
Pielou EC (1969) An introduction to mathematical ecology. Wiley,
New York
Pyle R, Bentzien M, Opler P (1981) Insect conservation. Ann Rev
Entomol 26:233–258
Rapport DJ, Singh A (2006) An ecohealth-based framework for state
of environment reporting. Ecol Indic 6:409–428
Rapport DJ, Costanza R, Epstein P, Gaudet C, Levins R (eds) (1998)
Ecosystem Health. Blackwell Science, Oxford
Rodgers WA, Panwar HS, Mathur VB (2002) Wildlife protected area
network in India: a review, Wildlife Institute of India, Dehradun
Rodriguez JP, Pearson DL, Barrera RR (1998) A test for the adequacy
of bioindicator taxa: are tiger beetles (Coleoptera: Cicindelidae)
appropriate indicators for monitoring the degradation of tropical
forests in Venezuela? Biol Conserv 83:69–76
Rosenberg DM, Danks HV, Lehmkuhl DM (1986) Importance of
insects in environment impact assessment. Environ Manag
10:773–783
Shannon CE, Weaver W (1949) The mathematical theory of
communication. University of Illinois Press, Urbana
Sinu PA, Nasser M, Rajan PD (2006) Feeding fauna and foraging
habits of tiger beetles found in agro-ecosystems in western ghats,
India. Biotropica 38:500–507
SPSS 16.0 (2007) for Windows, Rel. 09.13. Chicago: SPSS Inc
Stone L, Roberts A (1990) The checkerboard score and species
distributions. Oecologia 85:74–79
Suter GW (2001) Applicability of indicator monitoring to ecological
risk assessment. Ecol Indic 1:101–112
ter Braak CJF (1986) Canonical correspondence analysis: a new
eigenvector technique for multivariate direct gradient analysis.
Ecology 67:1167–1179
ter Braak CJF, Verdonschot PFM (1995) Canonical correspondence
analysis and related multivariate methods in aquatic ecology.
Aquat Sci 57:255–289
Uniyal VP, Bhargav V (2007) Tiger beetles–a field study in the
Shivaliks of Himachal Pradesh. Wildlife Institute of India,
Dehradun
Walkley AJ, Black TA (1934) Estimation of soil organic carbon by
the chromic acid titration method. Soil Sci 37:29–38
Wiesner J (1992) Verzeichnis der Sandlaufkafer der Welt. Checklist
of the tiger beetles of the world (Coleoptera, Cicindelidae).
Verlag Erna Bauer, Keltern
J Insect Conserv (2009) 13:459–473 473
123