Distinct Cell-Autonomous Functions of RETINOBLASTOMA ... · Based on the sulfadiazin resistance...
12
Distinct Cell-Autonomous Functions of RETINOBLASTOMA-RELATED in Arabidopsis Stem Cells Revealed by the Brother of Brainbow Clonal Analysis System W Guy Wachsman, Renze Heidstra, and Ben Scheres 1 Department of Biology, Utrecht University, 3584 CH Utrecht, The Netherlands Mutations that cause lethality in the gametophyte phase pose a major challenge for studying postfertilization gene function. When both male and female haploid cells require a functional gene copy, null alleles cause developmental arrest before the formation of the zygote, precluding further investigation. The Arabidopsis thaliana Rb homolog RETINOBLASTOMA-RELATED (RBR) has an important function in the stem cell niche, but its requirement in both male and female gametophytes has prevented full loss-of-function studies. To circumvent this obstacle, we designed a clonal deletion system named BOB (Brother of Brainbow) in which null mutant sectors marked by double fluorescence are generated in a fully complemented wild- type background. In this system, both copies of a complementing RBR transgene are eliminated by tissue-specific and inducible CRE expression, and homozygous mutant clones can be distinguished visually. Since mutant sectors can be produced in a homozygous, rather than a heterozygous, background, this system facilitates clonal deletion analysis not only for gametophytic lethal alleles but also for any type of mutation. Using the BOB system, we show that RBR has unique cell- autonomous functions in different cell types within the root stem cell niche. INTRODUCTION Gene function in multicellular organisms is often revealed through phenotypes conferred by null alleles. However, early requirements for a functional gene product can block develop- ment at early stages and prevent studies of later stages. In addition, subtle molecular and cellular changes may precede clear phenotypic characteristics, creating difficulties in assess- ing the time of onset of first defects. Currently, two main strategies are used to bypass these problems, both relying on cell-specific gene knockout or knock- down. First, silencing small RNAs (Schwab et al., 2006; Ossowski et al., 2008) can be driven by tissue-specific promoters to facilitate transcript degradation or block translation but are unlikely to completely abolish gene function (Brummelkamp et al., 2002). In addition, small RNAs can move between cell layers and even systemically (Winston et al., 2002; Yoo et al., 2004); thus, their knockdown effect is not fully constrained. Furthermore, small interfering RNAs can influence nontargeted genes (off-targets; Jackson et al., 2003). A second strategy uses manipulation of the DNA to eliminate the coding sequence of a gene of interest (GOI) in desired regions creating a local loss of function. All currently available methods for generating such genetic null sectors are based on loss of heterozygosity. Cells in heterozygotes are depleted of their single wild-type allele, forming a homozygous mutant clone, which is visibly marked (e.g., by a fluorescent protein) in a cell-autonomous manner. Loss of heterozygosity can be induced by several techniques, such as irradiation or site-specific recombination, using the yeast Flp/FRT or the bacteriophage Cre/lox systems (Hoess et al., 1982; McLeod et al., 1986). In animal systems, recombinase enzymes have been expressed tissue specifically and engineered to be inducible (Metzger et al., 1995). Despite their versatility, these systems cannot be readily implemented for mutations in genes that are essential for the production of both gametes, for which heterozygous progenies are rare. In Arabidopsis thaliana, stem cells are exquisitely sensitive to the dosage of the Retinoblastoma homolog, RBR. Based on hypomorphic mutants, a specific role for this factor has been proposed in the maintenance of the quiescent center (QC), a slowly dividing organizer cell population within the niche, and in progression from the stem cell state toward differentiation (Wildwater et al., 2005). Analysis of RBR functions in the shoot meristem also reported roles in differentiation (Wyrzykowska et al., 2006). However, female gametophytes strictly require the wild-type RBR allele, while transmission of mutant alleles through the male gametophyte has an efficiency of <10% (Ebel et al., 2004). Hence, generating hetero- or hemizygous progenies for clonal deletion analysis by loss of heterozygosity is extremely inefficient; thus, previously described clonal deletion systems (Muzumdar et al., 2007; Adamski et al., 2009) are not applicable for comprehensive analysis of RBR function in the stem cell niche. To circumvent this limitation, we designed a clonal dele- tion system named BOB (Brother of Brainbow), which allows for region-specific formation of null mutant cells and their detection by double fluorescence in a background harboring two wild-type 1 Address correspondence to [email protected]. The authors responsible for distribution of materials integral to the findings presented in this article in accordance with the policy described in the Instructions for Authors (www.plantcell.org) are: Guy Wachsman ([email protected]), Renze Heidstra ([email protected]), and Ben Scheres ([email protected]). W Online version contains Web-only data. www.plantcell.org/cgi/doi/10.1105/tpc.111.086199 This article is a Plant Cell Advance Online Publication. The date of its first appearance online is the official date of publication. The article has been edited and the authors have corrected proofs, but minor changes could be made before the final version is published. Posting this version online reduces the time to publication by several weeks. The Plant Cell Preview, www.aspb.org ã 2011 American Society of Plant Biologists. All rights reserved. 1 of 11
Transcript of Distinct Cell-Autonomous Functions of RETINOBLASTOMA ... · Based on the sulfadiazin resistance...
Distinct Cell-Autonomous Functions ofRETINOBLASTOMA-RELATED in Arabidopsis Stem CellsRevealed by the Brother of Brainbow Clonal Analysis System W
Guy Wachsman, Renze Heidstra, and Ben Scheres1
Department of Biology, Utrecht University, 3584 CH Utrecht, The Netherlands
Mutations that cause lethality in the gametophyte phase pose a major challenge for studying postfertilization gene function.
When both male and female haploid cells require a functional gene copy, null alleles cause developmental arrest before the
formation of the zygote, precluding further investigation. The Arabidopsis thaliana Rb homolog RETINOBLASTOMA-RELATED
(RBR) has an important function in the stem cell niche, but its requirement in both male and female gametophytes has
prevented full loss-of-function studies. To circumvent this obstacle, we designed a clonal deletion system named BOB
(Brother of Brainbow) in which null mutant sectors marked by double fluorescence are generated in a fully complemented wild-
type background. In this system, both copies of a complementing RBR transgene are eliminated by tissue-specific and
inducible CRE expression, and homozygous mutant clones can be distinguished visually. Since mutant sectors can be
produced in a homozygous, rather than a heterozygous, background, this system facilitates clonal deletion analysis not only
for gametophytic lethal alleles but also for any type of mutation. Using the BOB system, we show that RBR has unique cell-
autonomous functions in different cell types within the root stem cell niche.
INTRODUCTION
Gene function in multicellular organisms is often revealed
through phenotypes conferred by null alleles. However, early
requirements for a functional gene product can block develop-
ment at early stages and prevent studies of later stages. In
addition, subtle molecular and cellular changes may precede
clear phenotypic characteristics, creating difficulties in assess-
ing the time of onset of first defects.
Currently, two main strategies are used to bypass these
problems, both relying on cell-specific gene knockout or knock-
down. First, silencing small RNAs (Schwab et al., 2006;Ossowski
et al., 2008) can be driven by tissue-specific promoters to
facilitate transcript degradation or block translation but are
unlikely to completely abolish gene function (Brummelkamp
et al., 2002). In addition, small RNAs can move between cell
layers and even systemically (Winston et al., 2002; Yoo et al.,
2004); thus, their knockdown effect is not fully constrained.
Furthermore, small interfering RNAs can influence nontargeted
genes (off-targets; Jackson et al., 2003). A second strategy uses
manipulation of the DNA to eliminate the coding sequence of a
gene of interest (GOI) in desired regions creating a local loss of
function. All currently available methods for generating such
genetic null sectors are based on loss of heterozygosity. Cells
in heterozygotes are depleted of their single wild-type allele,
forming a homozygous mutant clone, which is visibly marked
(e.g., by a fluorescent protein) in a cell-autonomous manner.
Loss of heterozygosity can be induced by several techniques,
such as irradiation or site-specific recombination, using the yeast
Flp/FRT or the bacteriophage Cre/lox systems (Hoess et al., 1982;
McLeod et al., 1986). In animal systems, recombinase enzymes
have been expressed tissue specifically and engineered to be
inducible (Metzger et al., 1995). Despite their versatility, these
systems cannot be readily implemented for mutations in genes
that are essential for the production of both gametes, for which
heterozygous progenies are rare.
In Arabidopsis thaliana, stem cells are exquisitely sensitive to
the dosage of the Retinoblastoma homolog, RBR. Based on
hypomorphic mutants, a specific role for this factor has been
proposed in the maintenance of the quiescent center (QC), a
slowly dividing organizer cell population within the niche, and
in progression from the stem cell state toward differentiation
(Wildwater et al., 2005). Analysis of RBR functions in the shoot
meristem also reported roles in differentiation (Wyrzykowska
et al., 2006). However, female gametophytes strictly require the
wild-type RBR allele, while transmission of mutant alleles
through the male gametophyte has an efficiency of <10% (Ebel
et al., 2004). Hence, generating hetero- or hemizygous progenies
for clonal deletion analysis by loss of heterozygosity is extremely
inefficient; thus, previously described clonal deletion systems
(Muzumdar et al., 2007; Adamski et al., 2009) are not applicable
for comprehensive analysis of RBR function in the stem cell
niche. To circumvent this limitation, we designed a clonal dele-
tion system named BOB (Brother of Brainbow), which allows for
region-specific formation of null mutant cells and their detection
by double fluorescence in a background harboring twowild-type
1Address correspondence to [email protected] authors responsible for distribution of materials integral to thefindings presented in this article in accordance with the policy describedin the Instructions for Authors (www.plantcell.org) are: Guy Wachsman([email protected]), Renze Heidstra ([email protected]), and BenScheres ([email protected]).WOnline version contains Web-only data.www.plantcell.org/cgi/doi/10.1105/tpc.111.086199
This article is a Plant Cell Advance Online Publication. The date of its first appearance online is the official date of publication. The article has been
edited and the authors have corrected proofs, but minor changes could be made before the final version is published. Posting this version online
reduces the time to publication by several weeks.
The Plant Cell Preview, www.aspb.org ã 2011 American Society of Plant Biologists. All rights reserved. 1 of 11
gene copies. We used the BOB system for analysis of the
gametophytic lethal RBR gene and show that RBR is autono-
mously required in QC and columella stem cells to limit prolifer-
ation and in columella daughters to promote differentiation.
RESULTS
The BOB System for Generating Marked Homozygous
Deletion Clones
The basic strategy behind the BOB clonal deletion system is
that each cell, carrying the homozygous mutant (gametophytic-
essential) allele for the GOI, also harbors a single homozygous
insertion of the BOB construct, which contains the complement-
ing GOI cloned within it and flanked by lox sites. Induced Cre-
dependent recombination mediates the loss of both transgenic
copies of the complementing GOI, thus producing null sectors
within a wild-type plant. To generate the BOB construct, we
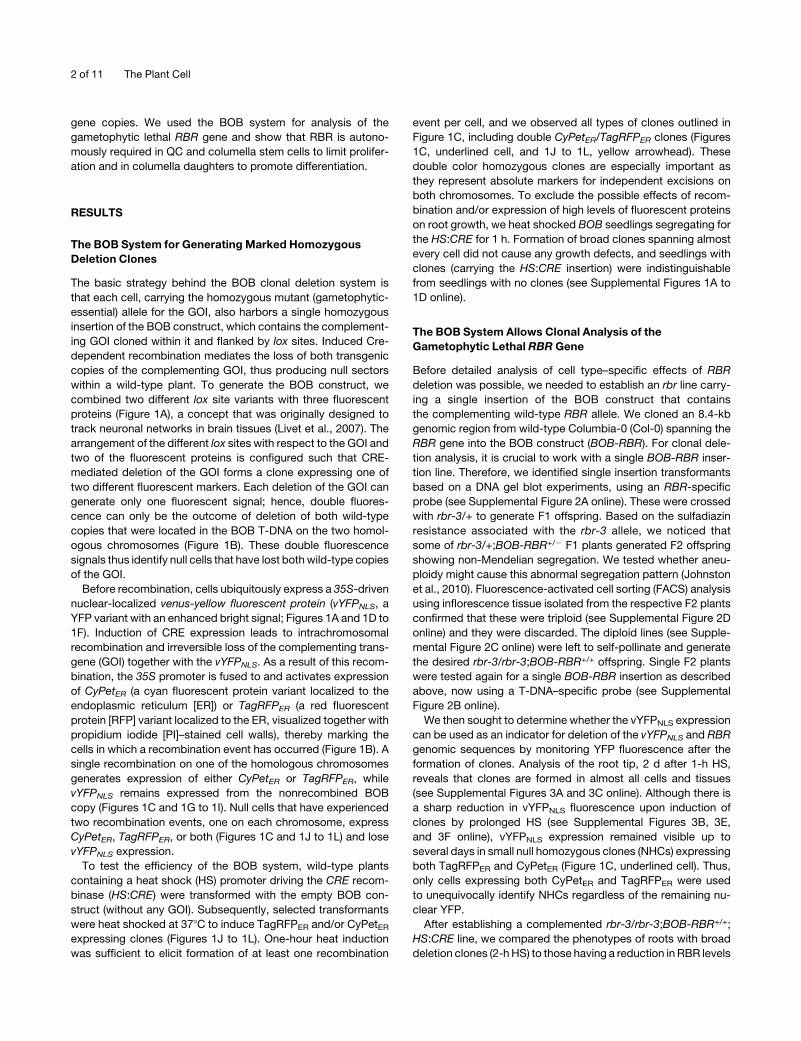
combined two different lox site variants with three fluorescent
proteins (Figure 1A), a concept that was originally designed to
track neuronal networks in brain tissues (Livet et al., 2007). The
arrangement of the different lox sites with respect to the GOI and
two of the fluorescent proteins is configured such that CRE-
mediated deletion of the GOI forms a clone expressing one of
two different fluorescent markers. Each deletion of the GOI can
generate only one fluorescent signal; hence, double fluores-
cence can only be the outcome of deletion of both wild-type
copies that were located in the BOB T-DNA on the two homol-
ogous chromosomes (Figure 1B). These double fluorescence
signals thus identify null cells that have lost bothwild-type copies
of the GOI.
Before recombination, cells ubiquitously express a 35S-driven
nuclear-localized venus-yellow fluorescent protein (vYFPNLS, a
YFP variant with an enhanced bright signal; Figures 1A and 1D to
1F). Induction of CRE expression leads to intrachromosomal
recombination and irreversible loss of the complementing trans-
gene (GOI) together with the vYFPNLS. As a result of this recom-
bination, the 35S promoter is fused to and activates expression
of CyPetER (a cyan fluorescent protein variant localized to the
endoplasmic reticulum [ER]) or TagRFPER (a red fluorescent
protein [RFP] variant localized to the ER, visualized together with
propidium iodide [PI]–stained cell walls), thereby marking the
cells in which a recombination event has occurred (Figure 1B). A
single recombination on one of the homologous chromosomes
generates expression of either CyPetER or TagRFPER, while
vYFPNLS remains expressed from the nonrecombined BOB
copy (Figures 1C and 1G to 1I). Null cells that have experienced
two recombination events, one on each chromosome, express
CyPetER, TagRFPER, or both (Figures 1C and 1J to 1L) and lose
vYFPNLS expression.
To test the efficiency of the BOB system, wild-type plants
containing a heat shock (HS) promoter driving the CRE recom-
binase (HS:CRE) were transformed with the empty BOB con-
struct (without any GOI). Subsequently, selected transformants
were heat shocked at 378C to induce TagRFPER and/or CyPetERexpressing clones (Figures 1J to 1L). One-hour heat induction
was sufficient to elicit formation of at least one recombination
event per cell, and we observed all types of clones outlined in
Figure 1C, including double CyPetER/TagRFPER clones (Figures
1C, underlined cell, and 1J to 1L, yellow arrowhead). These
double color homozygous clones are especially important as
they represent absolute markers for independent excisions on
both chromosomes. To exclude the possible effects of recom-
bination and/or expression of high levels of fluorescent proteins
on root growth, we heat shocked BOB seedlings segregating for
the HS:CRE for 1 h. Formation of broad clones spanning almost
every cell did not cause any growth defects, and seedlings with
clones (carrying the HS:CRE insertion) were indistinguishable
from seedlings with no clones (see Supplemental Figures 1A to
1D online).
The BOB System Allows Clonal Analysis of the
Gametophytic Lethal RBR Gene
Before detailed analysis of cell type–specific effects of RBR
deletion was possible, we needed to establish an rbr line carry-
ing a single insertion of the BOB construct that contains
the complementing wild-type RBR allele. We cloned an 8.4-kb
genomic region from wild-type Columbia-0 (Col-0) spanning the
RBR gene into the BOB construct (BOB-RBR). For clonal dele-
tion analysis, it is crucial to work with a single BOB-RBR inser-
tion line. Therefore, we identified single insertion transformants
based on a DNA gel blot experiments, using an RBR-specific
probe (see Supplemental Figure 2A online). These were crossed
with rbr-3/+ to generate F1 offspring. Based on the sulfadiazin
resistance associated with the rbr-3 allele, we noticed that
some of rbr-3/+;BOB-RBR+/2 F1 plants generated F2 offspring
showing non-Mendelian segregation. We tested whether aneu-
ploidy might cause this abnormal segregation pattern (Johnston
et al., 2010). Fluorescence-activated cell sorting (FACS) analysis
using inflorescence tissue isolated from the respective F2 plants
confirmed that these were triploid (see Supplemental Figure 2D
online) and they were discarded. The diploid lines (see Supple-
mental Figure 2C online) were left to self-pollinate and generate
the desired rbr-3/rbr-3;BOB-RBR+/+ offspring. Single F2 plants
were tested again for a single BOB-RBR insertion as described
above, now using a T-DNA–specific probe (see Supplemental
Figure 2B online).
We then sought to determine whether the vYFPNLS expression
can be used as an indicator for deletion of the vYFPNLS and RBR
genomic sequences by monitoring YFP fluorescence after the
formation of clones. Analysis of the root tip, 2 d after 1-h HS,
reveals that clones are formed in almost all cells and tissues
(see Supplemental Figures 3A and 3C online). Although there is
a sharp reduction in vYFPNLS fluorescence upon induction of
clones by prolonged HS (see Supplemental Figures 3B, 3E,
and 3F online), vYFPNLS expression remained visible up to
several days in small null homozygous clones (NHCs) expressing
both TagRFPER and CyPetER (Figure 1C, underlined cell). Thus,
only cells expressing both CyPetER and TagRFPER were used
to unequivocally identify NHCs regardless of the remaining nu-
clear YFP.
After establishing a complemented rbr-3/rbr-3;BOB-RBR+/+;
HS:CRE line, we compared the phenotypes of roots with broad
deletion clones (2-hHS) to those having a reduction in RBR levels
2 of 11 The Plant Cell
as previously described (Wildwater et al., 2005). Indeed, using
the BOB system, we observed similar phenotypes (i.e., prolifer-
ation in the stem cell niche, inhibition of differentiation in the
columella, and cell death in columella and vascular tissues) (see
Supplemental Figure 4 online; see below). Together with the
reduction in vYFPNLS expression, the similarity between these
phenotypes indicates that BOB clones truly represent excision of
the genomic RBR sequence.
Tissue-Specific Generation of BOB Clones
Our previous experiences indicated that it is difficult to obtain
specific and small clones in the QC and stem cells upon HS
induction using the HS:CRE construct (Heidstra et al., 2004). We
applied a two-step strategy to overcome these difficulties. First,
we used a CRE-GR (for CRE recombinase, fused to the ligand
binding domain of a mutated human glucocorticoid receptor)
protein fusion (Brocard et al., 1998), which allows activation of
CRE by inducing its nuclear translocation upon dexamethasone
(dex) application. Second, we combined this fusion with several
tissue-specific promoters to drive transcription ofCRE-GR in the
particular tissues of interest. We then transformed rbr-3/rbr-3;
BOB-RBR+/+ lines with these constructs. This system for tissue-
specific CRE-GR activation allowed significant enrichment of
clones in desired regions (Table 1). We applied several pro-
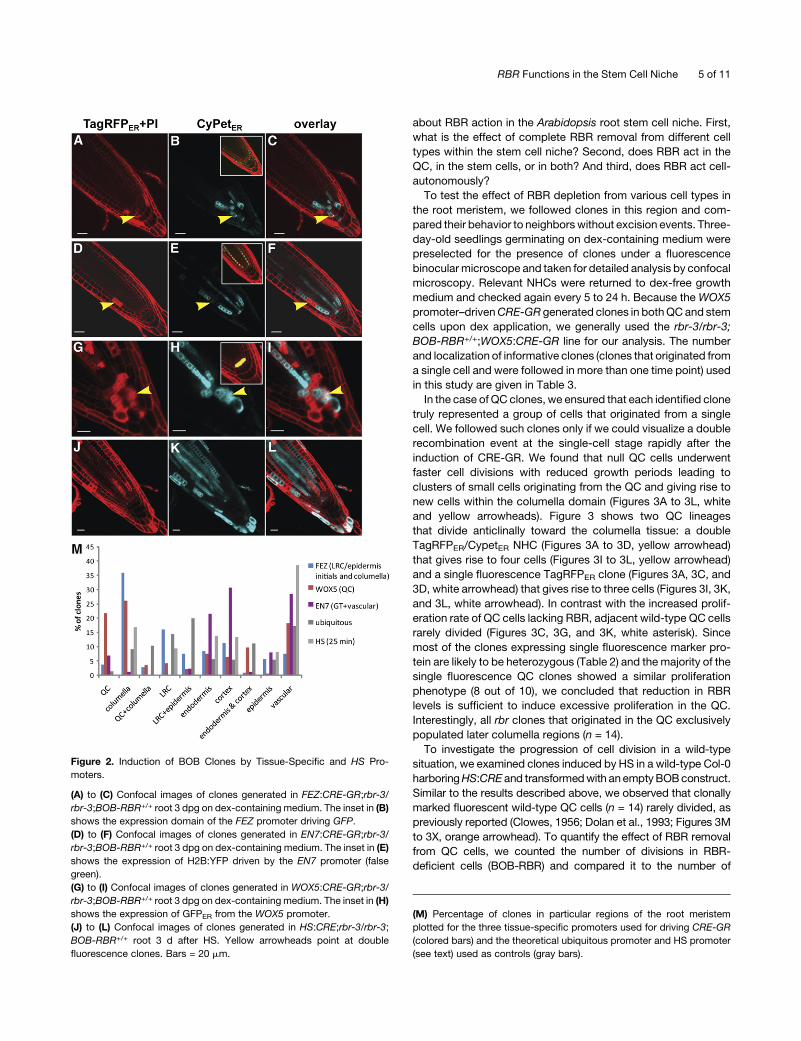
moters, amongwhich the FEZ promoter driving expression in the
columella and epidermis/lateral root cap stem cells and their
daughters (Figure 2B, inset; Willemsen et al., 2008), the EN7
promoter driving expressionmainly in the endodermis (Figure 2E,
inset; Heidstra et al., 2004), and the WOX5 promoter driving
expression in the QC (Figure 2H, inset; Blilou et al., 2005). Almost
60% of the clones induced upon dex treatment of FEZ-driven
CRE-GR were formed in the columella, lateral root cap, or distal
epidermis, as expected (Figures 2A to 2C, Table 1). Dex induc-
tion of CRE-GR expressed from the EN7 promoter facilitated
selection of clones in the meristematic ground tissue and vas-
cular tissue (Figures 2D to 2F, Table 1). Upon dex application,
WOX5 promoter–driven CRE-GR resulted in recombination and
generation of deletion clones in theQC (22%of the clones) and in
the surrounding stem cells (Figures 2G to 2I, Table 1).
To evaluate how efficient these promoters are for generat-
ing tissue-specific clones, we compared the percentage of
Figure 1. Induction and Analysis of Clones Using the BOB System.
(A) and (B) The BOB construct before (A) and after (B) CRE-mediated
recombination as indicated by dashed lines. Recombination between
lox2272 sites (i) fuses the 35S promoter with CypetER. A transcriptional
terminator (data not shown) at the 59 of CyPetER prevents TagRFPER
expression. Recombination between loxN sites fuses the 35S promoter
to TagRFPER (ii). Colored, filled objects represent active 35S promoter
(green), transcribed fluorescent proteins (yellow, cyan, and red), lox sites
(gray triangles), and a multicloning site (blue) for cloning a GOI (black).
White filled objects represent nonactive modules (i.e., CyPetER and
TagRFPER before recombination and lox sites after recombination).
(C) Illustration of possible fluorescently marked cells resulting from one
recombination (top) or two recombination events (bottom). Underlined
cell depicts the type of clones that were used to identify NHCs in all
analyses.
(D) to (F) Confocal images of BOB-RBR roots prior to CRE induction.
Visualization of PI-marked cell walls in the red channel (D), vYFPNLS
expression prior to CRE induction in the yellow channel (E), and their
overlay (F).
(G) to (I) Confocal images of a root tip with two highlighted single
recombination clones (dashed enclosure) visualized 5 d postinduction.
Highlighted clones analyzed in the cyan channel (CyPetER; [G]), the
yellow channel (vYFPNLS; [H]), and in the overlay (I).
(J) to (L) Efficient clone formation using the BOB system upon 1-h HS
induction. Clones in a HS:CRE;BOB root tip 3 d after HS induction are
shown in the red channel (PI + TagRFPER; [J]), the cyan channel
(CyPetER; [K]), and overlay (double fluorescence; [L]). Representative
CyPetER, TagRFPER, and double fluorescence clones are denoted by
purple, white, and yellow arrowheads, respectively. Bars = 20 mm.
RBR Functions in the Stem Cell Niche 3 of 11
tissue-specific clones to two nonspecific alternatives, based on
frequencies given in Table 1 (Figure 2M): (1) A theoretical ubiq-
uitous promoter that is expected to generate clones with similar
chance for each cell and (2) the HS promoter (Figures 2J to 2L).
The region that was selected for counting the number of cells and
the number of clones spans 100 mm shootward of the QC to the
distal most columella cells. For example, the QC cells constitute
;1.3% of the cells in the root meristem; thus, a truly ubiquitous
promoter would be expected to induce QC clones in 1.3% of the
cases. The percentage of QC clones generated using theWOX5
promoter was almost 20 times higher than the percentage of QC
cells in the root meristems, while the HS promoter never induced
clones in QC cells (P # 0.0001 for both comparisons; Fisher’s
exact test). The relative number of clones induced by the FEZ
promoter in the columella was 4 times higher (38 out of 106) in
comparison to a ubiquitous promoter (19 out of 207; P# 0.0001,
Fisher’s exact test) and 2.5 times higher in comparison to the
HS-induced columella clones (39 out of 233; P# 0.0002, Fisher’s
exact test). More importantly for our analysis, HS induced
columella clones were confined to the two outer layers and
never observed in columella stem cells and daughter cells
(Figures 2J to 2L), while half (19 out of 38) of the columella
clones induced by the FEZ promoter were found in columella
stem cells and daughter cells (P # 0.0002, Fisher’s exact test).
Columella stem cell or daughter cell clones are therefore greatly
enriched by use of FEZ promoter–driven CRE. Enrichment of
ground tissue (endodermis and cortex) clones using the EN7
promoter was more than twofold compared with a presumed
ubiquitous promoter (47 out of 88 versus 45 out of 207; P #
0.0001, Fisher’s exact test) and also twice as efficient compared
with HS-induced clones (47 out of 88 versus 63 out of 233; P #
0.0001 for both comparisons; Fisher’s exact test).
The first clones were observed in 3 d postgermination (dpg)
seedlings on 5 mM dex. Shorter induction times or concentra-
tions below 1 mM lead to a severe reduction in the number of
clones per root. After identification of clones, we transferred
seedlings to a dex-free medium to avoid further formation of new
clones. Nevertheless, in rare cases, new clones appeared up to
3 d after the removal of dex. We could not exclude that these
apparently newly emerging clones might have been present in a
slightly different focal plane, only becoming visible during time-
lapse analysis when roots are presenting a different median
plane. Nevertheless, the shape and fluorescence combination of
each clone and its neighboring cells were sufficient to reidentify it
in later stages and to discriminate new clones from dividing older
ones. Interestingly, regardless of the promoter we used for
driving CRE-GR, clones were always induced in a subset of cells
within the relevant tissue, while many cells did not undergo
deletion/recombination of any of the BOB-RBR copies. We
concluded that the CRE-GR fusion was only activated over a
considerable dex induction threshold and exploited this feature
to generate induction mosaics within a given tissue to compare
regions with clones to their juxtaposed wild-type cells.
To examine a possible preference of CRE-GR–mediated re-
combination for either of the two distinct lox variants in the BOB
system in planta, we compared the number of CyPetER (lox2272
recombination) and TagRFPER (loxN recombination) expressing
clones upon dex induction using the tissue-specific driver lines
described above. CyPetER clones, which result by single or
double recombination, were almost twice as abundant as the
TagRFPER clones (Table 2). This may be caused by the distance
between the different lox sites (Coppoolse et al., 2005) or be-
cause of differences in their quality as substrates for the CRE
recombinase. The frequency of the double fluorescence clones
was;10%, sufficient for efficient detection of NHCs.
Our data demonstrate that tissue-specific activation of CRE-
GR is a feasible method in plants to obtain significant enrichment
of null clones in desired regions and at preferred time points.
Cell-Autonomous RBR Activity in the QC Constrains
Cell Division
RBR has been implicated in several developmental processes,
including stem cell maintenance and differentiation (Wildwater
et al., 2005; Borghi et al., 2010), but its broad expression domain
prevented an accurate functional analysis in specific cells and
tissues. The capacity of the BOB system to generate single and
isolated null clones allowed us to address three open questions
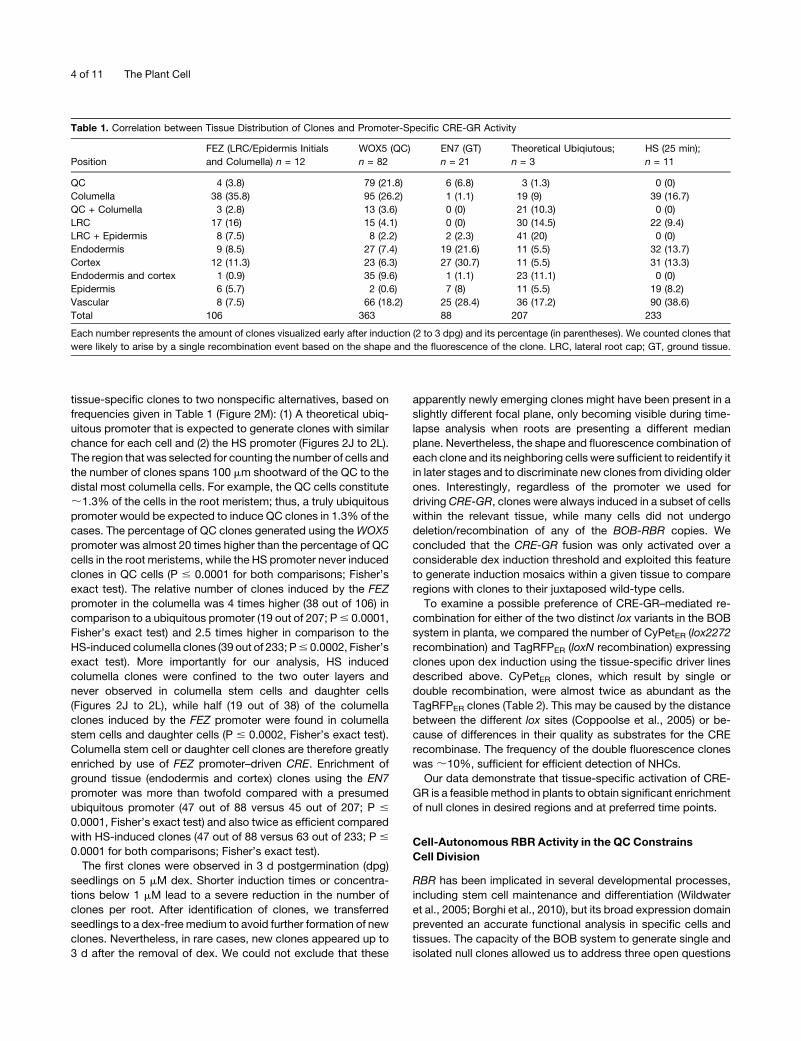
Table 1. Correlation between Tissue Distribution of Clones and Promoter-Specific CRE-GR Activity
Position
FEZ (LRC/Epidermis Initials
and Columella) n = 12
WOX5 (QC)
n = 82
EN7 (GT)
n = 21
Theoretical Ubiqiutous;
n = 3
HS (25 min);
n = 11
QC 4 (3.8) 79 (21.8) 6 (6.8) 3 (1.3) 0 (0)
Columella 38 (35.8) 95 (26.2) 1 (1.1) 19 (9) 39 (16.7)
QC + Columella 3 (2.8) 13 (3.6) 0 (0) 21 (10.3) 0 (0)
LRC 17 (16) 15 (4.1) 0 (0) 30 (14.5) 22 (9.4)
LRC + Epidermis 8 (7.5) 8 (2.2) 2 (2.3) 41 (20) 0 (0)
Endodermis 9 (8.5) 27 (7.4) 19 (21.6) 11 (5.5) 32 (13.7)
Cortex 12 (11.3) 23 (6.3) 27 (30.7) 11 (5.5) 31 (13.3)
Endodermis and cortex 1 (0.9) 35 (9.6) 1 (1.1) 23 (11.1) 0 (0)
Epidermis 6 (5.7) 2 (0.6) 7 (8) 11 (5.5) 19 (8.2)
Vascular 8 (7.5) 66 (18.2) 25 (28.4) 36 (17.2) 90 (38.6)
Total 106 363 88 207 233
Each number represents the amount of clones visualized early after induction (2 to 3 dpg) and its percentage (in parentheses). We counted clones that
were likely to arise by a single recombination event based on the shape and the fluorescence of the clone. LRC, lateral root cap; GT, ground tissue.
4 of 11 The Plant Cell
about RBR action in the Arabidopsis root stem cell niche. First,
what is the effect of complete RBR removal from different cell
types within the stem cell niche? Second, does RBR act in the
QC, in the stem cells, or in both? And third, does RBR act cell-
autonomously?
To test the effect of RBR depletion from various cell types in
the root meristem, we followed clones in this region and com-
pared their behavior to neighborswithout excision events. Three-
day-old seedlings germinating on dex-containing medium were
preselected for the presence of clones under a fluorescence
binocularmicroscope and taken for detailed analysis by confocal
microscopy. Relevant NHCs were returned to dex-free growth
medium and checked again every 5 to 24 h. Because theWOX5
promoter–drivenCRE-GR generated clones in bothQCand stem
cells upon dex application, we generally used the rbr-3/rbr-3;
BOB-RBR+/+;WOX5:CRE-GR line for our analysis. The number
and localization of informative clones (clones that originated from
a single cell and were followed in more than one time point) used
in this study are given in Table 3.
In the case of QC clones, we ensured that each identified clone
truly represented a group of cells that originated from a single
cell. We followed such clones only if we could visualize a double
recombination event at the single-cell stage rapidly after the
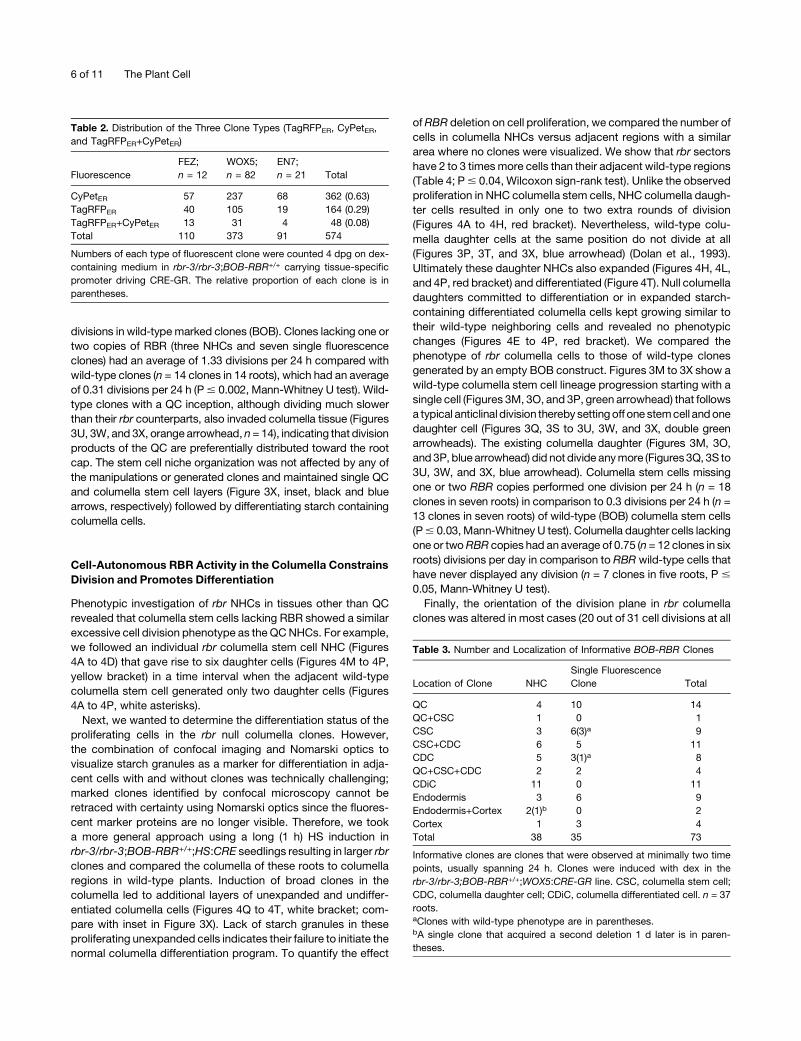
induction of CRE-GR. We found that null QC cells underwent
faster cell divisions with reduced growth periods leading to
clusters of small cells originating from the QC and giving rise to
new cells within the columella domain (Figures 3A to 3L, white
and yellow arrowheads). Figure 3 shows two QC lineages
that divide anticlinally toward the columella tissue: a double
TagRFPER/CypetER NHC (Figures 3A to 3D, yellow arrowhead)
that gives rise to four cells (Figures 3I to 3L, yellow arrowhead)
and a single fluorescence TagRFPER clone (Figures 3A, 3C, and
3D, white arrowhead) that gives rise to three cells (Figures 3I, 3K,
and 3L, white arrowhead). In contrast with the increased prolif-
eration rate of QC cells lacking RBR, adjacent wild-type QC cells
rarely divided (Figures 3C, 3G, and 3K, white asterisk). Since
most of the clones expressing single fluorescence marker pro-
tein are likely to be heterozygous (Table 2) and the majority of the
single fluorescence QC clones showed a similar proliferation
phenotype (8 out of 10), we concluded that reduction in RBR
levels is sufficient to induce excessive proliferation in the QC.
Interestingly, all rbr clones that originated in the QC exclusively
populated later columella regions (n = 14).
To investigate the progression of cell division in a wild-type
situation, we examined clones induced by HS in a wild-type Col-0
harboringHS:CRE and transformedwith anemptyBOBconstruct.
Similar to the results described above, we observed that clonally
marked fluorescent wild-type QC cells (n = 14) rarely divided, as
previously reported (Clowes, 1956; Dolan et al., 1993; Figures 3M
to 3X, orange arrowhead). To quantify the effect of RBR removal
from QC cells, we counted the number of divisions in RBR-
deficient cells (BOB-RBR) and compared it to the number of
Figure 2. Induction of BOB Clones by Tissue-Specific and HS Pro-
moters.
(A) to (C) Confocal images of clones generated in FEZ:CRE-GR;rbr-3/
rbr-3;BOB-RBR+/+ root 3 dpg on dex-containing medium. The inset in (B)
shows the expression domain of the FEZ promoter driving GFP.
(D) to (F) Confocal images of clones generated in EN7:CRE-GR;rbr-3/
rbr-3;BOB-RBR+/+ root 3 dpg on dex-containing medium. The inset in (E)
shows the expression of H2B:YFP driven by the EN7 promoter (false
green).
(G) to (I) Confocal images of clones generated in WOX5:CRE-GR;rbr-3/
rbr-3;BOB-RBR+/+ root 3 dpg on dex-containing medium. The inset in (H)
shows the expression of GFPER from the WOX5 promoter.
(J) to (L) Confocal images of clones generated in HS:CRE;rbr-3/rbr-3;
BOB-RBR+/+ root 3 d after HS. Yellow arrowheads point at double
fluorescence clones. Bars = 20 mm.
(M) Percentage of clones in particular regions of the root meristem
plotted for the three tissue-specific promoters used for driving CRE-GR
(colored bars) and the theoretical ubiquitous promoter and HS promoter
(see text) used as controls (gray bars).
RBR Functions in the Stem Cell Niche 5 of 11
divisions in wild-typemarked clones (BOB). Clones lacking one or
two copies of RBR (three NHCs and seven single fluorescence
clones) had an average of 1.33 divisions per 24 h compared with
wild-type clones (n = 14 clones in 14 roots), which had an average
of 0.31 divisions per 24 h (P# 0.002, Mann-Whitney U test). Wild-
type clones with a QC inception, although dividing much slower
than their rbr counterparts, also invaded columella tissue (Figures
3U, 3W, and 3X, orange arrowhead,n=14), indicating that division
products of the QC are preferentially distributed toward the root
cap. The stem cell niche organization was not affected by any of
the manipulations or generated clones and maintained single QC
and columella stem cell layers (Figure 3X, inset, black and blue
arrows, respectively) followed by differentiating starch containing
columella cells.
Cell-Autonomous RBR Activity in the Columella Constrains
Division and Promotes Differentiation
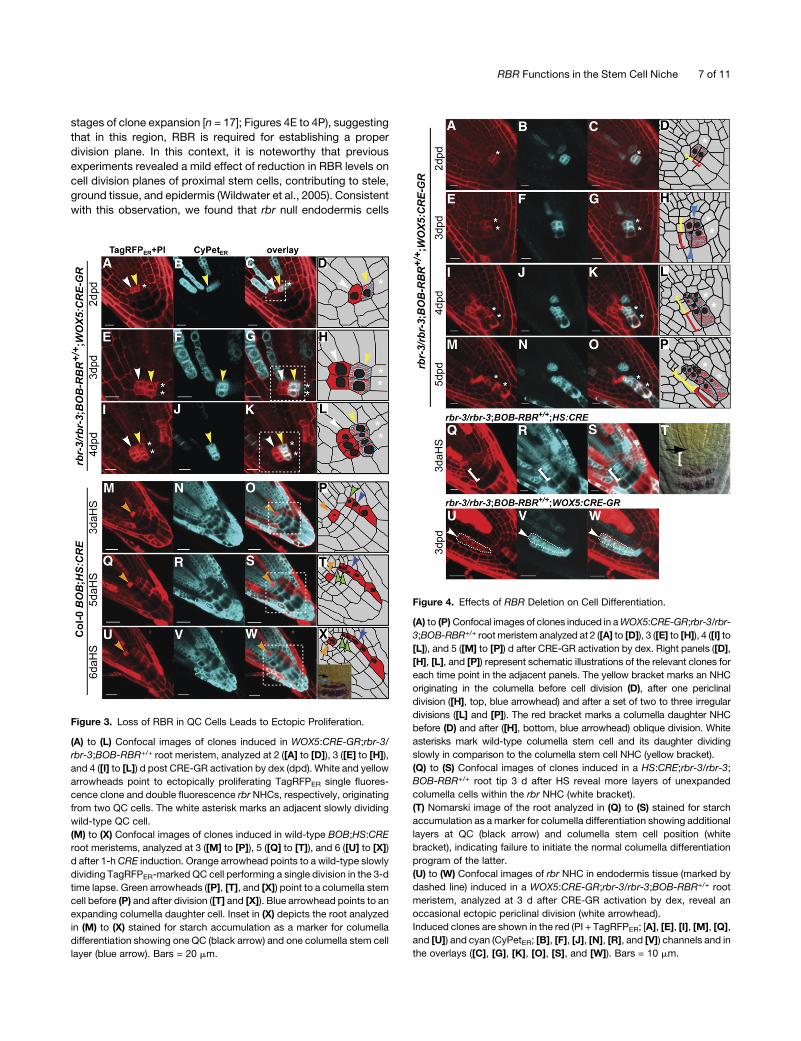
Phenotypic investigation of rbr NHCs in tissues other than QC
revealed that columella stem cells lacking RBR showed a similar
excessive cell division phenotype as the QCNHCs. For example,
we followed an individual rbr columella stem cell NHC (Figures
4A to 4D) that gave rise to six daughter cells (Figures 4M to 4P,
yellow bracket) in a time interval when the adjacent wild-type
columella stem cell generated only two daughter cells (Figures
4A to 4P, white asterisks).
Next, we wanted to determine the differentiation status of the
proliferating cells in the rbr null columella clones. However,
the combination of confocal imaging and Nomarski optics to
visualize starch granules as a marker for differentiation in adja-
cent cells with and without clones was technically challenging;
marked clones identified by confocal microscopy cannot be
retraced with certainty using Nomarski optics since the fluores-
cent marker proteins are no longer visible. Therefore, we took
a more general approach using a long (1 h) HS induction in
rbr-3/rbr-3;BOB-RBR+/+;HS:CRE seedlings resulting in larger rbr
clones and compared the columella of these roots to columella
regions in wild-type plants. Induction of broad clones in the
columella led to additional layers of unexpanded and undiffer-
entiated columella cells (Figures 4Q to 4T, white bracket; com-
pare with inset in Figure 3X). Lack of starch granules in these
proliferating unexpanded cells indicates their failure to initiate the
normal columella differentiation program. To quantify the effect
ofRBR deletion on cell proliferation, we compared the number of
cells in columella NHCs versus adjacent regions with a similar
area where no clones were visualized. We show that rbr sectors
have 2 to 3 timesmore cells than their adjacent wild-type regions
(Table 4; P# 0.04, Wilcoxon sign-rank test). Unlike the observed
proliferation in NHC columella stem cells, NHC columella daugh-
ter cells resulted in only one to two extra rounds of division
(Figures 4A to 4H, red bracket). Nevertheless, wild-type colu-
mella daughter cells at the same position do not divide at all
(Figures 3P, 3T, and 3X, blue arrowhead) (Dolan et al., 1993).
Ultimately these daughter NHCs also expanded (Figures 4H, 4L,
and 4P, red bracket) and differentiated (Figure 4T). Null columella
daughters committed to differentiation or in expanded starch-
containing differentiated columella cells kept growing similar to
their wild-type neighboring cells and revealed no phenotypic
changes (Figures 4E to 4P, red bracket). We compared the
phenotype of rbr columella cells to those of wild-type clones
generated by an empty BOB construct. Figures 3M to 3X show a
wild-type columella stem cell lineage progression starting with a
single cell (Figures 3M, 3O, and 3P, green arrowhead) that follows
a typical anticlinal division thereby settingoff one stemcell andone
daughter cell (Figures 3Q, 3S to 3U, 3W, and 3X, double green
arrowheads). The existing columella daughter (Figures 3M, 3O,
and3P, bluearrowhead) did not divide anymore (Figures3Q, 3S to
3U, 3W, and 3X, blue arrowhead). Columella stem cells missing
one or two RBR copies performed one division per 24 h (n = 18
clones in seven roots) in comparison to 0.3 divisions per 24 h (n =
13 clones in seven roots) of wild-type (BOB) columella stem cells
(P# 0.03,Mann-Whitney U test). Columella daughter cells lacking
one or twoRBR copies had an average of 0.75 (n = 12 clones in six
roots) divisions per day in comparison to RBR wild-type cells that
have never displayed any division (n = 7 clones in five roots, P #
0.05, Mann-Whitney U test).
Finally, the orientation of the division plane in rbr columella
clones was altered in most cases (20 out of 31 cell divisions at all
Table 2. Distribution of the Three Clone Types (TagRFPER, CyPetER,
and TagRFPER+CyPetER)
Fluorescence
FEZ;
n = 12
WOX5;
n = 82
EN7;
n = 21 Total
CyPetER 57 237 68 362 (0.63)
TagRFPER 40 105 19 164 (0.29)
TagRFPER+CyPetER 13 31 4 48 (0.08)
Total 110 373 91 574
Numbers of each type of fluorescent clone were counted 4 dpg on dex-
containing medium in rbr-3/rbr-3;BOB-RBR+/+ carrying tissue-specific
promoter driving CRE-GR. The relative proportion of each clone is in
parentheses.
Table 3. Number and Localization of Informative BOB-RBR Clones
Location of Clone NHC
Single Fluorescence
Clone Total
QC 4 10 14
QC+CSC 1 0 1
CSC 3 6(3)a 9
CSC+CDC 6 5 11
CDC 5 3(1)a 8
QC+CSC+CDC 2 2 4
CDiC 11 0 11
Endodermis 3 6 9
Endodermis+Cortex 2(1)b 0 2
Cortex 1 3 4
Total 38 35 73
Informative clones are clones that were observed at minimally two time
points, usually spanning 24 h. Clones were induced with dex in the
rbr-3/rbr-3;BOB-RBR+/+;WOX5:CRE-GR line. CSC, columella stem cell;
CDC, columella daughter cell; CDiC, columella differentiated cell. n = 37
roots.aClones with wild-type phenotype are in parentheses.bA single clone that acquired a second deletion 1 d later is in paren-
theses.
6 of 11 The Plant Cell
stages of clone expansion [n = 17]; Figures 4E to 4P), suggesting
that in this region, RBR is required for establishing a proper
division plane. In this context, it is noteworthy that previous
experiments revealed a mild effect of reduction in RBR levels on
cell division planes of proximal stem cells, contributing to stele,
ground tissue, and epidermis (Wildwater et al., 2005). Consistent
with this observation, we found that rbr null endodermis cells
Figure 3. Loss of RBR in QC Cells Leads to Ectopic Proliferation.
(A) to (L) Confocal images of clones induced in WOX5:CRE-GR;rbr-3/
rbr-3;BOB-RBR+/+ root meristem, analyzed at 2 ([A] to [D]), 3 ([E] to [H]),
and 4 ([I] to [L]) d post CRE-GR activation by dex (dpd). White and yellow
arrowheads point to ectopically proliferating TagRFPER single fluores-
cence clone and double fluorescence rbr NHCs, respectively, originating
from two QC cells. The white asterisk marks an adjacent slowly dividing
wild-type QC cell.
(M) to (X) Confocal images of clones induced in wild-type BOB;HS:CRE
root meristems, analyzed at 3 ([M] to [P]), 5 ([Q] to [T]), and 6 ([U] to [X])
d after 1-h CRE induction. Orange arrowhead points to a wild-type slowly
dividing TagRFPER-marked QC cell performing a single division in the 3-d
time lapse. Green arrowheads ([P], [T], and [X]) point to a columella stem
cell before (P) and after division ([T] and [X]). Blue arrowhead points to an
expanding columella daughter cell. Inset in (X) depicts the root analyzed
in (M) to (X) stained for starch accumulation as a marker for columella
differentiation showing one QC (black arrow) and one columella stem cell
layer (blue arrow). Bars = 20 mm.
Figure 4. Effects of RBR Deletion on Cell Differentiation.
(A) to (P)Confocal images of clones induced in aWOX5:CRE-GR;rbr-3/rbr-
3;BOB-RBR+/+ rootmeristemanalyzed at 2 ([A] to [D]), 3 ([E] to [H]), 4 ([I] to
[L]), and 5 ([M] to [P]) d after CRE-GR activation by dex. Right panels ([D],
[H], [L], and [P]) represent schematic illustrations of the relevant clones for
each time point in the adjacent panels. The yellow bracket marks an NHC
originating in the columella before cell division (D), after one periclinal
division ([H], top, blue arrowhead) and after a set of two to three irregular
divisions ([L] and [P]). The red bracket marks a columella daughter NHC
before (D) and after ([H], bottom, blue arrowhead) oblique division. White
asterisks mark wild-type columella stem cell and its daughter dividing
slowly in comparison to the columella stem cell NHC (yellow bracket).
(Q) to (S) Confocal images of clones induced in a HS:CRE;rbr-3/rbr-3;
BOB-RBR+/+ root tip 3 d after HS reveal more layers of unexpanded
columella cells within the rbr NHC (white bracket).
(T) Nomarski image of the root analyzed in (Q) to (S) stained for starch
accumulation as amarker for columella differentiation showing additional
layers at QC (black arrow) and columella stem cell position (white
bracket), indicating failure to initiate the normal columella differentiation
program of the latter.
(U) to (W) Confocal images of rbr NHC in endodermis tissue (marked by
dashed line) induced in a WOX5:CRE-GR;rbr-3/rbr-3;BOB-RBR+/+ root
meristem, analyzed at 3 d after CRE-GR activation by dex, reveal an
occasional ectopic periclinal division (white arrowhead).
Induced clones are shown in the red (PI + TagRFPER; [A], [E], [I], [M], [Q],
and [U]) and cyan (CyPetER; [B], [F], [J], [N], [R], and [V]) channels and in
the overlays ([C], [G], [K], [O], [S], and [W]). Bars = 10 mm.
RBR Functions in the Stem Cell Niche 7 of 11
occasionally (5 out of 14 analyzed endodermis NHCs) showed an
extra periclinal division (Figures 4U to 4W, white arrowhead),
whereas cortex and epidermis cells in the proximal meristem
were not affected by RBR removal. Normally, such a specific
reoriented periclinal division takes place only in the ground tissue
daughter cell or, at later stages, in the ground tissue stem cell.
Divisions in more proximal ground tissue cells are always anti-
clinal (Dolan et al., 1993).
Our data using null clones corroborate that the meristem
region in close proximity to the stem cell niche is most sensitive
to manipulation of the RBR pathway. Importantly, for all clones
that gave rise to phenotypes within the stem cell niche, we rarely
observed any cellular changes in their immediate unmarked
neighbors (e.g., white asterisks in Figure 4, n = 10). These data
strongly indicate that RBR acts in a cell-autonomous manner in
all cell types studied and that its activity level in the stem cell
organizer, columella stem cells, and their immediate daughters
contribute to the niche-specific features of these cells.
DISCUSSION
The BOB System as a Versatile Tool for Clonal Analysis
Haploid-essential genes required for both male and female
gamete development have hitherto been difficult to study. Our
new clonal deletion system overcomes current obstacles and
generally simplifies sector deletion analysis for all type of muta-
tions. Moreover, clone formation does not rely on prerequisites
such as integration of the lox sites into a specific locus or somatic
recombination and G2 entrance (Muzumdar et al., 2007; Wang
et al., 2007). With the BOB tool, NHCs can be detected in a
homozygous complemented background by double fluores-
cence, allowing efficient propagation of genotypes that can be
directly used for analysis. Furthermore, we demonstrate that the
CRE-GR fusion allows for tissue-specific induction of recombi-
nation. One potential improvement of the BOB system would be
the fusion of a destruction box to vYFPNLS to ensure elimination
of the protein at least in dividing cells.
There has been a debate on the persistence of the excised cir-
cular product from the CRE-mediated recombination (Srivastava
and Ow, 2003; Coppoolse et al., 2005). Our results suggest that
this fragment does not play a significant role in our clonal deletion
system. First, the observed phenotypes in plants harboring
deletion clones are very similar to phenotypes observed using
silencing methods (Wildwater et al., 2005; A. Cruz-Ramırez,
personal communication). Second, we observed a strong re-
duction of vYFPNLS levels after HS-induced ubiquitous recom-
bination. Third,CRE is activated by inducible systems (HS or GR/
dex). Hence, iterative excision and integration, especially when
the concentration of the circular fragment is low, are unlikely.
Finally, a reintegration of a circular fragment should change
the fluorescence signature of the clone (i.e., vYFPNLS would be
reactivated and one of the other fluorescent proteins [CyPetER or
TagRFPER] would be disconnected from the 35S promoter and
no longer transcribed).We have not observed this type of change
in clones. Therefore, we conclude that the BOB system gener-
ates NHCs, even though the disappearance of the protein under
control of the excised gene will not be instantaneous but rather
depend on the turnover rate of the specific protein in each case.
The Tissue Specificity of the CRE-GR Constructs
Previous studies indicated that it is impractical to screen for QC
and stem cells clones using HS-inducible CRE (Heidstra et al.,
2004). Therefore, we designed a series of tissue-specific CRE-
GR constructs for induction of deletion clones in favored regions.
This approach was proven to be useful since we obtained
considerable enrichment of clones in the target tissues. How-
ever, the number of specific cloneswas still lower than expected.
For example, WOX5 is expressed in QC cells (Figure 2H, inset),
but only 20% of theWOX5 induced clones were found in the QC.
One explanation could be that reduction of RBR levels interferes
with maintenance and/or specification of niche cell fates such
that WOX5 expression expands to neighbor cells; another ex-
planation may be limited movement of cytoplasmic CRE-GR to
neighboring cells via plasmodesmata.
Stem Cell Niche–Specific Functions of the RBR Protein
The removal of RBR activity in marked clones suggests a model
in which RBR has two roles in the stem cell niche. RBR acts cell-
autonomously in the QC as well as in columella stem cells to
restrain cell division. In columella stem cells and their daughters,
RBR inhibits cell division, while in daughter cells alone it is
required for differentiation. Notably, the requirement of RBR to
promote columella cell differentiation is most important in close
proximity to the stem cell niche: distal displacement of columella
cells ultimately imposed differentiation even at low RBR levels.
Why would RBR act in QC cells to suppress cell division? We
note that such a role is consistent with the need to maintain the
structural organization of QC cells as organizers of the surround-
ing stem cells. It is interesting that the quiescence of these cells
can be relaxed by RBR regulation, and an important question for
the future is whether such a regulation could contribute to the
postulated function of the QC as a long term reservoir for the
columella stem cell population (Kidner et al., 2000; Jiang and
Feldman, 2005; Ortega-Martinez et al., 2007).
Why would QC daughter cells, after division, preferentially
populate the distal root cap? This feature has also been observed
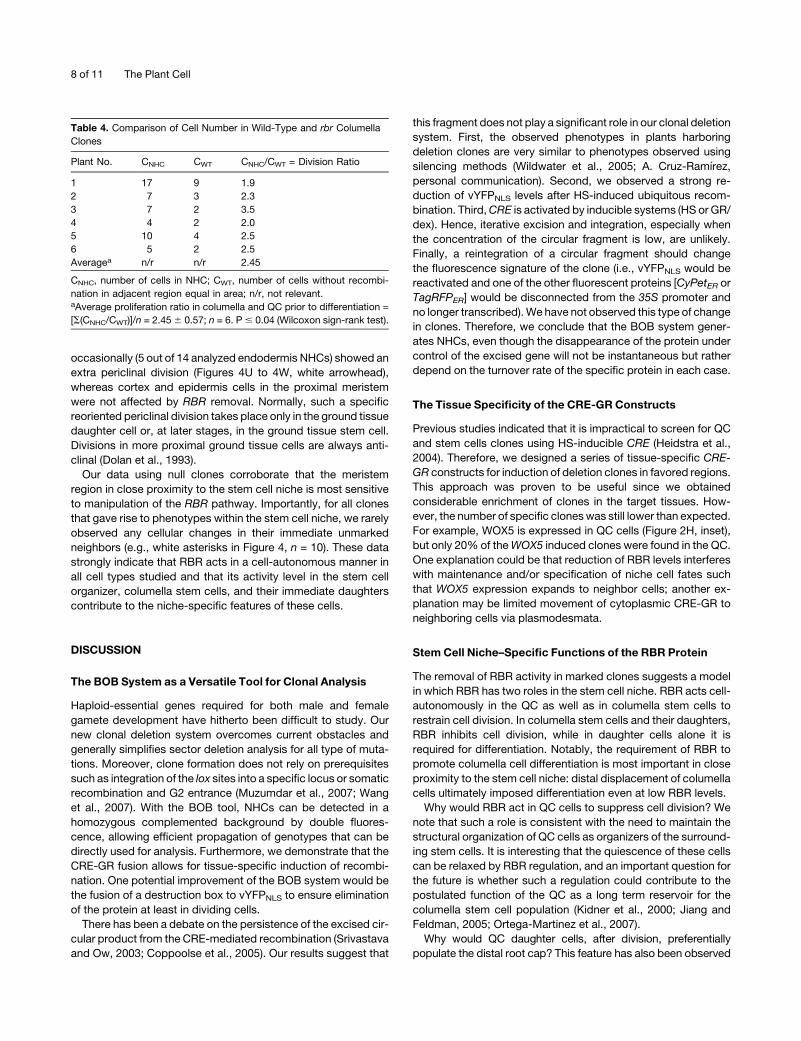
Table 4. Comparison of Cell Number in Wild-Type and rbr Columella
Clones
Plant No. CNHC CWT CNHC/CWT = Division Ratio
1 17 9 1.9
2 7 3 2.3
3 7 2 3.5
4 4 2 2.0
5 10 4 2.5
6 5 2 2.5
Averagea n/r n/r 2.45
CNHC, number of cells in NHC; CWT, number of cells without recombi-
nation in adjacent region equal in area; n/r, not relevant.aAverage proliferation ratio in columella and QC prior to differentiation =
[S(CNHC/CWT)]/n = 2.456 0.57; n = 6. P# 0.04 (Wilcoxon sign-rank test).
8 of 11 The Plant Cell
uponablation of columella stemcells,which triggersdivision of the
proximal QC cell to replace the ablated cell (Xu et al., 2006). While
this can be viewed as a passive consequence of stresses and
strains within the root tip, there may be a functional advantage for
this preference. Thedistal-most columella cells are the first ones to
encounter physical obstacles during root growth and are fre-
quently detached. Perhaps this exposure to physical stress calls
for a renewable reservoir for this particular cell type, where QC
cells can supply new columella stem cells.
In columella stem cells, RBR levels need to be balanced, low
enough to prevent early differentiation (Wildwater et al., 2005) but
sufficient to avoid overproliferation (this study). These data not
only support previous conclusions from several analyses of RBR
function in leaf and pollen development (Desvoyes et al., 2006;
Borghi et al., 2010; Chen et al., 2009) but also stress the point that
this balance is relevant in stem cell populations and their imme-
diate daughters. This is well illustrated by the induction of
periclinal divisions typical for ground tissue stem cells or their
daughters by RBR removal: This division in daughter cells is a
transient feature defining a particular differentiation state of the
cell as it traverses through the meristem; hence, its regulation by
RBR can be interpreted as regulation of a step along a differ-
entiation trajectory. However, RBR is not strictly required for
progression of terminal differentiation in cells moving away from
the niche; differentiation is delayed in the columella region where
this can be easily assessed, but cells ultimately differentiate.
What causes this difference in competence? Demonstrated
interactions between RBR and a set of stem cell–promoting
transcription factors, the PLETHORA proteins, whose expres-
sion is highest in the stem cell niche, may be responsible for a
difference in sensitivity to RBR levels (Galinha et al., 2007).
Graded levels of the plant growth regulator auxin may also play a
role in this process (Ding and Friml, 2010).
Recent work has implicated mammalian Rb in fate choice and
pluripotency of mesenchymal stem cells (Calo et al., 2010),
although this work could not identify the domain of action of Rb at
cellular resolution. Such studies underpin the need to dissect Rb-
mediated functions at a cellular resolution, which may elucidate
whether Rb-like proteins have universal roles in stem cells.
METHODS
Growth Conditions
Seeds were fume sterilized in a sealed container with 100 mL bleach
supplemented by 3 mL of 37% hydrochloric acid for 2 to 5 h, and then
suspended in 0.1%agarose and plated on a growthmedium consisting of
Murashige and Skoog salts, 1% Suc, 0.8% plant agar, MES, pH 5.8, 50
mg/mL ampicillin, and 1 to 5 mM dex (optional), stratified for 2 d in a 48C
dark room, and grown vertically in long-day conditions (16 h light followed
by 8 h of dark). For HS induction, plates with 2 to 3 dpg seedlings were
placed in a 378C incubator for 1 h and analyzed 2 d later.
Microscopy
Seedlings harboring red or cyan clones were preselected under a Leica
MZ16F fluorescence stereoscope and further analyzed by confocal
microscopy. To excite and collect red, cyan, and yellow fluorescent
signals in a Leica SP2 confocal microscope, we performed sequential
scanning as follows: the CyPetER and the vYFPNLS were excited together
using the 458- and 514-nm laser wavelengths, respectively, and emission
was collected at 465 to 506 nm for the CyPetER and 523 to 566 nm for the
vYFPNLS. PI, which marks cell walls and dead cells (3 mg/mL, final
concentration), and TagRFPER were visualized by exciting at 488 and 543
nm, respectively, and emission was collected at 502 to 522 and 561 to
633 nm. Fluorescence signal intensity wasmeasured using the “quantify”
function in the Leica TCS SPII confocal software in a region of interest
excluding overexposed areas that contain dead cells.
Although signals from cell walls, dead cells, and TagRFPER marked
clones are collected using the same filter settings, they are clearly dis-
tinguishable from one another based on the subcellular localization of the
fluorescence. PI marked walls of living cells appear as a rectangular
outline. Dead cells accumulate PI within the cytoplasm and nucleus and
show a high emission intensity coupled with distorted cell shape.
TagRFPER clones are characterized by signal from the ER surrounding
the circular nucleus.
Cloning
The BOB construct (Figure 1A) consists of a pGreenII backbone (Hellens
et al., 2000) with a 35S promoter driving vYFPNLS (Nagai et al., 2002) as a
default expressedmarker and two incompatible lox variants, lox2272 and
loxN, placed in between the 35S and vYFPNLS sequences. Despite our
attempt to generate a fast turnoff of the vYFPNLS by a general SV40
nuclear localization signal (NLS; Lassner et al., 1991) as a second
indication for genomic deletion of the GOI, vYFPNLS was still visible up
to several days inNHCs expressing TagRFPER andCyPetER. Downstream
to the 3AT (vYFPNLS terminator), we placed amulticloning site for insertion
of the complementing wild-type genomic allele of any GOI, including its
native promoter followed by two fluorescent proteins, CyPetER (Nguyen
and Daugherty, 2005) and TagRFPER (Merzlyak et al., 2007), with the
lox2272 and loxN at their 59, respectively. To generate the BOB plasmid,
four fragments were amplified from the template plasmids, pCB1
(Heidstra et al., 2004), 221e pSCR-H2B-VYFP-3AT, P1R4-DR5:ER-Cy-
Pet-nosT, and ER-TagRFP CBR_7 using primer pairs 1 and 2, 3 and 4, 5
and 6, and 7 and 8, respectively (see Supplemental Table 1 online). The
PCR products and the binary pGII124 vector, carrying a methotrexate
resistance marker, were cut with the appropriate restriction enzymes and
simultaneously ligated overnight. Positive colonies were analyzed by
restriction and sequencing. To clone the genomic fragment of RBR,
including the 2.2-kb 59 and 1.5-kb 39 regions in pBOB, we amplified it from
Col-0 genomic DNA with primers 9 and 10, digested with NheI and ClaI,
and ligated it between the NheI and BstBI sites creating pBOB-RBR. We
used primer pairs 13 and 14, 15 and 16, and 17 and 18 (see Supplemental
Table 1 online) to amplify Col-0 genomic DNA of WOX5, EN7, and FEZ
promoters, respectively, and cloned the PCR products by Gateway
(Invitrogen). CRE-GR constructs (Brocard et al., 1998) driven by tissue-
specific promoters were generated by three-way Gateway reaction.
Genetic Background and Crossing Scheme
pBOB and pBOB-RBR were transformed to Col-0 plants carrying a HS:
CRE construct by the floral dip method (Clough and Bent, 1998) and
tested for vYFPNLS expression before and for CyPetER or TagRFPER
expression 24 h after 20 to 60 min HS. To select for a single BOB-RBR
insertion in Col-0 HS:CRE background, we used DNA gel blotting. DNA
from T1 plants was digested with XbaI and hybridized with an RBR-
specific probe generated by PCR using primers 11 and 12 on Col-0 DNA.
A single insertion line was used as a female gametophyte donor to cross
with rbr-3/+ plants (GABI_170G02) that produce escape rbr-3 male
gametophytes. Sulfadiazin-resistant (encoded by the GABI T-DNA inser-
tion in the RBR gene) seedlings expressing vYFPNLS were genotyped for
the rbr-3 allele, analyzed for ploidy by FACS, and selfed twice. rbr-3/rbr-3;
RBR Functions in the Stem Cell Niche 9 of 11

BOB-RBR+/+ plants were selected and verified again for single insertion
by second DNA gel blot assay. Plant DNA was digested with HaeIII
and probed with a 545-bp NcoI/BglII vector-specific fragment isolated
from pGII124. Single-insertion BOB-RBR plants were subsequently
transformed with constructs of CRE-GR driven by a tissue-specific
promoter.
FACS Sample Preparation
Two to three inflorescences or three to four leaves (without petioles and
main vein) were chopped with a fine double-edge razor blade and
suspended in 500 mL of cold nuclear isolation buffer (Galbraith et al.,
1983). This crude extract was filtered through a 60-mmmesh, stainedwith
10mL PI (5mg/mL), and treatedwith 5mLRNaseA (100mg/mL) for 10min.
These nuclei were analyzed for ploidy by a BD influx cell sorter.
Accession Numbers
Sequence data from this article can be found in the Arabidopsis Genome
Initiative or GenBank/EMBL data libraries under the following accession
numbers: RBR (locus AT3G12280) and BOB (GenBank JF927991).
Supplemental Data
The following materials are available in the online version of this article.
Supplemental Figure 1. The BOB System Does Not Affect Growth.
Supplemental Figure 2. Selection for Single Insertion Diploid rbr-3/
rbr-3; BOB-RBR Plants.
Supplemental Figure 3. Reduction of vYFPNLS Fluorescence as a
Result of Clone Formation.
Supplemental Figure 4. Genomic Deletion and RNAi Silencing of
RBR Display Similar Phenotypes.
Supplemental Table 1. Primer List.
ACKNOWLEDGMENTS
CRE-GR sequence in the second Gateway box was a gift from Pierre
Chambon (Institute for Genetics and Cellular and Molecular Biology,
Strasbourg, France). We are grateful to Amal J. Johnston (Leibniz
Institute of Plant Genetics and Crop Plant Research, Gatersleben,
Germany), Wilhelm Gruissem (Department of Biology, Eidgenossische
Technische Hochschule, Zurich, Switzerland), and Ari Pekka Mahonen
(Institute of Biotechnology, University of Helsinki, Finland) for materials,
to Jean Livet (Departement de biologie du developpement, l’Institut de
la Vision, Paris, France) and Gabino Sanchez Perez (Bioinformatics
group, Utrecht University, The Netherlands) for discussions, to Frits
Kindt (Department of Biology, Utrecht University, The Netherlands) for
assisting with image processing, and to Ger Arkesteijn (The Faculty of
Veterinary Medicine, Utrecht University, The Netherlands) for performing
FACS analysis. G.W. was supported by The Netherlands Organization
for Scientific Research grant 2005/03618/ALW and by an European
Research Council-Advanced investigator grant to B.S. R.H. was sup-
ported by The Netherlands Organization for Scientific Research Horizon
grant 050-71-054.
AUTHOR CONTRIBUTIONS
G.W. and B.S. designed the research. G.W. performed the research.
G.W., R.H., and B.S. wrote the article.
Received April 8, 2011; revised May 23, 2011; accepted June 17, 2011;
published July 8, 2011.
REFERENCES
Adamski, N.M., Anastasiou, E., Eriksson, S., O’Neill, C.M., and
Lenhard, M. (2009). Local maternal control of seed size by KLUH/
CYP78A5-dependent growth signaling. Proc. Natl. Acad. Sci. USA
106: 20115–20120.
Blilou, I., Xu, J., Wildwater, M., Willemsen, V., Paponov, I., Friml, J.,
Heidstra, R., Aida, M., Palme, K., and Scheres, B. (2005). The PIN
auxin efflux facilitator network controls growth and patterning in
Arabidopsis roots. Nature 433: 39–44.
Borghi, L., Gutzat, R., Futterer, J., Laizet, Y., Hennig, L., and
Gruissem, W. (2010). Arabidopsis RETINOBLASTOMA-RELATED is
required for stem cell maintenance, cell differentiation, and lateral
organ production. Plant Cell 22: 1792–1811.
Brocard, J., Feil, R., Chambon, P., and Metzger, D. (1998). A chimeric
Cre recombinase inducible by synthetic, but not by natural ligands of
the glucocorticoid receptor. Nucleic Acids Res. 26: 4086–4090.
Brummelkamp, T.R., Bernards, R., and Agami, R. (2002). A system for
stable expression of short interfering RNAs in mammalian cells.
Science 296: 550–553.
Calo, E., Quintero-Estades, J.A., Danielian, P.S., Nedelcu, S., Berman,
S.D., and Lees, J.A. (2010). Rb regulates fate choice and lineage com-
mitment in vivo. Nature 466: 1110–1114.
Chen, Z., Hafidh, S., Poh, S.H., Twell, D., and Berger, F. (2009).
Proliferation and cell fate establishment during Arabidopsis male
gametogenesis depends on the Retinoblastoma protein. Proc. Natl.
Acad. Sci. USA 106: 7257–7262.
Clough, S.J., and Bent, A.F. (1998). Floral dip: A simplified method for
Agrobacterium-mediated transformation of Arabidopsis thaliana. Plant
J. 16: 735–743.
Clowes, F.A.L. (1956). Nucleic acids in root apical meristems of Zea.
New Phytol. 55: 29–34.
Coppoolse, E.R., de Vroomen, M.J., van Gennip, F., Hersmus, B.J.,
and van Haaren, M.J. (2005). Size does matter: cre-mediated so-
matic deletion efficiency depends on the distance between the target
lox-sites. Plant Mol. Biol. 58: 687–698.
Desvoyes, B., Ramirez-Parra, E., Xie, Q., Chua, N.H., and Gutierrez,
C. (2006). Cell type-specific role of the retinoblastoma/E2F pathway
during Arabidopsis leaf development. Plant Physiol. 140: 67–80.
Ding, Z., and Friml, J. (2010). Auxin regulates distal stem cell differen-
tiation in Arabidopsis roots. Proc. Natl. Acad. Sci. USA 107: 22344–
22349.
Dolan, L., Janmaat, K., Willemsen, V., Linstead, P., Poethig, S.,
Roberts, K., and Scheres, B. (1993). Cellular organisation of the
Arabidopsis thaliana root. Development 119: 71–84.
Ebel, C., Mariconti, L., and Gruissem, W. (2004). Plant retinoblastoma
homologues control nuclear proliferation in the female gametophyte.
Nature 429: 776–780.
Galbraith, D.W., Harkins, K.R., Maddox, J.M., Ayres, N.M., Sharma,
D.P., and Firoozabady, E. (1983). Rapid flow cytometric analysis of
the cell cycle in intact plant tissues. Science 220: 1049–1051.
Galinha, C., Hofhuis, H., Luijten, M., Willemsen, V., Blilou, I.,
Heidstra, R., and Scheres, B. (2007). PLETHORA proteins as dose-
dependent master regulators of Arabidopsis root development. Nature
449: 1053–1057.
Heidstra, R., Welch, D., and Scheres, B. (2004). Mosaic analyses using
marked activation and deletion clones dissect Arabidopsis SCARE-
CROW action in asymmetric cell division. Genes Dev. 18: 1964–1969.
Hellens, R.P., Edwards, E.A., Leyland, N.R., Bean, S., and
Mullineaux, P.M. (2000). pGreen: A versatile and flexible binary Ti
vector for Agrobacterium-mediated plant transformation. Plant Mol.
Biol. 42: 819–832.
Hoess, R.H., Ziese, M., and Sternberg, N. (1982). P1 site-specific
10 of 11 The Plant Cell
recombination: Nucleotide sequence of the recombining sites. Proc.
Natl. Acad. Sci. USA 79: 3398–3402.
Jackson, A.L., Bartz, S.R., Schelter, J., Kobayashi, S.V., Burchard,
J., Mao, M., Li, B., Cavet, G., and Linsley, P.S. (2003). Expression
profiling reveals off-target gene regulation by RNAi. Nat. Biotechnol.
21: 635–637.
Jiang, K., and Feldman, L.J. (2005). Regulation of root apical meristem
development. Annu. Rev. Cell Dev. Biol. 21: 485–509.
Johnston, A.J., Kirioukhova, O., Barrell, P.J., Rutten, T., Moore,
J.M., Baskar, R., Grossniklaus, U., and Gruissem, W. (2010).
Dosage-sensitive function of retinoblastoma related and convergent
epigenetic control are required during the Arabidopsis life cycle. PLoS
Genet. 6: e1000988.
Kidner, C., Sundaresan, V., Roberts, K., and Dolan, L. (2000). Clonal
analysis of the Arabidopsis root confirms that position, not lineage,
determines cell fate. Planta 211: 191–199.
Lassner, M.W., Jones, A., Daubert, S., and Comai, L. (1991). Target-
ing of T7 RNA polymerase to tobacco nuclei mediated by an SV40
nuclear location signal. Plant Mol. Biol. 17: 229–234.
Livet, J., Weissman, T.A., Kang, H., Draft, R.W., Lu, J., Bennis, R.A.,
Sanes, J.R., and Lichtman, J.W. (2007). Transgenic strategies for
combinatorial expression of fluorescent proteins in the nervous sys-
tem. Nature 450: 56–62.
McLeod, M., Craft, S., and Broach, J.R. (1986). Identification of the
crossover site during FLP-mediated recombination in the Saccharo-
myces cerevisiae plasmid 2 microns circle. Mol. Cell. Biol. 6: 3357–
3367.
Merzlyak, E.M., Goedhart, J., Shcherbo, D., Bulina, M.E., Shcheglov,
A.S., Fradkov, A.F., Gaintzeva, A., Lukyanov, K.A., Lukyanov, S.,
Gadella, T.W., and Chudakov, D.M. (2007). Bright monomeric red
fluorescent protein with an extended fluorescence lifetime. Nat.
Methods 4: 555–557.
Metzger, D., Clifford, J., Chiba, H., and Chambon, P. (1995). Condi-
tional site-specific recombination in mammalian cells using a ligand-
dependent chimeric Cre recombinase. Proc. Natl. Acad. Sci. USA 92:
6991–6995.
Muzumdar, M.D., Luo, L., and Zong, H. (2007). Modeling sporadic loss
of heterozygosity in mice by using mosaic analysis with double
markers (MADM). Proc. Natl. Acad. Sci. USA 104: 4495–4500.
Nagai, T., Ibata, K., Park, E.S., Kubota, M., Mikoshiba, K., and
Miyawaki, A. (2002). A variant of yellow fluorescent protein with fast
and efficient maturation for cell-biological applications. Nat. Biotech-
nol. 20: 87–90.
Nguyen, A.W., and Daugherty, P.S. (2005). Evolutionary optimization
of fluorescent proteins for intracellular FRET. Nat. Biotechnol. 23:
355–360.
Ortega-Martinez, O., Pernas, M., Carol, R.J., and Dolan, L. (2007).
Ethylene modulates stem cell division in the Arabidopsis thaliana root.
Science 317: 507–510.
Ossowski, S., Schwab, R., and Weigel, D. (2008). Gene silencing in
plants using artificial microRNAs and other small RNAs. Plant J. 53:
674–690.
Schwab, R., Ossowski, S., Riester, M., Warthmann, N., and Weigel,
D. (2006). Highly specific gene silencing by artificial microRNAs in
Arabidopsis. Plant Cell 18: 1121–1133.
Srivastava, V., and Ow, D.W. (2003). Rare instances of Cre-mediated
deletion product maintained in transgenic wheat. Plant Mol. Biol. 52:
661–668.
Wang, W., Warren, M., and Bradley, A. (2007). Induced mitotic recom-
bination of p53 in vivo. Proc. Natl. Acad. Sci. USA 104: 4501–4505.
Wildwater, M., Campilho, A., Perez-Perez, J.M., Heidstra, R., Blilou,
I., Korthout, H., Chatterjee, J., Mariconti, L., Gruissem, W., and
Scheres, B. (2005). The RETINOBLASTOMA-RELATED gene regu-
lates stem cell maintenance in Arabidopsis roots. Cell 123: 1337–
1349.
Willemsen, V., Bauch, M., Bennett, T., Campilho, A., Wolkenfelt, H.,
Xu, J., Haseloff, J., and Scheres, B. (2008). The NAC domain
transcription factors FEZ and SOMBRERO control the orientation of
cell division plane in Arabidopsis root stem cells. Dev. Cell. 15: 913–922.
Winston, W.M., Molodowitch, C., and Hunter, C.P. (2002). Systemic
RNAi in C. elegans requires the putative transmembrane protein
SID-1. Science 295: 2456–2459.
Wyrzykowska, J., Schorderet, M., Pien, S., Gruissem, W., and
Fleming, A.J. (2006). Induction of differentiation in the shoot apical
meristem by transient overexpression of a retinoblastoma-related
protein. Plant Physiol. 141: 1338–1348.
Xu, J., Hofhuis, H., Heidstra, R., Sauer, M., Friml, J., and Scheres, B.
(2006). A molecular framework for plant regeneration. Science 311:
385–388.
Yoo, B.C., Kragler, F., Varkonyi-Gasic, E., Haywood, V., Archer-Evans,
S., Lee, Y.M., Lough, T.J., and Lucas, W.J. (2004). A systemic small
RNA signaling system in plants. Plant Cell 16: 1979–2000.
RBR Functions in the Stem Cell Niche 11 of 11
DOI 10.1105/tpc.111.086199; originally published online July 8, 2011;Plant Cell
Guy Wachsman, Renze Heidstra and Ben ScheresRevealed by the Brother of Brainbow Clonal Analysis System
Stem CellsArabidopsis in RETINOBLASTOMA-RELATEDDistinct Cell-Autonomous Functions of
This information is current as of March 9, 2019
Supplemental Data /content/suppl/2011/07/06/tpc.111.086199.DC2.html /content/suppl/2011/06/29/tpc.111.086199.DC1.html
Permissions https://www.copyright.com/ccc/openurl.do?sid=pd_hw1532298X&issn=1532298X&WT.mc_id=pd_hw1532298X
eTOCs http://www.plantcell.org/cgi/alerts/ctmain
Sign up for eTOCs at:
CiteTrack Alerts http://www.plantcell.org/cgi/alerts/ctmain
Sign up for CiteTrack Alerts at:
Subscription Information http://www.aspb.org/publications/subscriptions.cfm
is available at:Plant Physiology and The Plant CellSubscription Information for
ADVANCING THE SCIENCE OF PLANT BIOLOGY © American Society of Plant Biologists