Dissolution Modeling for Real Time Release Testing (RTRT) · Dissolution Modeling for Real Time...
15
Dissolution Modeling for Real Time Release Testing (RTRT) Hanlin Li, Justin Prichard, Kelly A. Swinney ©2016 Vertex Pharmaceuticals Incorporated
Transcript of Dissolution Modeling for Real Time Release Testing (RTRT) · Dissolution Modeling for Real Time...
Dissolution Modeling for Real Time Release Testing (RTRT)Hanlin Li, Justin Prichard, Kelly A. Swinney
©2016 Vertex Pharmaceuticals Incorporated

Outline
• Introduction to continuous manufacturing and RTRT at Vertex• RTRT for dissolution – model development approach• Case Study
©2016 Vertex Pharmaceuticals Incorporated2

Early finalization of formulation/process on commercial scale
“Data rich” QbD commercial design space
High quality, consistent product
Vertex Business Drivers for Continuous Manufacturing
©2016 Vertex Pharmaceuticals Incorporated3
©2012 Vertex Pharmaceuticals Incorporated4 4 ©2012 Vertex Pharmaceuticals Incorporated .
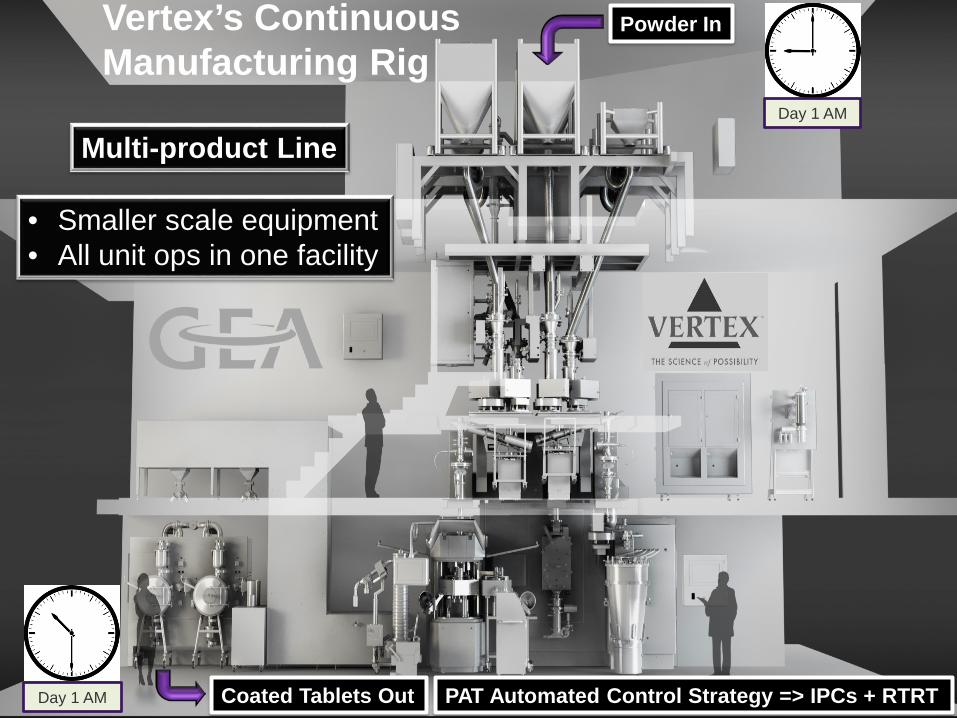
Powder In
Day 1 AM
Day 1 AM Coated Tablets Out
Vertex’s Continuous Manufacturing Rig
Multi-product Line
• Smaller scale equipment• All unit ops in one facility
PAT Automated Control Strategy => IPCs + RTRT
Tablet Press
PFLS
W Th H
PAT5b
Waste
STEP 6, COMPRESSION
Fluid Bed Dryer
drying air in
drying air out
Granulation liquid 1
PAT4 LHP
100L
1000L 1000L 1000L HC
10L
Mill
PAT3bPAT3a LHP 10L
100L100L
10L
Deduster
MC
Bucket Lift
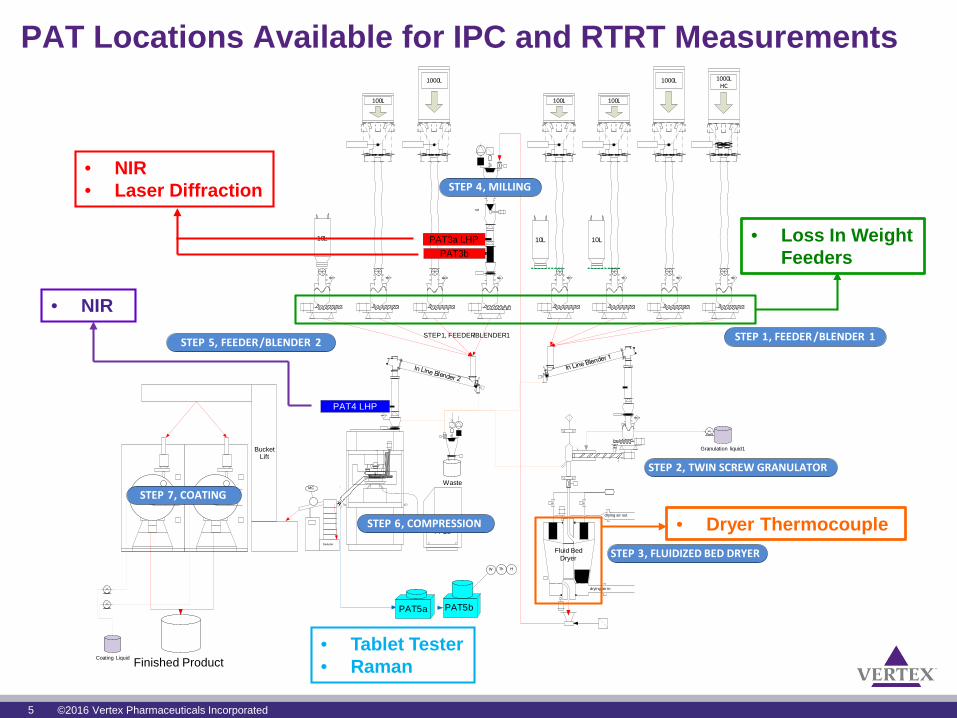
STEP 5, FEEDER/BLENDER 2 STEP 1, FEEDER /BLENDER 1
STEP 2, TWIN SCREW GRANULATOR
PAT1 NIR, measures material attributes during screening of raw materials
PAT2, NIR , measures composition and BU
PAT3a, NIR, measures granule uniformity, LOD, solid state form and physical attributes of granulesPAT3b, Laser Diffraction, measures particle size distribution
PAT4, NIR , measures composition and BU
PAT5a, Raman, measures assay and CUPAT5b, Weight, hardness, thickness
PAT6, Raman, measures coat thickness
STEP 7, COATING
STEP 3, FLUIDIZED BED DRYER
STEP 4, MILLING
Coating Liquid Finished Product
STEP 1, FEEDER/BLENDER 1
PAT5a
• Tablet Tester• Raman
• NIR• Laser Diffraction
• NIR
PAT Locations Available for IPC and RTRT Measurements
5
• Loss In Weight Feeders
• Dryer Thermocouple
5 ©2016 Vertex Pharmaceuticals Incorporated

CM Control Strategy Building Blocks
In-Process Controls
Design Space Monitoring
Unit Operation Control to Set Point
RTRTMaterial considered for release is manufactured within the DS (CPPs) and conforms to IPC criteria
Material is segregated from the process
IPC failure
Outside DSL
66 ©2016 Vertex Pharmaceuticals Incorporated Vertex Confidential Information

Example of RTRT for Continuous Manufacturing
7
Critical Quality Attribute PAT Technology RTRT Method Material
Identification Raman Confirm presence of API Core Tablet
AssayNIR
WeightAPI Content
Tablet WeightFinal BlendCore Tablet
DissolutionLaser Diffraction
NIRWTH
Granule Particle SizeAPI Content, Water Content
Tablet Weight, Hardness, Thickness
Milled GranulesFinal BlendCore Tablet
Water Content NIR Water Content Final Blend
Content Uniformity
NIRWeight
Variance in API ContentVariance in Tablet weight
Final BlendCore Tablet
Physical Form Raman API physical form Core Tablet
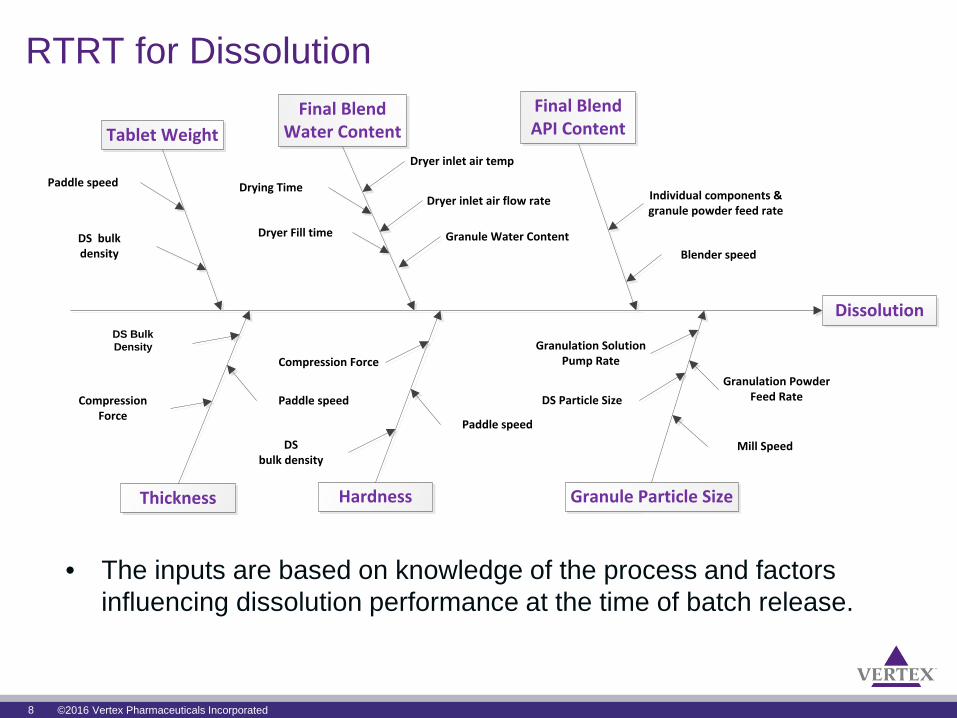
RTRT for Dissolution
8
Dissolution
Tablet Weight
Hardness
Final BlendAPI Content
Granule Particle Size
Compression Force
Thickness
Granulation SolutionPump Rate
DS Particle SizeGranulation Powder
Feed Rate
Individual components & granule powder feed rate
DSbulk density
Final Blend Water Content
Paddle speed
Drying Time
Dryer Fill time
Dryer inlet air flow rate
Mill Speed
VX-770 SDD bulkdensity
CompressionForce
Granule Water ContentBlender speed
Dryer inlet air temp
Paddle speed
Paddle speed
DS bulkdensity
• The inputs are based on knowledge of the process and factors influencing dissolution performance at the time of batch release.
©2016 Vertex Pharmaceuticals Incorporated
DS Bulk Density
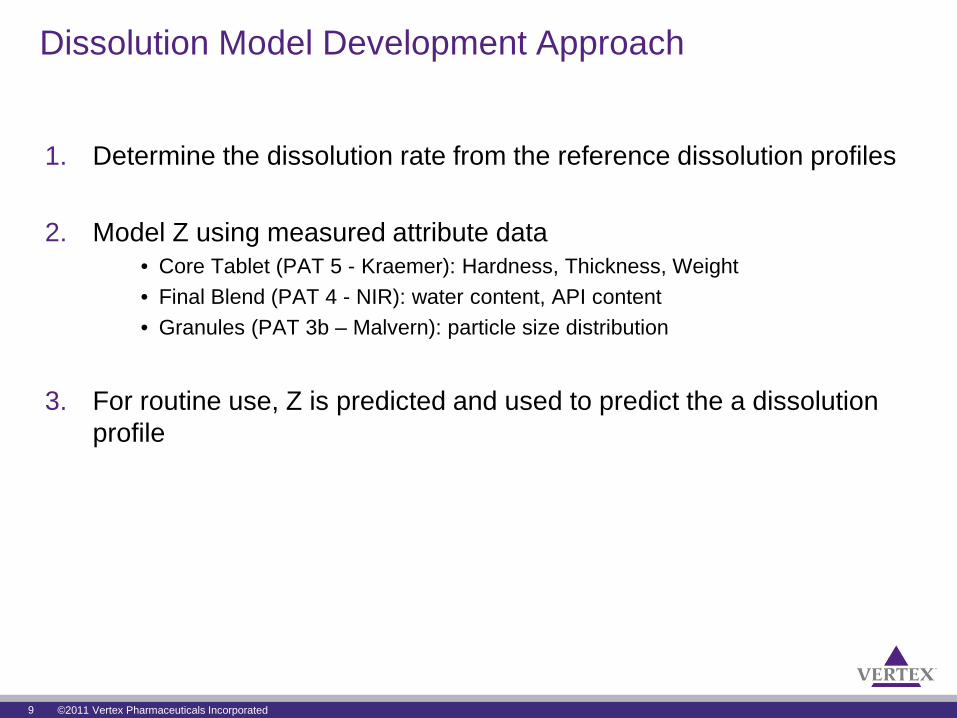
Dissolution Model Development Approach
1. Determine the dissolution rate from the reference dissolution profiles
2. Model Z using measured attribute data• Core Tablet (PAT 5 - Kraemer): Hardness, Thickness, Weight• Final Blend (PAT 4 - NIR): water content, API content• Granules (PAT 3b – Malvern): particle size distribution
3. For routine use, Z is predicted and used to predict the a dissolution profile
©2011 Vertex Pharmaceuticals Incorporated9

Step 1: Determine the dissolution rate from the reference dissolution profiles
• LC: dissolution % at time t• Dose: dose• Fixed parameters
• n: shape factor • Vol: volume• S: solubility
• Parameters to be fitted:• z: rate (scale) factor• p: plateau
𝑑𝑑𝑑𝑑𝑑𝑑𝑑𝑑𝑑𝑑
= 𝑧𝑧 𝑝𝑝 − 𝑑𝑑𝑑𝑑 𝑛𝑛(𝑆𝑆 −𝐷𝐷𝐷𝐷𝐷𝐷𝐷𝐷𝑉𝑉𝐷𝐷𝑉𝑉
𝑑𝑑𝑑𝑑)
©2011 Vertex Pharmaceuticals Incorporated10

Step 2: Model dissolution rate using measured attribute data
©2011 Vertex Pharmaceuticals Incorporated11
Reference Dissolution Rate
Pre
dict
ed D
isso
lutio
n R
ate

Reconstruct Dissolution Curve using Predicted Dissolution Rate
12

RTRT Dissolution Model: Case Study
13
B a tc h 1
T im e
% D
iss
olv
ed
0 2 0 4 0 6 0 8 0 1 0 0
4 0
6 0
8 0
1 0 0
Q C M e th o d
R T R T M ode l
B a tc h 2
T im e%
D
iss
olv
ed
0 2 0 4 0 6 0 8 0 1 0 0
4 0
6 0
8 0
1 0 0
Q C M e th o d
R T R T M ode l
USP <1092>: Absolute difference not more than 5% for time points > 85% released
©2016 Vertex Pharmaceuticals Incorporated
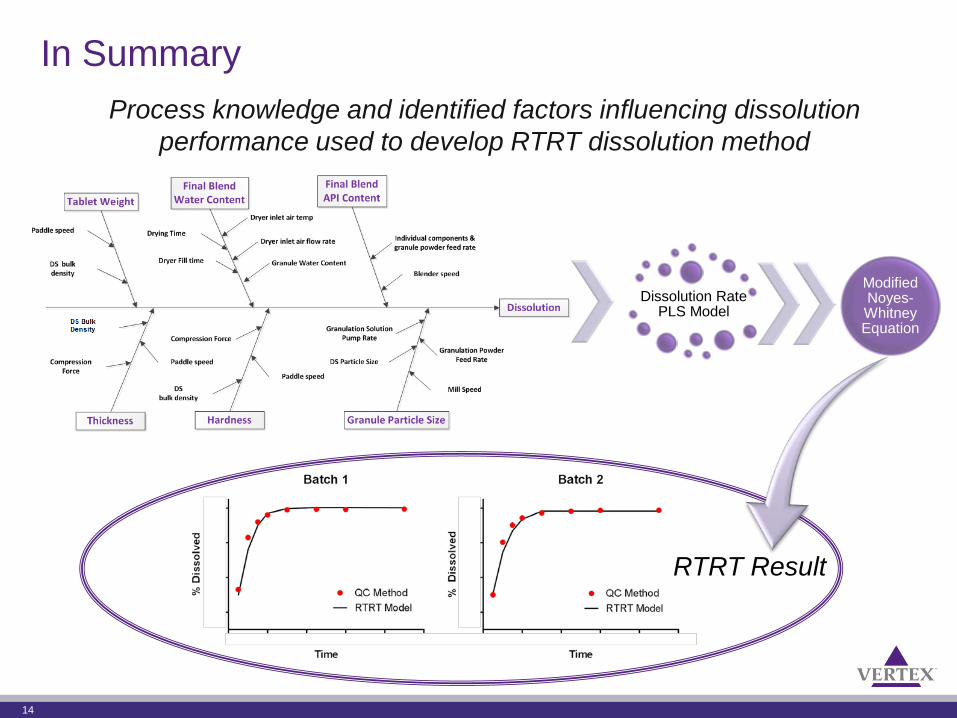
In Summary
14
Process knowledge and identified factors influencing dissolution performance used to develop RTRT dissolution method
Dissolution Rate PLS Model
Modified Noyes-Whitney Equation
RTRT Result
• Vertex Team• Pharmaceutical and Preclinical Science• Technical Operations• Supply Chain Management• Quality• CMC Regulatory• Facilities• Global Information Systems
• Equipment Manufacturers
• Our CMOs, Suppliers, and Research Collaborators
• Regulatory Agencies (FDA, EMA, MHRA, etc)
Acknowledgements
15 ©2016 Vertex Pharmaceuticals Incorporated