research.vu.nl dissertation.pdf · ! The studies described in this thesis were carried out at the...
168
Transcript of research.vu.nl dissertation.pdf · ! The studies described in this thesis were carried out at the...
EXPLORING THE POTENTIAL ROLEOF THE PROTEIN, ALPHA-SYNUCLEIN, AS DIAGNOSTICTARGET FOR PARKINSON’SDISEASE.
NOUR K. MAJBOUR

The studies described in this thesis were carried out at the department of Anatomy
and Neurosciences of the VU University Medical Center, Amsterdam Neuroscience,
Amsterdam, the Netherlands, and College of Medicine and Health Sciences, United
Arab Emirates University, Al-Ain, UAE.
The study described in chapter 3 was partly funded by Parkinson Vereniging and
Amsterdam Neuroscience (to dr. van de Berg/prof dr. Berendse).
© 2019 by Nour Majbour, Amsterdam, the Netherlands.
All rights reserved. No part of this publication may be reproduced or transmitted in
any form or by any means without the prior written consent of the author.

ALPHA-SYNUCLEIN; THE MOST ATTRACTIVE MOLECULE IN PARKINSON’S DISEASE
EXPLORING THE POTENTIAL ROLE OF THE PROTEIN, ALPHA-
SYNUCLEIN, AS DIAGNOSTIC TARGET FOR PARKINSON’S DISEASE.
Nour K. Majbour
VRIJE UNIVERSITEIT
EXPLORING THE POTENTIAL ROLE OF THE PROTEIN, ALPHA-‐SYNUCLEIN,
AS DIAGNOSTIC TARGET FOR PARKINSON’S DISEASE
ACADEMISCH PROEFSCHRIFT ter verkrijging van de graad Doctor of Philosophy aan
de Vrije Universiteit Amsterdam, op gezag van de rector magnificus
prof.dr. V. Subramaniam, in het openbaar te verdedigen
ten overstaan van de promotiecommissie van de Faculteit der Geneeskunde
op maandag 11 maart 2019 om 15.45 uur in de aula van de universiteit,
De Boelelaan 1105
door
Nour Khaled Majbour
geboren te Abu-‐Dhabi, Verenigde Emiraten

promotoren: prof.dr. O.M.A. El-‐Agnaf prof.dr. H.W. Berendse
copromotor: dr. W.D.J. van de Berg

beoordelingscommissie: prof. M.G. Spillantini prof.dr.ir. C.E. Teunissen prof.dr. J.J.van Hilten prof.dr. R.M.A. de Bie prof.dr. W.M van der Flier

7 GENERAL INTRODUCTION, AIM & OUTLINE OF THE THESIS
14 CHAPTER 1
Body Fluid Biomarkers in Parkinson’s Disease. Submitted to Nature Reviews Neurology
35 CHAPTER 2
Generation and Characterization of Novel Conformation-Specific Monoclonal Antibodies for Α-Synuclein Pathology. Neurobiology of Disease
75 CHAPTER 3
Oligomeric and Phosphorylated Alpha-Synuclein as Potential CSF Biomarkers for Parkinson’s Disease. Molecular Neurodegeneration
101 CHAPTER 4
Longitudinal Changes in CSF Alpha-Synuclein Species Reflect Parkinson's Disease Progression. Movement Disorders
116 CHAPTER 5
Increased Levels of CSF Total but Not Oligomeric or Phosphorylated Forms of Alpha-Synuclein in Patients Diagnosed with Probable Alzheimer's Disease. Scientific Reports
129 CHAPTER 6
CSF Oligomeric Alpha-Synuclein Levels as a Preclinical Marker of Parkinson’s Disease: A Study in LRRK2 Mutation Carriers and Sporadic Parkinson’s Disease Cases. Submitted to Neurology
149 CHAPTER 7
Summary & General Discussion
161 APPENDIX List of Publications
Word of Thanks About the Author

To My Parents

!!
GENERAL INTRODUCTION, AIM AND OUTLINE OF THE THESIS

8
GENERAL INTRODUCTION,
AIM AND OUTLINE OF THE THESIS
Although the first formal description of Parkinson disease (PD) by the English physician James Parkinson
in his essay on the “Shaking Palsy” was written more than 200 years ago, many aspects of the disease
remain to be elucidated. PD is a progressive, irreversible and age-related neurodegenerative disorder [1].
Of the many clinical symptoms that characterize PD, bradykinesia, muscle rigidity, resting tremor and
postural instability remain the cardinal ones [2]. In the recent years, we have come to appreciate that while
PD is a movement disorder, it also presents with a wide range of non-motor symptoms, such as cognitive
impairment, REM sleep behavior disorder, anxiety, depression and hyposmia [3]. Patients presenting with
bradykinesia in combination with muscle rigidity, resting tremor and/or postural instability are what
clinicians diagnose as PD. While severe autonomic involvement, cerebellar signs or early severe dementia
would rule out PD possibility. Clinical diagnosis also relies on progressive nature of the disease, a positive
effect of dopamine replacement therapy and a unilateral onset. [4]. Considering the progressive nature of
the disease and the overlapping of the clinical symptoms with other disorders such as essential tremor,
vascular parkinsonism, progressive supranuclear palsy (PSP), multiple system atrophy (MSA), diagnostic
accuracy of PD at the early stages yet to be improved [5, 6].
Neuropathologically, PD is mainly characterized by region-specific dopaminergic loss in the substantia
nigra pars compacta (SNpc) within the midbrain. Degeneration of the dopaminergic neurons results in
reduced levels of dopamine contributing to the motor dysfunction associated with PD [7]. In 1912, while
Friedrich Lewy was examining the brains of people who died with a clinical diagnosis of PD, he noticed
abnormal microscopic structures which are now known as Lewy bodies (LBs) [8] . LBs and Lewy neurites
(LNs) are the neuropathological hallmark of PD and dementia with Lewy bodies (DLB). LBs are
eosinophilic intracytoplasmic neuronal inclusions that are mainly composed of the protein alpha-synuclein
(α-syn) [8]. With that stated, Braak and Braak have also reflected on the fact that α-synuclein pathology
extends well beyond the substantia in their staging scheme [9].
α-Syn is a pre-synaptic neuronal protein and its aggregation and dysfunction is linked to a number of
neurodegenerative disorders named “synucleinopathies”. Actually, Since 1998 PD, dementia with Lewy
bodies (DLB) and multiple system atropgy (MSA) were frequently referred to as “synucleinopathies” [10].
The first antibodies against α-syn, produced in 1988, labeled both synapses and nuclei in the brain, leading
to the naming of synuclein [9, 11]. The precise function of this protein is not fully understood. However,
several lines of evidence through studies on different model organisms, suggest that α-syn is a major player

9
in vesicle trafficking, synaptic plasticity and neurotransmitter release [12]. α-Syn is subjected to several
post-translational modifications such as phosphorylation, oxidation, nitrosylation, truncation and
ubiquitination [13]. However, whether these post-translational modifications act to enhance or inhibit α-
syn neurotoxicity remains to be understood. . α-Syn is natively unfolded proteins, meaning that under
natural physiological conditions, it has a linear structure as random coils. However, numerous findings
suggest that α-syn aggregation plays a central role in the pathogenesis of synucleinopathies [14]. A better
understanding of the role of α-syn post-translational modifications may therefore help to elucidate the exact
role of α-syn in the pathogenesis of PD, paving the way for the development of new diagnostic and
therapeutic strategies for synucleinopathies. A number of findings have led to the speculation that the
aggregation of α-syn has a seminal role in PD. First, α-syn aggregates are the major component of LBs and
LNs. Second, several mutations in SNCA, the gene encoding α-syn protein, are associated with autosomal
dominantly inherited forms of PD [15]. Third, five missense α-syn mutations have been linked to rare forms
of early-onset familial PD [16-20], and they have been shown to increase α-syn aggregation in vitro.
furthermore, it has been also shown that mutant α-syn contain more β-sheet structure higher and causes
higher rates of α-syn self-oligomerization in vitro and amyloid fibrils formation compared to wild-type α-
syn [21, 22]. Based upon these observations, extensive efforts were put into the elucidation of pathogenic
mechanisms leading to α-syn polymerization and aggregation.
Despite major progress in our understanding of PD, we still lack effective disease-modifying therapies and
disease-specific biomarkers Treatments in most settings are symptomatic, and mainly focus on dopamine
replacement therapy. The clinical diagnostic criteria for PD have limited sensitivity and specificity,
particularly in the first years of the disease, mainly because PD is characterized by a striking heterogeneity
in clinical motor and non-motor features, rate of progression and susceptibility to the development of
adverse side effects. The struggle in detecting the disease at earlier stages, and the absence of reliable
methods to monitor disease progression or to assess response to treatments are other factors illustrating the
need for biomarkers. Many different approaches to the development of diagnostic and progression
biomarkers have emerged in recent years, with body fluid and brain imaging biomarkers at the forefront.
Biomarkers are objective measures of a disease state, disease progression and/or susceptibility to a disease.
Imaging techniques are increasingly employed to improve the accuracy of PD diagnosis. MRI scanning can
help to exclude secondary causes of parkinsonism [23], whereas single photon emission computed
tomography (SPECT) or Positron Emission Tomography (PET) can can facilitate the differential diagnosis
between PD and drug-induced, psychogenic and vascular parkinsonism or essential tremor. However, these
functional imaging techniques do not help to differentiate PD from other neurodegenerative parkinsonian
syndromes, such as MSA or PSP [24].

10
The great need for biomarkers that facilitate an early and reliable diagnosis of PD, preferably before the
actual development of clinical motor features, and the absolute necessity for monitoring disease progression
and response to treatment were the driving forces behind the work presented in the current thesis. The first
chapter of this thesis (Chapter 1) is a review of the progress made towards the development and validation
of PD biomarkers to improve disease detection and diagnosis. The original research conducted in the current
thesis primarily focuses on exploring the potential of the protein alpha-synuclein and its different forms as
biomarkers for PD in human CSF samples.
The key issues that we aimed to address in this thesis were:
1) Is it possible to overcome the limitations of pan antibodies to α-syn by generating conformation-
specific antibodies?
2) Can we develop robust methods to quantify the levels of α-syn forms in biological fluids from
patients and age-matched controls with optimal sensitivity and specificity?
3) Can the levels of CSF α-syn forms contribute to an early diagnosis of PD?
4) Can the levels of CSF α-syn forms reflect disease progression in PD?
5) Can the levels of CSF α-syn forms help identify individuals at risk of developing PD?
The development and thorough characterization of novel conformation-specific monoclonal antibodies for
α-syn is described in Chapter 2. Next, to measure α-syn in biofluids, we developed novel assays that can
overcome the limitations of conventional methods and serve as potential diagnostic tools for PD, as reported
in Chapter 3. Within the same chapter, our novel assays namely for t-, o- and pSer129-α-syn were deployed
in a cross-sectional analysis of human CSF samples from a Dutch cohort of PD patients and age-matched
healthy controls. In addition, we assessed the discriminating power of combining multiple CSF α-syn
species with classical AD biomarkers, and explored the correlation with clinical parameters. The next
logical question was whether α-syn species can serve as progression biomarkers for PD, and the answer
came from using the same assays to analyze samples from the longitudinal Deprenyl and Tocopherol
Antioxidative Therapy (DATATOP) for Parkinsonism study cohort, as detailed in Chapter 4. In short, the
DATATOP study was a multicenter, placebo-controlled clinical trial in patients with early-stage PD. All
patients were followed for an average of 2 years to an endpoint defined as the development of clinical
symptoms of sufficient severity to require dopamine replacement therapy. The study described in Chapter
5 was based upon a series of neuropathological findings of co-existence of α-syn and tau pathology in the
brains of patients with AD, PD and DLB, raising the question of whether α-syn species can improve the
diagnostic performance of classical AD biomarkers. This question was addressed in an Italian cohort of
CSF samples from AD patients who showed a CSF profile typical of AD at baseline as well as in cognitively
intact control subjects. Based upon the findings presented in the previous chapters, the next intriguing

11
question was whether α-syn would facilitate the diagnosis of PD at its prodromal stage or allow the
identification of high-risk individuals. To address this question we studied CSF levels of α-syn species in
symptomatic and asymptomatic leucine-rich repeat kinase 2 (LRRK2) mutation carriers, as well as in
sporadic PD patients and healthy control subjects, the results of which are described in Chapter 6. In the
last chapter, Chapter 7, we review and discuss the results of all individual chapters, portray the full picture
of the knowledge gained, and articulate how such knowledge can create a solid foundation for future studies.

12
References [1] Sherwood, "Parkinson, J. An Essay on the Shaking Palsy," N. & and Jones, Eds., ed, 1817. [2] E. R. Dorsey et al., "Projected number of people with Parkinson disease in the most
populous nations, 2005 through 2030," (in eng), Neurology, vol. 68, no. 5, pp. 384-‐6, Jan 2007.
[3] A. Schrag, U. F. Siddiqui, Z. Anastasiou, D. Weintraub, and J. M. Schott, "Clinical variables and biomarkers in prediction of cognitive impairment in patients with newly diagnosed Parkinson's disease: a cohort study," (in eng), Lancet Neurol, vol. 16, no. 1, pp. 66-‐75, Jan 2017.
[4] R. B. Postuma et al., "MDS clinical diagnostic criteria for Parkinson's disease," (in eng), Mov Disord, vol. 30, no. 12, pp. 1591-‐601, Oct 2015.
[5] J. C. Greenland, C. H. Williams-‐Gray, and R. A. Barker, "The clinical heterogeneity of Parkinson's disease and its therapeutic implications," (in eng), Eur J Neurosci, Jul 2018.
[6] S. M. van Rooden, W. J. Heiser, J. N. Kok, D. Verbaan, J. J. van Hilten, and J. Marinus, "The identification of Parkinson's disease subtypes using cluster analysis: a systematic review," (in eng), Mov Disord, vol. 25, no. 8, pp. 969-‐78, Jun 2010.
[7] E. Masliah et al., "Dopaminergic loss and inclusion body formation in alpha-‐synuclein mice: implications for neurodegenerative disorders," (in eng), Science, vol. 287, no. 5456, pp. 1265-‐9, Feb 2000.
[8] M. G. Spillantini, R. A. Crowther, R. Jakes, M. Hasegawa, and M. Goedert, "alpha-‐Synuclein in filamentous inclusions of Lewy bodies from Parkinson's disease and dementia with lewy bodies," (in eng), Proc Natl Acad Sci U S A, vol. 95, no. 11, pp. 6469-‐73, May 26 1998.
[9] H. Braak, K. Del Tredici, U. Rüb, R. A. de Vos, E. N. Jansen Steur, and E. Braak, "Staging of brain pathology related to sporadic Parkinson's disease," (in eng), Neurobiol Aging, vol. 24, no. 2, pp. 197-‐211, 2003 Mar-‐Apr 2003.
[10] M. Goedert and M. G. Spillantini, "Lewy body diseases and multiple system atrophy as alpha-‐synucleinopathies," (in eng), Mol Psychiatry, vol. 3, no. 6, pp. 462-‐5, Nov 1998.
[11] L. Maroteaux, J. T. Campanelli, and R. H. Scheller, "Synuclein: a neuron-‐specific protein localized to the nucleus and presynaptic nerve terminal," (in eng), J Neurosci, vol. 8, no. 8, pp. 2804-‐15, Aug 1988.
[12] A. Villar-‐Piqué, T. Lopes da Fonseca, and T. F. Outeiro, "Structure, function and toxicity of alpha-‐synuclein: the Bermuda triangle in synucleinopathies," (in eng), J Neurochem, vol. 139 Suppl 1, pp. 240-‐255, Oct 2016.
[13] A. W. Schmid, B. Fauvet, M. Moniatte, and H. A. Lashuel, "Alpha-‐synuclein post-‐translational modifications as potential biomarkers for Parkinson's disease and other synucleinopathies," (in ENG), Mol Cell Proteomics, Aug 2013.
[14] M. G. Spillantini and M. Goedert, "Neurodegeneration and the ordered assembly of α-‐synuclein," (in eng), Cell Tissue Res, vol. 373, no. 1, pp. 137-‐148, Jul 2018.
[15] A. B. Singleton, M. J. Farrer, and V. Bonifati, "The genetics of Parkinson's disease: progress and therapeutic implications," (in eng), Mov Disord, vol. 28, no. 1, pp. 14-‐23, Jan 2013.

13
[16] S. Appel-‐Cresswell et al., "Alpha-‐synuclein p.H50Q, a novel pathogenic mutation for Parkinson's disease," (in eng), Mov Disord, vol. 28, no. 6, pp. 811-‐3, Jun 2013.
[17] R. Krüger et al., "Ala30Pro mutation in the gene encoding alpha-‐synuclein in Parkinson's disease," (in eng), Nat Genet, vol. 18, no. 2, pp. 106-‐8, Feb 1998.
[18] M. H. Polymeropoulos et al., "Mutation in the alpha-‐synuclein gene identified in families with Parkinson's disease," (in eng), Science, vol. 276, no. 5321, pp. 2045-‐7, Jun 1997.
[19] C. Proukakis et al., "A novel α-‐synuclein missense mutation in Parkinson disease," (in eng), Neurology, vol. 80, no. 11, pp. 1062-‐4, Mar 2013.
[20] J. J. Zarranz et al., "The new mutation, E46K, of alpha-‐synuclein causes Parkinson and Lewy body dementia," (in eng), Ann Neurol, vol. 55, no. 2, pp. 164-‐73, Feb 2004.
[21] O. M. El-‐Agnaf et al., "Aggregates from mutant and wild-‐type alpha-‐synuclein proteins and NAC peptide induce apoptotic cell death in human neuroblastoma cells by formation of beta-‐sheet and amyloid-‐like filaments," (in eng), FEBS Lett, vol. 440, no. 1-‐2, pp. 71-‐5, Nov 1998.
[22] K. A. Conway, J. D. Harper, and P. T. Lansbury, "Fibrils formed in vitro from alpha-‐synuclein and two mutant forms linked to Parkinson's disease are typical amyloid," (in eng), Biochemistry, vol. 39, no. 10, pp. 2552-‐63, Mar 2000.
[23] A. Schrag et al., "Differentiation of atypical parkinsonian syndromes with routine MRI," (in eng), Neurology, vol. 54, no. 3, pp. 697-‐702, Feb 2000.
[24] W. E. Weber and A. M. Vlaar, "Role of DAT-‐SPECT in diagnostic work-‐up of Parkinsonism," (in eng), Mov Disord, vol. 23, no. 5, pp. 774; author reply 774-‐5, Apr 2008.

14
!!
CHAPTER 1
Body Fluid Biomarkers in Parkinson’s Disease

15
CHAPTER 1 | Body Fluid Biomarkers in Parkinson’s Disease Nour K. Majbour1,2, Brit Mollenhauer3, Jing Zhang4, Takahiko Tokuda5, Wilma D. J. van de Berg2,
Henk W. Berendse6, Omar M. A. El-‐Agnaf1* 1Neurological Disorders Research Center, Qatar Biomedical Research Institute (QBRI), Hamad Bin Khalifa University (HBKU), Education City, Qatar. 2Department of Anatomy and Neurosciences, Neuroscience Campus Amsterdam, VU University Medical Centre, Amsterdam, The Netherlands 3Paracelsus-‐Elena-‐Klinik, Kassel, Germany. 4University of Washington, Seattle, WA, USA. 5Department of Neurology, Research Institute for Geriatrics, Kyoto Prefectural University of Medicine, Kyoto, 602-‐0841 Japan 6Department of Neurology, Neuroscience Campus Amsterdam, VU University Medical Centre, Amsterdam, The Netherlands Correspondence to: Prof. Omar M.A. El-‐Agnaf, Neurological Disorders Center, Qatar Biomedical Research Institute, Education City, Qatar Foundation, P.O. Box 5825 Doha, Qatar Mobile: (+974) 55 93 55 68 E-‐mail: [email protected] Under Review by Nature Reviews Neurology. Oct 2018

16
Abstract
Parkinson’s disease was first described over 200 years ago by James Parkinson, yet only in the
past two decades our understanding of the molecular underpinnings of this progressive disorder,
the neuropathological features and the genetic risk factors has increased at a revolutionary pace.
In spite of the current lack of objective biomarkers to diagnose Parkinson’s disease early in its
course or to serve as endpoints in clinical trials, tangible progress at identifying biomarkers has
been made over the past ten years. Growing attention has been paid to several promising biofluids
markers that could potentially contribute to disease diagnosis and monitoring of disease
progression or the effects of disease-modifying interventions. This Review highlights the progress
in the discovery and evolution of Parkinson’s disease diagnostic and progression biomarkers in
human body fluids, including the identification of at-risk individuals.

17
I. Introduction
Parkinson’s disease (PD) was described for the first time over two centuries ago. However, its
etiology remains an enigma 1. While a cure remains elusive, many promising therapeutic
interventions for PD have emerged over the past few years. Treatments in most settings rely heavily
on pharmacological interventions to alleviate symptoms, yet are ineffective in targeting underlying
pathological mechanisms. The clinical signs and symptoms of PD are not disease-specific, making
the conventional clinical criteria suboptimal. PD encompasses a wide range of motor and non-
motor symptoms with a large variation in disease-onset and progression among patients, making
the early diagnosis for PD very challenging 2,3. The gold standard remains the neuropathological
presence of aggregated α-synuclein and neuronal loss. The limitations surrounding the clinical
diagnosis of PD could be overcome by the implementation of disease-specific body fluid
biomarkers.
Another purpose for body fluid biomarkers is the identification of the disease in its earliest stages,
i.e. in the long premotor phase that characterizes PD 4. This premotor phase can serve as a window
for early therapeutic interventions aimed at slowing down or perhaps halt disease progression.
Therapeutic intervention is likely to hold the greatest impact during the early stages of the disease.
Currently, the absence of robust biomarkers is a major hurdle to conduct clinical trials of potential
disease-modifying therapies at the time when therapeutic intervention is likely to hold the greatest
impact. Ideally, a reliable biomarker or biomarker panel for PD should reflect the clinical disease
state as well as defined underlying mechanisms of PD neuropathology, be validated in
neuropathologically confirmed PD subjects, be able to establish an early diagnosis of PD and
distinguish it from other synucleinopathies. In addition, the biomarker (panel) should be cost-
effective, highly reproducible, minimally-invasive, and qualify as a surrogate endpoint in clinical
trials.
In PD, as in many other neurodegenerative disorders, the pathological accumulation of misfolded
proteins is the dominant feature underlying the disease. Alpha-synuclein (α-syn) is the main protein
implicated in the pathogenesis of PD, whereas, neuropathologically Lewy bodies (LBs) and Lewy
neurites (LNs) are the defining lesions of the disease 5. The conversion of monomeric α-syn into
soluble oligomers and protofibrils before maturating into insoluble amyloid fibrils, has attracted
researchers’ attention to identify diagnostic and therapeutic targets for PD and related disorders 6.
Of the many impediments facing the diagnosis of PD, the heterogeneity of the disease within the
PD spectrum and significant overlap with other neurodegenerative diseases are the main ones.
These diseases include dementia with Lewy bodies (DLB) and multiple system atrophy (MSA), the
so-called “synuclein aggregation disorders” as well as other neurodegenerative disorders, such as

18
Alzheimer’s disease (AD), where a significant portion of cases demonstrate Lewy bodies at autopsy
and/or vascular lesions 7. Neuroprotective strategies in PD aim to target among others α-syn
aggregation and therefore overlapping clinical features with non-synuclein aggregation disorders
are challenging in the implementation of a disease-specific therapy. In spite of the current lack of
objective biomarkers for PD, a tangible progress at identifying the main potential biomarkers has
been made over the past two decades. This will be addressed in the present review.
II. α-Synuclein; the most attractive target in PD pathology
It was 20 years ago, when two major findings brought α-syn to the forefront of PD aetiology and
pathogenesis. The first finding was done in 1997, when a missense mutation (A53T) identified in
SNCA, the gene encoding for α-syn, was linked to familial PD in families of Greek origin 8. It
wasn’t long before a second mutation that caused early-onset PD in a German pedigree was
discovered in 1998 in the same gene (A30P) 9. The second clue came from Spillantini and
colleagues, who showed that α-syn was the main component of LBs and LNs in idiopathic PD brain
tissue 5,10. Later on, duplication and triplication of SNCA were also linked to early-onset, rapid
progression cases of sporadic PD, imparting that elevated levels of wild-type α-syn would also put
individuals at greater risk of developing PD as well as worsening disease prognosis as a gene dosage
effect 11,12.
α-Syn is a 140 amino acid protein that is highly abundant in the brain, where it is primarily localized
in presynaptic terminals 13. It is also present in red blood cells, plasma, serum, cerebrospinal fluid
(CSF), saliva, skin nerves and many other peripheral tissues such as colon and submandilar glands 14,15. Although a great interest has emerged about the likely pathogenic significance of α-syn, its
normal function remains poorly understood. Several lines of evidence, through studies on different
model organisms, suggest that α-syn is a major player in vesicle trafficking, synaptic plasticity and
neurotransmitter release supported by its intracellular localization in the presynaptic terminals 16.
Until recently, not much was known about the role of α-syn in inflammation. This has now changed,
since many studies have highlighted the role of the protein in inducing innate and adaptive
immunity, while others described its implication in pro-inflammatory cascades in microglia or
mediator of astroglial inflammatory responses 17-19.
II.I Dear α-synuclein, what can you tell us about PD? Growing evidence favours the hypothesis that α-syn aggregation is central to the neurodegeneration
in synuclein aggregation disorders. Native α-syn exist as unfolded monomer, however, under
certain conditions, α-syn monomers undergo a conformational transition, in which soluble
monomers initially form oligomers, then gradually assemble into protofibrils and eventually form

19
the large insoluble amyloid fibrils resembling the filaments present in human LBs and LNs 20. The
factors that determine the accumulation and aggregation of α-syn are diverse, but summate to result
either in upregulation of the protein expression, impaired degradation or increased likelihood for
its oligomerization and aggregation 20. It was the discovery of α-syn in CSF and blood in early 2000
that shed light for the first time on α-syn as a putative biomarker for PD 14,21. Since then, many
research groups including ours have tried to quantify the levels of α-syn species in biological fluids,
most prominently total α-syn but with varying results.
II.II Total alpha-synuclein; good but not good enough Exploring α-syn as a diagnostic biomarker, cross-sectional analysis of CSF total-α-syn in most
studies have shown t-α-syn to be decreased either in early drug-naïve PD patients 22-24, or in patients
with moderate to advanced PD 25 compared to healthy controls or AD 26 (Steenoven et al.,
Movement Disorders 2018, in press). When testing plasma and saliva samples, which are easily
accessible fluids and thus more attractive targets for biomarker development, t-α-syn levels in these
fluids were not significantly different between PD patients and healthy subjects 25. Unfortunately,
the reduction in CSF t- α-syn, is not specific for PD, but has also been reported in other synuclein-
related disorders like DLB and MSA and with tremendous overlap also with non-synuclein
disorders. In most studies exploring whether t-α-syn could reflect disease severity, an inverse
correlation with cognitive impairment was observed.
The role that t-α-syn could play as a progression biomarker does not seem to be sufficient either.
In longitudinal cohort studies, CSF levels of t-α-syn remained relatively stable over a follow-up
duration of either 24 months in the PPMI study or up to 4 years in the Norwegian ParkWest study 27,28. In other longitudinal studies CSF t-α-syn either showed a longitudinal increase over the early
course of the disease 29,30, or a significant decrease with PD progression 31. Two studies found
baseline CSF t-α-syn to predict cognitive decline in PD over the course of the disease 31,32. Although
most of the t-α-syn biomarker studies were performed in well-controlled cohorts, there are a
number of factors that may explain the inconsistencies in the above-described observations. These
include pre-analytical factors concerning the collection and the processing of the samples, the assay
platforms and the heterogeneity of patient and controls groups. In this context, the immediate
question is, could we do better when focussing on other species of α-syn?
II.III Oligomeric alpha-synuclein; know the enemy, make it your ally The debate about the most relevant α-syn inclusions to disease pathology has been going on for
some time. While growing evidence tips the scale in favour of soluble α-syn oligomers (o-α-syn)
being directly associated with neurodegeneration, the nature of the exact neurotoxic species
20
remains a point of controversy. The work of many researchers reflected strongly on the
neurotoxicity of α-syn oligomers 16,33,34.
The observation of a significant increase of CSF o-α-syn in PD patients compared to controls by
our group and others 35 brought o-α-syn to the forefront as potential biomarker for PD. When Park
and coworkers quantified α-syn oligomers in both CSF and plasma from drug naïve patients using
ELISA platform 36, CSF o-α-syn levels were elevated in PD compared to control subjects, whereas,
the difference in serum o-α-syn levels did not reach statistical significance. Another study by Aasly
et al. using an an improved version of previously described ELISA 35 explored the potential of t-
and o-α-syn in a LRRK2 cohort 37. Interestingly, o-α-syn was significantly higher in LRRK2 carriers
as well as in sporadic PD subjects compared to healthy controls. Similarly, Parnetti et al., found o-
α-syn to be significantly elevated in PD compared to neurological controls 38. An assessement of
the levels of CSF o-α-syn in a cohort of patients with the most common forms of dementia, i.e.
PDD, DLB and AD, revealed that the levels of o-α-syn were significantly increased in
synucleinopathy dementias rather than in tauopathy dementias 39. While this study didn’t fully
answer whether o-α-syn can serve as potential biomarker for dementia, clues were given of o-α-
syn being more intimately connected to synucleinopathies than tauopathies.
The considerable overlap noted among the diagnostic groups in these studies was revealing. It made
clear that while the method was successful, the assays had limitations. The studies were flawed by
the absence of a calibrator for the oligomeric ELISA, which roadblocked us from understanding
the levels of o-α-syn in terms of the actual concentrations and their relationship to t-α-syn
concentration. Another limitation was the lack of oligomeric-specific antibodies which could
overcome the hurdles with the previous assays. The first oligomeric-specific ELISA using
conformation-specific monoclonal antibodies for PD pathology was described in 2016 22. In this
study by El-Agnaf and coworkers levels of CSF o-α-syn were analysed using conformation-specific
antibodies built-in ELISA, as well as a thoroughly characterized calibrator of α-syn oligomers. The
CSF levels of o-α-syn using the new ELISA were indeed higher in PD, similar to what was reported
before, but the overlap was minimized between the two groups. More recently, in a cross-sectional
analysis of CSF o-α-syn levels in a cohort of PD, DLB, AD and controls with subjective cognitive
decline, o-α-syn was markedly elevated in both PD and DLB patients compared to AD and controls
subjects (Steenoven et al., Movement Disorders 2018, in press). Among the very few studies
assessing longitudinal changes in CSF biomarkers over the course of PD, only one covered CSF o-
α-syn. In the longitudinal DATATOP cohort, a longitudinal increase in o-α-syn over the two-year
follow up period, and a strong positive correlation between the changes in o- and t-α-syn were
observed, unravelling the dynamic pattern of o-α-syn over the early course of PD 29.

21
In recent years the seeding propensity of α-syn in biological fluids has gained increasing interest.
When CSF samples of PD patients and control subjects with other neurological disorders where
screened using protein misfolding cyclic amplification (PMCA) technology, the specificity for PD
reached 96.9% with a sensitivity of 88.5%. While PMCA technology is quite promising, many
questions such as monitoring disease progression or predicting disease in the pre-motor phase
remain to be answered. Inspired by PMCA, RT-QuIC was developed by Caughey for detecting
different types of prions 40. RT-QuIC captures the same principle as PMCA, but runs differently to
save time, cost and effort. It wasn’t long before Parkkinen and coworkers tailored RT-QuIC to
detect o-α-syn in CSF of patients with DLB with 92% and 95% sensitivity and specificity,
respectively 41. With the goal of improving RT-QuIC practicality, Caughey and coworkers reduced
the assay time and gave it a quantitative feature 42. The analysis of CSF samples from PD and DLB
cases compared to non synucleinopathies controls, revealed a 93% diagnostic sensitivity and 100%
specificity. While the potential of RT-QuIC seems remarkable, many challenges of the assay still
have to be overcome; RT-QuIC can only detect forms of α-syn that can be seeded, while other
forms of α-syn that can not be seeded are also related to disease pathogenesis. Other issues include
the following questions: Would different strains of α-syn exempt the same seeding kinetics? Could
RT-QuIC be used in biofluids collected by less invasive methods, such as plasma, serum or saliva?
The most important questions still remain: Would any of the oligomeric-specific assays provide an
early diagnosis for PD prior to the manifestation of the clinical symptoms? And could they help
us monitor disease progression?
II.IV Phosphorylated S129 alpha-synuclein; harmful or beneficial? An increasing number of studies reported that α-syn is subjected to several post translational
modifications (PTMs), such as phosphorylation, ubiquitination, sumoylation, nitration or c-
terminal truncation, changing the protein conformation and/or function 43,44. Moreover, these
studies suggested that PTMs may play a critical role in regulating α-syn aggregation and toxicity
in vivo. Considering that only a small fraction of α-syn (~ 4%) is phosphorylated at residue Ser 129
under physiological conditions in vivo, whereas almost 90% of α-syn in LBs is phosphorylated at
the same residue, the significant attention that was devoted to pS129-α-syn is easily explained.
While it is clear that pS129-α-syn can alter its characteristics in terms of aggregation and/or
neurotoxicity, whether phosphorylation promotes or protects against PD is less clear 43. Regardless
of how future research will answer this question, pS129-α-syn is a potential biomarker for PD.
Unfortunately, quantitative assessment of pS129-α-syn in biological fluids turned out to be more
challenging than initially anticipated, due to the scarcity of pS129-α-syn specific antibodies, the
abundance of phosphatases in biofluids and the questioned stability of pS129-α-syn over long

22
storage of the samples. As a result, only few laboratories were able to quantify pS129-α-syn in CSF
or blood.
In 2012, Zhang and co-workers first used reported a sensitive and specific assay for pS129-α-syn
to measure CSF pS129-α-syn in two sets of PD cohorts, a discovery cohort and a validation cohort 45. While pS129-α-syn discriminated PD patients from healthy subjects in the discovery set, this
could not be reproduced in the validation set. However, in both cohorts pS129-α-syn levels were
significantly higher in PD compared to MSA and PSP. In addition, a weak correlation between CSF
pS129-α-syn levels and PD severity was reported. The same assay was subsequently used to
examine the longitudinal changes of pS129-α-syn in the DATATOP cohort. Compared to baseline,
an insignificant increase in pS129-α-syn was observed. Close examination of the correlation
between CSF pS129-α-syn and disease severity in subjects from DATATOP, a large cross-sectional
cohort, and a cohort of LRRK2 mutation carriers after stratification by PD stage, revealed a
negative-to-positive transition over the different disease stages. Following a U-shaped curve, the
inverse correlation between CSF pS129-α-syn and disease severity at early stages changes to a
positive correlation at later stages. This knowledge can help us determine the optimal way in which
pS129-α-syn can be used as a biomarker for PD 46. Using a pS129-α-syn specific ELISA, first in a
cross-sectional cohort and thereafter in a longitudinal cohort, we found that CSF pS129-a-syn levels
are significantly higher in PD compared to HC, emphasizing the potential of pS129-α-syn as a
diagnostic marker for PD. Over a period of two years of disease progression, a decrease of pS129-
α-syn levels was noted at follow-up compared to baseline. The discrepancies between our findings
and those of Stewart et al. can be explained by differences in selection criteria of the patients from
DATATOP in each study. Stewart et al., included unmediated PD patients from the placebo group
that were followed longer than 6 months (n=95), whereas in Majbour et al., 121 patients with
definite PD (90%-100% confidence based on the investigators’ report (n=121) were selected. Other
factors that may have contributed to these discrepancies include the protocols used for processing
the samples, the methods used for quantification, and the antibodies used. More recently, CSF
pS129-α-syn were unchanged when assessed in PD and DLB compared to AD and patients with
subjective cognitive decline (Steenoven et al., Movement Disorders 2018, in press).
II.V Combining multiple species of α-syn; team work always pays off Combining multiple species of α-syn along with other biomarkers has been the most promising
approach for diagnostic purposes in PD thus far. Combining o- and t-α-syn in an o-/t-α-syn ratio, a
sensitivity of 89.3% and specificity of 90.6%, with an AUC of 0.948 was achieved for a diagnosis
of PD 35. In a study exploring the diagnostic value of several biological markers, t-α-syn, tau, Aβ42
and total protein in CSF and serum samples from three cross-sectional cohorts of patients with

23
different synucleinopathies (PD, MSA or DLB), AD, parkinsonism or other neurological disorder,
CSF t-α-syn and tau along with the age of participants, provided the best discriminative model for
distinguishing patients with synucleinopathies from patients with AD or other neurological
disorders 47.
In parallel with the findings above, Wang et al. showed how a combination of pS129- and t-α-syn
could distinguish PD from MSA and PSP 45. In another study, combining a wider range of
biomarkers, namely t- and o-α-syn, Aβ42 and tau, provided the best diagnostic accuracy for
differentiating between PD patients and patients with other neurological disorders 48. Using our
specific ELISA assays, we found that both pS129-/t-α-syn and o-/t-α-syn ratios improved the
discrimination between PD and healthy control subjects 22. The best predictive model for
discriminating PD could be generated by combining these ratios with p-tau levels in a logistic
regression analysis. Interestingly, also in the DATATOP cohort, in which a correlation between
single species of α-syn and PD severity was absent, combining o- and t-α-syn resulted in a fair
negative correlation with motor dysfunction 29. Remarkably, when PD patients where sub-grouped
based on their clinical phenotype to tremor dominant, postural instability and gait difficulty
dominant, or intermediate, the correlation between o-/t-α-syn ratio and the motor impairment was
stronger within the tremor dominant group and absent in the postural instability and gait difficulty
group, thus for the first time linking CSF biomarkers with clinical phenotype 29. Such extensive
cohort analyses strongly emphasize the significance of combining the measurement of biological
markers, perhaps even from different biofluids, along with patients’ characteristics (e.g. age) in
developing optimal therapeutic approaches as well as directing clinical trials towards the right
population.
III. Uric Acid; the lower the levels, the higher the risk
There is no doubt that oxidative stress plays a critical role in the neurodegenerative process of PD,
and it’s no secret that uric acid is among the antioxidants meant to suppress oxidative stress and
thus protects against cell death 49. Uric acid is therefore another potential biomarker for PD that has
received little attention so far, yet may reflect a mechanism underlying PD pathology. Data
highlighting the likely usefulness of uric acid as a biomarker for PD mainly emanated from
epidemiological and genetic studies, and a recent clinical trial 50,51. While studies assessing the
levels of uric acid in blood are limited in number, even fewer studies were aimed at CSF levels.
Most of these studies demonstrated reduced levels of uric acid in patients with PD compared to
control subjects, hence proposing that reduced levels of uric acid put individuals at a higher risk of
developing PD and vice versa.
24
IV. Lysosomal Enzymes; tricky to measure
The accumulating evidence about the link between lysosomal dysfunction and an increased risk of
PD 52, propelled the efforts of many researchers to explore the potential of CSF lysosomal enzymes
as biomarkers for PD. However, only few studies were successful. In a small cohort of PD and
neurological controls, the levels of CSF GCase were reduced in PD patients compared to
individuals suffering from other neurological conditions 53. When tested in a larger cohort, CSF
GCase levels better discriminated PD from control subjects when combined with CSF o-/t-α-syn
ratio with a sensitivity of 82% and a specificity of 71%, which once more emphasizes the
importance of combining multiple biomarkers to improve diagnostic accuracy of PD 54. Substantial
overlap between PD and controls as well as the many factors interfering with the quantification of
CSF lysosomal enzymes are among the reasons why lysosomal enzymes have a long way to go
before they can be used in clinical practice as surrogate biomarkers for PD 52,55.
V. Neurofilament Light Chain; a differential biomarker? Increased CSF levels of Neurofilament Light Chain (NF-L) are a strong marker of axonal injury.
Most studies have focused on the discriminative power of NF-L to differentiate PD patients from
other forms of parkinsonism, in particular MSA and PSP patients.
In a study by Holmberg and co-workers, involving a cohort of carefully characterized patients with
PD, MSA or PSP, CSF levels of NF-L were significantly higher in MSA and PSP patients compared
to PD. The discriminative analysis showed a sensitivity of 78% and a specificity of 80%, with only
7 PD patients out of 210 being false-positives 56. Similarly, others have observed a significantly
higher level of NF-L in MSA patients compared to PD with a specificity of 90% and a sensitivity
of 83% with AUC of 0.92 57. Subsequently, Holmberg and colleagues reported similar findings,
this time including another atypical parkinsonion disorder (corticobasal degeneration) as well as a
control group of healthy subjects 58. Although CSF NF-L levels segregated atypical parkinsonion
disorders from PD, they failed to discriminate PD patients from healthy controls which precludes
NF-L CSF levels from being an optimal stand-alone biomarker for PD. This finding was later
confirmed by Hall et al., reporting significantly higher CSF NF-L levels in patients with atypical
parkinsonion disorders (MSA, PSP or CBD) compared to PD and healthy subjects 59. In the same
study, positive correlations were found between CSF NF-L levels and motor function in PD and
PSP, and between CSF-NF-L and cognitive decline in AD. A positive correlation with age was also
observed in all diagnostic groups 59.
To understand the full potential of NF-L as a biomarker for PD, the same research group went a
step further to assess the levels of NF-L in blood 60. Interestingly, CSF levels of NF-L positively
and strongly correlated with NF-L levels in blood in all groups from the three independent cohorts.

25
The blood levels of NF-L also distinguished PD from other atypical parkinsonion disorders.
Hansson et al. not only validated the importance of NF-L as a potential biomarker for PD but also
the accessibility of this biomarker in convenient biofluids like blood 60.
To summarize, CSF and serum NF-L is an attractive biomarker to distinguish between PD and
atypical parkinsonian disorders. It is easily accessible and its levels correlate with disease severity,
but NF-L can not be used to differentiate PD from DLB or healthy subjects.
VI. Inflammatory Biomarkers; nonspecific, yet appealing Inflammation as a pathogenic factor in neurodegeneration has become a hot topic in the past few
years. Converging evidence supports the involvement of central and peripheral inflammation in the
pathogenesis of PD. Some researchers favour the hypothesis that inflammation is a causative factor,
while others believe it is merely a by-product of neurodegeneration. In both cases, inflammatory
markers might hold a promise as candidate biomarkers for PD diagnosis or monitoring of disease
progression. Many researchers have addressed this issue by measuring inflammatory markers in
serum and CSF samples of PD patients and healthy controls. The results of a recent study 61 suggests
that inflammatory markers are relatively stable and thus can be reliably measured. In spite of that
observation, conflicting results have been obtained. Most studies agree that serum and CSF IL-2,
IL-6, IL-10, IL-1β, tumour necrosis factor, C-reactive protein (CRP), neutrophil gelatinase-
associated lipocalin and IFNγ occupy the highest ranks among potential inflammatory markers 61,62.
In most studies, the levels of these markers were significantly higher in PD patients compared to
healthy control subjects. However, none of these markers optimally discriminated PD patients from
controls as a single marker, most probably reflecting heterogeneity of the disease. When exploring
the association between CSF inflammatory markers and non-motor symptoms in PD patients,
Hansson and co-workers observed that CRP levels were significantly higher in PD patients with
dementia (PDD) compared to non-demented PD patients or healthy controls, whereas all other
inflammatory biomarkers showed no significant difference 63. Nevertheless, the degree of
neuroinflammation in the PD group significantly correlated with more severe depression, fatigue,
and cognitive impairment 63.
In a study by Maetzler et al., involving 142 LRRK2-positive PD patients, levels of inflammatory
biomarkers, including interleukin 8 (IL-8), monocyte chemotactic protein 1 (MCP-1) and
macrophage inflammatory protein 1-b (MIP-1-b), discriminated between patients classified as
having a diffuse/malignant phenotype compared to patients classified as intermediate or mainly
pure motor 64.
In 2018, Karpenko et al., investigated the potential of inflammatory markers in CSF and serum of
PD patients compared to healthy subjects 65. In CSF, no significant differences in inflammatory

26
markers were noted between PD and control groups. In serum, however, significantly lower IL-
1RA and higher IL-Iβ and IL-6 were observed in the PD group. CSF IL-6 inversely correlated with
disease duration and severity, measured as Hoehn-Yahr stage and UPDRS II scores, while TNFα
positivity correlated with disease progression. Serum IL-6 positively correlated with both PD
severity and rate of progression, and inversely with disease duration. Exploring the relationship
between inflammatory markers and non-motor symptoms of PD, increased levels of IL-10 in serum
correlated with increased anxiety and depression, whereas serum TNFα levels were lower in PD
patients with mild cognitive impairment compared to healthy controls 65.
VII. AD-associated biomarkers; the question of complexity arises In recent years, it has been increasingly recognized that PD is a motor disorder with non-motor
features that are equally important 4,66. Mild cognitive impairment occurs in about 20-50% of
patients with PD, whereas the prevalence of dementia rises up to 75% in patients who have had PD
for more than 10 years 67. From a neuropathological standpoint, co-occurrence of PD and AD
pathologies has repeatedly been reported, suggesting that there may be an interaction between PD
and AD pathologies, i.e. α-syn, Aβ and tau proteins, in human brain and in animal models 68,69.
The main AD protein biomarkers that have been widely investigated in PD pathology are tau,
phosphorylated tau, Aβ40 and Aβ42, mostly focusing on the link between Aβ levels and cognitive
decline 70. In a study performed by Compta et al., the levels of tau, p-tau and Aβ were assessed in
CSF from PD and PDD patients, and in healthy subjects 71. CSF tau and p-tau were significantly
elevated in PDD patients compared to non-demented patients or healthy subjects. In addition, CSF
tau and p-tau levels were inversely correlated with memory impairment. Aβ42 on the other hand,
was lowest in PDD patients and positively correlated with phonetic fluency. It is noteworthy
mentioning that the small size of the subgroups undermines the power of these findings. Most cross-
sectional studies reported reduced levels of Aβ42 in PD patients compared to healthy controls 71,72
, elevated CSF tau and p-tau levels in PDD patients 71 while unchanged in non-demented PD
patients compared to healthy controls 22,38,72. The discrepancies between these findings may be
explained by differences in the clinical profile of the included patients and whether they were
medicated or drug-naïve. With respect to longitudinal changes, over a follow-up period of one to
two years in most studies, CSF Aβ42 levels showed a decreasing trend with lower baseline levels
being associated with higher risk of developing cognitive impairment, whereas tau and p-tau levels
remained relatively stable and showed no correlation with cognitive decline 29,73,74.

27
VIII. Conclusions and Future Perspectives; Then, Now and Future Considering the developments in the field of body fluid biomarkers in PD over the past two
decades, it is clear that it will be a daunting feat to reach a reliable diagnosis for PD based on a
simple test in a blood or CSF sample. The main challenges that delay the discovery of reliable PD
biomarkers are: the complex nature of the disease, the overlap with other neurodegenerative
diseases, the heterogeneity of the clinical phenotypes, and the many missing pieces of the puzzle
underpinning the disease etiology. In spite of these obstacles, as described in this review, the field
of biomarkers for PD has rapidly advanced on several fronts over the past ten years. There have
been concentrated and joint efforts by researchers and funding agencies for Parkinson’s Research
to spur the identification of reproducible biomarkers for PD. Since the ideal (panel) of biomarker(s)
has not yet been identified, the pursuit is still going on.
The biggest achievement in the last years was the recruitment of patient cohorts with the
longitudinal collection of biological fluids, such as the Parkinson’s Progression Marker Initiative
(www.ppmi-info.org). In addition, we have witnessed other development that are worthy of
recognition: tools and technologies have been developed to more accurately assess biomarkers 22,41,75,76, the spectrum of biological samples is widening (CSF, plasma, serum, saliva, skin biopsies,
etc.), the array of potential biomarkers is expanding (oligomeric α-syn, phosphorylated α-syn,
lysosomes and inflammatory biomarkers), the value of using a panel of biomarkers rather than a
single marker has become clearer, and the interest in longitudinal studies is deepening. We have
also come to appreciate the importance of pre-analytical factors; sample collection, processing,
thawing cycles, selection of tips and tubes for handling the samples, haemoglobin contamination
and storage conditions 77. These factors urged research centers to put collective efforts into
developing standardized protocols and methodologies for sample processing 78. As reviewed here,
it has become clear that a single biomarker can not stand alone for PD diagnosis or progression.
Instead, a panel of at least 5 markers is probably required to cover the clinical heterogeneity of PD.
From a diagnostic perspective, the main answers that research has delivered are 1) reduced serum
uric acid levels and elevated serum IL_6 and IL-10 levels can aid in the identification of individuals
at risk of PD, 2) CSF and serum NF-L levels are the best candidate biomarker to distinghuish PD
patients from patients with other parkinsonian disorders, 3) a combination of α-syn species, mainly
t- and o-a-syn can distinguish PD patients from subjects without a synucleinopathy (either healthy
controls or patients with other neurological disorders), 4) Aβ42 can differentiate between PDD and
PD patients. With respect to monitoring of disease progression, the levels of only some biomarkers
were associated with worsening PD motor and non-motor symptoms. Levels of CSF t-a-syn, CSF
Aβ42 and serum inflammatory markers correlated with cognitive decline, the strength and direction

28
of the correlation varying from one marker to another. While o-a-syn appears to reflect PD-related
motor deterioration, the ratio of o-/t-a-syn better reflects longitudinal disease progression and PD
clinical phenotypes. Taken together, there is increasing evidence that a panel of potentially
informative biomarkers for PD is coming together, which should at least include CSF t-a-syn, CSF
o-a-syn, CSF NF-L, Aβ42 and serum inflammatory markers (Figure 1).
In order to move forward, major questions remain to be answered by future studies; what is the
optimal method to determine cut-off points for chemical biomarkers? What does it take to
implement body fluid biomarkers into routine clinical care? Can we use blood biomarkers instead
of CSF biomarkers? Although the quest to find an ideal biomarker for PD has certainly not ended,
much ground has been covered and we are getting closer to the ultimate goal. We should therefore
sustain the momentum of the progress made towards the development of the ideal biomarker panel
for PD.

29
Figure.(1(
Uric%AcidInflammatory%markers
Neurofilament6light%chain
⍺6Synuclein%Forms
ADPD
PDD
DLB
HC
AD%biomarkers
At%risk
Atypical%Parkinsonism
DLBPD
PDD
PDD
AD
HC
PD
ADPD
PDD
DLB
Atypical-Parkinsonism
HC
CSF Blood
ADPD
At%riskPDD
DLB
Atypical%Parkinsonism
HC
Figure'1.(Proposed(Panel(of(Biomarkers(for(Parkinson’s(Disease(Differential(Diagnosis. The(chart(highlights(the(value(of(using(a(panel(of(biomarkers(to( improve(the(differential(diagnosis(of(PD.(Levels(of(serum(uric(acid(and(inflammatory(markers,(mainly(IL_6(and(ILD10(can(aid(identify(the(individuals(at(risk(of(PD.(CSF(and(serum(NFDL(can(distinguish(PD(patients(from(patients(with(other(parkinsonion(disorders((atypical( parkinsonism).( A( combination( of( αDsyn( species,( can( distinguish( PD( patients( from( HC,( DLB,( AD(subjects.(AD(biomarkers,(namely(CSF(Aβ42(can(differentiate(between(PDD(from(PD(patients. PD:(Parkinson’s(disease,(DLB:(Dementia(with(Lewy(bodies,(AD:(Alzheimer’s’(disease,(PDD:(Parkinson’s(disease(with(dementia,(HC:(healthy(controls

30
References 1 Sherwood. (eds Neely & & Jones) (1817). 2 Postuma, R. B. et al. MDS clinical diagnostic criteria for Parkinson's disease. Mov Disord
30, 1591-‐1601, doi:10.1002/mds.26424 (2015). 3 Marsili, L., Rizzo, G. & Colosimo, C. Diagnostic Criteria for Parkinson's Disease: From
James Parkinson to the Concept of Prodromal Disease. Front Neurol 9, 156, doi:10.3389/fneur.2018.00156 (2018).
4 Schrag, A., Horsfall, L., Walters, K., Noyce, A. & Petersen, I. Prediagnostic presentations of Parkinson's disease in primary care: a case-‐control study. Lancet Neurol 14, 57-‐64, doi:10.1016/S1474-‐4422(14)70287-‐X (2015).
5 Goedert, M. Alpha-‐synuclein and neurodegenerative diseases. Nat Rev Neurosci 2, 492-‐501, doi:10.1038/35081564 (2001).
6 Conway, K. A., Harper, J. D. & Lansbury, P. T. Fibrils formed in vitro from alpha-‐synuclein and two mutant forms linked to Parkinson's disease are typical amyloid. Biochemistry 39, 2552-‐2563 (2000).
7 Lee, V. M., Giasson, B. I. & Trojanowski, J. Q. More than just two peas in a pod: common amyloidogenic properties of tau and alpha-‐synuclein in neurodegenerative diseases. Trends Neurosci 27, 129-‐134, doi:10.1016/j.tins.2004.01.007 (2004).
8 Spira, P. J., Sharpe, D. M., Halliday, G., Cavanagh, J. & Nicholson, G. A. Clinical and pathological features of a Parkinsonian syndrome in a family with an Ala53Thr alpha-‐synuclein mutation. Ann Neurol 49, 313-‐319 (2001).
9 Gasser, T. et al. A susceptibility locus for Parkinson's disease maps to chromosome 2p13. Nat Genet 18, 262-‐265, doi:10.1038/ng0398-‐262 (1998).
10 Spillantini, M. G. et al. Alpha-‐synuclein in Lewy bodies. Nature 388, 839-‐840, doi:10.1038/42166 (1997).
11 Singleton, A. B. et al. alpha-‐Synuclein locus triplication causes Parkinson's disease. Science 302, 841, doi:10.1126/science.1090278 (2003).
12 Chartier-‐Harlin, M. C. et al. Alpha-‐synuclein locus duplication as a cause of familial Parkinson's disease. Lancet 364, 1167-‐1169, doi:10.1016/S0140-‐6736(04)17103-‐1 (2004).
13 Maroteaux, L., Campanelli, J. T. & Scheller, R. H. Synuclein: a neuron-‐specific protein localized to the nucleus and presynaptic nerve terminal. J Neurosci 8, 2804-‐2815 (1988).
14 Borghi, R. et al. Full length alpha-‐synuclein is present in cerebrospinal fluid from Parkinson's disease and normal subjects. Neurosci Lett 287, 65-‐67 (2000).
15 Visanji, N. P. et al. The Systemic Synuclein Sampling Study: toward a biomarker for Parkinson's disease. Biomark Med 11, 359-‐368, doi:10.2217/bmm-‐2016-‐0366 (2017).
16 Villar-‐Piqué, A., Lopes da Fonseca, T. & Outeiro, T. F. Structure, function and toxicity of alpha-‐synuclein: the Bermuda triangle in synucleinopathies. J Neurochem 139 Suppl 1, 240-‐255, doi:10.1111/jnc.13249 (2016).
17 Kannarkat, G. T., Boss, J. M. & Tansey, M. G. The role of innate and adaptive immunity in Parkinson's disease. J Parkinsons Dis 3, 493-‐514, doi:10.3233/JPD-‐130250 (2013).
18 Lee, H. J. et al. Direct transfer of alpha-‐synuclein from neuron to astroglia causes inflammatory responses in synucleinopathies. J Biol Chem 285, 9262-‐9272, doi:10.1074/jbc.M109.081125 (2010).
31
19 Zhang, W. et al. Aggregated alpha-‐synuclein activates microglia: a process leading to disease progression in Parkinson's disease. FASEB J 19, 533-‐542, doi:10.1096/fj.04-‐2751com (2005).
20 Spillantini, M. G. & Goedert, M. Neurodegeneration and the ordered assembly of α-‐synuclein. Cell Tissue Res, doi:10.1007/s00441-‐017-‐2706-‐9 (2017).
21 El-‐Agnaf, O. M. et al. Alpha-‐synuclein implicated in Parkinson's disease is present in extracellular biological fluids, including human plasma. FASEB J 17, 1945-‐1947, doi:10.1096/fj.03-‐0098fje (2003).
22 Majbour, N. K. et al. Oligomeric and phosphorylated alpha-‐synuclein as potential CSF biomarkers for Parkinson's disease. Mol Neurodegener 11, 7, doi:10.1186/s13024-‐016-‐0072-‐9 (2016).
23 Kang, J. H. Cerebrospinal Fluid Amyloid β1-‐42, Tau, and Alpha-‐Synuclein Predict the Heterogeneous Progression of Cognitive Dysfunction in Parkinson's Disease. J Mov Disord 9, 89-‐96, doi:10.14802/jmd.16017 (2016).
24 Mollenhauer, B. et al. Total CSF α-‐synuclein is lower in de novo Parkinson patients than in healthy subjects. Neurosci Lett 532, 44-‐48, doi:10.1016/j.neulet.2012.11.004 (2013).
25 Goldman, J. G. et al. Cerebrospinal fluid, plasma, and saliva in the BioFIND study: Relationships among biomarkers and Parkinson's disease Features. Mov Disord 33, 282-‐288, doi:10.1002/mds.27232 (2018).
26 Eusebi, P. et al. Diagnostic utility of cerebrospinal fluid α-‐synuclein in Parkinson's disease: A systematic review and meta-‐analysis. Mov Disord 32, 1389-‐1400, doi:10.1002/mds.27110 (2017).
27 Mollenhauer, B. et al. Longitudinal CSF biomarkers in patients with early Parkinson disease and healthy controls. Neurology 89, 1959-‐1969, doi:10.1212/WNL.0000000000004609 (2017).
28 Førland, M. G. et al. Evolution of cerebrospinal fluid total α-‐synuclein in Parkinson's disease. Parkinsonism Relat Disord 49, 4-‐8, doi:10.1016/j.parkreldis.2018.01.018 (2018).
29 Majbour, N. K. et al. Longitudinal changes in CSF alpha-‐synuclein species reflect Parkinson's disease progression. Mov Disord 31, 1535-‐1542, doi:10.1002/mds.26754 (2016).
30 Hall, S. et al. Longitudinal Measurements of Cerebrospinal Fluid Biomarkers in Parkinson's Disease. Mov Disord, doi:10.1002/mds.26578 (2016).
31 Stewart, T. et al. Cerebrospinal Fluid α-‐Synuclein Predicts Cognitive Decline in Parkinson Disease Progression in the DATATOP Cohort. Am J Pathol 184, 966-‐975, doi:10.1016/j.ajpath.2013.12.007 (2014).
32 Hall, S. et al. CSF biomarkers and clinical progression of Parkinson disease. Neurology 84, 57-‐63, doi:10.1212/WNL.0000000000001098 (2015).
33 Paleologou, K. E. et al. Detection of elevated levels of soluble alpha-‐synuclein oligomers in post-‐mortem brain extracts from patients with dementia with Lewy bodies. Brain 132, 1093-‐1101, doi:10.1093/brain/awn349 (2009).
34 Winner, B. et al. In vivo demonstration that alpha-‐synuclein oligomers are toxic. Proc Natl Acad Sci U S A 108, 4194-‐4199, doi:10.1073/pnas.1100976108 (2011).
32
35 Tokuda, T. et al. Detection of elevated levels of α-‐synuclein oligomers in CSF from patients with Parkinson disease. Neurology 75, 1766-‐1772, doi:10.1212/WNL.0b013e3181fd613b (2010).
36 Park, M. J., Cheon, S. M., Bae, H. R., Kim, S. H. & Kim, J. W. Elevated levels of α-‐synuclein oligomer in the cerebrospinal fluid of drug-‐naïve patients with Parkinson's disease. J Clin Neurol 7, 215-‐222, doi:10.3988/jcn.2011.7.4.215 (2011).
37 Aasly, J. O. et al. Elevated levels of cerebrospinal fluid α-‐synuclein oligomers in healthy asymptomatic LRRK2 mutation carriers. Front Aging Neurosci 6, 248, doi:10.3389/fnagi.2014.00248 (2014).
38 Parnetti, L. et al. Differential role of CSF alpha-‐synuclein species, tau, and Aβ42 in Parkinson's Disease. Front Aging Neurosci 6, 53, doi:10.3389/fnagi.2014.00053 (2014).
39 Hansson, O. et al. Levels of cerebrospinal fluid α-‐synuclein oligomers are increased in Parkinson's disease with dementia and dementia with Lewy bodies compared to Alzheimer's disease. Alzheimers Res Ther 6, 25, doi:10.1186/alzrt255 (2014).
40 Orrú, C. D. et al. Rapid and sensitive RT-‐QuIC detection of human Creutzfeldt-‐Jakob disease using cerebrospinal fluid. MBio 6, doi:10.1128/mBio.02451-‐14 (2015).
41 Fairfoul, G. et al. Alpha-‐synuclein RT-‐QuIC in the CSF of patients with alpha-‐synucleinopathies. Ann Clin Transl Neurol 3, 812-‐818, doi:10.1002/acn3.338 (2016).
42 Groveman, B. R. et al. Rapid and ultra-‐sensitive quantitation of disease-‐associated α-‐synuclein seeds in brain and cerebrospinal fluid by αSyn RT-‐QuIC. Acta Neuropathol Commun 6, 7, doi:10.1186/s40478-‐018-‐0508-‐2 (2018).
43 Oueslati, A. Implication of Alpha-‐Synuclein Phosphorylation at S129 in Synucleinopathies: What Have We Learned in the Last Decade? J Parkinsons Dis 6, 39-‐51, doi:10.3233/JPD-‐160779 (2016).
44 Tenreiro, S., Eckermann, K. & Outeiro, T. F. Protein phosphorylation in neurodegeneration: friend or foe? Front Mol Neurosci 7, 42, doi:10.3389/fnmol.2014.00042 (2014).
45 Wang, Y. et al. Phosphorylated α-‐synuclein in Parkinson's disease. Sci Transl Med 4, 121ra120, doi:10.1126/scitranslmed.3002566 (2012).
46 Stewart, T. et al. Phosphorylated α-‐synuclein in Parkinson's disease: correlation depends on disease severity. Acta Neuropathol Commun 3, 7, doi:10.1186/s40478-‐015-‐0185-‐3 (2015).
47 Mollenhauer, B. et al. α-‐Synuclein and tau concentrations in cerebrospinal fluid of patients presenting with parkinsonism: a cohort study. Lancet Neurol 10, 230-‐240, doi:10.1016/S1474-‐4422(11)70014-‐X (2011).
48 Parnetti, L. (Frontiers in Aging Neuroscience, 2014). 49 Havelund, J. F., Heegaard, N. H. H., Færgeman, N. J. K. & Gramsbergen, J. B. Biomarker
Research in Parkinson's Disease Using Metabolite Profiling. Metabolites 7, doi:10.3390/metabo7030042 (2017).
50 Yu, Z. et al. The significance of uric acid in the diagnosis and treatment of Parkinson disease: An updated systemic review. Medicine (Baltimore) 96, e8502, doi:10.1097/MD.0000000000008502 (2017).
51 Wen, M. et al. Serum uric acid levels in patients with Parkinson's disease: A meta-‐analysis. PLoS One 12, e0173731, doi:10.1371/journal.pone.0173731 (2017).

33
52 Moors, T. et al. Lysosomal Dysfunction and α-‐Synuclein Aggregation in Parkinson's Disease: Diagnostic Links. Mov Disord 31, 791-‐801, doi:10.1002/mds.26562 (2016).
53 Balducci, C. et al. Lysosomal hydrolases in cerebrospinal fluid from subjects with Parkinson's disease. Mov Disord 22, 1481-‐1484, doi:10.1002/mds.21399 (2007).
54 Parnetti, L. et al. Cerebrospinal fluid lysosomal enzymes and alpha-‐synuclein in Parkinson's disease. Mov Disord 29, 1019-‐1027, doi:10.1002/mds.25772 (2014).
55 Farotti, L., Paciotti, S., Tasegian, A., Eusebi, P. & Parnetti, L. Discovery, validation and optimization of cerebrospinal fluid biomarkers for use in Parkinson's disease. Expert Rev Mol Diagn 17, 771-‐780, doi:10.1080/14737159.2017.1341312 (2017).
56 Holmberg, B., Johnels, B., Ingvarsson, P., Eriksson, B. & Rosengren, L. CSF-‐neurofilament and levodopa tests combined with discriminant analysis may contribute to the differential diagnosis of Parkinsonian syndromes. Parkinsonism Relat Disord 8, 23-‐31 (2001).
57 Abdo, W. F., Bloem, B. R., Van Geel, W. J., Esselink, R. A. & Verbeek, M. M. CSF neurofilament light chain and tau differentiate multiple system atrophy from Parkinson's disease. Neurobiol Aging 28, 742-‐747, doi:10.1016/j.neurobiolaging.2006.03.010 (2007).
58 Constantinescu, R., Rosengren, L., Johnels, B., Zetterberg, H. & Holmberg, B. Consecutive analyses of cerebrospinal fluid axonal and glial markers in Parkinson's disease and atypical Parkinsonian disorders. Parkinsonism Relat Disord 16, 142-‐145, doi:10.1016/j.parkreldis.2009.07.007 (2010).
59 Hall, S. et al. Accuracy of a panel of 5 cerebrospinal fluid biomarkers in the differential diagnosis of patients with dementia and/or parkinsonian disorders. Arch Neurol 69, 1445-‐1452, doi:10.1001/archneurol.2012.1654 (2012).
60 Hansson, O. et al. Blood-‐based NfL: A biomarker for differential diagnosis of parkinsonian disorder. Neurology 88, 930-‐937, doi:10.1212/WNL.0000000000003680 (2017).
61 Eidson, L. N. et al. Candidate inflammatory biomarkers display unique relationships with alpha-‐synuclein and correlate with measures of disease severity in subjects with Parkinson's disease. J Neuroinflammation 14, 164, doi:10.1186/s12974-‐017-‐0935-‐1 (2017).
62 Qin, X. Y., Zhang, S. P., Cao, C., Loh, Y. P. & Cheng, Y. Aberrations in Peripheral Inflammatory Cytokine Levels in Parkinson Disease: A Systematic Review and Meta-‐analysis. JAMA Neurol 73, 1316-‐1324, doi:10.1001/jamaneurol.2016.2742 (2016).
63 Lindqvist, D. et al. Cerebrospinal fluid inflammatory markers in Parkinson's disease-‐-‐associations with depression, fatigue, and cognitive impairment. Brain Behav Immun 33, 183-‐189, doi:10.1016/j.bbi.2013.07.007 (2013).
64 Brockmann, K. et al. Inflammatory profile discriminates clinical subtypes in LRRK2-‐associated Parkinson's disease. Eur J Neurol 24, 427-‐e426, doi:10.1111/ene.13223 (2017).
65 Karpenko, M. N., Vasilishina, A. A., Gromova, E. A., Muruzheva, Z. M. & Bernadotte, A. Interleukin-‐1β, interleukin-‐1 receptor antagonist, interleukin-‐6, interleukin-‐10, and tumor necrosis factor-‐α levels in CSF and serum in relation to the clinical diversity of
34
Parkinson's disease. Cell Immunol 327, 77-‐82, doi:10.1016/j.cellimm.2018.02.011 (2018).
66 Schrag, A., Siddiqui, U. F., Anastasiou, Z., Weintraub, D. & Schott, J. M. Clinical variables and biomarkers in prediction of cognitive impairment in patients with newly diagnosed Parkinson's disease: a cohort study. Lancet Neurol 16, 66-‐75, doi:10.1016/S1474-‐4422(16)30328-‐3 (2017).
67 Goldman, J. G. & Litvan, I. Mild cognitive impairment in Parkinson's disease. Minerva Med 102, 441-‐459 (2011).
68 Arai, Y. et al. Alpha-‐synuclein-‐positive structures in cases with sporadic Alzheimer's disease: morphology and its relationship to tau aggregation. Brain Res 888, 287-‐296 (2001).
69 Iseki, E. et al. Dementia with Lewy bodies from the perspective of tauopathy. Acta Neuropathol 105, 265-‐270, doi:10.1007/s00401-‐002-‐0644-‐3 (2003).
70 Parnetti, L. et al. Cerebrospinal fluid biomarkers in Parkinson disease. Nat Rev Neurol 9, 131-‐140, doi:10.1038/nrneurol.2013.10 (2013).
71 Compta, Y. et al. Cerebrospinal tau, phospho-‐tau, and beta-‐amyloid and neuropsychological functions in Parkinson's disease. Mov Disord 24, 2203-‐2210, doi:10.1002/mds.22594 (2009).
72 Alves, G. et al. CSF amyloid-‐beta and tau proteins, and cognitive performance, in early and untreated Parkinson's disease: the Norwegian ParkWest study. J Neurol Neurosurg Psychiatry 81, 1080-‐1086, doi:10.1136/jnnp.2009.199950 (2010).
73 Siderowf, A. et al. CSF amyloid {beta} 1-‐42 predicts cognitive decline in Parkinson disease. Neurology 75, 1055-‐1061, doi:10.1212/WNL.0b013e3181f39a78 (2010).
74 Terrelonge, M., Marder, K. S., Weintraub, D. & Alcalay, R. N. CSF β-‐Amyloid 1-‐42 Predicts Progression to Cognitive Impairment in Newly Diagnosed Parkinson Disease. J Mol Neurosci 58, 88-‐92, doi:10.1007/s12031-‐015-‐0647-‐x (2016).
75 Vaikath, N. N. et al. Generation and characterization of novel conformation-‐specific monoclonal antibodies for α-‐synuclein pathology. Neurobiol Dis 79, 81-‐99, doi:10.1016/j.nbd.2015.04.009 (2015).
76 Shahnawaz, M. et al. Development of a Biochemical Diagnosis of Parkinson Disease by Detection of α-‐Synuclein Misfolded Aggregates in Cerebrospinal Fluid. JAMA Neurol 74, 163-‐172, doi:10.1001/jamaneurol.2016.4547 (2017).
77 del Campo, M. et al. Recommendations to standardize preanalytical confounding factors in Alzheimer's and Parkinson's disease cerebrospinal fluid biomarkers: an update. Biomark Med 6, 419-‐430, doi:10.2217/bmm.12.46 (2012).
78 Mollenhauer, B. et al. A user's guide for α-‐synuclein biomarker studies in biological fluids: Perianalytical considerations. Mov Disord 32, 1117-‐1130, doi:10.1002/mds.27090 (2017).

35
!!
CHAPTER 2
Generation and Characterization of Novel Conformation-Specific Monoclonal Antibodies for α-Synuclein Pathology

36
CHAPTER 2 | GENERATION AND CHARACTERIZATION OF NOVEL CONFORMATION-SPECIFIC MONOCLONAL ANTIBODIES FOR Α-SYNUCLEIN PATHOLOGY Nishant N. Vaikath1, 2, Nour K. Majbour1,3, Katerina E. Paleologou4, Mustafa T. Ardah1, Esther van Dam4, Wilma D. J. van de Berg3, Shelley L. Forrest5, Laura Parkkinen6, Wei-Ping Gai7, Nobutaka Hattori8, 9, Masashi Takanashi9, Seung-Jae Lee10, David M. A. Mann11, Yuzuru Imai8, Glenda M Halliday12, Jia-Yi. Li2, Omar M. A. El-Agnaf1, 13
1Department of Biochemistry, College of Medicine and Health Science, United Arab Emirates University, Al Ain, United Arab Emirates 2Neural Plasticity and Repair Unit, Department of Experimental Medical Sciences, Wallenberg Neuroscience Center, BMC A10, Lund University, Lund, Sweden. 3Department of Anatomy and Neurosciences, Neuroscience Campus Amsterdam, VU University Medical Center, Amsterdam, The Netherlands. 4Department of Molecular Biology and Genetics, Democritus University of Thrace, Alexandroupolis, Greece 5Discipline of Pathology, Charles Perkin Centre, University of Sydney, Sydney, Australia 6Department of Clinical Neurology, University of Oxford, Oxford, UK 7Department of Human Physiology, School of Medicine, Flinders University, Australia 8Department of Research for Parkinson’s Disease, Juntendo University Graduate School of Medicine, Japan 9Department of Neurology, Juntendo University Graduate School of Medicine, Japan 10Department of Biomedical Science and Technology, Konkuk Univeristy, Seoul 143-701, Korea 11Clinical and Cognitive Neuroscience Research Group, University of Manchester, Salford Royal Foundation NHS Trust, Salford M6 8HD, UK 12Faculty of Medicine, University of New South Wales and Neuroscience Research Australia, Sydney, Australia 13College of Science, Engineering and Technology, HBKU, Education City, Qatar Foundation, Doha, Qatar Neurobiol Dis. 2015 Jul;79:81-99. doi: 10.1016/j.nbd.2015.04.009..

37
Abstract α-Synuclein (α-syn), a small protein that has the intrinsic propensity to aggregate, is implicated in several
neurodegenerative diseases including Parkinson’s disease (PD), dementia with Lewy bodies (DLB), and
multiple system atrophy (MSA), which are collectively known as synucleinopathies. Genetic, pathological,
biochemical, and animal modeling studies provided compelling evidence that α-syn aggregation plays a
key role in the pathogenesis of PD and related synucleinopathies. It is therefore of utmost importance to
develop reliable tools that can detect the aggregated forms of α-syn. We describe here the generation and
characterization of six novel conformation-specific monoclonal antibodies that recognize specifically α-
syn aggregates but not the soluble, monomeric form of the protein. The antibodies described herein did not
recognize monomers or fibrils generated from other amyloidogenic proteins including β-syn, γ-syn, β-
amyloid, tau protein, islet amyloid polypeptide and ABri. Interestingly, the antibodies did not react to
overlapping linear peptides spanning the entire sequence of α-syn, confirming further that they only detect
α-syn aggregates. In immunohistochemical studies, the new conformation-specific monoclonal antibodies
showed underappreciated small micro-aggregates and very thin neurites in PD and DLB cases that were not
observed with generic pan antibodies that recognize linear epitope. Furthermore, employing one of our
conformation-specific antibodies in a sandwich based ELISA, we observed an increase in levels of α-syn
oligomers in brain lysates from DLB compared to Alzheimer’s disease and control samples. Therefore, the
conformation-specific antibodies portrayed herein represent useful tools for research, biomarkers
development, diagnosis and even immunotherapy for PD and related pathologies.
Introduction
The fibrillization of α-synuclein (α-syn) is considered to play a key role in the pathogenesis of several
neurodegenerative diseases including Parkinson’s disease (PD), dementia with Lewy bodies (DLB), and
multiple system atrophy (MSA) [1]. Indeed, many histopathological studies have demonstrated that α-syn
fibrils are the main components of the neuronal inclusions, namely Lewy bodies (LBs) and Lewy neurites
(LNs), which are the pathological hallmarks of PD and DLB, and glial cytoplasmic inclusions (GCIs), the
pathological hallmark of MSA [2-4]. Genetic studies show various point mutations (A53T, A30P, E46K,
H50Q or G51D) [5-9] and multiplication of the α-syn gene SNCA lead to familial PD [10, 11]. Cell culture
and animal model studies indicate that enhanced oligomerization and aggregation of α-syn is associated
with increased cytotoxicity [12-16], while α-syn oligomers have been shown to be significantly elevated in
the brain lysates and cerebrospinal fluid of PD and DLB patients [17-23]. The significance of α-syn
fibrillization in the pathobiology of synucleinopathies has been reinforced by recent data demonstrating
that preformed recombinant α-syn fibrils can seed the aggregation of endogenous α-syn both in cultured

38
wild-type mouse hippocampal neurons [24] and in in vivo transgenic and wild-type mice [25, 26], even
from the peripheral to the central nervous system [27].
Given the central role of α-syn in the pathogenesis of synucleinopathies, the characterization of
their pathology in the brain has relied heavily on the use of α-syn antibodies [4, 28, 29], the vast majority
of which recognize both the monomeric and the aggregated forms of α-syn. Hence, there is a need for
developing conformation-specific antibodies that can possibly unveil underappreciated α-syn
neuropathology or even reveal novel neuropathological features of PD and related disorders. Furthermore,
taking into account that passive immunotherapy against α-syn has emerged as a very promising strategy for
modifying PD and related synucleinopathies [30-32], therefore, the generation of conformation-specific
antibodies may prove to be a very useful tool for the treatment of these diseases.
The aim of the present study was to generate and characterize monoclonal antibodies (mAbs) that
specifically target the aggregated forms of α-syn. The specificity and sensitivity of these antibodies were
assessed by an array of biochemical methods including dot-blotting, ELISA, BIACORE and
immunohistochemical analysis.
Materials and methods Expression and purification of recombinant human α-syn
Expression and purification of recombinant human α-syn was performed as previously described [33].
Briefly, the glutathione S-transferase (GST)-α-syn fusion construct in pGEX-4T1 vector was inserted into
E.coli BL21 bacteria for protein expression. The transformed bacteria were grown in Luria Bertani (LB)
medium, and glutathione sepharose 4B beads were used to capture GST-α-syn in the bacterial lysate, and
the GST tag was cleaved by thrombin. The molecular weight and purity of α-syn was confirmed by SDS-
PAGE gel and the concentration was estimated using a BCA protein assay (Pierce Biotechnology,
Rockford, IL). For the expression of recombinant truncated human α-syn (1-122), the construct (kindly
provided by Dr. Hilal A. Lashuel, EPFL, Lausanne, Switzerland) was inserted into a bacterial expression
vector (pGEX-4T1 vector) and purification carried out as mentioned above.
Preparation of fibrils of α-syn and other amyloid proteins and peptides
Recombinant α-, β- or γ-syn (50µM) in phosphate buffered saline (PBS) were incubated in a thermomixer
(800 rpm) at 37°C. The incubation period was 7 days for α-syn and 15 days for β- and γ-syn. To prepare
pure fibrils, aggregated α-syn solution for seven days was spun at 10,000 x g for 10 minutes at 4°C in a
refrigerated microfuge (Eppendorf). The supernatant was then discarded, and the pellet was washed twice
with ultra-pure water, before resuspended in 1x PBS. The pure fibrils were fragmented by ultrasonication
while kept on ice using a Sonic ruptor 250, equipped with a fine tip (5 sec pulses, output of 40 watts for 5
minutes). For the estimation of α-syn concentration of the fibrils, the samples were denatured by 6M
Guanidine-HCl and BCA assay (pierce BCA protein assay kit; Thermo scientific) were used according to
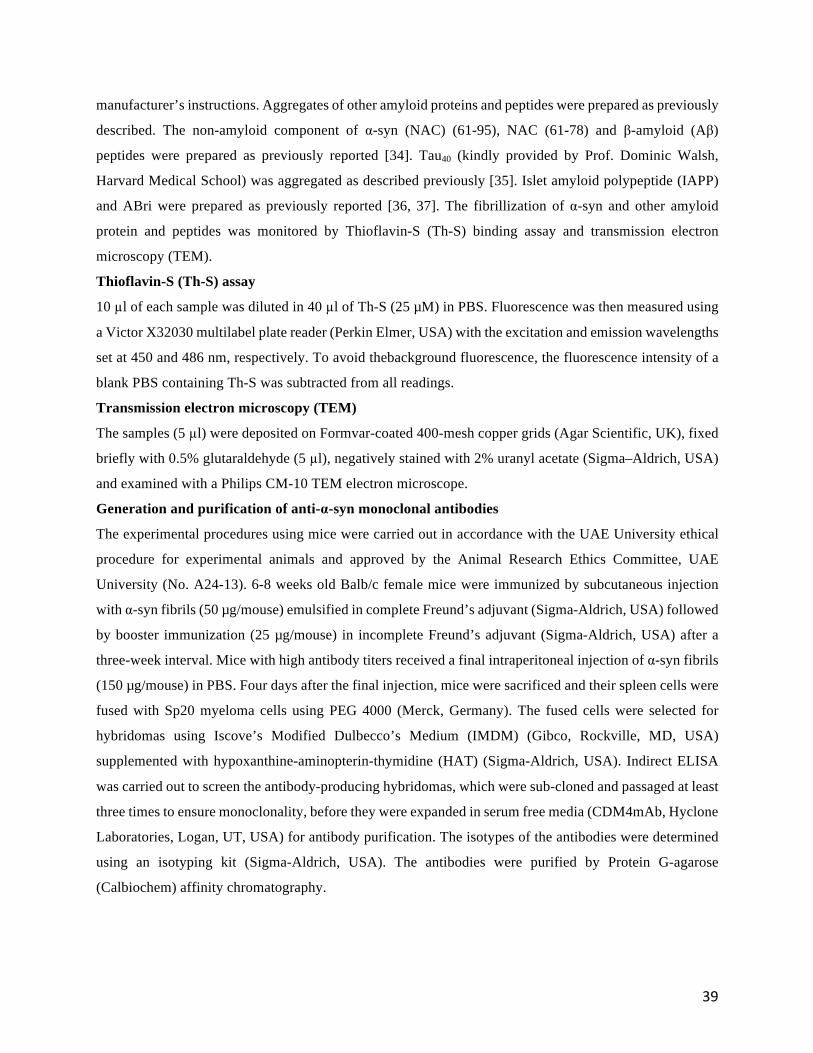
39
manufacturer’s instructions. Aggregates of other amyloid proteins and peptides were prepared as previously
described. The non-amyloid component of α-syn (NAC) (61-95), NAC (61-78) and β-amyloid (Aβ)
peptides were prepared as previously reported [34]. Tau40 (kindly provided by Prof. Dominic Walsh,
Harvard Medical School) was aggregated as described previously [35]. Islet amyloid polypeptide (IAPP)
and ABri were prepared as previously reported [36, 37]. The fibrillization of α-syn and other amyloid
protein and peptides was monitored by Thioflavin-S (Th-S) binding assay and transmission electron
microscopy (TEM).
Thioflavin-S (Th-S) assay
10 µl of each sample was diluted in 40 µl of Th-S (25 µM) in PBS. Fluorescence was then measured using
a Victor X32030 multilabel plate reader (Perkin Elmer, USA) with the excitation and emission wavelengths
set at 450 and 486 nm, respectively. To avoid thebackground fluorescence, the fluorescence intensity of a
blank PBS containing Th-S was subtracted from all readings.
Transmission electron microscopy (TEM)
The samples (5 µl) were deposited on Formvar-coated 400-mesh copper grids (Agar Scientific, UK), fixed
briefly with 0.5% glutaraldehyde (5 µl), negatively stained with 2% uranyl acetate (Sigma–Aldrich, USA)
and examined with a Philips CM-10 TEM electron microscope.
Generation and purification of anti-α-syn monoclonal antibodies
The experimental procedures using mice were carried out in accordance with the UAE University ethical
procedure for experimental animals and approved by the Animal Research Ethics Committee, UAE
University (No. A24-13). 6-8 weeks old Balb/c female mice were immunized by subcutaneous injection
with α-syn fibrils (50 µg/mouse) emulsified in complete Freund’s adjuvant (Sigma-Aldrich, USA) followed
by booster immunization (25 µg/mouse) in incomplete Freund’s adjuvant (Sigma-Aldrich, USA) after a
three-week interval. Mice with high antibody titers received a final intraperitoneal injection of α-syn fibrils
(150 µg/mouse) in PBS. Four days after the final injection, mice were sacrificed and their spleen cells were
fused with Sp20 myeloma cells using PEG 4000 (Merck, Germany). The fused cells were selected for
hybridomas using Iscove’s Modified Dulbecco’s Medium (IMDM) (Gibco, Rockville, MD, USA)
supplemented with hypoxanthine-aminopterin-thymidine (HAT) (Sigma-Aldrich, USA). Indirect ELISA
was carried out to screen the antibody-producing hybridomas, which were sub-cloned and passaged at least
three times to ensure monoclonality, before they were expanded in serum free media (CDM4mAb, Hyclone
Laboratories, Logan, UT, USA) for antibody purification. The isotypes of the antibodies were determined
using an isotyping kit (Sigma-Aldrich, USA). The antibodies were purified by Protein G-agarose
(Calbiochem) affinity chromatography.
40
Indirect ELISA
A 96-well clear maxisorp plate (Nunc, Denmark) was coated with 70 ng/well of α-syn fibrils in PBS and
was incubated at 4°C overnight. The plate was then washed three times with PBS-T(PBS containing 0.05%
Tween 20) and incubated with blocking buffer (PBS-T containing 2.25% gelatin) for 1 h at RT. After an
additional wash with PBS-T, 100 µl of antiserum (for titer check) or hybridoma culture supernatant (for
screening of positive clones) was dispensed in each well and the plate was incubated for 1 h at RT. The
plate was then washed with PBS-T and incubated with HRP-conjugated goat anti-mouse secondary
antibody (Jackson ImmunoResearch Laboratories Inc., USA) for 1 h at RT. After washing with PBS-T,
50µl/well of tetramethylbenzidine (TMB) peroxidase substrate (KPL, Maryland, USA) was added. The
reaction was stopped by adding 0.6 N H2SO4 (100 µl/well) and the absorbance at 450nm was measured in
a Victor X3 2030 multilabel plate reader (Perkin Elmer, USA).
Inhibition ELISA
A 384-well black maxisorp plate (Nunc, Denmark) was coated with 1.4 µg/ml of α-syn fibrils (50 µl/well)
in PBS and incubated at 4°C overnight. Blocking was carried out as described for the indirect ELISA. α-
Syn fibrils or monomers at starting concentration of 80 µM were subjected to two-fold serial dilution in
blocking buffer generating 18 different concentrations in 0.6 ml siliconized tubes. Equal volume of 20
ng/ml of our mAbs (Syn-F1, Syn-F2, Syn-O1, Syn-O2, Syn-O3 and Syn-O4) or the control antibody (Syn-
1) were added to each dilution and mixed for 2.5 h at RT. The antibody-antigen mixture was then added to
the antigen-coated–plate and incubated for 10 minutes at RT. Following washes with PBS-T, HRP-
conjugated goat anti-mouse secondary antibody (1:15000; Jackson ImmunoResearch Laboratories Inc.,
USA) was added and incubated for 1h at RT. The bound HRP activities were assayed by chemiluminescent
reaction using 50 µl/well of an enhanced chemiluminescent substrate (SuperSignal ELISA Femto
Maximum Sensitivity Substrate, Pierce Biotechnology, Rockford, USA). The chemiluminescence in
relative light units was then measured in a Victor X32030 multi-label plate reader (Perkin Elmer, USA).
Dot Blot
Nitrocellulose membrane was spotted with 50 ng (5 µl/spot) of protein and blocked with blocking buffer
(5% skimmed milk in PBS-T) for 1 h at RT. After washing, the blots were probed with the generated
antibodies or control antibodies (see Table. 3) specific for Aβ (82E1, IBL America, 50ng/ml), tau (5E2,
kindly provided by prof. Dominic Walsh, Harvard Medical School, 50ng/ml,), IAPP (R10/99, Santa Cruz
Biotechnology, 100ng/ml), ABri (Rabbit anti-ABri antiserum, kindly provided by Prof. Dominic Walsh,
Harvard Medical School, 1/3000), β-syn (Anti-beta synuclein (8), Santa Cruz Biotechnology, 1:2000), γ-
syn (C-20, Santa Cruz Biotechnology, 1:3000) α-syn (Syn-1, BD Bioscience, 50ng/ml), truncated α-syn (1-
122), NAC(61-95) and NAC(61-78) (5C2, Santa Cruz Biotechnology, 1:50), and incubated for 2 h at RT.
For the pre-absorption experiment, the antibodies were mixed with 5µg/ml of either α-syn fibrils or

41
monomers for 2 h at RT and then incubated with the nitrocellulose membrane, which was spotted with α-
syn fibrils or monomers. The blots were washed and incubated with the appropriate HRP-conjugated
secondary antibody for 1 h at RT and developed with chemiluminescent substrate (SuperSignal west pico
substrate, Pierce Biotechnology, Rockford, USA).
Determination of mAbs affinities by surface plasmon resonance
The kinetic constants for the interaction between the six raised mAbs and α-syn fibrils were determined by
surface plasmon resonance on a BIAcore X 100 instrument (Biacore, GE Healthcare). CM5 sensor chip
was activated with N-hydroxysuccinimide (NHS) and 1-ethyl-1-(dimethylaminopropyl)-carbofiimide
(EDC). α-Syn fibrils were immobilized on the chip by injecting 35 µl (120 µg/ml) of α-syn fibrils in 10
mM sodium acetate buffer, pH 4.5. The association rate constants were obtained by injecting the raised
antibodies or the control antibody, anti-α-syn 211 (Santa Cruz Biotechnolgy, USA) at eight different
concentrations ranging from 0.01 to 10 nM in HBS running buffer (10 mM HEPES, 150 mM NaCl, 3.4
mM EDTA and 0.005% surfactant P20, pH 7.4) at a flow rate of 10 µl/minute. The dissociation rates were
measured at a flow rate of 40 µl/min. The sensor chip was regenerated using 100 mM NaHCO3, pH. 9.6
and the sensograms analyzed with the BOA evaluation software (Biacore, GE Healthcare).
Epitope mapping
Synthetic fourteen amino acid long peptides with 7 amino acid overlap, covering the entire sequence of α-
syn (see Table 2) were used (Shanghai Hanhong Chemical Co., China). A 384-well black maxisorp plate
(Nunc, Denmark) was coated with 500 ng/well of the peptides in 0.2 M NaHCO3, pH 9.6 or 70 ng/well of
α-syn fibrils in PBS, pH 7.4 and incubated uncovered at 37°C overnight to dry out. The plate was washed
with PBS-T and blocked with 100 µl/well of blocking buffer (2.25% gelatin in PBST) for 1 h at RT.
Subsequent to washes with PBS-T, 50 µl/well (100 ng/ml) of our antibodies was added and the plate was
incubated for 1h at RT. Syn-1 (200 ng/ml, mouse anti-α-syn; BD Bioscience), N-19 (200 ng/ml, goat anti-
α-syn; Santa Cruz Biotechnology), FL-140 (200 ng/ml, rabbit anti-α-syn; Santa Cruz Biotechnology), 5C2
(1 µg/ml, mouse anti-α-syn; Santa Cruz Biotechnology) and 3B6 (1 µg/ml, mouse anti-α/β-syn; Santa Cruz
Biotechnology) were also included as control antibodies (see Table 3). After incubation with the appropriate
secondary antibody, HRP conjugated goat anti-mouse IgG (1:20000; Jackson ImmunoResearch
Laboratories Inc., USA), goat anti-rabbit IgG (1:5000; Jackson ImmunoResearch Laboratories Inc., USA),
or chicken anti-goat IgG (1:20000; Jackson ImmunoResearch Laboratories Inc., USA) for 1 h at RT, the
plate was incubated with 50 µl/well of substrate (Super Signal ELISA Femto Maximum Sensitivity
Substrate, Pierce Biotechnology, Rockford, USA) and the chemiluminescence in relative light units
measured with a Victor X3 2030 multi-label plate reader (Perkin Elmer, USA). The ELISA plates were
then exposed onto x-ray film and then developed to obtain the pepscan blots.

42
Table 1. Comparison of binding affinity of conformation-specific mAbs !
mAbs Isotype
Binding affinity by Inhibition ELISA
Kinetic constants by Surface Plasmon Resonance
IC50 (mean ±SD) Fold
affinity to
fibrils
ka (1/Ms)
kd (1/s)
KD (M) Fibrils
(µM)
Monomers (µM)
Syn-F1
IgG1
0.00012 ±2.1x10⁻⁶
2.083 ±0.103
16558 1.23 x 10⁷ 1.56 x 10⁻³ 1.27 x 10⁻¹⁰
Syn-F2 IgG2a 0.00118
±1.4x10⁻⁵
3.707 ±0.237 3141 1.25 x 10⁶ 3.37 x 10⁻³ 2.68 x 10⁻⁹
Syn-O1 IgG2b 0.00037
±5.3x10⁻⁵
4.793 ±0.785 12737 3.59 x 10⁶ 6.93 x 10⁻⁴ 1.92 x 10⁻¹⁰
Syn-O2 IgG1 0.00012
±4.4x10⁻⁶
3.283 ±0.212 27312 1.31 x 10⁷ 1.27 x 10⁻³ 9.6 x 10⁻¹¹
Syn-O3 IgG1 0.00047
±6.3x10⁻⁴
5.329 ±1.75 11129 1.78 x 10⁶ 4.8 x 10⁻⁴ 2.76 x 10⁻¹⁰
Syn-O4 IgG1 0.00052
±7.7x10⁻⁶
3.605 ±0.111 6932 7.23 x 10⁶ 9.64 x 10⁻⁴ 1.37 x 10⁻¹⁰
Syn-1 IgG1 0.00210 ±2.1x10⁻⁵
0.001 ±3.5x10⁻⁵ 0.476 - - -
211 IgG1 - - - 1.64 x 10⁵ 4.22 x 10⁻⁴ 2.56 x 10⁻⁹

43
Table 2. Sequence of α-syn peptide library. Each peptide is 14 amino acid long (7 amino acid overlap) spanning the sequence of human α-syn.
Peptide No.
Sequence No.
Peptide sequence
1 1-14 MDVFMKGLSKAKEG 2 8-21 LSKAKEGVVAAAEK 3 15-28 VVAAAEKTKQGVAE 4 22-35 TKQGVAEAAGKTKE 5 29-42 AAGKTKEGVLYVGS 6 36-49 GVLYVGSKTKEGVV 7 43-56 KTKEGVVHGVATVA 8 50-63 HGVATVAEKTKEQV 9 57-70 EKTKEQVTNVGGAV 10 64-77 TNVGGAVVTGVTAV 11 71-84 VTGVTAVAQKTVEG 12 78-91 AQKTVEGAGSIAAA 13 85-98 AGSIAAATGFVKKD 14 92-105 TGFVKKDQLGKNEE 15 99-112 QLGKNEEGAPQEGI 16 106-119 GAPQEGILEDMPVD 17 113-126 LEDMPVDPDNEAYE 18 120-133 PDNEAYEMPSEEGY 19 127-140 MPSEEGYQDYEPEA
Time dependent aggregation of α-syn
Fresh α-syn solution (50 µM) in PBS was incubated at 37°C with continuous mixing (800 rpm) in a
thermomixer. Aliquots of the incubated solution were collected at different time points (0, 2, 4, 6, 16, 24,
36 and 48 h), flash frozen with liquid nitrogen and stored at -80°C until required for dot blotting or sandwich
ELISA. Aggregation was monitored by Th-S assay, western blotting and transmission TEM.
Western blotting
The samples (30 ng) collected at various time points during the α-syn aggregation process were mixed with
the non-reducing sample buffer (0.25 M Tris-HCl, pH 6.8, 50% glycerol, 0.01% bromophenol blue), loaded
into a 15 % SDS-PAGE gel and separated by electrophoresis at 100V for 90 minutes. The use of non-
denaturing condition helps to maintain the high molecular weight species present in aggregated samples
compared with the samples prepared in denaturing condition [38]. The proteins were subsequently

44
Table 3. List of commercial antibodies used in this study.
Sl. No.
Antibody
Source
Epitope
Experiment
Dilution
1 Amyloid β, (82E1)
IBL America - Dot blot 50 ng/ml
2 Anti Tau antibody, 5E2
Gift from Prof. Dominic Walsh, Harvard medical
school
- Dot blot 50 ng/ml
3 Amylin antibody, R10/99
Santa Cruz Biotechnology
- Dot blot 100 ng/ml
4 Anti-ABri antiserum
Gift from Prof. Dominic Walsh, Harvard medical
school
- Dot blot 1/3000
5 β-synuclein antibody (8)
Santa Cruz Biotechnology
- Dot blot 1/2000
6 γ-synuclein Antibody (C-
20)
Santa Cruz Biotechnology
- Dot blot 1/3000
7 α-synuclein antibody (Syn-1)
BD Biosciences 91-99 of α-syn
Dot blot and ELISA
200 ng/ml
8 α-synuclein antibody, 5C2
Santa Cruz Biotechnology
61-95 of α-syn
Dot blot and ELISA
1/50 (Dot Blot) and 1µg/ml
(ELISA)
9 α-synuclein antibody, N19
Santa Cruz Biotechnology
1-60 of α-syn
ELISA 200 ng/ml
10 α-synuclein antibody, FL-140
Santa Cruz Biotechnology
Full length of α-syn
ELISA and western blot
200ng/ml (ELISA)
and 1/3000
(Western blot)
11 α/β-synuclein
antibody, 3B6 Santa Cruz
Biotechnology 119-140 of α-syn
ELISA 1µg/ml (ELISA)

45
transferred into a nitrocellulose membrane and western transfer performed at 90V for 110 minutes. The
membrane was boiled in PBS for 5 minutes and blocked with blocking buffer (5% skimmed milk in PBS-
T) for 1 h at RT followed by incubation with α/β/γ-syn FL-140 polyclonal antibody (1:3000 in PBS-T,
Santa Cruz Biotechnology, USA) for 2 h at RT. After washing with PBS-T, the membrane was incubated
for 1 h with HRP-conjugated goat anti-rabbit IgG (1:120.000 in PBS-T, Jackson ImmunoResearch
Laboratories Inc., USA). Following an additional washing step with PBS-T, the membrane was developed
with Super signal west femtochemiluminescent substrate (Pierce Biotechnology, Rockford, USA).
ELISA for measuring α-syn aggregates
A 384-well ELISA maxisorp plate (Nunc, Denmark) was coated by overnight incubation with either 0.1
µg/ml of our mAbs or Syn-1 (BD Bioscience, San Diego) (50 µl/well) in coating buffer (200 mM NaHCO3
buffer, pH 9.6). After washing with PBS-T, the plates were incubated with blocking buffer (PBS-T
containing 2.25% gelatin and 1% BSA) for 2 h at 37°C. Aggregated α-syn collected at various time points
(0, 2, 4, 6, 16, 24, 36 and 48 h) at a concentration of 5 nM (50 µl/well in PBS) was added and incubated for
5 minutes at RT, followed by incubation with 50 µl/well of the FL-140 rabbit polyclonal antibody (Santa
Cruz Biotechnology, USA, 1:1000) for 2 h at 37 °C. Subsequently, 50 µl/well HRP-conjugated goat anti-
rabbit IgG (Jackson ImmunoResearch Laboratories Inc., USA, 1:15000) was added and incubated for 1.5
h at 37°C. The bound HRP was detected by adding 50 µl/well of substrate (Super Signal ELISA Femto
Maximum Sensitivity Substrate, Pierce Biotechnolgy, Rockford, USA) and the chemiluminescence in
relative light units was measured in a Victor X3 2030 multi-label plate reader (Perkin Elmer, USA).
ELISA for measuring of α-syn oligomers in human brain homogenates
Frozen post-mortem samples of the frontal cerebral cortex from clinically diagnosed and
neuropathologically-confirmed DLB patients (n=14), AD patients (n=9) and age-matched controls (n=7)
were obtained from Manchester Brain Bank and processed as previously reported [18]. Briefly, tissue
samples were homogenized in CelLytic buffer (Sigma-Aldrich, USA) containing a cocktail of protease
inhibitors, including AEBSF, aprotinin, E-64, EDTA and leupeptin (Calbiochem, Germany) and
centrifuged at 100,000 x g for 3 h at 4°C.. The supernatant was collected, total protein concentration was
measured and all samples were adjusted to 0.1 mg/ml and stored at -80°C.
A 384-well ELISA plate (Nunc, Denmark) was coated with 0.2 µg/ml of Syn-O2 antibody (50 µl/well), in
200 mM NaHCO3 buffer, pH 9.6, and incubated at 4°C overnight. After incubation with 100µl/well of
blocking buffer (PBS-T containing 2.25% gelatin) for 2 h at 37°C, 50 µl/well of the brain lysates (5 µg/ml
in CelLytic buffer, Sigma-Aldrich, USA) and serial dilutions of α-syn oligomers (as standard generated
from aggregation of α-syn with Gn Rb1 [38] was dispensed in each well and the plate was incubated at
37°C for 2.5 h. After washing with PBS-T, 50 µl/well of FL-140 antibody (1:1000) was added and the plate
was incubated for another 1 h at 37°C. Subsequently, 50 µl/well of HRP-conjugated anti-rabbit antibody
46
(Jackson ImmunoResearch Laboratories Inc., USA, 1:15000) was added and incubated for 1 h at 37°C. The
plate was then washed and incubated with 50 µl/well of an enhanced chemiluminescent substrate (Super
Signal ELISA Femto Maximum Sensitivity Substrate, Pierce Biotechnology, Rockford, USA) and the
chemiluminescence in relative light units was measured with a Victor X32030 multi-label plate reader
(Perkin Elmer, USA). The samples were screened in a blinded fashion and tested randomly in duplicates.
All results were confirmed with at least two independent experiments. A series of internal controls was also
run to check for run-to-run variations. The intra-assay and inter-assay coefficient of variation examined
over >10 plates was < 10%. The lower limit of detection was as low as 10 pg/ml. The lower limit of
quantification for the assay was determined to be 10 pg/ml and the upper limit of quantitation was 10 ng/ml.
The concentration of α-syn oligomers in the samples was calculated using the standard curve.
Immunohistochemistry with conformation-specific α-syn antibodies of human brain tissue samples
The conformation-specific anti-α-syn mAbs were tested by five independent laboratories using
immunohistochemistry: Laboratory 1 (Van de Berg, Amsterdam) evaluated the immunostaining in the
substantia nigra (SN), hippocampus and entorhinal cortex of idiopathic PD, DLB and age-matched controls;
Laboratory 2 (Parkkinen, Oxford) evaluated immunostaining using different antigen retrieval methods in a
DLB patient. Laboratory 3 (Halliday, Sydney) evaluated the immunostaining in the anterior cingulate cortex
of PD, AD and aged, neurologically normal control cases, and the putamen from a MSA case; Laboratory
4 (Imai, Tokyo) evaluated the double immunofluorescence staining for brain sections from PD and control
cases; Laboratory 5 (Gai, Flinders) employed double immunofluorescence staining to compare the staining
patternson isolated cortical LBs from DLB cases. In agreement with local ethical guidelines, informed
consent was obtained for the use of all donor brain tissue, and neuropathological and clinical information
for research purposes.
Laboratory 1 (Van de Berg, Amsterdam): Transverse 10-µm-thick sections of formalin-fixed, paraffin-
embedded brain tissue including mesencephalon, hippocampus and entorhinal cortex of clinically
diagnosed and pathologically confirmed PD, DLB and aged-matched non-demented control cases (n=4 per
group), collected by the Netherlands Brain Bank (NBB, Amsterdam, The Netherlands), were processed for
immunohistochemistry. Antigen retrieval consisted of steaming in citrate buffer pH 6.0 followed by
blocking in 5% bovine albumin (BSA) in TBS-triton and then the elimination of endogenous peroxidase
activity with treatment with 3% H2O2 in PBS. Adjacent sections were then incubated with our mAbs (Syn-
O1, Syn-O2, Syn-O3, Syn-O4, F1, F2; 200 ng/ml), Syn-1 (BD Laboratories; 125 ng/ml) and KM51
(Novocastra, Newcastle, UK; dilution 1:500, full length) overnight at 4oC. To visualize the primary
antibodies, the EnVisiontm system (DAKO) was used which contains the specific secondary antibodies for
anti-mouse lgG. Next, 3, 3’-diaminobenzidine (DAB) peroxidise (Sigma-Aldrich) was applied for antigen
visualisation and sections were counterstained using 0.5% cresyl violet.

47
Laboratory 2 (Parkkinen, Oxford): All six antibodies were tested with no pretreatment or with three
different antigen retrieval methods (a. autoclave at 120°C for 10 min in citrate buffer; b. 98%formic acid
for 15 min; c. 20 µg/ml of proteinase K for 5 min) in formalin-fixed, paraffin-embedded 6-µm-thick sections
from the entorhinal cortex of a pathologically confirmed DLB patient (81 years, male) collected by the
Oxford Brain Bank. Following antigen retrieval, endogenous peroxidase activity was eliminated with
treatment with 3% H2O2 (in PBS), antibodies were each diluted (200 ng/ml) and adjacent sections incubated
overnight at 4°C. For detection, Histostain SP kit (Zymed, San Francisco, CA) was used with Romulin AEC
chromogen (Biocare Medical, Walnut Creek, CA).
Laboratory 3 (Halliday, Sydney):Immunostaining was performed on 10-µm-thick, formalin-fixed,
paraffin-embedded brain sections of the anterior cingulate cortex of clinically diagnosed and pathologically
confirmed PD (mean disease duration of 13±11 y), AD (disease duration of 6 y) and aged-matched control
cases (males n=2 per group, mean group age at death 81±6 y), and from the putamen of a male MSA case
(duration of 8 years, aged 67 at death) collected by the Sydney Brain Bank. Antigen retrieval with formic
acid (90%) for 3 min was followed by blocking endogenous peroxidase activity using 1% H2O2 (in 50%
ethanol) and non-specific binding using 10% normal horse serum. Adjacent sections were incubated
overnight at 4°C with Syn-1 (BD Laboratories; 125 ng/ml), anti-phospho-S129 α-syn antibody (Abcam;
1:500), Syn-F1 (100 ng/ml), Syn-F2 (200 ng/ml), Syn-O1 (100 ng/ml), Syn-O2 (200 ng/ml), Syn-O3 (200
ng/ml) or Syn-O4 (200 ng/ml), washed and incubated with biotinylated horse anti-mouse (Vector
Laboratories, USA; 1:200) or goat anti-rabbit (Vector Laboratories, USA; 1:200) antisera for 30 minutes at
37°C, followed by avidin-biotin complex (Vectastain Elite kit; Vector Laboratories, USA; 1:500) for 30
minutes at RT. Visualization with DAB in 0.005% H2O2 was used and sections counter-stained with 0.5%
cresyl violet.
Laboratory 4 (Imai, Tokyo): Double immunofluorescence was performed using 10-µm-thick, formalin-
fixed, paraffin-embedded sections from the amygdala of clinically diagnosed and pathologically confirmed
PD and control cases collected by the Department of Neurology, Jutendo University Hospital, Japan and
approved by the ethical committee of Jutendo University. Deparaffinized sections microwaved in citrate
buffer pH 6.0 for 7 min for antigen retrieval, were neutralized with PBS pH 7.4. Sections were blocked
with 5% goat serum and incubated with primary antibodies (Syn-F2 and Syn-O4; 500 ng/ml; MJFR1; 2
µg/ml) overnight at 4˚C. The primary antibodies were visualized with Alexa Fluor488 goat anti-mouse IgG
(1:400, Life Technologies) and Alexa Fluor594 goat anti-rabbit IgG (1:400) for 2 h at RT. To reduce the
lipofuscin autofluorescence, sections were further treated with 0.1% Sudan black B (CI 26150, Wako) in
70% ethanol for 1 min and washed with PBS briefly, prior to mounting with Vectashield (H-1000, Vector
Laboratories) and assessed using a TCS-SP5 laser-scanning microscope system (Leica Microsystems). For

48
tissue integrity, the same brain samples were stained with DAB and Hematoxylin, and indicated the cell
morphology is well conserved (data not shown).
Laboratory 5 (Gai, Flinders): Immunofluorescence double staining was used to compare the staining
patterns of our conformation-specific mAbs with generic α-syn antibodies, on isolated cortical LBs. The
LBs were isolated from temporal cortices of two DLB cases, and smears made as described [39]. Briefly,
fresh frozen brain tissues were taken from two cases [sex/age at death/ postmortem interval (h): m/80/6,
f/81/12]. Gray matter was dissected from the temporal cortex comprising the superior, middle, inferior, and
fusiform gyri from a 1-cm-thick coronal slice at the level of caudal amygdaloid, and homogenized in four
volumes of homogenization buffer (HB; 0.32 M sucrose, 50 mM Tris-HCl at pH 7.4, 5 mM EDTA,
leupeptin 1 mg/ml, pepstatin 1 mg/ml, phenylmethylsulfonyl fluoride 17.4 mg/ml), and homogenized in a
Dounce homogenizer (Wheaton) by 10 strokes of pestle A and 10 strokes of pestle B. The homogenate was
filtered through glass wool and centrifuged for 10 min at 1000 x g. The pellet was adjusted to 6 ml with HB
and 14% (v/v) of Percoll concentration. The suspension was overlaid on 2.4 ml of 35% Percoll (v/v in HB)
and centrifuged for 30 min at 35,000 x g. The material between the sample-35%Percoll interface was
collected and washed once in TBS (50 mM Tris–HCl buffered saline pH 7.4 and protease inhibitors) by
centrifugation for 10 min at 4000 x g. The above procedures were conducted either on ice or at 4°C. The
pellet was resuspended in 10 volumes of TBS and smeared onto gelatin-coated slides and air-dried at room
temperature. The smears were fixed for 10 min with 2% paraformaldehyde with 0.2% picric acid in PBS,
followed by 3 X 5 min washes with TBS-azide (20 mM Tris-HCl, 0.15M NaCl, 0.1% sodium azide, pH
7.4), blocked for 60 min with 20% normal horse serum (NHS) in TBS-azide, incubated overnight with
primary antibody pairs constituted in 1% NHS TBS-azide. Primary antibodies were affinity-purified sheep
anti-α-syn [40] and our mAbs (1 µg/ml). Following 3 X 5 min washes with TBS-azide, the smears were
incubated for 1 h with Alexa 594 or Alexa 488 conjugated donkey anti-sheep and donkey anti-mouse
(Invitrogen) IgG. The smears were washed 3 X 5 min washes with TBS-azide, and coverslipped with 20µl
of Vectashield mounting medium, sealed and examined using a Leica TCS SP5 Spectral Confocal
Microscope.
Statistical analysis
Statistical significance for the group comparisons for the levels α-syn oligomers in human brain
homogenates was analyzed by one-way ANOVA with Dunnett post-hoc test. The data were represented as
mean. Analyses were performed using GraphPad Prism software version 5.00 (GraphPad Software, San
Deigo, CA, USA). P-value <0.05 were considered as significant.
Results Generation of mAbs specific for α-syn pathology

49
In order to generate mAbs specific for α-syn pathology, we immunized Balb/c mice with α-syn fibrils. We
observed that all mice showed a high antibody titer immediately after the first booster immunization and,
as a consequence, they did not receive any further immunization prior to sacrificing. By employing an
indirect ELISA, we identified 1,100 positive clones for α-syn aggregates that were subcultured at least three
times to isolate the stable ones. Using dot blotting, we identified only 100 clones that showed specificity
for α-syn fibrils and not monomers, which were then selected for further characterization. Isotyping of the
antibodies secreted by these clones revealed that only 33 of them were producing IgG antibodies, while the
remaining clones were producing antibodies either of the IgM type or a mixture. The clones producing IgM
were excluded and the hybridoma clones secreting IgG antibodies selected, passaged multiple times to
identify stable clones and subjected to single cell cloning to achieve monoclonality.
The specificity of the hybridoma clones for α-syn aggregates was assessed by dot blot (Figure 1).
Fourteen stable clones were found to be highly specific for α-syn aggregates and were passaged at least
three times prior to confirming their isotype subclass. Out of the 14 IgG-secreting clones, the best 6 clones
(based on the clones’ stability and their binding specificity towards α-syn aggregates) were selected for
extensive characterization, which were later named based on their preference to either early α-syn oligomers
and mature amyloid fibrils Syn-Os” or only to mature amyloid fibrils Syn-Fs” namely Syn-F1 (IgG1), Syn-
F2 (IgG2a), Syn-O1 (IgG2b), Syn-O2 (IgG1), Syn-O3 (IgG1) and Syn-O4 (IgG1).
Fig. 1. Representative image for the screening of hybridoma clones by dot blot.
50 ng of fibrils (F) and monomers (M) of α-syn were spotted onto a nitrocellulose membrane. The membranes were then probed with hybridoma culture supernatant (1:1 diluted in PBS) or control generic mAb Syn-1.

50
The selected mAbs only recognize fibrils of the full-length α-syn
In order to further evaluate the specificity of the selected antibodies for α-syn fibrils we performed an
inhibition ELISA and dot blotting. Inhibition ELISA was used to characterize the selectivity and affinity of
the six mAbs for α-syn fibrils versus monomers. According to the results, all six antibodies recognized
selectively α-syn fibrils compared to monomers (Figure 2A-F), whereas the control antibody Syn-1 detected
both α-syn fibrils and monomers (Figure 2G).
Fig. 2. Specificity of the Abs to α-syn fibrils. Inhibition ELISA using Syn-F1, Syn-F2, Syn-O1, Syn-O2, Syn-O3, Syn-O4 (A-F) and control mAb Syn-1 (G).
Our mAbs were selective for fibrils compared to the monomers whereas Syn-1 showed equal preference for both monomers and fibrils. (H) Dot blot to confirm the specificity of our mAbs to α-syn fibrils. 5 µg/ml of either α-syn fibrils or monomers were preabsorbed with 50 ng/ml of our mAbs or 200 ng/ml of control antibodies (Syn-1 or 211) for 2 h at RT. The mixture was added to nitrocellulose membrane coated (50 ng/spot) of α-syn fibrils (F) or monomers (M) and then incubated for 30 min at RT.

51
To confirm further the specificity of our antibodies for α-syn fibrils, we assessed their ability to detect
monomeric and fibrillar α-syn after preabsorption with α-syn fibrils or monomers. As expected,
preabsorption of the antibodies with α-syn fibrils completely abolished their ability to detect α-syn fibrils
(Figure 2H) whereas, preabsorption of the antibodies with α-syn monomers had no effect which was
comparable to the signal produced by the non-absorbed antibodies. In contrast, preabsorption of the control
antibodies (Syn-1 and 211) with either form of α-syn, hindered their ability to detect both monomeric and
fibrillar α-syn (Figure 2H). These results strongly suggest that the new mAbs generated recognize epitopes
that are exclusively present in α-syn fibrils.
Interestingly, by employing various fragments of α-syn, including the C-terminally truncated α-syn
(1-122), the central hydrophobic region of α-syn NAC (61-95) or the fragment NAC (61-78), we show that
all the newly generated mAbs only detect the fibrils generated by the full-length protein (Figure 3A). The
control antibodies (Syn-1 and 5C2) not only detected fibrils and monomers of full-length α-syn (1-140),
but also truncated α-syn (1-122) and the NAC (61-95) fragment.
To investigate further the selectivity of the six selected mAbs, we assessed their cross-reactivity
with monomeric or fibrillar forms of β- and γ-syn. As shown in Figure 3B, the antibodies did not cross-
react with either the monomers or the fibrils generated from β- or γ-syn. Similarly, the antibodies did not
detect the fibrillar forms of other amyloidogenic proteins including Aβ, Tau40, IAPP or ABri (Figure 3C).
These results further confirm the selectivity of the newly generated mAbs for α-syn fibrils.
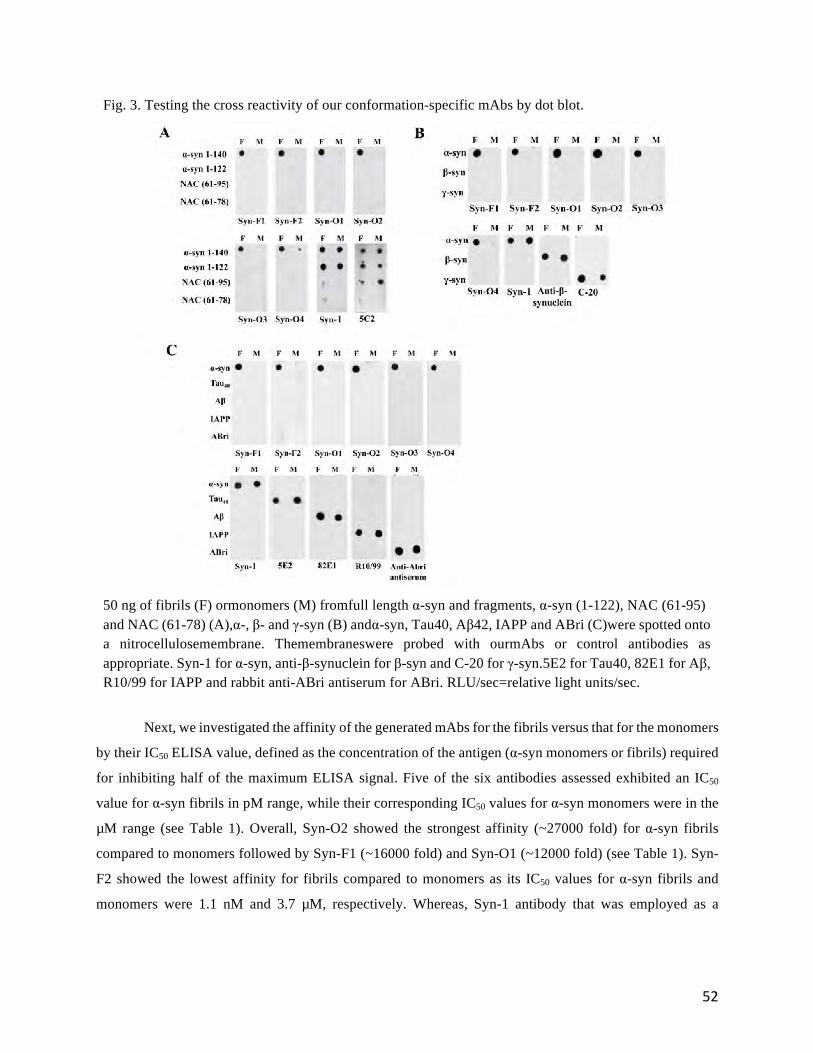
52
Fig. 3. Testing the cross reactivity of our conformation-specific mAbs by dot blot.
50 ng of fibrils (F) ormonomers (M) fromfull length α-syn and fragments, α-syn (1-122), NAC (61-95) and NAC (61-78) (A),α-, β- and γ-syn (B) andα-syn, Tau40, Aβ42, IAPP and ABri (C)were spotted onto a nitrocellulosemembrane. Themembraneswere probed with ourmAbs or control antibodies as appropriate. Syn-1 for α-syn, anti-β-synuclein for β-syn and C-20 for γ-syn.5E2 for Tau40, 82E1 for Aβ, R10/99 for IAPP and rabbit anti-ABri antiserum for ABri. RLU/sec=relative light units/sec.
Next, we investigated the affinity of the generated mAbs for the fibrils versus that for the monomers
by their IC50 ELISA value, defined as the concentration of the antigen (α-syn monomers or fibrils) required
for inhibiting half of the maximum ELISA signal. Five of the six antibodies assessed exhibited an IC50
value for α-syn fibrils in pM range, while their corresponding IC50 values for α-syn monomers were in the
µM range (see Table 1). Overall, Syn-O2 showed the strongest affinity (~27000 fold) for α-syn fibrils
compared to monomers followed by Syn-F1 (~16000 fold) and Syn-O1 (~12000 fold) (see Table 1). Syn-
F2 showed the lowest affinity for fibrils compared to monomers as its IC50 values for α-syn fibrils and
monomers were 1.1 nM and 3.7 µM, respectively. Whereas, Syn-1 antibody that was employed as a

53
reference exhibited comparable affinities for α-syn monomers and fibrils with IC50 values for fibrils and
monomers being 2.1 nM and 1.0 nM, respectively (Table 1).
In order to assess the binding kinetics of the raised antibodies for α-syn fibrils, surface plasmon
resonance (SPR) binding studies were carried out. All six antibodies exhibited high affinity for α-syn fibrils
(Figure 4). Indeed, in accordance with the IC50 ELISA values obtained above, the affinity for α-syn fibrils
for the antibodies Syn-F1 and Syn-O1, -O2, -O3 and -O4 was in the pM range and for Syn-F2 in the nM
range, with Syn-O2 showing the highest (96 pM) and Syn-F2 showing the lowest (2.6 nM) affinity for α-
syn fibrils (see Table 1). Interestingly, the reference antibody 211 showed a KD of 2.5 nM, which is
comparable to the lowest affinity observed for Syn-F2 antibody (see Table 1). This apparent affinity is most
likely avidity and proper affinity assessments need testing with the Fab fragments of the antibodies.
Fig. 4. SPR sensogram showing the binding kinetics of our mAbs and control antibody 211 to α-syn fibrils. Binding of our mAbs was determined by surface plasmon resonance using BIAcore X biosensor.
The binding curve in each sensogram corresponds to different concentrations of the mAbs. The response unit (RU) was calculated for nonspecific binding relative to a blank flow cell surface.

54
The selected mAbs do not recognize the linear sequence of α-syn
To further assess whether the generated antibodies detect linear or conformational epitopes, we
evaluated their binding against an overlapping peptide library composed of synthetic 14-mer peptides,
corresponding to amino acid residues 1-14, 8-21, etc, and spanning the entire α-syn sequence (see Table 2).
As shown in Figure 5A, with the exception of peptide No.19, corresponding to the α-syn C-terminal
fragment 127-140, the generated mAbs did not detect any other α-syn peptides from the peptide library.
Nevertheless, the detection of α-syn (127-140) peptide was extremely weaker compared to their signal for
the detection of α-syn fibrils (Figure 5A). Moreover, the commercially available α-syn antibodies Syn-1
(recognizes amino acid residues 91-99 of α-syn) [41], N19 (recognizes the N-terminus of α-syn, i.e. amino
acid residues 1-60), FL-140 (recognizes the full length of α-syn), 3B6 (recognizes the amino acid residues
119-140 of α-syn) and 5C2 (recognizes the amino acid residues 61-95 of α-syn) were also employed as
controls in this experiment. All the control antibodies detected α-syn fibrils, but unlike the generated mAbs,
they also strongly detected the peptides that contained part of their epitopes (Figure 5A).
The ELISA results also revealed interesting information regarding the exposed part of the epitope
in the fibrils. Moreover, the blots of the ELISA plates exposed in X-ray film, shown in Figure 5B, illustrate
unambiguously the intensity of the ELISA signal, revealing that the control antibodies, which were raised
against the linear forms of α-syn detected both α-syn fibrils and the peptides corresponding to their epitopes
with comparable intensity. Conversely, the generated mAbs detected α-syn fibrils with much higher
intensity compared to the C-terminal peptide α-syn (127-140; peptide 19), which only detected a weak
signal (Figure 5B). This indicates that α-syn (127-140) may represent only a part of the epitope recognized
by the generated antibodies, or that it is partly exposed. Collectively, these results confirm further that Syn-
F1, -F2 and Syn-O1, -O2, -O3 and -O4 are conformation-specific antibodies, the epitope of which is partly
composed of the C-terminal region of α-syn.

55
Fig. 5. Epitope mapping using α-syn peptide library. (A) Pepscan by ELISA, mAbs syn-F1, Syn-F2, Syn-O1, Syn-O2, Syn-O3 and Syn-O4 showed a weak signal for the peptide number 19 (127-140).
The control antibodies reacted to the peptides corresponding to their epitopes. FL-140 recognizes the peptides number 9 (57-70), 16 (106-119) and 19 (127-140), N19 recognizes strongly peptide number 2 (8-21) andweak signal to peptides numbers 1 (1-14), 3 (15-28) and 6 (36-49), 3B6 recognizes strongly the peptide number 19 (127-140), Syn-1 recognizes peptide number 13 (85-98) and 5C2 recognizes the peptide number 12 (78-91). (B) Pepscan blots developed by exposing the plate onto an x-ray film after the ELISA signals were measured.
The conformation-specific mAbs exhibit different specificity for various α-syn species generated in
vitro
The specificity of the six antibodies was further evaluated by assessing their ability to detect early
aggregates of α-syn. For this purpose, α-syn was aggregated in vitro and samples were collected at different
time points over 48 h. The collected samples were spotted on a nitrocellulose membrane and probed with
the generated mAbs or the control antibody Syn-1. As shown in Figure 6A, B and D, the sample collected
at time 0 h contains monomers, and as expected none of the generated antibodies showed any

56
immunoreactivity. Interestingly, the antibodies Syn-O1, -O2, -O3 and –O4 exhibited immunoreactivity for
the samples collected at 2, 4, 6 and 16 h (Figure 6C), which presumably contain soluble low molecular
weight and high molecular weight oligomers (protofibrillar of α-syn (Figure 6A and D) defined based on
previous data [36, 42]). However, the immunoreactivity of Syn-O1, -O2, -O3 and –O4 antibodies was
stronger for the late aggregates present in the samples collected at 24, 36 and 48 h (Figure 6C). Interestingly,
the antibodies Syn-F1 and-F2 did not detect early aggregates, but they showed low immunoreactivity for
the 24 h sample and a much stronger signal for the samples generated thereafter, suggesting that these two
antibodies recognize more of the late aggregates of α-syn “mature fibrils”. The control antibody, Syn-1, on
the other hand, exhibited a uniform immunoreactivity for all the samples collected at different time points,
including the one collected at time 0 h (Figure 6C). Furthermore, EM confirmed that the samples collected
between 2-6 h contain only very small spherical oligomers and protofibrils as previously reported that only
monomers, dimers or small oligomers exist at the early stage of α-syn aggregation [43]. Whereas, the
samples at later time points contain mature amyloid fibrils (Figure 6D and Supplementary Figure S1).
In order to evaluate further the specificity of the generated antibodies for the samples collected at
various time points during the in vitro aggregation of α-syn, a sandwich ELISA was carried out employing
these mAbs for capturing the antigen. Consistent with the results of the dot blot, the antibodies Syn-O1, -
O2, -O3 and –O4 detected the α-syn species in the samples collected as early as 2 h and the level of detection
increased in a time-dependent fashion (Figure 6E). Furthermore, the antibodies Syn-F1 and Syn-F2 showed
a good level of detection for the samples collected at 24, 36 and 48 h that increased time-dependently
(Figure 6C). In contrast, the control antibody Syn-1 produced a good level of detection for all the collected
samples, indicating that Syn-1 exhibits an equal affinity for both monomers and aggregated species. These
data further support the notion that Syn-O1, -O2, -O3 and -O4 recognize both early oligomers and late
mature fibrils, whereas, Syn-F1 and -F2 prefer more of the mature amyloid fibrils.
Detection of high levels of presumable α-syn oligomers in brain lysates from DLB using the new
conformation-specific mAbs
To investigate whether the generated antibodies can detect, α-syn aggregates present in DLB brain, we
developed a sensitive ELISA employing the antibody Syn-O2 for capturing. Syn-O2 was selected based on
the fact that it has the highest affinity and recognizes both early oligomers and late α-syn fibrils (see Table
1 and Figure 6C and E). As shown in Figure 7A, the average levels of presumable α-syn oligomers were
significantly higher in DLB cases than the control (P=0.0012) and AD (P=0.0006) (Mann-Whitney U test),
with no significant difference observed between control and AD samples.
The homogenates of the frontal cortex samples of DLB, AD and control donors were further spotted onto
nitrocellulose membrane and probed with Syn-O2 to confirm the ELISA results. The immunoreactivity of
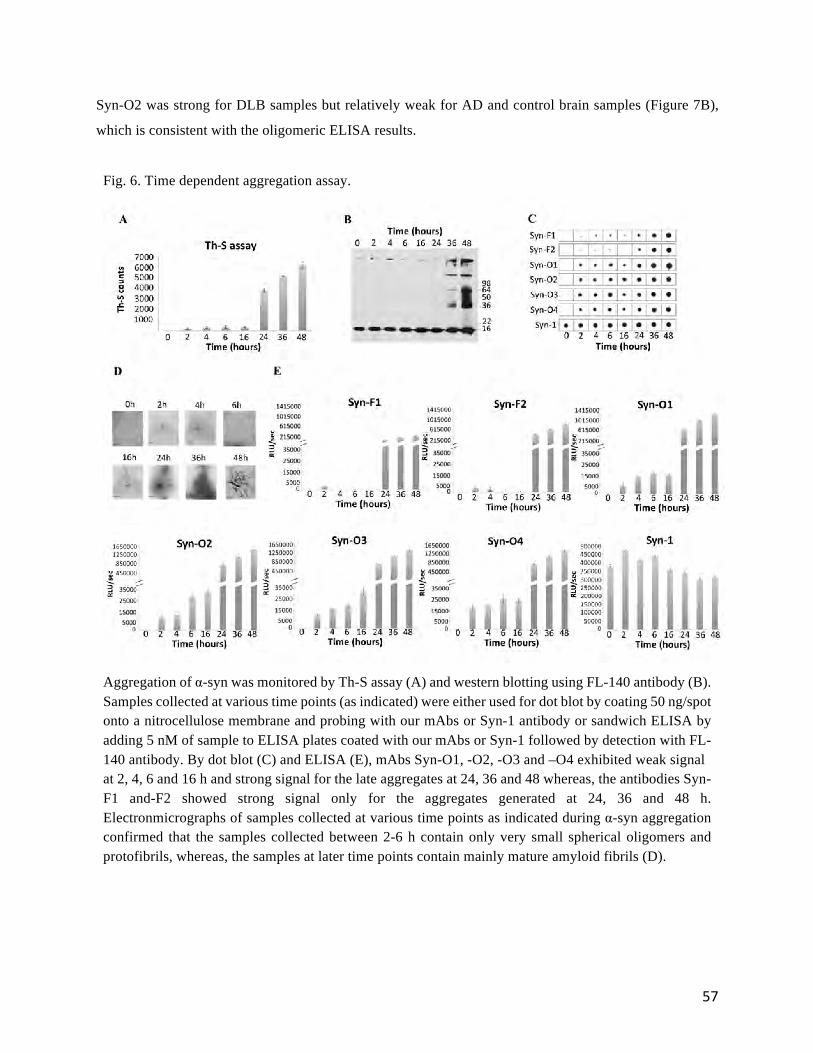
57
Syn-O2 was strong for DLB samples but relatively weak for AD and control brain samples (Figure 7B),
which is consistent with the oligomeric ELISA results.
Fig. 6. Time dependent aggregation assay.
Aggregation of α-syn was monitored by Th-S assay (A) and western blotting using FL-140 antibody (B). Samples collected at various time points (as indicated) were either used for dot blot by coating 50 ng/spot onto a nitrocellulose membrane and probing with our mAbs or Syn-1 antibody or sandwich ELISA by adding 5 nM of sample to ELISA plates coated with our mAbs or Syn-1 followed by detection with FL-140 antibody. By dot blot (C) and ELISA (E), mAbs Syn-O1, -O2, -O3 and –O4 exhibited weak signal at 2, 4, 6 and 16 h and strong signal for the late aggregates at 24, 36 and 48 whereas, the antibodies Syn-F1 and-F2 showed strong signal only for the aggregates generated at 24, 36 and 48 h. Electronmicrographs of samples collected at various time points as indicated during α-syn aggregation confirmed that the samples collected between 2-6 h contain only very small spherical oligomers and protofibrils, whereas, the samples at later time points contain mainly mature amyloid fibrils (D).

58
Fig. 7. Detection ofα-syn oligomers in human brain homogenates.
(A) Oligomeric ELISA using Syn-O2. The concentration of α-syn oligomers (pg/ml) in the brain homogenates, from control (solid circles), DLB (solid squares) and AD patients (solid triangles), was measured using Syn-O2-ELISA. There was a significant difference observed in the levels of α-syn oligomers between DLB and control (p b 0.0001) and also between DLB and AD (p b 0.0001) (one-way ANOVA with Dunnett post-hoc test). (B) Dot blot using Syn-O2. Brain extracts (0.5 µg of total protein) samples from DLB, AD and control were spotted onto nitrocellulose membrane, and then probed with Syn-O2.
Immunohistochemical analysis of human brain tissue Five laboratories evaluated the immunoreactivity of the six novel mAbs in postmortem human brain tisssue
samples in an independent manner.
Laboratory 1: In the SN of PD and DLB patients, a diversity of histopathological features were detected
with the six mAbs, including intracytoplasmic LBs and LNs, synaptic-like structures (<0.5 µm) and diffuse
intracytoplasmic immunostaining (Figure 8A). No immunoreactivity was observed in the SN of age-
matched non-demented controls with any of the novel mAbs (Figure 8A). Syn-O1-4 revealed more
synaptic-like immunostaining than Syn-F1 and Syn-F2 in both the PD and DLB cases. Both Syn-O2 and
Syn-O4 recognized small and long thin LNs in both DLB and PD cases. With the Syn-O1 antibody, few
immunostained-beaded LNs were observed in some controls in addition to synaptic immunoreactivity.
Interestingly, Syn-O1 and Syn-O3 revealed more LNs and synaptic immunoreactivity in the SN than the
commercial antibodies KM51 or Syn-1. Moreover, neurons with diffuse intracytoplasmic staining were
observed with the Syn-O1-4, whereas KM51 and Syn-1 stained mainly the larger intracytoplasmic LBs. In
addition, Syn-O1-4 immunoreactive LNs were observed in all PD and DLB donors, whereas mainly small
or long swollen/bulgy LNs were detected with the KM-51 and Syn-1 (Figure 8A). The differences between
the six mAbs were similar for PD and DLB cases. Similar immunoreactive structures were detected with

59
our mAbs in the entorhinal cortex and hippocampus of PD and DLB cases, including cortical LBs
particularly in the deeper layers and a dense meshwork of LNs in the superficial layers of the entorhinal
cortex (Figure 8B), whereas synaptic-like staining was observed in the Syn-O1-4 antibodies in the
hippocampus and entorhinal cortex (mainly superficial layers) of controls (Figure 8C). Syn-O1 and Syn-
O2 antibodies stained particularly smaller synaptic-like structures that were found within the total thickness
of the cortical grey matter. This synaptic pattern was not as well detected by Syn-F1 and -F2, with Syn-F1
though showing higher immunoreactivity than Syn-F2 to all detected structures.
Fig. 8. Representative photomicrographs of immunoreactivity with mAbs Syn-Os and Syn-Fs and commercial generic mAbs KM51 and Syn-1.

60
(A) Immunostaining in 10 µm-thick paraffin sections of post-mortem substantia nigra tissue of a non-demented control (female, 89 year), PD patient (male, 83 year; Braak PD stage 6) and DLB patient (female, 81 years; Braak PD stage 6, limbic dominant). No immunoreactivity with the mAbs was observed in the control case. In the PD and DLB cases, a diversity of histopathological features was detected with our novel conformation-specific antibodies, including LBs (arrowheads), LNs (*thin neurites;+bulgy neurite), diffuse intracellular staining, and synaptic-like immunostaining. The antibodies Syn-F1 and Syn-F2 and KM51 revealed predominantly LBs (arrowheads) and LNs (*), while synaptic-like immunostaining was less pronounced. Syn-1 stained LBs (arrowheads) andmany LNs (*) in the SN of the PD and DLB patients. Scale bar=50 µm. (B) Immunoreactivity withmAbs Syn-Os and Syn-Fs in six-adjacent 10 µmimmunostained paraffin sections of post-mortem entorhinal cortex and hippocampus of a DLB patient (male, 74 years). Comparison of the antibodies shows that Syn-O1 and Syn-O2 revealed the most synaptic-like staining in superficial layers of the entorhinal cortex. Both Syn-O2 and Syn-O4 provided strong immunoreactivity for small micro-aggregates and thin LNs. Syn-F1 and Syn-F2 revealed predominantly LBs and LNs,while synaptic-like stainingwas less pronounced. Syn-F1 hadmore affinity than Syn-F2. LBs and thick LNs aremainly seen in the deep layers of the entorhinal cortex. In the hippocampal CA1 area, LBs or small LNs were the main forms of α-syn immunoreactivity. Scale bar=50 µm. (C) Representative photomicrographs of immunoreactivity with mAbs Syn-Os and Syn-Fs in the entorhinal cortex and CA1 layer of the hippocampus of a non-demented control (male, 81 year). Synaptic-like immunoreactivitywas observed with Syn-O1-4 in the superficial layer, but not in deep layer of the entorhinal cortex and hippocampus. Synaptic-like staining was not observed with Syn-F1 and Syn-F2. Bar=50 µm, magnification 400x.

61
Laboratory 2: Pretreatment with proteinase K or autoclaving produced the best immunostaining results
revealing the dense meshwork of LNs and fine threads in DLB patients (Figure 9).
Fig. 9. Immunohistochemistry using mAbs Syn-Os and Syn-Fs with no pre-treatment or with three antigen retrieval methods (autoclave at 120 °C for 10 min in citrate buffer; 98 %formic acid for 15 min; 20 µg/ml of proteinase K for 5 min) in paraffin embedded tissue from entorhinal cortex of a DLB patient.

62
Parallel sectionswere cut in 6 µm- thick, deparaffinised, rehydrated followed epitope unmasking, all antibodies were diluted 1:5000 and incubated overnight at 4 °C. For detection, Histostain SP kit (Zymed, San Francisco, CA) was used with Romulin AEC chromogen (Biocare Medical,Walnut Creek, CA). All conditions identified the pathological neurites in the superficial layers but both autoclaving and proteinase K treatmentwere superior to identify the neuritic structures and also eliminated the diffuse staining of neuropil. Syn-F1 performed superior to Syn-F2whereas Syn-Os produced equal staining pattern. Scale bars=20 µm, magnification × 400.
Laboratory 3: Immunostaining of the anterior cingulate cortex in PD patients revealed that all six mAbs
labelled a large number of LBs predominantly in layer V neurons, sparse LNs and abundant synaptic-like
profiles, similar to the anti-phospho-S129 α-syn antibody (see Figure 10). In MSA, GCIs and a few LNs
were detected with all mAbs in the putamen of the case examined (Figure 10). LBs inclusion pathology
was not observed in these severely affected sections. The antibody against phospho-S129 α-syn identified
a similar number of GCIs, but did not show any synaptic α-syn immunoreactivity. Syn-F1 and Syn-F2
exhibited a staining pattern comparable to the pattern produced by the anti-phosphoS129 α-syn antibody.
Furthermore, similar to the anti-phospho-S129 α-syn, Syn-F1 and Syn-F2 demonstrated a weak
immunoreactivity for synaptic α-syn in all cases, including AD and controls (Figure 10). It is noteworthy
that synaptic α-syn immunoreactivity was prevalent with Syn-O1-4 mAbs, and particularly in AD cases
where neuronal loss was still minimal (Figure 10). In such cases there appeared to be an increase in both
neuronal density and synaptic material (Figure 10), potentially as tissue structures are initially affected by
the disease. Immunoreactivity was not observed in the white matter with any of the antibodies (see
Supplementary Figure S2).

63
Fig. 10. Immunostaining with mAbs Syn-Os, Syn-Fs, Syn-1 and anti-phospho S129, in the anterior
cingulate cortex from a case with PD, in the putamen from a case with MSA, in the anterior. or cingulate
cortex from a case with AD and in the anterior cingulate cortex from an aged, neurological control case.
All antibodies labelled LBs in PD, and glial cytoplasmic inclusions in MSA. When present, synaptic staining is most evident with Syn-Os. In AD where there is significant tissue shrinkage, there is an apparent increase in the density of both smaller neurons and synaptic immunoreactivity with the Syn-Os mAbs. Scale bar = 20 µm.
Laboratory 4: Double immunofluorescence staining with Syn-F2 or Syn-O4 and anti-Syn (MJFR1)
antibodies in the PD locus coeruleus revealed a high degree of colocalisation. Syn-F2 stained typical LBs
(Figure 11A1) and synaptic inclusions (Figure 11A2) in PD but not in a normal control (Figure 11A3). Syn-
O4 displayed immunoreactivity for LNs, (Figure 11A4), LBs (Figure 11A5) and small synaptic inclusions
(Figure 11A4 and 5) in PD but not in normal control (Figure 11A6).

64
Laboratory 5: LBs biochemically isolated from brain tissue were first identified by immunoreactivity for
the generic α-syn antibody, then scanned for the colocalization and staining patterns for each of our
conformation-specific antibody. All LBs, positive for generic sheep anti-α-syn antibody staining were also
positive for our mAbs. However, the staining using our mAbs was located in more peripheral regions of
LBs (Figure 11B). While the Syn-O1-O4 stained LBs with similar intensity to generic α-syn antibody
(Figure 11B), the Syn-F1 and Syn-F2 appeared weaker (Figure 11B).
Fig. 11. Confocal images of double-labeledα-syn-immunoreactive pathologies identified using conformation-specific mAbs and generic anti-α-syn antibodies.
(A) Representative confocal microscopic images of double immunofluorescent staining for Syn-F2, Syn-O4 (green) and the generic anti-α-syn antibody (MJFR1, red) antibodies in PD brain sections and normal control. Syn-F2 and Syn-O4 immunoreactivity for LBs and LNs co-localized to a high degree with MJFR1 signals in the PD brains sections. Syn-F2 stained typical LBs (1) and punctate inclusions (2) in the amygdala of the PD brain tissue but not in normal control (3). Syn-O4 displayed immunoreactivity for LNs (4), LBs (4) and small aggregates (5) in the locus ceruleus of the PD tissue but not in normal control (6). Scale bars=20 µm. (B) Colocalization of sheep anti-α-syn antibody (red) and the conformation-specificmAbs (green) in isolated LBs fromDLB brain tissue. All LBs that were positive for generic sheep anti-α-syn antibody staining were also positive for the conformation-specific mAbs. Syn-O1-O4 stained LBs with similar intensity to generic α-syn antibody (B, top 4 rows), while the Syn-F1 and Syn-F2 were weaker (B, bottom 2 rows). Scale bars= 10 µm.

65
Discussion
Several antibodies against α-syn have been developed since it was first detected as the major component of
LBs and GCIs [2, 28]. Indeed, the majority of α-syn antibodies have been developed against certain
fragments of α-syn [3, 44-47] or full length protein [48] and few raised against modified (i.e.in vitro
oxidized/nitrated α-syn) [49, 50], aggregated (under acidic or high salt conditions) [51, 52] or oligomerized
(induced by4-hydroxy-2-nonenal) α-syn [53] or purified LBs [4]. To enable the detection of
underestimated, or new pathological features, it is essential to develop α-syn antibodies, which recognize
specific α-syn conformations.
In order to generate mAbs that specifically target α-syn pathology, mice were immunized with in
vitro generated α-syn fibrils. Following the selection of the stable clones, determination of the antibody
isotype revealed that most of the hybridomas produced IgM antibodies rather than IgG. Similar findings
have been reported previously, indicating that the selection of conformation-specific monoclonal IgG-
producing hybridomas is difficult even by employing various immunization strategies [51, 52]. However,
14 hybridoma clones of IgG isotype were selected from 1100 clones that showed specificity towards α-syn
fibrils, six of which were selected for further characterization. The antibodies produced by these six clones
were designated Syn-F1, Syn-F2, Syn-O1, Syn-O2, Syn-O3 and Syn-O4 and characterized extensively. The
specificity of the generated mAbs was assessed by an inhibition ELISA and the results showed that the
mAbs were highly selective for α-syn fibrils. This finding was further confirmed by preabsorption of the
mAbs with either α-syn fibrils or monomer, proving their specificity for α-syn fibrils.
The affinity of the generated mAbs for the fibrils was determined by the IC50 values of the inhibition
ELISA. With the exception of the Syn-F2, which showed the lowest affinity for fibrils, the rest of the mAbs
exhibited IC50 values for the fibrils in pM range, whereas their corresponding IC50 values for α-syn
monomers were in the µM range. Interestingly, the IC50 values obtained for the six mAbs were much higher
compared to previously reported affinities of other mAbs directed for α-syn oligomers/ protofibrils [53].
The affinity of the generated antibodies was further confirmed by SPR analysis. Five of the generated mAbs
showed affinity for α-syn fibrils in pM range, with only Syn-F2 exhibiting affinity in the nM range. The
concentration of the fibrils was taken equivalent to the starting monomer concentration in the fresh sample.
This may not reflect the actual concentration of the fibrils per se which implies that the affinity of the mAbs
may be much higher to what we have observed. Moreover, the binding to the fibrils is most likely an avidity
effect and proper affinity assessment needs to be done using the Fab fragments.
The selectivity of the mAbs was further evaluated by assessing their cross-reactivity with
monomeric or fibrillar forms of β- or γ-syn, as well as other amyloidogenic proteins and peptides such as
Aβ, Tau40, IAPP or ABri. Surprisingly, none of the mAbs cross-reacted with the fibrils of β- or γ-syn, or
other amyloidogenic protein and peptides, further confirming that the raised mAbs are highly specific only

66
for α-syn fibrils. These findings are noteworthy considering that many mAbs against a particular
conformational epitope are less selective. It has been reported that polyclonal serum produced by
immunization of rabbits with molecular mimics of soluble oligomers of Aβ reacts equally with soluble
oligomers from other amyloid protein and peptides [54]. Moreover, antibodies raised against Aβ42 fibrils
recognize a generic amyloid epitope, as they react equally well with amyloid fibrils derived from other
proteins of unrelated sequence, such as transthyretin, IAPP, β-microglobulin, and polyglutamine [55].
The conformational specificity of our newly generated mAbs was further verified by pepscan using
a peptide library spanning the entire α-syn sequence. All antibodies exhibited a very weak reactivity for the
C-terminal peptide spanning the α-syn sequence between amino acids 127 and 140. This finding is in
agreement with the dot blotting results showing that none of the generated mAbs could detect the fibrils
formed by the C-terminally truncated α-syn (1-122) or the NAC fragments. In contrast, the control
antibodies FL-140 and 3B6, which also have epitope in the C-terminal region, showed almost equal affinity
to the peptide (127-140) and to α-syn fibrils. Taken together, these results show that the generated mAbs
do not recognize the linear peptides covering the α-syn sequence, and the C-terminus of α-syn may be a
part of the complex conformational epitope of α-syn amyloid fibrils. Our pepscan results revealed that the
C-terminal region of α-syn is more likely part of the conformational epitope for all our antibodies. However,
based on the observation that Syn-Fs prefer more of the mature amyloid fibrils of α-syn, and Syn-Os
recognize both early α-syn oligomers as well as late amyloid fibrils, these results suggest that the antibodies
are unlikely recognize exactly the same epitope sequences. Various modified forms of aggregated α-syn
have been identified in the LBs isolated from PD and DLB brain [56-58]. Interestingly, our mAbs also
recognized the aggregated forms of nitrated and phosphorylated α-syn (data not shown).
The specificity of the generated antibodies was further evaluated by assessing their ability to detect
α-syn aggregates generated in vitro at various time points. The aggregation of α-syn in vitro is a nucleation
dependent process, characterized by an initial lag phase, followed by a growth phase known as “elongation”
[59-61]. During the lag phase, there is accumulation of oligomers, which are considered more toxic than
fibrils [1, 17-19, 62], and in due course the oligomers convert to fibrils. Therefore, we investigated whether
the generated mAbs could show a differential binding specificity to early oligomers or late aggregates
formed during the in vitro aggregation of α-syn. The mAbs Syn-O1, -O2, -O3 and -O4 recognized both
early “oligomers” and late aggregates “amyloid fibrils”, whereas Syn-F1 and-F2 showed a preference for
the late aggregates.
To investigate whether the Syn-O’s could also detect the α-syn oligomers present in brain, we
employed Syn-O2 in a sandwich based ELISA to detect α-syn oligomers in human brain homogenates from
DLB, AD and control cases. The ELISA using Syn-O2 as a capturing antibody detected significantly higher
levels of α-syn oligomers in DLB samples compared to AD and control samples. These data are consistent
67
with our previous report demonstrating a significant increase in the levels of α-syn oligomers in the brain
of DLB compared to AD and controls [18].
The ability of the generated conformation-specific mAbs to detect α-syn pathology was further
explored by immunohistochemistry experiments using human PD, DLB, AD, MSA and control brain
sections. The mAbs labeled various histopathological features including LBs, LNs, synaptic pathology and
GCIs. Noteworthy, the Syn-Os were able to detect synaptic staining and LNs in the brain sections of PD
and DLB patients, whereas the Syn-Fs and commercially available generic antibodies (KM51 and Syn-1)
did not visualize these structures under the same conditions. In controls, no immunostaining was observed
in the substantia nigra with the Syn-Os and Syn-Fs, whereas synaptic staining was seen in the superficial
layers of the entorhinal cortex only with the Syn-Os. The synaptic staining with Syn-Os may suggest that
these antibodies recognize oligomeric species in normal brain which are not detected by Syn-Fs further
supporting the notion that the Syn-Fs recognize more specifically the late aggregates. The synaptic staining
observed is consistent with recent data showing multimeric complexes of α-syn are important
physiologically at synapses to attenuate synaptic vesicle recycling [63-66]. In PD, the mAbs labeled similar
structures in the brain sections to that observed with anti-phospho-S129 α-syn antibody, although a larger
proportion of large LBs were detected with the newly generated mAbs compared to the generic pan antibody
Syn-1. More inclusions were also identified with Syn-F2 and Syn-O4, than with Syn-F1. In MSA brain
sections, all antibodies labeled a comparable number of GCIs. A major advantage of the new conformation-
specific mAbs is that small micro-aggregates and very thin neurites in PD and DLB patients can be
recognized, which may contribute to a better understanding of the relevance of these small pathological
structures. Its noteworthy that the FILA-1 antibody, specific for aggregated α-syn was found to be specific
for the filamentous by more than 103-fold compared to the monomers but bound only poorly to isolated
LBs or DLB brain sections investigated by immunohistochemistry [67]. Comparison of antigen retrieval
methods showed that our mAbs stained pathological neurites in all conditions, allowing combinations with
other mAbs for colocalization studies. Autoclaving and proteinase K treatment improved the staining, as
previously described by others (Kovacs et al. 2012). Overall, our novel conformation-specific mAbs
distinguish pathological features in the elderly with high sensitivity and may serve as tools to characterize
α-syn pathology in more details in the brain and peripheral tissues.
Conformation-specific antibodies such as Syn-Fs, and Syn-Os may have numerous important
applications. They may prove invaluable in extending our knowledge on molecular pathogenesis of
synucleinopathies, allowing close monitoring of the formation of the pathogenic species during α-syn
aggregation in vitro and in vivo. Furthermore, antibodies such as Syn-Os maybe useful as diagnostic tools
to quantify α-syn oligomers in blood and/or CSF as biomarkers for synucleinopathies [62, 68]. Finally,
conformation-specific antibodies may also be useful as passive vaccines as anti-α-syn therapy. It has been

68
demonstrated that treatment of mice with monoclonal antibodies ameliorates the neuropathological and
behavioral deficits observed in transgenicα-syn mice [30, 69, 70].
In conclusion, we have generated and characterized six novel conformation-specific antibodies
with high affinity for α-syn aggregates. These antibodies recognize a widespread and distinct pattern of α-
syn related neuropathology including LBs, LNs, synaptic and GCIs. It is therefore likely that the antibodies
described herein can detect widespread α-syn pathology and possibly distinguish the various
neuropathological nuances that can be of certain diagnostic value. Such antibodies may also serve as
therapeutic agents in the form of vaccines in the field of passive immunotherapy, slowing or even reversing
α-syn aggregation.
Supplementary Figure 1. S1
Electron micrographs of samples collected at various time points as indicated during α-syn aggregation confirmed that the samples collected between 2-6 h contain only very small spherical oligomers and protofibrils, whereas, the samples at later time points contain mature amyloid fibrils.

69
Supplementary Figure 2. S2
Immunostaining with novel mAbs and control antibodies Syn-1 and phospho-S129 α-syn in the white matter underlying the anterior cingulate cortex from a case with Parkinson’s disease (A), in the posterior limb of the internal capsule from a case with multiple system atrophy (B), in the white matter underlying the anterior cingulate cortex from a case with Alzheimer’s disease (C) and in the white matter underlying the anterior cingulate cortex from an aged, neurological control case (D). Immunoreactivity was not observed in the white matter with any of the antibodies. Scale bar = 100 µm.

70
References
[1] K. E. Paleologou, G. B. Irvine, and O. M. El-‐Agnaf, "Alpha-‐synuclein aggregation in neurodegenerative diseases and its inhibition as a potential therapeutic strategy," Biochem Soc Trans, vol. 33, no. Pt 5, pp. 1106-‐10, Nov 2005.
[2] M. G. Spillantini, R. A. Crowther, R. Jakes, N. J. Cairns, P. L. Lantos, and M. Goedert, "Filamentous alpha-‐synuclein inclusions link multiple system atrophy with Parkinson's disease and dementia with Lewy bodies," Neurosci Lett, vol. 251, no. 3, pp. 205-‐8, Jul 31 1998.
[3] M. G. Spillantini, R. A. Crowther, R. Jakes, M. Hasegawa, and M. Goedert, "alpha-‐Synuclein in filamentous inclusions of Lewy bodies from Parkinson's disease and dementia with lewy bodies," Proc Natl Acad Sci U S A, vol. 95, no. 11, pp. 6469-‐73, May 26 1998.
[4] M. Baba et al., "Aggregation of alpha-‐synuclein in Lewy bodies of sporadic Parkinson's disease and dementia with Lewy bodies," Am J Pathol, Research Support, Non-‐U.S. Gov't
Research Support, U.S. Gov't, P.H.S. vol. 152, no. 4, pp. 879-‐84, Apr 1998. [5] M. H. Polymeropoulos et al., "Mutation in the alpha-‐synuclein gene identified in families
with Parkinson's disease," (in eng), Science, vol. 276, no. 5321, pp. 2045-‐7, Jun 27 1997. [6] R. Krüger et al., "Ala30Pro mutation in the gene encoding alpha-‐synuclein in Parkinson's
disease," (in eng), Nat Genet, vol. 18, no. 2, pp. 106-‐8, Feb 1998. [7] J. J. Zarranz et al., "The new mutation, E46K, of alpha-‐synuclein causes Parkinson and
Lewy body dementia," (in eng), Ann Neurol, vol. 55, no. 2, pp. 164-‐73, Feb 2004. [8] S. Appel-‐Cresswell et al., "Alpha-‐synuclein p.H50Q, a novel pathogenic mutation for
Parkinson's disease," (in eng), Mov Disord, vol. 28, no. 6, pp. 811-‐3, Jun 2013. [9] S. Lesage et al., "G51D α-‐synuclein mutation causes a novel parkinsonian-‐pyramidal
syndrome," (in eng), Ann Neurol, vol. 73, no. 4, pp. 459-‐71, Apr 2013. [10] M. C. Chartier-‐Harlin et al., "Alpha-‐synuclein locus duplication as a cause of familial
Parkinson's disease," (in eng), Lancet, vol. 364, no. 9440, pp. 1167-‐9, Sep 25-‐Oct 1 2004. [11] O. A. Ross et al., "Genomic investigation of alpha-‐synuclein multiplication and
parkinsonism," Ann Neurol, vol. 63, no. 6, pp. 743-‐50, Jun 2008. [12] B. Winner et al., "In vivo demonstration that alpha-‐synuclein oligomers are toxic," (in
eng), Proc Natl Acad Sci U S A, vol. 108, no. 10, pp. 4194-‐9, Mar 2011. [13] E. Rockenstein et al., "Accumulation of oligomer-‐prone alpha-‐synuclein exacerbates
synaptic and neuronal degeneration in vivo," Brain, vol. 137, no. Pt 5, pp. 1496-‐513, May 2014.
[14] P. J. Kahle et al., "Subcellular localization of wild-‐type and Parkinson's disease-‐associated mutant alpha -‐synuclein in human and transgenic mouse brain," J Neurosci, vol. 20, no. 17, pp. 6365-‐73, Sep 1 2000.
[15] E. Masliah et al., "Dopaminergic loss and inclusion body formation in alpha-‐synuclein mice: implications for neurodegenerative disorders," (in eng), Science, vol. 287, no. 5456, pp. 1265-‐9, Feb 2000.
[16] F. L. Martin, S. J. Williamson, K. E. Paleologou, D. Allsop, and O. M. El-‐Agnaf, "Alpha-‐synuclein and the pathogenesis of Parkinson's disease," Protein Pept Lett, vol. 11, no. 3, pp. 229-‐37, Jun 2004.

71
[17] T. Tokuda et al., "Detection of elevated levels of α-‐synuclein oligomers in CSF from patients with Parkinson disease," (in eng), Neurology, vol. 75, no. 20, pp. 1766-‐72, Nov 2010.
[18] K. E. Paleologou et al., "Detection of elevated levels of soluble alpha-‐synuclein oligomers in post-‐mortem brain extracts from patients with dementia with Lewy bodies," (in eng), Brain, vol. 132, no. Pt 4, pp. 1093-‐101, Apr 2009.
[19] O. M. El-‐Agnaf et al., "Detection of oligomeric forms of alpha-‐synuclein protein in human plasma as a potential biomarker for Parkinson's disease," (in eng), FASEB J, vol. 20, no. 3, pp. 419-‐25, Mar 2006.
[20] L. Parnetti et al., "Differential role of CSF alpha-‐synuclein species, tau, and Abeta42 in Parkinson's Disease," Front Aging Neurosci, vol. 6, p. 53, 2014.
[21] O. Hansson et al., "Levels of cerebrospinal fluid alpha-‐synuclein oligomers are increased in Parkinson's disease with dementia and dementia with Lewy bodies compared to Alzheimer's disease," Alzheimers Res Ther, vol. 6, no. 3, p. 25, 2014.
[22] R. Sharon, I. Bar-‐Joseph, M. P. Frosch, D. M. Walsh, J. A. Hamilton, and D. J. Selkoe, "The formation of highly soluble oligomers of alpha-‐synuclein is regulated by fatty acids and enhanced in Parkinson's disease," (in eng), Neuron, vol. 37, no. 4, pp. 583-‐95, Feb 2003.
[23] J. O. Aasly et al., "Elevated levels of cerebrospinal fluid alpha-‐synuclein oligomers in healthy asymptomatic LRRK2 mutation carriers," Front Aging Neurosci, vol. 6, p. 248, 2014.
[24] L. A. Volpicelli-‐Daley et al., "Exogenous alpha-‐synuclein fibrils induce Lewy body pathology leading to synaptic dysfunction and neuron death," Neuron, vol. 72, no. 1, pp. 57-‐71, Oct 6 2011.
[25] K. C. Luk et al., "Pathological alpha-‐synuclein transmission initiates Parkinson-‐like neurodegeneration in nontransgenic mice," Science, vol. 338, no. 6109, pp. 949-‐53, Nov 16 2012.
[26] K. C. Luk, V. M. Kehm, B. Zhang, P. O'Brien, J. Q. Trojanowski, and V. M. Lee, "Intracerebral inoculation of pathological alpha-‐synuclein initiates a rapidly progressive neurodegenerative alpha-‐synucleinopathy in mice," (in eng), J Exp Med, vol. 209, no. 5, pp. 975-‐86, May 7 2012.
[27] A. N. Sacino et al., "Intramuscular injection of alpha-‐synuclein induces CNS alpha-‐synuclein pathology and a rapid-‐onset motor phenotype in transgenic mice," Proc Natl Acad Sci U S A, vol. 111, no. 29, pp. 10732-‐7, Jul 22 2014.
[28] M. G. Spillantini, M. L. Schmidt, V. M. Lee, J. Q. Trojanowski, R. Jakes, and M. Goedert, "Alpha-‐synuclein in Lewy bodies," (in eng), Nature, vol. 388, no. 6645, pp. 839-‐40, Aug 1997.
[29] E. Croisier et al., "Comparative study of commercially available anti-‐alpha-‐synuclein antibodies," Neuropathol Appl Neurobiol, Comparative Study
Research Support, Non-‐U.S. Gov't vol. 32, no. 3, pp. 351-‐6, Jun 2006. [30] E. Masliah et al., "Passive immunization reduces behavioral and neuropathological
deficits in an alpha-‐synuclein transgenic model of Lewy body disease," PLoS One, Research Support, N.I.H., Extramural
Research Support, Non-‐U.S. Gov't vol. 6, no. 4, p. e19338, 2011.

72
[31] D. Games et al., "Reducing C-‐terminal-‐truncated alpha-‐synuclein by immunotherapy attenuates neurodegeneration and propagation in Parkinson's disease-‐like models," J Neurosci, vol. 34, no. 28, pp. 9441-‐54, Jul 9 2014.
[32] E. Masliah et al., "Effects of alpha-‐synuclein immunization in a mouse model of Parkinson's disease.," (in eng), Neuron, vol. 46, no. 6, pp. 857-‐68, Jun 2005.
[33] M. T. Ardah et al., "Structure activity relationship of phenolic acid inhibitors of alpha-‐synuclein fibril formation and toxicity," Front Aging Neurosci, vol. 6, p. 197, 2014.
[34] O. M. El-‐Agnaf et al., "Aggregates from mutant and wild-‐type alpha-‐synuclein proteins and NAC peptide induce apoptotic cell death in human neuroblastoma cells by formation of beta-‐sheet and amyloid-‐like filaments," (in eng), FEBS Lett, vol. 440, no. 1-‐2, pp. 71-‐5, Nov 1998.
[35] S. T. O'Dowd et al., "The ELISA-‐measured increase in cerebrospinal fluid tau that discriminates Alzheimer's disease from other neurodegenerative disorders is not attributable to differential recognition of tau assembly forms," J Alzheimers Dis, vol. 33, no. 4, pp. 923-‐8, 2013.
[36] O. M. El-‐Agnaf et al., "Effect of the disulfide bridge and the C-‐terminal extension on the oligomerization of the amyloid peptide ABri implicated in familial British dementia," (in eng), Biochemistry, vol. 40, no. 12, pp. 3449-‐57, Mar 2001.
[37] O. M. El-‐Agnaf, H. Goodwin, J. M. Sheridan, E. R. Frears, and B. M. Austen, B. M. Dunn, Ed. Improved solid-‐phase syntheses of amyloid proteins associated with neurodegenerative diseases, 1 ed. Bentham Science Publishers B. V, 2000, p. 8.
[38] M. T. Ardah et al., "Ginsenoside Rb1 inhibits fibrillation and toxicity of alpha-‐synuclein and disaggregates preformed fibrils," Neurobiol Dis, vol. 74, pp. 89-‐101, Feb 2015.
[39] W. P. Gai, H. X. Yuan, X. Q. Li, J. T. Power, P. C. Blumbergs, and P. H. Jensen, "In situ and in vitro study of colocalization and segregation of alpha-‐synuclein, ubiquitin, and lipids in Lewy bodies," Exp Neurol, vol. 166, no. 2, pp. 324-‐33, Dec 2000.
[40] W. P. Gai, J. H. Power, P. C. Blumbergs, J. G. Culvenor, and P. H. Jensen, "Alpha-‐synuclein immunoisolation of glial inclusions from multiple system atrophy brain tissue reveals multiprotein components," J Neurochem, vol. 73, no. 5, pp. 2093-‐100, Nov 1999.
[41] R. J. Perrin et al., "Epitope mapping and specificity of the anti-‐alpha-‐synuclein monoclonal antibody Syn-‐1 in mouse brain and cultured cell lines," (in eng), Neurosci Lett, vol. 349, no. 2, pp. 133-‐5, Oct 2003.
[42] D. M. Walsh, A. Lomakin, G. B. Benedek, M. M. Condron, and D. B. Teplow, "Amyloid beta-‐protein fibrillogenesis. Detection of a protofibrillar intermediate," J Biol Chem, vol. 272, no. 35, pp. 22364-‐72, Aug 29 1997.
[43] H. Zhang, A. Griggs, J. C. Rochet, and L. A. Stanciu, "In vitro study of alpha-‐synuclein protofibrils by cryo-‐EM suggests a Cu(2+)-‐dependent aggregation pathway," Biophys J, vol. 104, no. 12, pp. 2706-‐13, Jun 18 2013.
[44] D. W. Dickson et al., "Widespread alterations of alpha-‐synuclein in multiple system atrophy," (in eng), Am J Pathol, vol. 155, no. 4, pp. 1241-‐51, Oct 1999.
[45] J. G. Culvenor et al., "Non-‐Abeta component of Alzheimer's disease amyloid (NAC) revisited. NAC and alpha-‐synuclein are not associated with Abeta amyloid," (in eng), Am J Pathol, vol. 155, no. 4, pp. 1173-‐81, Oct 1999.

73
[46] B. I. Giasson et al., "A panel of epitope-‐specific antibodies detects protein domains distributed throughout human alpha-‐synuclein in Lewy bodies of Parkinson's disease," J Neurosci Res, Research Support, Non-‐U.S. Gov't
Research Support, U.S. Gov't, P.H.S. vol. 59, no. 4, pp. 528-‐33, Feb 15 2000. [47] R. Jakes, M. G. Spillantini, and M. Goedert, "Identification of two distinct synucleins
from human brain," FEBS Lett, vol. 345, no. 1, pp. 27-‐32, May 23 1994. [48] S. Yu et al., "Extensive nuclear localization of alpha-‐synuclein in normal rat brain
neurons revealed by a novel monoclonal antibody," (in eng), Neuroscience, vol. 145, no. 2, pp. 539-‐55, Mar 2007.
[49] J. E. Duda, B. I. Giasson, M. E. Mabon, V. M. Lee, and J. Q. Trojanowski, "Novel antibodies to synuclein show abundant striatal pathology in Lewy body diseases," Ann Neurol, Research Support, Non-‐U.S. Gov't
Research Support, U.S. Gov't, P.H.S. vol. 52, no. 2, pp. 205-‐10, Aug 2002. [50] E. A. Waxman, J. E. Duda, and B. I. Giasson, "Characterization of antibodies that
selectively detect alpha-‐synuclein in pathological inclusions," Acta Neuropathol, Research Support, N.I.H., Extramural vol. 116, no. 1, pp. 37-‐46, Jul 2008.
[51] A. L. Mougenot et al., "Production of a monoclonal antibody, against human alpha-‐synuclein, in a subpopulation of C57BL/6J mice, presenting a deletion of the alpha-‐synuclein locus," J Neurosci Methods, Research Support, Non-‐U.S. Gov't vol. 192, no. 2, pp. 268-‐76, Oct 15 2010.
[52] G. G. Kovacs et al., "An antibody with high reactivity for disease-‐associated α-‐synuclein reveals extensive brain pathology," (in eng), Acta Neuropathol, vol. 124, no. 1, pp. 37-‐50, Jul 2012.
[53] T. Fagerqvist et al., "Monoclonal antibodies selective for alpha-‐synuclein oligomers/protofibrils recognize brain pathology in Lewy body disorders and alpha-‐synuclein transgenic mice with the disease-‐causing A30P mutation," J Neurochem, Research Support, Non-‐U.S. Gov't vol. 126, no. 1, pp. 131-‐44, Jul 2013.
[54] R. Kayed et al., "Common structure of soluble amyloid oligomers implies common mechanism of pathogenesis," (in eng), Science, vol. 300, no. 5618, pp. 486-‐9, Apr 2003.
[55] B. O'Nuallain and R. Wetzel, "Conformational Abs recognizing a generic amyloid fibril epitope," Proc Natl Acad Sci U S A, vol. 99, no. 3, pp. 1485-‐90, Feb 5 2002.
[56] H. Fujiwara et al., "alpha-‐Synuclein is phosphorylated in synucleinopathy lesions," Nat Cell Biol, vol. 4, no. 2, pp. 160-‐4, Feb 2002.
[57] B. I. Giasson et al., "Oxidative damage linked to neurodegeneration by selective alpha-‐synuclein nitration in synucleinopathy lesions," Science, Research Support, Non-‐U.S. Gov't
Research Support, U.S. Gov't, P.H.S. vol. 290, no. 5493, pp. 985-‐9, Nov 3 2000. [58] J. P. Anderson et al., "Phosphorylation of Ser-‐129 is the dominant pathological
modification of alpha-‐synuclein in familial and sporadic Lewy body disease," J Biol Chem, vol. 281, no. 40, pp. 29739-‐52, Oct 6 2006.
[59] S. J. Wood, J. Wypych, S. Steavenson, J. C. Louis, M. Citron, and A. L. Biere, "alpha-‐synuclein fibrillogenesis is nucleation-‐dependent. Implications for the pathogenesis of Parkinson's disease," (in eng), J Biol Chem, vol. 274, no. 28, pp. 19509-‐12, Jul 1999.

74
[60] N. Cremades et al., "Direct observation of the interconversion of normal and toxic forms of α-‐synuclein," (in eng), Cell, vol. 149, no. 5, pp. 1048-‐59, May 2012.
[61] O. M. El-‐Agnaf, G. B. Irvine, and D. J. Guthrie, "Conformations of beta-‐amyloid in solution," J Neurochem, vol. 68, no. 1, pp. 437-‐9, Jan 1997.
[62] O. M. El-‐Agnaf, D. M. Walsh, and D. Allsop, "Soluble oligomers for the diagnosis of neurodegenerative diseases.," (in eng), Lancet Neurol, vol. 2, no. 8, pp. 461-‐2, Aug 2003.
[63] J. Burre, M. Sharma, and T. C. Sudhof, "alpha-‐Synuclein assembles into higher-‐order multimers upon membrane binding to promote SNARE complex formation," Proc Natl Acad Sci U S A, vol. 111, no. 40, pp. E4274-‐83, Oct 7 2014.
[64] L. Wang, U. Das, D. A. Scott, Y. Tang, P. J. McLean, and S. Roy, "alpha-‐synuclein multimers cluster synaptic vesicles and attenuate recycling," Curr Biol, vol. 24, no. 19, pp. 2319-‐26, Oct 6 2014.
[65] Y. Lai et al., "Nonaggregated alpha-‐synuclein influences SNARE-‐dependent vesicle docking via membrane binding," Biochemistry, vol. 53, no. 24, pp. 3889-‐96, Jun 24 2014.
[66] B. K. Choi et al., "Large alpha-‐synuclein oligomers inhibit neuronal SNARE-‐mediated vesicle docking," Proc Natl Acad Sci U S A, vol. 110, no. 10, pp. 4087-‐92, Mar 5 2013.
[67] E. Lindersson et al., "Proteasomal inhibition by alpha-‐synuclein filaments and oligomers," J Biol Chem, vol. 279, no. 13, pp. 12924-‐34, Mar 26 2004.
[68] L. Parnetti et al., "Cerebrospinal fluid biomarkers in Parkinson disease," Nat Rev Neurol, vol. 9, no. 3, pp. 131-‐40, Mar 2013.
[69] H. T. Tran et al., "α-‐Synuclein Immunotherapy Blocks Uptake and Templated Propagation of Misfolded α-‐Synuclein and Neurodegeneration," (in eng), Cell Rep, vol. 7, no. 6, pp. 2054-‐65, Jun 2014.
[70] E. J. Bae et al., "Antibody-‐Aided Clearance of Extracellular α-‐Synuclein Prevents Cell-‐to-‐Cell Aggregate Transmission," (in eng), J Neurosci, vol. 32, no. 39, pp. 13454-‐69, Sep 2012.

75
!!
CHAPTER 3
Oligomeric and Phosphorylated Alpha-Synuclein as Potential CSF Biomarkers for Parkinson’s Disease

76
CHAPTER 3 | OLIGOMERIC AND PHOSPHORYLATED ALPHA-SYNUCLEIN AS POTENTIAL CSF BIOMARKERS FOR PARKINSON’S DISEASE
Nour K. Majbour, MSc1,2, Nishant N. Vaikath, MSc1,3, Karin D. van Dijk, PhD2, Mustafa T. Ardah, PhD1, Shiji Varghese, MSc1, Louise B. Vesterager, PhD4, Liliana P. Montezinho, PhD4, Stephen Poole, PhD5, Bared Safieh-Garabedian, PhD6, Takahiko Tokuda, MD, PhD7, Charlotte E. Teunissen, MD, PhD8, HenkW. Berendse, MD, PhD9, Wilma D.J. van de Berg, PhD2 and Omar MA El-Agnaf, PhD 10
1Department of Biochemistry, College of Medicine and Health Sciences, United Arab Emirates University, Al Ain, United Arab Emirates
2Department of Anatomy and Neurosciences, Neuroscience Campus Amsterdam, VU University Medical Centre, Amsterdam, The Netherlands
3Neural Plasticity and Repair Unit, Department of Experimental Medical Sciences, Wallenberg Neuroscience Center, BMC A10, Lund University, Lund, Sweden 4Department of Neurodegeneration, H. Lundbeck A/S, 2500 Valby, Denmark 5Biotherapeutics Group, National Institute for Biological Standards and Control, Potters Bar, Herts, UK 6College of Medicine, Qatar University, Doha, Qatar 7Department of Neurology, Research Institute for Geriatrics, Kyoto Prefectural University of Medicine, Kyoto, 602-0841, Japan 8Neurochemistry Laboratory and Biobank, Department of Clinical Chemistry, Neuroscience Campus Amsterdam, VU University Medical Centre, Amsterdam, The Netherlands 9Department of Neurology, Neuroscience Campus Amsterdam, VU University Medical Centre, Amsterdam, The Netherlands 10Neurological Disorders Center, Qatar Biomedical Research Institute, and College of Science and Engineering, Hamad Bin Khalifa University (HBKU), Education City, Qatar Foundation, P.O. Box 5825 Doha, Qatar Mol Neurodegener. 2016 Jan 19;11:7. doi: 10.1186/s13024-016-0072-9.
77
Abstract
Background: Despite decades of intensive research, to date, there is no accepted diagnosis for Parkinson’s
disease (PD) based on biochemical analysis of blood or CSF. However, neurodegeneration in the brains of
PD patients begins several years before the manifestation of the clinical symptoms, pointing to serious
flaw/limitations in this approach.
Results: To explore the potential use of alpha-synuclein (α-syn) species as candidate biomarkers for PD,
we generated specific antibodies directed against wide array of α-syn species, namely total-, oligomeric-
and phosphorylated-Ser129-α-syn (t-, o- and p-S129-α-syn). Next we sought to employ our antibodies to
develop highly specific ELISA assays to quantify α-syn species in biological samples. Finally we verified
the usefulness of our assays in CSF samples from 46 PD patients and 48 age-matched healthy controls. We
also assessed the discriminating power of combining multiple CSF α-syn species with classical Alzheimer's
disease biomarkers. The combination of CSF o-/t-α-syn, p-S129-α-syn and p-tau provided the best fitting
predictive model for discriminating PD patients from controls. Moreover, CSF o-α-syn levels correlated
significantly with the severity of PD motor symptoms (r = -0.37), whereas CSF t-α-syn correlated inversely
with MMSE scores (r = -0.46).
Conclusion: Our new ELISA assays can serve as research tools to address the unmet need for reliable CSF
biomarkers for PD and related disorders.
Keywords: Parkinson’s disease, alpha synuclein, cerebrospinal fluid biomarkers, amyloid oligomers,
biomarkers
Background
Parkinson’s disease (PD) is the second most common neurodegenerative disorder after Alzheimer’s disease.
PD is characterized by a large time-gap between the beginning of the neurodegenerative processes and the
onset of clinical manifestations [1]. However, its diagnosis is primarily based on motor-related clinical
criteria. The natural history of the disease includes an initial asymptomatic stage followed by a long pre-
motor phase; finally, when the classical motor symptoms appear, a minimum of 30% of nigral dopaminergic
neurons have already degenerated [2-5]. Therefore, there is an urgent need for the discovery of reliable
biomarkers for PD diagnosis and prognosis. Toward this aim, recent intensive investigations have attempted
to identify biomarker(s) to enable an early diagnosis of PD, preferably during the pre-motor phase. And
since molecular changes in the brain can be reflected in the CSF proteome, this makes CSF an ideal source
of reliable biomarkers [6]. Aggregated and hyper-phosphorylated forms of alpha-synuclein (α-syn) protein
at S129 are the major components of Lewy bodies (LBs) and Lewy neurites and constitute the hallmark
pathology in the brains of patients with PD and dementia with Lewy bodies [7]. Although the accumulation

78
of α-syn is central to the development of synucleinopathies, the precise pathophysiological mechanism
remains uncertain [8]. Of the different species of α-syn, intermediate oligomers/protofibrils are thought to
be the major neurotoxic species [9, 10]. Therefore, developing therapeutic and diagnostic strategies that
target these species is of paramount importance. Several retrospective studies have explored CSF α-syn as
a putative biomarker for PD. A clear trend of lower CSF t-α-syn levels or marginally higher p-S129-α-
syn/t-α-syn ratio in PD have been reported, although a large overlap between PD and control groups was
noted [11-17]. Clearly, from previous studies it is evident that t-α-syn levels alone cannot discriminate
individual patients with synucleinopathies from healthy individuals or those with other neurodegenerative
diseases. Soluble α-syn oligomers (o-α-syn) have been increasingly linked to synaptic and neuronal
degeneration [18] . The exact mechanism by which α-syn oligomers cause neuronal cell death is not fully
elucidated. It has been shown that soluble o-α-syn is elevated in brain homogenates from PD and DLB
cases compared with controls [19, 20]. Interestingly, we have previously reported that CSF o-α-syn levels
were significantly higher in PD patients compared with other neurological disorders [14, 16]. CSF o-α-syn
levels and o-α-syn/t-α-syn ratios were found to be substantially higher in patients with PD, including those
with mild and early-stage disease, compared with controls [14, 16, 21-23].
Considering the findings presented above, it’s crucial to adopt precise strategies/methods capable to
specifically quantify α-syn neurotoxic species in biological samples. In this context, we demonstrated the
development of specific, sensitive and reliable ELISA assays using our antibodies to assess different species
of α-syn (t-, o- and p-S129-α-syn) in different biological samples. The provision of such reliable
immunoassays is not only valuable for the discovery of ideal CSF biomarkers but also for a better
understanding of the underlying pathophysiological process in PD and related disorders. Next, to explore
the potential of our novel assays, we employed them to quantify different species of α-syn in CSF from a
cohort of PD patients and age-matched healthy controls (HC). Finally, we investigated the usefulness of
combining several biomarkers that reflect different pathogenic pathways, including AD classical
biomarkers (total-tau (t-tau), phosphorylated-tau (p-tau) and amyloid-beta-42 (Aβ-42)), as candidate CSF
biomarkers for PD and related disorders.
Methods
Generation of anti-α-syn antibodies:
Generation and purification of our mouse monoclonal antibodies were performed as previously described
[24]. Briefly, the antigens, recombinant human α-syn protein, α-syn fibrils [25] or synthetic
phosphopeptide-S129 (CYEMPSEEGY (α-syn aa 125 to 133; [26, 27]) were used to generate 11D12, Syn-
O2 and PS129 mouse monoclonal antibodies respectively. The antigens were repeatedly used to immunize
female BALB/C mice subcutaneously. Mice with appropriate plasma titers were euthanized and splenocytes
were extracted and fused with Sp2/0 myeloma cells and then seeded in HAT (hypoxantin, aminopterine,

79
and thymidine) selective medium to generate antibody-producing hybridomas according to standard
techniques. After 10 days, the medium was replaced with hypoxantin, thymidine medium and 5 days later
the culture supernatants were tested for secreted anti-α-syn antibodies using indirect ELISA. Several
monoclonal antibodies were produced, purified and thoroughly characterized, among which Syn-O2
(IgG1), 11D12 (IgG2a) and PS129 (IgG2a) were selected for this study. The isotypes were determined
using an isotyping kit (Sigma-Aldrich, USA) and the antibody purification was done using Protein G-
agarose (Sigma-Aldrich, USA) affinity chromatography.
Syn-140 is a sheep polyclonal antibody raised against full-length human α-syn as previously described [28,
29]. In brief, a polyclonal antiserum was raised against α-syn in sheep by intramuscular injection into four
sites of 500 µg recombinant α-syn protein emulsified in Freund's complete adjuvant. Boosts of 200 µg in
Freund's incomplete adjuvant were given intramuscularly into four sites at intervals after the primary
injection of 1 month, 2 months and 6 months. The sheep were bled 8 days after the final boost.
Dot Blot
Monomeric and aggregated forms of recombinant α-, β- and γ-syn or tau proteins and synthetic peptides
Aβ-42 [9, 30]; Islet Amyloid Polypeptide (IAPP) [31] ; or ABri [26] were used for testing the specificity of
Syn-O2. Each protein/peptide was spotted (50 ng) onto a nitrocellulose membrane and allowed to dry at
RT for 1 h. The membranes were then incubated for 1 h at RT with 5% skimmed milk in PBST (PBS
containing 0.05% Tween-20) with gentle agitation. The blocking solution was then removed, and the
membranes were incubated for 2 h at RT with the primary antibodies: Syn-O2; mouse anti-α-syn (Syn-1,
BD Bioscience); mouse anti-β-syn (8; Santa Cruz Biotechnology); goat anti-γ-syn (C-20, Santa Cruz
Biotechnology); mouse anti-tau (5E2, Millipore); mouse anti-amyloid beta (82E1, IBL) or mouse anti-
amylin (R10/99, Santa Cruz Biotechnology). The membranes were then washed three times with PBST and
incubated with secondary antibodies, goat anti-mouse HRP (1:20 K, Jackson Immunoresearch, PA, USA);
goat anti-rabbit (1:20 K, Jackson Immunoresearch, PA, USA) or chicken anti-goat HRP ( 1:30 K, Santa
Cruz Biotechnology) as appropriate for 1 h at RT. The membranes were then washed three times with PBST
and developed using SuperSignal West Pico Chemiluminescent Substrate (Pierce).
Western Blotting
Samples of human-, mouse- and rat-brain lysates (15 µg), recombinant α-, β- and γ-syn or human and mouse
p-S129-α-syn (50 ng) were mixed with loading buffer (250 mM Tris-HCl, pH 6.8, 30% glycerol, 0.02%
bromophenol blue) and then separated on 15% SDS-PAGE gels. The separated proteins were transferred to
0.45 µm nitrocellulose membranes (WhatmanGmbh-Germany) at 100 V for 45 min. The membranes were
boiled for 5 min in PBS and then blocked for 1 h with 5% non-fat milk prepared in PBST prior to incubation
with 10 ml of primary antibody (50 ng/ml) for 2 h at RT. The membranes were then washed 4 times with
PBST followed by incubation with the secondary antibody. After one hour, the membranes were washed 4
80
times with PBST, and immunoreactive bands were visualized using the SuperSignal West Pico
Chemiluminescent Substrate Kit (Pierce) according to the manufacturer’s instructions.
Preparation of the standard for the oligomeric ELISA
Expression and purification of recombinant human α-syn was performed as previously described [25]. α-
Syn oligomers were prepared by incubating fresh α-syn (25 µM) with Ginsenoside Rb1 (100 µM) in PBS
at 37°C for 5 days with continuous shaking at 800 rpm in a Thermomixer (Eppendorf), then α-syn oligomers
were characterized using electron microscopy as previously described [32]. Briefly, size exclusion
chromatography was carried out using an AKTA FPLC system (GE Healthcare, Sweden) and a Superdex
200 column at 4 °C, in order to separate soluble α-syn oligomers from monomers. This way, we guaranteed
that only pure soluble α-syn oligomers were separated and then confirmed by electron microscopy (Figure
4A) [32].
Development of ELISA for measuring t-α-syn in human CSF
A 384-well ELISA microplate (Nunc MaxiSorb, NUNC) was coated by overnight incubation at 4°C with
0.1 µg/ml Syn-140 (sheep anti-α-syn polyclonal antibody) in 200 mM NaHCO3, pH 9.6 (50 µl/well). The
plate was then washed with PBST and incubated with 100 µl/well of blocking buffer (PBST containing
2.5% gelatin) for 2 hours at 37°C. After washing, 50 µl of the CSF samples (thawed on ice and Tween-20
was added to a final concentration of 0.05%) was added to each well, and plates were incubated at 37°C for
2.5 hours. 11D12 (mouse anti-α-syn monoclonal antibody), diluted in blocking buffer at 1:5 K was added
to the appropriate wells, and incubated at 37°C for 2 hours. Next, the plate was washed and incubated for
2 hours at 37°C with 50 µl/well of species-appropriate secondary antibody (donkey anti-mouse IgG HRP,
Jackson ImmunoResearch) diluted in blocking buffer (1:20 K). After washing, the plate was incubated with
50 µl/well of an enhanced chemiluminescent substrate (SuperSignal ELISA Femto, Pierce Biotechnology,
Rockford, IL). The chemiluminescence, expressed in relative light units, was immediately measured using
VICTOR™ X3 multilabel plate reader (PerkinElmer). The standard curve for the ELISA assay was carried
out using serial dilutions of recombinant human α-syn in artificial CSF.
Development of ELISA for measuring p-S129-α-syn in human CSF
A 384-well ELISA microplate (Nunc MaxiSorb, Nunc) was coated by overnight incubation at 4°C with 0.5
µg/ml Syn-140 (sheep anti-α-syn polyclonal antibody) in 200 mM NaHCO3, pH 9.6 (50 µl/well). The plate
was then washed with PBST and incubated with 100 µl/well of blocking buffer for 2 hours at 37°C. After
washing, 50 µl of the CSF samples (thawed on ice and Tween-20 was added to a final concentration of
0.05%) was added to each well, and plates were incubated at 37°C for 2.5 hours. PS129 (mouse anti-pS129-
α-syn monoclonal antibody) diluted in blocking buffer (1:1K) were added to the appropriate wells, and
incubated at 37°C for 2 hours. Next, the plate was washed and incubated for 2 hours at 37°C with 50 µl/well
of species-appropriate secondary antibody (donkey anti-mouse IgG HRP (Jackson ImmunoResearch))

81
diluted in blocking buffer (1:20 K). After washing, the plate was incubated with 50 µl/well of an enhanced
chemiluminescent substrate (SuperSignal ELISA Femto, Pierce Biotechnology, Rockford, IL). The
chemiluminescence, expressed in relative light units, was immediately measured using VICTOR™ X3
multilabel plate reader (PerkinElmer). The standard curve for the ELISA assay was obtained using serial
dilutions of recombinant human p-S129-α-syn in artificial CSF (50 µl/well).
Development of ELISA for measuring o-α-syn in human CSF
A 384-well ELISA microplate (Nunc MaxiSorb, Nunc) was coated by overnight incubation at 4°C with
Syn-O2 (0.2 µg/ml) in 200 mM NaHCO3, pH 9.6 (50 µl/well). The plate was then washed with PBST and
incubated with 100 µl/well of blocking buffer for 2 hours at 37°C. After washing, 50 µl of the CSF samples
(thawed on ice and Tween-20 was added to a final concentration of 0.05%) was added to each well, and
plates were incubated at 37°C for 2.5 hours. FL-140 (rabbit polyclonal antibody, Santa Cruz Biotechnology,
Santa Cruz, CA, USA), diluted in blocking buffer at 1:1K, was added to the appropriate wells, and incubated
at 37°C for 2 hours. Next, the plate was washed and incubated for 2 hours at 37°C with 50 µl/well of goat
anti-rabbit IgG HRP (Jackson ImmunoResearch) diluted in blocking buffer (1:15 K). After washing, the
plate was incubated with 50 µl/well of an enhanced chemiluminescent substrate (SuperSignal ELISA
Femto, Pierce Biotechnology, Rockford, IL). The chemiluminescence, expressed in relative light units, was
immediately measured using VICTOR™ X3 multilabel plate reader (PerkinElmer). The standard curve for
the ELISA assay was obtained using serial dilutions of recombinant human o-α-syn in artificial CSF (50
µl/well).
AD CSF biomarkers
Concentrations of t-tau, p-tau and Aβ42 in CSF were determined using the sandwich ELISAs Innotest β-
Amyloid (1–42), Innotest h TAU-Ag™ and Innotest Phosphotau (181P) ™; (Fujirebio Diagnostics),
respectively, as described previously [33].
Study population
A description of this cross-sectional cohort has been previously published [34]. We included 46 patients
with PD that attended the outpatient clinic for movement disorders at the VU University Medical Center
(VUMC) between September 2008 and February 2011, and 48 self-declared age-matched HC who were
recruited via an advertisement in the periodical of the Dutch Parkinson Foundation. All patients with PD
fulfilled the United Kingdom Parkinson’s Disease Society Brain Bank clinical diagnostic criteria [35].
Patients were included only if they were able to understand the study aim and procedures. Mini-Mental
State Examination and/ or neuropsychological assessment in the patients did not indicate dementia. In the
controls, dementia was excluded using the Cambridge Cognitive Examination scale [36]. Patients and
controls underwent a standardized clinical assessment that included their medical history and a neurological
examination. Severity of parkinsonism and disease stage in the ‘on’ state were rated using the Unified
82
Parkinson’s Disease Rating Scale-Part-III (UPDRS-III) [37] and the modified Hoehn and Yahr (H&Y)
classification [38], respectively. All the samples were screened in a blinded fashion and were tested
randomly. All the results were confirmed using at least two independent experiments. A series of internal
controls were also run to check for run-to-run variations. All CSF samples with > 500 erythrocytes/µl were
excluded from analysis as traces of blood may influence CSF α-syn levels [39].
Data Analysis
Statistical analyses were performed using using GraphPad Prism (version 5.0) software and IBM SPSS
software 21. Continuous variables were described using medians and interquartile ranges. Categorical
variables were presented as count or percentages. Mann-Whitney U-test was used for comparisons between
PD and HC diagnostic groups. Correlations were calculated using Spearman’s Rho(r). Subjects with PD
and HC were matched for age (p = 0·002), but not for gender since no significant differences between CSF
biomarkers in males and females were found in PD or HC groups (p = 0·85). The accuracy of the diagnostic
value of the biomarkers was assessed based on the area under the curve (AUC) of the receiver operating
characteristic (ROC) curve [40]. Cut-off values were calculated using sensitivity and specificity values that
maximized Youden’s index (sensitivity + specificity − 1). To determine the diagnostic value of a
combination of multiple biomarkers, we performed a binary logistic regression analysis. Combinations of
biomarkers were tested to find the best fitting model in a forward stepwise mode, which was based on the
change in likelihood resulting from including the variable. Change in -2 log-likelihood statistics between
the models was tested using Chi-square (χ2) tests. Sensitivity and specificity values of the combinations of
biomarkers for PD diagnosis and progression values were also calculated.
Results Development and characterization of our anti-α-syn antibodies
Our mouse monoclonal antibody, Syn-O2, specifically recognizes early “soluble oligomers” and late
aggregates “amyloid fibrils” of α-syn (Figure 1A,B), and has a high binding affinity for o-α-syn (IC50 120
pM and KD 9.6 x 10⁻¹¹ M) [24]. It exclusively bound to α-syn aggregates (amyloid fibrils and soluble
oligomers) without cross-reactivity with monomers or fibrils generated from other amyloid proteins
including β-syn, γ-syn, β-amyloid, tau, islet amyloid polypeptide (IAPP) or ABri (Figure 1A,B). In
immunohistochemical studies, Syn-O2 stained underappreciated small intra- and extracellular micro-
aggregates and very thin neurites in PD and DLB cases that were not observed with generic pan antibodies
(Syn-1 or KM51) that recognize linear epitope. Both classical Lewy neurites defined as elongated structures
within neuronal processes, and Lewy neurites in the form of beaded strings; swollen/bulging neurites and
long, thin threads were also stained by Syn-O2 (Figure 1C,D). The mAb,11D12, and a sheep polyclonal-
antibody, Syn-140, both recognized different forms/species of α-syn including monomeric-, oligomeric-,
protofibrillar-, nitrated- and phosphorylated-S129-α-syn, as well as full-length and N- or C-terminal

83
truncated forms of α-syn (Figure 1E-G). Finally, PS129, a mouse mAb was specific for p-S129-α-syn
(Figure 1H).
Development of new ELISA assays for measuring different species of α-syn
We developed, validated and optimized a new sandwich-type ELISA for measuring t-α-syn levels in human
We developed, validated and optimized a new sandwich-type ELISA for measuring t-α-syn levels in human
CSF. Assay conditions were first optimized using different concentrations of the capture antibody Syn-140
(sheep anti-α-syn polyclonal antibody). Based on its sensitivity and background signal, 0.1 µg/ml of the
capture antibody was selected for subsequent assays. The detection limit of the assay was as low as 50
pg/ml, which is 20-fold less than the concentration detected in human CSF (Figure 2A). The standard curve
for the ELISA assay was constructed using different concentrations of recombinant human α-syn in
solution. Serial dilutions of recombinant human β-syn and γ-syn were also included as negative controls
(Figure 2B). The inter-assay coefficient of variation (CV) examined over >10 plates was < 10% (Figure
2C). As illustrated in (Figure 2D), our assay permitted the direct quantification of native α-syn in biological
samples such as human CSF and Tg mouse-brain lysates. α-Syn was detected in Tg mice and human CSF,
whereas no signal was observed in WT or KO lysates (Figure 2D). Moreover, recovery rates were
determined by spiking recombinant α-syn into human CSF. Our assay consistently featured a mean recovery
rate > 90% (Figure 2E).
We followed a similar protocol for p-S129-α-syn-specific ELISA, where Syn-140 was used as the capture
antibody and PS129 was used as the reporter. To address the issue of specificity, serial dilutions of
recombinant human p-S129-α-syn and non-phosphorylated α-syn were tested, and signal was detected only
with the p-S129-α-syn (Figure 3A). Using similar criteria (sensitivity, reproducibility and background
signal), optimal conditions were adopted for the assay (Figure 3B). The limit of detection was as low as 20
pg/ml, and a standard curve with R2 of 0.999 was generated (Figure 3B), whereas, the inter-assay CV was
< 15% (Figure 3C). To explore the assay suitability for quantifying p-S129-α-syn in biological fluids,
multiple concentrations of recombinant human p-S129-α-syn were spiked into human CSF. The mean
recovery rates were between 95 and 97% (Figure 3D).
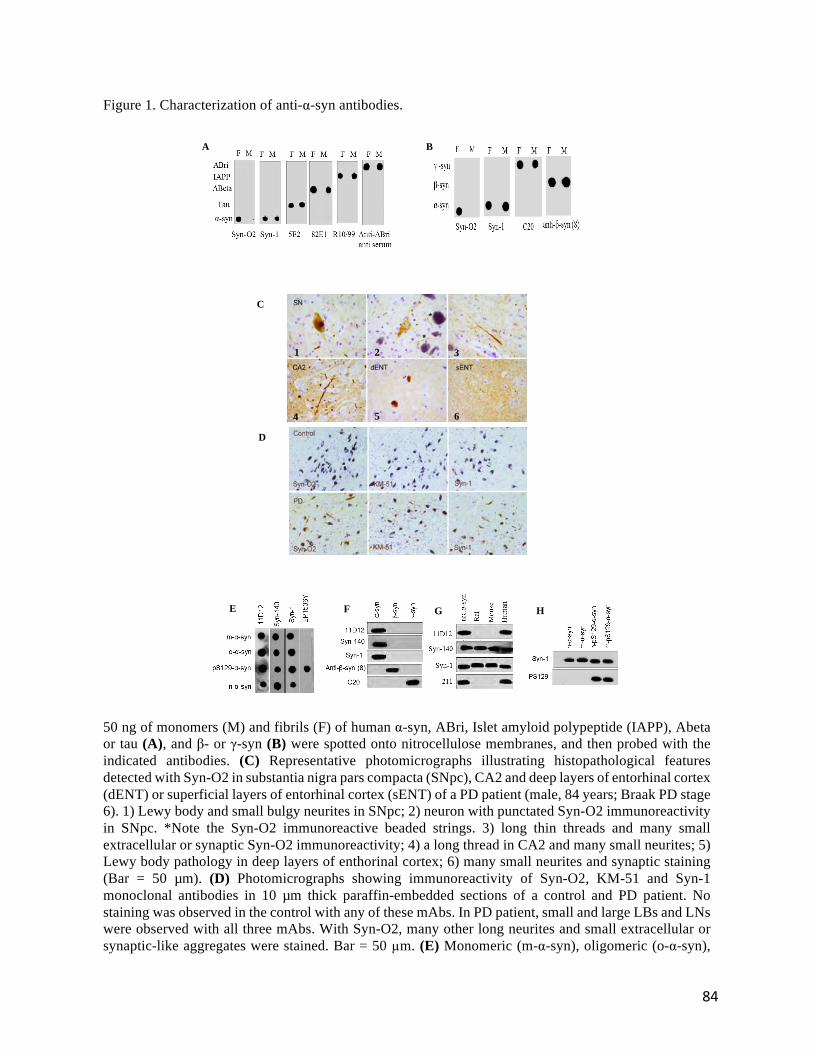
84
Figure 1. Characterization of anti-α-syn antibodies.
50 ng of monomers (M) and fibrils (F) of human α-syn, ABri, Islet amyloid polypeptide (IAPP), Abeta or tau (A), and β- or γ-syn (B) were spotted onto nitrocellulose membranes, and then probed with the indicated antibodies. (C) Representative photomicrographs illustrating histopathological features detected with Syn-O2 in substantia nigra pars compacta (SNpc), CA2 and deep layers of entorhinal cortex (dENT) or superficial layers of entorhinal cortex (sENT) of a PD patient (male, 84 years; Braak PD stage 6). 1) Lewy body and small bulgy neurites in SNpc; 2) neuron with punctated Syn-O2 immunoreactivity in SNpc. *Note the Syn-O2 immunoreactive beaded strings. 3) long thin threads and many small extracellular or synaptic Syn-O2 immunoreactivity; 4) a long thread in CA2 and many small neurites; 5) Lewy body pathology in deep layers of enthorinal cortex; 6) many small neurites and synaptic staining (Bar = 50 µm). (D) Photomicrographs showing immunoreactivity of Syn-O2, KM-51 and Syn-1 monoclonal antibodies in 10 µm thick paraffin-embedded sections of a control and PD patient. No staining was observed in the control with any of these mAbs. In PD patient, small and large LBs and LNs were observed with all three mAbs. With Syn-O2, many other long neurites and small extracellular or synaptic-like aggregates were stained. Bar = 50 µm. (E) Monomeric (m-α-syn), oligomeric (o-α-syn),
A B
D
C
1 2
4 5
3
6
FE G H
Figure 1

85
phosphorylated α-syn (p-Ser129-α-syn) and nitrated (n-α-syn) forms were used to test the cross-reactivity of our antibodies 11D12 and Syn-140· The generic commercial mAbs Syn-1 (BD Biosciences, 50ng/ml) for α-syn, and EP1536Y (Abcam) for p-Ser129-α-syn, were also included as controls. (F) 50 ng of recombinant α-, β- and γ-syn were loaded on SDS gels and transferred to nitrocellulose membranes for western blotting, and then probed with our antibodies or control antibodies as appropriate. Syn-1(BD Biosciences, 50ng/ml) for α-syn, anti-β-synuclein (8) (Santa Cruz Biotechnology, 1:2K) for β-syn and C-20 (Santa Cruz Biotechnology, 1:3K) for γ-syn. (G) 15 µg of human, mouse and rat brain lysates were used in western blotting to test the specificity of 11D12 and Syn-140· 50ng of recombinant human α-syn (rec.α-syn) was included as positive control. (H) 50 ng of recombinant human α-syn (H-α-syn) or mouse α-syn (M-α-syn), human phosphorylated α-syn (H-p-Ser129-α-syn) and mouse phosphorylated α-syn (M-p-S129-α-syn) were loaded on SDS gels and transferred to nitrocellulose membranes for western blotting, and the membranes were then probed with our mouse mAb (PS129) recognizes both human and mouse p-Ser129-α-syn or the generic commercial mAb Syn-1 as indicated.

86
Figure 2. Validation of ELISA specific for total α-syn.
(A) Histograms representing the optimization of the capture antibody (Syn-140) concentration. Based on the sensitivity and background signal (BG), 0.1 µg/ml of the capture antibody was selected for subsequent assays. (B) Standard curves displaying the specificities and sensitivities for α- (u), β- (n) and γ-syn (▲). (C) Data shown are representative of 3 independent experiments using serial dilutions of recombinant α-syn freshly prepared over 3 non-consecutive days. Measurements were taken in duplicate, and the results show the mean ± standard deviation for each point, and the inter-assay coefficient of variation (CV) was < 10%. (D) Antibody specificity determination using murine brain lysates and human
C
0
20000
40000
60000
80000
100000
120000
140000
5 2 1 0.5
RLU
/Sec
α-syn concentration (ng/ml)
Day 1 Day 2 Day 3 5 ng/ml CV : 2.1%2 ng/ml CV : 8.5%1 ng/ml CV : 9.5%0.5 ng/ml CV : 9.2%
B
y = -1711.2x2 + 31859x + 1533R² = 0.9993
0
20000
40000
60000
80000
100000
120000
140000
0 1 2 3 4 5 6
RLU
/Sec
protein concentration (ng/ml)
α-syn β-syn γ-syn
CSF 1 CSF 2 CSF 3
0.00
0.20
0.40
0.60
0.80
1.00
1.20
1.40
1.60
1.80
α-sy
n co
ncen
trat
ion
(ng/
ml)
unspiked + 0.5 + 0.2 + 0.05 unspiked + 0.5 + 0.2 + 0.05 unspiked + 0.5ng/ml
+ 0.2ng/ml
+ 0.05ng/ml
Average recovery rate94%
Average recovery rate92% Average recovery rate
94%
E
D
A

87
CSF; Tg, WT and KO brain lysates were diluted to 5µg/ml. Our assay permitted the direct quantification of native α-syn in biological samples such as human CSF and Tg mouse-brain lysates, whereas no signal was observed in WT or KO lysates. (E) Assessment of α-syn recovery rate in human CSF. The recovery rates were calculated from measured α-syn concentrations relative to spiked amounts, and the assay consistently featured a mean recovery rate > 90%.
As described above, we developed and optimized novel specific ELISA for measuring o-α-syn in human
CSF. Similarly, our oligomeric ELISA is based on a conventional sandwich ELISA system, where o-α-syn
is captured using our highly specific anti-o-α-syn mAb; Syn-O2. Multiple conditions were tested to assess
assay performance. Serial dilutions of recombinant human o-α-syn were run in duplicates. Based on optimal
sensitivity, specificity, reproducibility and background signal results, we selected a concentration of 0.2
µg/ml for coating (Figure 4B).
Our assay specificity towards o-α-syn was further validated as no signal was detected when serial dilutions
of α-syn monomers were included (Figure 4C). The intra-assay and inter-assay precision was < 10% (Figure
4D). To assess the specificity and sensitivity of our oligomeric-ELISA for o-α-syn in biological samples,
brain lysates and microdialysis fluid from young Tg mice that over-expressed human α-syn were used, and
WT and KO mice were also included. As anticipated, o-α-syn levels were significantly greater in Tg mice
compared with WT, whereas no signal was detected in KO mice (Figure 4E). In parallel, our assay
quantified the levels of o-α-syn in human CSF successfully (Figure 4E). Next, we spiked increasing
amounts of recombinant o-α-syn into human CSF samples. Interestingly, the average recovery rates were
> 95% (Figure 4F). We estimated that the lower limit of detection of recombinant o-α-syn using this ELISA
was as low as 10 pg/ml based on the initial concentration of the protein (5 ng/ml). Taken together, the
results show that our oligomeric-ELISA is specific, sensitive and reproducible, and it is thus suitable for
the quantification of o-α-syn in biological samples.

88
Figure 3. Validation of ELISA specific for p-S129-α-syn.
(A) Standard curves displaying the specificities and sensitivities for p-S129-α-syn (u) and non-phosphorylated α-syn (n). (B) Histograms representing the optimization of the capture antibody (Syn-140) concentration and the background signal (BG). (C) Examination of inter-assay variability. Measurements were taken in duplicate, and the results show the mean ± standard deviation for each point, and the inter-assay variability was found < 15%. (D) Assessment of α-syn recovery rate in human CSF. The recovery rates were calculated between 95 and 97% from measured α-syn concentrations relative to spiked amounts.
C
0
500000
1000000
1500000
2000000
2500000
5 2 1 0.5
RL
U/S
ec
p-S129-α-syn concentration (ng/ml)
Day 1 Day 2 Day 3 5 ng/ml CV : 10.7%2 ng/ml CV : 12.7%1 ng/ml CV : 14.2%0.5 ng/ml CV : 10.3%
D
CSF 1 CSF 2 CSF 3
0
100
200
300
400
500
600
700
800
p-S1
29-α
-syn
(pg/
ml)
unspiked + 0.5ng/ml
+ 0.2ng/ml
+ 0.05ng/ml
unspiked + 0.5ng/ml
+ 0.2ng/ml
+ 0.05ng/ml
unspiked + 0.5ng/ml
+ 0.2ng/ml
+ 0.05ng/ml
Average recovery rate95%
Average recovery rate97%Average recovery rate
95%
B
y = -32143x2 + 664616xR² = 0.9992
0
500000
1000000
1500000
2000000
2500000
3000000
0 1 2 3 4 5 6
RLU
/Sec
protein concentration (ng/ml)
p-S129-α-syn α-syn
A

89
Figure 4. Validation of ELISA specific for o-α-syn.
(A) Standard curves displaying the specificities and sensitivities for p-S129-α-syn (u) and non-phosphorylated α-syn (n). (B) Histograms representing the optimization of the capture antibody (Syn-140) concentration and the background signal (BG). (C) Examination of inter-assay variability. Measurements were taken in duplicate, and the results show the mean ± standard deviation for each point, and the inter-assay variability was found < 15%. (D) Assessment of α-syn recovery rate in human CSF. The recovery rates were calculated between 95 and 97% from measured α-syn concentrations relative to spiked amounts.
0
200000
400000
600000
800000
1000000
1200000
5 2 1 0.5 0.2 0.1 0.05 0.02 0.01
RLU/
Sec
o-α-syn (ng/ml)
Syn-O2 0.5 µg/ml Syn-O2 0.2 µg/ml Syn-O2 0.1 µg/ml
0
5000
10000
15000
20000
25000
30000
35000
40000
0.1 0.05 0.02 0.01
BA
E
0
100
200
300
400
500
600
700
800
900
1000
o-α-
syn
(pg/
ml)
KO WT Tg KO WT Tg CSF
Mouse brain lysates Mouse ECF Human
! !
! not- detectable
# 1 # 2 # 3 # 1 # 2 # 3 # 1 # 2 # 3 # 1 # 2 # 3 # 1 # 2 # 3 # 1 # 2 # 3 # 1 # 2 # 3
C
y = -2778.9x2 + 153091x + 1669.9R² = 0.9999
0
100000
200000
300000
400000
500000
600000
700000
800000
0 1 2 3 4 5 6
RLU/
Sec
protein concentration (ng/ml)
α-syn oligomers α-syn monomers
0
100000
200000
300000
400000
500000
600000
700000
800000
900000
1000000
5 2 1 0.5R
LU/S
eco-α-syn (ng/ml)
Day 1 Day 2 Day 3 5 ng/ml CV : 3.9%2 ng/ml CV : 4.9%1 ng/ml CV : 5.5%0.5 ng/ml CV : 7.4%
D
F

90
CSF biomarkers in diagnostic groups
We then measured the levels of different α-syn species in human CSF of an independent cross-sectional
cohort consisting of individuals diagnosed with PD (Table 1) and age-matched HC. Consistent with
previous reports [11, 14, 16, 22], CSF t-α-syn levels were significantly decreased in PD compared to HC
(p < 0.0001), whereas, o-α-syn levels were significantly higher in the PD group (p < 0.0001). CSF p-S129-
α-syn levels were elevated in PD compared to HC, with considerable overlap between the groups (p
<0.001). However, both p-S129-/t-α-syn and o-/t-α-syn ratios improved the discrimination of PD from HC
(p < 0.0001). CSF t-tau, p-tau and Aβ42 levels did not differ significantly between PD and HC groups
(Table 1).
Table 1. Demographics, clinical features and biomarkers. Median, interquartile ranges and p-values of
Mann-Whitney U test continuous variables, Count (percentage) for categorical ones.
HC (n=48) PD (n=46) p-‐values Female Male
32 (66.6%) 16 (33.3%)
18 (39%) 28 (61%)
0.85
Age 63 (57-‐67) 64 (57-‐71) 0.7969 Disease years -‐ 4 (2-‐8.3) -‐ H&Y Stage -‐ 2 (2-‐2.5) N.A UPDRS-‐ III -‐ 23 (15.3-‐27) N.A MMSE 29 (29-‐30) 29 (28-‐30) 0.0479 t-‐α-‐syn (ng/ml) 1.6 (1.3-‐2.2) 1.3 (1.2-‐1.6) <0.0001 p-‐S129-‐α-‐syn (pg/ml) 222 (180.5-‐275) 261 (206.8-‐296.3) <0.001 o-‐α-‐syn (pg/ml) 57 (36-‐106.5) 116 (76-‐170) <0.0001 p-‐S129/t-‐α-‐syn % 13.7 (9.2-‐18.5) 18.6 (15.7-‐23.3) <0.0001 o-‐/t-‐α-‐syn % 3.5 (2.3-‐6.2) 8.9 (5.2-‐12.2) <0.0001 t-‐tau (pg/ml) 229 (162-‐271.5) 190 (157.8-‐274.3) 0.1710 p-‐tau (pg/ml) 41.5 (29.3-‐50.3) 41.1 ± 16 0.5965 Aβ
42 (pg/ml) 995.5 (877.5-‐1153) 966.5 (794-‐1077) 0.6745

91
Figure 5. Scatter plots showing the correlation between t-α-syn and t-tau, p-tau and between o-α-syn and Hoehn and Yahr score (H&Y) scores.
The correlation between CSF t-α-syn with t-tau (r =0·46, p < 0·01) and p-tau (r = 0·53, p < 0·001) in the PD group (A-B). The correlation between CSF o-α-syn with H&Y scores (r = -0·37, p < 0·05) in the PD group (C). The dotted line is the 95% prediction interval for the calculated regression line (solid line).
r= 0.46p<0.01
A
r= -0.37p<0.05
C
r= 0.53p<0.001
B

92
Figure 6. Use of receiver operating curves (ROC) for the levels of α-syn species in CSF.
ROC curves based on logistic regression analyses for the classification of PD patients versus HC based on various predictors and combination of predictors.
1-Specificty
Sens
itivi
ty
AUC: 0.70Sens: 65 %Spec: 74 %
t-α-synA
1-SpecifictySe
nsiti
vity
AUC: 0.77Sens: 89 %Spec: 52 %
o-α-synB
1-Specificty
Sens
itivi
ty
AUC: 0.67Sens: 65 %Spec: 54 %
p-S129-α-synC
1-Specificty
Sens
itivi
ty
o-/t-α-syn %
AUC: 0.82Sens: 68 %Spec: 85 %
D
1-Specificty
Sens
itivi
ty
p-S129-/t-α-syn %
AUC: 0.76Sens: 80 %Spec: 56 %
E

93
Cross sectional correlation analysis of α-syn species in CSF
A positive correlation with t-α-syn was found for both t-tau and p-tau (rs = 0.47, rs= 0.53 respectively, p <
0.00, Figure 5A, B) in the PD group. In contrast, an inverse significant correlation was observed between
p-S129-syn levels and p-tau (rs = -0.30, p =0.043) within the PD group. The levels of CSF o-α-syn did not
correlate with any of AD biomarkers (Table 2). While CSF t-α-syn did not correlate with H&Y, UPDRS-
III or disease duration, an inverse correlation with MMSE scores was observed (rs = -0.46, p < 0.001) within
the PD group (Table 3). Similarly, CSF p-S129-α-syn did not correlate with disease severity. On the other
hand, a significant inverse correlation was noted between CSF o-α-syn and H&Y scores (rs = -0.37, p =
0.015, Figure 5C) within PD group, but not with UPDRS, disease duration or MMSE scores. As anticipated,
t-tau and p-tau positively correlated with age (p = 0.003, p < 0.0001, respectively) and negatively correlated
with MMSE scores in the PD group (rs= -0.35, p = 0.01, rs = -0.38, p = 0.009 respectively), whereas, Aβ42
didn’t correlate significantly with any of the clinical parameters.
Table 2. Spearman correlations between CSF biomarkers in PD.
t-‐α-‐syn p-‐α-‐syn o-‐α-‐syn t-‐Tau p-‐Tau Aβ42 t-‐α-‐syn 1·∙00 p-‐S129-‐α-‐syn 0·∙002 1·∙00
o-‐α-‐syn 0·∙21 -‐0·∙03 1·∙00 t-‐Tau 0·∙46** -‐0·∙19 0·∙06 1·∙00 p-‐Tau 0·∙53*** -‐0·∙30* 0·∙14 0·∙86** 1·∙00 Aβ42 0·∙09 -‐0·∙14 0·∙5284 0·∙31* -‐ 1·∙00
Logistic regression analysis
Binary logistic regression analysis revealed five CSF biomarkers as individual PD predictors: t-α-syn (p =
0.003), o-α-syn (p <0.0001), p-S129-α-syn (p < 0.0001), o-/t-α-syn ratio (p <0.0001) and p-S129/t-α-syn
ratio (p < 0.0001; Figure 6A-E). The combination of o-/t-α-syn, p-S129-α-syn and p-tau formed the best
fitting predictive model for discriminating PD patients from controls (Table 4). The sensitivity and
specificity of the combination of o-/t-α-syn ratio, p-S129-α-syn and p-tau was 79% and 67% (AUC= 0.86).
The performance of this predictive model was significantly better compared to o-/t-syn ratio, p-S129-syn
alone (See Table 4 for further details).

94
Table 3. Spearman correlations between CSF biomarkers, disease duration (years), UPDRS-III, Hoehn and Yahr stage and MMSE in PD.
Disease years UPDRS-III Hoehn and Yahr stage MMSE t-α-syn 0·06 0·12 0·18 -0·46** p-S129-α-syn 0·04 -0·16 -0·18 -0·05 o-α-syn -0·25 -0·19 -0·37* -0·01 p-S129/t-α-syn % -0·16 -0·22 0·002 0·39** o/t-α-syn % -0·25 -0·26 -0·31* 0·24
Table 4. Logistic regression analysis of CSF biomarkers between PD and HC
Predictor AUC Sensitivity Specificty p value t-α-syn 0·70 65 % 74 % 0·001 p-S129-α-syn 0·67 65 % 54 % < 0·0001 o-α-syn 0·77 89 % 52 % < 0·0001 p-S129/t-α-syn % 0·76 80% 56% < 0·0001 o-/t-α-syn % 0·82 68% 85% < 0·0001 o-/t-α-syn %, p-S129-α-syn & p-tau 0·86 79% 67% < 0·0001
Discussion The lack of reliable biomarkers is a major obstacle holding us back from accurately diagnosing PD or
monitoring its progression. Since the precise identification of toxic α-syn species is still unclear, we aimed
to generate antibodies capable to detect wide range of the different α-syn species including the pathogenic
species o-α-syn and p-S129-α-syn and then utilized these antibodies to develop total-, oligomeric- and p-
S129-ELISA systems capable to quantify specifically these species in different biological samples. Our
novel antibody, Syn-O2, can facilitate our ability to study o-α-syn and explore its toxic characteristics.
Moreover, Syn-O2 could provide insights into the possible strategies through which we can halt PD
progression or reverse o-α-syn toxicity. Applying different immunoassays, Syn-O2 was shown to be highly
selective for o-α-syn since it did not cross-react with aggregated forms of other amyloidogenic proteins
(tau, Abeta, IAPP and ABri) and it did not recognize the other synuclein proteins (β- or γ-syn). Moreover,
Syn-O2 clearly stained LBs and LNs only. Most interestingly, comparing Syn-O2 staining pattern with the
other commercial antibodies that are widely used in IHC (Syn-1, KM-51), Syn-O2 not only showed a lack
of cross-reactivity with synaptic α-syn, but also detected pathology not detectable by other pan antibodies
confirming its specificity toward α-syn pathology.
Both Syn-140 and 11D12 are specific for α-syn, and while Syn-140 recognizes α-syn from different species
(human, mouse and rat), 11D12 is specific only for human α-syn. Moreover, PS129 specifically recognizes
p-S129-α-syn and does not cross-react with non-phosphorylated α-syn. This diversity in the specifications/
characteristics of our antibodies imparts distinctive virtues to our ELISA assays. Therefore, our assays can

95
serve as powerful research tools to investigate the potential of α-syn species in different biological samples.
Furthermore, our new ELISA assays provide multiple improvements over other reported immunoassays.
First, our ELISA design using 384-well plates is perfectly compatible for accommodating multiple
replicates even with limited volume of the sample (50 µl/well). Second, the enhanced sensitivity shown by
our assays validates their suitability for the analysis of human CSF specimens. Our assays were shown to
be highly target specific based on several methods, including specificity validation of the employed
antibodies to their respective antigens, using brain and blood products from genetically modified mice (Tg,
WT, KO) and monitoring assay precisions. Our ELISAs are also robust since recovery rates from spike
experiments were > 90%.
Our group has previously described the development of an ELISA for quantifying o-α-syn in human CSF
using the same mouse mAb (211, mouse anti-α-syn antibody, Santa Cruz) for capture and the biotinylated
form of 211 for detection [14, 41]. However, heterophilic antibodies may interfere in this assay format
when using the same antibody for capturing and detection, leading to false-positive signals [42]. Our new
oligomeric-ELISA has addressed this shortcoming by using our novel mouse conformation-specific mAb
(Syn-O2), which selectively captures o-α-syn, and a rabbit polyclonal antibody (FL-140) for detection, thus
permitting the precise quantification of o-α-syn in biological samples. Furthermore, our new oligomeric-
ELISA system showed great sensitivity and specificity for measuring α-syn oligomers in biological samples
in comparison to our previous oligomeric-ELISA system.
Analyses of the cross sectional cohort revealed that while concentrations of t-α-syn decreased, o-α-syn
concentrations significantly increased in PD compared to HC, consistent with other studies [11, 12, 16, 34,
43, 44]. The reduction in CSF t-α-syn is likely due to α-syn oligomerisation and sequestration in LBs [11,
45], and we speculate that the elevated levels of o-α-syn results from a clearance failure of the aggregated
forms of α-syn. It’s worth mentioning, that in a recent study by Compta et al [44], the levels of o-α-syn
were determined using our previously published oligomeric-ELISA [14], where o-α-syn levels were found
to be elevated in PD patients consistent with our findings in this study. However, we attribute the differences
in the levels between both studies to the use of different quantification methods, pre-analytical confounding
factors (types of tubes, spinning conditions, storage conditions, etc.) and differences in disease severity
between the patients included in the studies. Furthermore, as emphasized above, we found our new
oligomeric-ELISA to be more reliable compared to the old generation oligomeric-ELISA in terms of
sensitivity, specificity and robustness.
PD patients with dementia were not enrolled in our cohort, as reflected in the overall high MMSE scores
registered. These high MMSE scores could explain the weakness of the correlation between MMSE scores
and t-α-syn levels and the lack of a correlation with Aβ42 levels. Interestingly, CSF o-α-syn levels showed
modest negative correlation with disease motor severity (H&Y grade). This inverse correlation, although

96
weak, suggests that o-α-syn increases at the early stage of the disease prior to the manifestation of the motor
symptoms. Interestingly, similar finding has been recently reported in sporadic PD patients and PD cases
with leucine-rich repeat kinase 2 mutations [23].
An increase in p-S129-α-syn levels was also observed in the PD group compared to HC. Although,
approximately 90% of accumulated α-syn in LBs consists of p-S129-α-syn [46], it is not known whether
phosphorylation of α-syn promotes or prevents the formation of toxic α-syn aggregates. To date there is
only one reported study, in which there was a weak positive correlation between CSF p-S129-α-syn/t-α-
syn ratio and disease severity [15], however we did not observe such relationship in our current study. These
discrepancies are likely due to several factors, including differences in the assay platform (Luminex versus
sandwich-ELISA), collection and handling of the CSF samples and/or heterogeneity of the patients included
in the studies.
Nevertheless, including both o-/t-α-syn and p-S129-/t-α-syn ratios improved the ability to discriminate
between PD and HC, this was further enhanced by including p-tau, emphasizing the usefulness of
combining several CSF biomarkers for diagnostic purposes.
Synucleinopathies and tauopathies show significant clinical overlap, making the early diagnosis of PD more
challenging. This overlap necessitates a combination of measurements of CSF α-syn species with key AD
biomarkers to improve diagnostic accuracy. Moreover, several in vitro and in vivo studies investigated
interactions among α-syn and tau proteins, showing that these proteins promote each other’s aggregation,
leading to neuronal degeneration and worsening cognitive impairment [47]. The positive correlation
between CSF t-α-syn and t-tau and p-tau in the PD group we observed, confirms and extends reports by
others showing a positive correlation between CSF t-α-syn and tau levels in PD, AD and controls [48] .
Conclusions
In summary, using our novel mAbs, we have developed sensitive and specific ELISAs to measure t-, o- and
p-S129-α-syn species in human CSF. Combining measurements of different α-syn species in CSF, we
observed marked differential CSF patterns between PD and controls. Our results validate the usefulness of
combining multiple CSF biomarkers in improving PD diagnostic accuracy and prognosis. Although the
potential use of our assays was confirmed in an independent cohort, we still need to validate the utilization
of our assays in large-scale, prospective, longitudinal and well-controlled studies such as the ongoing
Parkinson’s Progression Markers Initiative, and by inclusion of patients with other neurological illnesses.

97
References [1] J. Jankovic, "Parkinson's disease: clinical features and diagnosis," (in eng), J Neurol Neurosurg Psychiatry, vol. 79, no. 4, pp. 368-76, Apr 2008. [2] A. DelleDonne et al., "Incidental Lewy body disease and preclinical Parkinson disease," (in eng), Arch Neurol, vol. 65, no. 8, pp. 1074-80, Aug 2008. [3] J. M. Milber et al., "Lewy pathology is not the first sign of degeneration in vulnerable neurons in Parkinson disease," (in eng), Neurology, vol. 79, no. 24, pp. 2307-14, Dec 11 2012. [4] E. Tolosa, C. Gaig, J. Santamaría, and Y. Compta, "Diagnosis and the premotor phase of Parkinson disease," (in eng), Neurology, vol. 72, no. 7 Suppl, pp. S12-20, Feb 2009. [5] A. A. Dijkstra et al., "Stage-dependent nigral neuronal loss in incidental Lewy body and Parkinson's disease," (in eng), Mov Disord, vol. 29, no. 10, pp. 1244-51, Sep 2014. [6] A. Anoop, P. K. Singh, R. S. Jacob, and S. K. Maji, "CSF Biomarkers for Alzheimer's Disease Diagnosis," (in eng), Int J Alzheimers Dis, vol. 2010, 2010. [7] M. G. Spillantini, M. L. Schmidt, V. M. Lee, J. Q. Trojanowski, R. Jakes, and M. Goedert, "Alpha-synuclein in Lewy bodies," (in eng), Nature, vol. 388, no. 6645, pp. 839-40, Aug 28 1997. [8] K. E. Paleologou, G. B. Irvine, and O. M. El-Agnaf, "Alpha-synuclein aggregation in neurodegenerative diseases and its inhibition as a potential therapeutic strategy," (in eng), Biochem Soc Trans, vol. 33, no. Pt 5, pp. 1106-10, Nov 2005. [9] O. M. el-Agnaf, G. B. Irvine, and D. J. Guthrie, "Conformations of beta-amyloid in solution," (in eng), J Neurochem, vol. 68, no. 1, pp. 437-9, Jan 1997. [10] O. M. El-Agnaf, D. M. Walsh, and D. Allsop, "Soluble oligomers for the diagnosis of neurodegenerative diseases," (in eng), Lancet Neurol, vol. 2, no. 8, pp. 461-2, Aug 2003. [11] T. Tokuda et al., "Decreased alpha-synuclein in cerebrospinal fluid of aged individuals and subjects with Parkinson's disease," (in eng), Biochem Biophys Res Commun, vol. 349, no. 1, pp. 162-6, Oct 2006. [12] B. Mollenhauer, J. J. Locascio, W. Schulz-Schaeffer, F. Sixel-Döring, C. Trenkwalder, and M. G. Schlossmacher, "α-Synuclein and tau concentrations in cerebrospinal fluid of patients presenting with parkinsonism: a cohort study," (in eng), Lancet Neurol, vol. 10, no. 3, pp. 230-40, Mar 2011. [13] L. Parnetti et al., "Cerebrospinal fluid Tau/α-synuclein ratio in Parkinson's disease and degenerative dementias," (in eng), Mov Disord, vol. 26, no. 8, pp. 1428-35, Jul 2011. [14] T. Tokuda et al., "Detection of elevated levels of α-synuclein oligomers in CSF from patients with Parkinson disease," (in eng), Neurology, vol. 75, no. 20, pp. 1766-72, Nov 2010. [15] Y. Wang et al., "Phosphorylated α-synuclein in Parkinson's disease," (in eng), Sci Transl Med, vol. 4, no. 121, p. 121ra20, Feb 2012. [16] L. Parnetti et al., "Differential role of CSF alpha-synuclein species, tau, and Aβ42 in Parkinson's Disease," (in eng), Front Aging Neurosci, vol. 6, p. 53, 2014. [17] K. D. van Dijk, M. Bidinosti, A. Weiss, P. Raijmakers, H. W. Berendse, and W. D. van

98
de Berg, "Reduced alpha-synuclein levels in cerebrospinal fluid in Parkinson's disease are unrelated to clinical and imaging measures of disease severity," (in eng), Eur J Neurol, vol. 21, no. 3, pp. 388-94, Mar 2014. [18] E. Rockenstein et al., "Accumulation of oligomer-prone α-synuclein exacerbates synaptic and neuronal degeneration in vivo," (in eng), Brain, vol. 137, no. Pt 5, pp. 1496-513, May 2014. [19] K. E. Paleologou et al., "Detection of elevated levels of soluble alpha-synuclein oligomers in post-mortem brain extracts from patients with dementia with Lewy bodies," (in eng), Brain, vol. 132, no. Pt 4, pp. 1093-101, Apr 2009. [20] R. Sharon, I. Bar-Joseph, M. P. Frosch, D. M. Walsh, J. A. Hamilton, and D. J. Selkoe, "The formation of highly soluble oligomers of alpha-synuclein is regulated by fatty acids and enhanced in Parkinson's disease," (in eng), Neuron, vol. 37, no. 4, pp. 583-95, Feb 2003. [21] O. Hansson et al., "Levels of cerebrospinal fluid α-synuclein oligomers are increased in Parkinson's disease with dementia and dementia with Lewy bodies compared to Alzheimer's disease," (in eng), Alzheimers Res Ther, vol. 6, no. 3, p. 25, 2014. [22] L. Parnetti et al., "Cerebrospinal fluid lysosomal enzymes and alpha-synuclein in Parkinson's disease," (in eng), Mov Disord, vol. 29, no. 8, pp. 1019-27, Jul 2014. [23] J. O. Aasly et al., "Elevated levels of cerebrospinal fluid α-synuclein oligomers in healthy asymptomatic LRRK2 mutation carriers," (in eng), Front Aging Neurosci, vol. 6, p. 248, 2014. [24] N. N. Vaikath et al., "Generation and characterization of novel conformation-specific monoclonal antibodies for α-synuclein pathology," (in eng), Neurobiol Dis, vol. 79, pp. 81-99, Jul 2015. [25] M. T. Ardah et al., "Structure activity relationship of phenolic acid inhibitors of α-synuclein fibril formation and toxicity," (in eng), Front Aging Neurosci, vol. 6, p. 197, 2014. [26] O. M. El-Agnaf et al., "Effect of the disulfide bridge and the C-terminal extension on the oligomerization of the amyloid peptide ABri implicated in familial British dementia," (in eng), Biochemistry, vol. 40, no. 12, pp. 3449-57, Mar 2001. [27] A. M. Bodles, O. M. El-Agnaf, B. Greer, D. J. Guthrie, and G. B. Irvine, "Inhibition of fibril formation and toxicity of a fragment of alpha-synuclein by an N-methylated peptide analogue," (in eng), Neurosci Lett, vol. 359, no. 1-2, pp. 89-93, Apr 2004. [28] S. Poole, A. F. Bristow, S. Selkirk, and B. Rafferty, "Development and application of radioimmunoassays for interleukin-1 alpha and interleukin-1 beta," (in eng), J Immunol Methods, vol. 116, no. 2, pp. 259-64, Jan 1989. [29] Y. S. Taktak et al., "Assay of pyrogens by interleukin-6 release from monocytic cell lines," (in eng), J Pharm Pharmacol, vol. 43, no. 8, pp. 578-82, Aug 1991. [30] J. H. Lu et al., "Baicalein inhibits formation of α-synuclein oligomers within living cells and prevents Aβ peptide fibrillation and oligomerisation," (in eng), Chembiochem, vol. 12, no. 4, pp. 615-24, Mar 2011. [31] A. Masad et al., "Copper-mediated formation of hydrogen peroxide from the amylin peptide: a novel mechanism for degeneration of islet cells in type-2 diabetes mellitus?," (in eng), FEBS Lett, vol. 581, no. 18, pp. 3489-93, Jul 2007.
99
[32] M. T. Ardah et al., "Ginsenoside Rb1 inhibits fibrillation and toxicity of alpha-synuclein and disaggregates preformed fibrils," (in eng), Neurobiol Dis, vol. 74, pp. 89-101, Feb 2015. [33] C. Mulder et al., "Amyloid-beta(1-42), total tau, and phosphorylated tau as cerebrospinal fluid biomarkers for the diagnosis of Alzheimer disease," (in eng), Clin Chem, vol. 56, no. 2, pp. 248-53, Feb 2010. [34] K. D. van Dijk, M. Bidinosti, A. Weiss, P. Raijmakers, H. W. Berendse, and W. D. van de Berg, "Reduced α-synuclein levels in cerebrospinal fluid in Parkinson's disease are unrelated to clinical and imaging measures of disease severity," (in eng), Eur J Neurol, vol. 21, no. 3, pp. 388-94, Mar 2014. [35] A. J. Hughes, S. E. Daniel, L. Kilford, and A. J. Lees, "Accuracy of clinical diagnosis of idiopathic Parkinson's disease: a clinico-pathological study of 100 cases," (in eng), J Neurol Neurosurg Psychiatry, vol. 55, no. 3, pp. 181-4, Mar 1992. [36] M. Roth et al., "CAMDEX. A standardised instrument for the diagnosis of mental disorder in the elderly with special reference to the early detection of dementia," (in eng), Br J Psychiatry, vol. 149, pp. 698-709, Dec 1986. [37] Fahn, "Unified Parkinson’s disease rating scale. In: Fahn S, Marsden C, Calne D, eds. Recent Development in Parkinson’s Disease. ," vol. 2, R. Elton, Ed., ed. MacMillan Health Care Information, 1987. [38] J. Jankovic et al., "Variable expression of Parkinson's disease: a base-line analysis of the DATATOP cohort. The Parkinson Study Group," (in eng), Neurology, vol. 40, no. 10, pp. 1529-34, Oct 1990. [39] R. Barbour et al., "Red blood cells are the major source of alpha-synuclein in blood," (in eng), Neurodegener Dis, vol. 5, no. 2, pp. 55-9, 2008. [40] K. Hajian-Tilaki, "Receiver Operating Characteristic (ROC) Curve Analysis for Medical Diagnostic Test Evaluation," (in ENG), Caspian J Intern Med, vol. 4, no. 2, pp. 627-635, 2013. [41] O. M. El-Agnaf et al., "Detection of oligomeric forms of alpha-synuclein protein in human plasma as a potential biomarker for Parkinson's disease," (in eng), FASEB J, vol. 20, no. 3, pp. 419-25, Mar 2006. [42] D. Sehlin et al., "Interference from heterophilic antibodies in amyloid-β oligomer ELISAs," (in eng), J Alzheimers Dis, vol. 21, no. 4, pp. 1295-301, 2010. [43] M. J. Park, S. M. Cheon, H. R. Bae, S. H. Kim, and J. W. Kim, "Elevated levels of α-synuclein oligomer in the cerebrospinal fluid of drug-naïve patients with Parkinson's disease," (in eng), J Clin Neurol, vol. 7, no. 4, pp. 215-22, Dec 2011. [44] Y. Compta et al., "Correlates of cerebrospinal fluid levels of oligomeric- and total-α-synuclein in premotor, motor and dementia stages of Parkinson's disease," (in eng), J Neurol, vol. 262, no. 2, pp. 294-306, Feb 2015. [45] T. Stewart et al., "Cerebrospinal Fluid α-Synuclein Predicts Cognitive Decline in Parkinson Disease Progression in the DATATOP Cohort," (in eng), Am J Pathol, vol. 184, no. 4, pp. 966-75, Apr 2014. [46] J. P. Anderson et al., "Phosphorylation of Ser-129 is the dominant pathological

100
modification of alpha-synuclein in familial and sporadic Lewy body disease," (in eng), J Biol Chem, vol. 281, no. 40, pp. 29739-52, Oct 2006. [47] S. Moussaud, D. R. Jones, E. L. Moussaud-Lamodière, M. Delenclos, O. A. Ross, and P. J. McLean, "Alpha-synuclein and tau: teammates in neurodegeneration?," (in eng), Mol Neurodegener, vol. 9, p. 43, 2014. [48] S. Slaets et al., "Increased CSF α-synuclein levels in Alzheimer's disease: correlation with tau levels," (in eng), Alzheimers Dement, vol. 10, no. 5 Suppl, pp. S290-8, Oct 2014.

101
!!
CHAPTER 4
Longitudinal Changes in CSF Alpha-Synuclein Species Reflect Parkinson’s Disease Progression

102
CHAPTER 4 | LONGITUDINAL CHANGES IN CSF ALPHA-SYNUCLEIN SPECIES REFLECT PARKINSON’S DISEASE PROGRESSION Nour K. Majbour, MSc1, 2, Nishant N. Vaikath, MSc1, 3, Paolo Eusebi, PhD4, Davide Chiasserini, PhD4, Mustafa Ardah, PhD5, Shiji Varghese, MSc5, Takahiko Tokuda, M.D, PhD5, Peggy Auinger, MSc6, Paolo Calabresi, M.D, PhD4, 7, Lucilla Parnetti, M.D, PhD4, and Omar M.A El-Agnaf, PhD1,9 1Neurological Disorders Research Center, Qatar Biomedical Research Institute (QBRI), Hamad Bin Khalifa University (HBKU), Qatar Foundation, PO Box 5825, Doha, Qatar. 2Department of Anatomy and Neurosciences, Neuroscience Campus Amsterdam, VU University Medical Centre, Amsterdam, The Netherlands. 3Neural Plasticity and Repair Unit, Department of Experimental Medical Sciences, Wallenberg Neuroscience Center, BMC A10, Lund University, Lund, Sweden 4Dipartimento di Medicina, Sezione di Neurologia, Università degli Studi di Perugia, Perugia, Italy 5Department of Biochemistry, College of Medicine and Health Sciences, United Arab Emirates University, Al Ain, United Arab Emirates. 6Department of Neurology, Research Institute for Geriatrics, Kyoto Prefectural University of Medicine, Kyoto, 602-0841, Japan 7Department of Neurology, Center for Human Experimental Therapeutics, University of Rochester School of Medicine and Dentistry, Rochester, NY, USA 8IRCCS - S. Lucia Foundation, Rome, Italy 9Life Sciences Division, College of Science and Engineering, Hamad Bin Khalifa University (HBKU), Education City, Qatar Foundation, PO Box 5825, Doha, Qatar. [email protected]. Mov Disord. 2016 Oct;31(10):1535-1542. doi: 10.1002/mds.26754.

103
ABSTRACT
Background: Parkinson’s disease (PD) diagnosis is mainly based on clinical criteria with high risk of
misdiagnosis. Identification of reliable biomarkers for disease diagnosis and progression has a key role for
developing disease-modifying therapies. Here we investigate the longitudinal changes of CSF α-synuclein
(α-syn) species in early PD patients, and explore the potential use of these species as surrogate biomarkers
for PD progression.
Methods: We used our newly developed ELISA systems for measuring different forms of α-syn, such as
oligomeric-α-syn (o-α-syn), phosphorylated-α-syn at serine 129 (p-S129-α-syn) or total-α-syn (t-α-syn) in
CSF from longitudinal DATATOP cohort (n = 121). CSF Alzheimer’s disease biomarkers (total-tau,
phosphorylated-tau, Aβ-40 and Aβ-42) were also measured for this cohort.
Results: Interestingly, t- and o-α-syn levels significantly increased over the two-year DATATOP follow-
up period, whereas p-S129-α-syn levels showed a longitudinal decrease. We have also noted a significant
association between o-/t-α-syn ratio and UPDRS motor change (r=-0.22, p<0.05) in all patients, which was
found to be stronger in postural instability and gait difficulty dominant PD group (r=-0.41, p<0.01), while
it was not significant in the tremor dominant subtype (r=-0.05, p=0.782). A strong positive correlation
between the changes in CSF t-α-syn and o-α-syn over the two-year DATATOP study was also noted (r =
0.8).
Conclusion: Together, our data show that CSF α-syn species have a dynamic pattern along the course of
the disease, suggesting their possible role as progression biomarkers for PD. Moreover, our findings seem
to suggest that the PD clinical phenotypes could be characterized by different CSF patterns.
Keywords: Parkinson’s disease; alpha-synuclein; oligomers; biomarkers; DATATOP.
INTRODUCTION
Parkinson’s disease (PD) is characterized by a long preclinical phase between the onset of the
neurodegeneration and the first appearance of motor manifestations [1]. Reliable biomarkers are urgently
needed to aid earlier disease diagnosis and prognosis, especially during the premotor stage. Aggregated and
hyper-phosphorylated forms of alpha-synuclein (α-syn) are the major components of Lewy bodies (LBs)
the hallmark pathology of PD [2]. Although abnormal aggregation of α-syn plays a critical role in PD
pathogenesis, the exact pathogenic α-syn species remain undefined[3]. Several studies have demonstrated
that amyloid oligomers, but not mature amyloid fibrils, are the neurotoxic species [4, 5]. Therefore, several
studies have explored CSF α-syn as a putative biomarker for PD. Trends for lower levels of CSF total-α-
syn (t-α-syn), higher α-syn oligomers (o-α-syn) levels and/or a marginally higher p-S129-α-syn/t-α-syn
ratio in PD have been reported, with a large overlap between PD patients and controls [6-12].
To fully explore the potential use of CSF α-syn species as biomarkers for the diagnosis and prognosis of
PD, robust methods are needed to accurately quantify specific forms of α-syn in biological fluids, and large-

104
scale longitudinal studies are also needed. To address this need, recently we developed robust and specific
ELISAs to assess different species of α-syn (t-, o- or p-S129-α-syn) in biological fluids[12, 13]. In this
study we used our new ELISAs to explore the potential use of CSF α-syn species as progression biomarkers
in 121 early PD patients from the longitudinal DATATOP (deprenyl and tocopherol antioxidative therapy
for Parkinsonism) study, who underwent repeated CSF sampling over a two-year period.
MATERIALS AND METHODS
The standard for the oligomeric ELISA
Expression and purification of recombinant human α-syn was performed as previously described [12, 14].
α-Syn oligomers were prepared by incubating fresh α-syn (25 µM) with Ginsenoside Rb1 (100 µM) in
PBS at 37°C for 5 days with continuous shaking at 800 rpm in a Thermomixer (Eppendorf), then α-syn
oligomers were characterized using electron microscopy as previously described [15]. Briefly, size
exclusion chromatography was carried out using an AKTA FPLC system (GE Healthcare, Sweden) and a
Superdex 200 column at 4 °C, in order to separate soluble α-syn oligomers from monomers. This way, we
guaranteed that only soluble α-syn oligomers were separated and then confirmed by electron microscopy
[15].
ELISA assays for measuring CSF α-syn species
CSF t-, o- and p-S129-α-syn levels were measured using our newly developed ELISA assays [12]. Briefly,
to capture t-α-syn or p-S129-α-syn, a 384-well ELISA microplate was coated by overnight incubation at
4°C with 0.1 µg/ml Syn-140 (sheep anti-α-syn polyclonal antibody) in 200 mM NaHCO3, pH 9.6 (50
µl/well), and Syn-O2 (0.2 µg/ml), was used to capture α-syn oligomers. The plates were then washed with
phosphate-buffered saline containing 0.05% Tween-20 (PBST) and incubated with 100 µl/well of blocking
buffer (PBST containing 2.5% gelatin) for 2 hours at 37°C. After washing, 50 µl of the CSF samples
(thawed on ice and Tween-20 was added to a final concentration of 0.05%) was added to each well, and
plates were incubated at 37°C for 2.5 hours. 11D12 (mouse anti-α-syn monoclonal antibody), PS129
(mouse anti-pS129-α-syn monoclonal antibody) and FL-140 (rabbit polyclonal antibody, Santa Cruz
Biotechnology, Santa Cruz, CA, USA) for measuring t-α-syn, pS129-α-syn or o-α-syn, respectively, diluted
in blocking buffer at 1:5 K, 1:1K and 1:1K, respectively, were added to the appropriate wells , and
incubated at 37°C for 2 hours. Next, the plates were washed and incubated for 2 hours at 37°C with 50
µl/well of species-appropriate secondary antibodies (donkey anti-mouse IgG HRP or goat anti-rabbit IgG
HRP (Jackson ImmunoResearch)) diluted in blocking buffer (1:20 K). After washing, the plates were
incubated with 50 µl/well of an enhanced chemiluminescent substrate (SuperSignal ELISA Femto, Pierce
Biotechnology, Rockford, IL). The chemiluminescence, expressed in relative light units, was immediately
measured using VICTOR™ X3 multilabel plate reader (PerkinElmer). The standard curve for the ELISA

105
assays was obtained using serial dilutions of recombinant human α-syn, p-S129-α-syn or o-α-syn in
artificial CSF (50 µl/well). Samples were measured in a blinded fashion and tested randomly. The baseline
and follow-up samples from the same individual were run in one plate to avoid plate-to-plate variations,
and results were confirmed with at least two independent experiments. A series of internal controls was
also run to check for run-to-run variations.
AD CSF biomarkers
AD biomarkers were measured with the INNO-BIA ALZBIO3 kit (Fujirebio Diagnostics), as previously
reported [16].
Study population
A description of the DATATOP cohort has been previously published [17]. DATATOP is a multicenter,
placebo-controlled clinical trial in patients with early PD. Eligible patients with early stages of untreated
PD were enrolled in DATATOP and randomized to (1) active deprenyl, (2) active tocopherol, (3) active
deprenyl and tocopherol, or (4) placebo treatments. Subjects presented at baseline with minimal disability,
which did not necessitate the need for symptomatic anti-PD treatment. Subjects were followed for two years
to an “endpoint” defined as the development of symptoms of sufficient severity to require dopamine
replacement therapy. Both CSF and the clinical data investigated in this study were collected for the patients
at the baseline and follow-up time points, prior to dopamine replacement therapy.
The criteria behind the clinical diagnosis were derived by the DATATOP Steering Committee members
who are experienced PD investigators. In selecting the CSF samples for the α-syn oligomers study, The
Parkinson’s’ study Group (PSG) committee excluded subjects that likely did not have PD. More
specifically, based on the investigators report, only subjects that had at least 60% confidence that PD was
the likely diagnosis are part of the study. This has been a typical cutoff in other studies to select definite
and acceptable PD. These subjects were divided into 90-100% confidence versus at least 60% confidence
at each of the visits. However, a confirmation of 100% likely PD was not feasible, since only a small number
(9 of the 800 subjects) of subjects where identified by autopsy whether the subject definitely had PD or not.
However, none of the 147 subjects in our study reported autopsy results. Thus, we have selected only 121
subjects whom did have definite PD (90-100% confidence). Investigators could only identify ranges of
confidence and 90-100% were grouped together for this study.
Clinical Assessment’s
Patients were classified into three subtypes following the approach of Jankovic and colleagues [18].
Depending on the dominant motor features, PD subtype was defined as (i) tremor dominant; (ii) postural
instability and gait difficulty dominant (PIGD); or (iii) intermediate. Subtype classification was based on
the ratio of the average of UPDRS tremor items (16, 20 and 21) divided by the average of ‘postural
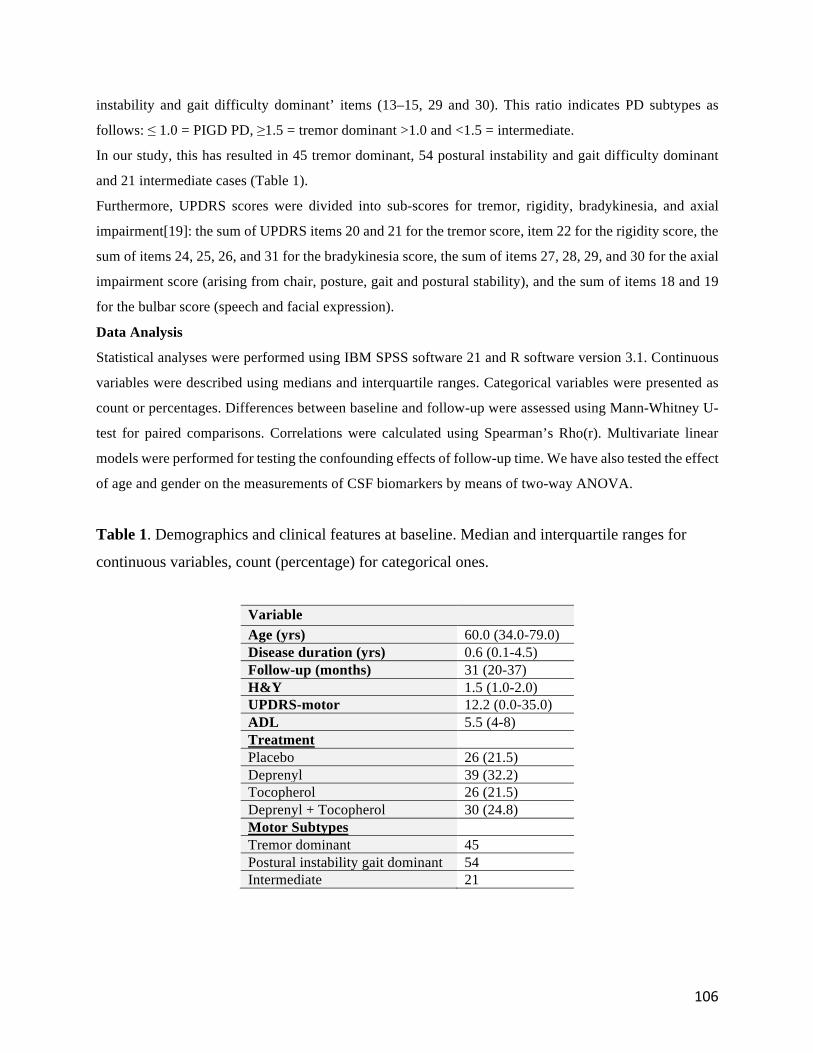
106
instability and gait difficulty dominant’ items (13–15, 29 and 30). This ratio indicates PD subtypes as
follows: ≤ 1.0 = PIGD PD, ≥1.5 = tremor dominant >1.0 and <1.5 = intermediate.
In our study, this has resulted in 45 tremor dominant, 54 postural instability and gait difficulty dominant
and 21 intermediate cases (Table 1).
Furthermore, UPDRS scores were divided into sub-scores for tremor, rigidity, bradykinesia, and axial
impairment[19]: the sum of UPDRS items 20 and 21 for the tremor score, item 22 for the rigidity score, the
sum of items 24, 25, 26, and 31 for the bradykinesia score, the sum of items 27, 28, 29, and 30 for the axial
impairment score (arising from chair, posture, gait and postural stability), and the sum of items 18 and 19
for the bulbar score (speech and facial expression).
Data Analysis
Statistical analyses were performed using IBM SPSS software 21 and R software version 3.1. Continuous
variables were described using medians and interquartile ranges. Categorical variables were presented as
count or percentages. Differences between baseline and follow-up were assessed using Mann-Whitney U-
test for paired comparisons. Correlations were calculated using Spearman’s Rho(r). Multivariate linear
models were performed for testing the confounding effects of follow-up time. We have also tested the effect
of age and gender on the measurements of CSF biomarkers by means of two-way ANOVA.
Table 1. Demographics and clinical features at baseline. Median and interquartile ranges for
continuous variables, count (percentage) for categorical ones.
Variable Age (yrs) 60.0 (34.0-79.0) Disease duration (yrs) 0.6 (0.1-4.5) Follow-up (months) 31 (20-37) H&Y 1.5 (1.0-2.0) UPDRS-motor 12.2 (0.0-35.0) ADL 5.5 (4-8) Treatment Placebo 26 (21.5) Deprenyl 39 (32.2) Tocopherol 26 (21.5) Deprenyl + Tocopherol 30 (24.8) Motor Subtypes Tremor dominant 45 Postural instability gait dominant 54 Intermediate 21

107
RESULTS Recently, we developed three robust, sensitive and reproducible sandwich-type ELISA systems that were
specific for t-, p-S129- or o-α-syn, and suitable for quantifying α-syn species/forms in human CSF
samples[12]. The total-ELISA system permitted quantification of most native forms of α-syn present in
biological samples such as human CSF and human- and Tg mouse-brain lysates, and had a detection limit
of 50 pg/ml, which is 20-fold less than the concentration detected in human CSF. The inter-assay coefficient
of variation (CV) examined over >10 plates was < 10%. Moreover, recovery rates were determined by
spiking recombinant α-syn into human CSF. Our assay consistently featured a mean recovery rate > 90%.
For the p-S129-α-syn-specific ELISA, the limit of detection was as low as 20 pg/ml, and a standard curve
with R2 of 0.999 was generated, whereas, the inter-assay CV was < 15% .The mean recovery rates were
between 95 and 97%, while the new oligomeric-ELISA for measuring o-α-syn had a detection limit of 10
pg/ml [20] . Our assay specificity towards o-α-syn was further validated as no signal was detected when
serial dilutions of α-syn monomers were included. The intra-assay and inter-assay precision was < 10%.
Spiking increasing amounts of recombinant o-α-syn into human CSF samples, the average recovery rates
were > 95%. Thus in the current study we employed our new ELISA protocols to quantify t-, p-S129- and
o-α-syn in CSF samples from longitudinal DATATOP cohort.
Assessment of longitudinal changes of α-syn species in CSF
CSF α-syn, tau and Aβ species were measured in CSF samples taken from the large cohort of 121
participants in the DATATOP study who were clinically diagnosed with early PD at the last evaluation
(probability between 90% - 100%). We tested the change in CSF t-, o-, p-S129-α-syn, t-tau, p-tau, Aβ40
and Aβ42 over the two-year DATATOP follow-up period. Examining the effect of medication between the
different treatment groups, no significant effect was noted on the clinical outcomes. However, deprenyl
was found to significantly, although weakly, slow ADL loss. Further investigating the association between
the different treatments and the changes in CSF biomarkers, no significant effect was noted, eliminating
the assumption that medications are potential confounders. Testing for age and gender effect, a significant
increase of p-S129-α-syn was noted in males versus females, as well as a significant increase of t-tau and
p-tau with age. Thus, we have adjusted for age and gender when investigating the correlations between the
levels of the biomarkers and the clinical parameters. However, when testing the effect of age and gender
on the changes of CSF biomarkers by means of two-way ANOVA, no significant association was observed,
thus age and gender were not considered as potential confounders in investigating the changes of CSF
biomarkers and the change in the clinical outcome. Both CSF t-α-syn and o-α-syn levels and the o-/t-α-syn
ratio were significantly higher at follow-up compared to baseline (p =0.003, p <0.0001, and p <0.0001,

108
respectively). In contrast, p-S129-α-syn levels were significantly lower at follow-up compared to baseline
(p=0.001). Biomarkers values at baseline and follow-up are all presented in Table 2.
Table 2. Biomarkers values at baseline and follow-up. Median and interquartile ranges Pairwise
Mann-Whitney test.
Biomarker Baseline Follow-up p-value t-α-syn (ng/ml) 2.6 (0.5-16.6) 3.3 (0.6-23.9) 0.003 p-S129-α-syn (pg/ml) 220 (51.7-642.1) 180 (12.0-542.8) 0.001 o-α-syn (pg/ml) 114 (0.0-652.6) 181 (37.9-790.0) <0.001 o-/t-α-syn 43.4 (11.3-543. 4) 48.6 (7.6-124.8) <0.001 p-S129-/t-α-syn 86.5 (6.2-540.0) 47.6 (1.1-481.9) <0.001 t-tau (pg/ml) 38 (13.4-129.5) 37 (17.9-142.2) 0.686 p-tau (pg/ml) 32 (15.4-85.8) 31 (15.6-106.1) 0.198 Aβ42 (pg/ml) 1230 (276.8-2685.2) 1195 (265.2-3363.2) 0.500 Aβ40 (pg/ml) 8089 (2882.4-15146.0) 7671 (1275.3-16450.8) 0.369
Changes of CSF α-syn species and disease progression
All patients
The correlation between the changes of CSF biomarkers and PD progression over the period of follow-up
in the DATATOP cohort is shown in Table 3. A significant positive correlation was observed between the
changes in CSF levels of both t-α-syn and o-α-syn with the two-year follow-up time (rs = 0,28, p < 0.01 and
rs = 0,32, p < 0.01, respectively, Fig. 1A, B). The correlation between o-/t-α-syn ratio and UPDRS motor
change (r=-0.22, p<0.05) was significant also after adjustment for baseline UPDRS motor and follow-up
on the regression model (β=-0.09, p<0.05). We have found also a significant association between o-/t-α-
syn ratio and UPDRS axial change (r=-0.31, p<0.01) that was significant also in the regression model (β=-
0.03, p<0.001) and a correlation between p-tau and change in ADL (r=-0.20, p<0.05), but this was not
significant after adjustment for follow-up, baseline ADL and medications (β=-0.08, p=0.114). A strong
positive correlation between the changes in t-α-syn and o-α-syn was also noted (r= 0.84, p< 0.0001, Fig.1C).
Tremor dominant patients
We found a significant association between change of CSF p-tau levels and UPDRS motor change in tremor
dominant PD (r=-0.35, p<0.05), and this was significant also after adjustment (β=-0.44, p<0.05).
Correlation between changes of CSF biomarkers levels and clinical parameters in tremor dominant group
are presented in Supplementary Table 1.
PIGD
Interestingly the correlation between o-/t-α-syn ratio and UPDRS motor was stronger in PIGD PD (r=-0.41,
p<0.01) while it was not significant in the tremor dominant subtype (r=-0.05, p=0.782); the association
between o-/t-α-syn ratio and UPDRS motor in PIGD holds also after adjustment for follow-up and baseline

109
UPDRS motor (β=-0.14, p<0.05). Furthermore, we found a significant correlation between change of o-/t-
α-syn ratio and ADL (r=-0.30, p<0.05) and this was not significant in the multivariate model accounting
for the effect of follow-up time, baseline ADL and medications (β=-0.04, p=0.081). UPDRS axial was
correlated with o-/t-α-syn ratio (r=-0.34, p<0.05) and this was significant also after adjustment for baseline
UPDRS axial and follow-up time (β=-0.03, p<0.01). UPDRS axial was correlated with t-tau (r=0.31,
p<0.05) but this was not significant in the multivariate model (β=0.05, p=0.076). Correlation between
changes of CSF biomarkers levels and clinical parameters in PIGD group are presented in Supplementary
Table 2.
Intermediate
No significant association was noted between the change in CSF biomarkers and the clinical parameters
(see Supplementary Table 3).
Figure 1. Scatter plots indicating the correlation between changes in CSF t-, o-α-syn and o-/t-α-syn levels with follow-up time and changes in clinical staging.
The correlation between the change of CSF t- and o-α-syn with length of follow-up time (r =0·28, p < 0·01 and r =0·32, p < 0·01, respectively) (A-B). The correlation between the changes in CSF t-α-syn and o-α-syn over the two-year DATATOP study period (r= 0·84, p < 0·0001) (C) The dotted line is the 95% prediction interval for the calculated regression line (solid line).

110
Correlation of CSF α-syn species with AD biomarkers
The correlation between changes of CSF biomarkers levels are all shown in Table 4. Interestingly, a
significant correlation was found between the change of p-tau with the change of o-α-syn (r=-0.21, p<0.05)
and the change of o-/t-α-syn ratio (r=-0.23, p<0.05). Furthermore, the change of Aβ42 correlated with the
change of p-S129-/t-α-syn ratio (r=0.19, p<0.05), whereas, the change of Aβ40 correlated with change of
o-α-syn (r=-0.25, p<0.05), o-/t-α-syn ratio (r=-0.23, p<0.05) and p-S129-/t-α-syn ratio (r=0.21, p<0.05).
We have also investigated the correlations between baseline levels of CSF biomarkers (Supplementary
Table 4). T-tau correlated with o-α-syn (r=-0.21, p<0.05) and o-/t-α-synuclein ratio (r=-0.23, p<0.05),
whereas, p-tau correlated with o-α-syn (r=-0.22, p<0.05) and o-/t-α-syn ratio (r = -0.26, p<0.05). Moreover,
Aβ42 correlated with t-α-syn (r=-0.21, p<0.05), o-α-syn (r=-0.35, p<0.001) and o-/t-α-syn ratio (r=-0.24,
p<0.05). Similar findings were noted with Aβ40, which also correlated with t-α-syn (r=-0.21, p<0.05) o-α-
syn (r=-0.37, p<0.001) and o-/t-α-syn ratio (r=-0.27, p<0.05).
Table 3. Correlation between changes of CSF biomarkers levels and disease duration, follow-up
time, changes of clinical outcomes/staging in all patients. Spearman’s rho and p-values (*p<0.05,
**p<0.01).
Follow-up HY ADL UPDRS motor
UPDRS tremor
UPDRS rigidity
UPDRS bradykinesia
UPDRS Axial
t-α-syn 0.28** 0.07 0.03 0.04 -0.07 0.02 0.04 0.02 p-S129-α-syn 0.04 -0.09 -0.07 -0.07 0.06 -0.10 0.01 0.04 o-α-syn 0.32** 0.11 -0.01 0.02 -0.09 0.04 0.00 -0.07 t-tau -0.03 0.09 -0.08 0.01 0.01 -0.02 0.07 0.10 p-tau -0.05 -0.15 -0.20 -0.19 0.01 -0.15 -0.07 -0.04 Aβ42 0.01 -0.16 0.04 -0.05 0.13 -0.02 -0.07 0.07 Aβ40 -0.07 -0.04 0.10 0.01 0.10 0.06 0.02 0.15 p-S129-/t-α-syn -0.24* -0.02 0.02 0.02 0.17 -0.05 0.11 0.10 o-/t-α-syn 0.15 -0.08 -0.17 -0.22* -0.19 -0.01 -0.03 -0.31**

111
Table 4. Correlation between changes of CSF biomarkers levels (* p<0.05, ** p<0.01). t-α-syn p-S129-α-syn o-α-syn o-/t-α-syn p-S129-/t-α-syn t-tau p-tau Aβ42 Aβ40 t-α-syn 1.00 p-S129-α-syn -0.29** 1.00 o- α -syn 0.84*** -0.24* 1.00 o-/t- α-syn -0.02 1.00 p-S129-/t-α-syn -0.66*** -0.01 1.00 t-tau 0.02 -0.09 0.01 -0.12 -0.07 1.00 p-tau -0.12 0.07 -0.21* -0.23* 0.09 0.51*** 1.00 Aβ42 -0.12 0.17 -0.17 -0.16 0.19* 0.14 0.22* 1.00 Aβ40 -0.18 0.12 -0.25** -0.23* 0.21* 0.17 0.28** 0.78*** 1.00
DISCUSSION CSF biomarker analyses and longitudinal clinical evaluations were conducted in a large cohort of early
diagnosed PD patients who participated in the DATATOP study. In the two-year DATATOP follow-up
period, CSF t- and o-α-syn levels were significantly higher, while p-S129-α-syn levels were significantly
lower, at follow-up compared to baseline. The changes in t- and o-α-syn levels, but not p-S129-α-syn levels,
positively correlated with follow-up time, further emphasizing the longitudinal increase in CSF t- and o-α-
syn levels over disease progression. Our findings are in disagreement with those reported recently[21], in
contrast these authors observed no significant longitudinal change in CSF t-α-syn, whereas, CSF p-S129-
α-syn increased longitudinally[21]. In a recent study by Shaw and colleagues [22], cross-sectional analysis
of the longitudinal PPMI study showed a significant reduction of CSF t-α-syn in PD compared to controls.
In contrast, CSF t-α-syn levels showed a longitudinal increase over the two-year DATATOP follow-up
period. However, the lack of control subjects in the DATATOP study, the small window of follow-up time,
the use of different quantification methods and the impact of pre-analytical confounding factors (types of
tubes, spinning conditions, storage conditions, etc.), hinder the comparison between both studies.
While the change in CSF t- or o-α-syn levels alone did not correlate with the longitudinal motor progression
of the disease in our DATATOP cohort, the change in o-/t-α-syn ratio significantly associated with UPDRS
motor scores. More interestingly, sub-group analysis of PD patients revealed a stronger correlation between
the change in o-/t-α-syn ratio and the change in UPDRS motor in PIGD group, whereas, the same correlation
was absent in tremor dominant group.
To our knowledge, this is the first study coupling the CSF biochemical profile of α-syn species with the
clinical PD phenotype. In this field, it is interesting to mention a recent functional MRI study measuring

112
brain activity in which different brain activation patterns could be found in tremor-dominant PD patients as
compared to those nontremor-dominant [23]. Our data seem to suggest that the PD clinical phenotypes
could be characterized by different CSF patterns. This finding, if confirmed in other series, might have
relevant implication in diagnosis, prognosis and treatment of PD. These results together with our previous
studies provide strong evidence for the important role of o-α-syn in the pathogenesis of PD. The correlations
noted between α-syn species and AD biomarkers, although weak, could also hold a potential in tracking PD
progression.
The PD subjects in the DATATOP study were at early stage of the disease, unlike most other clinical trials.
At baseline, these PD patients had minimal disability and were followed until just prior to the initiation of
the dopamine replacement therapy, which is reflected in their low H&Y scores. The fact that the patients
were at an early stage of disease with limited motor disability may explain the lack of an association
between the baseline or follow-up CSF biomarkers and disease severity. We did observe significant changes
of CSF α-syn levels over the two-year follow-up period, however, it is likely that a correlation between
CSF α-syn levels and clinical parameters will become more apparent with a longer follow-up. This will
require large-scale, prospective and well-controlled studies, especially those that include PD subjects with
neuroimaging and healthy controls such as the on-going Parkinson’s Progression Markers Initiative.
To our knowledge, this is the first study that combines measurements of different species of α-syn and AD
biomarkers and examined their longitudinal changes. In this study we demonstrated that quantification of
α-syn species in CSF has strong potential for tracking PD progression. However, we have to interpret our
findings with cautious since the DATATOP cohort is subject to several limitations; 1) the CSF samples
from the DATATOP study were stored for very long time (>25 years), and long storage could lead to
degradation, aggregation/precipitation and/or change in the phosphorylation state of α-syn; 2) the collection
and the process procedures of the CSF samples were not standardized; 3) and the absence of healthy controls
in the DATATOP study. Nevertheless, these caveats don’t underrate the importance of our original findings,
especially in the aspect of PD progression. Our interesting findings still need to be further validated in large-
scale, prospective and well-controlled studies, especially those that include subjects with neuroimaging-
supported definite PD and healthy controls and where CSF samples are collected and processed using
rigorous standardization as in the ongoing Parkinson’s Progression Markers Initiative.
Altogether, our current study shows that CSF α-syn species have a dynamic pattern along the course of the
disease, suggesting their possible role as progression biomarkers for PD.

113
REFERENCES
[1] J. Jankovic, "Parkinson's disease: clinical features and diagnosis," (in eng), J Neurol Neurosurg Psychiatry, vol. 79, no. 4, pp. 368-‐76, Apr 2008.
[2] M. G. Spillantini, M. L. Schmidt, V. M. Lee, J. Q. Trojanowski, R. Jakes, and M. Goedert, "Alpha-‐synuclein in Lewy bodies," (in eng), Nature, vol. 388, no. 6645, pp. 839-‐40, Aug 28 1997.
[3] K. E. Paleologou, G. B. Irvine, and O. M. El-‐Agnaf, "Alpha-‐synuclein aggregation in neurodegenerative diseases and its inhibition as a potential therapeutic strategy," (in eng), Biochem Soc Trans, vol. 33, no. Pt 5, pp. 1106-‐10, Nov 2005.
[4] O. M. El-‐Agnaf et al., "Aggregates from mutant and wild-‐type alpha-‐synuclein proteins and NAC peptide induce apoptotic cell death in human neuroblastoma cells by formation of beta-‐sheet and amyloid-‐like filaments," (in eng), FEBS Lett, vol. 440, no. 1-‐2, pp. 71-‐5, Nov 1998.
[5] O. M. el-‐Agnaf, G. B. Irvine, and D. J. Guthrie, "Conformations of beta-‐amyloid in solution," (in eng), J Neurochem, vol. 68, no. 1, pp. 437-‐9, Jan 1997.
[6] T. Tokuda et al., "Decreased alpha-‐synuclein in cerebrospinal fluid of aged individuals and subjects with Parkinson's disease," (in eng), Biochem Biophys Res Commun, vol. 349, no. 1, pp. 162-‐6, Oct 2006.
[7] L. Parnetti et al., "Differential role of CSF alpha-‐synuclein species, tau, and Aβ42 in Parkinson's Disease," (in eng), Front Aging Neurosci, vol. 6, p. 53, 2014.
[8] K. D. van Dijk, M. Bidinosti, A. Weiss, P. Raijmakers, H. W. Berendse, and W. D. van de Berg, "Reduced α-‐synuclein levels in cerebrospinal fluid in Parkinson's disease are unrelated to clinical and imaging measures of disease severity," (in eng), Eur J Neurol, vol. 21, no. 3, pp. 388-‐94, Mar 2014.
[9] L. Parnetti et al., "Cerebrospinal fluid biomarkers in Parkinson disease," (in eng), Nat Rev Neurol, vol. 9, no. 3, pp. 131-‐40, Mar 2013.
[10] L. Parnetti et al., "Cerebrospinal fluid Tau/α-‐synuclein ratio in Parkinson's disease and degenerative dementias," (in eng), Mov Disord, vol. 26, no. 8, pp. 1428-‐35, Jul 2011.
[11] B. Mollenhauer, J. J. Locascio, W. Schulz-‐Schaeffer, F. Sixel-‐Döring, C. Trenkwalder, and M. G. Schlossmacher, "α-‐Synuclein and tau concentrations in cerebrospinal fluid of patients presenting with parkinsonism: a cohort study," (in eng), Lancet Neurol, vol. 10, no. 3, pp. 230-‐40, Mar 2011.
[12] N. K. Majbour et al., "Oligomeric and phosphorylated alpha-‐synuclein as potential CSF biomarkers for Parkinson's disease," (in eng), Mol Neurodegener, vol. 11, no. 1, p. 7, 2016.
[13] M. Helwig et al., "Brain propagation of transduced α-‐synuclein involves non-‐fibrillar protein species and is enhanced in α-‐synuclein null mice," (in ENG), Brain, Dec 2015.
[14] M. T. Ardah et al., "Structure activity relationship of phenolic acid inhibitors of α-‐synuclein fibril formation and toxicity," (in eng), Front Aging Neurosci, vol. 6, p. 197, 2014.
[15] M. T. Ardah et al., "Ginsenoside Rb1 inhibits fibrillation and toxicity of alpha-‐synuclein and disaggregates preformed fibrils," (in eng), Neurobiol Dis, vol. 74, pp. 89-‐101, Feb 2015.

114
[16] L. M. Shaw et al., "Qualification of the analytical and clinical performance of CSF biomarker analyses in ADNI," (in eng), Acta Neuropathol, vol. 121, no. 5, pp. 597-‐609, May 2011.
[17] "DATATOP: a multicenter controlled clinical trial in early Parkinson's disease. Parkinson Study Group," (in eng), Arch Neurol, vol. 46, no. 10, pp. 1052-‐60, Oct 1989.
[18] J. Jankovic et al., "Variable expression of Parkinson's disease: a base-‐line analysis of the DATATOP cohort. The Parkinson Study Group," (in eng), Neurology, vol. 40, no. 10, pp. 1529-‐34, Oct 1990.
[19] M. E. Domellöf, E. Elgh, and L. Forsgren, "The relation between cognition and motor dysfunction in drug-‐naive newly diagnosed patients with Parkinson's disease," (in eng), Mov Disord, vol. 26, no. 12, pp. 2183-‐9, Oct 2011.
[20] N. N. Vaikath et al., "Generation and characterization of novel conformation-‐specific monoclonal antibodies for α-‐synuclein pathology," (in eng), Neurobiol Dis, vol. 79, pp. 81-‐99, Jul 2015.
[21] T. Stewart et al., "Phosphorylated α-‐synuclein in Parkinson's disease: correlation depends on disease severity," (in eng), Acta Neuropathol Commun, vol. 3, p. 7, 2015.
[22] J. H. Kang et al., "Association of cerebrospinal fluid β-‐amyloid 1-‐42, T-‐tau, P-‐tau181, and α-‐synuclein levels with clinical features of drug-‐naive patients with early Parkinson disease," (in eng), JAMA Neurol, vol. 70, no. 10, pp. 1277-‐87, Oct 2013.
[23] J. Prodoehl, P. J. Planetta, A. S. Kurani, C. L. Comella, D. M. Corcos, and D. E. Vaillancourt, "Differences in brain activation between tremor-‐ and nontremor-‐dominant Parkinson disease," (in eng), JAMA Neurol, vol. 70, no. 1, pp. 100-‐6, Jan 2013.

115

116
!!
CHAPTER 5 Increased Levels of CSF Total but not Oligomeric or Phosphorylated Forms of Alpha-Synuclein in Patients Diagnosed with Probable Alzheimer’s Disease

117
CHAPTER 5 | INCREASED LEVELS OF CSF TOTAL BUT NOT OLIGOMERIC OR PHOSPHORYLATED FORMS OF ALPHA-SYNUCLEIN IN PATIENTS DIAGNOSED WITH PROBABLE ALZHEIMER’S DISEASE
Nour K. Majbour, MSc1, 2†, Davide Chiasserini, PhD3†, Nishant N. Vaikath, MSc1, 4, Paolo Eusebi, PhD3,
Takahiko Tokuda, MD, PhD5, Wilma van de Berg, PhD2, Lucilla Parnetti, MD, PhD3, Paolo Calabresi,
MD3, 6, Omar M.A. El-Agnaf, PhD1,7 1Neurological Disorders Research Center, Qatar Biomedical Research Institute (QBRI), Hamad Bin Khalifa University (HBKU), Qatar Foundation, PO Box 5825, Doha, Qatar 2Department of Anatomy and Neurosciences, Neuroscience Campus Amsterdam, VU University Medical Centre, Amsterdam, The Netherlands. 3Dipartimento di Medicina, sezione di Neurologia, Università degli Studi di Perugia, Perugia, Italy 4Neural Plasticity and Repair Unit, Department of Experimental Medical Sciences, Wallenberg Neuroscience Center, BMC A10, Lund University, Lund, Sweden 5Department of Neurology, Research Institute for Geriatrics, Kyoto Prefectural University of Medicine, Kyoto, 602-0841, Japan 6IRCCS Fondazione S. Lucia, Roma, Italy 7Life Sciences Division, College of Science and Engineering, Hamad Bin Khalifa University (HBKU), Education City, Qatar Foundation, PO Box 5825, Doha, Qatar †These authors contributed equally to this work.
Sci Rep. 2017 Jan 10;7:40263. doi: 10.1038/srep40263.

118
Abstract Several studies reported an association between CSF alpha-synuclein (α-syn) and tau in Alzheimer’s
disease (AD), and demonstrated the significance of α-syn in improving the diagnostic sensitivity/specificity
of classical AD CSF biomarkers. In the current study, we measured CSF levels of different α-syn species
in a cohort of AD patients (n=225) who showed a CSF profile typical of AD at baseline as well as in
cognitively intact controls (n=68). CSF total α-syn (t-α-syn) significantly increased in the AD group (p
<0.0001) compared to controls, while oligomeric- and phosphorylated-Ser129-α-syn did not change
significantly. ROC analysis showed a sensitivity of 85% and a specificity of 84% (AUC = 0.88) in
distinguishing AD from controls. T-α-syn levels correlated positively with tau species in AD group and
negatively with baseline MMSE score. Our data support the added value of measurement of CSF α-syn
species for further characterization of the CSF AD profile.
Introduction α-Synuclein (α-syn) is a pre-synaptic neuronal protein that has been linked to a number of
neurodegenerative disorders named as “synucleinopathies” [1]. However, the role of α-syn in the
pathogenesis of Alzheimer’s disease (AD) has been increasingly recognized since Uéda et al. reported the
presence of a non-Aβ component in the extracellular plaques found in the brains of AD patients, which was
shown to be a fragment of α-syn [2]. In fact, the role of α-syn became of particular interest when the co-
existence of α-syn and tau pathology was observed in the brains of patients with AD, Parkinson’s disease
(PD) and dementia with Lewy bodies (DLB) [3]. Although total tau (t-tau), phosphorylated tau (p-tau) and
amyloid beta-42 (Aβ42) are state biomarkers of AD, some of the neuropathological changes observed in
the brains of AD patients are not captured by these traditional biomarkers, such as α-syn inclusions “LBs”.
Therefore, there is a need for additional biomarkers that can lead to better understanding and differential
diagnosis. The aim of our study was to measure the levels of CSF α-syn species total- (t-), oligomeric- (o-
) and phosphorylated-Ser129- (p-S129-) α-syn in a cohort of patients clinically diagnosed with probable
AD who also exhibited a CSF profile positive for AD biomarkers, in support of the clinical diagnosis. To
evaluate the diagnostic performance of CSF α-syn species in AD patients, we also included a control group
composed of subjects who did not exhibit cognitive decline and who displayed CSF profiles negative for
AD biomarkers. These were patients who had been diagnosed with other neurological diseases (OND).
The correlation of CSF α-syn species with t-tau, p-tau and Aβ42 was also investigated.
Methods Patients and CSF sampling
The AD cohort enrolled in this study included patients who attended the Center for Memory Disturbances
of the University of Perugia between 2008 and 2011 and underwent CSF analysis for diagnostic purposes

119
after informed written consent. All of the patients underwent the following: a thorough clinical examination
by experienced neurologists; a neuropsychological assessment, including the Mini Mental State
Examination (MMSE); analysis of blood chemistry; and a brain CT and/or MRI scan to exclude major
cerebrovascular diseases or other pathological brain conditions (e.g., hydrocephalus, tumors, hematomas,
abscesses, etc.). The AD group was composed of 225 patients diagnosed with probable AD according to
the research criteria proposed by Dubois et al.[4] (M/F = 96/129). Each patient also had a CSF biomarker
profile indicative of AD, according to the cut-offs used in our center (Aβ42 < 800, t-tau > 300 and p-tau >
60). As neurological controls, we selected 68 subjects who were admitted to the neurological ward and
underwent CSF tapping for diagnostic reasons (e.g., headache, suspected myelopathy, etc.), were without
clinical evidence of cognitive impairment and had CSF biomarkers profile negative for AD (other
neurological diseases group, OND). In all subjects enrolled in this study, lumbar puncture was performed
as a routine diagnostic procedure between 8:00 and 10:00 a.m. CSF (10 mL) was collected in sterile
polypropylene tubes, centrifuged for 10 minutes at 2000 x g, divided into 0.5 mL aliquots and immediately
frozen at -80°C. CSF samples were collected according to a standard protocol following international
guidelines[5].The study was approved by the local Ethical Committee (Comitato Etico delle Aziende
Sanitarie della Regione Umbria - CEAS Umbria) and informed written consent was signed by all patients
enrolled or by their legal representatives. The work was carried out according to the Declaration of Helsinki.
Immunoassays to quantify α-syn species in the CSF
CSF t-, o- and p-S129-α-syn levels were measured using our recently published ELISA assays [6]. Briefly,
for measuring t-α-syn, a 384-well ELISA microplate was coated by overnight incubation at 4°C with 0.1
µg/ml Syn-140 (sheep anti-α-syn polyclonal antibody) in 200 mM NaHCO3, pH 9.6 (50 µl/well). Similarly,
Syn-140 was used for measuring p-S129-α-syn, while the conformation-specific monoclonal antibody
(Syn-O2) [7], which is specific for α-syn oligomers (0.2 µg/ml), was used as the primary antibody to capture
o-α-syn. The plate was then washed with phosphate-buffered saline containing 0.05% Tween-20 (PBST)
and incubated with 100 µl/well of blocking buffer (PBST containing 2.5% gelatin) for 2 hours at 37°C.
After washing, 50 µl of the CSF samples (thawed on ice and Tween-20 added to a final concentration of
0.05%) were added to each well, and the plate was incubated at 37°C for another 2.5 hours. Antibodies
included 11D12 (mouse anti-α-syn monoclonal antibody) for measuring t-α-syn, PS129 (mouse anti-pS129-
α-syn monoclonal antibody) for measuring pS129-α-syn and FL-140 (rabbit polyclonal antibody, Santa
Cruz Biotechnology, Santa Cruz, CA, USA) for measuring o-α-syn were diluted to the desired
concentration (1:5000, 1:1,000 and 1:1,000, respectively) in the blocking buffer before being added to the
corresponding wells and incubated at 37°C for 2 hours. Next, the plate was washed and then incubated for
2 hours at 37°C with 50 µl/well of species-appropriate secondary antibodies: donkey anti-mouse IgG HRP
or goat anti-rabbit IgG HRP (Jackson ImmunoResearch, US), diluted in blocking buffer (1:20,000). After

120
washing, the plate was incubated with 50 µl/well of an enhanced chemiluminescent substrate (SuperSignal
ELISA Femto, Pierce Biotechnology, Rockford, IL). Then, the chemiluminescence (relative light units)
was immediately measured using a VICTOR™ X3 multilabel plate reader (PerkinElmer). The standard
curve for the ELISA assays was carried out using 50 µl/well of serial dilutions of recombinant human α-
syn, p-S129-α-syn or o-α-syn in artificial CSF. The samples were screened in a blinded fashion and tested
randomly. All the results were confirmed with at least two independent experiments. A series of internal
controls was also run to check for run-to-run variations.
Measurement of AD biomarkers
CSF Aβ42, total tau, and p-tau were measured using an ELISA technique (INNOTEST ß amyloid 1-42,
hTAU-Ag, p-TAU 181 Ag, Fujirebio Europe, Gent, Belgium) as previously described [8].
Data analysis and statistics
Statistical analysis was performed using R software v. 2.15. Continuous variables were described by the
median and interquartile range because data distributions were skewed. Correlations were calculated using
Spearman’s Rho (rs). The Mann-Whitney test was used for initial comparisons between the two diagnostic
groups (p < 0.05). The accuracy of the diagnostic value of the biomarkers [9] was assessed by calculating
the area under the curve (AUC) of the receiver operating characteristic (ROC) curve [10]. Cut-off values
were calculated using sensitivity and specificity values that maximized Youden’s index. Because there was
a significant difference in age (p <0.0001) and in the distribution of gender (p <0.01) between the groups,
we corrected for these using a logistic regression approach to adjust for covariates. All CSF samples with
an erythrocyte count > 500 cells/µl were excluded from further analysis, as traces of blood may influence
CSF α-syn levels [11, 12].
Results
Patients’ characteristics
Demographic data and clinical features are reported in Table 1. The AD group had median disease duration
of 2 years at the time of the lumbar puncture. No significant difference in the number of years of education
was present. As expected, baseline MMSE scores were significantly lower in the AD group (p < 0.0001).

121
Table 1. Demographic data and clinical features of OND and AD subjects.
Demographics OND AD
p-value (n=68) (n=225)
Sex (M) 42 (62%) 96 (43%) 0.0094
Age 63.7 ± 10.6 71.2 ± 8.8 <0.0001
Education 9.1 ± 5.1 8.2 ± 4.5 0.3895
Disease years - 2.5 ± 1.4 - MMSE 26.1 ± 3.2 21.1 ± 3.2 <0.0001
Levels of α-syn species in the CSF of AD patients and control subjects
Due to the differences between the groups in some demographic and clinical parameters we used a logistic
regression approach to assess the diagnostic performance of the α-syn species, adjusting for covariates such
as sex, age and MMSE (Table 2). CSF t-α-syn levels were significantly higher in the AD group compared
to the OND group (p <0.0001, Fig. 1A), whereas CSF o-α-syn and p-S129-α-syn levels were similar in both
diagnostic groups (p = 0.22 and p = 0.35, respectively, Fig. 1B, C). As a consequence, the o-/t-α-syn ratio
and p-S129-/t-α-syn ratio were significantly lower in AD subjects compared to OND subjects (p < 0.001
and p < 0.0001 respectively, Fig. 1D, E).
Table 2. P-values of OND vs. AD comparisons of CSF biomarkers levels after adjustment for covariates (age, gender) using a regression model.
Biomarker OND AD
p-values (n=68) (n=225)
t-tau 202.5 ± 55.5 776.1 ± 476.2 <0.0001 p-tau 42.1 ± 9.5 105.5 ± 46.7 <0.0001 t-α-syn (pg/ml) 1119.0 ± 1114.4 2200.0 ± 1189.9 <0.0001 p-S129-α-syn (pg/ml) 81.8 ± 55.0 97.5 ± 61.8 0.346 o-α-syn (pg/ml) 158.5 ± 79.8 162.5 ± 113.3 0.2291 o-/t-α-syn 0.17 ± 0.08 0.09 ± 0.08 0.0003 p-S129-/t-α-syn 0.08 ± 0.06 0.04 ± 0.05 <0.0001

122
Figure 1. Boxplots of the values of CSF biomarkers observed in the AD and OND groups.
Individual values of the CSF levels of (A) t-α-syn, (B) o-α-syn, and (C) p-S129-α-syn and the (D) o-/t-α-syn ratio and (E) p-S129-/t-α-syn ratio in patients with AD and OND. Horizontal bold lines indicate the medians; upper and lower horizontal lines indicate the range of values.
ROC analysis was carried out for the α-syn species (Fig. 2), and t-α-syn achieved the best diagnostic
performance compared to o-α-syn or p-S129-α-syn, with a sensitivity of 85% and a specificity of 84%
(AUC = 0.87, 95% CI=0.82-0.93, and cut-off =1260 pg/ml). However, neither the o-/t-α-syn ratio nor the
p-S129-/t-α-syn ratio improved the global diagnostic performance of t-α-syn in detecting AD (sensitivity =
87%, specificity = 79%, AUC = 0.82, 95% CI=0.76-0.87, and cut-off = 11.5; sensitivity=50%,
specificity=84%, AUC= 0.71, 95% CI= 0.63-0.78, and cut-off= 8.0, respectively).
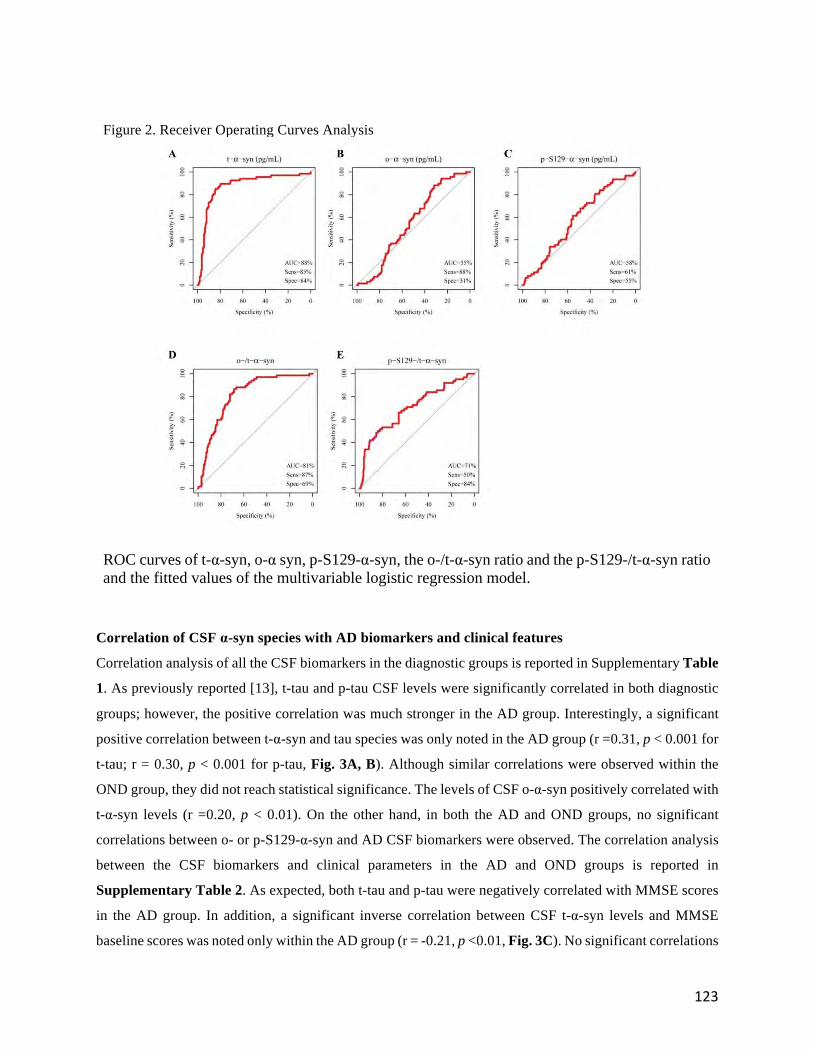
123
Figure 2. Receiver Operating Curves Analysis
ROC curves of t-α-syn, o-α syn, p-S129-α-syn, the o-/t-α-syn ratio and the p-S129-/t-α-syn ratio and the fitted values of the multivariable logistic regression model.
Correlation of CSF α-syn species with AD biomarkers and clinical features
Correlation analysis of all the CSF biomarkers in the diagnostic groups is reported in Supplementary Table
1. As previously reported [13], t-tau and p-tau CSF levels were significantly correlated in both diagnostic
groups; however, the positive correlation was much stronger in the AD group. Interestingly, a significant
positive correlation between t-α-syn and tau species was only noted in the AD group (r =0.31, p < 0.001 for
t-tau; r = 0.30, p < 0.001 for p-tau, Fig. 3A, B). Although similar correlations were observed within the
OND group, they did not reach statistical significance. The levels of CSF o-α-syn positively correlated with
t-α-syn levels (r =0.20, p < 0.01). On the other hand, in both the AD and OND groups, no significant
correlations between o- or p-S129-α-syn and AD CSF biomarkers were observed. The correlation analysis
between the CSF biomarkers and clinical parameters in the AD and OND groups is reported in
Supplementary Table 2. As expected, both t-tau and p-tau were negatively correlated with MMSE scores
in the AD group. In addition, a significant inverse correlation between CSF t-α-syn levels and MMSE
baseline scores was noted only within the AD group (r = -0.21, p <0.01, Fig. 3C). No significant correlations

124
were observed between the other α-syn species and age, education or disease duration in either diagnostic
group.
Figure 3. Scatter plots indicating the correlation between t-α-syn and t-tau, p-tau and MMSE scores.
ROC curves of t-α-syn, o-α syn, p-S129-α-syn, the o-/t-α-syn ratio and the p-S129-/t-α-syn ratio and the fitted values of the multivariable logistic regression model.
125
Discussion The role of α-syn as a putative AD biomarker has been investigated in several studies, largely with
contrasting results. Some studies have reported either unchanged or increased levels of t-α-syn in AD
patients compared to various control groups (healthy or other neurological conditions) [14-16].
In the present study, we used our newly developed, sensitive ELISAs to measure the concentration of t-α-
syn and other pathologically important CSF α-syn species (o- and p-S129-α-syn), which are mainly
associated with synucleinopathies. The CSF samples analyzed were selected from a large cohort of patients
clinically diagnosed with probable AD who also had an AD-positive CSF biomarkers profile. As a control
group, we included cognitively intact patients who had been diagnosed with other neurological diseases but
had an AD-negative CSF biomarkers profile. Our main findings were: i) a significant increase in CSF t-α-
syn levels in AD patients with respect to control subjects; ii) no significant change in CSF o- or p-S129-α-
syn levels in AD patients; and iii) a significant correlation of t-α-syn levels with tau species and MMSE in
the AD group.
The increase of t-α-syn in the AD group is in line with the findings of several previous reports [14, 17], but
contrasts with others [18, 19]. These discrepancies are likely due to several factors, including differences
in the assay platform used, lack of control of contamination of the samples with red blood cells and
heterogeneity of the patients included in the studies. In this study, we selected a cohort of AD patients by
not only relying on an accurate clinical and neuropsychological evaluation but also choosing the patients
according to the CSF profile of Aβ42, t-tau and p-tau, which further supports the initial AD diagnosis.
Whereas, the OND group included cognitively normal subjects with CSF biomarker profile negative for
AD, possibly excluding non-AD neurological disorders with neurodegeneration. This may explain the
difference in diagnostic performance among the studies. Korff and colleagues found a sensitivity of 65%
and a specificity of 74% in distinguishing AD patients from controls [20], while in the present work, the
performance of t-α-syn was better, reaching approximately 85% for both sensitivity and specificity.
A meaningful hypothesis about the increase of t-α-syn in the AD group relies on evidence of over-
expression in the brain tissue of AD patients, as previously shown [21], and/or on the neuronal damage
related to AD. This, in turn, can increase the release of α-syn from damaged cells into the brain’s interstitial
fluid and then into the CSF. This hypothesis is further supported by the significant positive correlation
between t-α-syn and tau species we found in our cohort. This correlation agrees with previous reports [17]
and was observed solely in the AD group. Tau protein is considered the prototypical biomarker of neuronal
damage because it is highly increased in the CSF of patients diagnosed with Creutzfeldt-Jakob disease [22],
a disease characterized by massive neurodegeneration, as well as in acute events such as traumatic brain
injury [23]. Notably, CSF α-syn is also increased in these conditions and in other neurological diseases in
which neurodegeneration is an important attribute [24-26], further stressing the parallelism between tau and

126
α-syn. In particular, the increase of α-syn in AD patients can be perceived as a marker of synapse loss and
synapse disruption. It is worth noting that, consistent with other studies [20, 27], we observed a significant
inverse correlation between the levels of CSF α-syn and cognitive function as measured by MMSE in our
AD group.
The unique role of α-syn in AD pathology relative to synucleinopathies is also supported by the lack of a
contribution of o- and p-S129-α-syn species to the diagnosis of AD. Substantial evidence suggests a
neurotoxic role for o-α-syn in the pathogenesis of synucleinopathies, both in vitro and in vivo [28], as α-
syn oligomers are increased in brain homogenates and the CSF of PD and DLB patients [29-31]. Here, we
found no significant differences in the level of o-α-syn in the AD group with respect to control subjects,
thus confirming our previous reports [30]. Likewise, phosphorylated α-syn has been previously linked to
PD pathogenesis, reflecting that most of the α-syn accumulated in LBs is phosphorylated at residue Ser129
[32, 33]. Elevated p-S129-/t-α-syn ratios have also been found in the CSF of PD patients [34]. In the current
study, p-S129-α-syn did not show any significant change in our AD cohort, supporting the hypothesis that
the oligomeric- and p-S129-α-syn species are intimately connected to the pathogenesis of
synucleinopathies.
One possible limitation of this study is the lack of neuropathological assessment. It has been shown that
AD biomarkers can detect the underlying AD pathology with high accuracy, but may not detect co-
morbidity caused by the presence of other protein aggregates (Toledo et al., Acta Neuropathol, 2012). Co-
morbidity may influence the accuracy of CSF biomarkers, including α-syn. Further studies should be
devoted to the understanding of the complex relationships between CSF AD biomarkers and α-syn species
across different types of dementia, possibly together with pathological confirmation. We also aim to include
subjects with α-syn related dementias such as DLB and PD with dementia in future research to broaden our
understanding of the potential role of α-syn as cognitive biomarkers.
In conclusion, our results in a well characterized cohort of AD patients and neurological controls further
support the notion that t-α-syn most likely represents a marker of neuron loss and/ or synaptic failure in
AD. Future studies should be aimed at understanding the added values of α-syn species to the core AD
biomarkers.
127
References
[1] M. G. Spillantini and M. Goedert, "The alpha-‐synucleinopathies: Parkinson's disease, dementia with Lewy bodies, and multiple system atrophy," (in eng), Ann N Y Acad Sci, vol. 920, pp. 16-‐27, 2000.
[2] K. Uéda et al., "Molecular cloning of cDNA encoding an unrecognized component of amyloid in Alzheimer disease," (in eng), Proc Natl Acad Sci U S A, vol. 90, no. 23, pp. 11282-‐6, Dec 1993.
[3] K. Vekrellis, M. Xilouri, E. Emmanouilidou, H. J. Rideout, and L. Stefanis, "Pathological roles of α-‐synuclein in neurological disorders," (in eng), Lancet Neurol, vol. 10, no. 11, pp. 1015-‐25, Nov 2011.
[4] B. Dubois et al., "Research criteria for the diagnosis of Alzheimer's disease: revising the NINCDS-‐ADRDA criteria," (in eng), Lancet Neurol, vol. 6, no. 8, pp. 734-‐46, Aug 2007.
[5] C. E. Teunissen et al., "A consensus protocol for the standardization of cerebrospinal fluid collection and biobanking," Neurology, vol. 73, no. 22, pp. 1914-‐22, Dec 1 2009.
[6] N. K. Majbour et al., "Oligomeric and phosphorylated alpha-‐synuclein as potential CSF biomarkers for Parkinson's disease," (in eng), Mol Neurodegener, vol. 11, no. 1, p. 7, 2016.
[7] N. N. Vaikath et al., "Generation and characterization of novel conformation-‐specific monoclonal antibodies for α-‐synuclein pathology," (in eng), Neurobiol Dis, vol. 79, pp. 81-‐99, Jul 2015.
[8] L. Parnetti et al., "Performance of aβ1-‐40, aβ1-‐42, total tau, and phosphorylated tau as predictors of dementia in a cohort of patients with mild cognitive impairment," (in eng), J Alzheimers Dis, vol. 29, no. 1, pp. 229-‐38, 2012.
[9] P. Eusebi, "Diagnostic accuracy measures," (in eng), Cerebrovasc Dis, vol. 36, no. 4, pp. 267-‐72, 2013.
[10] X. Robin et al., "pROC: an open-‐source package for R and S+ to analyze and compare ROC curves," (in eng), BMC Bioinformatics, vol. 12, p. 77, 2011.
[11] Z. Hong et al., "DJ-‐1 and alpha-‐synuclein in human cerebrospinal fluid as biomarkers of Parkinson's disease," (in eng), Brain, vol. 133, no. Pt 3, pp. 713-‐26, Mar 2010.
[12] R. Barbour et al., "Red blood cells are the major source of alpha-‐synuclein in blood," (in eng), Neurodegener Dis, vol. 5, no. 2, pp. 55-‐9, 2008.
[13] L. Parnetti et al., "Cerebrospinal fluid Tau/α-‐synuclein ratio in Parkinson's disease and degenerative dementias," (in eng), Mov Disord, vol. 26, no. 8, pp. 1428-‐35, Jul 2011.
[14] J. B. Toledo, A. Korff, L. M. Shaw, J. Q. Trojanowski, and J. Zhang, "CSF α-‐synuclein improves diagnostic and prognostic performance of CSF tau and Aβ in Alzheimer's disease," (in eng), Acta Neuropathol, vol. 126, no. 5, pp. 683-‐97, Nov 2013.
[15] K. Kasuga et al., "Differential levels of alpha-‐synuclein, beta-‐amyloid42 and tau in CSF between patients with dementia with Lewy bodies and Alzheimer's disease," (in eng), J Neurol Neurosurg Psychiatry, vol. 81, no. 6, pp. 608-‐10, Jun 2010.
[16] E. Kapaki, G. P. Paraskevas, E. Emmanouilidou, and K. Vekrellis, "The diagnostic value of CSF α-‐synuclein in the differential diagnosis of dementia with Lewy bodies vs. normal subjects and patients with Alzheimer's disease," (in eng), PLoS One, vol. 8, no. 11, p. e81654, 2013.
[17] S. Slaets et al., "Increased CSF α-‐synuclein levels in Alzheimer's disease: Correlation with tau levels," (in ENG), Alzheimers Dement, Jan 2014.
[18] F. E. Reesink et al., "CSF alpha-‐synuclein does not discriminate dementia with Lewy bodies from Alzheimer's disease," (in eng), J Alzheimers Dis, vol. 22, no. 1, pp. 87-‐95, 2010.
[19] A. Ohrfelt et al., "Cerebrospinal fluid alpha-‐synuclein in neurodegenerative disorders-‐a marker of synapse loss?," (in eng), Neurosci Lett, vol. 450, no. 3, pp. 332-‐5, Feb 2009.

128
[20] A. Korff, C. Liu, C. Ginghina, M. Shi, J. Zhang, and A. s. D. N. Initiative, "α-‐Synuclein in cerebrospinal fluid of Alzheimer's disease and mild cognitive impairment," (in eng), J Alzheimers Dis, vol. 36, no. 4, pp. 679-‐88, 2013.
[21] M. E. Larson et al., "Soluble α-‐synuclein is a novel modulator of Alzheimer's disease pathophysiology," (in eng), J Neurosci, vol. 32, no. 30, pp. 10253-‐66, Jul 2012.
[22] T. Skillbäck, C. Rosén, F. Asztely, N. Mattsson, K. Blennow, and H. Zetterberg, "Diagnostic performance of cerebrospinal fluid total tau and phosphorylated tau in Creutzfeldt-‐Jakob disease: results from the Swedish Mortality Registry," (in eng), JAMA Neurol, vol. 71, no. 4, pp. 476-‐83, Apr 2014.
[23] S. Magnoni et al., "Tau elevations in the brain extracellular space correlate with reduced amyloid-‐β levels and predict adverse clinical outcomes after severe traumatic brain injury," (in eng), Brain, vol. 135, no. Pt 4, pp. 1268-‐80, Apr 2012.
[24] K. Blennow, H. Hampel, M. Weiner, and H. Zetterberg, "Cerebrospinal fluid and plasma biomarkers in Alzheimer disease," (in eng), Nat Rev Neurol, vol. 6, no. 3, pp. 131-‐44, Mar 2010.
[25] H. Wang et al., "Cerebrospinal fluid α-‐synuclein levels are elevated in multiple sclerosis and neuromyelitis optica patients during replase," (in eng), J Neurochem, vol. 122, no. 1, pp. 19-‐23, Jul 2012.
[26] T. Kasai et al., "Increased α-‐synuclein levels in the cerebrospinal fluid of patients with Creutzfeldt-‐Jakob disease," (in eng), J Neurol, vol. 261, no. 6, pp. 1203-‐9, Jun 2014.
[27] M. E. Larson et al., "Soluble alpha-‐synuclein is a novel modulator of Alzheimer's disease pathophysiology," in J Neurosci, vol. 32no. 30) United States, 2012, pp. 10253-‐66.
[28] B. Winner et al., "In vivo demonstration that alpha-‐synuclein oligomers are toxic," (in eng), Proc Natl Acad Sci U S A, vol. 108, no. 10, pp. 4194-‐9, Mar 2011.
[29] T. Tokuda et al., "Detection of elevated levels of α-‐synuclein oligomers in CSF from patients with Parkinson disease," (in eng), Neurology, vol. 75, no. 20, pp. 1766-‐72, Nov 2010.
[30] O. Hansson et al., "Levels of cerebrospinal fluid α-‐synuclein oligomers are increased in Parkinson's disease with dementia and dementia with Lewy bodies compared to Alzheimer's disease," (in eng), Alzheimers Res Ther, vol. 6, no. 3, p. 25, 2014.
[31] K. E. Paleologou et al., "Detection of elevated levels of soluble alpha-‐synuclein oligomers in post-‐mortem brain extracts from patients with dementia with Lewy bodies," (in eng), Brain, vol. 132, no. Pt 4, pp. 1093-‐101, Apr 2009.
[32] J. P. Anderson et al., "Phosphorylation of Ser-‐129 is the dominant pathological modification of alpha-‐synuclein in familial and sporadic Lewy body disease," (in eng), J Biol Chem, vol. 281, no. 40, pp. 29739-‐52, Oct 2006.
[33] H. Fujiwara et al., "alpha-‐Synuclein is phosphorylated in synucleinopathy lesions," (in eng), Nat Cell Biol, vol. 4, no. 2, pp. 160-‐4, Feb 2002.
[34] Y. Wang et al., "Phosphorylated α-‐synuclein in Parkinson's disease," (in eng), Sci Transl Med, vol. 4, no. 121, p. 121ra20, Feb 2012.

129
!!
CHAPTER 6 CSF Oligomeric Alpha-Synuclein Levels as A Preclinical Marker of Parkinson’s Disease: A Study in LRRK2 Mutation Carriers and Sporadic Parkinson’s Disease Cases

130
CHAPTER 6 | CSF OLIGOMERIC ALPHA-SYNUCLEIN LEVELS AS A PRECLINICAL MARKER OF PARKINSON’S DISEASE: A STUDY IN LRRK2 MUTATION CARRIERS Nour K. Majbour, MSc1,2, Jan O. Aasly, MD, PhD3,4, Eldbjørg Hustad, MD3,4, Mercy A. Thomas,
MSc1, Muneera Fayyad, MSc1, Nishant N. Vaikath, MSc1, Naser Elkum, PhD5, Wilma D. J. van
de Berg, PhD2, Takahiko Tokuda, MD, PhD6, Brit Mollenhauer, PhD7, Henk W. Berendse, MD,
PhD8, Omar M.A. El-Agnaf, PhD1
1Neurological Disorders Research Center, Qatar Biomedical Research Institute (QBRI), Hamad
Bin Khalifa University (HBKU), Education City, Qatar 2Department of Anatomy and Neurosciences, Neuroscience Campus Amsterdam, VU University
Medical Centre, Amsterdam, The Netherlands 3Department of Neuroscience, Norwegian University of Science and Technology, (NTNU),
Trondheim, Norway 4Department of Neurology, St. Olav’s Hospital, University Hospital of Trondheim, Norway 5Clinical Epidemiology, Sidra Medical and Research Center, Doha, Qatar. 6Department of Neurology, Research Institute for Geriatrics, Kyoto Prefectural University of
Medicine, Kyoto, 602-0841 Japan 7Paracelsus-Elena Clinic, Centre of Parkinsonism and Movement Disorders, Department of
Neurology (BM) and Department of Neurosurgery (CT), Paracelsus-Elena Clinic, University
Medical Center Goettingen, Kassel, Germany.aracelsus-Elena-Klinik, Kassel, Germany 8Department of Neurology, Amsterdam UMC, location VU University Medical Centre,
Amsterdam, The Netherlands
Submitted to Neurology. Jan 2019

131
Abstract
Objective: To explore the diagnostic potential of alpha-synuclein (α-syn) oligomers in
cerebrospinal fluid (CSF) from individuals with leucine-rich repeat kinase 2 (LRRK2) mutation
carriers and subjects with sporadic Parkinson’s disease (PD).
Methods: We measured the levels of CSF total- (t-), oligomeric (o-) and phosphorylated S129
(pS129-) α-syn in symptomatic (n=21) and asymptomatic (n=50) LRRK2 mutation carriers,
subjects with the clinical diagnosis of PD (n=60) and age-matched healthy controls (HC) (n=39).
Results: CSF o-α-syn levels were significantly higher in sPD patients than in HC (P<0.001) and,
in asymptomatic LRRK2 mutation carriers than in HC (P=0.006). The area under the receiver
operating characteristic curve (AUC) indicated a sensitivity of 71.7% and specificity of 76.9%,
with an AUC of 0.76 with increased ratios of CSF o-/t-α-syn in sPD compared to HC. Similarly,
sensitivity and specificity rates didn’t exceed 80% for CSF o-/t-α-syn in symptomatic LRRK2
group. Assessing ROC curves of o-/t-α-syn ratio for pure sPD patients without any cognitive
impairment, generated greater sensitivity of 83.3%, and specificity of 90.6% with an AUC of 0.84.
Interestingly, asymptomatic LRRK2 mutations carriers scored moderate based on PET data,
presented with elevated levels of CSF t-α-syn levels, whereas, the subjects scored severe reported
high levels of CSF o-α-syn.
Conclusion: Our study indicates that CSF o-α-syn are potential surrogate biomarkers for early PD
detection. Moreover, our findings suggest that cognitive impairment in PD might be a certain
phenotype with a different aSyn biomarker profile, however, future biomarkers discovery studies
should consider stratifying the selected PD cohort by excluding patients with cognitive
impairment.

132
Introduction
Our understanding of the genetic basis of Parkinson’s disease (PD) has increased tremendously
over the past twenty years. Mutations in the gene encoding alpha-synuclein (α-syn) were the first
to be associated with genetic PD. Another monogenic causative factor in PD patients is leucine-
rich repeat kinase 2 (LRRK2); its role in PD occurrence is strongly supported by more than 100
LRRK2 variants.1 Asymptomatic carriers of LRRK2 mutations constitute an optimal population for
identifying preclinical biomarkers of PD for several reasons: 1) the long preclinical gap prior to
the onset of motor symptoms, 2) the reports of dopaminergic neuronal loss demonstrated by
positron emission tomography (PET) scanning, and 3) the similarity of these individuals’ clinical
phenotype to that of patients with sporadic PD (sPD). Several research groups, including ours,
reported a significant elevation of CSF o-α-syn and α-syn phosphorylated at Ser129 (pS129-α-syn)
in PD patients compared to the levels of these oligomers in controls, suggesting their potential role
as diagnostic biomarkers in the early detection of PD.2, 3 Here, we used our previously established
in-house-developed sandwich-based ELISAs,3 aiming to determine whether levels of CSF α-syn
species, including total (t-), o- and pS129-α-syn, allow the early detection of PD in presymptomatic
cases and are associated with the nigrostriatal dopaminergic deficit measured used PET and with
clinical parameters. We measured the levels of CSF t-, o- and pS129-α-syn species in a well-
characterized Norwegian cohort of 71 subjects with LRRK2 mutations: 21 symptomatic individuals
and 50 asymptomatic mutation carriers. In parallel, we included 60 patients with sPD and 39
healthy control (HC) subjects.
Methods
Patient selection and CSF sampling
Patient selection criteria and the method of CSF collection were extensively described in previous
publications.4, 5 In total, 72 Norwegian individuals from 12 different families with LRRK2
mutations were assessed in the current study. Twenty-one patients were clinically diagnosed with
PD, whereas 50 patients were healthy, asymptomatic LRRK2 mutation carriers when enrolled in
the study. These families have been extensively described in previous reports.4, 6, 7 In addition, 60
patients with sPD and 31 age-matched HC were recruited for this study the same as LRRK2
individuals from St. Olav’s Hospital at the University Hospital of Trondheim in Norway. PD was
diagnosed according to established clinical diagnostic criteria (UK Parkinson’s Disease Society
133
Brain Bank). Disease stage was assessed according to the Hoehn and Yahr (H&Y) scale. All
patients with sPD were screened and confirmed to be negative for known LRRK2 mutations.
Patients with an age at onset of ≤50 years also tested negative for known pathogenic mutations in
Parkin and PINK1. All family members of LRRK2 patients were examined for clinical features of
PD by movement disorder specialists and found to be asymptomatic, although a few had mild
premotor signs and an increased Unified Parkinson’s Disease Rating Scale (UPDRS) score.8 The
LRRK2-mutant PD patients were taking levodopa, and some were taking dopamine agonists and/or
monoamine oxidase-B (MAO-B) inhibitors. Lumbar punctures were performed in overnight fasted
patients between 8 and 10 am. CSF samples were aliquoted in 1.2–1.5 ml low-binding tubes, and
one vial was sent for routine laboratory analysis (i.e., white and red blood cell count, total protein
and glucose levels, according to the Parkinson’s Progression Markers Initiative [PPMI] protocol),
whereas the majority of the vials were frozen fewer than 15 min after collection following
centrifugation at 2000 g at 4º C then subaliquoted and stored at -80 °C until further analysis. All
patients provided signed informed consent, and the study was approved by the Regional
Committee for Medical and Health Research Ethics.
PET scan analysis
Scanning was performed following scanning protocols as previously described.9 Within 1 year of
CSF sample collection, each subject was scanned with 3 different tracers, 18F-6-fluoro-L-dopa
(FD), as a marker for the uptake and decarboxylation of levodopa as well as the trapping of
dopamine in synaptic vesicles, 11C-(±) dihydrotetrabenazine (DTBZ), a vesicular monoamine
transporter 2 [VMAT2] ligand, and 11C-D-threomethylphenidate (MP), a dopamine transporter
[DAT] ligand. PET images were scored by the examiner as mild, moderate or severe.
Measurement of alpha-synuclein species via immunoassays
All immunoassays used to measure the different species of α-syn were developed in-house and
were thoroughly described in previous reports.3, 10, 11 Briefly, to capture t- or pS129-α-syn, a 384-
well ELISA microplate was coated with 0.1 or 0.5 µg/ml Syn-140 (a sheep anti-α-syn polyclonal
antibody) in 200 mM NaHCO3, pH 9.6 (50 µl/well) by overnight incubation at 4 °C, while 0.2
µg/ml of our mouse conformation-specific antibody, Syn-O2, was used to capture o-α-syn. After
incubation with 100 µl/well of blocking buffer (PBS-T containing 2.25% gelatin) for 2 h at 37 °C,
50 µl/well of the CSF samples (diluted 1:2 in artificial CSF) along with serial dilutions of
recombinant human t-, pS129-or o-α-syn (50 µl) were dispensed in each well, and the plate was
134
incubated at 37 °C for 2.5 h. After washing with PBS-T, 50 µl/well of 11D12 (a mouse anti-α-syn
monoclonal antibody), PS129 (a mouse anti-pS129-α-syn monoclonal antibody), or FL-140 (rabbit
polyclonal antibody, Santa Cruz Biotechnology, Santa Cruz, CA, USA), for measuring t-, o-, or
pS129-α-syn, respectively, were added to the corresponding wells and incubated at 37 °C for 2 h.
Next, the plates were washed and incubated for 2 h at 37 °C with 50 µl/well of species-appropriate
secondary antibody (goat anti-rabbit IgG HRP or donkey anti-mouse IgG HRP, Jackson
ImmunoResearch Laboratories Inc., USA, 1:20,000 dilution). After washing, the plates were
incubated with 50 µl/well of enhanced chemiluminescent substrate (Super Signal ELISA Femto,
Pierce Biotechnology, USA). The chemiluminescence, expressed in relative light units, was
immediately measured using a PerkinElmer Envision multilabel plate reader (PerkinElmer,
Finland). CSF samples were measured in a blinded fashion and randomized for analysis, with all
LRRK symptomatic/asymptomatic, PD and HC samples being tested together on the same ELISA
microplates. A series of internal controls was also run to check for run-to-run variations. The
concentrations of α-syn species in the samples were calculated using the corresponding standard
curves.
Statistical analysis
GraphPad Prism (GraphPad Prism Version 7.0a, GraphPad software, San Diego, CA) and IBM
SPSS software (version 24.0, Chicago, IL, USA) were used for the statistical analyses of the data.
Quantitative variables are expressed as the medians and interquartile ranges (IQRs) (25th and 75th
percentiles). Qualitative variables are expressed as counts or percentages and were analyzed by
Fisher’s exact test. The Mann-Whitney U test was used for comparisons among the diagnostic
groups. To evaluate the relationship between CSF α-syn species and the patients’ clinical data,
Spearman’s rho correlation analysis was used. To explore the potential diagnostic value of the
levels of CSF α-syn species and o- or pS129-/t-α-syn ratio in CSF, receiver operating characteristic
(ROC) curves were generated, and the area under the curve (AUC) was calculated. The cutoff
values were calculated using the sensitivity and specificity values that maximized Youden’s index
(sensitivity + specificity−1).

135
Results
Patient population and demographics
The patient groups and demographic details are summarized in Table 1. Twenty-one of the 71
subjects (30%) with LRRK2 mutations analyzed had a manifest PD and were carrying either the
most common LRRK2 mutation, G2019S, or a different LRRK2 mutation, N1437H. These 21
subjects had a mean age of 58.0 ± 11 years. Fifty subjects of the 71 subjects (70%) were free of
symptoms of PD at the time of CSF sample collection. These asymptomatic LRRK2 mutation
carriers had a mean age of 57.2 ± 13.4 years. As comparison, we included samples from 60
manifest PD without genetic mutation. And 39 age-matched HCs were included in this study. No
significant difference was noted in disease duration between the symptomatic LRRK2 mutation
carriers and the PD patients. Moreover, no difference was found between the groups with regard
to the routine CSF levels of white cell count-red as well as the total protein, albumin, and glucose
levels, including the plasma glucose level. Controlling for age and sex did not significantly alter
any results.
Table 1| Demographics and CSF biomarkers by diagnostic group
CSF alpha-synuclein levels
Comparisons of the CSF biomarker levels among the different diagnostic groups are summarized
in Table 2.
Table 2. a| CSF biomarkers among different diagnostic groups (Median and Interquartile range)
Table&1|&Demographics&and&CSF&biomarkers&by&diagnostic&groupHealthy(Controls
(n=(39)
sporadic(PD
(n=60)
LRRK2(asymptomatic(carriers
(n=(50)
LRRK2(symptomatic(carriers(
(n=(21)
Age((yrs) 50((18E80) 57((26E80) 57((27E83) 58((45E80)
Gender M=(21,(F=18 M=(34,(F=(26 M=(25,(F=(27 M=(4,(F=(17
Disease(Duration((yrs) N/A 3.5((1E6) N/A 7((5.3E20)
MoCA 27((27E29) 27((25E28) 27((26E28) 26((24E27)
UPDRSEIII N/A 23.5((19E28) 3((0.5E5) 23(((17E25)
HEY(grade N/A 2((2E2) 0((0EE0) 2((2E3)
*(Median(and(Interquartile(range(for(continious(values
Healthy(Controls(n=(39)
sporadic(PD(n=60)
LRRK2(asymptomatic(carriers(n=(50)
LRRK2(symptomatic(carriers((n=(21)
tB⍺Bsyn((ng/ml) 0.79((0.58B1.08) 0.57((0.47B0.70) 0.64((0.43B0.8) 0.61((0.35B0.80)oB⍺Bsyn((pg/ml) 161((148B186) 188((171B220) 182((157B220) 162((145B183)pS129B⍺Bsyn((pg/ml) 118((101B149) 139((114B163) 120((94B150) 122((108B156)oB/tB⍺Bsyn(% 22.6((15.4B27.4) 33.1((24.3B41.4) 31.3((21.6B45.9) 28.7((20.9B42.6)pS129B/tB⍺Bsyn(% 15((10.9B21.1) 25.4((16.4B30.2) 20.3((13B29.3) 24.4((18.1B29.7)

136
Table 2. b| CSF biomarkers among different diagnostic groups. One way ANOVA was used for
comparisons among all the groups, while Mann-Whitney U test was used for comparisons between
the two groups as illustrated in the table.
In comparison to HC (median and IQR = 0.79 (0.58-1.08) ng/ml, n = 39), levels of CSF t-α-syn
were significantly lower in the sPD (median and IQR = 0.57 (0.47-0.70) ng/ml, n = 60) (P = 0.002,
Mann-Whitney U test; Figure 1A), asymptomatic LRRK2 (median and IQR = 0.64 (0.43-0.8)
ng/ml, n = 50) (P < 0.0215, Mann-Whitney U test; Figure 1A), and symptomatic LRRK2 (median
and IQR = 0.61 (0.35-0.80) ng/ml, n = 21) (P < 0.0103, Mann-Whitney U test) patients (Figure
1A). There were no differences in the concentrations of CSF t-α-syn between the groups of sPD,
asymptomatic LRRK2 and symptomatic LRRK2 cases.
In contrast and as shown in Figure 1B, the levels of CSF o-α-syn were significantly higher
in the sPD group than in the HC group (median and IQR = 188 (171-220) pg/ml, n = 60) (P <
0.0001, Mann-Whitney U test; Figure 1B). Interestingly, CSF o-α-syn levels were also
significantly higher in the asymptomatic LRRK2 group than in the HC group (median and IQR =
182 (157-220) pg/ml, n = 50) (P < 0.006, Mann-Whitney U test; Figure 1B). Surprisingly, levels
of CSF o-α-syn in the symptomatic LRRK2 mutation carriers (median and IQR = 162 (145-183)
pg/ml, n = 21) were similar to those in the HC (median and IQR = 161 (148-186) pg/ml, n=39) (P
= 0.905, Mann-Whitney U test; Figure 1B), but significantly lower than CSF o-α-syn levels in
patients with sPD (P = 0.0008, Mann-Whitney U test) and in asymptomatic LRRK2 mutation
carriers (median and IQR = 182 (157-220) pg/ml, n=50).
Examination of CSF levels of pS129-α-syn revealed that CSF pS129 levels were higher in
patients with sPD and symptomatic LRRK2 compared to HC, but this was only significant for
sPD vs. HC (median and IQR = 139 (114-163) pg/ml, n=60) (P = 0.0281, Mann-Whitney U test;
Figure 1C).
Table&2.b|&CSF&biomarkers&among&different&diagnostic&groups.&One&way&ANOVA&was&used&for&comparisions&among&all&thr&groups,&while&MannDWhitney&U&test&was&used&for&comparisons&between&the&two&groups&as&illustrated&in&the&table.
All#groups sPD#vs.#HC LRRK24HC#vs#HC LRRK24PD#vs.#HC LRRK24PD#vs.#sPDLRRK24PD#vs.#LRRK24HC
t4⍺4syn#(ng/ml) 0.0099 0.002 0.0215 0.0103 0.4982 0.3226o4⍺4syn#(pg/ml) 0.0001 <0.0001 0.006 0.9052 0.0008 0.0264pS1294⍺4syn#(pg/ml) 0.0835 0.0281 0.9338 0.5156 0.3414 0.5947o4/t4⍺4syn#% 0.0002 <0.0001 0.0012 0.0058 0.5365 0.9437pS1294/t4⍺4syn#% 0.0013 0.0003 0.0595 0.0019 0.862 0.1016
P&value

137
The ratio of o-α-syn to t-α-syn (o-/t-α-syn ratio) in the CSF was significantly higher in the
sPD (median and IQR = 33.1 (24.3-41.4) %, n = 60) (P < 0.0001, Mann-Whitney U test),
asymptomatic LRRK2 (median and IQR = 31.3 (21.6-45.9) %, n = 50) (P < 0.0012, Mann-Whitney
U test), and symptomatic LRRK2 (median and IQR = 28.7 (20.9-42.6) %, n = 21) (P < 0.0058,
Mann-Whitney U test) groups than in the age-matched HC group (median and IQR = 22.6 (15.4-
27.4) %, n = 39) (Figure 1D). The CSF pS129-/t-a-syn ratio was significantly higher in sPD
(median and IQR = 25.4 (16.4-30.2) %, n = 60) (P = 0.0003, Mann-Whitney U test), and in
symptomatic LRRK2 (median and IQR = 24.4 (18.1-29.7) %, n = 21) (P = 0.0019, Mann-Whitney
U test) groups than in the age-matched HC group (median and IQR = 15 (10.9-21.1) %, n = 39)
(Figure 1E), but was not significantly higher in asymptomatic LRRK2 (median and IQR = 20.3
(13-29.3) %, n = 50) (P = 0.0595, Mann-Whitney U test; Figure 1E).
Figure 1. Box and Whisker plots of CSF α-syn species levels among the diagnostic groups
*****
***
(A) *****
*****
(B)
***
(C)
****
****
(D)

138
CSF levels of total α-synuclein (ng/ml), (B)
CSF levels of oligomeric α-synuclein (pg/ml),
(C) CSF levels of pSer129-α-synuclein
(pg/ml), (D) CSF oligomeric/total α-synuclein
ratio %, (E) CSF phosphorylated S129/total α-
synuclein ratio %. The line through the middle
of the boxes corresponds to the median and the
lower and the upper lines to the 25th and 75th
percentile, respectively. The whiskers extend
from the 5th percentile on the bottom to the
95th percentile on top. Differences between
groups were assessed using Mann-Whitney U
–test, adjusted for age and gender. HC:
Healthy controls, sPD: sporadic PD, LRRK2-
HC: asymptomatic LRRK2 carriers, LRRK2-
PD: symptomatic LRRK2 carriers. * p<0.05,
** p<0.01, *** p<0.001
Correlations between CSF alpha-synuclein levels and clinical parameters
Correlations between CSF levels of α-syn species and the clinical profiles of the patients in both
sPD and symptomatic LRRK2 groups are summarized in Table 3. Higher levels of CSF t-α-syn
correlated with: worse cognitive function as assessed by the Montreal Cognitive Assessment
(MoCA) score (r= -0.48, P<0.001), longer disease duration (r= 0.26, P<0.05), in the sPD group,
and stronger impairment of motor functions as demonstrated by the UPDRS-III score (r= 0.52,
P<0. 01) in symptomatic LRRK2 carriers. However, there were no correlations between CSF o-
or pS129-α-syn levels and the clinical parameters we analyzed (Table 3).
***
**
(E)

139
Table 3| Spearman correlations between CSF alpha-synuclein species and clinical parameters
Subgroup analysis
PET image analysis
We assessed the correlation of PET data with the levels of CSF α-syn species in asymptomatic
LRRK2 mutation carriers (Table 4 and Figure 2). Based on their PET data, asymptomatic LRRK2
subjects were classified into four impairment stages by visual inspection: normal (n= 14), mild (n=
15), moderate (n= 14) and severe (n=7). Interestingly, by exploring the levels of the CSF α-syn
species among the different subgroups, we found that CSF t-α-syn levels were significantly higher
(P < 0.041, Kruskal-Wallis test; Figure 2A) when asymptomatic LRRK2 subjects were moderately
impaired, whereas subjects classified as severely impaired by PET scan analysis exhibited higher
levels of CSF o-α-syn (P < 0.048, Kruskal-Wallis test; Figure 2B). However, CSF pS129-α-syn
levels did not significantly change across the different stages (P = 0.438, Kruskal-Wallis test,
Figure 2C). The differences in the o-/t-α-syn ratio were more pronounced among the subgroups (P
= 0.02, Kruskal-Wallis test; Figure 2D) than the differences in the CSF pS129-/t-α-syn ratio (P =
0.678, Kruskal-Wallis test, Figure 2E).
Table&3|&Spearman&correlations&between&CSF&alpah7synuclein&species&and&clinical¶metersDisease&Duration H&Y UPDRS&III MoCA
Spordaic&PDt"⍺"syn&(ng/ml) 0.26* 0.14 0.16 "0.48***o"⍺"syn&(pg/ml) "0.04 "0.04 0.07 0.15pS129"⍺"syn&(pg/ml) 0.21 0.18 0.18 "0.10Symptomatic& LRRK2 &carrierst"⍺"syn -0.10 0.39 0.58** -0.42o"⍺"syn 0.32 0.35 0.33 "0.33pS129"⍺"syn 0.19 0.28 0.32 "0.15

140
Figure 2. Box and Whisker plots of CSF α-syn species in asymptomatic LRRK2 carriers
subgroups based on PET image analysis.
(A) CSF levels of total α-synuclein (ng/ml), (B) CSF levels of oligomeric α-synuclein (pg/ml), (C) CSF levels of pSer129-α-synuclein (pg/ml). The line through the middle of the boxes corresponds to the median and the lower and the upper lines to the 25th and 75th percentile, respectively. The whiskers extend from the 5th percentile on the bottom to the 95th percentile on top. Differences between groups were assessed using Kruskal-Wallis test, adjusted for age and gender. * p<0.05, ** p<0.01, *** p<0.001.
(A) *
(B)
(C) (D) *
(E)

141
Table 4 | Biomarkers values in asymptomatic LRRK2 carriers’ subgroups (Median and
Interquartile range)
ROC analysis
ROC analysis was carried out for the CSF α-syn species, with each marker analyzed alone or in
combination with other markers to assess the power to discriminate sPD and LRRK2 groups from
the HC group (Figure 3). CSF o-α-syn achieved the best diagnostic performance as a single marker
to differentiate patients with sPD from HC (AUC= 0.74, sensitivity= 65%, specificity= 71%), with
CSF pS129-α-syn achieving the second highest diagnostic performance (AUC= 0.63, sensitivity=
61.7%, specificity= 71.5%). However, the o-/t-α-syn and pS129-/t-α-syn ratios performed even
better than the species alone, with AUCs of 0.76 and 0.71, sensitivities of up to 71.7% and 60%,
and specificities of up to 76.9% and 74.4%, respectively (see Figure 3A). The sensitivity and
specificity to discriminate symptomatic LRRK2 mutation carriers from HC were relatively poor
for most α-syn species alone (Figure 3C). However, the o-/t-α-syn and pS129-/t-α-syn ratios
achieved AUCs of 0.71 and 0.74, with sensitivities up to 61.9% and 71.4%, and specificities of up
to 71.4% and 66.7 respectively (Figure 3C). However, the sensitivity and specificity for CSF α-
syn species either alone or in combination to discriminate the asymptomatic LRRK2 group from
the HC group were relatively poor (Figure 3B).
Table&4&|&Biomarkers&values&in&asymptomatic&LRRK2&carriers&&subgroups&(Median&and&Interquatrile&range)Normal'(n=14) Mild'(n=15) Moderate'(n=14) Severe'(n=7) All'groups
t<⍺<syn'(ng/ml) 0.53'(0.29<'0.80) 0.58'(0.39<1.39) 0.76'(0.50<1.42)' 0.7'(0.28<'1.02) 0.0418o<⍺<syn'(pg/ml) 194'(155<'264) 178'(130<281) 160'(138<259) 192'(161<316) 0.0485pS129<⍺<syn'(pg/ml) 119'(62<'172) 110'(67<208) 135'(74<234) 120'(94<146) 0.4382o</t<⍺<syn'% 40.6'(19.3<91.7) 28.6'(13.0<61.6)' 22.8'(11.8<49.6) 41.9'(18.6<62.0) 0.0208pS129</t<⍺<syn'% 19.7'(7.9<53.6) 22.45'(5.7<48.9) 20.5'(6.2<40.9) 20'(12.0<36.3) 0.6782
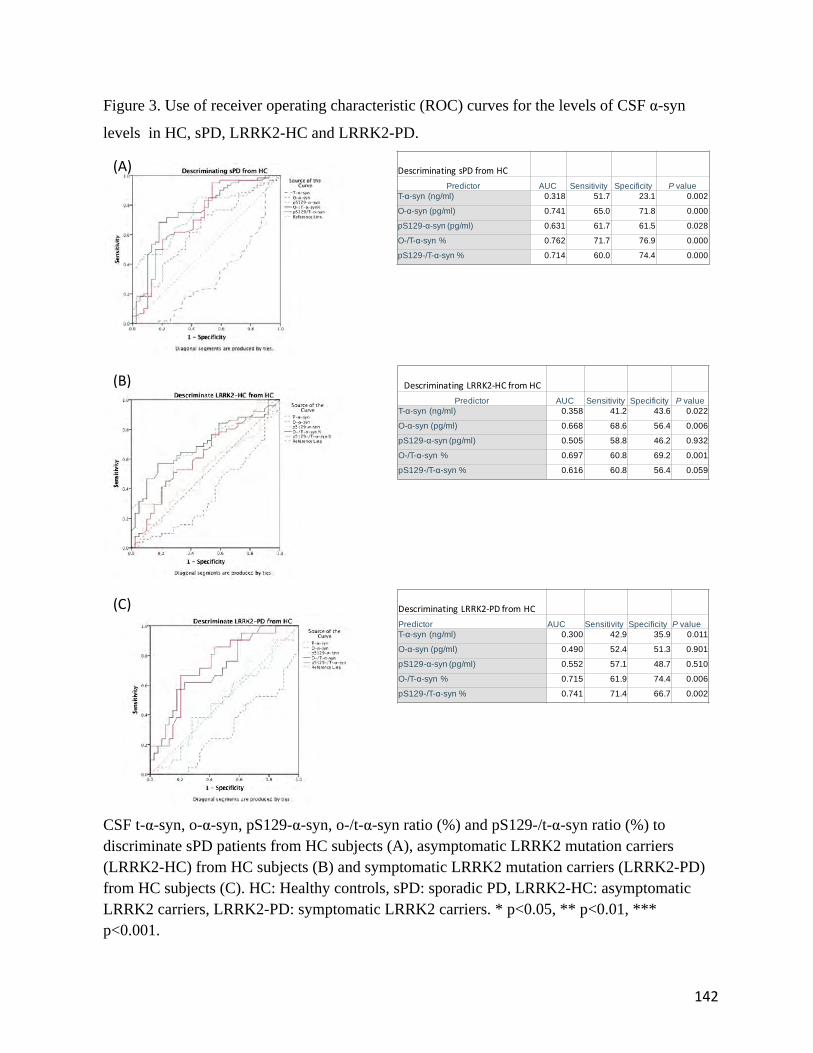
142
Figure 3. Use of receiver operating characteristic (ROC) curves for the levels of CSF α-syn
levels in HC, sPD, LRRK2-HC and LRRK2-PD.
CSF t-α-syn, o-α-syn, pS129-α-syn, o-/t-α-syn ratio (%) and pS129-/t-α-syn ratio (%) to discriminate sPD patients from HC subjects (A), asymptomatic LRRK2 mutation carriers (LRRK2-HC) from HC subjects (B) and symptomatic LRRK2 mutation carriers (LRRK2-PD) from HC subjects (C). HC: Healthy controls, sPD: sporadic PD, LRRK2-HC: asymptomatic LRRK2 carriers, LRRK2-PD: symptomatic LRRK2 carriers. * p<0.05, ** p<0.01, *** p<0.001.
Descriminating,sPD,from,HCPredictor AUC Sensitivity Specificity P value
T-α-syn (ng/ml) 0.318 51.7 23.1 0.002
O-α-syn (pg/ml) 0.741 65.0 71.8 0.000
pS129-α-syn (pg/ml) 0.631 61.7 61.5 0.028
O-/T-α-syn % 0.762 71.7 76.9 0.000
pS129-/T-α-syn % 0.714 60.0 74.4 0.000
Descriminating,LRRK21HC,from,HCPredictor AUC Sensitivity Specificity P value
T-α-syn (ng/ml) 0.358 41.2 43.6 0.022
O-α-syn (pg/ml) 0.668 68.6 56.4 0.006
pS129-α-syn (pg/ml) 0.505 58.8 46.2 0.932
O-/T-α-syn % 0.697 60.8 69.2 0.001
pS129-/T-α-syn % 0.616 60.8 56.4 0.059
Descriminating,LRRK21PD,from,HCPredictor AUC Sensitivity Specificity P valueT-α-syn (ng/ml) 0.300 42.9 35.9 0.011
O-α-syn (pg/ml) 0.490 52.4 51.3 0.901
pS129-α-syn (pg/ml) 0.552 57.1 48.7 0.510
O-/T-α-syn % 0.715 61.9 74.4 0.006
pS129-/T-α-syn % 0.741 71.4 66.7 0.002
(A)
(B)
(C)
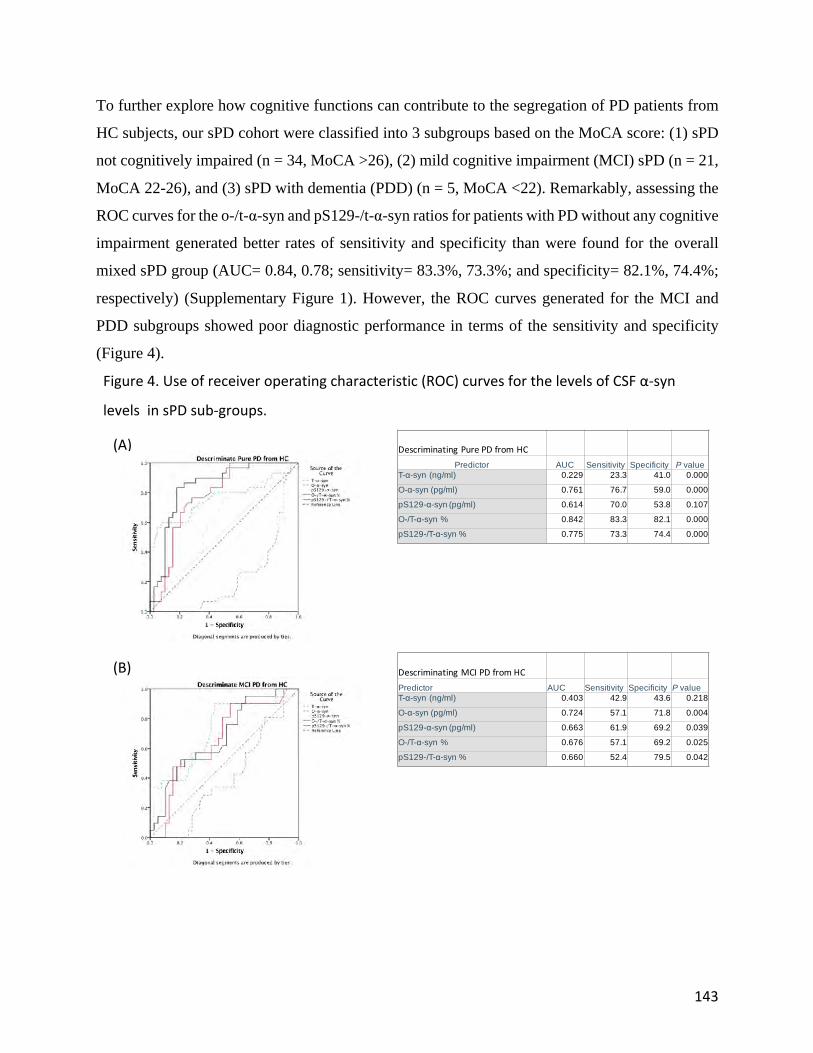
143
To further explore how cognitive functions can contribute to the segregation of PD patients from
HC subjects, our sPD cohort were classified into 3 subgroups based on the MoCA score: (1) sPD
not cognitively impaired (n = 34, MoCA >26), (2) mild cognitive impairment (MCI) sPD (n = 21,
MoCA 22-26), and (3) sPD with dementia (PDD) (n = 5, MoCA <22). Remarkably, assessing the
ROC curves for the o-/t-α-syn and pS129-/t-α-syn ratios for patients with PD without any cognitive
impairment generated better rates of sensitivity and specificity than were found for the overall
mixed sPD group (AUC= 0.84, 0.78; sensitivity= 83.3%, 73.3%; and specificity= 82.1%, 74.4%;
respectively) (Supplementary Figure 1). However, the ROC curves generated for the MCI and
PDD subgroups showed poor diagnostic performance in terms of the sensitivity and specificity
(Figure 4).
Figure 4. Use of receiver operating characteristic (ROC) curves for the levels of CSF α-‐syn
levels in sPD sub-‐groups.
Descriminating,Pure,PD,from,HCPredictor AUC Sensitivity Specificity P value
T-α-syn (ng/ml) 0.229 23.3 41.0 0.000
O-α-syn (pg/ml) 0.761 76.7 59.0 0.000
pS129-α-syn (pg/ml) 0.614 70.0 53.8 0.107
O-/T-α-syn % 0.842 83.3 82.1 0.000
pS129-/T-α-syn % 0.775 73.3 74.4 0.000
Descriminating,MCI,PD,from,HCPredictor AUC Sensitivity Specificity P valueT-α-syn (ng/ml) 0.403 42.9 43.6 0.218
O-α-syn (pg/ml) 0.724 57.1 71.8 0.004
pS129-α-syn (pg/ml) 0.663 61.9 69.2 0.039
O-/T-α-syn % 0.676 57.1 69.2 0.025
pS129-/T-α-syn % 0.660 52.4 79.5 0.042
(A)
(B)
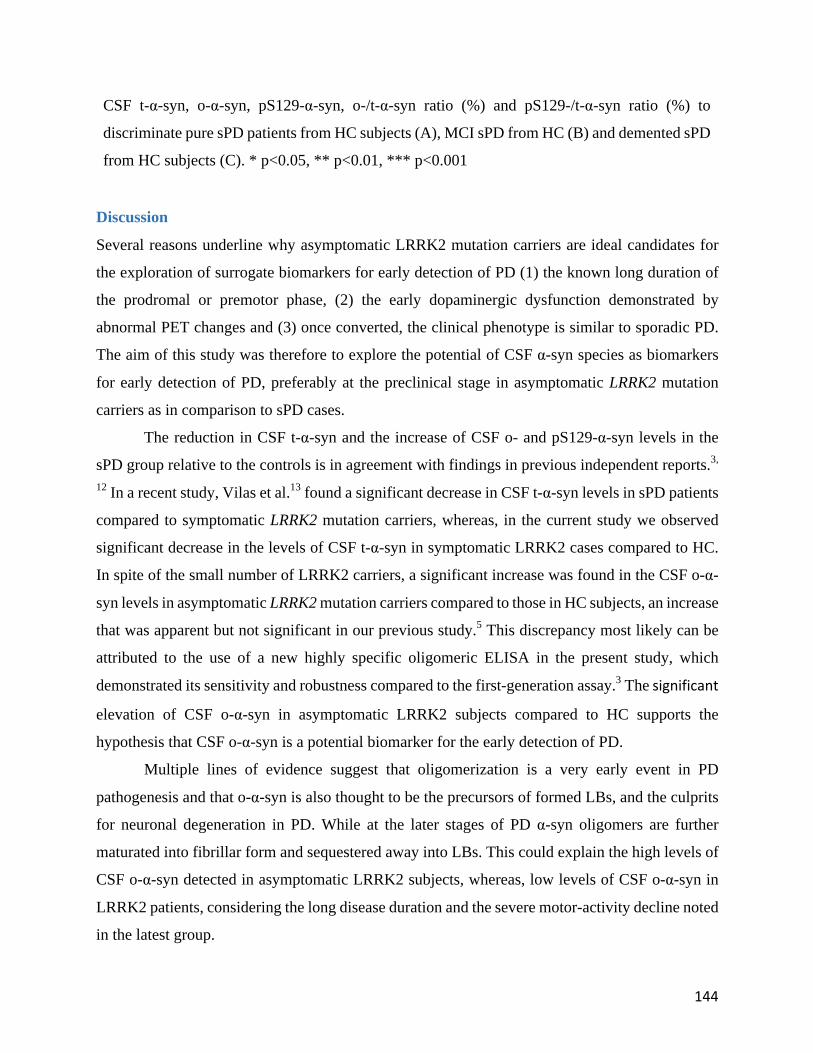
144
CSF t-α-syn, o-α-syn, pS129-α-syn, o-/t-α-syn ratio (%) and pS129-/t-α-syn ratio (%) to
discriminate pure sPD patients from HC subjects (A), MCI sPD from HC (B) and demented sPD
from HC subjects (C). * p<0.05, ** p<0.01, *** p<0.001
Discussion
Several reasons underline why asymptomatic LRRK2 mutation carriers are ideal candidates for
the exploration of surrogate biomarkers for early detection of PD (1) the known long duration of
the prodromal or premotor phase, (2) the early dopaminergic dysfunction demonstrated by
abnormal PET changes and (3) once converted, the clinical phenotype is similar to sporadic PD.
The aim of this study was therefore to explore the potential of CSF α-syn species as biomarkers
for early detection of PD, preferably at the preclinical stage in asymptomatic LRRK2 mutation
carriers as in comparison to sPD cases.
The reduction in CSF t-α-syn and the increase of CSF o- and pS129-α-syn levels in the
sPD group relative to the controls is in agreement with findings in previous independent reports.3,
12 In a recent study, Vilas et al.13 found a significant decrease in CSF t-α-syn levels in sPD patients
compared to symptomatic LRRK2 mutation carriers, whereas, in the current study we observed
significant decrease in the levels of CSF t-α-syn in symptomatic LRRK2 cases compared to HC.
In spite of the small number of LRRK2 carriers, a significant increase was found in the CSF o-α-
syn levels in asymptomatic LRRK2 mutation carriers compared to those in HC subjects, an increase
that was apparent but not significant in our previous study.5 This discrepancy most likely can be
attributed to the use of a new highly specific oligomeric ELISA in the present study, which
demonstrated its sensitivity and robustness compared to the first-generation assay.3 The significant
elevation of CSF o-α-syn in asymptomatic LRRK2 subjects compared to HC supports the
hypothesis that CSF o-α-syn is a potential biomarker for the early detection of PD.
Multiple lines of evidence suggest that oligomerization is a very early event in PD
pathogenesis and that o-α-syn is also thought to be the precursors of formed LBs, and the culprits
for neuronal degeneration in PD. While at the later stages of PD α-syn oligomers are further
maturated into fibrillar form and sequestered away into LBs. This could explain the high levels of
CSF o-α-syn detected in asymptomatic LRRK2 subjects, whereas, low levels of CSF o-α-syn in
LRRK2 patients, considering the long disease duration and the severe motor-activity decline noted
in the latest group.

145
The value of using a panel of different markers rather than a single marker has become
clearer in the clinical practice and is well important also due to the clinical heterogeneity of PD.
When we combined the analyses of CSF t- and o-α-syn and measured the ratio of these species,
the AUC value representing the ability to discriminate between patients with sPD and HC was
0.74 for CSF o-α-syn alone but improved to 0.76 for the o-/t-α-syn ratio. Similarly, the AUC
increased from 0.63 for CSF pS129-α-syn alone to 0.71 for the ratio. However, the o-/t-α-syn and
pS129-/t-α-syn ratios exhibited AUCs of 0.71 and 0.74, respectively, to discriminate asymptomatic
LRRK2 mutation carriers from HC.
Several cross-sectional and longitudinal cohort studies correlated increased levels of CSF
t-α-syn with cognitive decline or dementia3, 14 but not with motor impairment in PD. Elevated
levels of CSF t-α-syn have been reported in prion disease and Alzheimer’s disease patients
compared to those in HC, and t-α-syn levels have been positively correlated with tau species and
negatively correlated with the Mini-Mental State Examination (MMSE) score in Alzheimer’s
disease.15-17 Therefore, we sub-grouped sPD patients based on their MoCA scores and assessed
the power of CSF α-syn forms in segregating pure PD patients with no signs of cognitive decline
from HC group. As expected, MCI and PDD patients corresponded to higher CSF t-α-syn levels
compared to pure PD patients. Interestingly, CSF o-/t-α-syn ratio displayed better diagnostic
performance at discriminating pure PD patients rather than the mixed sPD population from HC
subjects. This observation highlights the significant role of CSF o-/t-α-syn ratio in stratifying PD
patients for biomarkers discovery and perhaps for clinical trials that specifically target α-syn.
Future studies in large-scale, prospective and well-controlled studies, where presymptomatic
LRRK2 subjects are followed up longitudinally up to the appearance of the clinical symptoms such
as the ongoing PPMI will further validate the findings reported in our current study.
In summary, the assessment of the diagnostic performance of CSF α-syn species across
different study groups, CSF o-α-syn were significantly elevated in asymptomatic LRRK2 subjects
compared to symptomatic LRRK2 patients. CSF o-/t-α-syn ratio attained better sensitivity and
specificity scores rather than single species, further supporting the optimum diagnostic utility of
CSF biomarkers ratios. Although weak, but present, CSF o-α-syn biomarkers correlated with PET
scan images in asymptomatic LRRK2 mutation carriers. Importantly, our findings suggest that
future biomarkers discovery studies should consider stratifying the selected PD cohort by
separating patients with cognitive impairment and possibly other phenotypes, that have to be

146
identified. To account for the different phenotype and the vast heterogeneity of PD also other
marker candidates need to be identified that can add to the synuclein marker presented here. Future
studies will further validate our findings in larger cohorts, where asymptomatic LRRK2 subjects
and early diagnosed sPD patients are followed up longitudinally to detect the early appearance of
motor symptoms and track the disease progression.
Acknowledgments
The authors thank all patients and healthy subjects, lab manager Dr. Houari Abdesselem, and
funding agencies. This work would have not been possible without their valuable contribution.
Author contributions
Study design and supervision: N.M, O.E. Conduction of the experiments: N.M, M.T., M.F. and
N.V. Clinical data collection: J.A. and E.H. Data analysis: N.E. and N.M. Writing the first draft of
the manuscript and incorporating revisions from other authors: N.M. Data interpretation and
critical revision of the manuscript for important intellectual content: N.M, J.A., W.B., T.T., B.M.,
H.B., and O.E. Final review of the draft and approval to submit for publication: O.E. All authors
read and approved the final manuscript.

147
References
1. Wu YR, Chang KH, Chang WT, et al. Genetic variants ofLRRK2 in Taiwanese Parkinson's disease. PloS one 2013;8:e82001. 2. Stewart T, Sossi V, Aasly JO, et al. Phosphorylated α-‐synuclein in Parkinson's disease: correlation depends on disease severity. Acta Neuropathol Commun 2015;3:7. 3. Majbour NK, Vaikath NN, van Dijk KD, et al. Oligomeric and phosphorylated alpha-‐synuclein as potential CSF biomarkers for Parkinson's disease. Molecular neurodegeneration 2016;11:7. 4. Aasly JO, Toft M, Fernandez-‐Mata I, et al. Clinical features of LRRK2-‐associated Parkinson's disease in central Norway. Annals of neurology 2005;57:762-‐765. 5. Aasly JO, Johansen KK, Brønstad G, et al. Elevated levels of cerebrospinal fluid α-‐synuclein oligomers in healthy asymptomatic LRRK2 mutation carriers. Front Aging Neurosci 2014;6:248-‐248. 6. Aasly JO, Vilarino-‐Guell C, Dachsel JC, et al. Novel pathogenic LRRK2 p.Asn1437His substitution in familial Parkinson's disease. Movement disorders : official journal of the Movement Disorder Society 2010;25:2156-‐2163. 7. Johansen KK, Hasselberg K, White LR, Farrer MJ, Aasly JO. Genealogical studies in LRRK2-‐associated Parkinson's disease in central Norway. Parkinsonism & related disorders 2010;16:527-‐530. 8. Johansen KK, White LR, Farrer MJ, Aasly JO. Subclinical signs in LRRK2 mutation carriers. Parkinsonism & related disorders 2011;17:528-‐532. 9. Sossi V, de la Fuente-‐Fernandez R, Nandhagopal R, et al. Dopamine turnover increases in asymptomatic LRRK2 mutations carriers. Movement disorders : official journal of the Movement Disorder Society 2010;25:2717-‐2723. 10. Vaikath NN, Majbour NK, Paleologou KE, et al. Generation and characterization of novel conformation-‐specific monoclonal antibodies for alpha-‐synuclein pathology. Neurobiology of disease 2015;79:81-‐99. 11. Majbour NK, Vaikath NN, Eusebi P, et al. Longitudinal changes in CSF alpha-‐synuclein species reflect Parkinson's disease progression. Movement disorders : official journal of the Movement Disorder Society 2016;31:1535-‐1542. 12. Park MJ, Cheon S-‐M, Bae H-‐R, Kim S-‐H, Kim JW. Elevated levels of α-‐synuclein oligomer in the cerebrospinal fluid of drug-‐naïve patients with Parkinson's disease. J Clin Neurol 2011;7:215-‐222. 13. Vilas et al. 14. Stewart T, Liu C, Ginghina C, et al. Cerebrospinal fluid α-‐synuclein predicts cognitive decline in Parkinson disease progression in the DATATOP cohort. Am J Pathol 2014;184:966-‐975. 15. Majbour NK, Chiasserini D, Vaikath NN, et al. Increased levels of CSF total but not oligomeric or phosphorylated forms of alpha-‐synuclein in patients diagnosed with probable Alzheimer's disease. Sci Rep 2017;7:40263-‐40263. 16. Kasai T, Tokuda T, Ishii R, et al. Increased alpha-‐synuclein levels in the cerebrospinal fluid of patients with Creutzfeldt-‐Jakob disease. Journal of neurology 2014;261:1203-‐1209.

148
17. Llorens F, Kruse N, Schmitz M, et al. Evaluation of alpha-‐synuclein as a novel cerebrospinal fluid biomarker in different forms of prion diseases. Alzheimer's & dementia : the journal of the Alzheimer's Association 2017;13:710-‐719.

149
!!
CHAPTER 7
SUMMARY & GENERAL DISCUSSION

150
CHAPTER 7 | SUMMARY & GENERAL DISCUSSION Biomarkers for Parkinson’s disease (PD) are of paramount importance, since the clinical symptoms are
often nonspecific and show overlap with other neurodegenerative diseases, the clinical progression is highly
variable, and multiple clinical phenotypes exist for the same disease [1]. Primary endpoints of most clinical
trials in PD depend on measures of motor and cognitive impairment, which are critically hindered by a lack
of disease specificity or sensitivity [2]. Biomarkers reflecting the underlying disease mechanisms at the
molecular level might prove useful in improving diagnostic accuracy, monitoring disease progression, and
serving as surrogate endpoints in clinical trials. However, at this point we are still far beyond having solid
biomarkers for PD.
In this thesis, we address the challenges for the identification of informative body fluid biomarkers for PD,
and we highlight the effort made to develop robust immunoassays targeting different species of alpha-
synuclein (α-syn), aiming to provide a panel of disease-reflecting biomarkers for the early diagnosis of PD,
and for the monitoring of disease progression. The recognition that α-syn protein is abundant in Lewy
bodies (LBs) [3], the finding that mutations in the gene encoding α-syn protein (SNCA) [4], as well as that
duplication and triplication of this gene lead to early-onset, familial PD [5], and the reports of transgenic
flies and animals with human wild-type or mutant α-synuclein genes developing neuronal dysfunction and
PD-like pathology [6] were behind the growing interest in α-syn as a critical player in PD pathogenesis.
After a 20-year journey of α-syn research [7], we have come to understand that α-syn can adopt several
different pathological conformations. In addition, α-syn can be detected in extracellular fluids, such as CSF,
blood and saliva [8, 9]. These findings prompted us to explore the role of α-syn as a diagnostic and
progression biomarker for PD.
In this chapter, we recount and discuss our discoveries from the previous chapters of this thesis. Thereafter,
we summarize our conclusions concerning the potential role of α-syn species as diagnostic and progression
biomarkers for PD. We then describe how our findings can facilitate reaching the goal of an early diagnosis
of PD and pave the way towards the development of more effective therapeutic strategies for the disease.
At the end of the chapter, we comment on future directions for biomarker discovery in PD and related
disorders.
In Chapter 1, we reviewed the progress made to date towards the development and validation of body fluid
biomarkers to improve the diagnosis and treatment of PD. Despite the progress made in the past decades in
understanding the etiology of PD [10], the diagnosis still depends on clinical criteria, hindering the early
detection of a disease that has a long prodromal or premotor phase. The existing literature was reviewed
looking for the answer to the most important question; What might be the ideal biomarker for PD? While
the answer is yet to be found, there are reasons to be believe that we are getting closer to that goal. Perhaps,

151
the most insightful conclusions made in Chapter 1, are: 1) a panel of biomarkers rather than a single marker
is the way forward, 2) some biomarkers better differentiate PD from other forms of parkinsonism (NF-L
levels), while others better predict PD progression (CSF t-a-syn, CSF o-a-syn), 3) it is important to adhere
to strictly and thoroughly standardized protocols for body fluid sample collection and processing to reach
consistent results.
Considering the minute levels of the different species of α-syn in body fluids, studying their presence in
different biological compartments of the human body in association with the pathophysiology of PD
demands robust tools with high specificity and affinity. The optimal way to address these challenges was
through the generation of conformation-specific monoclonal antibodies (mAbs) that can specifically target
PD pathology. This aim was successfully achieved in Chapter 2, where we described the generation and
characterization of conformation-specific mAbs against α-syn aggregates. Our mAbs were generated
following the hybridoma technology, where recombinant α-syn aggregates were used to immunize female
balb/C mice. Only IgG isotype clones that showed specificity towards α-syn aggregates were selected for
further characterization. The specificity of the mAbs towards α-syn aggregates was assessed by means of
inhibition ELISA, dot blotting, and preadsorption experiments. Our mAbs did not cross-react with
monomeric or fibrillar forms of β- or γ-syn, or any other amyloidogenic proteins or peptides such as Aβ,
Tau40, IAPP or ABri. This clearly established that although our mAbs were raised against a conformational
epitope, they are still highly selective, unlike many other conformation-specific mAbs that recognize the
conformation of multiple amyloid proteins [11]. To ensure that the affinity of our mAbs towards α-syn
aggregates would outreach their peer antibodies, surface plasmon resonance analysis was deployed where
most of our antibodies showed affinity towards α-syn fibrils in the picomolar range. In an attempt to acquire
more details about the epitope of our mAbs, pepscan using a peptide library spanning the entire α-syn
sequence was performed. MAbs exhibited very weak reactivity for the C-terminal peptide spanning the α-
syn sequence between amino acids 127 and 140, confirming that our mAbs do not recognize linear peptides
and that the C-terminus of α-syn may be a part of the complex conformational epitope. The potential of the
mAbs was additionally explored by staining human brain sections of patients with PD, dementia with Lewy
bodies (DLB), Alzheimer’s disease (AD), and multiple system atrophy (MSA) along with healthy control
cases. Immunohistochemical analysis showed that our mAbs were able to recognize α-syn pathology in
synucleinopathies, as well as identify pathological structures that were not detected by other commercially
available antibodies. In summary, Chapter 2 detailed the generation and characterization of six novel
conformation-specific mAbs against PD pathology. These mAbs can either be exploited to develop
immunoassays that may serve as diagnostic tools for PD, or be engineered to serve as therapeutic agents in
the form of vaccines in the field of passive immunotherapy [12].

152
Our quest for developing robust tools that can improve our understanding of PD pathology did not stop
there. In Chapter 3, we went on to use the mAbs described in Chapter 2 for the development of
quantitative analytical methods, which resulted in highly sensitive and specific enzyme-linked
immunosorbent assays (ELISA). In this chapter, we additionally reported the characterization of more
mAbs (11D12, and PS129), as well as our polyclonal antibody Syn-140. We also elaborated on the
sensitivity and specificity of the three ELISA assays that were developed to capture total- (t-), oligomeric-
(o-), or phosphorylated S129 (p-S129-) a-syn. Chapter 3 highlights the value of adding a biochemical test
to the diagnostic procedures in PD to overcome the limitations of current clinical criteria and reduce the
high rates of misdiagnosis in the early stages of the disease. We explored the potential of our novel assays
for the discovery of CSF biomarkers in a Dutch cohort of PD patients and age matched healthy controls.
Analyses of this cross-sectional cohort revealed reduced CSF t-α-syn, and elevated CSF o- and p-S129-α-
syn levels in PD compared to healthy controls. Highlighting the diagnostic power of multiple CSF
biomarkers, combining both o-/t-α-syn and p-S129-/t- α-syn ratios improved the ability to discriminate
between PD and healthy controls, which was further enhanced by including p-tau. When investigating the
correlations of biomarker levels with disease severity in the PD group, CSF t-α-syn levels inversely
correlated with MMSE scores, whereas CSF o-α-syn levels inversely correlated with H&Y scores. In
conclusion, the results described in Chapter 3, 1) highlight the potential of our biomarker assays in the
field of PD and other synucleinopathies, 2) address the shortcomings of previous ELISA platforms [13](that
used a generic antibody for capture, and the biotinylated form for detection) by using a novel conformation-
specific mAb (Syn-O2), and 3) validate the usefulness of combining multiple CSF biomarkers in improving
diagnostic accuracy in PD.
To take full advantage of the merits of the assays described in Chapters 2 and 3, and to expand our
understanding of the role that α-syn species may have as progression biomarkers in PD, we measured the
different forms of α-syn (t, o- and p-S129-α-syn) in CSF from 121 participants in the longitudinal Deprenyl
and Tocopherol Antioxidative Therapy for Parkinsonism (DATATOP) study cohort, who were clinically
diagnosed with early-stage PD (probability between 90%-100%), which is described in Chapter 4.
DATATOP is a multicenter, placebo-controlled clinical trial involving patients with early-stage PD, who
underwent repeated CSF sampling during a 2-year period, prior to starting dopamine replacement therapy
[14]. We examined the changes in CSF t-, o-, p-S129-α-syn, t-tau, p-tau, Aβ 1-40, and Aβ 1-42 during the
2-year follow-up period. Compared to baseline levels, follow-up CSF levels of t- and o-α-syn levels were
significantly higher, whereas p-S129-α-syn levels were significantly lower. In addition, the changes in t-
and o-α-syn levels, but not p-S129-α-syn levels positively correlated with duration of follow-up, confirming
the increase in CSF t- and o-α-syn levels with disease progression. Although changes in CSF t- or o-α-syn
levels alone did not correlate with clinical measures of motor progression, the change in the ratio of o-/t-α-

153
syn was associated with worsening UPDRS motor scores. Interestingly, patients with predominant postural
instability and gait difficulty revealed a stronger correlation between the change in the o-/t-α-syn ratio and
the change in UPDRS motor scores compared to other clinical phenotypes, defined as tremor dominant or
intermediate subtypes, thus coupling the CSF biochemical profile of α-syn species with the clinical
phenotype of PD. The data in Chapter 4 shed light on the dynamic pattern of change in CSF α-syn species
over the course of the disease, supporting their potential role as disease progression biomarkers and their
association with PD clinical phenotypes. The findings in Chapters 3 and 4 together demonstrate the
potential role of α-syn species as surrogate biomarkers for PD diagnosis and disease progression
monitoring. Despite the limitations surrounding the DATATOP cohort, including long storage of CSF
samples (> 25 years), no tandardized protocols for sample collection across participating centers, and the
lack of a control group, our findings are of paramount importance especially in the context of PD
progression. Clearly, to fully appreciate the role CSF α-syn species can play in monitoring PD progression,
our findings should be extended to larger cohorts where PD patients are followed longitudinally until
autopsy, providing a definitive neuropathological confirmation of the clinical diagnosis.
The co-existence of α-syn and tau pathology observed in the brains of patients with AD, PD and DLB[15,
16], prompted us to study the association between CSF α-syn and tau in an AD cohort. The results of this
study, described in Chapter 5, demonstrated an improvement of diagnostic sensitivity/specificity of
classical AD CSF biomarkers when adding CSF α-syn species. Using the same immunoassays described in
Chapters 3 and 4, we measured CSF levels of different α-syn species in an Italian cohort of AD patients,
who showed a CSF profile typical of AD at baseline, as well as in cognitively intact controls. The AD
patients in this cohort were selected based on both clinical evaluation and a CSF profile of Aβ-42, t-tau and
p-tau supporting the clinical diagnosis of AD. CSF t-α-syn levels were significantly higher in the AD group
compared to the control group, whereas CSF o- and p-S129-α-syn levels were not significantly different
between the groups. A positive correlation between t-α-syn and tau species was found only in the AD group.
The role of t-α-syn in AD pathology taken together with the lack of o- and p-S129-α-syn contribution to
AD diagnosis, further support the hypothesis that o- and p-S129-α-syn species are intimately connected to
the pathogenesis of synucleinopathies rather than tauopathies. To broaden our understanding of the
potential role of α-syn as a cognitive biomarker [17], cohorts of subjects with α-syn related dementias,
including DLB and PD dementia, should be investigated [18]. Furthermore, combining α-syn and AD core
biomarkers with brain imaging data might contribute to the identification of individuals at higher risk of
MCI and conversion to AD. In conclusion, the results in Chapter 5 obtained in a well-characterized cohort
of AD patients and neurological controls further support the notion that t-α-syn most likely represents a
marker of neuronal loss and/or synaptic failure in AD [19].
154
While most cases of PD occur in a sporadic manner, a subset of cases are attributable to genetic causes.
Mutations in the leucine-rich repeat kinase 2 (LRRK2) gene are the most common causes of inherited PD.
In Chapter 6, we aimed to determine whether any of the CSF α-syn species have the potential to serve as
preclinical biomarkers for PD. Using our in-house developed ELISA assays, we measured t-, o- and pS129-
α-syn species in a well-characterized Norwegian cohort of 72 subjects with LRRK2 mutations: 21
symptomatic cases already diagnosed with PD and 51 asymptomatic LRRK2 mutation carriers. In parallel,
we also included 60 patients with sporadic PD (sPD) and 31 healthy control subjects. The observations in
this cohort suggested that CSF o-α-syn holds potential as a surrogate biomarker for the early detection of
PD. In addition, we observed a correlation between body fluid biomarker levels and PET scan images in
asymptomatic LRRK2 mutation carriers. Larger cohorts, where asymptomatic LRRK2 subjects are followed
up longitudinally, would further validate these findings.
Interpreting the findings from Chapters 3-5 together, the reduction of CSF t-α-syn in PD is most likely due
to the protein folding tendency and its subsequent sequestration in LBs, while the increased CSF o-α-syn
levels are most likely related to clearance failure of the oligomerized forms of α-syn. The scarce longitudinal
data challenge our speculations about the reasons behind the longitudinal changes in CSF t- and o-α-syn
levels over the course of PD. Elevated levels of α-syn have been linked to degree of neurodegeneration and
a worse prognosis of PD [20]. Having said that, only a weak inverse correlation between CSF o-α-syn and
motor impairment, and a moderate inverse correlation between t-α-syn and cognitive function were noted
in Chapter 3, while the levels of neither of these CSF α-syn species correlated with disease duration.
Longitudinal follow-up of cases, as described in Chapter 4, did show a correlation between the changes in
t- and o-α-syn levels and disease duration, a correlation that may grow stronger with a longer follow-up
period. In interpreting our findings, we have to keep in mind that PD is a disease that develops slowly over
many years. The average follow-up duration of two years in most longitudinal studies may be too short to
capture the true strength of the relationship between body fluid biomarkers and disease progression in PD.
As discussed in the previous chapters of this thesis, α-syn is subject to several post-translational
modifications (PTMs) [21], where phosphorylation at Serine 129 is among the most frequent ones [22]. So
far, we do not know exactly in what way α-syn phosphorylation alters the folding propensity or
neurotoxicity of the protein [23]. The fact that α-syn in LBs is predominantly phosphorylated at Ser129
[24] encouraged us to think that developing immunoassays measuring CSF p-S129-α-syn would best reflect
LB pathology. This hypothesis was supported by findings in cross-sectional studies by our group and others,
where higher levels of CSF p-S129-α-syn were found in PD [25, 26]. However, longitudinal studies have
come up with conflicting results. Stewart et al. reported a longitudinal increase in CSF p-S129-α-syn levels,
while we found a longitudinal decrease in cases from the DATATOP study [26]. Although differences in

155
selection criteria of the patients included in each study may explain these differences, this sparked a
controversy about the potential role of p-S129-α-syn as a PD biomarker.
In AD, the increase in CSF t-α-syn can be attributed to protein over-expression and/or excessive neuronal
damage in AD patients [27, 28], leading in turn to α-syn leakage from damaged cells into the brain’s
interstitial fluid and then into the CSF. This leakage, however, was not reflected in the levels of other forms
of α-syn, such as o- or p-S129-α-syn.
Among the different species of α-syn explored in this thesis, and the original findings these cohorts yielded,
the data suggest that the link between CSF α-syn biomarkers and PD severity can be summarized as follows:
1) CSF o-α-syn rather than t- or p-S129-α-syn is more connected to PD motor severity, 2) CSF t-α-syn is
associated with cognitive decline in PD, 3) CSF o-α-syn holds the biggest potential for early detection of
PD. Large-scale, prospective studies in well-controlled cohorts, where CSF samples are collected and
processed using rigorously standardized procedures are needed to further validate these findings [29].
As highlighted in Chapter 1, several studies have reported inconsistent findings on α-syn levels among the
different labs suggesting there are gaps in our knowledge that should be filled. This has led research groups
to collaborate in order to identify the best strategies to move forward with body fluid biomarker studies.
This includes an increasing number of recent studies directed towards understanding the leading cause for
the lack of reproducibility between laboratories [30]. Many factors contributing to this inconsistency have
already been identified, such as: 1) protocols for biofluid collection and processing (storage duration, types
of tubes, centrifugation, etc.), 2) CSF contamination with blood traces, and hemoglobin levels in
serum/plasma, 3) immunoassays platforms, and 4) patient selection criteria.
Future Directions There is an increasing body of knowledge suggesting that multiple forms of α-syn can improve the
diagnostic accuracy of PD, especially when used as a panel of biomarkers and supported by neuroimaging
and clinical data. However, further studies using validated quantitative platforms and including patients
with different synucleinopathies that are followed longitudinally until autopsy are highly needed. When
further deployed in larger cohorts with longer follow-up durations, the assays we developed can facilitate
the search for reliable CSF biomarkers that correlate with disease severity. We will make our assays widely
available for the research community to help provide us with objective data from different biomarkers
discovery studies to assist in making informed decisions about the diagnosis in individual patients in a
timely manner. An accurate early diagnosis is desperately needed in the development of PD-specific
therapies to be able to distinguish PD cases from patients suffering from other synucleinopathies or forms
of parkinsonism that require different therapies.

156
Although considerable research is needed to translate α-syn biomarkers from the research setting to
diagnostic strategies, it is worth acknowledging the rapid advances that have been made in the field of PD
biomarkers, and the work towards accelerating the pace of developing disease modifying therapies for PD
and related disorders. Given the association of multiple proteins and markers other than α-syn with PD,
such as tau, Aβ42, neurofilament light chain, or inflammatory markers, it is very likely that the search for
an ideal panel of biomarkers will continue. Furthermore, multiple large-scale, longitudinal studies in well-
controlled cohorts, where standardized protocols are followed, like the Parkinson's Progression Markers
Initiative, are now underway and will yield important new data within the next decade. In addition, an
increasing number of studies have extended their search for biomarkers far beyond CSF and blood to also
include peripheral tissues such as submandibular salivary glands [31] and skin biopsies [32]. Although this
approach has not yet culminated in complete success, it might facilitate reaching the ultimate goal of an
ideal (panel of) biomarker(s) for PD in the near future for early and differential diagnosis, and monitoring
disease progression in PD.
In summary, while our understanding of PD over the past two centuries has vastly progressed and many
potential biomarkers have come to the fore, the ideal biomarker or panel of biomarkers for PD has yet to
be validated. On the bright side, multiple large-scale, longitudinal studies in well-controlled cohorts, where
standardized protocols are followed, like the Parkinson's Progression Markers Initiative, are now underway
and will yield important new data within the next decade.
Key findings of the thesis 1. Conformation-specific mAbs for α-syn aggregates were generated and employed to identify α-syn
pathology compared to pan antibodies;
2. 11D12 and Syn-140 antibodies were generated and served as good candidates for t-α-syn detection,
whereas PS129 mAb was specific for p-S129-α-syn;
3. Robust, sensitive and specific ELISA assays for t-, o-, or p-Ser129-α-syn forms were developed
and characterized;
4. In PD patients, CSF t-α-syn levels were significantly decreased, whereas CSF o-α-syn and p-s129-
α-syn levels were significantly increased compared to healthy controls;
5. The combination of CSF o-/t-α-syn, p-S129-α-syn and p-tau provided the best fitting predictive
model for discriminating PD patients from healthy controls;
6. CSF o-α-syn levels correlated with the severity of PD motor symptoms;
7. CSF t- and o- α-syn levels significantly increased over a two-year follow-up period in early-stage
PD, and the CSF o-/t-α-syn ratio was associated with the change in UPDRS motor scores;

157
8. CSF t-α-syn levels were significantly higher in AD patients compared to non-demented controls,
and corresponded to worsening of cognitive functions in the AD patients;
9. Levels of CSF t-α-syn were comparable among sporadic PD, symptomatic and asymptomatic
LRRK2 mutation carriers, but significantly higher than in healthy subjects;
10. CSF o-α-syn levels were significantly higher in asymptomatic LRRK2 subjects than in healthy
controls or symptomatic LRRK2 patients;
158
References
[1] L. Parnetti et al., "Cerebrospinal fluid biomarkers in Parkinson disease," (in eng), Nat Rev Neurol, vol. 9, no. 3, pp. 131-‐40, Mar 2013.
[2] L. Marsili, G. Rizzo, and C. Colosimo, "Diagnostic Criteria for Parkinson's Disease: From James Parkinson to the Concept of Prodromal Disease," (in eng), Front Neurol, vol. 9, p. 156, 2018.
[3] M. G. Spillantini, M. L. Schmidt, V. M. Lee, J. Q. Trojanowski, R. Jakes, and M. Goedert, "Alpha-‐synuclein in Lewy bodies," (in eng), Nature, vol. 388, no. 6645, pp. 839-‐40, Aug 28 1997.
[4] P. Ibáñez et al., "Causal relation between alpha-‐synuclein gene duplication and familial Parkinson's disease," (in eng), Lancet, vol. 364, no. 9440, pp. 1169-‐71, 2004 Sep 25-‐Oct 1 2004.
[5] M. C. Chartier-‐Harlin et al., "Alpha-‐synuclein locus duplication as a cause of familial Parkinson's disease," (in eng), Lancet, vol. 364, no. 9440, pp. 1167-‐9, 2004 Sep 25-‐Oct 1 2004.
[6] H. Mizuno, N. Fujikake, K. Wada, and Y. Nagai, "α-‐Synuclein Transgenic Drosophila As a Model of Parkinson's Disease and Related Synucleinopathies," (in eng), Parkinsons Dis, vol. 2011, p. 212706, 2010.
[7] M. Goedert, R. Jakes, and M. G. Spillantini, "The Synucleinopathies: Twenty Years On," (in eng), J Parkinsons Dis, vol. 7, no. s1, pp. S53-‐S71, 2017.
[8] O. M. El-‐Agnaf et al., "Alpha-‐synuclein implicated in Parkinson's disease is present in extracellular biological fluids, including human plasma," (in eng), FASEB J, vol. 17, no. 13, pp. 1945-‐7, Oct 2003.
[9] I. Devic et al., "Salivary α-‐synuclein and DJ-‐1: potential biomarkers for Parkinson's disease," (in eng), Brain, vol. 134, no. Pt 7, p. e178, Jul 2011.
[10] S. Przedborski, "The two-‐century journey of Parkinson disease research," (in eng), Nat Rev Neurosci, vol. 18, no. 4, pp. 251-‐259, 03 2017.
[11] R. Kayed et al., "Conformation dependent monoclonal antibodies distinguish different replicating strains or conformers of prefibrillar Aβ oligomers," (in eng), Mol Neurodegener, vol. 5, p. 57, 2010.
[12] O. El-‐Agnaf et al., "Differential effects of immunotherapy with antibodies targeting α-‐synuclein oligomers and fibrils in a transgenic model of synucleinopathy," (in eng), Neurobiol Dis, vol. 104, pp. 85-‐96, Aug 2017.
[13] T. Tokuda et al., "Detection of elevated levels of α-‐synuclein oligomers in CSF from patients with Parkinson disease," (in eng), Neurology, vol. 75, no. 20, pp. 1766-‐72, Nov 2010.
[14] "DATATOP: a multicenter controlled clinical trial in early Parkinson's disease. Parkinson Study Group," (in eng), Arch Neurol, vol. 46, no. 10, pp. 1052-‐60, Oct 1989.
[15] S. Moussaud, D. R. Jones, E. L. Moussaud-‐Lamodière, M. Delenclos, O. A. Ross, and P. J. McLean, "Alpha-‐synuclein and tau: teammates in neurodegeneration?," (in eng), Mol Neurodegener, vol. 9, p. 43, 2014.

159
[16] B. Mollenhauer, J. J. Locascio, W. Schulz-‐Schaeffer, F. Sixel-‐Döring, C. Trenkwalder, and M. G. Schlossmacher, "α-‐Synuclein and tau concentrations in cerebrospinal fluid of patients presenting with parkinsonism: a cohort study," (in eng), Lancet Neurol, vol. 10, no. 3, pp. 230-‐40, Mar 2011.
[17] L. Parnetti et al., "Cerebrospinal fluid biomarkers in Parkinson's disease with dementia and dementia with Lewy bodies," (in eng), Biol Psychiatry, vol. 64, no. 10, pp. 850-‐5, Nov 2008.
[18] I. van Steenoven et al., "α-‐Synuclein species as potential cerebrospinal fluid biomarkers for dementia with lewy bodies," (in eng), Mov Disord, Nov 2018.
[19] A. Korff, C. Liu, C. Ginghina, M. Shi, J. Zhang, and A. s. D. N. Initiative, "α-‐Synuclein in cerebrospinal fluid of Alzheimer's disease and mild cognitive impairment," (in eng), J Alzheimers Dis, vol. 36, no. 4, pp. 679-‐88, 2013.
[20] S. Hall et al., "Longitudinal Measurements of Cerebrospinal Fluid Biomarkers in Parkinson's Disease," (in ENG), Mov Disord, Feb 2016.
[21] A. W. Schmid, B. Fauvet, M. Moniatte, and H. A. Lashuel, "Alpha-‐synuclein post-‐translational modifications as potential biomarkers for Parkinson's disease and other synucleinopathies," (in ENG), Mol Cell Proteomics, Aug 2013.
[22] S. Tenreiro, K. Eckermann, and T. F. Outeiro, "Protein phosphorylation in neurodegeneration: friend or foe?," (in eng), Front Mol Neurosci, vol. 7, p. 42, 2014.
[23] A. Oueslati, "Implication of Alpha-‐Synuclein Phosphorylation at S129 in Synucleinopathies: What Have We Learned in the Last Decade?," (in eng), J Parkinsons Dis, vol. 6, no. 1, pp. 39-‐51, 2016.
[24] H. Fujiwara et al., "alpha-‐Synuclein is phosphorylated in synucleinopathy lesions," (in eng), Nat Cell Biol, vol. 4, no. 2, pp. 160-‐4, Feb 2002.
[25] N. K. Majbour et al., "Longitudinal changes in CSF alpha-‐synuclein species reflect Parkinson's disease progression," (in ENG), Mov Disord, vol. 31, no. 10, pp. 1535-‐1542, Oct 2016.
[26] T. Stewart et al., "Phosphorylated α-‐synuclein in Parkinson's disease: correlation depends on disease severity," (in eng), Acta Neuropathol Commun, vol. 3, p. 7, 2015.
[27] F. Tateno, R. Sakakibara, T. Kawai, M. Kishi, and T. Murano, "Alpha-‐synuclein in the cerebrospinal fluid differentiates synucleinopathies (Parkinson Disease, dementia with Lewy bodies, multiple system atrophy) from Alzheimer disease," (in eng), Alzheimer Dis Assoc Disord, vol. 26, no. 3, pp. 213-‐6, 2012 Jul-‐Sep 2012.
[28] J. B. Toledo, A. Korff, L. M. Shaw, J. Q. Trojanowski, and J. Zhang, "CSF α-‐synuclein improves diagnostic and prognostic performance of CSF tau and Aβ in Alzheimer's disease," (in eng), Acta Neuropathol, vol. 126, no. 5, pp. 683-‐97, Nov 2013.
[29] A. Schrag, U. F. Siddiqui, Z. Anastasiou, D. Weintraub, and J. M. Schott, "Clinical variables and biomarkers in prediction of cognitive impairment in patients with newly diagnosed Parkinson's disease: a cohort study," (in eng), Lancet Neurol, vol. 16, no. 1, pp. 66-‐75, Jan 2017.
[30] B. Mollenhauer et al., "A user's guide for α-‐synuclein biomarker studies in biological fluids: Perianalytical considerations," (in eng), Mov Disord, vol. 32, no. 8, pp. 1117-‐1130, Aug 2017.

160
[31] K. Del Tredici, C. H. Hawkes, E. Ghebremedhin, and H. Braak, "Lewy pathology in the submandibular gland of individuals with incidental Lewy body disease and sporadic Parkinson's disease," (in eng), Acta Neuropathol, vol. 119, no. 6, pp. 703-‐13, Jun 2010.
[32] V. Donadio et al., "A new potential biomarker for dementia with Lewy bodies: Skin nerve α-‐synuclein deposits," (in eng), Neurology, vol. 89, no. 4, pp. 318-‐326, Jul 2017.

161
List of Publications (h index = 10)
1. Alpha-‐synuclein species as potential CSF biomarkers for Dementia with Lewy bodies Inger van Steenoven, Nour K. Majbour, Nishant Vaikath, Henk W. Berendse, MD, Wiesje M. van der Flier, Wilma D.J. van de Berg, Charlotte E. Teunissen, Afina W. Lemstra, and Omar M.A. El-‐Agnaf. Movement Disorders.
2. Duffy MF, Collier TJ, Patterson JR, Kemp CJ, Luk KC, Tansey MG, Paumier KL, Kanaan NM, Fischer DL, Polinski NK, Barth OL, Howe JW, Vaikath NN, Majbour NK, El-‐Agnaf OMA, Sortwell CE. Lewy body-‐like alpha-‐synuclein inclusions trigger reactive microgliosis prior to nigral degeneration. J Neuroinflammation. 2018 May 1;15(1):129. doi: 10.1186/s12974-‐018-‐1171-‐z. Erratum in: J Neuroinflammation. 2018 May 29;15(1):169.
3. El-‐Agnaf O, Overk C, Rockenstein E, Mante M, Florio J, Adame A, Vaikath N, Majbour N, Lee SJ, Kim C, Masliah E, Rissman RA. Differential effects of immunotherapy with antibodies targeting α-‐synuclein oligomers and fibrils in a transgenic model of synucleinopathy. Neurobiol Dis. 2017 Aug;104:85-‐96. doi: 10.1016/j.nbd.2017.05.002.
4. Tomlinson JJ, Shutinoski B, Dong L, Meng F, Elleithy D, Lengacher NA, Nguyen AP, Cron GO,
Jiang Q, Roberson ED, Nussbaum RL, Majbour NK, El-‐Agnaf OM, Bennett SA, Lagace DC, Woulfe JM, Sad S, Brown EG, Schlossmacher MG. Holocranohistochemistry enables the visualization of α-‐synuclein expression in the murine olfactory system and discovery of its systemic anti-‐microbial effects. J Neural Transm (Vienna). 2017 Jun;124(6):721-‐738. doi: 10.1007/s00702-‐017-‐1726-‐7.
5. Majbour NK, Chiasserini D, Vaikath NN, Eusebi P, Tokuda T, van de Berg W, Parnetti L,
Calabresi P, El-‐Agnaf OM. Increased levels of CSF total but not oligomeric or phosphorylated forms of alpha-‐synuclein in patients diagnosed with probable Alzheimer's disease. Sci Rep. 2017 Jan 10;7:40263. doi: 10.1038/srep40263.
6. Majbour NK, El-‐Agnaf O. Cognitive impairment in Parkinson's disease.
Lancet Neurol. 2017 Jan;16(1):23-‐24. doi: 10.1016/S1474-‐4422(16)30329-‐5. No abstract available.
7. Landeck N, Hall H, Ardah MT, Majbour NK, El-‐Agnaf OM, Halliday G, Kirik D. A novel multiplex assay for simultaneous quantification of total and S129 phosphorylated human alpha-‐synuclein. Mol Neurodegener. 2016 Aug 22;11(1):61. doi: 10.1186/s13024-‐016-‐0125-‐0.
8. Majbour NK, Vaikath NN, Eusebi P, Chiasserini D, Ardah M, Varghese S, Haque ME, Tokuda T, Auinger P, Calabresi P, Parnetti L, El-‐Agnaf OM. Longitudinal changes in CSF alpha-‐synuclein species reflect Parkinson's disease progression. Mov Disord. 2016 Oct;31(10):1535-‐1542. doi: 10.1002/mds.26754.
9. Majbour NK, Vaikath NN, van Dijk KD, Ardah MT, Varghese S, Vesterager LB, Montezinho LP,
Poole S, Safieh-‐Garabedian B, Tokuda T, Teunissen CE, Berendse HW, van de Berg WD, El-‐Agnaf OM. Oligomeric and phosphorylated alpha-‐synuclein as potential CSF biomarkers for Parkinson's disease. Mol Neurodegener. 2016 Jan 19;11(1):7. doi: 10.1186/s13024-‐016-‐0072-‐9.

162
10. Helwig M, Klinkenberg M, Rusconi R, Musgrove RE, Majbour NK, El-‐Agnaf OM, Ulusoy A, Di Monte DA. Brain propagation of transduced α-‐synuclein involves non-‐fibrillar protein species and is enhanced in α-‐synuclein null mice. Brain. 2015 Dec 30. pii: awv376.
11. Javed H, Menon SA, Al-‐Mansoori KM, Al-‐Wandi A, Majbour NK, Ardah MT, Varghese S,
Vaikath NN, Haque ME, Azzouz M, El-‐Agnaf OM. Development of Nonviral Vectors Targeting the Brain as a Therapeutic Approach For Parkinson's Disease and Other Brain Disorders. Mol Ther. 2015 Dec 24. doi: 10.1038/mt.2015.232.
12. Vaikath NN, Majbour NK, Paleologou KE, Ardah MT, van Dam E, van de Berg WD, Forrest SL,
Parkkinen L, Gai WP, Hattori N, Takanashi M, Lee SJ, Mann DM, Imai Y, Halliday GM, Li JY, El-‐Agnaf OM. Generation and characterization of novel conformation-‐specific monoclonal antibodies for α-‐synuclein pathology. Neurobiol Dis. 2015 Jul;79:81-‐99. doi: 10.1016/j.nbd.2015.04.009. Epub 2015 Apr 30.
13. Buck K, Landeck N, Ulusoy A, Majbour NK, El-‐Agnaf OM, Kirik D. Ser129 phosphorylation of
endogenous α-‐synuclein induced by overexpression of polo-‐like kinases 2 and 3 in nigral dopamine neurons is not detrimental to their survival and function. Neurobiol Dis. 2015 Jun;78:100-‐14. doi: 10.1016/j.nbd.2015.03.008. Epub 2015 Mar 25.
14. Jan O. Aasly, Krisztina K. Johansen, Gunnar Brønstad, Bjørg J. Warø, Shiji Varghese, Nour K. Majbour, Fatimah Alzahmi, Katerina E. Paleologou, Dena A. M. Amer, Abdulmonem Al-‐Hayani and Omar M. A. El-‐Agnaf. Elevated Levels of CSF α‑Synuclein Oligomers in Healthy Asymptomatic LRRK2 Mutation Carriers. Front Aging Neurosci. 2014 Sep 25;6:248. doi: 10.3389/fnagi.2014.00248.
15. Oskar Hansson, Sara Hall, Annika Öhrfelt, Henrik Zetterberg, Kaj Blennow, Lennart Minthon,
Katarina Nägga, Elisabet Londos, Shiji Varghese, Nour K Majbour, Abdulmonem Al-‐Hayani and Omar MA El-‐Agnaf. Levels of cerebrospinal fluid alpha-‐synuclein oligomers are increased in Parkinson's disease with dementia and dementia with Lewy bodies compared to Alzheimer's disease. Alzheimer's Research & Therapy 2014, May 20; 6:25.
16. Lucilla Parnetti, Lucia Farotti, Paolo Eusebi1, Davide Chiasserini, Claudia DeCarlo, David
Giannandrea, Nicola Salvadori, Viviana Lisetti, NicolaTambasco, Aroldo Rossi, Nour K. Majbour, Omar El-‐Agnaf and Paolo Calabresi. Differential role of CSF alpha-‐synuclein species, tau, and Aβ42 in Parkinson’s Diseas. Front Aging Neurosci. 2014 Mar 31; 6:53. doi: 10.3389.

163
WORD OF THANKS
My deepest gratitude goes to my family for their unconditional love and support.
It’s been a privilege to have worked under the direction of Prof. Omar El-Agnaf, Dr.
Wilma van de Berg and Prof. dr. Henk Berendse. Their sincere mentorship and unwavering
support have immensely leveraged the success of this research.
Omar El-Agnaf, I learnt from you the value of knowledge, courage and integrity. And through
the example you set, I came to appreciate the power of dedication, diligence and resilience. It’s
been eight years now since I joined your team. A journey that has transformed my life and
molded the person I’m today. Thank you very much for crafting an inspiring example as a
researcher, mentor, visionary leader and a role model.
Henk Berendse, I have always enjoyed and appreciated your sincere and wise advice. Your
enlightening guidance and constructive feedback have positively influenced my research career.
Wilma van de Berg, my sincere gratitude to you for creating and facilitating this wonderful
opportunity for me. Thank you very much for your kind acts of care, genuine encouragement and
the excellent research experience.
To all my academic educators, thank you very much for the untiring support and
guidance throughout my journey.
To the reading and examination committee, thank you very much for sharing your
time, expert opinion and extensive knowledge.
164
Special thanks go to all my colleagues, namely Nishant Vaikath, Mercy Thomas,
Muneera Fayyad, Houari Abdesselem, Ilham Abdi, Yasmine Fathy, Hanneke Guet, Angela
Ingrassia and Tim Moors for their companionship, kind support and the friendly working
atmosphere.
Nishant Vaikath, you have been a wonderful colleague, true mentor and a very
supportive friend.
Warm thanks to my dear friends for helping me unlock the strength I didn’t know I have.
My deepest appreciation for the patients and the healthy volunteers whom research is
not possible without their contribution.
I would also like to extend my gratitude to the VU University Medical Center,
Amsterdam Neuroscience, Amsterdam, the Netherlands for this life-changing experience, the
access to world-class research facilities and the expert mentorship.
165
ABOUT THE AUTHOR Nour Majbour was born 12 March 1987 in Abu Dhabi, United Arab
Emirates for Syrian Parents. After completing her high school
education, she pursued a bachelor in Pharmacy from Tishreen
University at her hometown, Lattakia, Syria. In 2014 she obtained her
Master degree in Biomedical Sciences, from the College of Medicine
and health Sciences, at UAE University. In 2015, Majbour commenced
her PhD project, supervised by Prof. Dr. Henk Berendse, Prof. Omar
El-Agnaf and Dr. Wilma van de Berg at the department of Anatomy and Neurosciences of the VU
University Medical Center, which resulted in the publication of this thesis.
In 2017, Majbour joined Hamad Bin Khalifa University’s (HBKU) Qatar Biomedical Research
Institute (QBRI) as a research associate. One year later and through Stars of Science TV show,
the Arab World’s leading science-based innovation show, Majbour took her research from QBRI’s
laboratories to a global television audience and skillfully fought her way through prototype
performance, industrial design and customer validation with her proposed innovation for early
detection of Parkinson’s disease earning the 2nd place. Majbour hopes her innovation, Parkinson’s
Early Detection Kit (QABY) would surpass the current limitations in disease diagnostics through
the use of novel antibodies that may be leveraged to identify biomarkers for Parkinson’s disease.
Looking towards the marketability of her innovation, Majbour plans to use her wining share of
seed money to develop her kit for an up-and-coming Qatari biotech company that aims to develop
new scientific tools for early diagnosis, treatment, and management of devastating diseases, thus
supporting Qatar’s position as a global player in the healthcare industry. Her entrepreneurial spirit
and unwavering dedication, which stem from personal experiences with family members afflicted
by Parkinson’s disease, positioned her as a strong contestant and effective role model for women
in Science, Technology, Engineering and Mathematics (STEM) professions.

Department of Anatomy and Neurosciences