
Dissecting the complexity of human susceptibility to ...200063/FULLTEXT01.pdf · Dissecting the...
124
The Wenner-Gren Institute Doctoral Thesis in Immunology at Stockholm University, Sweden 2008 Valentina D Mangano Dissecting the complexity of human susceptibility to Plasmodium falciparum malaria: genetic approaches Dissecting the complexity of human susceptibility to Plasmodium falciparum malaria: genetic approaches Valentina D Mangano ISBN 978-91-7155-713-1
Transcript of Dissecting the complexity of human susceptibility to ...200063/FULLTEXT01.pdf · Dissecting the...
The Wenner-Gren Institute
Doctoral Thesis in Immunology at Stockholm University, Sweden 2008
Valentina D M
anganoD
issecting th
e comp
lexity of h
um
an su
sceptib
ility to Plasmodiu
m falciparu
m m
alaria: genetic ap
proach
es
Dissecting the complexity of human susceptibility to Plasmodium falciparum malaria: genetic approaches
Valentina D Mangano
ISBN 978-91-7155-713-1
Doctoral thesis from the Department of Immunology,
the Wenner‐Gren Institute, Stockholm University
Dissecting the complexity of human susceptibility to
Plasmodium falciparum malaria: genetic approaches
Valentina D Mangano
Stockholm 2008
All previously published articles, or portions of them, were reproduced with permission from the
publishers
Valentina D Mangano, Stockholm 2008
This work is licensed under the Creative Commons Attribution‐Non‐Commercial‐Share Alike 2.5 Sweden
License
To view a copy of this licence, visit http://creativecommons.org/licenses/by‐nc‐sa/2.5/se/ or send a
letter to Creative Commons, 171 Second Street, Suite 300, San Francisco, California 94105, USA
ISBN 978‐91‐7155‐713‐1
Cover Illustration: “Workplace with milk” by Federico Ciamei and Elena Gagliasso
Printed in Sweden by Universitetsservice AB, Stockholm 2008
Distributor: Stockholm University Library

To everyone that made these four years of PhD studies so great to live.
“La vache ne poudra jamais remercier la forêt,
parce‐que elle vit toujours dans la forêt”
Proverbe Peul
Thank you all for being my forest!

SUMMARY
There are many basic aspects of the immunology of Plasmodium falciparum infection that
are not fully understood, thus hampering our understanding of how people become immune to
malaria and of immune‐based pathogenesis. The understanding of immunity and susceptibility
to malaria has been hindered by the complexity of parasite‐host interaction and by the
inherent difficulty of distinguishing epiphenomena from events truly on the causative pathway,
as well as protective from pathological responses. We discuss genetic approaches that are of
great value for dissecting the complexity of immune responses to malaria in natura by
providing new insights into molecular interactions between the parasite and the host. Genetics
of susceptibility to malaria therefore can represent a complementary research tool to
experimental immunology in vitro and in vivo.
The work presented in this thesis had two major aims: I) to investigate the role of Interferon
(IFN)‐γ signalling in susceptibility to malaria and II) to understand the biological basis of the low
susceptibility to malaria shown by the Fula people of West Africa.
In order to investigate the molecular mechanisms of protective immunity to malaria and
pathogenesis regulated by IFN‐γ, we conducted genetic epidemiology association studies of
complementary design to investigate the role of four candidate loci: IFNG, IFNGR1, IFNGR2 and
IRF1. The most interesting findings concerned the IRF1 gene: we observed significant
associations between common genetic variation at the IRF1 locus and the ability to control P.
falciparum infection, both in healthy adult individuals and in children affected by
uncomplicated and severe malaria. On the other hand, our studies did not provide evidence for
a major role of this gene in determining susceptibility to severe disease. Furthermore, using the
methodology of allele‐specific transcript quantification mapping, we obtained preliminary
results suggesting the existence of a regulatory element(s) in the 5’ upstream region of the IRF1
locus. Thus, our current hypothesis is that IRF1 polymorphisms entail different abilities to
control P. falciparum infection by affecting IRF1 gene expression and ultimately the production
of inflammatory cytokines, but that they are not involved in immune‐based pathogenesis of
severe disease.
As a first step to understand the biological basis of the resistance to malaria shown by the
Fula people of West Africa, we analysed HLA class II polymorphism to confirm previous data
showing that the Fula from Burkina Faso are genetically differentiated from sympatric Mossi
and Rimaibé. We then compared the expression profiles of healthy adults of Fula and Mossi
ethnicity. Quantitative (QT)‐PCR analysis of Peripheral Blood Mononuclear Cells (PBMCs)
isolated from Fula showed higher expression of several genes related to Th1 and Th2 function
and reduced expression of two important genes related to immune tolerance: FOXP3 and
CTLA4. Microarray analysis of CD4+CD25+ cells also revealed a lower expression of several genes
affecting T regulatory activity such as FOXP3, CTLA4, TGFB and TGFBRs in the Fula. These results
suggest a functional deficit of T regulatory cells (Tregs) in the Fula and identify key genes as
good candidates for future genetic association studies.
ORIGINAL PAPERS
This thesis is based on the following articles, which will be referred to in the text by their
roman numerals:
I. Mangano VD, Luoni G, Rockett KA, Sirima BS, Konaté A, Forton J, Clark TG,
Bancone G, Sadighi Akha E, Kwiatkowski DP, Modiano D. Interferon
Regulatory Factor 1 polymorphisms are associated with the control of
Plasmodium falciparum infection. Genes Immun. 2008 Mar; 9(2):122‐9.
II. Mangano VD, Clark TG, Auburn S*, Diakite M*, Fry AE*, Campino S, Green A,
Richardson A, Muminatou Jallow M, Fatou Sisay‐Joof F, Pinder M, Griffiths M,
Peshu N, Williams TN, Marsh K, Molyneux ME, Taylor TE , Modiano D,
Kwiatkowski DP, Rockett KA. Lack of association of Interferon Regulatory
Factor 1 with severe malaria in affected child‐parental trio studies across
three African populations. *Contributed equally to this work. PLoS ONE. In
progress.
III. Lulli P*, Mangano VD*, Onori A, Luoni G, Sirima BS, Batini C, Chessa L,
Modiano D. HLA class II loci polymorphism in three West African ethnic
groups showing different immune response to Plasmodium falciparum
malaria. *Joint authorship. Manuscript.
IV. Torcia MG, Santarlasci V, Cosmi L, Clemente A, Maggi L, Mangano VD, Verra F,
Bancone G, Nebie I, Sirima BS, Liotta F, Frosali F, Angeli R, Severini C, Sannella
AR, Bonini P, Lucibello M, Maggi E, Garaci E, Coluzzi M, Cozzolino F,
Annunziato F, Romagnani S, Modiano D. Functional deficit of T regulatory
cells in Fulani, an ethnic group with low susceptibility to Plasmodium
falciparum malaria. Proc Natl Acad Sci USA. 2008 Jan 15; 105(2):646‐51.
ABBREVIATIONS ACTs Artemisin Combination Therapies
ADCI Antibody‐Dependent Cellular Inhibition AMA‐1 Apical‐Membrane Antigen 1
APL Altered‐Peptide Ligand ARMS Amplification‐Refractory Mutation System
ASTQ Allele‐Specific Transcript Quantification CoA Correspondence Analysis
CD Cluster of Differentiation cDNA Complementary DNA
CM Cerebral Malaria CMI Cellular‐Mediated Inhibition
CR1 Complement Receptor 1 CSA Chondroitin Sulphate A
CS‐COOH C‐terminal antigen of CSP
CS‐NANP40 Repetitive antigen of CSP
CS‐NH N‐terminal antigen of CSP CSP Circum‐Sporozoite Protein
CTLA‐4 Cytotoxic T Lymphocyte‐Associated 4 DBL Duffy‐Binding Like
DCs Dendritic Cells DDT Dichloro Diphenyl Trichloroethane
DNA Deoxyribonucleic acid DZ Dizygotic
EIR Entomological Inoculation Rate FOXP‐3 Forkhead box P3
G6PD Glucose‐6‐phosphate dehydrogenase gDNA Genomic DNA
GDP Gross Domestic Product HLA Human Leucocyte Antigen
HMM Home Management of Malaria htSNP Haplotype Tagging SNP
HWE Hardy Weinberg Equilibrium ICAM‐1 Intercellular‐Adhesion Molecule 1
IFN Interferon Ig Immunoglobulin
IL Interleukin In/del Insertion/deletion
IPT Intermittent Preventing Treatment iRBC Infected‐Red Blood Cell
IRF‐1 Interferon Regulatory Factor 1 LD Linkage Disequilibrium
LSA‐1 Liver‐Surface Antigen 1 MAF Minor Allele Frequency
MalariaGEN Malaria Genomic Epidemiology Network
MAP Mitogen‐Activated Protein MDA Multiple Displacement Amplification
MHC Major Histocompatibility Complex mRNA Messenger RNA
MSP‐1 Merozoite‐Surface Protein 1
MSP‐119 19 Kda fragment of MSP‐1
MSP‐2 Merozoite‐Surface Protein 2 MZ Monozygotic
NJ Neighbour Joining NO Nitric Oxide
OD Optical Density PAM Pregnancy‐Associated Malaria
PBC P‐value after Bonferroni correction PBMCs Peripheral Blood Mononuclear Cells
PCA Principal Component Analysis PCR Polymerase Chain Reaction
PEP Primer Extension Pre‐amplification Pf332 P. falciparum 332 antigen
PfEMP1 P. falciparum Erythrocyte Membrane Protein 1 PMA Phorbol Myristate Acetate
QTL Quantitative Trait Locus QT‐PCR Quantitative (Real Time) PCR
RBC Red Blood Cell RBL Reticulocyte‐Binding Like
RESA Ring‐Erythrocyte Surface Antigen RNA Ribonucleic acid
RT‐PCR Reverse Transcriptase PRC SE Standard Error
SMA Severe Malaria Anaemia SNP Single Nucleotide Polymorphism
SQNM Sequenom genotyping system STARP Sporozoite‐Threonine Asparagine Rich Protein
TDT Transmission Disequilibrium Test TGF Transforming Growth Factor
Th T helper TLRs Toll‐Like Receptors
TNF Tumor Necrosis Factor TRAP Thrombospondin‐Related Adhesive Protein
Tregs T regulatory cells VSA Variant Surface Antigens
WHO World Health Organization
TABLE OF CONTENTS
INTRODUCTION
PLASMODIUM FALCIPARUM MALARIA
Malaria parasites in humans. ....................................................................................................................... 1 The Plasmodium life cycle ............................................................................................................................ 2 Global burden and epidemiology ................................................................................................................. 3 Socio‐economic factors and malaria ............................................................................................................ 5 Malaria control ............................................................................................................................................. 5 Pathogenesis ................................................................................................................................................ 6 Clinical manifestations. ................................................................................................................................ 8
IMMUNOLOGY OF MALARIA INFECTION
Clinical immunity to malaria ...................................................................................................................... 10 Mechanisms of protective immunity .......................................................................................................... 11 Variant Surface Antigens and immunity .................................................................................................... 15 Immune evasion strategies ........................................................................................................................ 16 Immunological memory.............................................................................................................................. 17 Malaria as an immune‐mediated disease. ................................................................................................. 18 Genetics of malaria infection and immunology in natura .......................................................................... 18
GENETICS OF SUSCEPTIBILITY TO MALARIA: FROM THE RED BLOOD CELL TO THE WHOLE GENOME
Malaria as an evolutionary force shaping the human genome. ................................................................ 20 Susceptibility to malaria is a partially heritable trait ................................................................................. 21 Identifying genome regions of interest through linkage studies. ............................................................... 24 Insights from comparative analysis of gene expression profiles ................................................................ 26 Linkage disequilibrium association mapping ............................................................................................. 27 Searching for regulatory determinants of gene expression ....................................................................... 28
Towards genome‐wide and multi‐centre association studies .................................................................... 30
RELATED BACKGROUND The role of interferon‐γ in susceptibility to P. falciparum malaria IFN‐γ and immunological mechanisms in malaria ..................................................................................... 33 IFN‐γ and protection against malaria in humans ....................................................................................... 35 Regulation of IFN‐γ production and clinical immunity ............................................................................... 36 Candidate genes ......................................................................................................................................... 36
The Fula people of West Africa are less susceptible to malaria than sympatric ethnic groups Lower susceptibility to malaria in the Fula ................................................................................................. 38 Inter‐ethnic differences are likely to be underlined by genetic factors ...................................................... 40 Classic malaria resistance alleles are at lower frequencies in the Fula. ..................................................... 41 Hypotheses on the immunological basis of Fula’s resistance to malaria ................................................... 42 HLA class II molecules are unlikely to play a role ....................................................................................... 43 The potential involvement of T regulatory cells ......................................................................................... 44
THE PRESENT INVESTIGATION AIMS AND OBJECTIVES ............................................................................................................................... 47
METHODOLOGY .......................................................................................................................................... 49
RESULTS AND DISCUSSION Common genetic variation at IFN‐γ loci and carriage of P. falciparum infection in Fula
and Mossi from Burkina Faso: interest of the IRF1 gene (Preliminary association study) .................... 58 Relation of IRF1 polymorphisms with P. falciparum infection levels
and disease severity in malaria patients from Burkina Faso (Paper I) .................................................. 66 IRF1 polymorphisms and susceptibility to severe malaria in affected
child‐parental trios from The Gambia, Kenya and Malawi (Paper II) .................................................... 70
Regulatory determinants of IRF1 gene expression in Yoruba B cell lines (Preliminary functional study) ............................................................................. 74
HLA class II diversity in Fula, Mossi and Rimaibé from Burkina Faso and their relationship with Europeans and Sub‐Saharan African populations (Paper III) .................................... 79
Gene expression profiles of PBMCs and T regulatory cells in Fula and Mossi from Burkina Faso and susceptibility to malaria (Paper IV) ..................................... 85
CONCLUDING REMARKS AND FUTURE PERSPECTIVES
Role of IRF1 polymorphisms in susceptibility to malaria ............................................................................ 91 Functional deficit of T regulatory cells and lower susceptibility to malaria in the Fula ............................. 92
AKNOWLEDGMENTS ............................................................................................................................ 95
REFERENCES ........................................................................................................................................... 98
APPENDIXES: Papers I‐IV
INTRODUCTION
PLASMODIUM FALCIPARUM MALARIA.
Malaria parasites in humans.
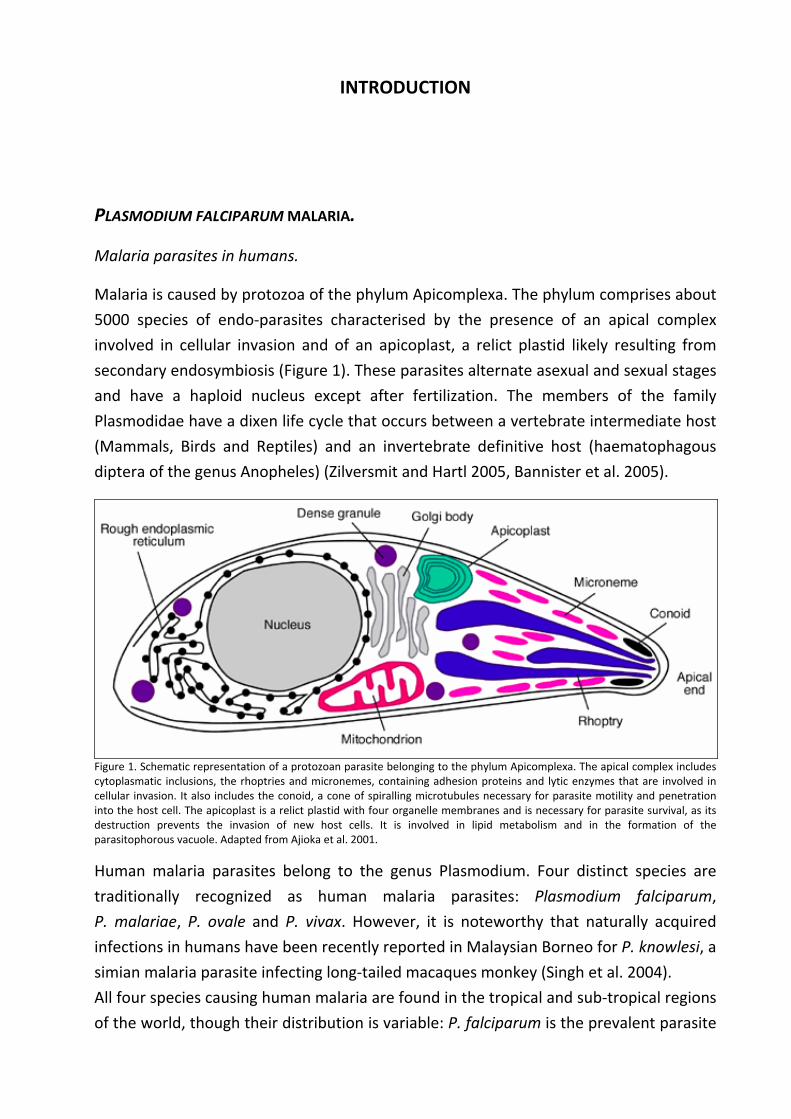
Malaria is caused by protozoa of the phylum Apicomplexa. The phylum comprises about
5000 species of endo‐parasites characterised by the presence of an apical complex
involved in cellular invasion and of an apicoplast, a relict plastid likely resulting from
secondary endosymbiosis (Figure 1). These parasites alternate asexual and sexual stages
and have a haploid nucleus except after fertilization. The members of the family
Plasmodidae have a dixen life cycle that occurs between a vertebrate intermediate host
(Mammals, Birds and Reptiles) and an invertebrate definitive host (haematophagous
diptera of the genus Anopheles) (Zilversmit and Hartl 2005, Bannister et al. 2005).
Figure 1. Schematic representation of a protozoan parasite belonging to the phylum Apicomplexa. The apical complex includes cytoplasmatic inclusions, the rhoptries and micronemes, containing adhesion proteins and lytic enzymes that are involved in cellular invasion. It also includes the conoid, a cone of spiralling microtubules necessary for parasite motility and penetration into the host cell. The apicoplast is a relict plastid with four organelle membranes and is necessary for parasite survival, as its destruction prevents the invasion of new host cells. It is involved in lipid metabolism and in the formation of the parasitophorous vacuole. Adapted from Ajioka et al. 2001.
Human malaria parasites belong to the genus Plasmodium. Four distinct species are
traditionally recognized as human malaria parasites: Plasmodium falciparum,
P. malariae, P. ovale and P. vivax. However, it is noteworthy that naturally acquired
infections in humans have been recently reported in Malaysian Borneo for P. knowlesi, a
simian malaria parasite infecting long‐tailed macaques monkey (Singh et al. 2004).
All four species causing human malaria are found in the tropical and sub‐tropical regions
of the world, though their distribution is variable: P. falciparum is the prevalent parasite
Introduction
2
in Sub‐Saharan Africa; P. vivax is instead the most frequent parasite found in Asia,
Central‐ and South‐America while it is essentially absent from West Africa as the
majority of the population do not carry the Duffy determinant, which the parasite uses
to enter the host red cell; P. malariae and P. ovale are much less common parasites
found in most of Africa; P. ovale is also endemic in Papua New Guinea and the
Philippines (Carter and Mendis 2002).
The vast majority of clinical disease and virtually all malaria related deaths are due to
P. falciparum and therefore this thesis will concentrate uniquely, except where
specifically stated, on P. falciparum malaria.
The Plasmodium life cycle.
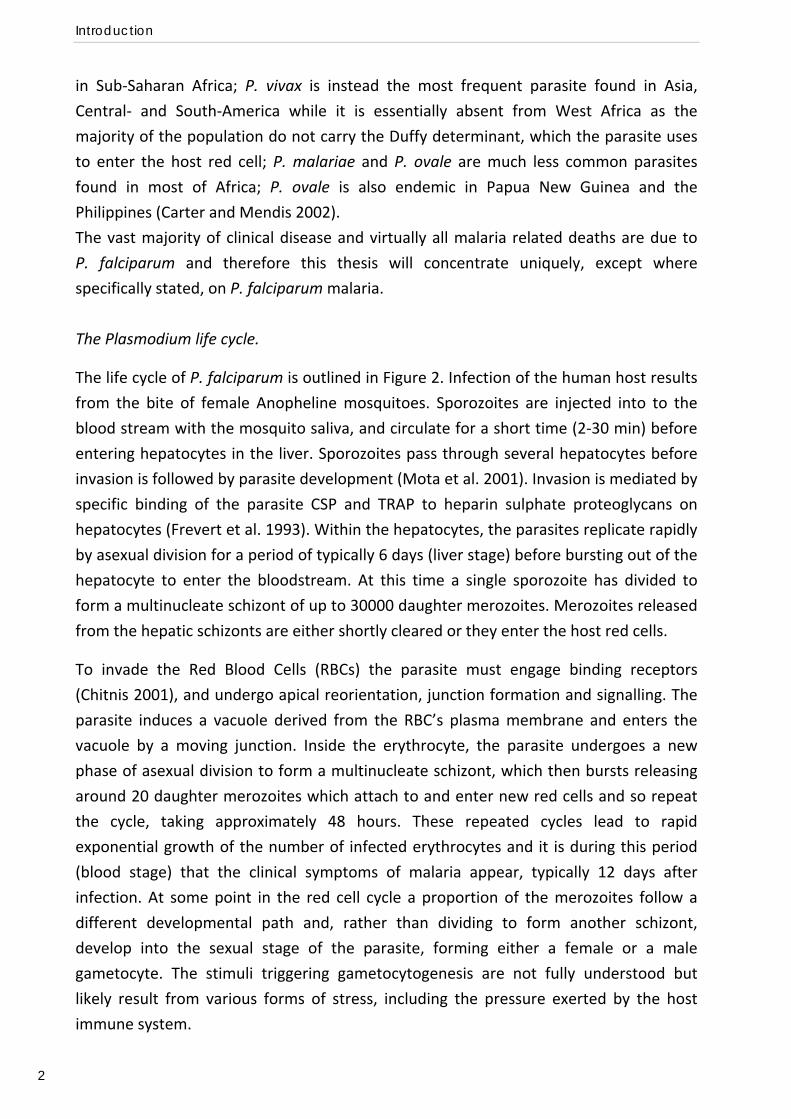
The life cycle of P. falciparum is outlined in Figure 2. Infection of the human host results
from the bite of female Anopheline mosquitoes. Sporozoites are injected into to the
blood stream with the mosquito saliva, and circulate for a short time (2‐30 min) before
entering hepatocytes in the liver. Sporozoites pass through several hepatocytes before
invasion is followed by parasite development (Mota et al. 2001). Invasion is mediated by
specific binding of the parasite CSP and TRAP to heparin sulphate proteoglycans on
hepatocytes (Frevert et al. 1993). Within the hepatocytes, the parasites replicate rapidly
by asexual division for a period of typically 6 days (liver stage) before bursting out of the
hepatocyte to enter the bloodstream. At this time a single sporozoite has divided to
form a multinucleate schizont of up to 30000 daughter merozoites. Merozoites released
from the hepatic schizonts are either shortly cleared or they enter the host red cells.
To invade the Red Blood Cells (RBCs) the parasite must engage binding receptors
(Chitnis 2001), and undergo apical reorientation, junction formation and signalling. The
parasite induces a vacuole derived from the RBC’s plasma membrane and enters the
vacuole by a moving junction. Inside the erythrocyte, the parasite undergoes a new
phase of asexual division to form a multinucleate schizont, which then bursts releasing
around 20 daughter merozoites which attach to and enter new red cells and so repeat
the cycle, taking approximately 48 hours. These repeated cycles lead to rapid
exponential growth of the number of infected erythrocytes and it is during this period
(blood stage) that the clinical symptoms of malaria appear, typically 12 days after
infection. At some point in the red cell cycle a proportion of the merozoites follow a
different developmental path and, rather than dividing to form another schizont,
develop into the sexual stage of the parasite, forming either a female or a male
gametocyte. The stimuli triggering gametocytogenesis are not fully understood but
likely result from various forms of stress, including the pressure exerted by the host
immune system.
Plasmodium falciparum malaria
3
Figure 2. Life cycle of Plasmodium falciparum. a) Life stages within the human host. b) Life stages within a female mosquito of the genus Anopheles. From Wirth 2002.
Gametocytes are the infective stage of the parasite and are ingested by female
Anopheline mosquito during blood meal. In the mosquito’s stomach the gametocytes
develop into female and male gametes. Fertilization occurs and the diploid ookynete
migrates into the gut wall where matures into an oocysts. Within the oocysts the
parasite undergoes sexual divisions and thousands of sporozoites are generated. At the
oocysts rupture, the sporozoites migrate through the haemocele to the salivary glands,
from where they are injected when the mosquito next takes a blood meal (Marsh and
Makani 2004).
Global burden and epidemiology.
Many different factors concur to the determination of malaria transmission intensity.
Climatic factors include temperature, humidity and rain fall, which influence the density
of the vector population and the development of the parasite within the mosquito. The
longevity of the mosquito, as well as its endo‐phily (tendency to preferentially rest
within houses) and anthropo‐phily (tendency to preferentially bite humans) are also
crucial factors. Finally, the density and behaviour of the human population must also be
considered. Transmission intensity is expressed as the average number of infective bites
per person per year, or Entomological Inoculation Rate (EIR). Malaria is said to be stably
endemic when transmission occurs from year to year and leads to a characteristic
pattern of immunity whereby older children and adults become immune to the worst
effects of the disease. Malaria is said to be unstable when there is no reliable year to
Introduction
4
year transmission and sudden epidemics may occur after long periods of virtually no
transmission (Marsh and Makani 2004). In turn transmission intensity – together with
parasite factors such as virulence and drug resistance, host factors such as immunity
and genetic background, and socio‐economic factors – determines the outcome of
malaria infection (reviewed by Miller et al. 2002).
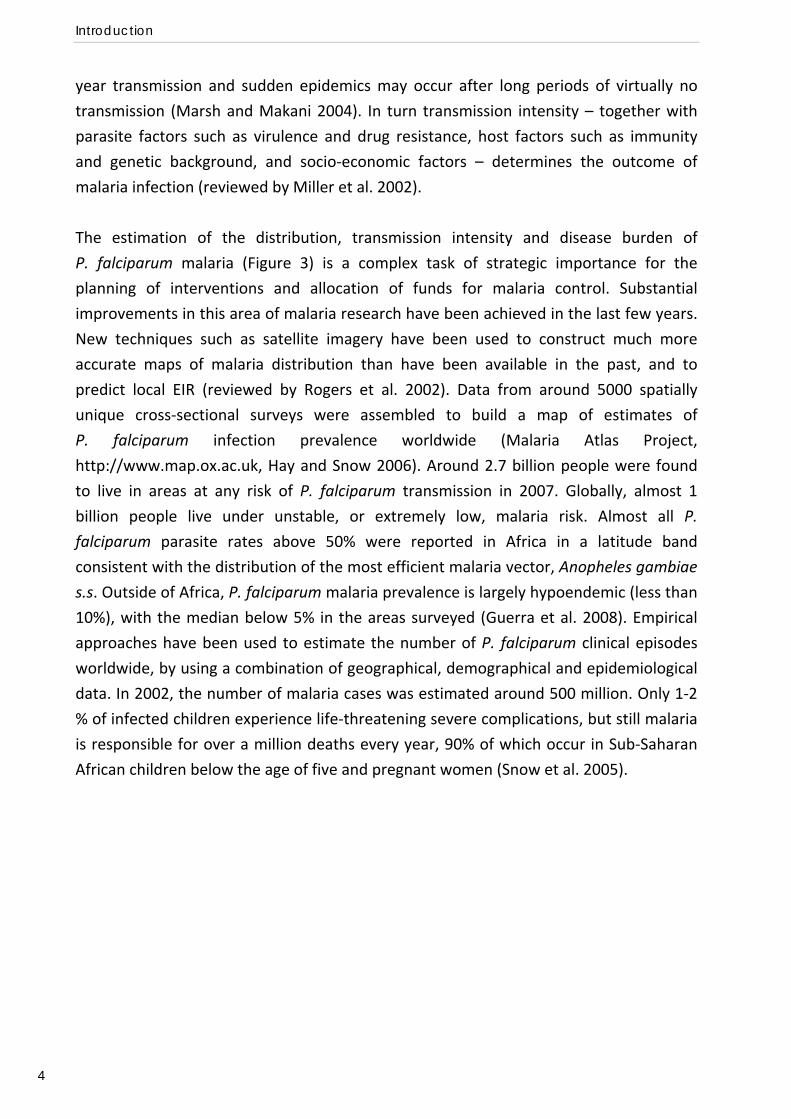
The estimation of the distribution, transmission intensity and disease burden of
P. falciparum malaria (Figure 3) is a complex task of strategic importance for the
planning of interventions and allocation of funds for malaria control. Substantial
improvements in this area of malaria research have been achieved in the last few years.
New techniques such as satellite imagery have been used to construct much more
accurate maps of malaria distribution than have been available in the past, and to
predict local EIR (reviewed by Rogers et al. 2002). Data from around 5000 spatially
unique cross‐sectional surveys were assembled to build a map of estimates of
P. falciparum infection prevalence worldwide (Malaria Atlas Project,
http://www.map.ox.ac.uk, Hay and Snow 2006). Around 2.7 billion people were found
to live in areas at any risk of P. falciparum transmission in 2007. Globally, almost 1
billion people live under unstable, or extremely low, malaria risk. Almost all P.
falciparum parasite rates above 50% were reported in Africa in a latitude band
consistent with the distribution of the most efficient malaria vector, Anopheles gambiae
s.s. Outside of Africa, P. falciparum malaria prevalence is largely hypoendemic (less than
10%), with the median below 5% in the areas surveyed (Guerra et al. 2008). Empirical
approaches have been used to estimate the number of P. falciparum clinical episodes
worldwide, by using a combination of geographical, demographical and epidemiological
data. In 2002, the number of malaria cases was estimated around 500 million. Only 1‐2
% of infected children experience life‐threatening severe complications, but still malaria
is responsible for over a million deaths every year, 90% of which occur in Sub‐Saharan
African children below the age of five and pregnant women (Snow et al. 2005).
Plasmodium falciparum malaria
5
Figure 3. P. falciparum malaria risk defined by annual parasite incidence, temperature, and aridity. From Snow et al. 2008.
Socio‐economic factors and malaria.
Analysis of the relationship between socio‐economic factors and malaria burden reveals
that the global distribution of per‐capita Gross Domestic Product (GPD) shows a striking
correlation with that of malaria, with lower rates of economic growth corresponding to
malaria‐endemic countries. Not only socio‐economic factors affect the access to
prevention measures, treatment and care and therefore the outcome and control of
malaria infection, but vice versa malaria can hinder development in many ways. These
include effects on fertility, population growth, saving and investment, worker
productivity, premature mortality and medical costs (reviewed by Sachs and Malaney
2002).
Malaria control.
Existing tools for malaria control are still insufficient but a few positive notes have been
registered in the last decade. The insecticide DDT (Dichloro Diphenyl Trichloroethane),
which has been saved from a global ban, can be used for household spraying as a vector
control tool (Roberts et al. 2000). Insecticide‐treated bednets and curtains can diminish
human‐vector contact and provide protection against malaria in the short‐term (Alonso
et al. 1991, D’Alessandro et al. 1995). However, adverse long‐term effects of decreased
transmission on development of immunity and mortality are argument of debate (Snow
and Marsh 2002), and the combination of DDT and bednets usage with prompt access to
efficient drug treatment seems desirable. In this direction, the development of new
drugs based on the plant Artemisia annua and used in combination with other
compounds to avoid the spread of resistance (Artemisin Combination Therapies, ACTs)
Introduction
6
has been a major achievement (Bosman and Mendis 2007, Nosten and White 2007).
Also, new strategies to improve access to treatment and compliance are under
experimentation, including Intermittent Preventing Treatment (IPT, Greenwood 2006)
and Home Management of Malaria (HMM, Hopkins et al. 2007). However, such tools are
expensive and difficult to apply in logistical terms, and therefore not very cost‐effective
from a public health point of view. For these reasons, many advocate the need for a
cheap and effective vaccine that prevents disease (Richie and Saul 2002, Matuschewski
and Mueller 2007, Walther and Walther 2007). It is therefore crucial to understand the
mechanisms of disease pathogenesis and of protective immunity.
Pathogenesis.
‐ Invasion of RBCs.
Several differences in the biology of P. falciparum account for its much higher
pathogenicity compared to other Plasmodium species infecting humans (reviewed by
Miller et al. 2002). One such differences is that P. falciparum can invade all stages of
RBCs development, from reticulocytes to the more mature stages, and can reach much
higher parasitemias, with up to 50% of the erythrocytes being parasitized. P. falciparum
uses many redundant invasion pathways to infect RBCs that luck a particular receptor
(Dolan et al. 1990, Sim et al. 1994). It possesses two families of homologous proteins,
the Duffy‐Binding Like proteins (DBL, Adams et al. 1992) and the Reticulocytes‐Binding
Like proteins (RBL, Rayner et al. 2005), whose various members can recognize different
receptors on the RBC surface and take part in invasion.
‐ Cytoadherence.
Another important difference is that P. falciparum modifies the surface of RBCs so that
asexual parasites and gametocytes can adhere to the endothelium and asexual parasites
to the placenta. The surface of iRBCs (infected RBCs) is covered with knob‐like
excrescences that are the contact point with host cells. Adherence protects parasite
from destruction, as non‐adherent iRBCs are cleared rapidly in the spleen. Different
parasites can bind to variable numbers and combination of host receptors and this
variability is believed to affect the tissue distribution and pathogenesis of parasites
(Newbold et al. 1997, 1999). A single parasite protein, the P. falciparum Erythrocyte
Membrane Protein 1 (PfEMP1), mediates parasite binding to all the various receptors
(Baruch et al. 1995). PfEMP1 is encoded by the very large and diverse var gene family,
which includes about 60 polymorphic loci in the P. falciparum genome (Su et al. 1995,
Gardner et al. 2002). Although each parasite within a RBC expresses a single var gene,
other var genes in its repertoire can be expressed up to a rate of 2% per parasite growth
cycle, a phenomenon called antigenic variation (Roberts et al. 1992). Other two families
Plasmodium falciparum malaria
7
of genes, rif and stevor, have been more recently characterised, which encode proteins
that have also been implicated in malaria pathogenesis and that undergo antigenic
variation (Cheng et al. 1998, Kyes et al. 1999, Khattab et al. 2008).
CD36 is the crucial host receptor for sequestration in microvasculature. Sequestration of
parasites in the brain may be related to cerebral malaria and may involve Intercellular
Adhesion Molecule 1 (ICAM‐1), while sequestration of parasites in the placenta is
mediated by adhesion to Chondroitin Sulphate A (CSA). iRBCs can also adhere to
uninfected erythrocytes (rosetting) involving Complement Receptor 1 (CR1), and one to
another through platelets and binding to CD36 (clumping).
‐ Metabolic acidosis, anaemia and inflammation.
How adhesion progresses to pathology is a critical issue that is only partially understood.
Sequestration in the blood vessels, rosetting and clumping can cause considerable
obstruction to tissue perfusion. In addition, in severe malaria there may be marked
reductions in the deformability of uninfected RBCs. Individuals with malaria are often
dehydrated and relatively hypovolaemic, which potentially exacerbates microvascular
obstruction by reducing perfusion pressure. The destruction of RBCs is also an inevitable
part of malaria pathogenesis, and the resulting anaemia further compromises oxygen
delivery. Anaemia can also arise from acute haemolysis of uninfected RBCs and
dyserythropoiesis. All these different processes (reviewed by Miller et al. 2002) can
concur to metabolic acidosis (English et al. 1997), which has been recognised as a
principal pathophysiological feature that cuts across various clinical syndromes
(reviewed by Maitland and Marsh 2004). Other mechanisms that might cause damage
to host tissues and organs include local and/or systemic action of bioactive parasite
products, as well as local and/or systemic production and deposition of pro‐
inflammatory cytokines and chemokines by the innate and adaptive immune system in
response to infection, and the activation, recruitment and infiltration of inflammatory
cells (reviewed by Schofield and Grau 2005).
Introduction
8
Clinical manifestations.
The outcome of an infection and progression into pathology depends on the specific and
dynamic combination of host and parasite properties. Clinical disease also changes with
age, immunity and transmission rates (see later in “Immunity to malaria” and “Variant
Surface Antigens and immunity”). Uncomplicated malaria occurs in semi‐immune
individuals while severe malaria and pregnancy‐associated malaria affect non‐immune
subjects, with the groups most at risk in endemic areas being children under five years
of age and primigravidae women, respectively.
‐ Uncomplicated malaria.
The main clinical symptoms of uncomplicated or mild malaria are a combination of
fever, chills and sweats, headache, vomiting, watery diarrhoea, anaemia, jaundice and
swelling of the spleen (splenomegaly). In addition to these symptoms, children can
experience convulsions, coughing and rapid shallow breathing.
Such symptoms are caused by the rupture of iRBCs and by the release of parasite‐
derived toxins and pyrogens. Malaria attacks therefore classically follow a tertian
pattern (occurring every third day), although this is infrequently observed (Marsh and
Makani 2004).
‐ Severe malaria.
As we previously described severe malaria is a complex disorder that affects several
tissues and organs and there is no simple one‐to‐one correlation between the clinical
syndromes and the pathogenic process, where many routes can lead to a common
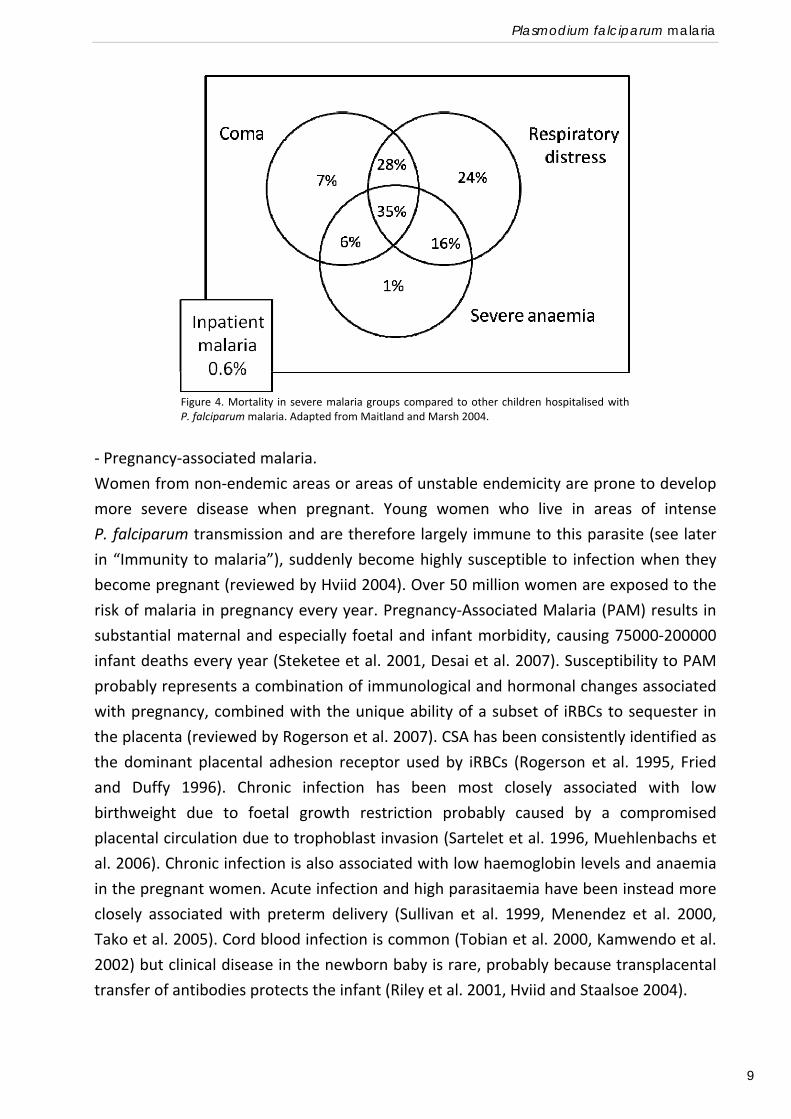
outcome. The most common clinical manifestations in childhood are severe malaria
anaemia, cerebral malaria and respiratory distress (Figure 4, Marsh et al. 1995). Severe
Malaria Anaemia (SMA) is defined by low haemoglobin levels (less than 5 g/dl) and/or
erythrocyte counts (less than 10% packed cell volume) and is usually accompanied by
high parasite counts. Mortality rate in this group is about 1%. Cerebral Malaria (CM)
implies a neurological involvement in the disease, and manifestations can vary from
prostration to impaired consciousness and deep coma, with an associated mortality rate
of about 7%. Finally, respiratory distress is the most apparent clinical manifestation of
metabolic acidosis and the syndrome with highest mortality rate, about 24%. Metabolic
acidosis is the single most important determinant of survival and the best independent
predictor of fatal outcome (Maitland and Marsh 2004).
‐
Plasmodium falciparum malaria
9
‐ Pregnancy‐associated malaria.
Women from non‐endemic areas or areas of unstable endemicity are prone to develop
more severe disease when pregnant. Young women who live in areas of intense
P. falciparum transmission and are therefore largely immune to this parasite (see later
in “Immunity to malaria”), suddenly become highly susceptible to infection when they
become pregnant (reviewed by Hviid 2004). Over 50 million women are exposed to the
risk of malaria in pregnancy every year. Pregnancy‐Associated Malaria (PAM) results in
substantial maternal and especially foetal and infant morbidity, causing 75000‐200000
infant deaths every year (Steketee et al. 2001, Desai et al. 2007). Susceptibility to PAM
probably represents a combination of immunological and hormonal changes associated
with pregnancy, combined with the unique ability of a subset of iRBCs to sequester in
the placenta (reviewed by Rogerson et al. 2007). CSA has been consistently identified as
the dominant placental adhesion receptor used by iRBCs (Rogerson et al. 1995, Fried
and Duffy 1996). Chronic infection has been most closely associated with low
birthweight due to foetal growth restriction probably caused by a compromised
placental circulation due to trophoblast invasion (Sartelet et al. 1996, Muehlenbachs et
al. 2006). Chronic infection is also associated with low haemoglobin levels and anaemia
in the pregnant women. Acute infection and high parasitaemia have been instead more
closely associated with preterm delivery (Sullivan et al. 1999, Menendez et al. 2000,
Tako et al. 2005). Cord blood infection is common (Tobian et al. 2000, Kamwendo et al.
2002) but clinical disease in the newborn baby is rare, probably because transplacental
transfer of antibodies protects the infant (Riley et al. 2001, Hviid and Staalsoe 2004).
Figure 4. Mortality in severe malaria groups compared to other children hospitalised withP. falciparum malaria. Adapted from Maitland and Marsh 2004.
Introduction
10
IMMUNOLOGY OF MALARIA INFECTION.
Clinical immunity to malaria.
Repeated exposure to malaria slowly leads to the development of some degree of
immunity to the parasite.
Subjects with no previous experience of malaria almost invariably become ill on their
first exposure to the parasite, developing a febrile illness which may become severe and
may lead to death. In malaria endemic areas, young children are particularly susceptible.
As subjects age, and experience more exposure to malaria, they acquire the ability to
limit the consequences of infection. Older children and adults therefore develop
essentially complete protection from severe illness and death. However, sterile
immunity is probably never achieved, and even adults continue to be susceptible to
parasitisation (reviewed by Langhorne et al. 2008).
As immunity is acquired with exposure, it develops faster at higher transmission levels.
Under conditions of very high transmission, the majority of malaria deaths occur in
infants under one year. Under moderate transmission the risk of deaths is concentrated
in children under five years, whereas under conditions of low stable endemicity the
ability to limit severe malaria and death may not be established until the early teens
(Snow et al. 1997).
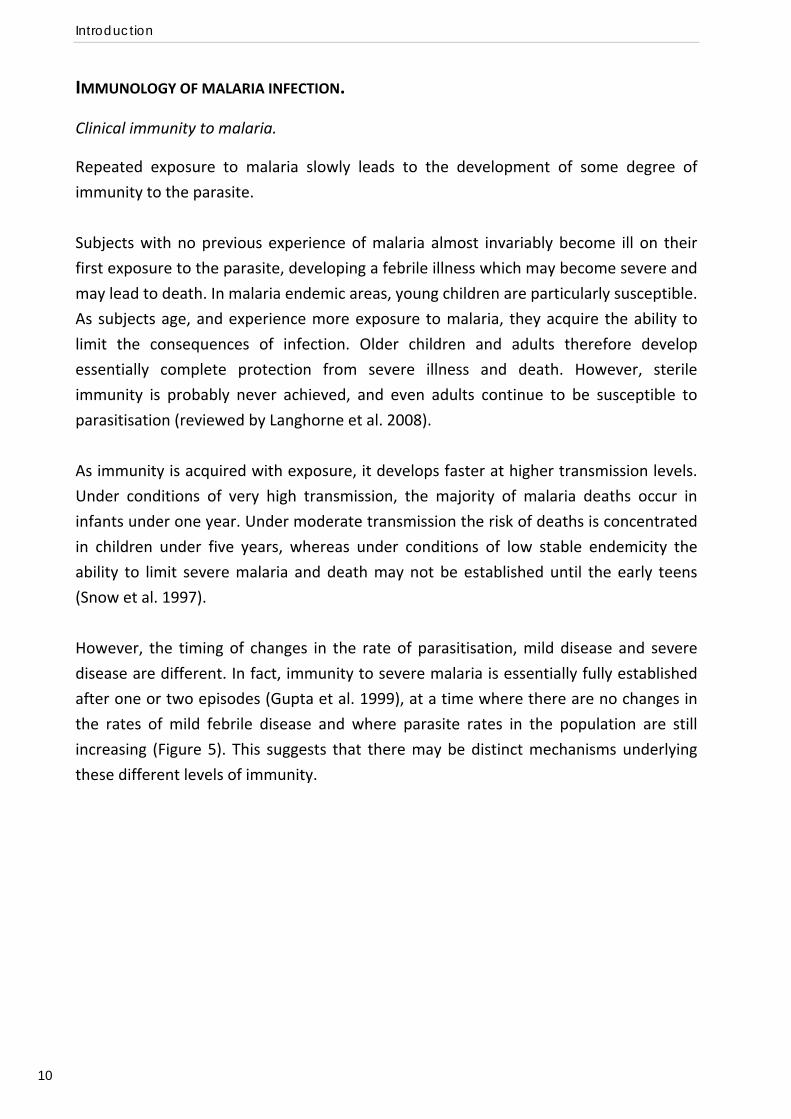
However, the timing of changes in the rate of parasitisation, mild disease and severe
disease are different. In fact, immunity to severe malaria is essentially fully established
after one or two episodes (Gupta et al. 1999), at a time where there are no changes in
the rates of mild febrile disease and where parasite rates in the population are still
increasing (Figure 5). This suggests that there may be distinct mechanisms underlying
these different levels of immunity.
Immunology of malaria infection
11
Mechanisms of protective immunity.
Immune effector mechanisms against each stage of the malaria parasite life cycle are
outlined in Figure 6 and will described here below.
‐ Pre‐erythrocytic stage.
Following their inoculation into the human host, antibodies to the sporozoites could
protect both through opsonisation leading to clearance of the sporozoite before
reaching the hepatocyte (Schoefield et al. 1987, Nussenzweig and Nussennzwieg 1989)
and by blocking invasion of hepatocytes (Pasquetto et al. 1997, Silvie et al. 2004). CSP is
the most abundant protein on the sporozoite and participates in binding to liver cells.
Together with TRAP, LSA‐1 , STARP and AMA‐1 , CSP constitutes a target of neutralising
antibodies (John et al. 2003). Nevertheless, to date there is no clear evidence from field
studies that the presence or level of antibodies recognising the sporozoite correlate
with protection against infection or disease (reviewed by Marsh and Kinyanjui 2006).
This is perhaps not surprising, given the short time to which a sporozoite could be
exposed to antibodies (2‐30 min) (Saul 1987).
Figure 5. Change over time (years) of different malaria indices in the population (severe malaria, mildmalaria and asymptomatic infection). The data are normalised and presented as the percent ofmaximum cases for each population index. Adapted from Langhorne et al. 2008.
Introduction
12
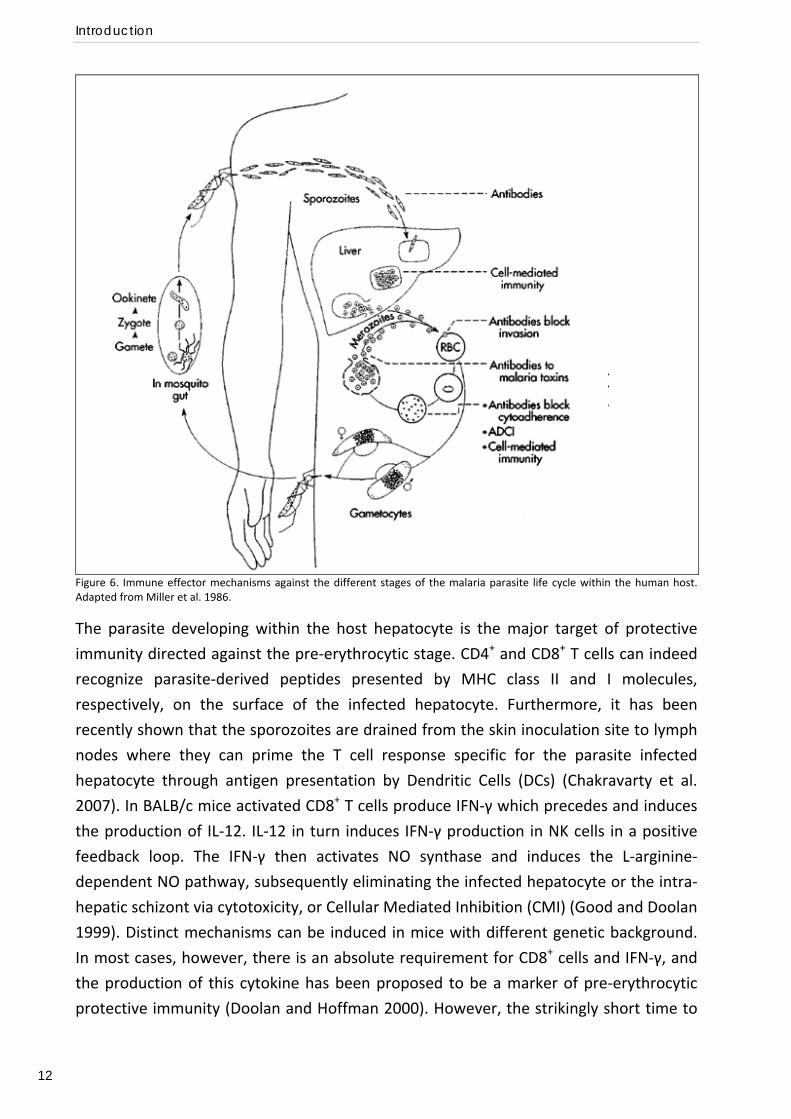
Figure 6. Immune effector mechanisms against the different stages of the malaria parasite life cycle within the human host. Adapted from Miller et al. 1986.
The parasite developing within the host hepatocyte is the major target of protective
immunity directed against the pre‐erythrocytic stage. CD4+ and CD8+ T cells can indeed
recognize parasite‐derived peptides presented by MHC class II and I molecules,
respectively, on the surface of the infected hepatocyte. Furthermore, it has been
recently shown that the sporozoites are drained from the skin inoculation site to lymph
nodes where they can prime the T cell response specific for the parasite infected
hepatocyte through antigen presentation by Dendritic Cells (DCs) (Chakravarty et al.
2007). In BALB/c mice activated CD8+ T cells produce IFN‐γ which precedes and induces
the production of IL‐12. IL‐12 in turn induces IFN‐γ production in NK cells in a positive
feedback loop. The IFN‐γ then activates NO synthase and induces the L‐arginine‐
dependent NO pathway, subsequently eliminating the infected hepatocyte or the intra‐
hepatic schizont via cytotoxicity, or Cellular Mediated Inhibition (CMI) (Good and Doolan
1999). Distinct mechanisms can be induced in mice with different genetic background.
In most cases, however, there is an absolute requirement for CD8+ cells and IFN‐γ, and
the production of this cytokine has been proposed to be a marker of pre‐erythrocytic
protective immunity (Doolan and Hoffman 2000). However, the strikingly short time to
Immunology of malaria infection
13
re‐infection in adult subjects suggests that immunity against the pre‐erythrocytic stage
is not particularly effective, and early studies with direct blood stage challenge indicate
that immune adult remain protected even if this stage of the life cycle is bypassed
(reviewed by Marsh and Kinyanjui 2006).
‐ Erythrocytic stage.
Invasion of red cells is a key step in the establishment of malaria infection and is
therefore likely to be an important target for protective immune responses.
Sera from immunised mice adoptively transfer protection to naive recipients (Cohen et
al. 1961), pointing to the importance of antibodies. Antibodies can be effective in
protection against blood‐stage parasites by various mechanisms. These include
opsonisation of merozoites for uptake through Fc receptors and/or complement
receptors on phagocytes, blocking of invasion of RBCs, complement‐mediated lysis of
the iRBCs, opsonisation of iRBCs for phagocytosis and/or inhibition of adherence to the
endothelium, and neutralisation of malaria toxins. Furthermore, cytophilic antibodies
(IgG1 and IgG3 in humans) can participate with monocytes in Antibody‐Dependent
Cellular Inhibition (ADCI) and killing of iRBCs. The relative importance of each of these
mechanisms is still a matter of debate (reviewed by Langhorne et al. 2008). Although
the identification of immunological correlates of protection is a difficult task and field
studies have not always been consistent, antibodies directed against many antigens on
the merozoite and iRBC surface, or against antigens released during merozoite invasion,
have been identified as being potentially protective (reviewed by Marsh and Kinyanjui
2006). It seems likely that the ability to mount a diverse humoral response to many
antigens is involved in protection (Gray et al. 2007, Osier et al. 2008). It should therefore
be stressed that not only the level but also the diversity of the antibody response as well
as the fine specificity of the antibodies play an important role in immunity.
Also cellular immunity has a substantial role against the erythrocytic stage. It has been
shown that non‐immune volunteers repeatedly challenged with blood stage parasites at
ultra low doses developed immunity to subsequent challenge in the absence of antibody
responses (Pombo et al. 2002).
Early studies showed that T cells specific for malaria parasite can adoptively transfer
protection without apparent antibody responses (van der Heyde et al. 1994, von der
Weid et al. 1996) and have the ability to inhibit parasite growth in vitro (Taylor‐Robinson
et al. 1993, Fell et al. 1994, Amante et al. 1997).
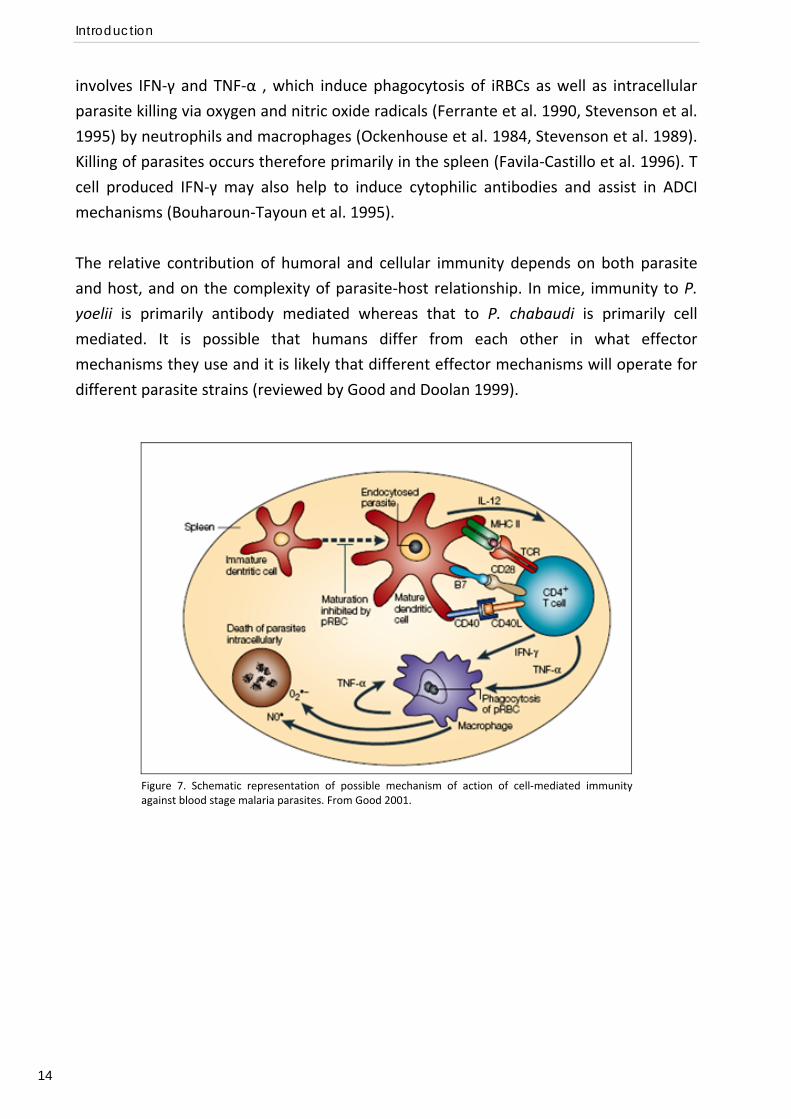
The most generally accepted model of antibody‐independent cellular immunity to the
blood stage is outlined in Figure 7, commencing with activation of CD4+ T cells in the
spleen, after antigen presentation by DCs. T cell immunity is regulated by IL‐12 and
Introduction
14
involves IFN‐γ and TNF‐α , which induce phagocytosis of iRBCs as well as intracellular
parasite killing via oxygen and nitric oxide radicals (Ferrante et al. 1990, Stevenson et al.
1995) by neutrophils and macrophages (Ockenhouse et al. 1984, Stevenson et al. 1989).
Killing of parasites occurs therefore primarily in the spleen (Favila‐Castillo et al. 1996). T
cell produced IFN‐γ may also help to induce cytophilic antibodies and assist in ADCI
mechanisms (Bouharoun‐Tayoun et al. 1995).
The relative contribution of humoral and cellular immunity depends on both parasite
and host, and on the complexity of parasite‐host relationship. In mice, immunity to P.
yoelii is primarily antibody mediated whereas that to P. chabaudi is primarily cell
mediated. It is possible that humans differ from each other in what effector
mechanisms they use and it is likely that different effector mechanisms will operate for
different parasite strains (reviewed by Good and Doolan 1999).
Figure 7. Schematic representation of possible mechanism of action of cell‐mediated immunityagainst blood stage malaria parasites. From Good 2001.
Immunology of malaria infection
15
Variant Surface Antigens and immunity.
Three families of variant genes have been characterized in P. falciparum: the var genes
encoding PfEMP1; the repetitive interspersed family (rif) of genes; and the subtelomeric
variant open reading frame (stevor) genes (Deitsch and Hviid 2004). Within the genome
of the laboratory strain 3D7, there are 59 intact var, 149 rif and 28 stevor genes
(Gardner et al. 2002). Variant Surface Antigens (VSA) are considered one of the main
targets of protective IgG in malaria (Bull et al. 1998, Nielsen et al. 2002). There is large
evidence that parasites causing clinical disease express VSA to which the patient has no
pre‐existing antibody response, and that the immune system responds to a clinical
disease episode by mounting an antibody response with specificity for the VSA
expressed by the parasite (Marsh and Howard 1986, Bull et al. 1998, Giha et al. 1999,
Ofori et al. 2002). This observation, together with the fact that each parasite clone
possesses many variants, and that there exists high variability between clones, fits well
with the slow acquisition of significant immunity. It has also been observed that
different VSA are expressed by a parasite clone during severe malaria and mild malaria
episodes (Bull et al. 2000, Nielsen et al. 2002, Tebo et al. 2002). Certain VSA bind more
efficiently to specific endothelial receptors than others and are therefore relatively
more conserved because of functional constraints (VSA Group A). These antigens are
frequently and highly recognised by antibodies and are associated with severe malaria
(VSASM) in individuals with little pre‐existing immunity, while VSA that bind less
efficiently and are rarely and poorly recognised are associated with uncomplicated
malaria (VSAUM) and asymptomatic infection in semi‐immune people. These findings can
partly explain why protection from severe and life‐threatening disease precede
immunity to uncomplicated malaria and asymptomatic infection (reviewed by Hviid
2005).
Susceptibility to PAM is highly concentrated among primigravidae, suggesting that the
parasites causing PAM are different from those causing malaria in the non‐pregnant
population and that protective immunity is developed relatively easily once the immune
system has been exposed to such parasites. Women who have never been pregnant,
men and children do not have antibodies that can recognize the VSA expressed by
placenta‐sequestering parasites (VSAPAM) (Beeson et al. 1999, Ricke et al. 2000).
Furthermore, levels of anti‐ VSAPAM IgG in sera from pregnant women increase with
parity (Fried et al. 1998, Ricke et al. 2000). These observations suggest that protective
immunity is mediated by specific antibodies. An unusually structured and highly
conserved VSA has been characterized that binds to CSA in the placenta and that
possesses all the features of a VSAPAM. This is the product of the VAR2CSA gene (Salanti
et al. 2003 and 2004, Tuikue Ndam et al. 2005, Duffy et al. 2005, Barfod et al. 2007).
Introduction
16
Immune evasion strategies.
Different strategies of immune evasion have been unravelled in malaria parasites
ranging from intracellular parasitism, a primitive escape mechanism to avoid antigen
recognition observed in many pathogens, to antigen diversity and antigenic variation
through sequestration in the microvasculature (see “Pathogenesis and clinical
manifestations”). The P. falciparum genome encodes for more than 5300 predicted
proteins, many of which are also highly polymorphic (Gardner et al. 2002). Most
responses induced to many polymorphic antigens may not be protective and may
instead act as a smoke screen. Furthermore, antigenic variation is an effective
mechanism for immune escape to antibody‐dependent killing. Finally, there is
accumulating evidence that the parasite has evolved ways of manipulating the host
immune system. Here we discuss some examples of such complex interaction between
parasite and host.
Variant epitopes of the CSP antigen have been described to operate Altered Peptide
Ligand (APL) mediated antagonism which inhibits T‐cell priming by HLA‐class I antigen
presentation (Gilbert et al. 1998, Young et al. 2005). The T cells are capable of
proliferating on response to the antigen but not of killing or of producing protective
cytokines such as IFN‐γ. The same variant epitopes are also able to mutually interfering
with cytotoxic memory T cells from malaria exposed donors, thereby abolishing their
lytic activity (Plebanski et al. 1999). This interference with the induction of protective T
cell responses by APL‐mediated antagonism may be a strategy to maintain a population
of exposed but functionally “naive” hosts.
Malaria infection can also lead to anergy and deletion of parasite‐specific T cells, but not
T cells of different specificity, providing a strategy for the parasite to potentially delay
the development of immunity (Hirunpetcharat and Good 1998).
The interaction of iRBCs with DCs has been shown to inhibit normal DC maturation in
both humans (Urban et al. 1999) and mice (Ocana‐Morgner et al. 2003). In humans, this
inhibition is possibly mediated by the interaction of PfEMP1 on the surface on the iRBC
with CD36 on DCs (Urban et al. 2001). Also macrophages‐monocyte function can be
inhibited through the interaction with iRBCs (Leitner and Krzych 1997) and/or by the
malaria pigment haemozoin (Skorokhod et al. 2004). IL‐10 produced by parasite‐
modulated DCs and macrophages can inhibit CD4+ T cell activation (Urban et al. 2001).
However, the ability of iRBCs to modulate DCs and thereby the activation of T cells is still
controversial, as different studies have shown fully functional activation of DCs in
response to Plasmodium infection (Seixas et al. 2001, Coban et al. 2002, Perry et al.
2004).
Immunology of malaria infection
17
PfEMP1 has also been shown to down‐regulate the host immune response by
suppressing the production of the pro‐inflammatory cytokine IFN‐γ by Peripheral Blood
Mononuclear Cells (PBMCs) in a CD36 independent manner (D’Ombrain et al. 2007).
CD4+CD25+ T regulatory cells (Tregs) suppress CD4+ and CD8+ T cell activation and are
believed to contribute to the establishment of chronic infections. Depletion of Tregs
protects mice from a lethal strain of P. yoelii and increases T cell responses against
parasite antigens (Hisaeda et al. 2004). Malaria infection has been shown to induce
Tregs and the production of down‐regulatory cytokines such as TGF‐β and IL‐10 both in
mice (Omer et al. 2003a, 2003b) and humans (Walter et al. 2005), thereby limiting the
magnitude of immune responses to the parasite and ensuring rapid parasite growth.
TGF‐β and IL‐10 produced by Tregs can also inhibit the generation of central and
memory effector cells (Taylor et al. 2006).
Immunological memory.
Immunity to malaria develops relatively slowly, is not sterile and is often said to wane
quickly when immune adults leave malaria‐endemic regions, which suggests that
continued exposure to malaria antigens is required not only for the generation of
effector and memory cells but also for their persistence (reviewed by Langhorne et al.
2008).
It is apparent that immune responses to malaria, particularly antibody responses to
defined antigens, are often extremely short lived (Deloron and Chougnet 1992) and may
fail to boost upon subsequent exposure to the parasite (Achtman et al. 2005),
suggesting that there may be defects in establishing functional immune memory.
Contrasting evidence is available regarding the presence of memory B cells. One study
reported that anti‐P. falciparum memory B cells are present in adults for over 8 years
without evident exposure (Kinyanjui et al. 2007), whereas another study has reported
the presence of serum antibody but only very low frequencies of malaria‐specific
memory B cells in children exposed to the parasite (Migot et al. 1993). Further studies
are therefore sought in this direction.
The formation of both central and effector CD8+ memory T cells requires priming by DCs
in the skin‐draining lymph nodes (Chakravarty et al. 2007) and help by CD4+ T cells
(Carvalho et al. 2002, Morrot et al. 2005). These cells can leave up to 6 months, in
apparent contrast with the notion that induced immunity to irradiated sporozoite is
short lived (Scheller et al. 1995).
As previously described (“Immune evasion strategies”), the parasite is able to
manipulate the host immune system during the course of infection and to interfere with
B cell and T cell activation and with the generation of immunological memory. It is
Introduction
18
therefore likely that this interference of Plasmodium infection with the host immune
system results in short‐lived immunity.
Malaria as an immune‐mediated disease.
Two epidemiological observations suggest that severe malaria can be at least in part an
immune‐mediated disease. Firstly, cerebral malaria typically occurs in children who have
already acquired a significant degree of anti‐malarial immunity, as demonstrated by
lower mean parasite density and resistance to severe anaemia. One potential
explanation is that immunological priming occurring at first infection may lead to
immunopathology upon re‐infection. Secondly, among travellers from non endemic
areas, severe life threatening malaria is more common in adults than children (reviewed
by Artavanis‐Tsakonas and Riley 2003).
It has long been apparent that many of the features of severe malaria are similar to
those of sepsis (Hotchkiss et al. 2003) and there is evidence that over‐vigorous or
disordered immune responses are central in pathogenesis (reviewed by Schoefield and
Grau 2005). For example, although TNF‐α is crucial for protective immune responses
against the parasite, high serum concentration are associated with increased disease
severity and death (Kwiatkowski et al. 1990). The trigger for the production or over‐
production of pro‐inflammatory cytokines may depend on the type of interaction
between parasite and host cells during the course of infection.
It also seems that the balance between pro‐ and anti‐inflammatory cytokines may be
critical to determine an effective immune response against infection in the absence of
pathology. Clinical immunity could therefore correspond to the ability of regulating the
immune responses in a way to achieve parasite clearance while avoiding detrimental
effects (Artavanis‐Tsakonas et al. 2003).
Genetics of malaria infection and immunology in natura.
There are many basic aspects of the immunology of Plasmodium infection that are not
fully understood, and many others that have been not investigated yet, hampering our
understanding of how people become immune to malaria. Further research is therefore
desirable to achieve a picture as clear as possible of mechanisms of natural immunity,
an important starting point for vaccine development.
The understanding of immunity and susceptibility to malaria has been hindered by the
complexity of parasite‐host interaction and by the inherent difficulty of distinguishing
epiphenomena from events truly on the causative pathway, as well as protective from
pathological responses.
Immunology of malaria infection
19
Genetic approaches may be of great value for dissecting the complexity of immune
responses to malaria in natura by providing new insights into molecular interactions
between parasite and host. Genetics of susceptibility to malaria may therefore
represent a research complement to experimental immunology in vitro and in vivo
(Quintana Murci et al. 2007).
Such genetic approaches will be described in the next section of the Introduction and
will be applied to particular problems in malaria immunology, whose understanding
represents the aim of the present investigation.
Introduction
20
GENETICS OF SUSCEPTIBILITY TO MALARIA: FROM THE RED BLOOD CELL TO THE WHOLE
GENOME.
Malaria as an evolutionary force shaping the human genome.
When the genetic basis of some important red blood cell disorders was unravelled in
the first half of last century, geneticists were puzzled with the biological paradox of the
high frequency reached in some populations by these heavily deleterious mutations. It
was the case for example of alpha‐thalassemia, causing mycrocitemic anaemia in many
areas of the Mediterranean. Haldane proposed that the mutant allele reached and
maintained its high frequency not by means of an exceptionally high mutation rate, but
due to selection. The disadvantage of the mutant homozygote state would have been
counter‐balanced by an advantage of the heterozygote state (the concept of balanced
polymorphism). Simple observations lead Haldane to formulate the hypothesis that P.
falciparum could be the actual selective agent: its present or past distribution largely
overlaps with that of thalassemia; it is a parasite causing a deadly infection and affecting
humans for a long time; it strictly interacts with red blood cells (Haldane 1949).
A vast body of evidence now exists that many red blood cell disorders are protective
against malaria (reviewed by Williams 2006). Haldane’s hypothesis represented indeed
the starting point for genetics of susceptibility to malaria and more broadly to infectious
diseases. In the last few years research has been increasingly focusing on genes
encoding immunological mediators. A better understanding of the effects of malaria on
the evolution of the immune system can potentially shed a light on the genetic basis of
some immunological disorders, for example autoimmune diseases.
The idea that malaria has been acting as a major evolutionary force in recent human
history (reviewed by Kwiatkowski 2005) has been also the fertile ground for the
development of tools to interrogate the human genome for signatures of positive
selection (Tishkoff et al. 2001, Hamblin et al. 2002, Sabeti et al. 2002, reviewed by
Sabeti et al. 2006). Association findings of candidate‐gene studies are now increasingly
supported by evidence of selection at the locus. More importantly, signatures of malaria
selection can be used with great value to direct the design and interpretation of
association studies, now moving towards a genome‐wide era.
Genetics of susceptibility to malaria
21
Susceptibility to malaria is a partially heritable trait.
Malaria epidemiology studies have extensively shown that, within a population, a high
degree of variation exists between individuals with respect to malaria susceptibility
phenotypes, including parasite load, disease incidence and severity (Greenwood et al.
1991), and the magnitude and type of immune responses to malaria antigens (Good et
al. 1988, Troye‐Blomberg et al. 1989, Riley et al. 1990). These observations have
stimulated geneticists and genetics epidemiologists with the fascinating challenge of
dissecting the environmental and genetic components, if any, of individual variation.
Longitudinal data of parasite densities in Cameroonian families were analysed by Abel
and colleagues (1992). Mean parasite densities adjusted for sex, age, area of residence
and season showed a bimodal distribution, which the authors interpreted as suggestive
of a major gene effect. Segregation analysis confirmed a genetic model with a major
recessive genetic factor predisposing to high infection levels. In a study of malaria
infection during pregnancy in Burkina Faso, mean parasite densities, further adjusted for
parity, also showed a bimodal distribution (Cot et al. 1993). Further pedigree analysis
conducted in Cameroon confirmed the evidence of genetic factors controlling infection
levels, but were consistent with a complex mode of inheritance instead that with simple
Mendelian transmission of a single gene. Interestingly, a strong interaction between age
and putative genetic factors was observed, with the magnitude of the genetic effect
being greater in children than adults (Garcia et al. 1998a). Very similar results have been
obtained from studies carried out in large family samples from urban and rural areas of
Burkina Faso. High sib‐sib correlation of blood infection levels was observed in both
areas with an estimated heritability (i.e. the percentage of the phenotypic variance
explained by genetic factors) of about 60%. A significant interaction between age and
genetic factors was herein confirmed. As in the previous study, segregation analysis
suggested a complex genetic model, with a major codominant gene and many other
genes with smaller effects (Rihet et al. 1998a).
The first study aiming to assess the extent of genetic determination of susceptibility to
clinical malaria was conducted by Jepson and colleagues (1995) in a rural area of The
Gambia, and based on a longitudinal survey of twin children. Monozygotic (MZ) twins
were found to more likely to both experience a fever malaria attack than were dizygotic
(DZ) twins, suggesting a role for genetic factors on disease development.
The relative contribution of genetic and non genetic factors to infection and disease
burdens was also investigated by pedigree‐based variance component analysis
conducted in a rural population of Sri Lanka (Mackinnon et al. 2000). The heritability
was estimated to be around 15% for the incidence of both P. falciparum asymptomatic
Introduction
22
and symptomatic infections, and around 10% for the intensity of clinical symptoms. A
similar study was conducted in two cohorts of Kenyan children, where the incidence of
mild clinical malaria and hospital admissions to malaria were monitored. In both cases,
it was estimated that 25% of the total variation was explained by additively acting host
genes and that haemoglobin S, the strongest known resistance genetic factor (Allison
1954, Hill et al. 1991, Ackerman et al. 2005), explained only 2% of the total variation,
suggesting the existence of many unknown protective genes, each individually resulting
in small population effects (Mackinnon et al. 2005).
Although somewhat limited by a retrospective analysis of family history, a careful study
conducted in Mali showed that the odds that a child will develop severe disease in a
lifetime are greatly increased when a relative had a history of disease (Ranque et al.
2005). This was observed for both CM and SMA, therefore suggesting a strong familiar
aggregation for these two major severe complications of malaria disease. It should be
stressed that this is the only familial study of severe malaria. This is likely to be a
reflection of the intrinsic difficulty to ascertain the affected status of relatives, given the
transient nature of the illness and the lack of medical records. Nevertheless, the genetic
basis of severe malaria has been intensively investigated, as life‐threatening disease is a
phenotype whose understanding is of great interest for therapeutics and vaccine
development. Furthermore, it is a powerful phenotype for association studies as it
occurs in a small (1‐2%) proportion of the population, which is likely to be enriched for
genetic factors with strong effects.
The immune responses to malaria have also been the object of extensive investigation
aiming at dissecting their genetic regulation. A pioneer study of antibody levels to
malaria antigens has been carried out in a small sample of twin pairs from Liberia and
Madagascar by Sjoberg and colleagues (1992). Variation of antibody titres to RESA (Ring
Erythrocyte Surface Antigen) increased with decreased consanguinity: a greater
concordance in the antibody levels was observed in MZ twins than in DZ twins or age‐
and sex‐matched siblings and unrelated subjects exposed to similar transmission levels.
A comparison of both cellular and humoral immune responses to a panel of malaria
antigens has been carried out between a large sample of MZ and DZ twin pairs resident
in rural villages of The Gambia. For almost 50% of the antigens a much higher
concordance in both lymphoproliferative responses and antibody levels was observed in
MZ twins, showing evidence of a significant heritable component (Jepson et al. 1997a).
Variance component analysis has been applied in a pedigree‐based study of cellular and
humoral responses to various malaria antigens in adults and children from Papua New
Guinea. Substantial familial aggregation was evident for humoral responses (total IgG
and IgG subclasses) to certain antigens (RESA and MSP‐2). Although the study was
Genetics of susceptibility to malaria
23
somehow hampered by the difficulty of dissecting genetics from household effects, it
suggested some degree of heritability for immune responses to malaria antigens
(Stirnadel et al. 1999, 2000a, 2000b). The IgG subclass responses to a number of
antigens and parasite crude extracts were also inspected in a study conducted in two
areas of Burkina Faso with different transmission levels (urban and rural). Isotypic
distribution and levels of IgG showed high sibling correlation in both areas, further
strengthening the idea that immune responses to malaria are at least in part genetically
regulated (Aucan et al. 2001).
A somewhat more indirect but very intriguing line of evidence that genetics plays a role
in shaping individual immune response to malaria has come from studies of different
ethnic groups. The Fula of West Africa have been shown to mount a stronger immune
response to malaria and to be less affected by the disease than other ethnic groups
residing in the same region. Epidemiological surveys conducted in Burkina Faso showed
that the Fula have higher antibody titres against several malaria antigens than their
neighbours, the Mossi and the Rimaibé, despite equivalent exposure to infection. Likely
as a consequence of their more efficient immune response, the Fula also have lower
parasite rates and densities and fewer fever malaria attacks (Modiano 1996, 1998,
1999). Similarly, in studies conducted in Mali it was observed that the Fula have higher
levels if IgG and IgE against crude malaria antigens, higher spleen enlargement rate,
lower parasite rate and lower prevalence of clinical malaria than the Dogon ethnic
group (Dolo et al. 2005). The typing of HLA class I alleles has provided evidence that the
Fula are genetically distant from sympatric groups (Modiano 2001a), strongly suggesting
that genetic factors could be responsible for the differences in susceptibility to malaria
observed.
In conclusion, much evidence supports the concept that heterogeneity in susceptibility
to malaria between individuals is partly genetically determined. From a genetic
perspective resistance to malaria can be considered as a complex trait, as it likely to
involve several different genes and their interactions with many individual and
“environmental” variables ‐ such as age, transmission intensity, parasite genetic factors,
co‐infections with other pathogens and the socioeconomic status of the human host
(Miller 2002, Kwiatkowski 2005).
Introduction
24
Identifying genome regions of interest through linkage studies.
Linkage studies are the classical approach applied by geneticists in the first attempt to
identify the genetic factor(s) underlying a phenotypic trait of interest, once a genetic
component has been demonstrated. Linkage is a physical genetic relationship between
loci, and it is assessed by inspecting co‐segregation of genes with the phenotype locus
within families. Although they proved quite successful for rare Mendelian disorders,
they have more limited power of detecting small additive effects of several different
genes, the most likely scenario for common complex traits. Nevertheless they can
provide useful insights to direct further association studies.
Sib‐pair linkage analysis was carried out in a small sample of families from Cameroon to
further investigate the genetic control on blood infection levels that was suggested by
previous segregation analysis. The role of five candidate genome regions was
investigated: 6p21 (HLA loci), 2q13‐21 (IL1), 14q11 (TCRA), 7q35 (TCRB) and 5q31‐33
(cluster of cytokines and growth factors encoding genes). A trend of linkage was
observed for the 5q31‐33 region (Garcia et al. 1998b). Interestingly, linkage to
Schistosoma mansoni infection intensity was previously reported for the same region
(Marquet et al. 1996).
Taking on from these observations, a sib‐pair linkage analysis of the 5q31‐33 region was
performed on a larger sample from Burkina Faso. The results showed significant linkage
of this genome region to parasite density and the heritability of the trait accounted by
the locus was estimated to be about 45% (Rihet et al. 1998b).
This finding was later confirmed in an independent sample of nuclear trios from Burkina
Faso, where linkage and association between blood infection levels and the 5q31‐33
region were detected (Flori et al. 2003a). The locus of linkage has been named PfIL, for
P. falciparum infection levels.
A further confirmation resulted from comparative linkage mapping of regions
homologous to the 5q31‐33 in mice, where a Quantitative Trait Locus (QTL) controlling
P. chabaudi infection could be identified on chromosome 11 (Hernandez‐Valladares et
al. 2004).
Following on their twin study in The Gambia, Jepson and colleagues used the affected
sib pairs method to evaluate linkage of HLA loci to mild malaria. They compared the
observed and expected distribution of microsatellite alleles at HLA loci inherited
identical by descent in concordant DZ twins. A significant non random sharing of alleles
was observed, and the maximum lod (logarithm of odds) score was estimated for the
TNFA locus (Jepson et al. 1997b). These findings were confirmed by a pedigree‐based
Genetics of susceptibility to malaria
25
linkage study conducted in Burkina Faso, with a significant multipoint lod score in the
region, and a peak close to the TNFA gene (Flori et al. 2003b).
So far, linkage analysis has been focused on selected regions of the genome. These
studies have provided interesting results and have stimulated further investigation.
Actually many candidate genes lying in the regions of linkage signals have been the
object of association studies. However, a hypothesis free and comprehensive search for
genetic determinants of malaria susceptibility was not carried out until very recently.
A first autosome‐wide linkage scan of malaria infection intensity and mild disease has
been carried out in rural Ghana. The strongest and significant linkage was observed for
the number of clinical malaria episodes to chromosome 10p15.3‐14. The locus‐specific
heritability was estimated to be around 37% and the locus was named PfFE1 (P.
falciparum‐fever episode 1). Further evidence of linkage was found for parasite density
to chromosome 13q (PfPD2, P. falciparum parasite density 2). Somehow surprisingly, no
evidence of linkage was obtained for the 5q31 region to parasite density, while a weak
signal of linkage was observed for this region to malarial anaemia. The authors stressed
the intrinsic difficulty of carefully defining the phenotype of malaria intensity infection,
and it might be argued that this could partially explain the divergence of linkage results
(Timmann et al. 2007). Beside its comprehensive approach, the other major advantage
of this study is the use of single nucleotide polymorphisms (SNPs) instead of
microsatellites, with the result that much narrower regions of linkage, around 3 Mb
large, have been identified.
A genome‐wide scan has also been conducted in extended pedigrees from Senegal. The
major strength of this study is that is based on a very long (over a decade) longitudinal
survey of parasitological and clinical data, the longest active case follow up to date, and
therefore allows best accuracy in the definition of the phenotypes. Furthermore analysis
is carried out independently for two villages, Dielmo and Ndiop, characterized by
different transmission intensity as well as ethnicity, enabling comparison of the results
under different environmental and genetic backgrounds. For the number of clinical
malaria episodes linkage was observed only in Dielmo to regions 5p15‐23 and 13q12‐22.
For parasite density linkage was confirmed to the 5q31 region, but again only in the
Dielmo village (Sakuntabhai et al. 2008). This was despite the fact that both phenotypes
showed substantial and similar heritability in the two villages. The authors argued that
due to much higher transmission intensity, the individual variation in exposure to
infective bite (a major non genetic factor) would be reduced in Dielmo, increasing the
power of detecting genetic factors.
Introduction
26
Differences in the outcome of the Ghanaian and Senegalese investigations are most
likely accounted by a combination of different study design and different underlying
genetic backgrounds. These newly identified linkage regions are therefore worthy of
attempting replication in independent standardised studies. Furthermore, fine‐scale
association mapping seems desirable, in order to identify the actual genetic factors
underlying the signals observed.
Insights from comparative analysis of gene expression profiles.
Gene expression analysis offers an opportunity to identify mediators that are critical to
the host response to a pathogen (Cummings et al. 2000). A greater understanding of the
gene‐regulatory networks involved in immune response and pathogenesis is of valuable
use to inform and prioritize the selection of candidate genes/pathways for genetic
association studies. Few examples will be described.
A genome‐wide expression analysis has been carried out in Kenyan children hospitalized
with either clinical malaria or other febrile infectious diseases, to provide a molecular
perspective of the host acute response to malaria (Griffiths et al. 2005). Host gene
expression has been measured in whole blood, at hospital admission and after recovery,
and expression intensities have been correlated with the clinical parameters of the
children. A cluster of genes exhibited correlation with absolute neutrophil count. Based
on changes in expression of these genes, febrile and convalescent children could be
assigned to separate groups, indicating that neutrophil response plays a role in response
to acute infection. A second gene cluster was associated with parasite density, and
children with malaria could be distinguished from non‐malaria patients on the basis of
different expression profiles. The cluster included genes encoding for proinflammatory
molecules, markers of cellular stress and proapoptotic mediators. The response patterns
and molecules identified are worthy of further investigation.
To describe the transcriptional changes that occur with malaria infection and disease,
genome‐wide expression levels have been compared in PBMCs from uninfected naïve
subjects, presymptomatic experimentally infected naïve volunteers, and naturally
infected individuals with clinical malaria (Ockenhouse et al. 2006). Common features of
gene expression in presymptomatic and symptomatic infected subjects, with respect to
uninfected ones, can provide important clues on the molecular mechanisms that are
activated very early in infection. In both groups, induced expression was observed for
genes encoding members of Toll Like Receptors (TLRs) and IFN‐γ signalling pathways,
genes that function in phagocytosis (Fc receptors) and inflammation (TNF‐α, IL1, IL6),
Genetics of susceptibility to malaria
27
genes involved in antigen processing and presentation by HLA molecules, and genes
involved in cellular stress (heat shock proteins). On the other hand, features unique to
symptomatic subjects can shed a light on the pathophysiological processes of malaria. In
malaria patients only, genes involved in immune regulation (IL10), apoptosis (FasL,
MAP‐kinases), sustained proinflammatory response and fever (IL1 signalling) were
induced. It is noteworthy that, despite very different experimental design and analytical
methods, the two studies described above provided similar results in terms of the
molecular pathways that seem to be activated during acute malaria infection.
Linkage disequilibrium association mapping.
Linkage studies classically define long chromosomal region and linkage disequilibrium
association mapping can be used to further localise the susceptibility locus.
Alternatively, we might have some previous knowledge (for example, as obtained from
gene expression analysis) about the biological function of a gene and a plausible
mechanistic hypothesis for its relevance to malaria that we wish to test by conducting
an association study.
While linkage is a specific genetic relationship between loci, association is simply a
statistical statement about the co‐occurrence of alleles and phenotypes. Association
studies therefore compare allele frequencies between cases and controls to identify
disease susceptibility genes. The association between a disease and a polymorphic
marker can be the result of either direct causation or linkage disequilibrium. Linkage
disequilibrium association mapping relies on recombination to narrow the genomic
region related to the phenotype. Because the study sample is drawn from the general
population, it uses a measure of allelic association or site correlation, known as linkage
disequilibrium (LD), to detect historical recombination. The assumption is that the
assayed or genotyped allele will be in LD or associated with the causative allele; thus,
the assayed allele would be overrepresented among cases compared with controls
because it is highly correlated with the disease‐causing allele. The particular allele
associated with the disease may be different in different populations. Because linkage
disequilibrium is a short‐range phenomenon, if an association is found, it defines a small
candidate region to search for the susceptibility allele. Furthermore, association is more
powerful than linkage for detecting weak susceptibility alleles (Strachan and Read
2004).
Several association studies have been performed to identify malaria susceptibility
genes. Early investigations have mainly focused on erythrocytes variants, but increasing
attention is being paid to molecules that mediate cytoadherence by iRBCs and to
Introduction
28
immune‐related genes. A number of recent publications comprehensively reviewed the
available data on genetic associations with malaria phenotypes (Kwiatkowski 2005,
Williams 2006, Verra et al. 2008), a task which is beyond the scope of this thesis.
Searching for regulatory determinants of gene expression.
A positive association result leaves open the question of whether the DNA variant is
functionally important itself or is serving as a genetic marker for a co‐inherited
functional locus. The potential importance of the control of gene expression in complex
disease is emphasized by recent studies implicating regulatory polymorphisms in
susceptibility to a number of diseases (Knight 2005). Variation in gene regulation
provides a way of fine tuning the cellular response. DNA polymorphisms affecting gene
expression may therefore provide a sensitive substrate for phenotypic adaptation, in
contrast to coding DNA where alteration of protein/structure would have gross effects
on phenotype. Thus, it seems relevant to interrogate DNA polymorphisms for their
effect on gene expression in order to identify regulators of malaria susceptibility.
Substantial variation in gene expression levels between individuals has been described
in humans amongst other species (Shadt et al. 2003, Cheung et al. 2003). There is
growing evidence that allele‐specific differences in gene expression occur in autosomal
genes which do not show genomic imprinting. These differences, often of modest
magnitude, have been shown to be inheritable (Yan et al. 2002, Monks et al. 2004,
Pastinen et al.2004) and can be mapped as a quantitative trait (Morley et al. 2004) to
DNA elements involved in the mechanisms underlying transcriptional control (Knight
2005) and/or splicing (Pagani et al.2004, Hull et al. 2007). Such regulatory
polymorphisms can modify the expression levels of a transcript or its isoforms acting in
a cis or trans manner. Cis‐acting factors influence transcript synthesis or stability in an
allele‐specific manner and are relatively close to the gene(s) that they regulate (e.g. DNA
sequence variation at enhancers, silencers, splicing sites). Trans‐acting factors can affect
both alleles of a gene and are not necessarily close to the gene(s) that they regulate,
often residing on a different chromosome (e.g. a polymorphism affecting the
structure/function of a transcription factor).
Computational‐based approaches can be used to predict regulatory elements, such as
transcription factor binding sites within promoters (e.g. using the TRANSFAC database),
coupled with interspecies comparative analysis to identify evolutionary conserved
sequences. The accuracy of these predictions is rapidly increasing as experimentally
derived data on protein‐DNA binding are made available (Linnell et al. 2004). In vitro
Genetics of susceptibility to malaria
29
assays comprise the Electro‐Mobility Shift Assay (EMSA) (Tournamille et al. 1995), which
has been applied to the functional characterization of many candidate SNPs, but is not
an efficient screening method, as only short probes in a known DNA region can be used.
DNA‐seI footprinting assay offers considerable advantages in this respect. Nevertheless,
the resolution of the regulatory elements is limited by the preferential cleavage sites of
the DNA‐seI and by the size of the enzyme itself. The most common strategy to assess
the effect of genetic variation on gene expression in vitro is to use reporter gene assays,
in which cells are transiently transfected with allele‐specific promoter constructs and
the transcriptional activity of the synthetic reporter is measured (Rockman and Wray
2002, Hoogendoorn et al. 2003). These methods are mostly used to validate the effect
of candidate regulatory polymorphisms and are not suitable as a hypothesis‐free
discovery tool. Furthermore, the results obtained are strongly context dependent and
the extent to which reporter construct data reflects the transcription of a gene of
interest in its relevant cellular and chromatin context is often uncertain.
Ex vivo cell stimulation studies provide the main advantage that the system closely
mirror physiological conditions and offer the opportunity of using knowledge of the
genetic background of the cell. High‐throughput expression platforms have been
recently used to assess total RNA amounts for virtually all known transcripts and, taking
advantage of HapMap (www.hapmap.org) genotype data, have attempted to uncover
cis‐acting variants by investigating the correlation between marker genotypes and gene
expression levels (Monks et al. 2004, Morley et al. 2004, Cheung et al. 2005, Stranger et
al. 2005). This is a very powerful approach, whose major drawback is that the
comparison of genotyping groups across samples inevitably introduces experimental
noise. These problems can be somewhat overcome using allelic imbalance methods
(Forton et al. 2006, Natividad et al. 2008) that compare the relative abundance of mRNA
originating from the two alternative alleles of the same gene within the same
(heterozygote) cellular sample. Alleles are expressed in their normal genomic and
chromatin context, and the use of alternative alleles of a locus as internal controls for
one another enables higher sensitivity in the detection of cis‐acting effects as well as
avoidance of potential bias due to environmental influences.
Introduction
30
Towards genome‐wide and multi‐centre association studies.
A number of associations have been reported between malaria‐related phenotypes, and
above all severe malaria, and polymorphisms of candidate loci. For many
haemoglobinopathies, even though the mechanism of protection has not been fully
understood yet, the actual functional variant has been unequivocally identified and
consistent observations on its protective role have been made. On the other hand, for
many genes related to the red cell surface and oxidative stress, cytoadherence and
immune function, no clear‐cut result has been obtained. Actually, few of these
associations have been tested in several independent studies and/or in different
populations. When replication has been attempted results have often been variable. In
some cases, the initial finding could not be replicated. In others, a polymorphism
associated with increased risk of severe malaria in a study was associated with
protection against severe malaria in a second study. Finally, in some instances the
genotype and/or haplotype patterns of association varied across different
studies/populations. There are various plausible explanations for these inconsistencies,
and we will try to argue why genome‐wide association studies in large samples of
multiple populations would have the great potential to overcome some of the
difficulties so far encountered.
One such possibility is that the reported association does not result from a biological
causal relationship, whether direct or indirect, between genotype and phenotype, but is
a false positive resulting from statistical artefact. This is an option to bear in mind at all
time when dealing with genetic association studies in general, as association is a simple
statistical statement about the co‐occurrence of two or more factors and does not imply
per se any biological phenomenon. The opposite scenario can also occur, where lack of
association is a false negative result due to lack of power. False negatives results are
more likely to arise the smaller is the magnitude of the phenotypic effect of the genetic
variant. As outlined by the work of Mackinnon and colleagues (2005), we expect the
genetic basis of resistance to malaria to be built upon many different protective genes,
each individually resulting in small population effects, which are prone to be missed by
insufficiently powered studies. In both cases, the use of much larger sample sizes would
be certainly of great benefit.
False positive results can also arise in case‐control studies from population structure
and/or admixture (Marchini et al. 2004). This is of particular importance in African
populations, where genetic diversity is exceptionally high (Tishkoff et al. 2002). In
transmission disequilibrium test studies, false positives may instead be caused by
pedigree‐misspecifications. Genome‐wide data of nucleotide polymorphisms offer the
Genetics of susceptibility to malaria
31
possibility to apply statistical methods to detect and correct for population stratification
(Pritchard et al. 2000, Price et al. 2006), as well as to identify and discard false pedigrees
from association analysis (Teo et al. 2008).
The high diversity of the human genome within Africa, as well as across different
continents, has also another important implication. This is that association signals for
the same non‐genotyped functional variant could show a different pattern in different
populations, due to local variation in haplotype structure and linkage disequilibrium
architecture. Furthermore, the example of haemoglobinopathies illustrate how distinct
malaria resistant alleles have arisen in different populations due to selective pressure,
with haemoglobin S being found in Africa (on four distinct haplotypes; Chebloune et al.
1988, Nagel and Ranney 1990, Lapoumeroulie et al. 1992) but not in Asia, and the
opposite for haemoglobin E; or again with the relative prevalence of haemoglobin S and
C varying greatly between neighbouring countries and even between close villages
(Agarwal et al. 2000, Modiano et al. 2008). Dense genome‐wide typing of SNPs in
multiple populations, perhaps coupled with re‐sequencing in regions of special interest,
should enable a much more accurate knowledge of the underlying genetic background
and therefore an easier and fruitful interpretation of association results. Moreover, it
would allow looking for signatures of recent positive selection in the genome, thereby
providing a useful screening but also confirmational tool.
Least but not last, differences in the outcome of association studies might well
correspond to true differences in the molecular mechanisms underlying
resistance/protection in different epidemiological contexts. For example, as was earlier
described, transmission intensity is likely to have an effect on the type of immune
responses triggered by the parasite, as well as on the rapidity of their development. Also
features of severe malaria, with regards to both age‐incidence profiles and clinical
spectrum, are profoundly affected by the level of transmission (Snow et al 1997). It
must also not be underestimated the role of the parasite genetic and antigenic
variation. Strains with different virulence could exert different pressure on the immune
system or follow different strategies of immune‐suppression/evasion. Antigen
recognition by HLA molecules and cytoadherence of infected red blood cells to the
endothelia are two classic examples in which host and parasite polymorphisms can
interact in a complex manner, and local and even temporal “solutions” might be
generated in different place at different times.
The Malaria Genomic Epidemiology Network (MalariaGEN) is a multi‐country
collaborative effort to put in place the necessary infrastructure to conduct genome‐wide
Introduction
32
and multi‐centre association studies of resistance to malaria, in order to gain
fundamental new insights into the effects of genetic variation on malaria susceptibility,
and thereby on molecular mechanisms of protective immune responses and
pathogenesis in endemic populations (Kwiatkowski 2005, MalariaGEN Consortium
2008).
Beside the likely advantages of large genome‐wide association studies earlier described,
such a network offers the possibility of standardizing phenotype definition, genotyping
technology, experimental and analytical plan across multiple sites. This is anticipated to
augment the power of the study as well as to insure reproducibility of results, while at
the same time allowing to identify and describe regional differences of potential
biological interest.
Related background
33
RELATED BACKGROUND
The role of interferon‐γ in susceptibility to P. falciparum malaria.
IFN‐γ and immunological mechanisms in malaria.
‐ Anti‐parasitic effector mechanisms.
Resistance to rodent malaria is absolutely dependent on signals mediated by IFN‐γ. The
difference between lethal and non lethal infections actually depends on the ability to
mount an early IFN‐γ response, among other pro‐inflammatory cytokines such as IL‐12
and TNF‐α (Shear et al. 1989). IFN‐γ production is also essential for controlling the initial
wave of parasitaemia (Su and Stevenson 2000).
During the pre‐erythrocytic stage, IFN‐γ is induced as a direct consequence of CD8+ T cell
recognition of specific peptide‐MHC complexes on the surface of the infected
hepatocyte (Weiss et al. 1990); this initiates production of IL‐12 which in turn induces
production of additional IFN‐γ by NK cells (Sedegah et al. 1994). IFN‐γ is crucial for
inhibition of parasite growth and development inside hepatocytes (Ferreira et al. 1986,
Schofield et al. 1987). In vitro treatment of Plasmodium spp. infected hepatocytes with
IFN‐γ eliminates P. berghei or P. falciparum parasites from these cultures. Furthermore
in vivo administration of IFN‐γ partially protects against sporozoite challenge with P.
berghei in mice or P. cynomolgy in monkeys while in vivo depletion of IFN‐γ abrogates
protective immunity induced by P. berghei in mice (reviewed by Doolan and Hoffman
1997). The protective effect of CD8+ T cell IFN‐γ production is mainly due to its
activation of the inducible nitric oxid synthase (iNOS) (Seguin et al. 1994), which starts
the nitric oxide cytotoxic pathway and the killing of the parasite (Mellouk et al. 1994).
IFN‐γ induced liver stage protection can also be mediated by CD4+ T cells (Tsuji et al.
1990, Weiss et al. 1993), NK cells (Doolan and Hoffman 1999) and γδ T cells (Rzepczyk et
al. 1997).
During the erythrocytic stage, IFN‐γ can be produced by a variety of innate and adaptive
immune cells in response to P. falciparum antigens. In vitro studies of cellular responses
in human naive volunteers have shown that the earliest pulse (18h) of IFN‐γ is derived
principally from NK cells, subsequently γδ T cells (24‐48h) and finally αβ T cells (4‐6
days) also begin to secrete IFN‐γ (Artavanis‐Tsakonas and Riley 2003). Early production
of IFN‐γ by NK cells is associated with spontaneous resolving infection in mice infected
with various Plasmodium species, whereas lethal infection occurs in the absence of this
response (de Souza et al. 1997, Mohan et al. 1997). Also γδ T cell produced IFN‐γ has
been reported to have anti‐parasitic effects (Elloso et al. 1994, Hensmann and
Present Investigation
34
Kwiatkowski 2001, Hviid et al. 2001). CD4+ T cells intervene later in the infection as the
major source of protective IFN‐γ (Taylor‐Robinson et al. 1993). IFN‐γ mediates its
protective activity by activating macrophages for enhanced phagocytosis and killing of
parasitized erythrocytes and free merozoites (Ockenhouse et al. 1984, Stevenson et al.
1989, Ferrante et al. 1990). Parasites are eliminated by means of macrophage produced
oxygen reactive species (e.g. H2O2) and Nitric Oxide (NO) (Stevenson et al. 1995), with
anti‐parasitic cytotoxic effects (Rockett et al. 1991). IFN‐γ also mediates Ig‐class
switching to the protective cytophilic antibodies subclasses IgG2a and IgG2b in mice, or
IgG1 and IgG3 in humans (Waki et al. 1995, Aucan et al. 2000). Activated macrophages
and cytophilic antibodies participate in parasite killing via ADCI mechanisms
(Bouharoun‐Tayoun et al. 1995, Su and Stevenson 2002).
‐ Pathological responses. The detrimental effects of IFN‐γ are believed to be due to its ability to activate
macrophages which, in turn, produce endogenous pyrogens (TNF‐α, IL‐1 and IL‐6)
leading to a pathological inflammatory cascade (reviewed by Schofield and Grau 2005).
In vivo neutralization of IFN‐γ in mice infected with P. berghei strain ANKA (model of
CM) prevents TNF‐α overproduction and CM development (Grau et al. 1989). The
central role of IFN‐γ in CM is confirmed by the fact that IFN‐γ receptor deficient mice do
not develop CM (Amani et al. 2000). An indirect support for an involvement of IFN‐γ in
CM comes from the knowledge that C57BL/6 mice, which are Th1 response prone, are
susceptible to CM, while BALB/c mice, which have a genetically determined Th2 bias,
are resistant (de Kossodo et al. 1993). IFN‐γ and other inflammatory cytokines (e.g. TNF‐
α) could lead to CM pathogenesis as a consequence of a local acute‐phase response
triggered by parasite toxins. Here they would induce the expression of inter‐cellular
adhesion molecules (e.g. ICAM1) by endothelial cells, with increased parasite
sequestration (reviewed by Hunt and Grow 2003). IFN‐γ can also induce differentiation
of infiltrated monocytes into macrophages and activate them to produce chemokines,
which are released systemically, thereby amplifying infiltration of cells and
sequestration of infected red blood cells (Hanum et al. 2003, Sexton et al. 2004).
Also SMA has been suggested to have an inflammatory ethiology. Reticulo‐endothelial
clearance of the red blood cells is mainly mediated by macrophages in the splenic red
pulp, and IFN‐γ activation of these macrophages might accelerate the process (Biemba
et al. 1998, 2000). Furthermore, it has been proposed that an IFN‐γ and TNF‐α cascade
could mediate erythropoietic suppression by decreasing the responsiveness of erythroid
precursors to erythropoietin (Chang et al. 2004, McDevitt et al. 2004), but this remains
to be proven.
Related background
35
Finally, the exacerbation of cytoadherence by inflammatory cytokines described above
is likely to have a role also in the pathogenesis of both severe malaria anaemia and
metabolic acidosis, by causing widespread obstruction to tissue blood flow and hypoxia.
IFN‐γ and protection against malaria in humans.
Studies conducted in human populations naturally exposed to malaria have shown that
malaria specific IFN‐γ production is associated with lower infection rates and resistance
to re‐infection as well as to reduced risk of clinical disease (Deloron et al. 1991, Luty et
al. 1999, Dodoo et al. 2002).
In a hospital‐based prospective study of severe and mild malaria in Gabonese children,
Luty and colleagues observed that in children admitted with mild disease, but not in
those with severe disease, production of IFN‐γ by PBMCs in response to either liver‐
stage or merozoite antigens was associated with a delay in the first re‐infections and
with lower rates of re‐infection. Furthermore, the production of IFN‐γ by PBMCs in
response to sporozoite and merozoite antigens was observed more frequently in
children presenting with mild malaria than in those presenting with severe malaria.
In a community‐based prospective study conducted in southern Ghana, Dodoo and
colleagues examined the levels of IFN‐γ produced in whole blood assays in response to
live schizonts in relation to the incidence of clinical malaria during longitudinal follow
up. Higher IFN‐γ responses at recruitment were associated with a reduced risk of clinical
malaria.
Based on these observations and on the immune effector mechanisms described above,
IFN‐γ is currently considered as a correlate of cellular immunity to malaria and used as a
marker for vaccines immunogenicity and efficacy (Good and Doolan 1999, Plebanski and
Hill 2000).
IFN‐γ and immune‐based pathogenesis of severe disease.
Similarly to the mouse model, an excessive inflammatory response with high systemic
levels of IFN‐γ, TNF‐α, IL‐1 and IL‐6, has long been correlated with immune‐based
pathogenesis of severe disease in humans (Kern et al. 1989, Grau et al. 1989,
Kwiatkowski et al. 1990, Day et al. 1999). Much higher levels of IFN‐γ are also found in
symptomatic individuals with respect of asymptomatic ones, both in plasma (Riley et al.
1991) and cultured PBMCs supernatants (Mshana et al. 1991). A temporal association
between secretion and fever has been seen in association with experimental malarial
infections (Harpaz et al. 1992). In vitro experiments where PBMC from clinically immune
individuals produce lower levels of those from unexposed donors (Chizzolini et al. 1990,
Rhee et al. 2001), also indicate that the control of clinical symptoms characteristic of
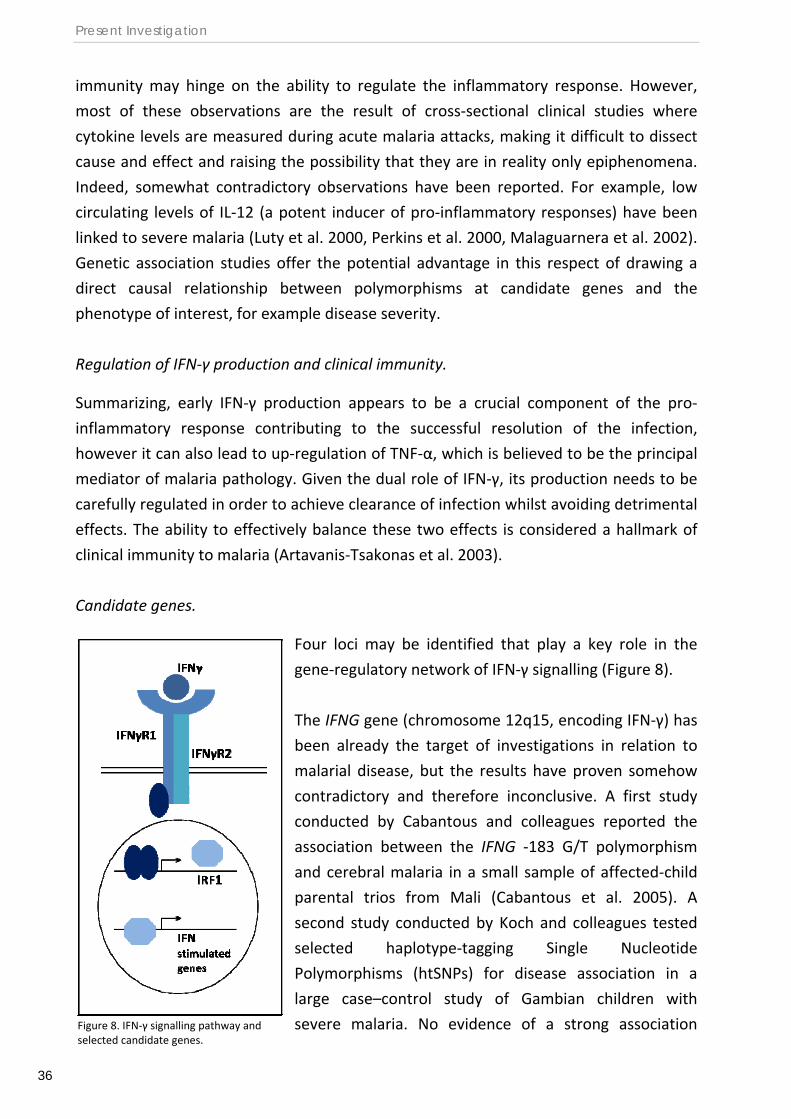
Present Investigation
36
immunity may hinge on the ability to regulate the inflammatory response. However,
most of these observations are the result of cross‐sectional clinical studies where
cytokine levels are measured during acute malaria attacks, making it difficult to dissect
cause and effect and raising the possibility that they are in reality only epiphenomena.
Indeed, somewhat contradictory observations have been reported. For example, low
circulating levels of IL‐12 (a potent inducer of pro‐inflammatory responses) have been
linked to severe malaria (Luty et al. 2000, Perkins et al. 2000, Malaguarnera et al. 2002).
Genetic association studies offer the potential advantage in this respect of drawing a
direct causal relationship between polymorphisms at candidate genes and the
phenotype of interest, for example disease severity.
Regulation of IFN‐γ production and clinical immunity.
Summarizing, early IFN‐γ production appears to be a crucial component of the pro‐
inflammatory response contributing to the successful resolution of the infection,
however it can also lead to up‐regulation of TNF‐α, which is believed to be the principal
mediator of malaria pathology. Given the dual role of IFN‐γ, its production needs to be
carefully regulated in order to achieve clearance of infection whilst avoiding detrimental
effects. The ability to effectively balance these two effects is considered a hallmark of
clinical immunity to malaria (Artavanis‐Tsakonas et al. 2003).
Candidate genes.
Four loci may be identified that play a key role in the
gene‐regulatory network of IFN‐γ signalling (Figure 8).
The IFNG gene (chromosome 12q15, encoding IFN‐γ) has
been already the target of investigations in relation to
malarial disease, but the results have proven somehow
contradictory and therefore inconclusive. A first study
conducted by Cabantous and colleagues reported the
association between the IFNG ‐183 G/T polymorphism
and cerebral malaria in a small sample of affected‐child
parental trios from Mali (Cabantous et al. 2005). A
second study conducted by Koch and colleagues tested
selected haplotype‐tagging Single Nucleotide
Polymorphisms (htSNPs) for disease association in a
large case–control study of Gambian children with
severe malaria. No evidence of a strong association Figure 8. IFN‐γ signalling pathway and selected candidate genes.
Related background
37
between severe malaria and the IFNG markers was observed. However, the authors did
not exclude the possibility that there exist functional IFNG polymorphisms that were not
effectively tagged by the set of markers that were tested, and therefore advocated the
necessity of further studies of the IFNG locus (Koch et al. 2005). No study has been
conducted yet to investigate the role of IFNG polymorphisms on the ability to control P.
falciparum infection.
The alpha subunit of the IFN‐γ receptor, encoded by the gene IFNGR1 (chromosome
6q23.3), plays a critical role in ligand binding, receptor trafficking, and signal
transduction (Bach et al. 1997). Case control studies of Gambian children affected by
severe malaria showed that, in the Mandinka ethnic group, heterozygous for the
IFNGR1 ‐56T/C polymorphism were protected against cerebral malaria and fatal
outcome, while people carrying the IFNGR1 ‐470 in/del (insertion/deletion)
polymorphism were protected against severe malaria in general (Koch et al. 2002).
Functional investigations of the IFNGR1 promoter have shown that the IFNGR1 ‐470
in/del polymorphism, which is found in Africans but not Europeans or Asians, has a
significant effect on the binding of distinct nuclear factors and gene expression levels in
different cell types (Koch et al. 2006). Whether these polymorphisms also have an effect
on the ability to control P. falciparum infection remains to be investigated.
Although not playing a major role in ligand binding, the beta subunit of the IFN‐γ
receptor, encoded by the gene IFNGR2 (chromosome 21q22.11), is necessary for IFN‐γ
signalling (Bach 1997). Studies conducted in mice have shown that IFNGR2 knockout
cause unresponsiveness to IFN‐γ, with a consequent alteration in IFN‐γ induced Ig class
switching in B cells and a defect in Th1 cell differentiation. The IFNGR2 ‐/‐ mice also
produce lower amounts of IFN‐γ in response to antigenic challenge and are highly
susceptible to infection by Listeria monocytogenes (Lu et al. 1998). In humans,
associations between IFNGR2 variantss and susceptibility to mycobacterial infections
have been reported (reviewed in Dupuis et al. 2000), but to our knowledge no
investigations have been carried out with respect to malaria infection.
Interferon Regulatory Factor 1 (IRF‐1) is a transcription factor that regulates the
expression of many IFN‐γ induced genes. A role for IRF‐1 in both malaria mortality and
parasite density has been suggested by studies of P. berghei infection conducted in IRF1
knockout mice (Senaldi et al. 1999; Tan et al. 1999) although such a role has not been
investigated in humans so far. Interestingly, the IRF1 locus lies in the 5q23.3 (previously
named 5q31) human genome region, which contains a cluster of immunological genes
encoding cytokines and growth factors, and has been therefore thought to play a role in
Present Investigation
38
the response to parasitic diseases. This has been investigated by linkage analysis studies
that demonstrated the involvement of this gene region in the control of P. falciparum
blood parasite densities (Rihet et al. 1998) as well as of Schistosoma mansoni infection
intensity (Marquet et al. 1996), but further narrowing down the P. falciparum infection
level locus (Pfil) has not as yet been achieved. Polymorphisms in the IRF1 gene have
been implicated in susceptibility to viral infections (Saito et al. 2002, Ball et al. 2007).
With the present investigation we aim to gain new insights into molecular mechanisms
of protective immunity and pathogenesis regulated by IFN‐γ. In particular, we want to
investigate whether genetic variation at these four candidate loci affects susceptibility
to malaria. To address this question we conduct genetic epidemiology association
studies, and perform allele‐specific transcript quantification mapping to identify
functional variantss (Paper I and II).
The Fula people of West Africa are less susceptible to malaria than sympatric ethnic
groups.
Lower susceptibility to malaria in the Fula.
Extensive epidemiological studies of malaria have been conducted between August
1994 and October 1995 in a shrubby savannah area north‐west of Ouagadougou, the
capital city of Burkina Faso. The study included two villages distant five kilometres apart:
Barkoumbilen, inhabited by Mossi and Rimaibé ethnicity; and Barkoundouba, inhabited
by Fula and Rimaibé ethnicity.
The Fula people (ca. 13 mln total) are scattered in many areas of West Africa, from Lake
Chad to the Atlantic coast. Their language, the Fulfulde, is classified within the West
Atlantic branch of the Niger‐Congo family. Originally the Fula were a nomadic pastoral
people, and nowadays they can be nomadic, semi‐nomadic or sedentary. The pastoralist
Fula exhibit a high incidence of non‐negroid physical traits and consanguineous
marriages are common (Stenning 1965). On the basis of physical and cultural data a
Caucasoid component has been suggested in the genetic make‐up of the Fula ethnic
group (Blanc et al. 1990, Olerup et al. 1991, Allsopp et al. 1992). The Mossi (ca. 4 mln
total), are a Sudanese negroid population living in the central plateau of Burkina Faso as
sedentary farmers. Their language, More´, belongs to the Gur branch and is akin to that
spoken by the Mamprusi and Dagomba of northern Ghana (Skinner 1964). Closer to the
Mossi in terms of ethnic origin, Rimaibe´ have adopted most of the socio‐cultural habits
of Fula, having historically been their slaves. Actually Rimaibe´ consider themselves as
Related background
39
Fula and speak their language; moreover, they carry family names taken from their
previous Fula masters. Therefore Rimaibe´ are frequently misclassified as Fula (Modiano
et al. 1996). No intermarriage was recorded between individuals belonging to distinct
ethnic groups in the study area (Modiano et al. 1996).
Across five consecutive cross‐sectional surveys, both P. falciparum parasite prevalence
and positive parasite density were lower in the Fula people than in the Mossi and the
Rimaibé, with greater differences in the older age groups. By the last survey, 36 % of the
Fula were never found to be infected, while almost everyone in the Mossi and Rimaibé
ethnic groups was infected at least once. Mossi and Rimaibé did not exhibit differences
in their susceptibility to malaria infection (Modiano et al. 1996). Clinical malaria was
monitored by active follow up during the rainy season in children below ten years of
age. The mean parasite density was three fold lower in the Fula than in the other ethnic
groups, and the incidence of malaria episodes was also lower, but no differences were
observed between Mossi and Rimaibé (Modiano et al. 1996).
Antibody titres to a number of P. falciparum antigens (CS‐NANP40, CS‐NH, CS‐COOH,
TRAP, MSP‐1, Pf332, RESA) were measured by ELISA at each survey. Higher
seroprevalences and antibody levels were observed in the Fula with respect to both
Mossi and Rimaibé, while the two latter groups did not show any difference. Strikingly,
in many instances Fula children aged between five and ten years had similar or even
higher antibody levels than Mossi and Rimaibé adults, indicating that acquired immunity
to malaria might develop much faster in the Fula population (Modiano et al. 1996, 1998,
1999). The inverse pattern showed by the distributions of parasite burden and antibody
production suggested that the lower susceptibility to malaria observed in the Fula is
mediated by a stronger immune response.
Consistent observations have been made in a similarly designed study conducted
between 1998 and 2000 in four villages of the Dogon Country, Mali, inhabited by the
Fula and Dogon ethnic groups. The Dogon are farmers who lived with the Malinke ethnic
group in the Malian Empire until the 13th century. They then migrated to the cliffs of
Bandiagara and moved to their present location around 50 years ago. There is no inter‐
marriage between Dogon and Fula ethnic groups in the study area (Dolo et al. 2005).
Parasite rates were lower in Fula than Dogon in four cross‐sectional surveys and the
percentage of children who had one or more malaria episodes during longitudinal
disease surveillance was also much lower in the Fula (Dolo et al. 2005). IgM, IgE, IgG,
IgG1 and IgG3 levels to parasite schizont extract were higher in the Fula compared to
the Dogon (Dolo et al. 2005, Bolad et al. 2005), and the Fula’s stronger immune
reactivity was confirmed by an higher prevalence of spleen enlargement (Dolo et al.
2005, Bereczky et al. 2006). While in the Dogon the spleen enlargement prevalence
Present Investigation
40
increases with parasite prevalence and density and with mild malaria, this is not true in
the Fula. Thus, the more susceptible Dogon population appears to respond with
pronounced spleen enlargement to asymptomatic infection and acute disease whereas
the Fula have generally enlarged spleens already functional for protection (Bereczky et
al. 2006). Furthermore, both in Burkina Faso and Mali, a lower number of parasite
clones has been observed in the Fula than sympatric ethnic groups, further suggesting
their more efficient control of the infection by the immune system (Paganotti et al.
2004, Farouk et al. 2005).
A review of the earlier literature shows that lower parasite prevalence (Riley et al.
1990), higher antibody response to malaria antigens (Riley et al. 1991) and higher spleen
enlargement prevalence (Greenwood et al. 1987) were already observed in the Fula
compared to neighbouring ethnic groups in The Gambia, but the investigators at the
time were not in the condition to assess the ethnicity of the sampled populations and
therefore did not draw any explicit conclusion on its relation to malaria susceptibility.
Inter‐ethnic differences are likely to be underlined by genetic factors.
The differences observed between the Fula and the neighbouring populations, both in
terms of susceptibility to malaria infection and disease and of immune reactivity to
malaria antigens, could be explained by environmental, socio‐economic or genetic
factors. However many reasons strongly indicate that, most likely, they are accounted
for by genetic factors.
The first important indication comes from the Burkina Faso study, where the
Barkoundouba and Barkoumbilen villages are inhabited by Fula and Rimaibé and by
Mossi and Rimaibé communities, respectively. The Rimaibé people, by living in both
villages, serve as an optimal internal control for environmental differences.
Furthermore, they culturally are much closer to the Fula than the Mossi, as previously
described. Nevertheless, they show virtually identical characteristics to the Mossi in
terms of malaria susceptibility.
The most relevant variable to malaria susceptibility is certainly exposure. EIRs have been
measured both in Burkina Faso (Modiano et al. 1996) and in Mali (Dolo et al. 2005), and
have demonstrated similar transmission intensities in the villages inhabited by the
different ethnic groups. Furthermore, no differences in the use of impregnated
bednets/curtains were observed between Fula and Mossi or Rimaibé in Burkina Faso,
and Dogon in Mali (Modiano et al. 1996, Dolo et al. 2005). Also the intake of antimalarial
drugs was comparable (Modiano et al. 1996). Finally, the sympatric ethnic groups are
Related background
41
exposed to the same parasite strains, with no differences in allele frequency for MSP1,
MSP2, and GLURP genes (Paganotti et al. 2004, Bereczky et al. 2006).
The typing of HLA class I alleles in unrelated individuals of the Fula, Mossi and Rimaibé
ethnic groups from Burkina Faso has demonstrated the genetic distance of the Fula
from the Mossi and Rimaibé, who are instead very much alike to each other (Modiano
et al. 2001a). It seems therefore likely that differences in susceptibility to malaria might
be the expression of the different genetic background of the ethnic groups.
Classic malaria resistance alleles are at lower frequencies in the Fula.
A possible explanation of the Fula’s lower susceptibility to malaria could be a higher
frequency in this ethnic group of genetic factors previously reported to be associated
with resistance to malaria.
In order to test this hypothesis, the frequencies of haemoglobin S (HbS; Allison 1954, Hill
et al. 1991), haemoglobin C (HbC; Agarwal et al. 2000, Modiano et al. 2001c), α‐
thalassemia (α‐thal; Allen et al. 1997), G6PD deficiency (G6PDA‐; Ruwende et al. 1995)
and HLA‐B*53 (Hill et al. 1991) have been estimated in a sample of unrelated Fula,
Mossi and Rimaibé subjects from Burkina Faso. The results indicated that HbS has a
similar frequency in the three ethnic groups, while HbC, α‐thal, G6PDA‐ and HLA‐B*53
have higher frequencies in the Mossi and Rimaibé compared to the Fula. Within the
Fula, the proportion of people that does not carry any of the protective alleles is of 57%,
around three‐fold higher than what was observed within the Mossi or Rimaibé (17%)
(Modiano et al. 2001b). Furthermore, none of the HLA class I alleles showing different
frequencies in the three ethnic group were associated with protection against malaria
(Modiano et al. 2001a), while the possible effect of HLA class II alleles has not been
investigated as yet. Also in Mali, the frequency of HbS was similar in Dogon and Fula,
while that of HbC was higher in the Dogon than in the Fula (Dolo et al. 2005).
These findings therefore exclude that known protective variants could play a role in the
resistance to malaria shown by the Fula. On the contrary, they suggest that so far
unidentified protective genetic factor(s) could exist in the Fula, and that their effect
could be so large that selective pressure by malaria would have relaxed in this ethnic
group and therefore did not drive the accumulation of otherwise often detrimental
mutations.
Present Investigation
42
Hypotheses on the immunological basis of Fula’s resistance to malaria.
As we have seen, the Fula’s lower susceptibility to P. falciparum infection and
uncomplicated disease is accompanied by higher antibody responses to malaria
antigens and higher prevalence of spleen enlargement. Therefore, it is the current view
that their protection against malaria is mediated by a stronger immune reactivity. Most
likely, the underlying genetic factor(s) would encode for molecules of the immune
system.
The distribution of antibody levels against CSP, Pf332 and RESA in Fula and non‐Fula
individuals has been explored by Luoni and colleagues (2001) to try to figure out what
sort of genetic effect could explain the observed patterns. Although antibody levels
were in average higher in the Fula than in the non‐Fula, there was considerable overlap
in the middle of the distribution between the two groups, while the upper end and the
lower end of the distribution were enriched for Fula and Mossi subjects, respectively.
One possibility to explain such distribution would be that a single major genetic
determinant of antibody production is present in a higher proportion in the Fula and at
lower frequency in the other groups. A promoter variant of the IL4 gene (IL4‐590 C/T),
previously described to affect promoter activity (Borish et al. 1994), was genotyped in
unrelated Fula Mossi and Rimaibé subjects from Burkina Faso. In the Fula only, the IL4‐
590 T allele was associated with higher levels of antibodies against CSP and Pf332
antigens and a similar trend was seen for RESA antibodies although this was not
statistically significant. The IL4‐590 T allele is present at a frequency twice that observed
in their neighbours (0.45 vs 0.22), raising the possibility that in this ethnic group it marks
out a protective haplotype (Luoni et al. 2001). Its association with elevated antibody
levels in the Fula would be consistent with this, while the lack of association in non‐Fula
indicates that it is not itself the functional polymorphism. Rather, the protective allele
could potentially lie in another part of the Th2 cytokine cluster of the 5q31 genome
region where the IL4 locus lies. Somewhat surprisingly, the IL4‐590 T allele was reported
to be associated with higher infection prevalence in the Fula from Mali (Vafa et al.
2007). Therefore, although these data need therefore further investigation, at the same
time they illustrate how the combination of inter‐ and intra‐ethnic comparisons is a
useful approach to characterize critical determinants of malarial immunity.
On the basis of the higher antibody response and on the association between the IL4‐
590 SNP and antibody levels observed in the Fula, Farouk and colleagues (2005)
hypothesised a possible polarisation towards Th2 cytokine‐mediated response in this
ethnic group, as reflected by a higher number of IL‐4 producing cells. To test this
Related background
43
hypothesis, the proportions P. falciparum‐ induced IL‐4, IFN‐γ, IL‐10 and IL‐12 producing
cells, as measured by ELISPOT, were compared between Fula and Dogon from Mali.
Differently from expected, both IFN‐γ (Th1) and IL‐4 (Th2) producing cells were present
in higher numbers in Fula than in Dogon, while the production of IL‐10 and IL‐12 did not
differ between the two ethnic tribes (Farouk et al. 2005). These findings, although
preliminary, suggested that the Fula’s resistance to malaria is not mediated by a Th2
polarised immune response, while, as both Th1 and Th2 responses seem to be
enhanced, it could be more likely the result of a generally stronger immune activation
(or weaker immune suppression).
In this view, it is also possible that the greater immune reactivity seen in the Fula does
not limit to P. falciparum antigens, but extends to many different antigenic stimuli.
Actually, antibody levels to Schistosoma haematobium, hepatitis B and cytomegalovirus
were found to be higher in Fula than Mossi and Rimaibé from Burkina Faso (Modiano,
unpublished data). Similarly, a higher humoral response to Toxoplasma gondii and
measles was observed in Fula than sympatric groups either in Burkina Faso or Mali.
Nevertheless, results with regards to Mycobacteria tuberculosis and Helicobacter pylori
were less clear cut, with significant differences observed in one country but not in the
other, and no differences were seen for rubella (Bolad et al. 2005). While these results
await confirmation in larger samples and further observations in order to exclude that
they are due to cross‐reactivity, they constitute an indication that the Fula are capable
of mounting a stronger humoral response to other pathogens than malaria.
With the present investigation we aim to achieve a greater understanding of the
biological basis of the resistance to malaria shown by the Fula people of West Africa and
of the underlying molecular mechanism by applying genetic approaches.
HLA class II molecules are unlikely to play a role.
The role played by the HLA system on the immune response to malaria antigens has
been quite extensively investigated because of the crucial importance of eventual HLA‐
restrictions in the development of subunit vaccines.
By comparing the humoral and cellular responses of HLA‐identical to that of HLA‐non
identical DZ twins, Jepson and colleagues were able to assess the relative contribution
of HLA and non‐HLA loci to the total phenotypic variance and concluded that non‐HLA
genes play a much more substantial role than HLA ones (Jepson et al. 1997a). The T
lymphoproliferative and B cell humoral responses to RESA were analyzed to establish
whether they were genetically regulated by restrictions imposed on the immune
response by class II molecules of the donor's MHC system; no association were observed
Present Investigation
44
(Troye‐Blomberg et al. 1991). Several studies have subsequently failed to show
association of HLA alleles with specific cellular or antibody responses to defined malaria
antigens (Graves et al. 1989, Sjoberg et al. 1992, Troye‐Blomberg 1994, Migot et al.
1995, Taylor et al. 1996, Stirnadel et al. 1999). Nevertheless, other investigations have
reported positive or negative correlation of given HLA types with responses to different
antigens (Patarroyo et al. 1991, Riley et al. 1992, Beck et al. 1995, Stephens et al. 1995,
Johnson et al. 2000, Nardin et al. 2000, Johnson et al. 2004). The great antigenic
diversity and polymorphism of the P. falciparum genome at a local and global level
almost certainly plays a crucial role in shaping the heterogeneous pattern of association
observed, which is likely be the result of a molecular arm race between the host and the
parasite.
Taken together, the available evidence suggests that is unlikely that HLA loci are major
genetic determinants of immune reactivity to malaria, although it can be the case that
defined host‐parasite interactions at the level of antigen processing and presentation
might affect the development of specific immune responses.
HLA class II molecules therefore do not seem good candidates to explain the lower
susceptibility to malaria shown by the Fula, given that their exceptionally high humoral
responses do not appear to be restricted to defined antigens.
On the other hand, HLA loci are the most polymorphic autosomal genes in the human
genome (Horton et al. 2004) and have therefore been frequently used, together with
mitochondrial DNA and Y chromosome DNA, for the investigation of genetic relationship
between populations and the reconstruction of past migration events (Jobling et al.
2004). Thus, the analysis of HLA class II polymorphism may be useful to assess the
genetic distance of the Fula from sympatric ethnic groups, thereby complementing the
information previously obtained by HLA class I genotyping (Modiano et al. 2001a) (Paper
III).
The potential involvement of T regulatory cells.
The molecular mechanisms responsible for the lower susceptibility to malaria and the
stronger immune reactivity observed in the Fula remain open to investigation. This
higher reactivity could involve any cellular or soluble mediator of the innate immune
response and of the Th1‐ or Th2‐type response, as well as mechanisms of immune
tolerance mediated by Tregs.
Related background
45
Tregs are key regulators of immune homeostasis as they are responsible for dominant
immune suppression, in tolerance to self as well as in the tuning of immune response to
pathogens. These cells may be either naturally produced in the thymus or induced in the
periphery in response to a specific stimulus. They express the surface molecules CD4
and CD25 and upon activation they express the transcription factor FOXP3, which is
crucial for their development and function. They exert their suppressive effects by cell
contact and/or by the production of down‐regulatory cytokines (IL‐10 and TGF‐β)
(Janeway 2005).
In parasitic infections, natural and adaptive Tregs limit the magnitude of effectors
responses and by doing so they minimize tissue damage but at the same time they can
favour pathogen survival (Belkaid et al. 2006).
With respect to malaria, it has actually been shown that depletion of CD4+ CD25+ Tregs
protects mice from death upon infection with a lethal strain of Plasmodium yoelii and
that this protection is associated with an increased T cell response against parasite‐
derived antigens (Hisaeda et al. 2004).
Furthermore, a study of experimental sporozoite infection of human volunteers has
demonstrated that both the production of TGF‐β and the proliferation of
CD4+CD25+FOXP3+ Tregs, rapidly induced after blood‐stage infection, are associated with
decreased pro‐inflammatory cytokine production, decreased antigen‐specific immune
responses and higher rates of parasite growth in vivo (Walther et al. 2005) (see also
“Immune evasion strategies”).
It is therefore apparent how is of great interest to investigate whether Tregs play a role
in the lower susceptibility to malaria shown by the Fula compared to sympatric ethnic
groups (Paper IV).

47
THE PRESENT INVESTIGATION
AIMS AND OBJECTIVES
I) The first aim of the work presented in this thesis was to gain new insights on the role
played by IFN‐γ signalling in susceptibility to malaria
Specific objectives:
1. To describe the polymorphism and haplotype structure of the IFNG, IFNGR1
IFNGR2 and IRF1 genes in African populations (Preliminary association study)
2. To test common variation at IFNG, IFNGR1 IFNGR2 and IRF1 genes for
association with carriage of P. falciparum infection (Preliminary association
study)
3. To confirm the involvement of IRF1 genetic variation in the control of
P. falciparum infection, as observed in the preliminary study, by assessing
association with blood parasite densities in malaria patients (Paper I)
4. To evaluate the effect of IRF1 polymorphisms on disease severity by
comparing allele frequencies between population controls, mild malaria cases
and severe malaria cases (Paper I)
5. To further investigate whether IRF1 affects susceptibility to life‐threatening disease by conducting a large family‐based association study in affected child‐
parental trios (Paper II)
6. To reveal eventual functional variant(s) responsible for the signals of association observed in the genetic epidemiology studies by searching cis‐
acting regulatory determinants of IRF1 expression levels using allele‐specific
transcript quantification mapping (Preliminary functional study)
Present Investigation
48
II) The second aim of the present investigation was to achieve a better understanding of
the biological basis of the low susceptibility to malaria shown by the Fula people of
West Africa
Specific objectives:
1. To confirm that the Fula are genetically differentiated from sympatric ethnic
groups by analyzing HLA class II diversity in Fula, Mossi and Rimaibé from Burkina
Faso (Paper III)
2. To investigate the genetic relationship of Fula, Mossi and Rimaibé from Burkina
Faso with other Sub‐Saharan African populations as well as with Europeans
(Paper III)
3. To investigate whether Tregs play a role in the higher immune reactivity shown
by the Fula with respect to sympatric ethnic groups and to explore differences in
gene regulatory networks of the immune system by comparing the expression
profiles of PBMCs and Tregs from healthy adults of Fula and Mossi ethnicity from
Burkina Faso (Paper IV)
Methodology
49
METHODOLOGY
‐ Study subjects.
Details on study subjects are given for each of the studies as part of the discussion of
the results.
‐ Ethical approval and informed consent of study participants.
All biological samples were collected following approval from the relevant research
ethics committees and informed consent from participants.
‐ Plasmodium falciparum detection and density determination.
Thick and thin blood smears were prepared following the standard procedures.
According to WHO (World Health Organization) guidelines for the microscopic diagnosis
of malaria (Bench Aids for the Diagnosis of Human Malaria; Plate 8, Methods of
counting malaria parasites in Giemsa‐stained thick blood films), 100 microscopic fields
(ca. 20 leukocytes/field at 1000x = ca. 0.25 µl of blood) of the thick blood smear were
examined for the determination of parasite density. The Plasmodium species was
identified on the thin blood smear.
‐ Determination of antibody levels. IgG levels against P. falciparum recombinant antigens CSP and MSP‐119 (supplied by MR4) were measured by ELISA according to a standard protocol (described in Modiano et al. 1999). ELISA OD values were log transformed to fit a normal distribution. The threshold for positivity was calculated as the mean + three standard deviations of a pool of ten malaria naive individuals. Antibody levels of seropositive Mossi and Fula were compared using the Kruskal‐Wallis test.
‐ Severe malaria phenotypes definition.
All cases were children admitted to hospital with evidence of P. falciparum on thick
blood film.
In line with WHO guidelines (Marsh et al. 1995), severe malaria was defined by the
presence of P. falciparum in the thick blood film associated with at least one of the
following conditions: prostration (incapacity of the child to sit without help), impaired
consciousness, repeated generalized convulsions (more than two episodes in the
preceding 24 hours), unrousable coma (inability to localise or to react to a painful
stimulus), severe anaemia (haemoglobin <5 g /dL or packed cell volume <15%),
pulmonary oedema/respiratory distress, clinical shock, spontaneous bleeding, renal
failure (plasma creatinine > 3 mg/dL) , hypoglycemia (blood glucose < 40 mg/dL),
Present investigation
50
acidosis (plasma bicarbonate < 15 mmol/l), jaundice, haemoglobinuria, hyperpyrexia
(T>40ºC) and hyperparasitaemia (parasite count > 500,000/µl).
For the analysis of severe malaria sub‐phenotypes, we used a Blantyre coma score of ≤ 2
as a criterion of CM and haemoglobin < 5g/dl or packed cell volume < 15% as a criterion
of SMA. Some children had both CM and SMA. Uncomplicated malaria was defined as a
clinical illness characterised by an axillary temperature > 37.5 °C associated with a P.
falciparum positive blood film in the absence of clinical signs and symptoms of severe
malaria and of any other evident cause of fever.
‐ Selection of genetic markers for genetic association studies.
SNPs in the region 10 kb upstream to 10 kb downstream of the IFNG, IFNGR1, IFNGR2
and IRF1 genes (Paper I and II) were identified from public databases (dbSNP build 126,
Ensemble release 40) and the literature.
The markers for genotyping were selected on the basis of several criteria: validated
status by frequency, haplotype‐tagging SNP (htSNP) in the HapMap sample of the
Yoruba ethnic group from Nigeria, overall coverage of the locus with regular spread
(density of 1 SNP every 2 Kb on average), encompassing exonic, intronic, regulatory
regions of the gene. Further criteria for prioritizing the markers were some evidence of
a functional effect of the allelic variant, as based either on the current literature or on
the use of the FastSNP tool (http://fastsnp.ibms.sinica.edu.tw) (Yuan et al. 2006).
‐ DNA samples preparation.
DNA extraction from buffy coat was performed using either Qiagen or Nucleon kits as
per protocol. Genomic DNA samples were quantified using Picogreen as per protocol.
They were then diluted to a concentration of 20 ng/µl before undergoing whole genome
amplification through either Primer Extension Pre‐amplification (PEP) (Zhang et al. 1992)
or Multiple Displacement Amplification (MDA) (Gonzalez et al. 2005). A dilution (1:10 or
1:20) of the amplified DNA was plated into multi‐well (96 or 384) plates for genotyping
(Paper I, II and III).
‐ Genotyping of IFN‐γ loci.
The genotypes for the selected polymorphisms at the IFNG, IFNGR1, IFNGR2 and IRF1
genes (Paper I and II) were determined through either the SEQUENOM© MassARRAY™
System (SQNM) or the Amplification Refractory Mutation System (ARMS) (Ross et al.
1998).
The SQNM is a high through‐put procedure based on an allele‐specific primer‐extension
reaction and Matrix‐Assisted Laser Desorption/Ionisation‐Time Of Flight Mass
Methodology
51
Spectrometry (MALDI‐TOF). Primers and multiplexes were designed using the dedicated
software SpectroDESIGNER™ (SEQUENOM©).
The ARMS is a simple procedure based on allele‐specific primer‐amplification reaction
and gel electrophoresis. Primers were designed using a dedicated software
(http://cedar.genetics.soton.ac.uk/public_html/primer1.html) (Ye et al. 2001). An extra
destabilizing mismatch in the primers and a touch‐down Polymerase Chain Reaction
(PCR) program have been used to increase amplification specificity. DNA samples whose
genotype was determined by SQNM were used as positive controls for validation of
genotype calls.
‐ Genotyping of HLA class II loci .
HLA‐DRB1 and ‐DQB1 loci (Paper III) were genotyped at low molecular resolution using
Sequence Specific Primers in Polymerase Chain Reaction amplification (SSP‐PCR system).
Micro SSPTM DNA typing Kits (ONE LAMBDA INC.) have been used and amplifications
were performed as recommended from the purchaser. The Kit contains 32 pairs of
primers and allows the identification of all known low‐resolution alleles: 13 alleles for
DRB1 (*01, *03, *04, *07‐*16) and 5 alleles for DQB1 (*02‐*06). The alleles were
identified assuming that DRB1 and DQB1 loci have no blanks. When a single allele was
found, the individual was considered homozygous for that allele.
‐ Genotyping quality filters.
We excluded from any further analysis SNPs whose assays had a failure rate higher than
10%; whose MAF was lower than 0.01; or for whom there was evidence that the
genotypes deviated from Hardy Weinberg Equilibrium (HWE). HWE has been tested
using a threshold p value of 0.001, which aims to represent a compromise between the
safe exclusion of most genotyping errors and the retention of potentially interesting
SNPs, i.e. those under selection (Teo et al. 2007). Subjects whose DNA samples showed
genotyping failure for more than 10% of the assays were also excluded from our studies
(Paper I, II and III).
In the TDT study (Paper II) the family trios were assessed for pedigree misspecification
using a panel of 48 additional markers spread across the genome and the Nucl3ar
software package (Teo et al. 2008), and only true trios were used in association analysis.
Present investigation
52
‐ Allele frequencies.
Allele frequencies were estimated by direct counting in the study subjects and Hardy‐
Weinberg equilibrium (HWE) of genotypes has been tested within each ethnic group.
Allele frequencies have been compared using Yates‐corrected χ2 test with one degree of freedom. If contingency tables had less than 5 expected events per cell, Fisher's exact
test was used. Standard error of each allele frequency has been calculated as SE= (p (1‐
p)/N)1/2 where p is the allele frequency and N the sample size.
For HLA class II loci (Paper III), Bonferroni correction for multiple testing was applied to
the comparison of allele/haplotype frequencies between populations, the corrected
significance threshold required to keep Type I error rate at 5% being equal to 0.05
divided for the total number of alleles/haplotypes.
Wright’s Fst (1950) (calculated as follows: Fst= (Ht‐Hs)/Ht, where Ht is the expected
heterozygosity in the overall population and Hs is the expected heterozygosity in the
weighted sum of subpopulations) has been used as a measure of population
differentiation of allele frequencies. We used the guidelines suggested by Wright for
interpretation of Fst: values lower than 0.05 indicate little differentiation, values in the
0.05‐0.15 range indicate moderate differentiation, values in the 0.15‐0.25 range indicate
great differentiation, and values higher than 0.25 indicate very great differentiation
(Hartl and Clark 1997).
‐ Haplotypes and Linkage Disequilibrium architecture.
Linkage Disequilibrium (LD) was measured using a simple correlation between markers,
called Δ2 or alternatively r2. This is calculated as follows: {fAB fab ‐ fAb faB}2 / fA fa fB fb,
where A and a denote the alleles at the first locus, B and b denote the alleles at the
second locus, and fAb is the frequency of the haplotype carrying the major allele for the
first locus and the minor allele for the second locus.
LD metrics and graphs showing LD patterns were generated using the MARKER
http://www.gmap.net/perl/marker/marker_entry) application. Typed single nucleotide
polymorphisms (SNPs) are represented on the vertical axis and ordered by chromosome
position. The linkage disequilibrium between each pair of markers is represented by
diamonds of different colours.
Haplotypes at IFN‐γ loci (Paper I and II) were constructed using the Stephens‐Donnelly
method (Stephens et al. 2001) and the software PHASE v.2. To phase HLA‐DRB1 and ‐
DQB1 genotypes (Paper III) the option for multiallelic markers on PHASE v.2.1 was used
(Stephens 2003).
Haplotype frequencies were compared using Yates‐corrected χ2 test with one degree of freedom. If contingency tables had less than 5 expected events per cell, Fisher's exact
test was used.
Methodology
53
HtSNPs were determined by an unstructured approach using the ENTROPY algorithm
(Ackerman et al. 2003), which selects those SNPs that best describe the whole
haplotypic diversity of the region. The algorithm starts by picking the most informative
marker, which will be that with allele frequency closest to 0.5. It then repeatedly adds
new markers from the set, each time choosing the one marker which most increases the
logical entropy of the system. HtSNPs are defined by an Entropy value > 0.
Haplotypes blocks across the genes were defined using the program HaploBlockFinder
(Zhang et al. 2003) and the HAPLOVIEW application (Barrett et al. 2005), based on the
method originally described by Gabriel and colleagues (Gabriel et al. 2002).
‐ Statistical methods in genetic association analysis.
Case‐control analysis was performed using SPSS v14.00 and EpiInfo 2000. Allele,
genotype and haplotype distributions between cases and controls have been compared
by Yates‐corrected χ2 test. If contingency tables had less than 5 expected events per cell, Fisher's exact test was used.
Association analysis of markers and haplotypes with blood infection levels in malaria
patients has also been performed using SPSS v14.00. We used linear regression adjusted
for disease status and age, after log‐transformation of parasite densities.
For family‐based association analysis, single locus and haplotype versions of the TDT
was implemented using R statistical software (based on Transmit, Clayton 1999). The
FBAT application (Rabinowitz and Leird 2000) (software available at http:// biosun1.
harvard. Edu/ ~fbat/ fbat.htm) has been used for comparison of the results.
We applied a method to correct for multiple testing of SNPs in LD with each other
(Nyholt et al. 2004), using an interface available online (http:// genepi.qimr.edu.au/
general/ daleN/ SNPSpD). Based on spectral decomposition of matrices of pairwise LD
between SNPs, the method determines the effective number of independent markers in
the set tested (Meff). The corrected significance threshold required to keep Type I error
rate at 5% is equal to 0.05/ Meff. The independence of association signals was evaluated
using linear regression analysis. A p value of 0.05 has been considered as threshold for
significance (Paper I and II).
‐ Interpopulation genetic variation.
We used Correspondence Analysis (CoA) to generate a two dimensional graphical
representation of the relationship between populations based on a table in which the
rows represent the populations and the columns the allele frequencies. This method is
analogue to Principal Component Analysis (PCA), where individual axes, known as
principal components (PC), are extracted sequentially, with each PC encapsulating as
much of the remaining variation as possible. An important difference between CoA and
Present investigation
54
PCA is that the first one allows the analysis of both rows and columns
contemporaneously, obtaining a plot in which both populations and alleles are
represented. It is therefore easier to identify the alleles that contribute to determine
the positions of the populations (Jobling et al. 2004). The statistical software SPSS
v.15.00 has been used to perform CoA.
Pairwise genetic distances between populations have been measured using the chord
distance by Cavalli‐Sforza and Rogers (1967). The standard genetic distance by Nei
(1972), has been used for comparison of the results. A phylogenetic tree has been
constructed using the Neighbour Joining (NJ) clustering method based on the matrix of
chord genetic distances. With this method, the tree is built by an iterative process that
combines the two populations that have the least genetic difference between them
(Jobling et al. 2004). Unrooted networks have been used as graphical representations of
NJ trees. The PHYLIP package v. 3.67 (available at the web site
http://evolution.genetics.washington.edu/phylip.html) has been used for both
calculation of genetic distances and construction of the phylogenetic tree (Paper III).
‐ Selection of a transcript marker for Allele Specific Transcript Quantification (ASTQ).
An exonic SNP is sought for the discrimination of allele‐specific transcripts. We
identified a SNP (rs839) in the 3’ UTR region of the IRF1 gene that was polymorphic in
African populations and for whom we could develop an efficient genotyping assay.
‐ Cell lines.
EBV‐immortalized lymphoblastoid cell lines from unrelated Yoruba HapMap individuals
who were heterozygote at the rs839 locus were retrieved from the Corriell repository.
‐ Cell culture and stimulation. Cells have been cultured at 37 ºC and 5% CO2 environment in culture medium. In order to test for stimulation‐induced allele‐specific variation, samples were split into two aliquots. One aliquot was activated with ionomycin and PMA, potent B‐cell mitogens, for 6 hours, while the other aliquot received no stimulation.
‐ Extraction of mRNA and gDNA and synthesis of cDNA.
mRNA was extracted from the activated and non‐activated sample aliquots using TRIzol
reagent (Invitrogen), a standard chloroform‐isopropanol procedure, and the Dynal
Dynabead kit as per protocol. RNA concentration and quality were assessed using
NanoDropTM 1000 (THERMO Scientific) by following manufacturer’s instructions. The
mRNA was split into two aliquots. One mRNA aliquot was subject to RT‐PCR (+RT
sample) using the Stratagene cDNA synthesis kit as per protocol, while the other aliquot
Methodology
55
was left untreated (‐RT sample) and used as to check for gDNA contamination of the
mRNA samples. gDNA was extracted from each sample using the Nucleon kit. The gDNA
was then used as a reference for normalization of the allele‐specific transcription ratios
in order to control for differences in the ability of the detection system to quantify both
alleles, given that gDNA has equimolar amounts of both alleles of a SNP.
‐ ASTQ and determination of allele‐specific transcript rations.
The cDNA yield from the +RT samples and gDNA yield from the –RT and gDNA samples
was determined using the SQNM platform. The +RT samples were split into four aliquots
for the amplification PCR and the product of each aliquot was split further into four
aliquots for the extension PCR (total of twelve technical replicates for each cell line). The
gDNA samples were split into two aliquots for the amplification PCR and a further two
aliquots for the extension PCR (total of four technical replicates for each cell line). This
approach enabled assessment of the level of variation in allele‐specific transcription due
to noise from technical variables in the genotyping platform.
The ratio between the two allele‐specific cDNA yields was averaged across the technical replicates within each cell line order to determine the cDNA allelic imbalance. The gDNA allelic imbalance was calculated by the same method. The cDNA ratios were normalized against the corresponding reference gDNA ratios by dividing the ratio of each of the cDNA samples by the mean of the ratios from the gDNA samples.
‐ ASTQ quality filters.
Samples with substantial variation between technical replicates as defined by a
standard error greater than 5% were excluded from the mapping analysis. Additionally,
cDNA samples with evidence of substantial gDNA contamination, as determined from
their corresponding –RT samples, were excluded from the mapping analysis.
‐ Genetic mapping of allelic imbalance.
Details on the rationale and statistical methods used for genetic mapping of allelic
imbalance will be given during the discussion of the results.
‐ Biological replicates.
In order to assess the level of noise in the transcription phenotype due to variation in
the cell sample and/or the culture conditions, expression analysis was repeated for
biological replicates of each cell line. A biological replicate was defined as a sample
which was revived from the stock stored in liquid nitrogen.
Present investigation
56
‐ Purification of PBMCs and Tregs. PBMCs were isolated by Ficoll density gradient. They were then froze down and stored in liquid nitrogen until they were used. CD4+CD25+ T cells were affinity‐purified by immunomagnetic cell sorting by depletion of
CD4‐ cells and positive selection of CD25+ cells in the CD4+ pre‐enriched fraction using
the CD4+CD25+ Regulatory T cells Isolation Kit (Miltenyi Biotec) as described by
Annunziato and colleagues (2002) (Paper IV).
‐ RNA samples preparation for gene expression analysis.
Total RNA was extracted using TRIzol reagent (Invitrogen) and a standard chloroform‐
isopropanol procedure. The RNeasy Mini kit (Qiagen) was used for RNA cleaning as per
protocol. RNA concentration and quality were assessed using NanoDropTM 1000
(THERMO Scientific) by following manufacturer’s instructions (Paper IV).
‐ Expression analysis of PBMCs using QT‐PCR.
Total RNA was extracted from PBMCs of five Mossi (two males and three females, mean
age ± SE = 42 ± 11.4) and five Fula (three females and two males, mean age ± SE = 40.6 ± 9.8). cDNA was synthesised from 50 ng of RNA by using Super Script reverse
transcriptase (Invitrogen) as per protocol. Quantitative real‐time PCR (QT‐PCR) analysis
was performed with the ABI PRISM 7700 sequence detector (Applied Biosystems). The
Human Th1‐Th2‐Th3 PCR array (SuperArray) was used to simultaneously determine the
mRNA levels of 84 genes according to manufacturer's protocol. For the quantification of
the FOXP3 gene expression, FOXP3 primer control reagent Mix and TaqMan PCR Master
Mix (Applied Biosystems) were used with the following PCR protocol: 50°/ 3 min, 95
°C/10 min, 95 °C/15 s and 60 °C/1 min for 40 cycles. Normalization was performed in
both cases based on the mean of three house‐keeping genes: ACTB, PPIA and GAPDH.
Relative amounts of RNA for each gene and fold increase/decrease in gene expression
were calculated by using the 2^‐ΔCT statistics described by Livak and Schmittgen (2001).
Changes in gene expression between groups were tested for significance using the
Student T test. Expression analysis have been performed using the dedicated excel
software provided by Superarray (Paper IV).
‐ Expression analysis of CD4+CD25+ T cells by microarrays technology.
Total RNA was extracted from CD4+CD25+ T cells of five Mossi (three females, two
males, mean age ± SE = 43.2 ± 3.1), five Fula (three females, two males, mean age ± SE =
40.8 ± 13.4) and five European donors (three females, two males, mean age ± SE = 38 ± 4.7).
A total of 100 ng for each of the donor groups (Mossi, Fula, and European donors) was
pooled. Synthesis of radio‐labelled cDNA was performed with GEArray Ampolabeling‐
Methodology
57
LPR kit (Superarray) by using [α32‐P]‐dCTP (Amersham) according to the supplier's
instructions.
For relative quantification of gene expression, cDNA samples were hybridised to the
Human Autoimmune and Inflammatory Response Gene Array (Superarray).
Radioactivity was quantified with the Packard Cyclone phosphor‐imager. Image
processing and intensity data extraction were performed using the GEArray Expression
Analysis Suite application (Superarray). The results obtained for each group, normalized
to the mean value of ACTB, PPIA and GAPDH as HK‐genes, were compared to each other
by Scatter Plot Analysis using the GEarray Expression Analysis Suite software. The same
procedure was repeated with different set of pooled RNA from the same donors
(biological replicate) and a second set of microarrays (technical replicate) to assess the
variability associated with the preparation of targets and processing of microarrays
(Paper IV).
‐ Validation of microarrays results by QT‐PCR.
RNA was extracted from CD4+CD25+ T cells of twelve Mossi (seven females and five
males, mean age 42.4 ± 11.1) and twelve Fula (seven females and five males, mean age
39.3 ± 8.7). cDNA was synthesised as described above. The expression of selected candidate genes (CTLA4, FOXP3, FASLG, TLR5, TGFB, TGFBR2,
TRADD and SOCS2) and of housekeeping genes (ACTB, PPIA and GAPDH) was assessed
using a custom array purchased from Superarray. Expression analysis was performed as
described above (Paper IV).
Present Investigation
58
RESULTS AND DISCUSSION
Common genetic variation at IFN‐γ loci and carriage of P. falciparum infection in Fula
and Mossi from Burkina Faso: interest of the IRF1 gene (Preliminary association study).
To determine whether genetic variation at the IFNG, IFNGR1, IFNGR2 and IRF1 loci
affects resistance to malaria infection in humans we studied their genetic diversity in
Fula and Mossi, two ethnic groups from Burkina Faso showing striking differences in
susceptibility and immune response to malaria (Modiano et al. 1996, 1998, 1999), and
conducted association analysis with carriage of P. falciparum infection within each
ethnic group.
‐ Study subjects.
We genotyped selected SNPs in a region extending from 5 kb upstream to 5 kb
downstream of each candidate gene in subjects of the Fula and Mossi ethnic groups
from Burkina Faso. The sample comprised 190 unrelated individuals aged > 10 years, 85
belonging to the Fula (mean age ± SE; 29.8 ± 2.0 years) and 105 to the Mossi (39.2 ± 1.7
years), who were recruited during a cross‐sectional epidemiological survey conducted in
August 1994 in the villages of Barkoumbilen and Barkoundouba, Northeast of
Ougadougou, Burkina Faso (Modiano et al. 1996). In spite of the lower mean age of the
present Fula sub‐sample, higher P. falciparum infection rates were recorded amongst
the Mossi (parasite prevalence 31.0 ± 5.0% vs 60.4 ± 4.9% respectively, Yates’s‐
corrected X2 = 14.8 p=0.0001).
‐ Allele frequencies at IFN‐γ loci in Mossi and Fula.
Among the genotyped markers, 10 SNPs were polymorphic at the IFNG locus, 7 at the
IFNGR1 locus, 12 at the IFNGR2 locus and 14 at the IRF1 locus. The allele frequencies for
these SNPs in Mossi and Fula individuals are presented in Table 1. The four genes show
different degrees of genetic diversity, as measured by the mean heterozygosity, but
with a similar picture in the two ethnic groups (IFNG: HM=0.22, HF=0.26; IFNGR1:
HM=0.23, HF=0.25; IFNGR2: HM=0.31, HF=.30; IRF1: HM=0.49; HF=0.48).
We compared the MAF between Mossi and Fula subjects, and calculated the Fst, a
measure of population differentiation of allele frequency, for each SNP at the candidate
loci. At every gene we observed Fst values higher than 0.01 and, with the exception of
IFNGR2, significant differences in MAF for two or more polymorphisms per locus.
It is worth noting that the Fula and Mossi have different geographical origins and
migration history, and are therefore likely to have been exposed to different
environmental pressures, so demographic factors (e.g. bottlenecks) and selection are
Results and Discussion
59
both potential contributors to differences in allele frequency between the two
populations.
Such differences must be taken into account when interpreting association results. A
genetic factor responsible for an increased resistance to malaria infection in the Fula
ethnic group, for example, should show an association with lower infection prevalence
in both populations and a higher allele frequency in the Fula. Furthermore, different
allele frequencies can lead to different haplotype structure, which could potentially
affect the chance of observing signals of association for a un‐genotyped functional SNP.
‐ Haplotypes and Linkage Disequilibrium architecture.
Using the typed SNPs we generated haplotypes across the four loci and calculated pair‐
wise metrics of Linkage Disequilibrium (LD) (Figure 9).
The IFNG and IFNGR1 genes show little level of LD between markers in both Fula and
Mossi. HtSNPs could not be identified as all the genotyped SNPs are necessary to
describe the haplotypic diversity of the two loci. It is therefore likely that the SNPs
included in the present set would not serve as markers for an allelic variant with a true
phenotypic effect if this was not genotyped in our study. In such a situation haplotype‐
based association analysis could prove more informative that single‐marker analysis.
Differences in the frequency of common haplotypes (frequency > 0.05) between Fula
and Mossi can be observed for both loci (Table 3).
One haplotype block has been identified within the IFNGR2 gene, corresponding to
exons 3 to 6 and the downstream region. Similar sets of htSNPs describe the haplotypic
diversity of the locus in the two populations (data not shown) and no differences are
observed in terms of common haplotype frequency (Table 3). It is worth recalling that
we did not observe any significant difference in allele frequency for this gene (see Table
1).
Much higher levels of LD are observed at the IRF1 gene, where in both the Fula and
Mossi two haplotype blocks are identified: the first corresponding to the coding and the
downstream regions, and the second to the upstream region. The haplotypic diversity is
captured by different sets of htSNPs (data not shown). Furthermore, the most common
haplotypes (frequency > 0.05) have different frequencies in the two populations (Table
3), and haplotypes exclusive to just one ethnic group also exist (data not shown).
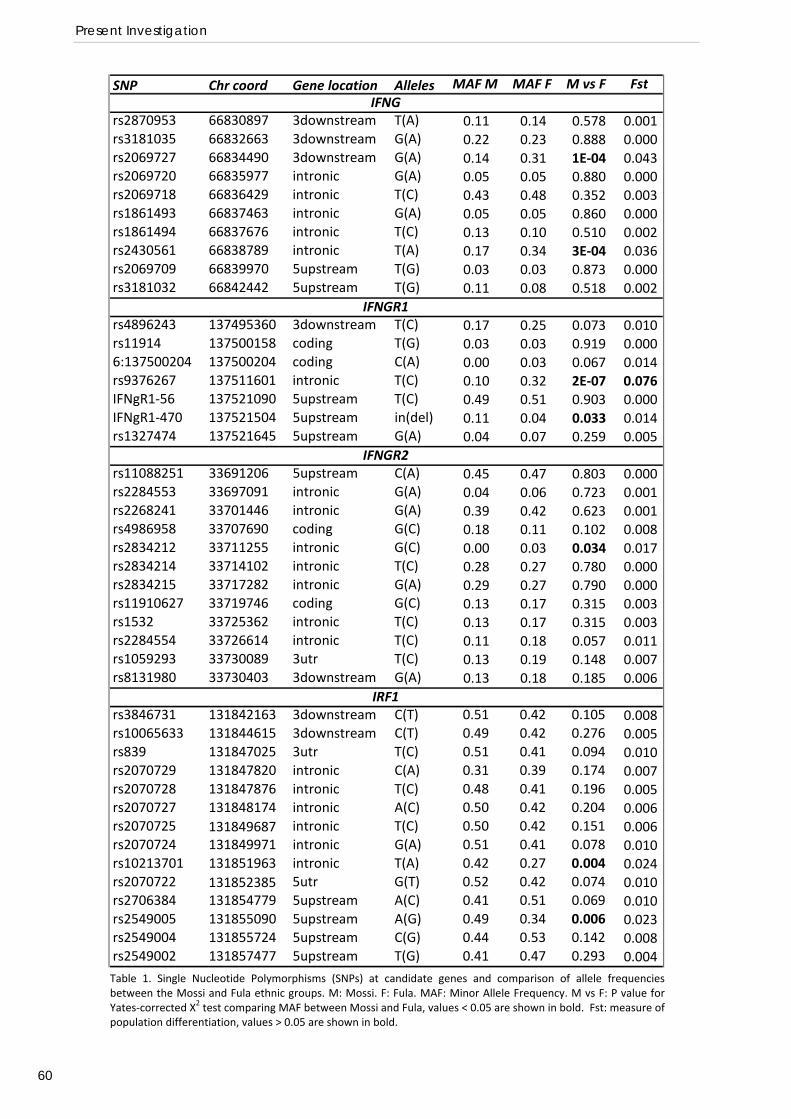
Present Investigation
60
SNP Chr coord Gene location Alleles MAF M MAF F M vs F Fst
rs2870953 66830897 3downstream T(A) 0.11 0.14 0.578 0.001rs3181035 66832663 3downstream G(A) 0.22 0.23 0.888 0.000rs2069727 66834490 3downstream G(A) 0.14 0.31 1E‐04 0.043rs2069720 66835977 intronic G(A) 0.05 0.05 0.880 0.000rs2069718 66836429 intronic T(C) 0.43 0.48 0.352 0.003rs1861493 66837463 intronic G(A) 0.05 0.05 0.860 0.000rs1861494 66837676 intronic T(C) 0.13 0.10 0.510 0.002rs2430561 66838789 intronic T(A) 0.17 0.34 3E‐04 0.036rs2069709 66839970 5upstream T(G) 0.03 0.03 0.873 0.000rs3181032 66842442 5upstream T(G) 0.11 0.08 0.518 0.002
rs4896243 137495360 3downstream T(C) 0.17 0.25 0.073 0.010rs11914 137500158 coding T(G) 0.03 0.03 0.919 0.0006:137500204 137500204 coding C(A) 0.00 0.03 0.067 0.014rs9376267 137511601 intronic T(C) 0.10 0.32 2E‐07 0.076IFNgR1‐56 137521090 5upstream T(C) 0.49 0.51 0.903 0.000IFNgR1‐470 137521504 5upstream in(del) 0.11 0.04 0.033 0.014rs1327474 137521645 5upstream G(A) 0.04 0.07 0.259 0.005
rs11088251 33691206 5upstream C(A) 0.45 0.47 0.803 0.000rs2284553 33697091 intronic G(A) 0.04 0.06 0.723 0.001rs2268241 33701446 intronic G(A) 0.39 0.42 0.623 0.001rs4986958 33707690 coding G(C) 0.18 0.11 0.102 0.008rs2834212 33711255 intronic G(C) 0.00 0.03 0.034 0.017rs2834214 33714102 intronic T(C) 0.28 0.27 0.780 0.000rs2834215 33717282 intronic G(A) 0.29 0.27 0.790 0.000rs11910627 33719746 coding G(C) 0.13 0.17 0.315 0.003rs1532 33725362 intronic T(C) 0.13 0.17 0.315 0.003rs2284554 33726614 intronic T(C) 0.11 0.18 0.057 0.011rs1059293 33730089 3utr T(C) 0.13 0.19 0.148 0.007rs8131980 33730403 3downstream G(A) 0.13 0.18 0.185 0.006
rs3846731 131842163 3downstream C(T) 0.51 0.42 0.105 0.008rs10065633 131844615 3downstream C(T) 0.49 0.42 0.276 0.005rs839 131847025 3utr T(C) 0.51 0.41 0.094 0.010rs2070729 131847820 intronic C(A) 0.31 0.39 0.174 0.007rs2070728 131847876 intronic T(C) 0.48 0.41 0.196 0.005rs2070727 131848174 intronic A(C) 0.50 0.42 0.204 0.006rs2070725 131849687 intronic T(C) 0.50 0.42 0.151 0.006rs2070724 131849971 intronic G(A) 0.51 0.41 0.078 0.010rs10213701 131851963 intronic T(A) 0.42 0.27 0.004 0.024rs2070722 131852385 5utr G(T) 0.52 0.42 0.074 0.010rs2706384 131854779 5upstream A(C) 0.41 0.51 0.069 0.010rs2549005 131855090 5upstream A(G) 0.49 0.34 0.006 0.023rs2549004 131855724 5upstream C(G) 0.44 0.53 0.142 0.008rs2549002 131857477 5upstream T(G) 0.41 0.47 0.293 0.004
IFNG
IFNGR1
IFNGR2
IRF1
Table 1. Single Nucleotide Polymorphisms (SNPs) at candidate genes and comparison of allele frequenciesbetween the Mossi and Fula ethnic groups. M: Mossi. F: Fula. MAF: Minor Allele Frequency. M vs F: P value for Yates‐corrected Χ2 test comparing MAF between Mossi and Fula, values < 0.05 are shown in bold. Fst: measure of population differentiation, values > 0.05 are shown in bold.
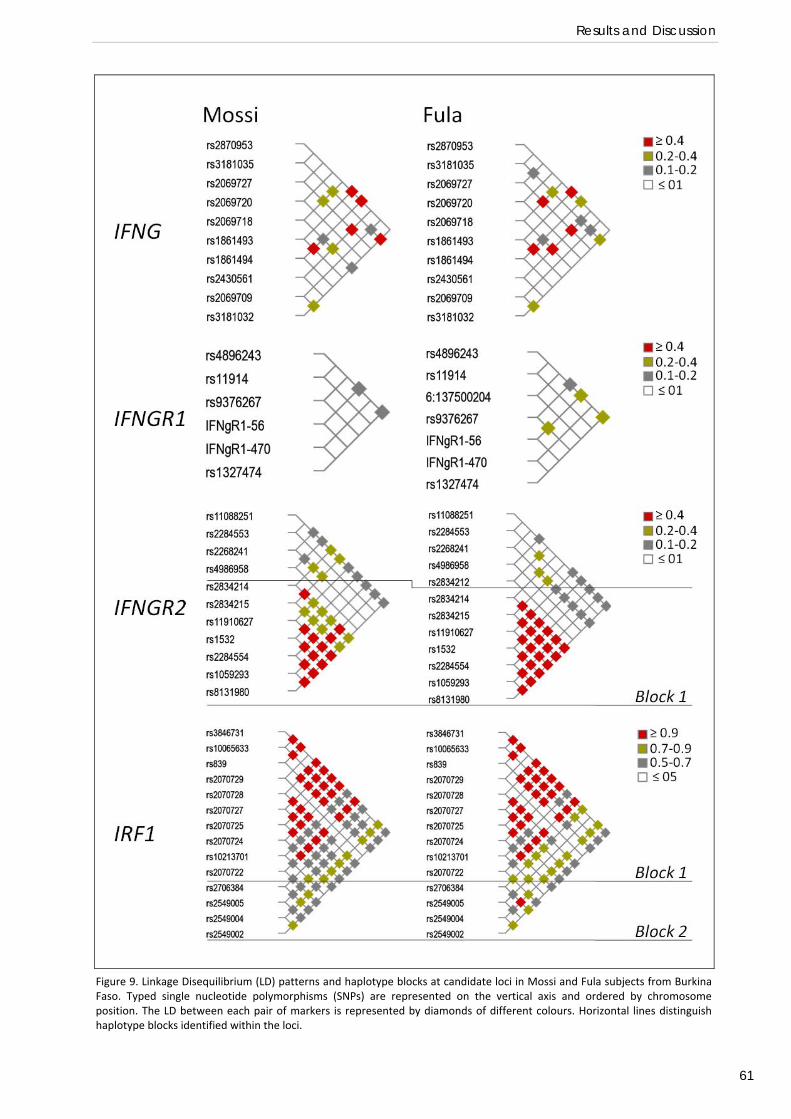
Results and Discussion
61
Figure 9. Linkage Disequilibrium (LD) patterns and haplotype blocks at candidate loci in Mossi and Fula subjects from BurkinaFaso. Typed single nucleotide polymorphisms (SNPs) are represented on the vertical axis and ordered by chromosomeposition. The LD between each pair of markers is represented by diamonds of different colours. Horizontal lines distinguishhaplotype blocks identified within the loci.
Present Investigation
62
‐ Single‐marker and haplotype‐based analysis of association with carriage of
P. falciparum infection.
We analysed association between common genetic variation at candidate loci and
carriage of P. falciparum infection, based on a cross‐sectional epidemiological survey of
190 unrelated individuals over 10 years old, of which 85 were Fula and 105 Mossi.
Results of single marker tests under the genotype and additive model are presented in
Table 2, while results of haplotype‐based tests are presented in Table 3.
We did not observe any significant association between IFNG SNPs/haplotypes and
susceptibility to infection neither in the Mossi nor in the Fula populations. A trend of
association was observed in the Mossi for SNP rs1861494, but this would be well
beyond statistical significance threshold when applying correction for multiple testing.
We noted a trend of association between the ‐470 in/del polymorphism in the IFNGR1
gene and susceptibility to infection in the Mossi ethnic group. This is an interesting
observation in view of the previous report of association of this SNP with severe malaria
(Kock et al. 2005) and of the possible functional effect of this variant on gene
transcription (Koch et al. 2006). Nevertheless, this result must be considered with
caution, as only a trend is observed in only one ethnic group. A significant association
was instead observed for SNP rs9376267 in the Fula. It is possible that a loose LD
structure and different haplotypic architecture in the two populations are hindering the
detection of the effect of a non‐genotyped causative variant(s). Extensive search for
genetic polymorphisms in this gene region would be therefore desirable.
As for IFNG, no significant associations were observed for the IFNGR2 locus in any of the
two ethnic groups. Marker rs1059293 showed only a trend of association in the Mossi
ethnic group.
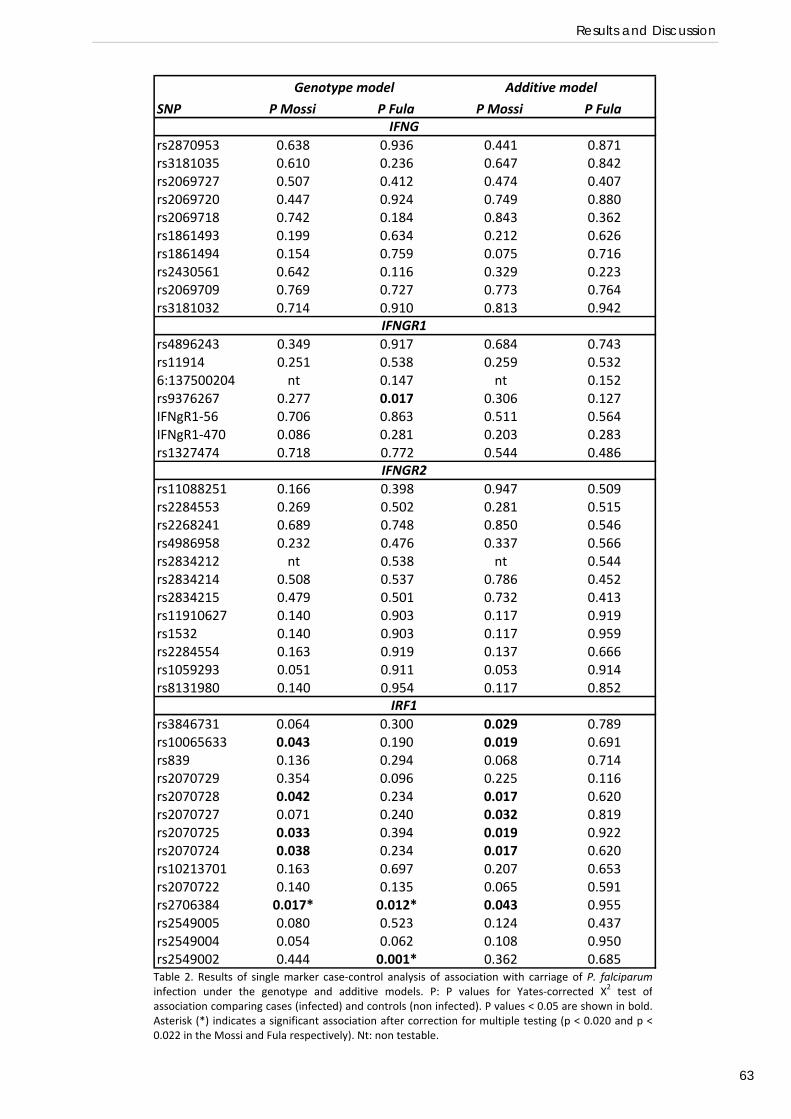
Results and Discussion
63
Table 2. Results of single marker case‐control analysis of association with carriage of P. falciparuminfection under the genotype and additive models. P: P values for Yates‐corrected Χ2 test ofassociation comparing cases (infected) and controls (non infected). P values < 0.05 are shown in bold.Asterisk (*) indicates a significant association after correction for multiple testing (p < 0.020 and p <0.022 in the Mossi and Fula respectively). Nt: non testable.
SNP P Mossi P Fula P Mossi P Fula
rs2870953 0.638 0.936 0.441 0.871rs3181035 0.610 0.236 0.647 0.842rs2069727 0.507 0.412 0.474 0.407rs2069720 0.447 0.924 0.749 0.880rs2069718 0.742 0.184 0.843 0.362rs1861493 0.199 0.634 0.212 0.626rs1861494 0.154 0.759 0.075 0.716rs2430561 0.642 0.116 0.329 0.223rs2069709 0.769 0.727 0.773 0.764rs3181032 0.714 0.910 0.813 0.942
rs4896243 0.349 0.917 0.684 0.743rs11914 0.251 0.538 0.259 0.5326:137500204 nt 0.147 nt 0.152rs9376267 0.277 0.017 0.306 0.127IFNgR1‐56 0.706 0.863 0.511 0.564IFNgR1‐470 0.086 0.281 0.203 0.283rs1327474 0.718 0.772 0.544 0.486
rs11088251 0.166 0.398 0.947 0.509rs2284553 0.269 0.502 0.281 0.515rs2268241 0.689 0.748 0.850 0.546rs4986958 0.232 0.476 0.337 0.566rs2834212 nt 0.538 nt 0.544rs2834214 0.508 0.537 0.786 0.452rs2834215 0.479 0.501 0.732 0.413rs11910627 0.140 0.903 0.117 0.919rs1532 0.140 0.903 0.117 0.959rs2284554 0.163 0.919 0.137 0.666rs1059293 0.051 0.911 0.053 0.914rs8131980 0.140 0.954 0.117 0.852
rs3846731 0.064 0.300 0.029 0.789rs10065633 0.043 0.190 0.019 0.691rs839 0.136 0.294 0.068 0.714rs2070729 0.354 0.096 0.225 0.116rs2070728 0.042 0.234 0.017 0.620rs2070727 0.071 0.240 0.032 0.819rs2070725 0.033 0.394 0.019 0.922rs2070724 0.038 0.234 0.017 0.620rs10213701 0.163 0.697 0.207 0.653rs2070722 0.140 0.135 0.065 0.591rs2706384 0.017* 0.012* 0.043 0.955rs2549005 0.080 0.523 0.124 0.437rs2549004 0.054 0.062 0.108 0.950rs2549002 0.444 0.001* 0.362 0.685
IRF1
Genotype model Additive model
IFNG
IFNGR1
IFNGR2
Present Investigation
64
Significant SNP associations with carriage of P. falciparum infection were observed at
the IRF1 locus in both Fula and Mossi, but each showed a different pattern of
association. In haplotype‐based analysis, a trend of association has been observed in the
two populations, again each with different haplotypes. This might possibly reflect the
different haplotype architecture in the two groups.
Interestingly, the two SNPs with greatest difference in frequency between Fula and
Mossi were not associated with carriage of P. falciparum infection. One IRF1 promoter
polymorphism, rs2706384, was associated with protection against P. falciparum
infection in both populations (Table 3), and was still significant after correction for
multiple testing. Although the rs2706384 polymorphism appears to be a marker for
protection against P. falciparum infection, it is evidently not responsible for the
increased malaria resistance of the Fula compared to the Mossi, as it has a similar allele
frequency in both groups (0.41 and 0.51 respectively, see Table 1) and when stratified
for rs2706384 genotype the parasite rate remains lower in the Fula than in the Mossi
(Table 4). Furthermore the pattern of association differs between the two populations:
while in the Mossi the C allele is associated with a higher risk of carrying a P. falciparum
infection (OR=1.92, 95% CI 1.02‐3.63, p=0.04), this is not the case in the Fula (OR=1.08,
95% CI 0.53‐2.22, p=0.95). In fact in the latter group both CC and AA homozygous
individuals are more frequently parasitized than heterozygous CA subjects. This
observation further suggests that this polymorphism is not itself the cause of
association but could be a marker for a non‐genotyped functional SNP.
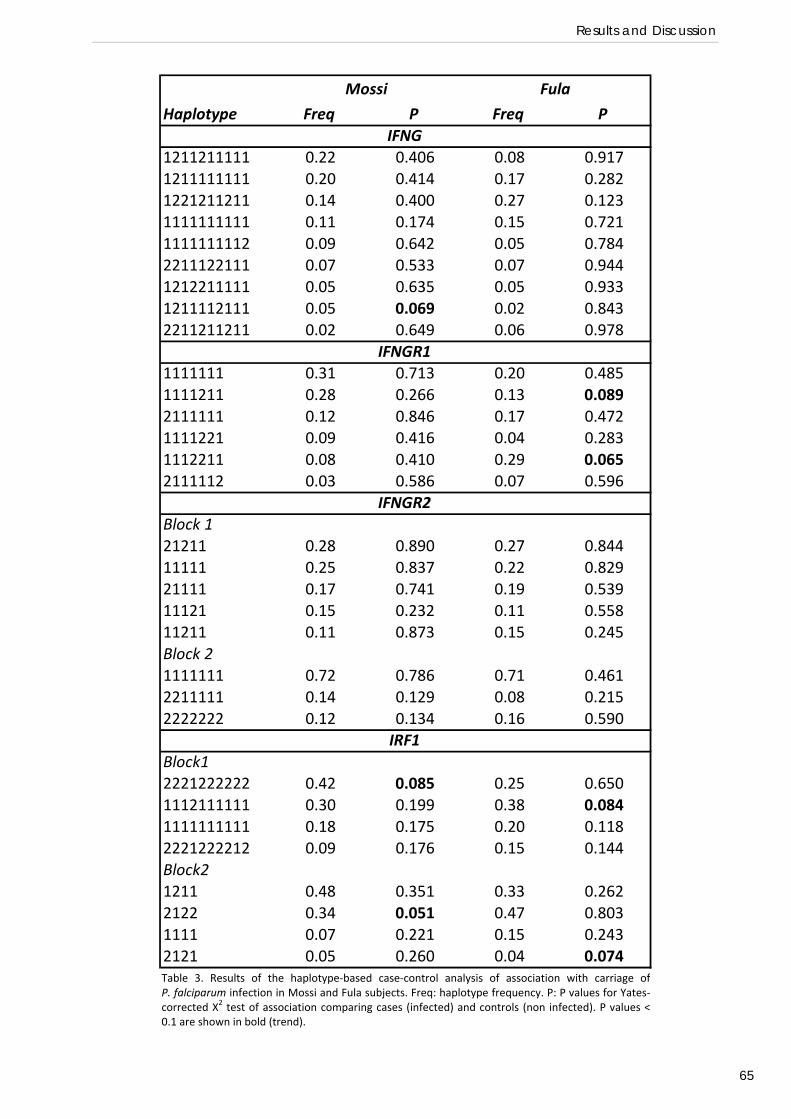
Results and Discussion
65
Haplotype Freq P Freq P
1211211111 0.22 0.406 0.08 0.9171211111111 0.20 0.414 0.17 0.2821221211211 0.14 0.400 0.27 0.1231111111111 0.11 0.174 0.15 0.7211111111112 0.09 0.642 0.05 0.7842211122111 0.07 0.533 0.07 0.9441212211111 0.05 0.635 0.05 0.9331211112111 0.05 0.069 0.02 0.8432211211211 0.02 0.649 0.06 0.978
1111111 0.31 0.713 0.20 0.4851111211 0.28 0.266 0.13 0.0892111111 0.12 0.846 0.17 0.4721111221 0.09 0.416 0.04 0.2831112211 0.08 0.410 0.29 0.0652111112 0.03 0.586 0.07 0.596
Block 121211 0.28 0.890 0.27 0.84411111 0.25 0.837 0.22 0.82921111 0.17 0.741 0.19 0.53911121 0.15 0.232 0.11 0.55811211 0.11 0.873 0.15 0.245Block 21111111 0.72 0.786 0.71 0.4612211111 0.14 0.129 0.08 0.2152222222 0.12 0.134 0.16 0.590
Block12221222222 0.42 0.085 0.25 0.6501112111111 0.30 0.199 0.38 0.0841111111111 0.18 0.175 0.20 0.1182221222212 0.09 0.176 0.15 0.144Block21211 0.48 0.351 0.33 0.2622122 0.34 0.051 0.47 0.8031111 0.07 0.221 0.15 0.2432121 0.05 0.260 0.04 0.074
IRF1
Mossi Fula
IFNG
IFNGR1
IFNGR2
Table 3. Results of the haplotype‐based case‐control analysis of association with carriage of
P. falciparum infection in Mossi and Fula subjects. Freq: haplotype frequency. P: P values for Yates‐corrected Χ2 test of association comparing cases (infected) and controls (non infected). P values <0.1 are shown in bold (trend).
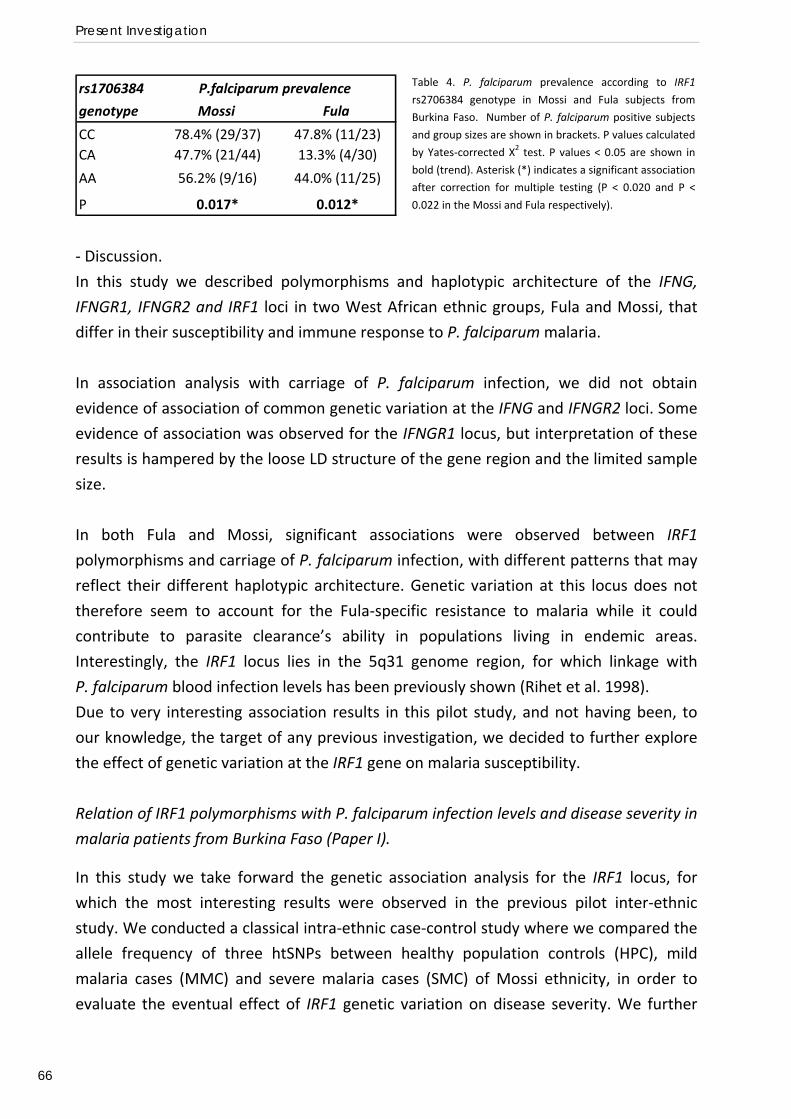
Present Investigation
66
Table 4. P. falciparum prevalence according to IRF1
rs2706384 genotype in Mossi and Fula subjects from
Burkina Faso. Number of P. falciparum positive subjects
and group sizes are shown in brackets. P values calculated
by Yates‐corrected Χ2 test. P values < 0.05 are shown in
bold (trend). Asterisk (*) indicates a significant association
after correction for multiple testing (P < 0.020 and P <
0.022 in the Mossi and Fula respectively).
rs1706384
genotype Mossi Fula
CC 78.4% (29/37) 47.8% (11/23)CA 47.7% (21/44) 13.3% (4/30)
AA 56.2% (9/16) 44.0% (11/25)
P 0.017* 0.012*
P.falciparum prevalence
‐ Discussion.
In this study we described polymorphisms and haplotypic architecture of the IFNG,
IFNGR1, IFNGR2 and IRF1 loci in two West African ethnic groups, Fula and Mossi, that
differ in their susceptibility and immune response to P. falciparum malaria.
In association analysis with carriage of P. falciparum infection, we did not obtain
evidence of association of common genetic variation at the IFNG and IFNGR2 loci. Some
evidence of association was observed for the IFNGR1 locus, but interpretation of these
results is hampered by the loose LD structure of the gene region and the limited sample
size.
In both Fula and Mossi, significant associations were observed between IRF1
polymorphisms and carriage of P. falciparum infection, with different patterns that may
reflect their different haplotypic architecture. Genetic variation at this locus does not
therefore seem to account for the Fula‐specific resistance to malaria while it could
contribute to parasite clearance’s ability in populations living in endemic areas.
Interestingly, the IRF1 locus lies in the 5q31 genome region, for which linkage with
P. falciparum blood infection levels has been previously shown (Rihet et al. 1998).
Due to very interesting association results in this pilot study, and not having been, to
our knowledge, the target of any previous investigation, we decided to further explore
the effect of genetic variation at the IRF1 gene on malaria susceptibility.
Relation of IRF1 polymorphisms with P. falciparum infection levels and disease severity in
malaria patients from Burkina Faso (Paper I).
In this study we take forward the genetic association analysis for the IRF1 locus, for
which the most interesting results were observed in the previous pilot inter‐ethnic
study. We conducted a classical intra‐ethnic case‐control study where we compared the
allele frequency of three htSNPs between healthy population controls (HPC), mild
malaria cases (MMC) and severe malaria cases (SMC) of Mossi ethnicity, in order to
evaluate the eventual effect of IRF1 genetic variation on disease severity. We further
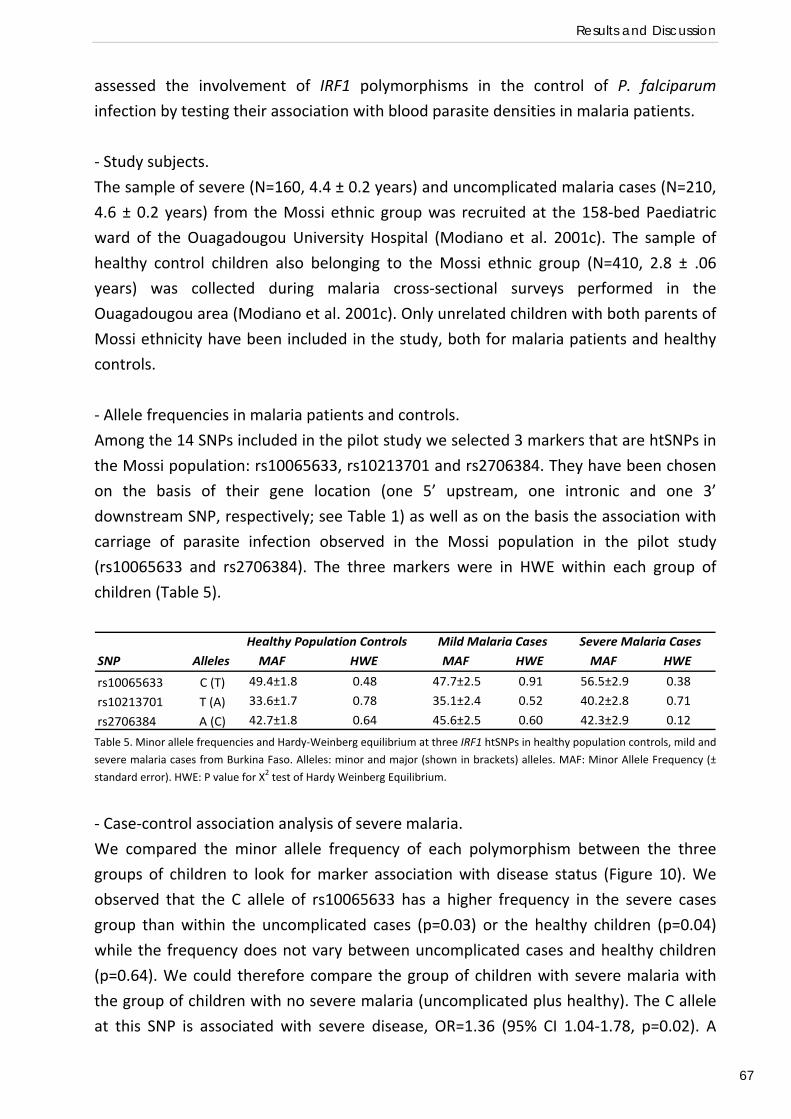
Results and Discussion
67
assessed the involvement of IRF1 polymorphisms in the control of P. falciparum
infection by testing their association with blood parasite densities in malaria patients.
‐ Study subjects.
The sample of severe (N=160, 4.4 ± 0.2 years) and uncomplicated malaria cases (N=210,
4.6 ± 0.2 years) from the Mossi ethnic group was recruited at the 158‐bed Paediatric
ward of the Ouagadougou University Hospital (Modiano et al. 2001c). The sample of
healthy control children also belonging to the Mossi ethnic group (N=410, 2.8 ± .06
years) was collected during malaria cross‐sectional surveys performed in the
Ouagadougou area (Modiano et al. 2001c). Only unrelated children with both parents of
Mossi ethnicity have been included in the study, both for malaria patients and healthy
controls.
‐ Allele frequencies in malaria patients and controls.
Among the 14 SNPs included in the pilot study we selected 3 markers that are htSNPs in
the Mossi population: rs10065633, rs10213701 and rs2706384. They have been chosen
on the basis of their gene location (one 5’ upstream, one intronic and one 3’
downstream SNP, respectively; see Table 1) as well as on the basis the association with
carriage of parasite infection observed in the Mossi population in the pilot study
(rs10065633 and rs2706384). The three markers were in HWE within each group of
children (Table 5).
SNP Alleles MAF HWE MAF HWE MAF HWE
rs10065633 C (T) 49.4±1.8 0.48 47.7±2.5 0.91 56.5±2.9 0.38
rs10213701 T (A) 33.6±1.7 0.78 35.1±2.4 0.52 40.2±2.8 0.71
rs2706384 A (C) 42.7±1.8 0.64 45.6±2.5 0.60 42.3±2.9 0.12
Healthy Population Controls Mild Malaria Cases Severe Malaria Cases
Table 5. Minor allele frequencies and Hardy‐Weinberg equilibrium at three IRF1 htSNPs in healthy population controls, mild and
severe malaria cases from Burkina Faso. Alleles: minor and major (shown in brackets) alleles. MAF: Minor Allele Frequency (±
standard error). HWE: P value for X2 test of Hardy Weinberg Equilibrium.
‐ Case‐control association analysis of severe malaria.
We compared the minor allele frequency of each polymorphism between the three
groups of children to look for marker association with disease status (Figure 10). We
observed that the C allele of rs10065633 has a higher frequency in the severe cases
group than within the uncomplicated cases (p=0.03) or the healthy children (p=0.04)
while the frequency does not vary between uncomplicated cases and healthy children
(p=0.64). We could therefore compare the group of children with severe malaria with
the group of children with no severe malaria (uncomplicated plus healthy). The C allele
at this SNP is associated with severe disease, OR=1.36 (95% CI 1.04‐1.78, p=0.02). A
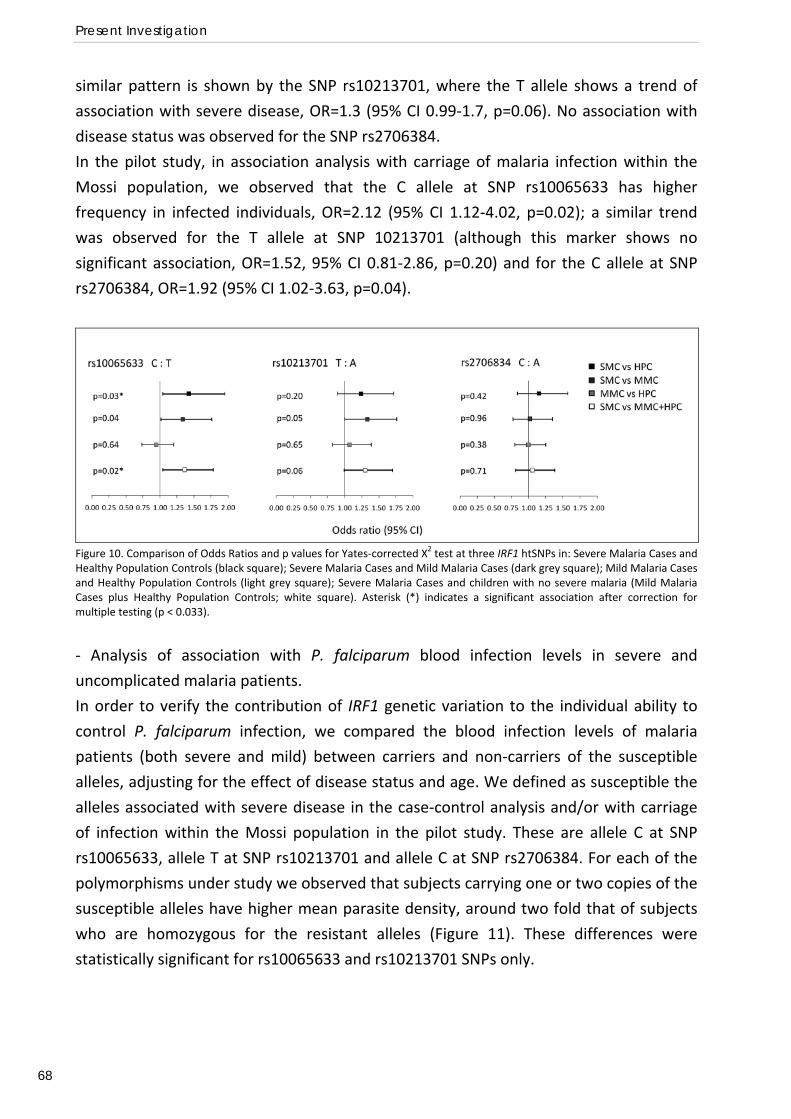
Present Investigation
68
similar pattern is shown by the SNP rs10213701, where the T allele shows a trend of
association with severe disease, OR=1.3 (95% CI 0.99‐1.7, p=0.06). No association with
disease status was observed for the SNP rs2706384.
In the pilot study, in association analysis with carriage of malaria infection within the
Mossi population, we observed that the C allele at SNP rs10065633 has higher
frequency in infected individuals, OR=2.12 (95% CI 1.12‐4.02, p=0.02); a similar trend
was observed for the T allele at SNP 10213701 (although this marker shows no
significant association, OR=1.52, 95% CI 0.81‐2.86, p=0.20) and for the C allele at SNP
rs2706384, OR=1.92 (95% CI 1.02‐3.63, p=0.04).
Figure 10. Comparison of Odds Ratios and p values for Yates‐corrected X2 test at three IRF1 htSNPs in: Severe Malaria Cases and Healthy Population Controls (black square); Severe Malaria Cases and Mild Malaria Cases (dark grey square); Mild Malaria Cases and Healthy Population Controls (light grey square); Severe Malaria Cases and children with no severe malaria (Mild Malaria Cases plus Healthy Population Controls; white square). Asterisk (*) indicates a significant association after correction for multiple testing (p < 0.033).
‐ Analysis of association with P. falciparum blood infection levels in severe and
uncomplicated malaria patients.
In order to verify the contribution of IRF1 genetic variation to the individual ability to
control P. falciparum infection, we compared the blood infection levels of malaria
patients (both severe and mild) between carriers and non‐carriers of the susceptible
alleles, adjusting for the effect of disease status and age. We defined as susceptible the
alleles associated with severe disease in the case‐control analysis and/or with carriage
of infection within the Mossi population in the pilot study. These are allele C at SNP
rs10065633, allele T at SNP rs10213701 and allele C at SNP rs2706384. For each of the
polymorphisms under study we observed that subjects carrying one or two copies of the
susceptible alleles have higher mean parasite density, around two fold that of subjects
who are homozygous for the resistant alleles (Figure 11). These differences were
statistically significant for rs10065633 and rs10213701 SNPs only.
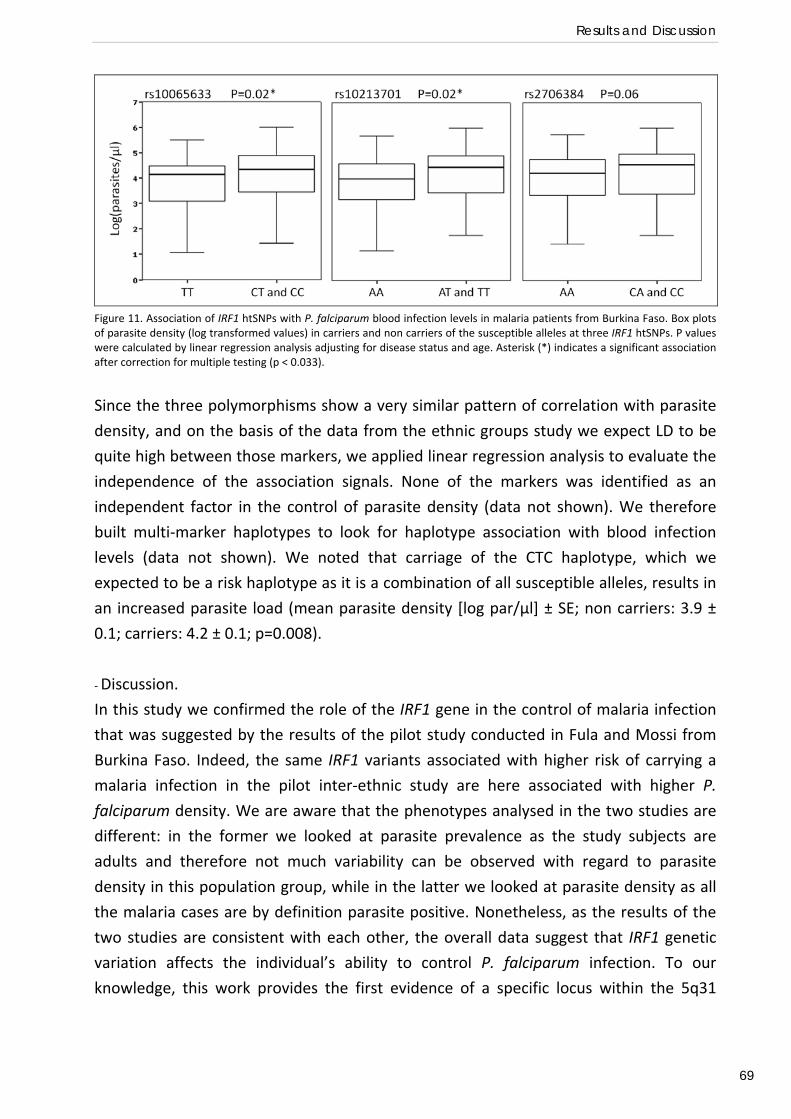
Results and Discussion
69
Figure 11. Association of IRF1 htSNPs with P. falciparum blood infection levels in malaria patients from Burkina Faso. Box plots of parasite density (log transformed values) in carriers and non carriers of the susceptible alleles at three IRF1 htSNPs. P values were calculated by linear regression analysis adjusting for disease status and age. Asterisk (*) indicates a significant association after correction for multiple testing (p < 0.033).
Since the three polymorphisms show a very similar pattern of correlation with parasite
density, and on the basis of the data from the ethnic groups study we expect LD to be
quite high between those markers, we applied linear regression analysis to evaluate the
independence of the association signals. None of the markers was identified as an
independent factor in the control of parasite density (data not shown). We therefore
built multi‐marker haplotypes to look for haplotype association with blood infection
levels (data not shown). We noted that carriage of the CTC haplotype, which we
expected to be a risk haplotype as it is a combination of all susceptible alleles, results in
an increased parasite load (mean parasite density [log par/µl] ± SE; non carriers: 3.9 ±
0.1; carriers: 4.2 ± 0.1; p=0.008).
‐ Discussion.
In this study we confirmed the role of the IRF1 gene in the control of malaria infection
that was suggested by the results of the pilot study conducted in Fula and Mossi from
Burkina Faso. Indeed, the same IRF1 variants associated with higher risk of carrying a
malaria infection in the pilot inter‐ethnic study are here associated with higher P.
falciparum density. We are aware that the phenotypes analysed in the two studies are
different: in the former we looked at parasite prevalence as the study subjects are
adults and therefore not much variability can be observed with regard to parasite
density in this population group, while in the latter we looked at parasite density as all
the malaria cases are by definition parasite positive. Nonetheless, as the results of the
two studies are consistent with each other, the overall data suggest that IRF1 genetic
variation affects the individual’s ability to control P. falciparum infection. To our
knowledge, this work provides the first evidence of a specific locus within the 5q31
Present Investigation
70
region that is associated with the control of malaria infection, and raises the possibility
that IRF1 could be the Pfil locus.
However, the case‐control association analysis did not provide coherent and convincing
evidence of the involvement of this locus in the evolution of malaria as a disease.
Indeed, only a trend of association with small differential risk of severe disease was
suggested. The role of IRF1 as a genetic determinant of human susceptibility to severe
malaria needs further exploring and will be the object of investigation of the next
association study.
IRF1 polymorphisms and susceptibility to severe malaria in affected child‐parental trios
from The Gambia, Kenya and Malawi (Paper II).
In order to investigate whether genetic variation at the IRF1 locus contributes to a
child’s risk of developing severe malaria, we conducted a large multi‐centre association
study. As African populations show a great genetic diversity (Tishkoff et al. 2002)
population structure must be carefully taken into account when conducting population
based genetic association studies since it might lead to false positive results (Marchini et
al. 2004). To avoid this drawback we applied the complementary TDT approach
(Spielman 1993) which uses genotype data from family trios consisting of one affected
child and his/her two parents, and compares the genotype distribution observed in the
severe malaria cases to its expected distribution derived on Mendel’s law of
segregation. A comparison of the case‐control and family‐based association methods
has been carried out using the well‐established association of the sickle cell trait with
protection against severe malaria, showing that they have similar power and give similar
estimates of the level of protection (Ackerman et al. 2005).. We conducted our
association analysis in trios from 3 sub‐Saharan African countries covering a range of
malaria ecologies, The Gambia, Kenya and Malawi. By considering multiple populations,
we were able to investigate regional differences, whilst standardizing phenotype
definition and study design.
‐ Study subjects.
We have genotyped 18 SNPs in the IRF1 genetic region in 961 nuclear trios comprising
one child affected by severe malaria and his two parents. Severe malaria patient
samples were collected as part of ongoing epidemiological studies at the Royal Victoria
Hospital, Banjul, The Gambia (555 trios); the Queen Elizabeth Central Hospital, Blantyre,
Malawi (202 trios); and Kilifi District Hospital, Kilifi, Kenya (204 trios). The family trios
were assessed for pedigree misspecification using a panel of 48 additional markers
spread across the genome and the Nucl3ar software package (Teo et al. 2008), which
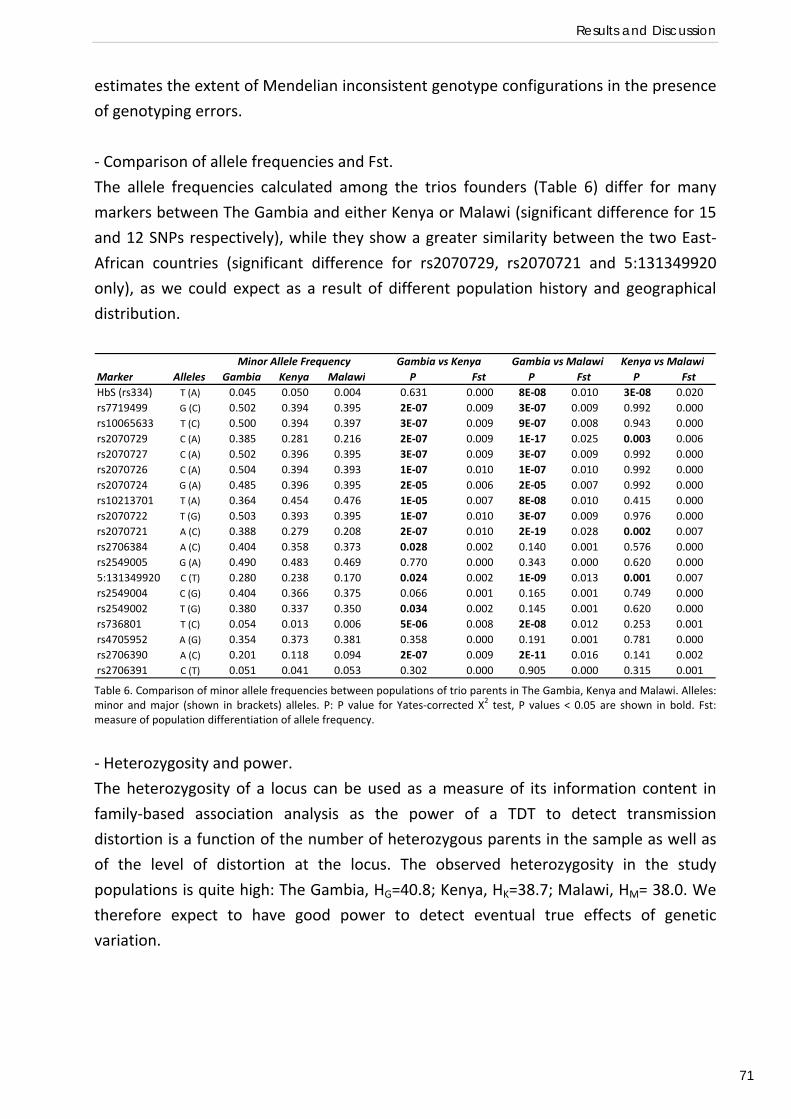
Results and Discussion
71
estimates the extent of Mendelian inconsistent genotype configurations in the presence
of genotyping errors.
‐ Comparison of allele frequencies and Fst.
The allele frequencies calculated among the trios founders (Table 6) differ for many
markers between The Gambia and either Kenya or Malawi (significant difference for 15
and 12 SNPs respectively), while they show a greater similarity between the two East‐
African countries (significant difference for rs2070729, rs2070721 and 5:131349920
only), as we could expect as a result of different population history and geographical
distribution.
Marker Alleles Gambia Kenya Malawi P Fst P Fst P FstHbS (rs334) T (A) 0.045 0.050 0.004 0.631 0.000 8E‐08 0.010 3E‐08 0.020rs7719499 G (C) 0.502 0.394 0.395 2E‐07 0.009 3E‐07 0.009 0.992 0.000rs10065633 T (C) 0.500 0.394 0.397 3E‐07 0.009 9E‐07 0.008 0.943 0.000rs2070729 C (A) 0.385 0.281 0.216 2E‐07 0.009 1E‐17 0.025 0.003 0.006rs2070727 C (A) 0.502 0.396 0.395 3E‐07 0.009 3E‐07 0.009 0.992 0.000rs2070726 C (A) 0.504 0.394 0.393 1E‐07 0.010 1E‐07 0.010 0.992 0.000rs2070724 G (A) 0.485 0.396 0.395 2E‐05 0.006 2E‐05 0.007 0.992 0.000rs10213701 T (A) 0.364 0.454 0.476 1E‐05 0.007 8E‐08 0.010 0.415 0.000rs2070722 T (G) 0.503 0.393 0.395 1E‐07 0.010 3E‐07 0.009 0.976 0.000rs2070721 A (C) 0.388 0.279 0.208 2E‐07 0.010 2E‐19 0.028 0.002 0.007rs2706384 A (C) 0.404 0.358 0.373 0.028 0.002 0.140 0.001 0.576 0.000rs2549005 G (A) 0.490 0.483 0.469 0.770 0.000 0.343 0.000 0.620 0.0005:131349920 C (T) 0.280 0.238 0.170 0.024 0.002 1E‐09 0.013 0.001 0.007rs2549004 C (G) 0.404 0.366 0.375 0.066 0.001 0.165 0.001 0.749 0.000rs2549002 T (G) 0.380 0.337 0.350 0.034 0.002 0.145 0.001 0.620 0.000rs736801 T (C) 0.054 0.013 0.006 5E‐06 0.008 2E‐08 0.012 0.253 0.001rs4705952 A (G) 0.354 0.373 0.381 0.358 0.000 0.191 0.001 0.781 0.000rs2706390 A (C) 0.201 0.118 0.094 2E‐07 0.009 2E‐11 0.016 0.141 0.002rs2706391 C (T) 0.051 0.041 0.053 0.302 0.000 0.905 0.000 0.315 0.001
Minor Allele Frequency Gambia vs Kenya Gambia vs Malawi Kenya vs Malawi
Table 6. Comparison of minor allele frequencies between populations of trio parents in The Gambia, Kenya and Malawi. Alleles: minor and major (shown in brackets) alleles. P: P value for Yates‐corrected Χ2 test, P values < 0.05 are shown in bold. Fst: measure of population differentiation of allele frequency.
‐ Heterozygosity and power.
The heterozygosity of a locus can be used as a measure of its information content in
family‐based association analysis as the power of a TDT to detect transmission
distortion is a function of the number of heterozygous parents in the sample as well as
of the level of distortion at the locus. The observed heterozygosity in the study
populations is quite high: The Gambia, HG=40.8; Kenya, HK=38.7; Malawi, HM= 38.0. We
therefore expect to have good power to detect eventual true effects of genetic
variation.
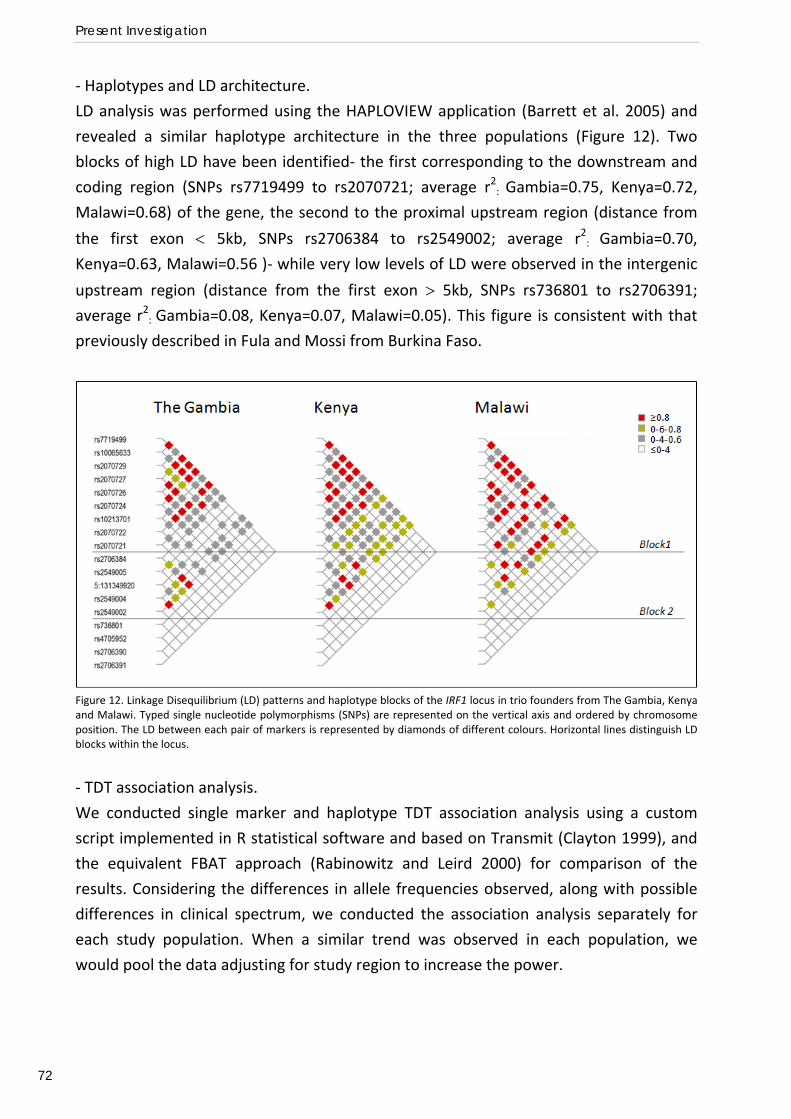
Present Investigation
72
‐ Haplotypes and LD architecture.
LD analysis was performed using the HAPLOVIEW application (Barrett et al. 2005) and
revealed a similar haplotype architecture in the three populations (Figure 12). Two
blocks of high LD have been identified‐ the first corresponding to the downstream and
coding region (SNPs rs7719499 to rs2070721; average r2: Gambia=0.75, Kenya=0.72,
Malawi=0.68) of the gene, the second to the proximal upstream region (distance from
the first exon < 5kb, SNPs rs2706384 to rs2549002; average r2: Gambia=0.70,
Kenya=0.63, Malawi=0.56 )‐ while very low levels of LD were observed in the intergenic
upstream region (distance from the first exon > 5kb, SNPs rs736801 to rs2706391; average r2: Gambia=0.08, Kenya=0.07, Malawi=0.05). This figure is consistent with that
previously described in Fula and Mossi from Burkina Faso.
Figure 12. Linkage Disequilibrium (LD) patterns and haplotype blocks of the IRF1 locus in trio founders from The Gambia, Kenya and Malawi. Typed single nucleotide polymorphisms (SNPs) are represented on the vertical axis and ordered by chromosome position. The LD between each pair of markers is represented by diamonds of different colours. Horizontal lines distinguish LD blocks within the locus.
‐ TDT association analysis.
We conducted single marker and haplotype TDT association analysis using a custom
script implemented in R statistical software and based on Transmit (Clayton 1999), and
the equivalent FBAT approach (Rabinowitz and Leird 2000) for comparison of the
results. Considering the differences in allele frequencies observed, along with possible
differences in clinical spectrum, we conducted the association analysis separately for
each study population. When a similar trend was observed in each population, we
would pool the data adjusting for study region to increase the power.
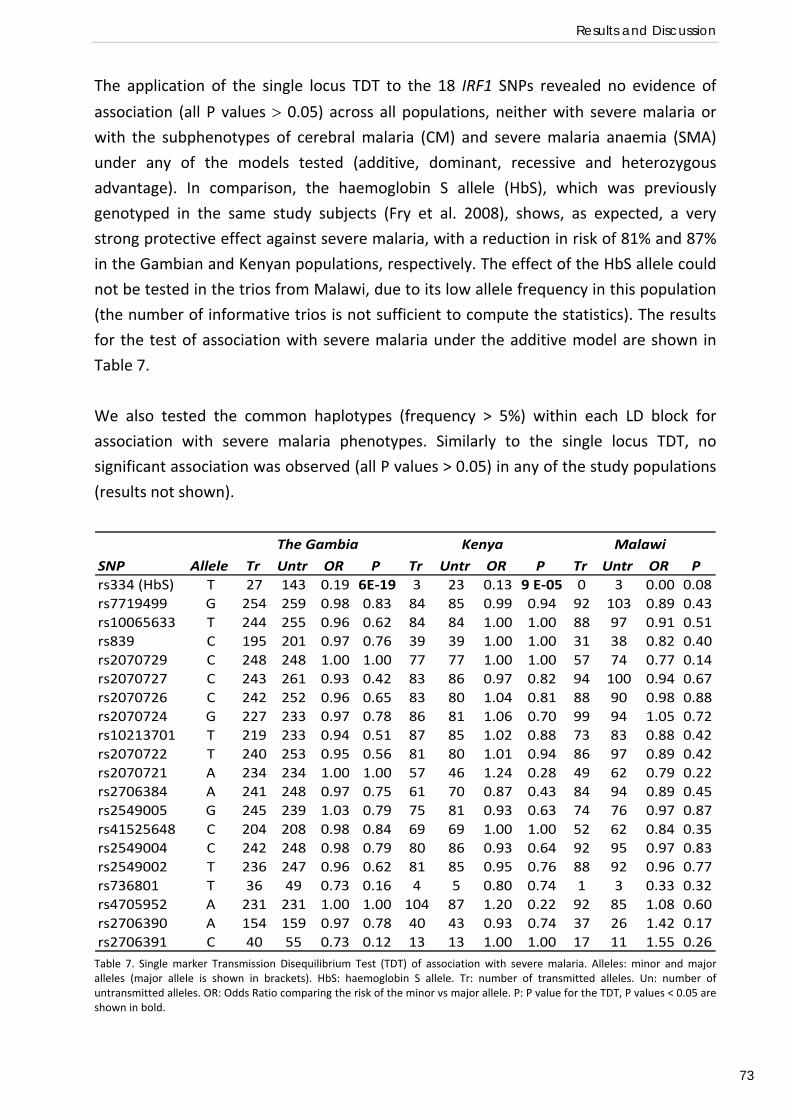
Results and Discussion
73
The application of the single locus TDT to the 18 IRF1 SNPs revealed no evidence of
association (all P values > 0.05) across all populations, neither with severe malaria or
with the subphenotypes of cerebral malaria (CM) and severe malaria anaemia (SMA)
under any of the models tested (additive, dominant, recessive and heterozygous
advantage). In comparison, the haemoglobin S allele (HbS), which was previously
genotyped in the same study subjects (Fry et al. 2008), shows, as expected, a very
strong protective effect against severe malaria, with a reduction in risk of 81% and 87%
in the Gambian and Kenyan populations, respectively. The effect of the HbS allele could
not be tested in the trios from Malawi, due to its low allele frequency in this population
(the number of informative trios is not sufficient to compute the statistics). The results
for the test of association with severe malaria under the additive model are shown in
Table 7.
We also tested the common haplotypes (frequency > 5%) within each LD block for
association with severe malaria phenotypes. Similarly to the single locus TDT, no
significant association was observed (all P values > 0.05) in any of the study populations
(results not shown).
SNP Allele Tr Untr OR P Tr Untr OR P Tr Untr OR Prs334 (HbS) T 27 143 0.19 6E‐19 3 23 0.13 9 E‐05 0 3 0.00 0.08rs7719499 G 254 259 0.98 0.83 84 85 0.99 0.94 92 103 0.89 0.43rs10065633 T 244 255 0.96 0.62 84 84 1.00 1.00 88 97 0.91 0.51rs839 C 195 201 0.97 0.76 39 39 1.00 1.00 31 38 0.82 0.40rs2070729 C 248 248 1.00 1.00 77 77 1.00 1.00 57 74 0.77 0.14rs2070727 C 243 261 0.93 0.42 83 86 0.97 0.82 94 100 0.94 0.67rs2070726 C 242 252 0.96 0.65 83 80 1.04 0.81 88 90 0.98 0.88rs2070724 G 227 233 0.97 0.78 86 81 1.06 0.70 99 94 1.05 0.72rs10213701 T 219 233 0.94 0.51 87 85 1.02 0.88 73 83 0.88 0.42rs2070722 T 240 253 0.95 0.56 81 80 1.01 0.94 86 97 0.89 0.42rs2070721 A 234 234 1.00 1.00 57 46 1.24 0.28 49 62 0.79 0.22rs2706384 A 241 248 0.97 0.75 61 70 0.87 0.43 84 94 0.89 0.45rs2549005 G 245 239 1.03 0.79 75 81 0.93 0.63 74 76 0.97 0.87rs41525648 C 204 208 0.98 0.84 69 69 1.00 1.00 52 62 0.84 0.35rs2549004 C 242 248 0.98 0.79 80 86 0.93 0.64 92 95 0.97 0.83rs2549002 T 236 247 0.96 0.62 81 85 0.95 0.76 88 92 0.96 0.77rs736801 T 36 49 0.73 0.16 4 5 0.80 0.74 1 3 0.33 0.32rs4705952 A 231 231 1.00 1.00 104 87 1.20 0.22 92 85 1.08 0.60rs2706390 A 154 159 0.97 0.78 40 43 0.93 0.74 37 26 1.42 0.17rs2706391 C 40 55 0.73 0.12 13 13 1.00 1.00 17 11 1.55 0.26
The Gambia Kenya Malawi
Table 7. Single marker Transmission Disequilibrium Test (TDT) of association with severe malaria. Alleles: minor and major alleles (major allele is shown in brackets). HbS: haemoglobin S allele. Tr: number of transmitted alleles. Un: number of untransmitted alleles. OR: Odds Ratio comparing the risk of the minor vs major allele. P: P value for the TDT, P values < 0.05 are shown in bold.
Present Investigation
74
‐ Discussion.
In this study we investigated whether IRF1 genetic variation affect susceptibility to
severe disease by performing a family based association test in nuclear trios consisting
of an affected child and his / her two parents from The Gambia, Kenya and Malawi.
We did not observe association between any of the SNPs/haplotypes analysed and
severe malaria phenotypes in any of the three study populations. We cannot, however,
rule out the possibility that a different pattern could be observed in other African
populations as a consequence of a different genetic background. Nor can we exclude
the possibility that the effects of IRF1 SNPs on severe malaria are very modest or affect
only a rare sub‐phenotype of severe malaria. In these settings our study may have
insufficient statistical power.
Nevertheless, our data offer no evidence that the molecular pathways regulated by the
transcription factor IRF‐1 are involved in immune‐based pathogenesis or protection
against life‐threatening disease.
Regulatory determinants of IRF1 gene expression in Yoruba B cell lines (Preliminary
functional study).
Recent genetic association studies suggested a role for IRF‐1 in resistance to viral
infections. An IRF1 haplotype has been shown to protect from Hepatitis C in a Japanese
population, and to modify promoter activity as measured by luciferase reporter assay
(Saito et al. 2001). The authors suggested that this haplotype could affect the secondary
structure of the promoter region, and therefore its affinity for transcription factors. IRF1
transcriptional regulation is potentially critical given the short half‐life of the IRF‐1
protein (Kroger et al. 2002). Actually it has been reported that this variant correlates
with IFN‐γ and IL‐10 levels produced by PBMCs, as well as with the percentage of Th1
CD4+ cells in patients with chronic Hepatitis C (Saito et al.2002).
IRF1 polymorphisms have also been found to be associated with resistance to HIV‐
infection in a sample of Kenyan sex‐workers. PBMCs isolated from subjects with
protective genotypes showed a reduced expression of the gene, both before and after
IFN‐γ stimulation, as measured by Western Blot analysis (Ball et al. 2007).
These observations provide possible functional explanations for our association findings,
nevertheless none of these studies could identify the true causative polymorphism/s. In
the present study, we will use allelic imbalance methods in the effort of identifying cis‐
regulators of IRF1 gene expression.
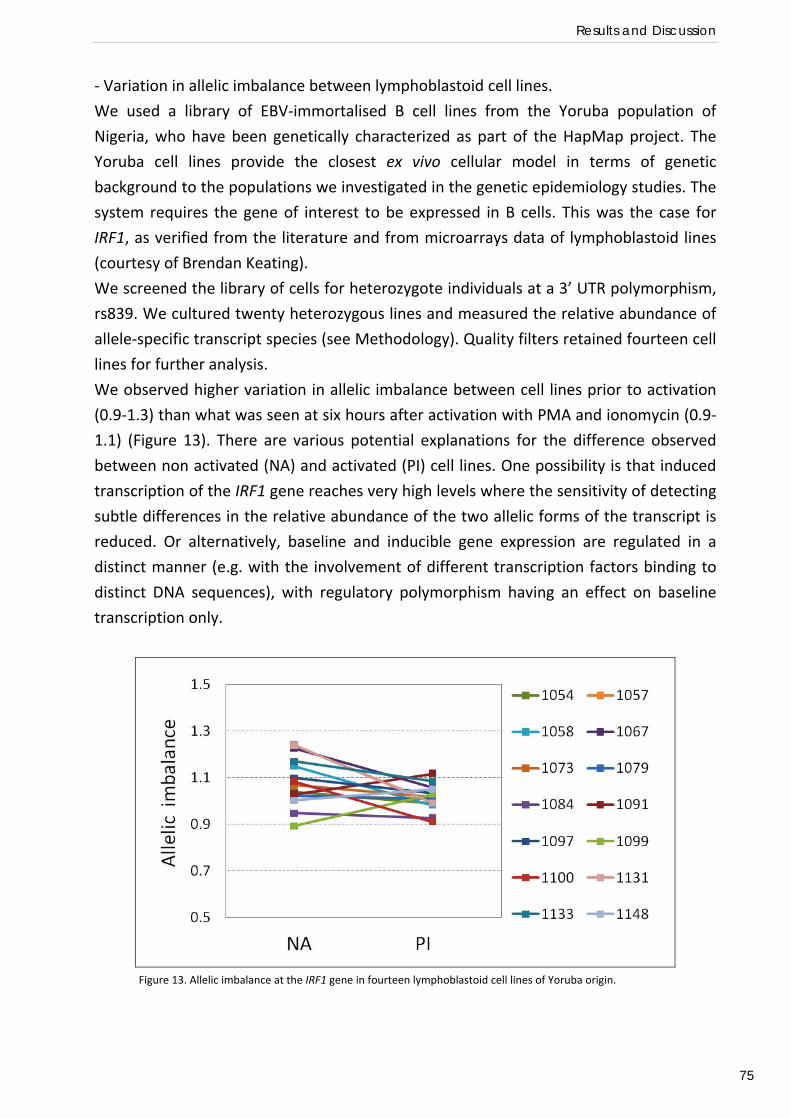
Results and Discussion
75
‐ Variation in allelic imbalance between lymphoblastoid cell lines.
We used a library of EBV‐immortalised B cell lines from the Yoruba population of
Nigeria, who have been genetically characterized as part of the HapMap project. The
Yoruba cell lines provide the closest ex vivo cellular model in terms of genetic
background to the populations we investigated in the genetic epidemiology studies. The
system requires the gene of interest to be expressed in B cells. This was the case for
IRF1, as verified from the literature and from microarrays data of lymphoblastoid lines
(courtesy of Brendan Keating).
We screened the library of cells for heterozygote individuals at a 3’ UTR polymorphism,
rs839. We cultured twenty heterozygous lines and measured the relative abundance of
allele‐specific transcript species (see Methodology). Quality filters retained fourteen cell
lines for further analysis.
We observed higher variation in allelic imbalance between cell lines prior to activation
(0.9‐1.3) than what was seen at six hours after activation with PMA and ionomycin (0.9‐
1.1) (Figure 13). There are various potential explanations for the difference observed
between non activated (NA) and activated (PI) cell lines. One possibility is that induced
transcription of the IRF1 gene reaches very high levels where the sensitivity of detecting
subtle differences in the relative abundance of the two allelic forms of the transcript is
reduced. Or alternatively, baseline and inducible gene expression are regulated in a
distinct manner (e.g. with the involvement of different transcription factors binding to
distinct DNA sequences), with regulatory polymorphism having an effect on baseline
transcription only.
Figure 13. Allelic imbalance at the IRF1 gene in fourteen lymphoblastoid cell lines of Yoruba origin.
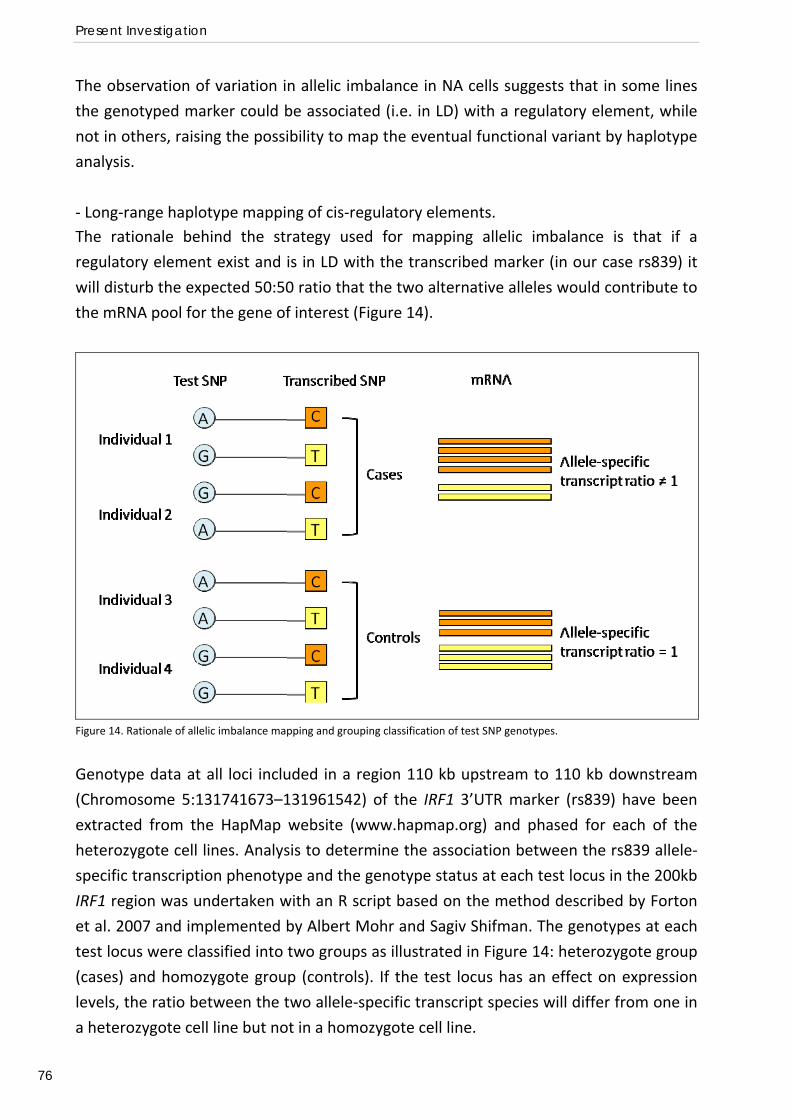
Present Investigation
76
The observation of variation in allelic imbalance in NA cells suggests that in some lines
the genotyped marker could be associated (i.e. in LD) with a regulatory element, while
not in others, raising the possibility to map the eventual functional variant by haplotype
analysis.
‐ Long‐range haplotype mapping of cis‐regulatory elements. The rationale behind the strategy used for mapping allelic imbalance is that if a
regulatory element exist and is in LD with the transcribed marker (in our case rs839) it
will disturb the expected 50:50 ratio that the two alternative alleles would contribute to
the mRNA pool for the gene of interest (Figure 14).
Figure 14. Rationale of allelic imbalance mapping and grouping classification of test SNP genotypes.
Genotype data at all loci included in a region 110 kb upstream to 110 kb downstream
(Chromosome 5:131741673–131961542) of the IRF1 3’UTR marker (rs839) have been
extracted from the HapMap website (www.hapmap.org) and phased for each of the
heterozygote cell lines. Analysis to determine the association between the rs839 allele‐
specific transcription phenotype and the genotype status at each test locus in the 200kb
IRF1 region was undertaken with an R script based on the method described by Forton
et al. 2007 and implemented by Albert Mohr and Sagiv Shifman. The genotypes at each
test locus were classified into two groups as illustrated in Figure 14: heterozygote group
(cases) and homozygote group (controls). If the test locus has an effect on expression
levels, the ratio between the two allele‐specific transcript species will differ from one in
a heterozygote cell line but not in a homozygote cell line.
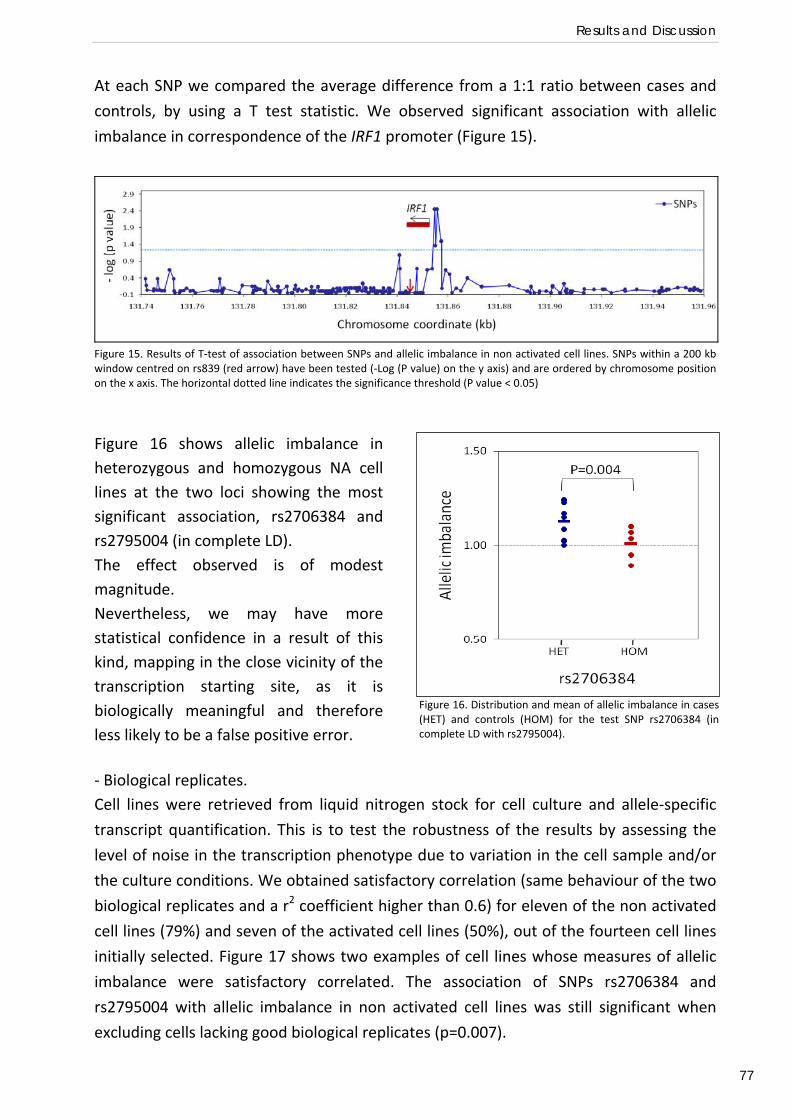
Results and Discussion
77
At each SNP we compared the average difference from a 1:1 ratio between cases and
controls, by using a T test statistic. We observed significant association with allelic
imbalance in correspondence of the IRF1 promoter (Figure 15).
Figure 15. Results of T‐test of association between SNPs and allelic imbalance in non activated cell lines. SNPs within a 200 kb window centred on rs839 (red arrow) have been tested (‐Log (P value) on the y axis) and are ordered by chromosome position on the x axis. The horizontal dotted line indicates the significance threshold (P value < 0.05)
‐ Biological replicates. Cell lines were retrieved from liquid nitrogen stock for cell culture and allele‐specific
transcript quantification. This is to test the robustness of the results by assessing the
level of noise in the transcription phenotype due to variation in the cell sample and/or
the culture conditions. We obtained satisfactory correlation (same behaviour of the two
biological replicates and a r2 coefficient higher than 0.6) for eleven of the non activated
cell lines (79%) and seven of the activated cell lines (50%), out of the fourteen cell lines
initially selected. Figure 17 shows two examples of cell lines whose measures of allelic
imbalance were satisfactory correlated. The association of SNPs rs2706384 and
rs2795004 with allelic imbalance in non activated cell lines was still significant when
excluding cells lacking good biological replicates (p=0.007).
Figure 16. Distribution and mean of allelic imbalance in cases(HET) and controls (HOM) for the test SNP rs2706384 (incomplete LD with rs2795004).
Figure 16 shows allelic imbalance in heterozygous and homozygous NA cell lines at the two loci showing the most significant association, rs2706384 and rs2795004 (in complete LD). The effect observed is of modest magnitude. Nevertheless, we may have more statistical confidence in a result of this kind, mapping in the close vicinity of the transcription starting site, as it is biologically meaningful and therefore less likely to be a false positive error.
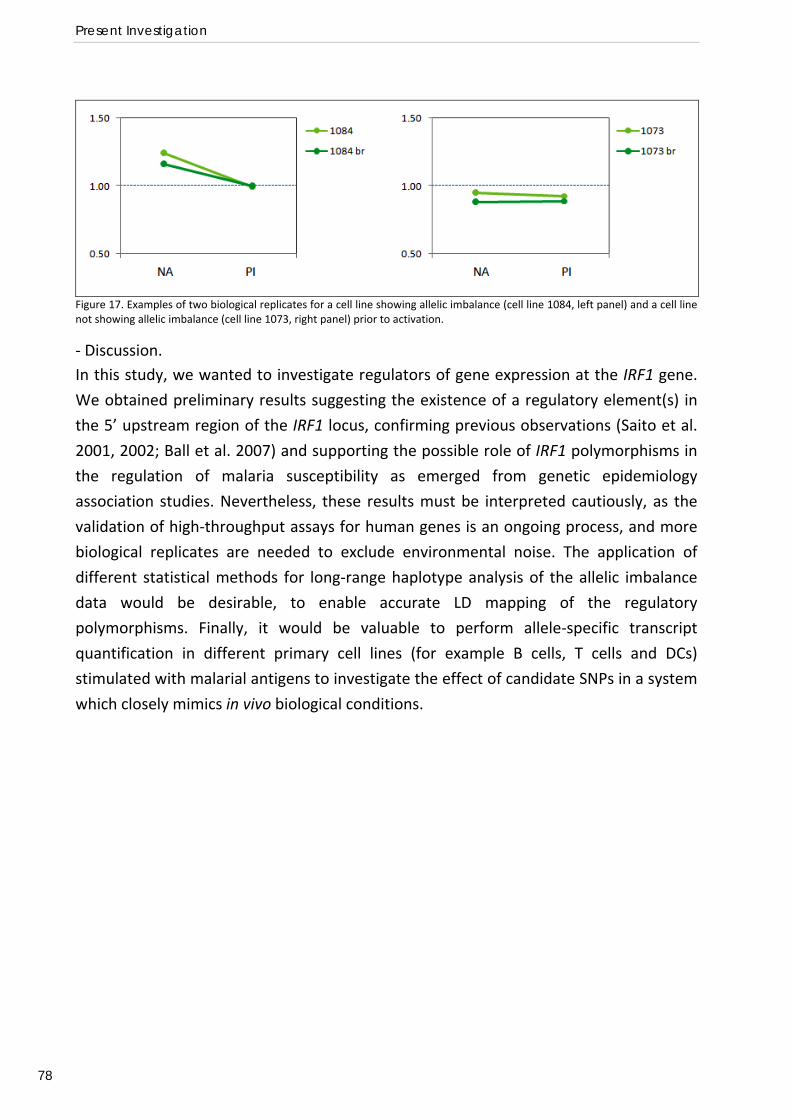
Present Investigation
78
Figure 17. Examples of two biological replicates for a cell line showing allelic imbalance (cell line 1084, left panel) and a cell line not showing allelic imbalance (cell line 1073, right panel) prior to activation.
‐ Discussion. In this study, we wanted to investigate regulators of gene expression at the IRF1 gene.
We obtained preliminary results suggesting the existence of a regulatory element(s) in
the 5’ upstream region of the IRF1 locus, confirming previous observations (Saito et al.
2001, 2002; Ball et al. 2007) and supporting the possible role of IRF1 polymorphisms in
the regulation of malaria susceptibility as emerged from genetic epidemiology
association studies. Nevertheless, these results must be interpreted cautiously, as the
validation of high‐throughput assays for human genes is an ongoing process, and more
biological replicates are needed to exclude environmental noise. The application of
different statistical methods for long‐range haplotype analysis of the allelic imbalance
data would be desirable, to enable accurate LD mapping of the regulatory
polymorphisms. Finally, it would be valuable to perform allele‐specific transcript
quantification in different primary cell lines (for example B cells, T cells and DCs)
stimulated with malarial antigens to investigate the effect of candidate SNPs in a system
which closely mimics in vivo biological conditions.
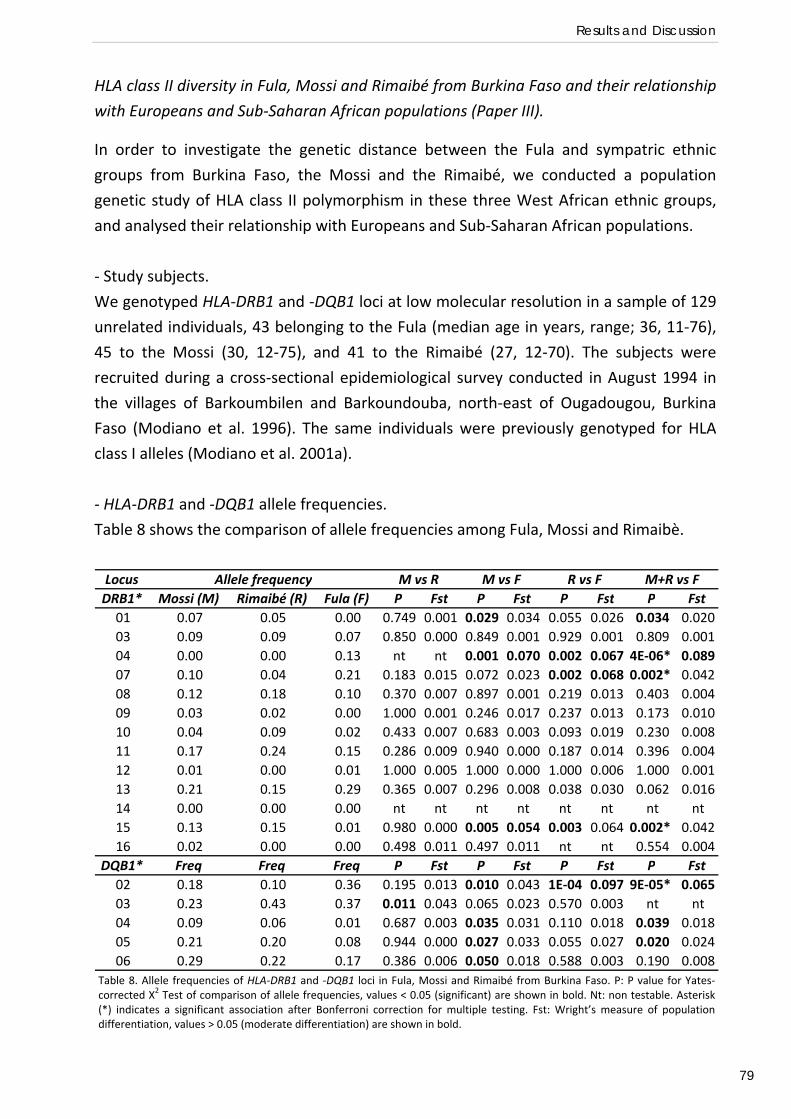
Results and Discussion
79
HLA class II diversity in Fula, Mossi and Rimaibé from Burkina Faso and their relationship
with Europeans and Sub‐Saharan African populations (Paper III).
In order to investigate the genetic distance between the Fula and sympatric ethnic
groups from Burkina Faso, the Mossi and the Rimaibé, we conducted a population
genetic study of HLA class II polymorphism in these three West African ethnic groups,
and analysed their relationship with Europeans and Sub‐Saharan African populations.
‐ Study subjects.
We genotyped HLA‐DRB1 and ‐DQB1 loci at low molecular resolution in a sample of 129
unrelated individuals, 43 belonging to the Fula (median age in years, range; 36, 11‐76),
45 to the Mossi (30, 12‐75), and 41 to the Rimaibé (27, 12‐70). The subjects were
recruited during a cross‐sectional epidemiological survey conducted in August 1994 in
the villages of Barkoumbilen and Barkoundouba, north‐east of Ougadougou, Burkina
Faso (Modiano et al. 1996). The same individuals were previously genotyped for HLA
class I alleles (Modiano et al. 2001a).
‐ HLA‐DRB1 and ‐DQB1 allele frequencies.
Table 8 shows the comparison of allele frequencies among Fula, Mossi and Rimaibè.
LocusDRB1* Mossi (M) Rimaibé (R) Fula (F) P Fst P Fst P Fst P Fst01 0.07 0.05 0.00 0.749 0.001 0.029 0.034 0.055 0.026 0.034 0.02003 0.09 0.09 0.07 0.850 0.000 0.849 0.001 0.929 0.001 0.809 0.00104 0.00 0.00 0.13 nt nt 0.001 0.070 0.002 0.067 4E‐06* 0.08907 0.10 0.04 0.21 0.183 0.015 0.072 0.023 0.002 0.068 0.002* 0.04208 0.12 0.18 0.10 0.370 0.007 0.897 0.001 0.219 0.013 0.403 0.00409 0.03 0.02 0.00 1.000 0.001 0.246 0.017 0.237 0.013 0.173 0.01010 0.04 0.09 0.02 0.433 0.007 0.683 0.003 0.093 0.019 0.230 0.00811 0.17 0.24 0.15 0.286 0.009 0.940 0.000 0.187 0.014 0.396 0.00412 0.01 0.00 0.01 1.000 0.005 1.000 0.000 1.000 0.006 1.000 0.00113 0.21 0.15 0.29 0.365 0.007 0.296 0.008 0.038 0.030 0.062 0.01614 0.00 0.00 0.00 nt nt nt nt nt nt nt nt15 0.13 0.15 0.01 0.980 0.000 0.005 0.054 0.003 0.064 0.002* 0.04216 0.02 0.00 0.00 0.498 0.011 0.497 0.011 nt nt 0.554 0.004
DQB1* Freq Freq Freq P Fst P Fst P Fst P Fst02 0.18 0.10 0.36 0.195 0.013 0.010 0.043 1E‐04 0.097 9E‐05* 0.06503 0.23 0.43 0.37 0.011 0.043 0.065 0.023 0.570 0.003 nt nt04 0.09 0.06 0.01 0.687 0.003 0.035 0.031 0.110 0.018 0.039 0.01805 0.21 0.20 0.08 0.944 0.000 0.027 0.033 0.055 0.027 0.020 0.02406 0.29 0.22 0.17 0.386 0.006 0.050 0.018 0.588 0.003 0.190 0.008
M+R vs FAllele frequency M vs R M vs F R vs F
Table 8. Allele frequencies of HLA‐DRB1 and ‐DQB1 loci in Fula, Mossi and Rimaibé from Burkina Faso. P: P value for Yates‐corrected Χ2 Test of comparison of allele frequencies, values < 0.05 (significant) are shown in bold. Nt: non testable. Asterisk(*) indicates a significant association after Bonferroni correction for multiple testing. Fst: Wright’s measure of populationdifferentiation, values > 0.05 (moderate differentiation) are shown in bold.
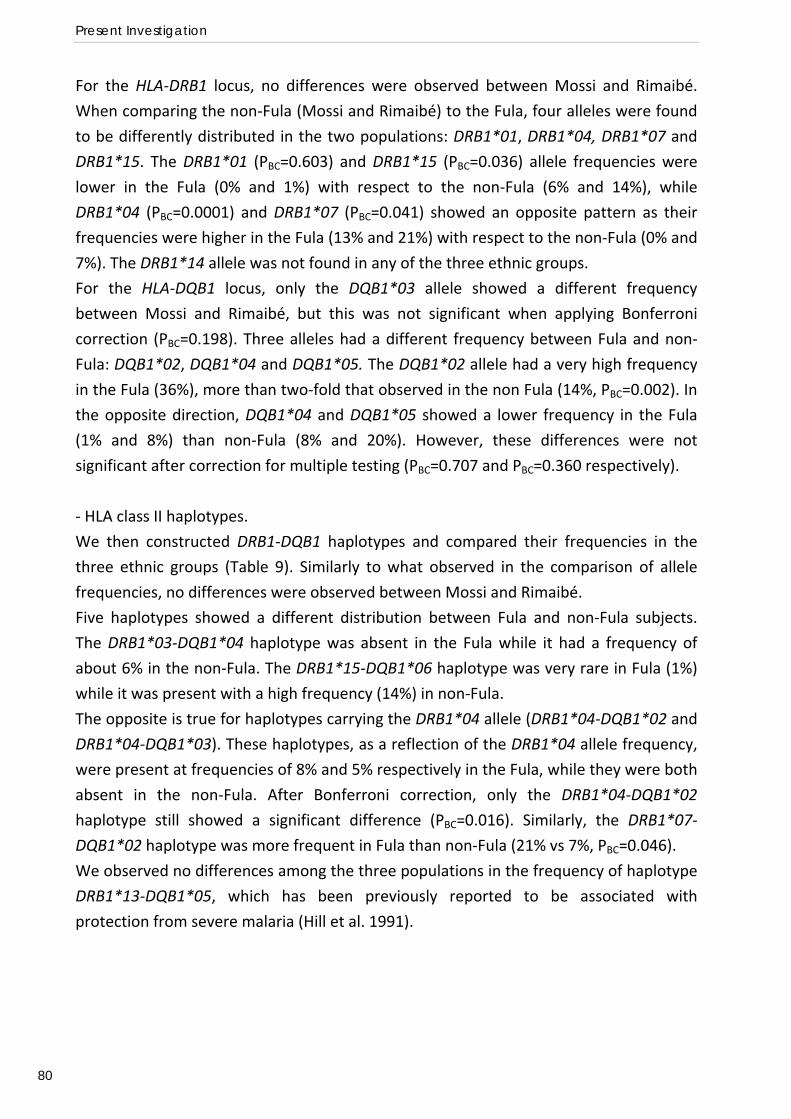
Present Investigation
80
For the HLA‐DRB1 locus, no differences were observed between Mossi and Rimaibé.
When comparing the non‐Fula (Mossi and Rimaibé) to the Fula, four alleles were found
to be differently distributed in the two populations: DRB1*01, DRB1*04, DRB1*07 and
DRB1*15. The DRB1*01 (PBC=0.603) and DRB1*15 (PBC=0.036) allele frequencies were
lower in the Fula (0% and 1%) with respect to the non‐Fula (6% and 14%), while
DRB1*04 (PBC=0.0001) and DRB1*07 (PBC=0.041) showed an opposite pattern as their
frequencies were higher in the Fula (13% and 21%) with respect to the non‐Fula (0% and
7%). The DRB1*14 allele was not found in any of the three ethnic groups.
For the HLA‐DQB1 locus, only the DQB1*03 allele showed a different frequency
between Mossi and Rimaibé, but this was not significant when applying Bonferroni
correction (PBC=0.198). Three alleles had a different frequency between Fula and non‐
Fula: DQB1*02, DQB1*04 and DQB1*05. The DQB1*02 allele had a very high frequency
in the Fula (36%), more than two‐fold that observed in the non Fula (14%, PBC=0.002). In
the opposite direction, DQB1*04 and DQB1*05 showed a lower frequency in the Fula
(1% and 8%) than non‐Fula (8% and 20%). However, these differences were not
significant after correction for multiple testing (PBC=0.707 and PBC=0.360 respectively).
‐ HLA class II haplotypes.
We then constructed DRB1‐DQB1 haplotypes and compared their frequencies in the
three ethnic groups (Table 9). Similarly to what observed in the comparison of allele
frequencies, no differences were observed between Mossi and Rimaibé.
Five haplotypes showed a different distribution between Fula and non‐Fula subjects.
The DRB1*03‐DQB1*04 haplotype was absent in the Fula while it had a frequency of
about 6% in the non‐Fula. The DRB1*15‐DQB1*06 haplotype was very rare in Fula (1%)
while it was present with a high frequency (14%) in non‐Fula.
The opposite is true for haplotypes carrying the DRB1*04 allele (DRB1*04‐DQB1*02 and
DRB1*04‐DQB1*03). These haplotypes, as a reflection of the DRB1*04 allele frequency,
were present at frequencies of 8% and 5% respectively in the Fula, while they were both
absent in the non‐Fula. After Bonferroni correction, only the DRB1*04‐DQB1*02
haplotype still showed a significant difference (PBC=0.016). Similarly, the DRB1*07‐
DQB1*02 haplotype was more frequent in Fula than non‐Fula (21% vs 7%, PBC=0.046).
We observed no differences among the three populations in the frequency of haplotype
DRB1*13‐DQB1*05, which has been previously reported to be associated with
protection from severe malaria (Hill et al. 1991).
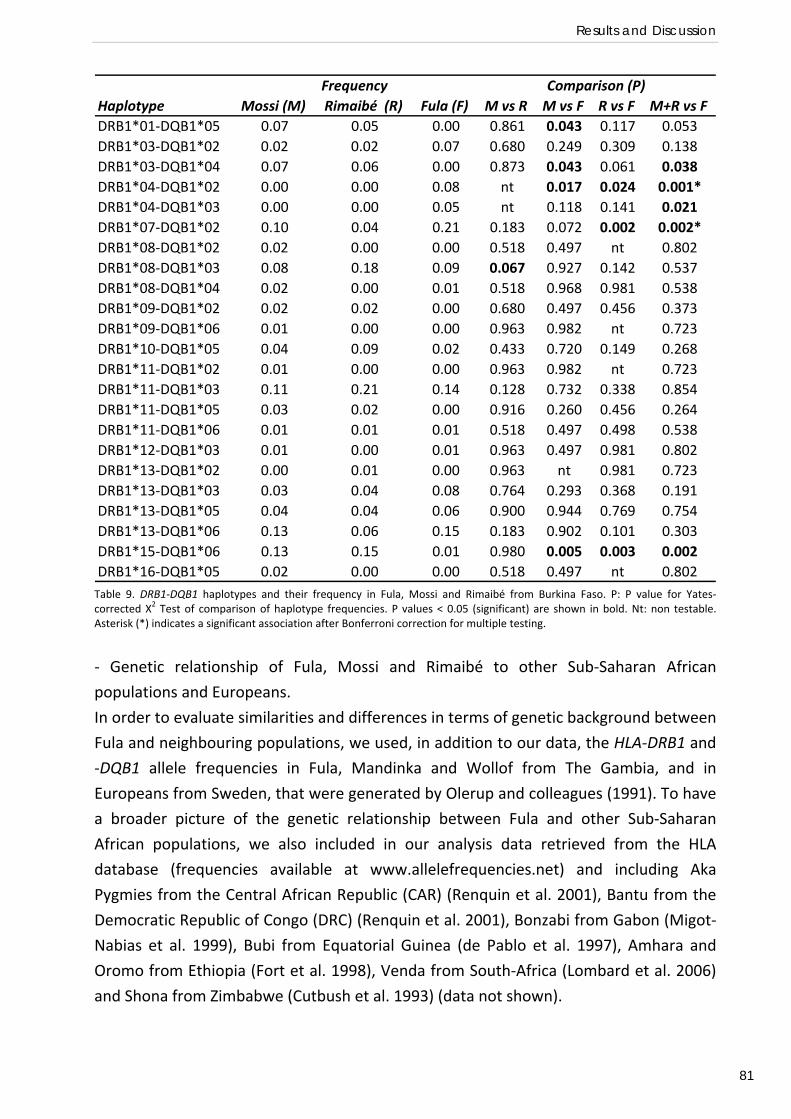
Results and Discussion
81
Haplotype Mossi (M) Rimaibé (R) Fula (F) M vs R M vs F R vs F M+R vs FDRB1*01‐DQB1*05 0.07 0.05 0.00 0.861 0.043 0.117 0.053DRB1*03‐DQB1*02 0.02 0.02 0.07 0.680 0.249 0.309 0.138DRB1*03‐DQB1*04 0.07 0.06 0.00 0.873 0.043 0.061 0.038DRB1*04‐DQB1*02 0.00 0.00 0.08 nt 0.017 0.024 0.001*DRB1*04‐DQB1*03 0.00 0.00 0.05 nt 0.118 0.141 0.021DRB1*07‐DQB1*02 0.10 0.04 0.21 0.183 0.072 0.002 0.002*DRB1*08‐DQB1*02 0.02 0.00 0.00 0.518 0.497 nt 0.802DRB1*08‐DQB1*03 0.08 0.18 0.09 0.067 0.927 0.142 0.537DRB1*08‐DQB1*04 0.02 0.00 0.01 0.518 0.968 0.981 0.538DRB1*09‐DQB1*02 0.02 0.02 0.00 0.680 0.497 0.456 0.373DRB1*09‐DQB1*06 0.01 0.00 0.00 0.963 0.982 nt 0.723DRB1*10‐DQB1*05 0.04 0.09 0.02 0.433 0.720 0.149 0.268DRB1*11‐DQB1*02 0.01 0.00 0.00 0.963 0.982 nt 0.723DRB1*11‐DQB1*03 0.11 0.21 0.14 0.128 0.732 0.338 0.854DRB1*11‐DQB1*05 0.03 0.02 0.00 0.916 0.260 0.456 0.264DRB1*11‐DQB1*06 0.01 0.01 0.01 0.518 0.497 0.498 0.538DRB1*12‐DQB1*03 0.01 0.00 0.01 0.963 0.497 0.981 0.802DRB1*13‐DQB1*02 0.00 0.01 0.00 0.963 nt 0.981 0.723DRB1*13‐DQB1*03 0.03 0.04 0.08 0.764 0.293 0.368 0.191DRB1*13‐DQB1*05 0.04 0.04 0.06 0.900 0.944 0.769 0.754DRB1*13‐DQB1*06 0.13 0.06 0.15 0.183 0.902 0.101 0.303DRB1*15‐DQB1*06 0.13 0.15 0.01 0.980 0.005 0.003 0.002DRB1*16‐DQB1*05 0.02 0.00 0.00 0.518 0.497 nt 0.802
Frequency Comparison (P)
Table 9. DRB1‐DQB1 haplotypes and their frequency in Fula, Mossi and Rimaibé from Burkina Faso. P: P value for Yates‐corrected Χ2 Test of comparison of haplotype frequencies. P values < 0.05 (significant) are shown in bold. Nt: non testable. Asterisk (*) indicates a significant association after Bonferroni correction for multiple testing.
‐ Genetic relationship of Fula, Mossi and Rimaibé to other Sub‐Saharan African
populations and Europeans.
In order to evaluate similarities and differences in terms of genetic background between
Fula and neighbouring populations, we used, in addition to our data, the HLA‐DRB1 and
‐DQB1 allele frequencies in Fula, Mandinka and Wollof from The Gambia, and in
Europeans from Sweden, that were generated by Olerup and colleagues (1991). To have
a broader picture of the genetic relationship between Fula and other Sub‐Saharan
African populations, we also included in our analysis data retrieved from the HLA
database (frequencies available at www.allelefrequencies.net) and including Aka
Pygmies from the Central African Republic (CAR) (Renquin et al. 2001), Bantu from the
Democratic Republic of Congo (DRC) (Renquin et al. 2001), Bonzabi from Gabon (Migot‐
Nabias et al. 1999), Bubi from Equatorial Guinea (de Pablo et al. 1997), Amhara and
Oromo from Ethiopia (Fort et al. 1998), Venda from South‐Africa (Lombard et al. 2006)
and Shona from Zimbabwe (Cutbush et al. 1993) (data not shown).
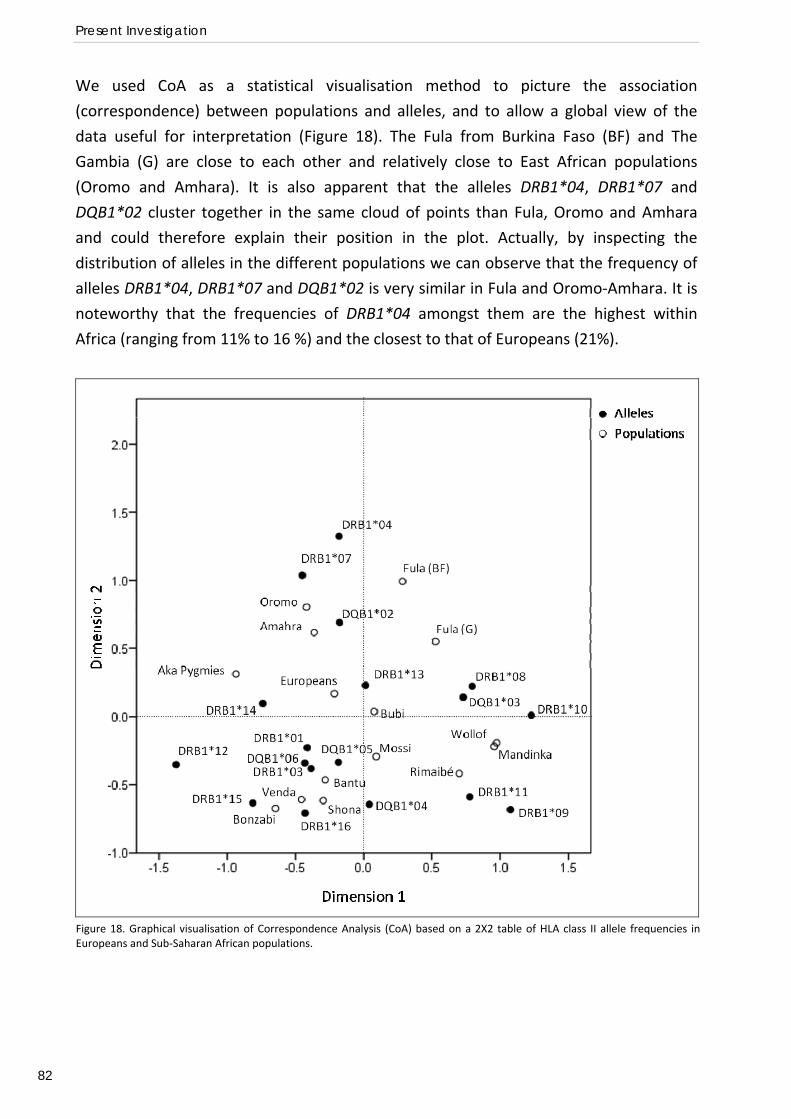
Present Investigation
82
We used CoA as a statistical visualisation method to picture the association
(correspondence) between populations and alleles, and to allow a global view of the
data useful for interpretation (Figure 18). The Fula from Burkina Faso (BF) and The
Gambia (G) are close to each other and relatively close to East African populations
(Oromo and Amhara). It is also apparent that the alleles DRB1*04, DRB1*07 and
DQB1*02 cluster together in the same cloud of points than Fula, Oromo and Amhara
and could therefore explain their position in the plot. Actually, by inspecting the
distribution of alleles in the different populations we can observe that the frequency of
alleles DRB1*04, DRB1*07 and DQB1*02 is very similar in Fula and Oromo‐Amhara. It is
noteworthy that the frequencies of DRB1*04 amongst them are the highest within
Africa (ranging from 11% to 16 %) and the closest to that of Europeans (21%).
Figure 18. Graphical visualisation of Correspondence Analysis (CoA) based on a 2X2 table of HLA class II allele frequencies inEuropeans and Sub‐Saharan African populations.
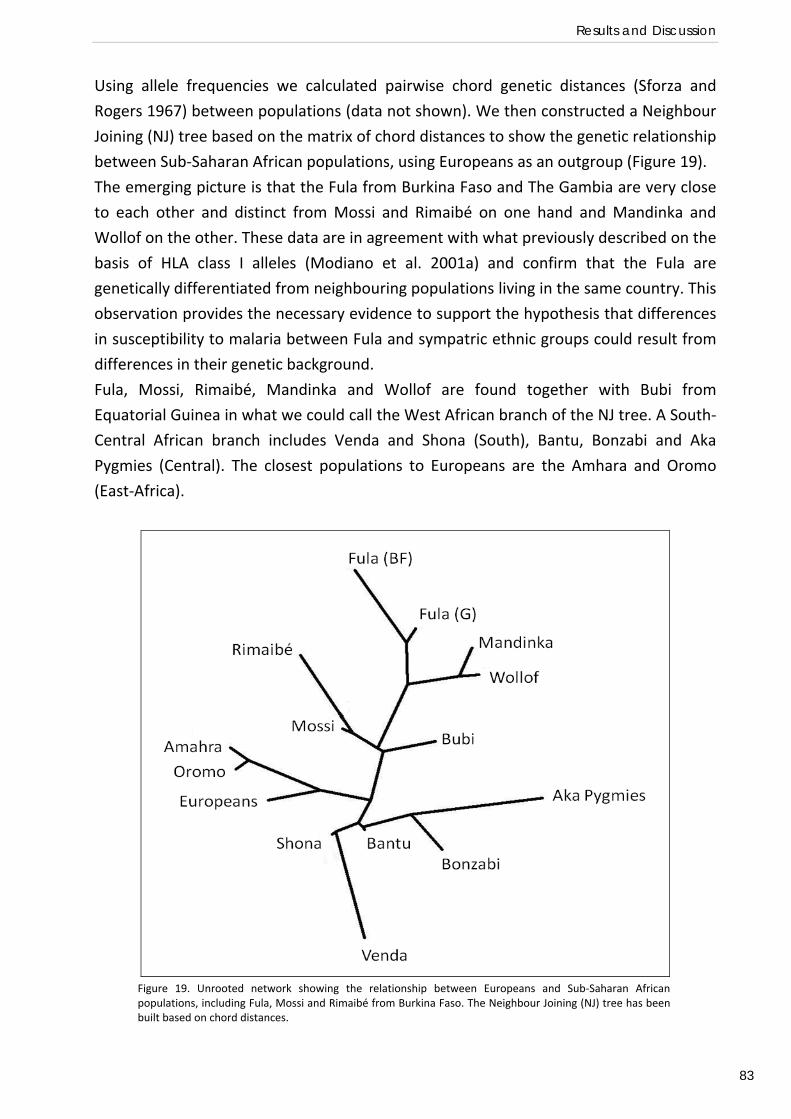
Results and Discussion
83
Using allele frequencies we calculated pairwise chord genetic distances (Sforza and
Rogers 1967) between populations (data not shown). We then constructed a Neighbour
Joining (NJ) tree based on the matrix of chord distances to show the genetic relationship
between Sub‐Saharan African populations, using Europeans as an outgroup (Figure 19).
The emerging picture is that the Fula from Burkina Faso and The Gambia are very close
to each other and distinct from Mossi and Rimaibé on one hand and Mandinka and
Wollof on the other. These data are in agreement with what previously described on the
basis of HLA class I alleles (Modiano et al. 2001a) and confirm that the Fula are
genetically differentiated from neighbouring populations living in the same country. This
observation provides the necessary evidence to support the hypothesis that differences
in susceptibility to malaria between Fula and sympatric ethnic groups could result from
differences in their genetic background.
Fula, Mossi, Rimaibé, Mandinka and Wollof are found together with Bubi from
Equatorial Guinea in what we could call the West African branch of the NJ tree. A South‐
Central African branch includes Venda and Shona (South), Bantu, Bonzabi and Aka
Pygmies (Central). The closest populations to Europeans are the Amhara and Oromo
(East‐Africa).
Figure 19. Unrooted network showing the relationship between Europeans and Sub‐Saharan Africanpopulations, including Fula, Mossi and Rimaibé from Burkina Faso. The Neighbour Joining (NJ) tree has beenbuilt based on chord distances.
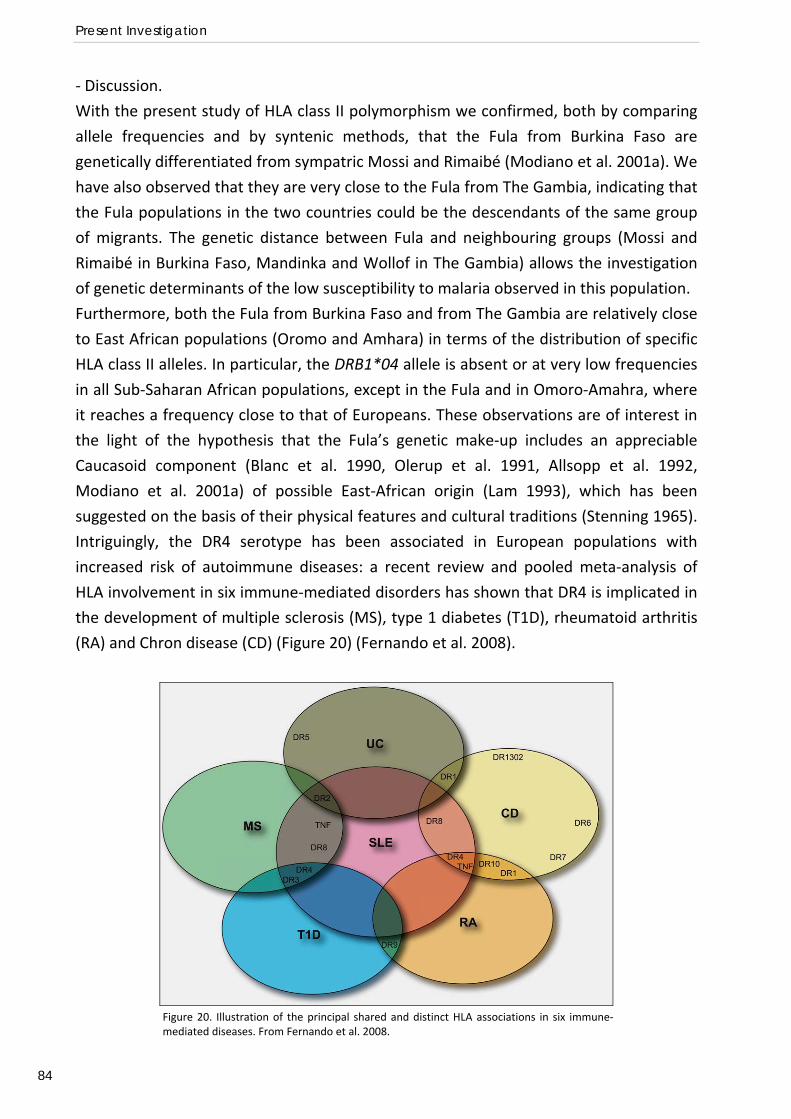
Present Investigation
84
‐ Discussion.
With the present study of HLA class II polymorphism we confirmed, both by comparing
allele frequencies and by syntenic methods, that the Fula from Burkina Faso are
genetically differentiated from sympatric Mossi and Rimaibé (Modiano et al. 2001a). We
have also observed that they are very close to the Fula from The Gambia, indicating that
the Fula populations in the two countries could be the descendants of the same group
of migrants. The genetic distance between Fula and neighbouring groups (Mossi and
Rimaibé in Burkina Faso, Mandinka and Wollof in The Gambia) allows the investigation
of genetic determinants of the low susceptibility to malaria observed in this population.
Furthermore, both the Fula from Burkina Faso and from The Gambia are relatively close
to East African populations (Oromo and Amhara) in terms of the distribution of specific
HLA class II alleles. In particular, the DRB1*04 allele is absent or at very low frequencies
in all Sub‐Saharan African populations, except in the Fula and in Omoro‐Amahra, where
it reaches a frequency close to that of Europeans. These observations are of interest in
the light of the hypothesis that the Fula’s genetic make‐up includes an appreciable
Caucasoid component (Blanc et al. 1990, Olerup et al. 1991, Allsopp et al. 1992,
Modiano et al. 2001a) of possible East‐African origin (Lam 1993), which has been
suggested on the basis of their physical features and cultural traditions (Stenning 1965).
Intriguingly, the DR4 serotype has been associated in European populations with
increased risk of autoimmune diseases: a recent review and pooled meta‐analysis of
HLA involvement in six immune‐mediated disorders has shown that DR4 is implicated in
the development of multiple sclerosis (MS), type 1 diabetes (T1D), rheumatoid arthritis
(RA) and Chron disease (CD) (Figure 20) (Fernando et al. 2008).
Figure 20. Illustration of the principal shared and distinct HLA associations in six immune‐mediated diseases. From Fernando et al. 2008.
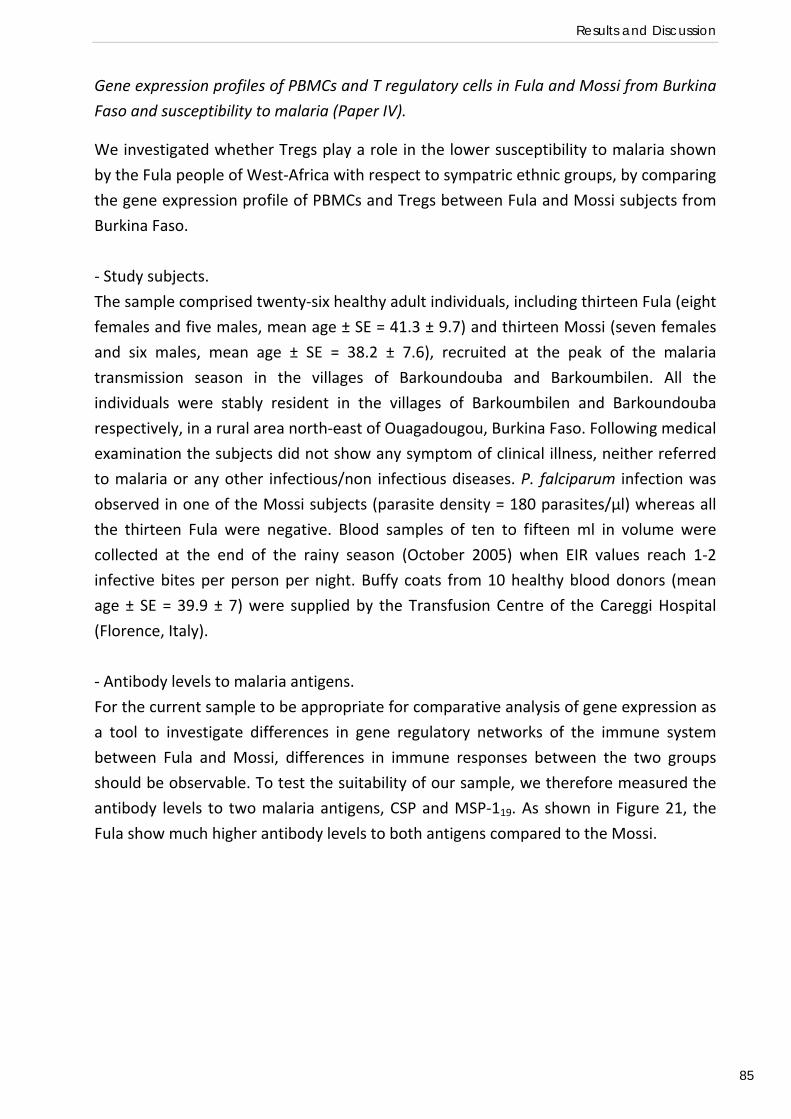
Results and Discussion
85
Gene expression profiles of PBMCs and T regulatory cells in Fula and Mossi from Burkina
Faso and susceptibility to malaria (Paper IV).
We investigated whether Tregs play a role in the lower susceptibility to malaria shown
by the Fula people of West‐Africa with respect to sympatric ethnic groups, by comparing
the gene expression profile of PBMCs and Tregs between Fula and Mossi subjects from
Burkina Faso.
‐ Study subjects.
The sample comprised twenty‐six healthy adult individuals, including thirteen Fula (eight
females and five males, mean age ± SE = 41.3 ± 9.7) and thirteen Mossi (seven females
and six males, mean age ± SE = 38.2 ± 7.6), recruited at the peak of the malaria
transmission season in the villages of Barkoundouba and Barkoumbilen. All the
individuals were stably resident in the villages of Barkoumbilen and Barkoundouba
respectively, in a rural area north‐east of Ouagadougou, Burkina Faso. Following medical
examination the subjects did not show any symptom of clinical illness, neither referred
to malaria or any other infectious/non infectious diseases. P. falciparum infection was
observed in one of the Mossi subjects (parasite density = 180 parasites/µl) whereas all
the thirteen Fula were negative. Blood samples of ten to fifteen ml in volume were
collected at the end of the rainy season (October 2005) when EIR values reach 1‐2
infective bites per person per night. Buffy coats from 10 healthy blood donors (mean
age ± SE = 39.9 ± 7) were supplied by the Transfusion Centre of the Careggi Hospital
(Florence, Italy).
‐ Antibody levels to malaria antigens.
For the current sample to be appropriate for comparative analysis of gene expression as
a tool to investigate differences in gene regulatory networks of the immune system
between Fula and Mossi, differences in immune responses between the two groups
should be observable. To test the suitability of our sample, we therefore measured the
antibody levels to two malaria antigens, CSP and MSP‐119. As shown in Figure 21, the
Fula show much higher antibody levels to both antigens compared to the Mossi.
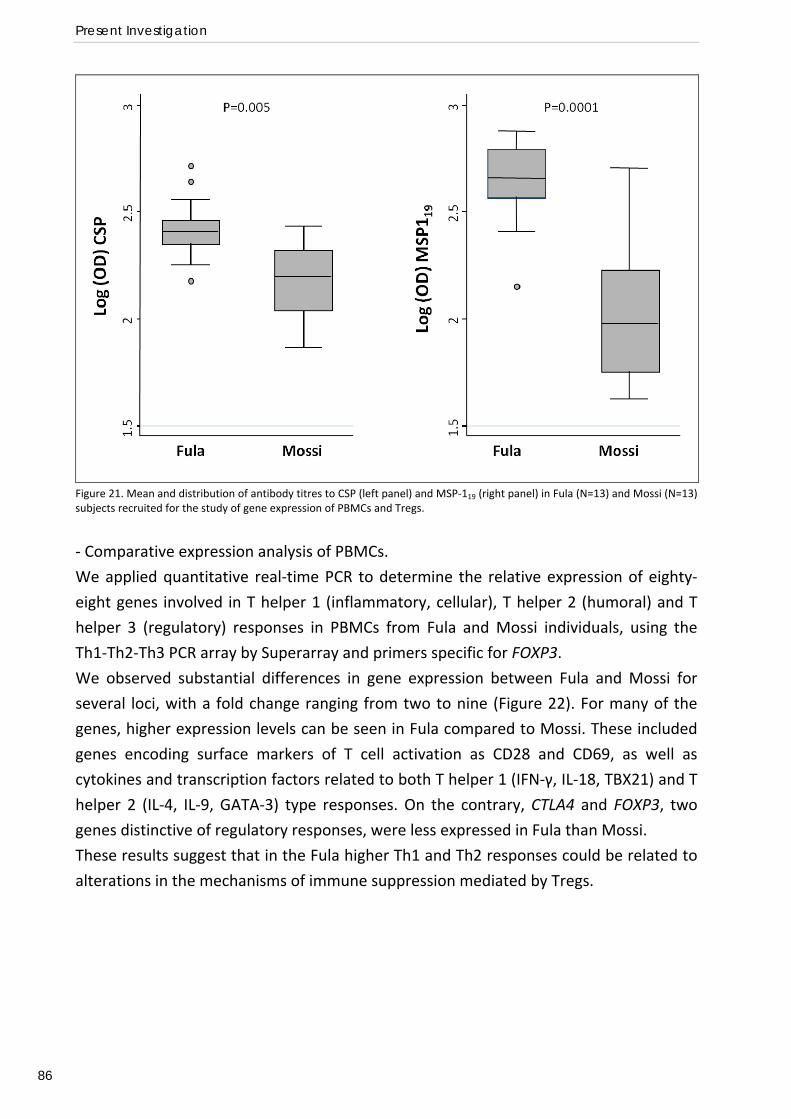
Present Investigation
86
Figure 21. Mean and distribution of antibody titres to CSP (left panel) and MSP‐119 (right panel) in Fula (N=13) and Mossi (N=13) subjects recruited for the study of gene expression of PBMCs and Tregs.
‐ Comparative expression analysis of PBMCs.
We applied quantitative real‐time PCR to determine the relative expression of eighty‐
eight genes involved in T helper 1 (inflammatory, cellular), T helper 2 (humoral) and T
helper 3 (regulatory) responses in PBMCs from Fula and Mossi individuals, using the
Th1‐Th2‐Th3 PCR array by Superarray and primers specific for FOXP3.
We observed substantial differences in gene expression between Fula and Mossi for
several loci, with a fold change ranging from two to nine (Figure 22). For many of the
genes, higher expression levels can be seen in Fula compared to Mossi. These included
genes encoding surface markers of T cell activation as CD28 and CD69, as well as
cytokines and transcription factors related to both T helper 1 (IFN‐γ, IL‐18, TBX21) and T
helper 2 (IL‐4, IL‐9, GATA‐3) type responses. On the contrary, CTLA4 and FOXP3, two
genes distinctive of regulatory responses, were less expressed in Fula than Mossi.
These results suggest that in the Fula higher Th1 and Th2 responses could be related to
alterations in the mechanisms of immune suppression mediated by Tregs.
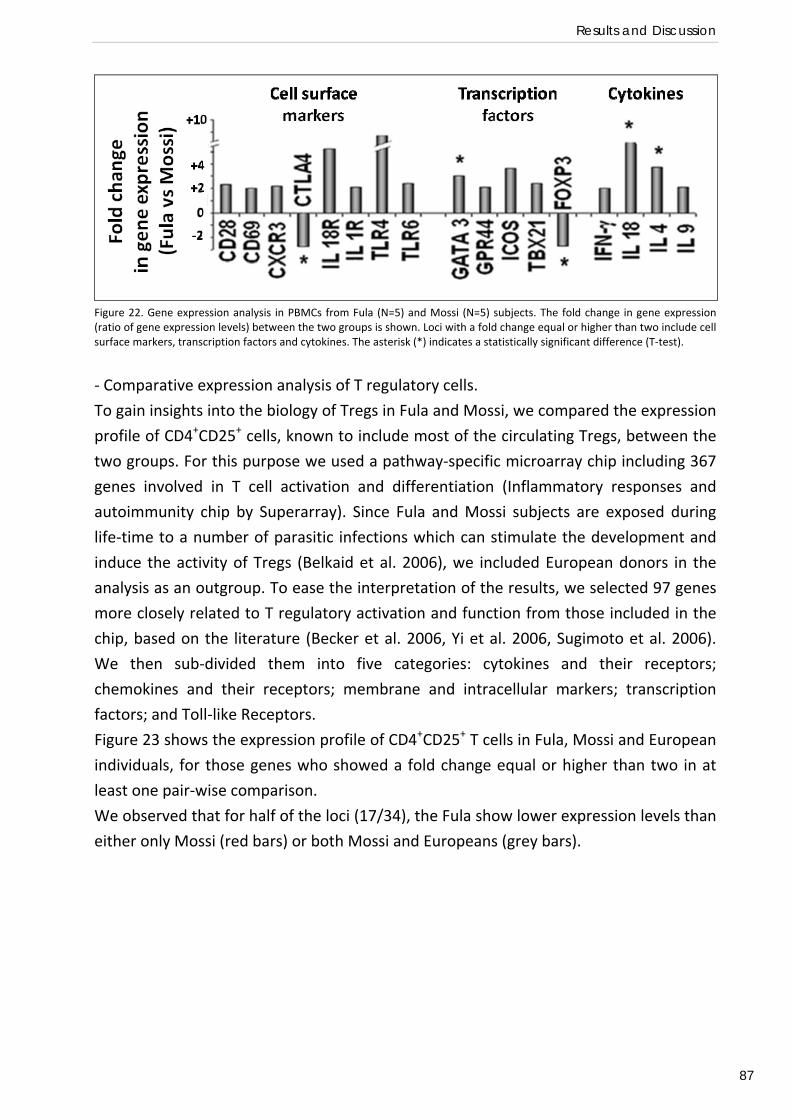
Results and Discussion
87
Figure 22. Gene expression analysis in PBMCs from Fula (N=5) and Mossi (N=5) subjects. The fold change in gene expression (ratio of gene expression levels) between the two groups is shown. Loci with a fold change equal or higher than two include cell surface markers, transcription factors and cytokines. The asterisk (*) indicates a statistically significant difference (T‐test).
‐ Comparative expression analysis of T regulatory cells.
To gain insights into the biology of Tregs in Fula and Mossi, we compared the expression
profile of CD4+CD25+ cells, known to include most of the circulating Tregs, between the
two groups. For this purpose we used a pathway‐specific microarray chip including 367
genes involved in T cell activation and differentiation (Inflammatory responses and
autoimmunity chip by Superarray). Since Fula and Mossi subjects are exposed during
life‐time to a number of parasitic infections which can stimulate the development and
induce the activity of Tregs (Belkaid et al. 2006), we included European donors in the
analysis as an outgroup. To ease the interpretation of the results, we selected 97 genes
more closely related to T regulatory activation and function from those included in the
chip, based on the literature (Becker et al. 2006, Yi et al. 2006, Sugimoto et al. 2006).
We then sub‐divided them into five categories: cytokines and their receptors;
chemokines and their receptors; membrane and intracellular markers; transcription
factors; and Toll‐like Receptors.
Figure 23 shows the expression profile of CD4+CD25+ T cells in Fula, Mossi and European
individuals, for those genes who showed a fold change equal or higher than two in at
least one pair‐wise comparison.
We observed that for half of the loci (17/34), the Fula show lower expression levels than
either only Mossi (red bars) or both Mossi and Europeans (grey bars).
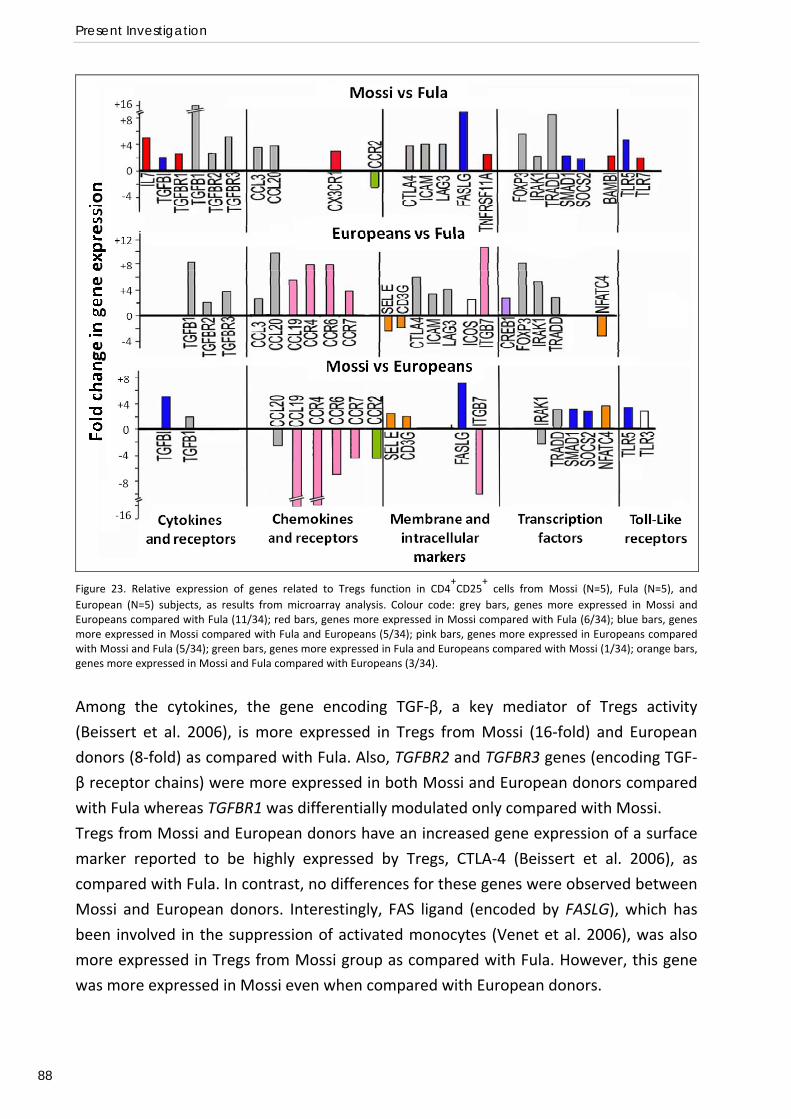
Present Investigation
88
Figure 23. Relative expression of genes related to Tregs function in CD4
+CD25
+ cells from Mossi (N=5), Fula (N=5), and
European (N=5) subjects, as results from microarray analysis. Colour code: grey bars, genes more expressed in Mossi and Europeans compared with Fula (11/34); red bars, genes more expressed in Mossi compared with Fula (6/34); blue bars, genes more expressed in Mossi compared with Fula and Europeans (5/34); pink bars, genes more expressed in Europeans compared with Mossi and Fula (5/34); green bars, genes more expressed in Fula and Europeans compared with Mossi (1/34); orange bars, genes more expressed in Mossi and Fula compared with Europeans (3/34).
Among the cytokines, the gene encoding TGF‐β, a key mediator of Tregs activity
(Beissert et al. 2006), is more expressed in Tregs from Mossi (16‐fold) and European
donors (8‐fold) as compared with Fula. Also, TGFBR2 and TGFBR3 genes (encoding TGF‐
β receptor chains) were more expressed in both Mossi and European donors compared
with Fula whereas TGFBR1 was differentially modulated only compared with Mossi.
Tregs from Mossi and European donors have an increased gene expression of a surface
marker reported to be highly expressed by Tregs, CTLA‐4 (Beissert et al. 2006), as
compared with Fula. In contrast, no differences for these genes were observed between
Mossi and European donors. Interestingly, FAS ligand (encoded by FASLG), which has
been involved in the suppression of activated monocytes (Venet et al. 2006), was also
more expressed in Tregs from Mossi group as compared with Fula. However, this gene
was more expressed in Mossi even when compared with European donors.
Results and Discussion
89
In Mossi and European Tregs we could also observe a much higher expression of FOXP‐
3, a transcription factor which is the main responsible for Tregs differentiation (Becker
et al. 2006), as compared with Fula. SOCS2, a member of the suppressor of cytokine
signalling family of transcription factors, whose expression is confined to Tregs subset
and is dependent on FOXP‐3 expression (Sugimoto et al. 2006), was also more expressed
in Tregs from Mossi as compared with Fula. SOCS2 but not FOXP3 was more expressed
in Mossi as compared with Europeans.
Among the gene encoding TLRs, Tregs from Mossi, compared with Fula, have a higher
expression of TLR5 and TLR7, which have been reported as expressed at significantly
higher levels in Tregs than in conventional T cells (Sutmuller et al. 2006). The expression
of TLR5 was increased in Mossi also compared with European donors.
On the whole these results indicated that Fula have a lower expression of genes
determinant for Tregs activity such as TGFB1, TGFBRs, CTLA4, and FOXP3 compared with
both Mossi and European donors. In contrast, gene expression of Mossi Tregs was partly
super‐imposable to that of European donor Tregs, except for genes such as TRADD,
SOCS2, FASLG, and TLR5, which are likely to be involved in Tregs activation dependent
on stimuli triggered by parasitic infections endemic in the rural area of Burkina Faso
where the Mossi live.
Therefore, we wanted to validate these findings by quantitative real time‐PCR of
selected genes of interest: CTLA4, FOXP3, FASLG, TLR5, TGFB, TGFBR2, TRADD and
SOCS2. In agreement with the microarray analysis, the genes tested were less expressed
in Fula compared with Mossi, and, with the exception of FASLG, the differences
between the two groups were statistically significant. FOXP3, CTLA4, TGFB, and TGFBR2
were significantly reduced in Fula also when compared with European donors. The
comparison with Mossi and European donors confirmed that Treg from Mossi express
significantly more SOCS2 and TLR5. Higher expression of TRADD and FASLG was also
found, but the differences were not significant (data not shown).
‐ Discussion.
The results of gene expression analysis of PBMCs showed that mononuclear cells
isolated from Fula express higher amounts of RNA for several genes related to Th1 and
Th2 function when compared to Mossi. The same cells from Fula showed reduced
expression of two important genes related to immune tolerance: FOXP3 and CTLA4. The
reduced expression of the FOXP3 gene in PBMCs from Fula directly involves the activity
of Tregs and suggests that in the Fula higher Th1 and Th2 responses could be related to
alterations in the mechanisms of immune suppression mediated by Tregs. In line with
Present Investigation
90
previous evidence from murine and human models (Hisaeda et al. 2004, Walther et al.
2005), these results suggest that T regulatory activity could be central in the control of
malaria infection also in populations exposed to naturally high P. falciparum
transmission.
Quantitative‐PCR and microarray analysis of gene expression in CD4+CD25+ Tregs of
Fula, Mossi and European subjects indicated a lower expression of genes related to
Tregs activation and function in the Fula. In particular the reduced expression of the
FOXP3, CTLA4, TGFB and TGFBRs in CD4+CD25+ cells in the Fula suggests that the
autocrine/paracrine circuits maintaining the regulatory phenotype could be interrupted
or less efficient in this ethnic group. We identified these few key genes as good
candidates for genetic susceptibility studies.
It might be possible that an early block in the differentiation process driven by TGF‐β
(TGF‐β/CTLA‐4/FOXP‐3/CTLA‐4 positive loop) affects the generation of functional Tregs
in the Fula. In fact it has been shown that TGF‐β induces FOXP‐3 gene expression and in turn, FOXP‐3 makes T cells highly susceptible to the regulatory effects of TGF‐β signalling (Chen et al. 2003, Fantini et al. 2004). Furthermore, the interaction of CTLA‐4
with CD80/CD86 determinants on the surface of target T cells is necessary for the
induction of FOXP‐3 in the presence of TGF‐β, and its expression is amplified by FOXP‐3
(Beissert et al. 2006, Zheng et al. 2006).
This disorder of immune homeostasis could underlie the higher susceptibility of the Fula
to diseases with autoimmune pathogenesis reported in the literature, such as diabetes
mellitus (Fisch et al. 1987), pemphigus (Mahe et al. 1996), and onchocercal skin disease
(Brieger et al. 1997). A higher resistance against infectious diseases like P. falciparum
malaria could have been the driving selective force of this disorder.
Conclusions and Perspectives
91
CONCLUDING REMARKS AND FUTURE PERSPECTIVES
Role of IRF1 polymorphisms in susceptibility to P. falciparum malaria.
The first aim of the present investigation was to gain new insights into molecular
mechanisms of protective immunity to malaria and pathogenesis regulated by IFN‐γ. We
conducted three genetic epidemiology association studies of complementary design to
investigate the role of four candidate loci: IFNG, IFNGR1, IFNGR2 and IRF1. The most
interesting findings concerned the IRF1 gene. Indeed, we observed significant
associations between common genetic variation at the IRF1 locus and the ability to
control P. falciparum infection, both in healthy adult individuals (Preliminary association
study) and in children affected by uncomplicated and severe malaria (Paper I). On the
other hand, our studies did not provide evidence for a major role of this gene in
determining susceptibility to severe disease (Paper II). Furthermore, using the recently
developed methodology of allele‐specific transcript quantification mapping, we
obtained preliminary results suggesting the existence of a regulatory element(s) in the
5’ upstream region of the IRF1 locus (Preliminary functional study).
According to a recently proposed model of innate immunity to malaria, P. falciparum
activates mDCs, possibly through the interaction of GPI with TLR‐2 or TLR‐4, to produce
IL‐12, IL‐18 and type I IFN. These inflammatory cytokines are required, together with
contact‐dependent signals, for IFN‐γ production by NK cells, an early protective
response against malaria infection (Korbel et al. 2005, Newman et al. 2006). There is
also increasing evidence showing that IRFs are key regulators of TLRs signalling (Honda
and Taniguchi 2006). Furthermore IRF‐1 is known to regulate the expression of IL‐15, IL‐
12, IL‐18 and type I IFN and to drive NKs and TH1 cells activation (Lohoff and Mak 2005).
It seems therefore likely that IRF‐1 plays a crucial role in the gene‐regulatory network
leading to IFN‐γ production by NK cells during malaria infection. The results of
microarray analysis are consistent with this model: comparisons of PBMCs from
uninfected and experimentally infected individuals showed that expression of TLRs,
MyD88, IRF1, IFNG, IFNGR1 and IFNGR2 is significantly induced very early in infection
(Ockenhouse et al. 2006).
The gene regulatory networks of the immune system that are activated during malaria
infection and that are responsible for parasite killing may differ from those leading to an
over‐reaction to the parasite that is harmful to the host, depending for example on the
molecular triggers from the parasite or on the tissues involved. A genome‐wide linkage
analysis of parasite density and mild malaria in two Senegalese villages has recently
suggested that this could be the case. Regions of linkage showed little if any overlap
Present Investigation
92
with genes previously described to be associated with severe malaria, while showing an
overlap with genes involved in asthma and atopy related traits (Sakuntabhai et al. 2008).
Thus, our working hypothesis based on the available data and literature is that IRF1
polymorphisms entail different abilities to control P. falciparum infection by affecting
IRF1 gene expression and ultimately the production of inflammatory cytokines, but that
they do play a role in immune‐based pathogenesis of severe disease.
To further investigate this hypothesis, we wish to conduct fine mapping studies in
multiple populations of larger sample size, where both phenotypes, parasite load and
disease severity, could be inspected against the same genetic background. The
MalariaGEN network (MalariaGEN Consortium 2008) offers now the great opportunity
to conduct such studies.
Also, we would like to evaluate the effect of IRF1 polymorphisms on gene expression
and production of cytokines in response to malaria. An in vitro study of immunological
responses to P. falciparum has been recently conducted by Prof. Riley’s group (LSHTM,
London, UK) on PBMCs from malaria naive volunteers, offering an ideal setting to test
this hypothesis. The study indeed showed striking heterogeneity in the individual ability
to mount a sustained IFN‐γ response to P. falciparum infection and suggested that
genetic factors may be involved (Korbel et al. 2005, Newman et al. 2006).
Functional deficit of T regulatory cells and lower susceptibility to P. falciparum malaria in
the Fula people of West Africa.
The second aim of our investigation was to achieve a greater understanding of the
biological basis of the resistance to malaria shown by the Fula people of West Africa and
of the underlying molecular mechanism.
First of all, by studying HLA class II polymorphism we confirmed that the Fula from
Burkina Faso are genetically differentiated from sympatric Mossi and Rimaibé, which
represents the necessary theoretical background for the investigation of genetic
determinants of inter‐ethnic differences in susceptibility to malaria. We have also
observed that they are very close to the Fula from The Gambia, and that both the Fula
from Burkina Faso and from The Gambia are relatively close to East African populations.
In particular, the DRB1*04 allele is absent or at very low frequencies in all Sub‐Saharan
African populations, except in the Fula and in Ethiopians, where it reaches a frequency
close to that of Europeans. These observations are in agreement with the hypothesis
Conclusions and Perspectives
93
that the Fula’s genetic make‐up includes an appreciable Caucasoid component of
possible East‐African origin, which has been suggested on the basis of their physical
features and cultural traditions. Furthermore, the HLADR1*04 allele may be a potential
candidate for future genetic association studies of susceptibility to malaria, as in
Europeans it is associated with increased risk of autoimmune diseases (Paper III).
We have then compared the expression profiles of healthy adults of Fula and Mossi
ethnicity from Burkina Faso in the effort of identifying the immunological mechanisms
underlying the observed differences in susceptibility to malaria. QT‐PCR analysis showed
that PBMCs isolated from Fula express higher amounts of RNA for several genes related
to Th1 and Th2 function when compared to Mossi. The same cells from Fula showed
reduced expression of two important genes related to immune tolerance: FOXP3 and
CTLA4. The differential expression of the FOXP3 gene directly involves the activity of
Tregs. Microarray transcriptional analysis of the CD4+CD25+ cells revealed, beside a
lower expression of FOXP3, also a lower expression of several genes determinant for T
regulatory activity such as CTLA4, TGFB and TGFBRs in the Fula. These results suggested
a functional deficit of Tregs in the Fula and identified few key genes as good candidates
for genetic association studies (Paper IV).
At present we are conducting a field study in Burkina Faso and Mali to further
investigate whether regulatory T cells are implicated in the susceptibility to
P. falciparum malaria in hyper‐endemic areas. The percentage of CD4+CD25+FOXP‐3+
cells and the percentage of T cells producing regulatory cytokines (IL‐10 and TGF‐β) will be determined in the study populations during community based surveys by
cytofluorimetric analysis. These parameters will be compared in healthy subjects
belonging to ethnic groups characterized by different degree of susceptibility and
immune response to malaria (Fula and Mossi from Burkina Faso; Fula and Dogon from
Mali) to investigate whether we can confirm the deficit of T regulatory number/function
observed in the Fula. The same parameters will also be compared between children
who developed at least one malaria episode during longitudinal follow up and children
who did not suffer any malaria attack, to determine if T regulatory activity plays a role in
susceptibility to clinical malaria.
In parallel to the field work, we aim to take forward the results of gene expression analysis and further investigate the role of four key candidate genes, FOXP3, CTLA4, TGFB1 and TGFBR2, in determining the higher resistance to malaria shown by the Fula people of West‐Africa and, more broadly, susceptibility to malaria in individuals living in endemic areas. We wish to conduct population genetics studies in Fula and sympatric
Present Investigation
94
ethnic groups as well as other African and European populations to look for differences in allele frequencies and signals of positive selection (Sabeti et al. 2006). We would also like to perform fine genetic mapping in Fula and sympatric ethnic groups to look for association with incidence of clinical malaria, parasite density and immune responses to malaria antigens. By carrying out allele‐specific expression experiments and applying analogous strategies to those earlier described (see “Searching for regulators of gene expression”; Knight et al. 2003) we might enable uncovering of functional polymorphisms. Finally, we could test the selected functional variants for association with severe malaria in large, multi‐centre samples using MalariaGEN resources (MalariaGEN Consortium 2008).
95
AKNOWLEDGMENTS
I am really glad to be able to thank here the so many different people that have made this work
possible. I am happy to have experienced that science is collective machinery.
Thanks a lot to Prof. David Modiano for the trust he has built upon me and for the professional
challenges and opportunities he has provided me with over the years, which made me grow up as a
person and a scientist. Thanks for sustaining my diverse research interests and willing to continue to do
so in the future.
To Prof. Dominic Kwiatkowski big thanks for always being present and feeding my enthusiasm with crazy
ideas and solid plans or the opposite way round. Thanks for making me enter and being part of a great
research group from which I am constantly learning.
Warm thanks to Prof. Marita Troye‐Blomberg for excellent guidance and constant support throughout
my PhD studies. She has been essential for good time planning and for leading me to dissertation. She
also made sure that I learned and loved immunology. Thanks so much for doing all this with a very much
appreciated personal touch.
To the BioMalPar Network and PhD Programme goes my greatest appreciation for the amazing
opportunities I have been offered during my studies. Most of all for the exposure to different
professional and human environments and for the many occasions to learn from and interact with
scientists of very diverse backgrounds in malaria research.
In Italia.
Thanks a lot to Dr. Federica Verra at the University of Rome, Dept. of Public Health Sciences, for showing
me how important are determination and hard work in every aspect of scientific life. For her great help
revising all my manuscripts and for valuable suggestions each time I needed one.
Thanks to all my colleagues at the Dept. of Public Health Sciences, especially Dr. Pamela Avellino, Dr.
Germana Bancone, Dr. Giacomo Paganotti, Dr. Beniamino Caputo, Dr. Marco Pombi, Dr. Federica
Santolamazza, Dr. Bruno Arcà, Dr. Fabrizio Lombardo, Cinzia Rizzo and Gabriella Sferra for all their help
in the lab and for making me very happy to come back home every time I do.
Thanks to Dr. Patrizia Lulli at the Dept. of Diagnostic Sciences, for introducing me to HLA genotyping,
and for much enjoyable days spent discussing the data.
Thanks a lot to Dr. Chiara Batini at the Dept. of Animal and Human Biology for assisting me with
correspondence analysis and more broadly for getting involved one another with different methods in
population genetics.
Big thanks to my dear friend Dr. Mauro Capocci at the Section of History of Medicine for formatting my
thesis and preparing the figures of my papers, as well as for far too many other reasons to be mentioned
here.
Thanks a lot to Dr. Gabriella Torcia at the University of Florence for teaching me a lot about immunology
and immunological methods during her visit to Burkina Faso and my visit to Florence, and for passionate
discussions about T regulatory cells, autoimmunity and malaria. Thanks also to Dr. Annamaria Clemente
for kindly showing me QT‐PCR and microarrays experiments.
Aknowledgments
96
In England.
Thanks a lot to Dr. Kirk Rockett at the WTCHG in Oxford for patiently teaching me almost everything I
know about scientific methodology. Most of all I would like to warmly thank him for being constructively
critic and really supportive at all time, which has been of invaluable importance to me.
Thanks a lot to Dr. Susana Campino for many lessons in molecular biology and cell culture. Thanks again
to her and to Dr. Sarah Auburn, Dr. Julian Forton and Dr. Albert Mohr, who I loved to work with, for their
enthusiastic altruism in science and in life, and for very good laughs in and out the cell culture room.
Thanks to Dr. Taane Clark for great help with statistics and for pushing me writing up my manuscripts.
Thanks also to all other PhD students at the Childhood Infection Group, especially Abeer Alzein and
Anita Gansah, for the special working environment experienced in the Oxford lab.
Thanks to really everyone of the ever expanding DK Group at the WTCHG in Oxford and at the WTSI in
Hinxton for being very helpful and kind and for making a great time of every visit to the UK over the
years.
Thanks to Dr. Branwen Hennig at the LSHTM in London for keeping up my enthusiasm for genetic
epidemiology of infectious diseases and for being a terribly good friend.
In Sweden.
Thanks a lot to Prof. Carmen Fernandez for all her help with every aspect of PhD studies at Stockholm
University and for kindly revising my thesis.
Thanks to Halima Balogun, Pablo Giusti, Dr. Elisabeth Israelsson and Dr. Manijeh Vafa, for sharing their
office with me during every visit I made to the Department of Immunology and for very helpful guidance
with respect to exams, seminars and writing up of the thesis.
Thanks to Nora Bachmayer and Yvonne Sundstrom for training me with the basics of FACS technology.
Au Burkina Faso.
Thanks a lot to Dr. Bienvenu Sodiomon Sirima and Dr. Bocar Kouyaté for accepting me to join the CNFRP
in Ouagadougou during the field studies. To Dr. Issa Nebie and Dr. Amadou Konaté a special thanks, for
many suggestions and lessons, and for all their kindness. Thanks to Dr. Edith Bougouma, Dr. Issaka
Soulama, Dr. Amidou Diarra et Dr. Issouf Kaboré for their help and hard work.
Je veut aussi bien remercier tous les cliniciens et les infirmiers qui ont amené les enquêtes, les
informaticiens, et tous les techniciens des laboratoire des Immunologie, Parasitologie, Génétique et
Biologie Moléculaire du CNFRP pour leur travail précieux et pour les très beaux moments que on a
passés ensemble sur le terrain ou au labo.
Je tien à remercier tous les habitants des villages de Barkoumbilen, Barkoundouba, Nonokiodogo, Bassy
et Zanga pour leur participation active aux études amenées pendant le cours de cette thèse. Un grand
merci aux guides villageois pour leur aide incommensurable. Spécialement je veut remercier Boukari
Diallo pour l’ accueillance fraternel, la curiosité sincère, le soutien au tout moment et pour avoir essayé
de me faire comprendre la culture Peul, souvent à travers des ses très beaux proverbes.
Big thanks to my friend Dr. André Lin Ouedrago for having shared everything with me during my stay in
Burkina Faso. For the passion for science, exciting discussions either on immunology or on Burkinabé
society, and the strong support which has been crucial in the difficult moments.
Warm thanks to Dr. Virginio Pietra for introducing me to the reality of Health Centres and to the
complexity of situations a doctor has to face in Africa. Thanks for sustaining my interest in tropical
medicine and for being such good fun.

Aknowledgments
97
Thanks to a great trio of clinicians, my neighbours Dr. Veronica Bennato, Dr. Veronica Del Punta and Dr.
Alessandro Pini, for sharing their stories and impressions at the end of the day over a cold beer.
Around the world.
Thanks to Charlotte Behr, Cristina Cerboni, Patrick Corran, Daria Donati, Lars Hviid, Jean Langhorne,
Kirsty Newman, Eleonor Riley, Sue Pierce and Odile Poujalon for inspirational lessons‐seminars‐
discussions on immunology of malaria. Thanks all the same to Kevin Marsh, Louis Miller and Matts
Walgren for precious insights into the world of malaria pathogenesis and immunity to severe disease. It
has been a great opportunity to meet each one of you.
Thanks to all BioMalPar PhD students for sharing excitements and difficulties about our projects as well
as for being a great network of friends around Europe and Africa. Thanks for putting in practice our
special CSP (which in this case does not stay for Circum‐Sporozoite Protein, but for Common Solidarity
Programme).
Thanks finally to all the people who warmly opened their homes to me keeping a bed or a sofa ready for
the next visit, and made me feel an happy nomadic. Special thanks to Silvia and Enrico, Branwen and
Johnny, Giulia and Alessandro, Irina, Susana and Taane, Catherine and Carlotta.
And to Gaia, thanks for accompanying me all the way.
98
REFERENCES
Abel L, Cot M et al. (1992). Segregation analysis detects a major gene controlling blood infection levels in human malaria. Am J Hum Genet 50(6): 1308‐17.
Achtman AH, Bull PC et al. (2005). Longevity of the immune response and memory to blood‐stage malaria infection. Curr Top Microbiol Immunol 297: 71‐102.
Ackerman H, Usen S et al. (2003). Haplotypic analysis of the TNF locus by association efficiency and entropy. Genome Biol 4(4): R24.
Ackerman H, Usen S et al. (2005). A comparison of case‐control and family‐based association methods: the example of sickle‐cell and malaria. Ann Hum Genet 69(Pt 5): 559‐65.
Adams JH, Sim BK et al. (1992). A family of erythrocyte binding proteins of malaria parasites. Proc Natl Acad Sci U S A 89(15): 7085‐9.
Agarwal A, Guindo A et al. (2000). Hemoglobin C associated with protection from severe malaria in the Dogon of Mali, a West African population with a low prevalence of hemoglobin S. Blood 96(7): 2358‐63.
Ajioka JW, Fitzpatrick JM et al. (2001). Toxoplasma gondii genomics: shedding light on pathogenesis and chemotherapy. Expert Rev Mol Med 2001: 1‐19.
Allen SJ, O'Donnell A et al. (1997). alpha+‐Thalassemia protects children against disease caused by other infections as well as malaria. Proc Natl Acad Sci U S A 94(26): 14736‐41.
Allison AC (1954). Protection afforded by sickle‐cell trait against subtertian malareal infection. Br Med J 1(4857): 290‐4.
Allsopp CE, Harding RM et al. (1992). Interethnic genetic differentiation in Africa: HLA class I antigens in The Gambia. Am J Hum Genet 50(2): 411‐21.
Alonso PL, Lindsay SW et al. (1991). The effect of insecticide‐treated bed nets on mortality of Gambian children. Lancet 337(8756): 1499‐502.
Amani V, Vigario AM et al. (2000). Involvement of IFN‐gamma receptor‐medicated signaling in pathology and anti‐malarial immunity induced by Plasmodium berghei infection. Eur J Immunol 30(6): 1646‐55.
Amante FH and Good MF (1997). Prolonged Th1‐like response generated by a Plasmodium yoelii‐specific T cell clone allows complete clearance of infection in reconstituted mice. Parasite Immunol 19(3): 111‐26.
Annunziato F, Cosmi L et al. (2002). Phenotype, localization, and mechanism of suppression of CD4(+)CD25(+) human thymocytes. J Exp Med 196(3): 379‐87.
Artavanis‐Tsakonas K, Tongren JE et al. (2003). The war between the malaria parasite and the immune system: immunity, immunoregulation and immunopathology. Clin Exp Immunol 133(2): 145‐52.
Aucan C, Traore Y et al. (2000). High immunoglobulin G2 (IgG2) and low IgG4 levels are associated with human resistance to Plasmodium falciparum malaria. Infect Immun 68(3): 1252‐8.
Aucan C, Traore Y et al. (2001). Familial correlation of immunoglobulin G subclass responses to Plasmodium falciparum antigens in Burkina Faso. Infect Immun 69(2): 996‐1001.
Bach EA, Aguet M et al. (1997). The IFN gamma receptor: a paradigm for cytokine receptor signaling. Annu Rev Immunol 15: 563‐91.
Ball TB, Ji H et al. (2007). Polymorphisms in IRF‐1 associated with resistance to HIV‐1 infection in highly exposed uninfected Kenyan sex workers. Aids 21(9): 1091‐101.
Bannister LH, Margos G et al. (2005). Making a home for Plasmodium post‐genomics: ultrastructural organization of the blood stages. Molecular Approaches to Malaria. Sherman IW. Washington, D.C., ASM Press: 24‐49.
References
99
Barfod L, Bernasconi NL et al. (2007). Human pregnancy‐associated malaria‐specific B cells target polymorphic, conformational epitopes in VAR2CSA. Mol Microbiol 63(2): 335‐47.
Barrett JC, Fry B et al. (2005). Haploview: analysis and visualization of LD and haplotype maps. Bioinformatics 21(2): 263‐5.
Baruch DI, Pasloske BL et al. (1995). Cloning the P. falciparum gene encoding PfEMP1, a malarial variant antigen and adherence receptor on the surface of parasitized human erythrocytes. Cell 82(1): 77‐87.
Beck HP, Felger I et al. (1995). Evidence of HLA class II association with antibody response against the malaria vaccine SPF66 in a naturally exposed population. Am J Trop Med Hyg 53(3): 284‐8.
Becker C, Stoll S et al. (2006). Regulatory T cells: present facts and future hopes. Med Microbiol Immunol 195(3): 113‐24.
Beeson JG, Rogerson SJ et al. (2000). Adhesion of Plasmodium falciparum‐infected erythrocytes to hyaluronic acid in placental malaria. Nat Med 6(1): 86‐90.
Beissert S, Schwarz A et al. (2006). Regulatory T cells. J Invest Dermatol 126(1): 15‐24. Belkaid Y, Blank RB et al. (2006). Natural regulatory T cells and parasites: a common quest for host
homeostasis. Immunol Rev 212: 287‐300. Bereczky S, Dolo A et al. (2006). Spleen enlargement and genetic diversity of Plasmodium falciparum
infection in two ethnic groups with different malaria susceptibility in Mali, West Africa. Trans R Soc Trop Med Hyg 100(3): 248‐57.
Biemba G, Gordeuk VR et al. (1998). Prolonged macrophage activation and persistent anaemia in children with complicated malaria. Trop Med Int Health 3(1): 60‐5.
Biemba G, Gordeuk VR et al. (2000). Markers of inflammation in children with severe malarial anaemia. Trop Med Int Health 5(4): 256‐62.
Blanc M, Sanchez‐Mazas A et al. (1990). Interethnic genetic differentiation: GM polymorphism in eastern Senegal. Am J Hum Genet 46(2): 383‐92.
Bolad A, Farouk SE et al. (2005). Distinct interethnic differences in immunoglobulin G class/subclass and immunoglobulin M antibody responses to malaria antigens but not in immunoglobulin G responses to nonmalarial antigens in sympatric tribes living in West Africa. Scand J Immunol 61(4): 380‐6.
Bouharoun‐Tayoun H, Oeuvray C et al. (1995). Mechanisms underlying the monocyte‐mediated antibody‐dependent killing of Plasmodium falciparum asexual blood stages. J Exp Med 182(2): 409‐18.
Brieger WR, Ososanya OO et al. (1997). Gender and ethnic differences in onchocercal skin disease in Oyo State, Nigeria. Trop Med Int Health 2(6): 529‐34.
Bull PC, Lowe BS et al. (1998). Parasite antigens on the infected red cell surface are targets for naturally acquired immunity to malaria. Nat Med 4(3): 358‐60.
Bull PC, Kortok M et al. (2000). Plasmodium falciparum‐infected erythrocytes: agglutination by diverse Kenyan plasma is associated with severe disease and young host age. J Infect Dis 182(1): 252‐9.
Cabantous S, Poudiougou B et al. (2005). Evidence that interferon‐gamma plays a protective role during cerebral malaria. J Infect Dis 192(5): 854‐60.
Carter R and Mendis KN. (2002). Evolutionary and historical aspects of the burden of malaria. Clin Microbiol Rev 15(4): 564‐494.
Carvalho LH, Sano G et al. (2002). IL‐4‐secreting CD4+ T cells are crucial to the development of CD8+ T‐cell responses against malaria liver stages. Nat Med 8(2): 166‐70.
Cavalli‐Sforza LL and Edwards AW (1967). Phylogenetic analysis. Models and estimation procedures. Am J Hum Genet 19(3 Pt 1): 233‐57.
References
100
Chakravarty S, Cockburn IA et al. (2007). CD8+ T lymphocytes protective against malaria liver stages are primed in skin‐draining lymph nodes. Nat Med 13(9): 1035‐41.
Chang KH, Tam M et al. (2004). Inappropriately low reticulocytosis in severe malarial anemia correlates with suppression in the development of late erythroid precursors. Blood 103(10): 3727‐35.
Charron D (1997). Genetic diversity of HLA: functional and medical implications. Proc 12th Int Histocompatibility Workshop and Conference. Charron D. Paris, EDK. 1.
Chebloune Y, Pagnier J et al. (1988). Structural analysis of the 5' flanking region of the beta‐globin gene in African sickle cell anemia patients: further evidence for three origins of the sickle cell mutation in Africa. Proc Natl Acad Sci U S A 85(12): 4431‐5.
Chen W, Jin W et al. (2003). Conversion of peripheral CD4+CD25‐ naive T cells to CD4+CD25+ regulatory T cells by TGF‐beta induction of transcription factor Foxp3. J Exp Med 198(12): 1875‐86.
Cheng Q, Cloonan N et al. (1998). stevor and rif are Plasmodium falciparum multicopy gene families which potentially encode variant antigens. Mol Biochem Parasitol 97(1‐2): 161‐76.
Cheung VG, Conlin LK et al. (2003). Natural variation in human gene expression assessed in lymphoblastoid cells. Nat Genet 33(3): 422‐5.
Chitnis CE (2001). Molecular insights into receptors used by malaria parasites for erythrocyte invasion. Curr Opin Hematol 8(2): 85‐91.
Chizzolini C, Grau GE et al. (1990). T lymphocyte interferon‐gamma production induced by Plasmodium falciparum antigen is high in recently infected non‐immune and low in immune subjects. Clin Exp Immunol 79(1): 95‐9.
Clayton D (1999). A generalization of the transmission/disequilibrium test for uncertain‐haplotype transmission. Am J Hum Genet 65(4): 1170‐7.
Coban C, Ishii KJ et al. (2002). Purified malaria pigment (hemozoin) enhances dendritic cell maturation and modulates the isotype of antibodies induced by a DNA vaccine. Infect Immun 70(7): 3939‐43.
Cohen S, Mc GI et al. (1961). Gamma‐globulin and acquired immunity to human malaria. Nature 192: 733‐7.
Cot M, Abel L et al. (1993). Risk factors of malaria infection during pregnancy in Burkina Faso: suggestion of a genetic influence. Am J Trop Med Hyg 48(3): 358‐64.
Cummings CA and Relman DA (2000). Using DNA microarrays to study host‐microbe interactions. Emerg Infect Dis 6(5): 513‐25.
Cutbush S, Chikanza IC et al. (1993). Sequence‐specific oligonucleotide typing in Shona patients with rheumatoid arthritis and healthy controls from Zimbabwe. Tissue Antigens 41(4): 169‐72.
D'Alessandro U, Olaleye BO et al. (1995). Mortality and morbidity from malaria in Gambian children after introduction of an impregnated bednet programme. Lancet 345(8948): 479‐83.
Day NP, Hien TT et al. (1999). The prognostic and pathophysiologic role of pro‐ and antiinflammatory cytokines in severe malaria. J Infect Dis 180(4): 1288‐97.
de Kossodo S and Grau GE (1993). Profiles of cytokine production in relation with susceptibility to cerebral malaria. J Immunol 151(9): 4811‐20.
de Pablo R, Garcia‐Pacheco JM et al. (1997). HLA class I and class II allele distribution in the Bubi population from the island of Bioko (Equatorial Guinea). Tissue Antigens 50(6): 593‐601.
De Souza JB, Williamson KH et al. (1997). Early gamma interferon responses in lethal and nonlethal murine blood‐stage malaria. Infect Immun 65(5): 1593‐8.
Deitsch KW and Hviid L (2004). Variant surface antigens, virulence genes and the pathogenesis of malaria. Trends Parasitol 20(12): 562‐6.
Deloron P, Chougnet C et al. (1991). Protective value of elevated levels of gamma interferon in serum against exoerythrocytic stages of Plasmodium falciparum. J Clin Microbiol 29(9): 1757‐60.
References
101
Deloron P and Chougnet C (1992). Is immunity to malaria really short‐lived? Parasitol Today 8(11): 375‐8.
Desai M, ter Kuile FO et al. (2007). Epidemiology and burden of malaria in pregnancy. Lancet Infect Dis 7(2): 93‐104.
Dodoo D, Omer FM et al. (2002). Absolute levels and ratios of proinflammatory and anti‐inflammatory cytokine production in vitro predict clinical immunity to Plasmodium falciparum malaria. J Infect Dis 185(7): 971‐9.
Dolan SA, Miller LH et al. (1990). Evidence for a switching mechanism in the invasion of erythrocytes by Plasmodium falciparum. J Clin Invest 86(2): 618‐24.
Dolo A, Modiano D et al. (2005). Difference in susceptibility to malaria between two sympatric ethnic groups in Mali. Am J Trop Med Hyg 72(3): 243‐8.
D'Ombrain MC, Voss TS et al. (2007). Plasmodium falciparum erythrocyte membrane protein‐1 specifically suppresses early production of host interferon‐gamma. Cell Host Microbe 2(2): 130‐8.
Doolan DL and Hoffman SL (1997). Pre‐erythrocytic‐stage immune effector mechanisms in Plasmodium spp. infections. Philos Trans R Soc Lond B Biol Sci 352(1359): 1361‐7.
Doolan DL and Hoffman SL (1999). IL‐12 and NK cells are required for antigen‐specific adaptive immunity against malaria initiated by CD8+ T cells in the Plasmodium yoelii model. J Immunol 163(2): 884‐92.
Doolan DL and Hoffman SL (2000). The complexity of protective immunity against liver‐stage malaria. J Immunol 165(3): 1453‐62.
Duffy MF, Byrne TJ et al. (2005). Broad analysis reveals a consistent pattern of var gene transcription in Plasmodium falciparum repeatedly selected for a defined adhesion phenotype. Mol Microbiol 56(3): 774‐88.
Dupuis S, Doffinger R et al. (2000). Human interferon‐gamma‐mediated immunity is a genetically controlled continuous trait that determines the outcome of mycobacterial invasion. Immunol Rev 178: 129‐37.
Elloso MM, van der Heyde HC et al. (1994). Inhibition of Plasmodium falciparum in vitro by human gamma delta T cells. J Immunol 153(3): 1187‐94.
English M, Sauerwein R et al. (1997). Acidosis in severe childhood malaria. Qjm 90(4): 263‐70. Fantini MC, Becker C et al. (2004). Cutting edge: TGF‐beta induces a regulatory phenotype in CD4+CD25‐
T cells through Foxp3 induction and down‐regulation of Smad7. J Immunol 172(9): 5149‐53. Farouk SE, Dolo A et al. (2005). Different antibody‐ and cytokine‐mediated responses to Plasmodium
falciparum parasite in two sympatric ethnic tribes living in Mali. Microbes Infect 7(1): 110‐7. Favila‐Castillo L, Monroy‐Ostria A et al. (1996). Protection of rats against malaria by a transplanted
immune spleen. Parasite Immunol 18(7): 325‐31. Fell AH, Currier J et al. (1994). Inhibition of Plasmodium falciparum growth in vitro by CD4+ and CD8+ T
cells from non‐exposed donors. Parasite Immunol 16(11): 579‐86. Fernando MM, Stevens CR et al. (2008). Defining the role of the MHC in autoimmunity: a review and
pooled analysis. PLoS Genet 4(4): e1000024. Ferrante A, Kumaratilake L et al. (1990). Killing of Plasmodium falciparum by cytokine activated effector
cells (neutrophils and macrophages). Immunol Lett 25(1‐3): 179‐87. Ferreira A, Schofield L et al. (1986). Inhibition of development of exoerythrocytic forms of malaria
parasites by gamma‐interferon. Science 232(4752): 881‐4. Fisch A, Pichard E et al. (1987). Prevalence and risk factors of diabetes mellitus in the rural region of Mali
(West Africa): a practical approach. Diabetologia 30(11): 859‐62.
References
102
Flori L, Kumulungui B et al. (2003). Linkage and association between Plasmodium falciparum blood infection levels and chromosome 5q31‐q33. Genes Immun 4(4): 265‐8.
Flori L, Sawadogo S et al. (2003). Linkage of mild malaria to the major histocompatibility complex in families living in Burkina Faso. Hum Mol Genet 12(4): 375‐8.
Fort M, de Stefano GF et al. (1998). HLA class II allele and haplotype frequencies in Ethiopian Amhara and Oromo populations. Tissue Antigens 51(4 Pt 1): 327‐36.
Forton JT, Udalova IA et al. (2007). Localization of a long‐range cis‐regulatory element of IL13 by allelic transcript ratio mapping. Genome Res 17(1): 82‐7.
Frevert U, Sinnis P et al. (1993). Malaria circumsporozoite protein binds to heparan sulfate proteoglycans associated with the surface membrane of hepatocytes. J Exp Med 177(5): 1287‐98.
Fried M and Duffy PE (1996). Adherence of Plasmodium falciparum to chondroitin sulfate A in the human placenta. Science 272(5267): 1502‐4.
Fried M and Duffy PE (1998). Maternal malaria and parasite adhesion. J Mol Med 76(3‐4): 162‐71. Fry AE, Griffiths MJ et al. (2008). Common variation in the ABO glycosyltransferase is associated with
susceptibility to severe Plasmodium falciparum malaria. Hum Mol Genet 17(4): 567‐76. Gabriel SB, Schaffner SF et al. (2002). The structure of haplotype blocks in the human genome. Science
296(5576): 2225‐9. Garcia A, Cot M et al. (1998). Genetic control of blood infection levels in human malaria: evidence for a
complex genetic model. Am J Trop Med Hyg 58(4): 480‐8. Garcia A, Marquet S et al. (1998). Linkage analysis of blood Plasmodium falciparum levels: interest of the
5q31‐q33 chromosome region. Am J Trop Med Hyg 58(6): 705‐9. Gardner MJ, Hall N et al. (2002). Genome sequence of the human malaria parasite Plasmodium
falciparum. Nature 419(6906): 498‐511. Giha HA, Staalsoe T et al. (1999). Nine‐year longitudinal study of antibodies to variant antigens on the
surface of Plasmodium falciparum‐infected erythrocytes. Infect Immun 67(8): 4092‐8. Gilbert SC, Plebanski M et al. (1998). Association of malaria parasite population structure, HLA, and
immunological antagonism. Science 279(5354): 1173‐7. Gonzalez JM, Portillo MC et al. (2005). Multiple displacement amplification as a pre‐polymerase chain
reaction (pre‐PCR) to process difficult to amplify samples and low copy number sequences from natural environments. Environ Microbiol 7(7): 1024‐8.
Good MF, Pombo D et al. (1988). Human T‐cell recognition of the circumsporozoite protein of Plasmodium falciparum: immunodominant T‐cell domains map to the polymorphic regions of the molecule. Proc Natl Acad Sci U S A 85(4): 1199‐203.
Good MF and Doolan DL (1999). Immune effector mechanisms in malaria. Curr Opin Immunol 11(4): 412‐9.
Good MF (2001). Towards a blood‐stage vaccine for malaria: are we following all the leads? Nat Rev Immunol 1(2): 117‐25.
Grau GE, Heremans H et al. (1989). Monoclonal antibody against interferon gamma can prevent experimental cerebral malaria and its associated overproduction of tumor necrosis factor. Proc Natl Acad Sci U S A 86(14): 5572‐4.
Graves PM, Bhatia K et al. (1989). Association between HLA type and antibody response to malaria sporozoite and gametocyte epitopes is not evident in immune Papua New Guineans. Clin Exp Immunol 78(3): 418‐23.
Gray JC, Corran PH et al. (2007). Profiling the antibody immune response against blood stage malaria vaccine candidates. Clin Chem 53(7): 1244‐53.
References
103
Greenwood BM, Groenendaal F et al. (1987). Ethnic differences in the prevalence of splenomegaly and malaria in The Gambia. Ann Trop Med Parasitol 81(4): 345‐54.
Greenwood B, Marsh K et al. (1991). Why do some African children develop severe malaria? Parasitol Today 7(10): 277‐81.
Greenwood B (2006). Review: Intermittent preventive treatment‐‐a new approach to the prevention of malaria in children in areas with seasonal malaria transmission. Trop Med Int Health 11(7): 983‐91.
Guerra CA, Gikandi PW et al. (2008). The limits and intensity of Plasmodium falciparum transmission: implications for malaria control and elimination worldwide. PLoS Med 5(2): e38.
Gupta S, Snow RW et al. (1999). Immunity to non‐cerebral severe malaria is acquired after one or two infections. Nat Med 5(3): 340‐3.
Haldane JBS (1949). Disease and evolution. Ricerca Scientifica Suppl 35: 68‐76. Hamblin MT, Thompson EE et al. (2002). Complex signatures of natural selection at the Duffy blood
group locus. Am J Hum Genet 70(2): 369‐83. Hanum PS, Hayano M et al. (2003). Cytokine and chemokine responses in a cerebral malaria‐susceptible
or ‐resistant strain of mice to Plasmodium berghei ANKA infection: early chemokine expression in the brain. Int Immunol 15(5): 633‐40.
Harpaz R, Edelman R et al. (1992). Serum cytokine profiles in experimental human malaria. Relationship to protection and disease course after challenge. J Clin Invest 90(2): 515‐23.
Hartl DL and Clark AG (1997). Principles of population genetics. Sunderland, MA, Sinauer Associates. Hay SI and Snow RW (2006). The malaria Atlas Project: developing global maps of malaria risk. PLoS Med
3(12): e473. Hensmann M and Kwiatkowski D (2001). Cellular basis of early cytokine response to Plasmodium
falciparum. Infect Immun 69(4): 2364‐71. Hernandez‐Valladares M, Rihet P et al. (2004). Mapping of a new quantitative trait locus for resistance
to malaria in mice by a comparative mapping approach with human Chromosome 5q31‐q33. Immunogenetics 56(2): 115‐7.
Hill AV, Allsopp CE et al. (1991). Common west African HLA antigens are associated with protection from severe malaria. Nature 352(6336): 595‐600.
Hirunpetcharat C and Good MF (1998). Deletion of Plasmodium berghei‐specific CD4+ T cells adoptively transferred into recipient mice after challenge with homologous parasite. Proc Natl Acad Sci U S A 95(4): 1715‐20.
Hisaeda H, Maekawa Y et al. (2004). Escape of malaria parasites from host immunity requires CD4+ CD25+ regulatory T cells. Nat Med 10(1): 29‐30.
Honda K and Taniguchi T (2006). Toll‐like receptor signaling and IRF transcription factors. IUBMB Life 58(5‐6): 290‐5.
Hoogendoorn B, Coleman SL et al. (2003). Functional analysis of human promoter polymorphisms. Hum Mol Genet 12(18): 2249‐54.
Hopkins H, Talisuna A et al. (2007). Impact of home‐based management of malaria on health outcomes in Africa: a systematic review of the evidence. Malar J 6: 134.
Horton R, Wilming L et al. (2004). Gene map of the extended human MHC. Nat Rev Genet 5(12): 889‐99. Hotchkiss RS and Karl IE (2003). The pathophysiology and treatment of sepsis. N Engl J Med 348(2): 138‐
50. Hull J, Campino S et al. (2007). Identification of common genetic variation that modulates alternative
splicing. PLoS Genet 3(6): e99. Hunt NH and Grau GE (2003). Cytokines: accelerators and brakes in the pathogenesis of cerebral
malaria. Trends Immunol 24(9): 491‐9.
References
104
Hviid L, Kurtzhals JA et al. (2001). Perturbation and proinflammatory type activation of V delta 1(+) gamma delta T cells in African children with Plasmodium falciparum malaria. Infect Immun 69(5): 3190‐6.
Hviid L (2004). The immuno‐epidemiology of pregnancy‐associated Plasmodium falciparum malaria: a variant surface antigen‐specific perspective. Parasite Immunol 26(11‐12): 477‐86.
Hviid L and Staalsoe T (2004). Malaria immunity in infants: a special case of a general phenomenon? Trends Parasitol 20(2): 66‐72.
Hviid L (2005). Naturally acquired immunity to Plasmodium falciparum malaria in Africa. Acta Trop 95(3): 270‐5.
Janeway C (2005). Immunobiology : the immune system in health and disease. New York, Garland Science.
Jepson AP, Banya WA et al. (1995). Genetic regulation of fever in Plasmodium falciparum malaria in Gambian twin children. J Infect Dis 172(1): 316‐9.
Jepson A, Banya W et al. (1997). Quantification of the relative contribution of major histocompatibility complex (MHC) and non‐MHC genes to human immune responses to foreign antigens. Infect Immun 65(3): 872‐6.
Jepson A, Sisay‐Joof F et al. (1997). Genetic linkage of mild malaria to the major histocompatibility complex in Gambian children: study of affected sibling pairs. Bmj 315(7100): 96‐7.
Jobling MA, Hurles M et al. (2004). Human evolutionary genetics : origins, peoples & disease. New York, Garland Science.
John CC, Zickafoose JS et al. (2003). Antibodies to the Plasmodium falciparum antigens circumsporozoite protein, thrombospondin‐related adhesive protein, and liver‐stage antigen 1 vary by ages of subjects and by season in a highland area of Kenya. Infect Immun 71(8): 4320‐5.
Johnson A, Leke R et al. (2000). Interaction of HLA and age on levels of antibody to Plasmodium falciparum rhoptry‐associated proteins 1 and 2. Infect Immun 68(4): 2231‐6.
Johnson AH, Leke RG et al. (2004). Human leukocyte antigen class II alleles influence levels of antibodies to the Plasmodium falciparum asexual‐stage apical membrane antigen 1 but not to merozoite surface antigen 2 and merozoite surface protein 1. Infect Immun 72(5): 2762‐71.
Kamwendo DD, Dzinjalamala FK et al. (2002). Plasmodium falciparum: PCR detection and genotyping of isolates from peripheral, placental, and cord blood of pregnant Malawian women and their infants. Trans R Soc Trop Med Hyg 96(2): 145‐9.
Kern P, Hemmer CJ et al. (1989). Elevated tumor necrosis factor alpha and interleukin‐6 serum levels as markers for complicated Plasmodium falciparum malaria. Am J Med 87(2): 139‐43.
Khattab A, Bonow I et al. (2008). Plasmodium falciparum variant STEVOR antigens are expressed in merozoites and possibly associated with erythrocyte invasion. Malar J 7: 137.
Kinyanjui SM, Conway DJ et al. (2007). IgG antibody responses to Plasmodium falciparum merozoite antigens in Kenyan children have a short half‐life. Malar J 6: 82.
Knight JC (2005). Regulatory polymorphisms underlying complex disease traits. J Mol Med 83(2): 97‐109. Koch O, Awomoyi A et al. (2002). IFNGR1 gene promoter polymorphisms and susceptibility to cerebral
malaria. J Infect Dis 185(11): 1684‐7. Koch O, Rockett K et al. (2005). Investigation of malaria susceptibility determinants in the
IFNG/IL26/IL22 genomic region. Genes Immun 6(4): 312‐8. Koch O, Kwiatkowski DP et al. (2006). Context‐specific functional effects of IFNGR1 promoter
polymorphism. Hum Mol Genet 15(9): 1475‐81. Korbel DS, Newman KC et al. (2005). Heterogeneous human NK cell responses to Plasmodium
falciparum‐infected erythrocytes. J Immunol 175(11): 7466‐73. Kroger A, Koster M et al. (2002). Activities of IRF‐1. J Interferon Cytokine Res 22(1): 5‐14.
References
105
Kwiatkowski D, Hill AV et al. (1990). TNF concentration in fatal cerebral, non‐fatal cerebral, and uncomplicated Plasmodium falciparum malaria. Lancet 336(8725): 1201‐4.
Kwiatkowski DP (2005). How malaria has affected the human genome and what human genetics can teach us about malaria. Am J Hum Genet 77(2): 171‐92.
Kyes SA, Rowe JA et al. (1999). Rifins: a second family of clonally variant proteins expressed on the surface of red cells infected with Plasmodium falciparum. Proc Natl Acad Sci U S A 96(16): 9333‐8.
Lam AM (1993). De l'origine égyptienne des Peuls. Paris ‐ Gif‐sur‐Yvette, Présence africaine; Khepera. Langhorne J, Ndungu FM et al. (2008). Immunity to malaria: more questions than answers. Nat Immunol
9(7): 725‐32. Lapoumeroulie C, Dunda O et al. (1992). A novel sickle cell mutation of yet another origin in Africa: the
Cameroon type. Hum Genet 89(3): 333‐7. Leitner WW and Krzych U (1997). Plasmodium falciparum malaria blood stage parasites preferentially
inhibit macrophages with high phagocytic activity. Parasite Immunol 19(3): 103‐10. Linnell J, Mott R et al. (2004). Quantitative high‐throughput analysis of transcription factor binding
specificities. Nucleic Acids Res 32(4): e44. Livak KJ and Schmittgen TD (2001). Analysis of relative gene expression data using real‐time quantitative
PCR and the 2(‐Delta Delta C(T)) Method. Methods 25(4): 402‐8. Lohoff M and Mak TW (2005). Roles of interferon‐regulatory factors in T‐helper‐cell differentiation. Nat
Rev Immunol 5(2): 125‐35. Lombard Z, Dalton DL et al. (2006). Association of HLA‐DR, ‐DQ, and vitamin D receptor alleles and
haplotypes with tuberculosis in the Venda of South Africa. Hum Immunol 67(8): 643‐54. Lu B, Ebensperger C et al. (1998). Targeted disruption of the interferon‐gamma receptor 2 gene results
in severe immune defects in mice. Proc Natl Acad Sci U S A 95(14): 8233‐8. Luoni G, Verra F et al. (2001). Antimalarial antibody levels and IL4 polymorphism in the Fulani of West
Africa. Genes Immun 2(7): 411‐4. Luty AJ, Lell B et al. (1999). Interferon‐gamma responses are associated with resistance to reinfection
with Plasmodium falciparum in young African children. J Infect Dis 179(4): 980‐8. Luty AJ, Perkins DJ et al. (2000). Low interleukin‐12 activity in severe Plasmodium falciparum malaria.
Infect Immun 68(7): 3909‐15. Mackinnon MJ, Gunawardena DM et al. (2000). Quantifying genetic and nongenetic contributions to
malarial infection in a Sri Lankan population. Proc Natl Acad Sci U S A 97(23): 12661‐6. Mackinnon MJ, Mwangi TW et al. (2005). Heritability of malaria in Africa. PLoS Med 2(12): e340. Mahe A, Flageul B et al. (1996). Pemphigus in Mali: a study of 30 cases. Br J Dermatol 134(1): 114‐9. Maitland K and Marsh K (2004). Pathophysiology of severe malaria in children. Acta Trop 90(2): 131‐40. Malaguarnera L, Imbesi RM et al. (2002). Increased levels of interleukin‐12 in Plasmodium falciparum
malaria: correlation with the severity of disease. Parasite Immunol 24(7): 387‐9. MalariaGEN Consortium (2008). A global network for genomic epidemiology of malaria. Nature: In press. Marchini J, Cardon LR et al. (2004). The effects of human population structure on large genetic
association studies. Nat Genet 36(5): 512‐7. Marquet S, Abel L et al. (1996). Genetic localization of a locus controlling the intensity of infection by
Schistosoma mansoni on chromosome 5q31‐q33. Nat Genet 14(2): 181‐4. Marsh K and Howard RJ (1986). Antigens induced on erythrocytes by P. falciparum: expression of diverse
and conserved determinants. Science 231(4734): 150‐3. Marsh K, Forster D et al. (1995). Indicators of life‐threatening malaria in African children. N Engl J Med
332(21): 1399‐404.
References
106
Marsh K and Makani J (2004). Malaria. Principles of Medicine in Africa. Parry EHO. Cambridge, UK ; New York, NY, Cambridge University Press: 284‐304.
Marsh K and Kinyanjui S (2006). Immune effector mechanisms in malaria. Parasite Immunol 28(1‐2): 51‐60.
Matuschewski K and Mueller AK (2007). Vaccines against malaria ‐ an update. Febs J 274(18): 4680‐7. McDevitt MA, Xie J et al. (2004). The anemia of malaria infection: role of inflammatory cytokines. Curr
Hematol Rep 3(2): 97‐106. Mellouk S, Hoffman SL et al. (1994). Nitric oxide‐mediated antiplasmodial activity in human and murine
hepatocytes induced by gamma interferon and the parasite itself: enhancement by exogenous tetrahydrobiopterin. Infect Immun 62(9): 4043‐6.
Menendez C, Ordi J et al. (2000). The impact of placental malaria on gestational age and birth weight. J Infect Dis 181(5): 1740‐5.
Migot F, Chougnet C et al. (1993). Human immune responses to the Plasmodium falciparum ring‐infected erythrocyte surface antigen (Pf155/RESA) after a decrease in malaria transmission in Madagascar. Am J Trop Med Hyg 48(3): 432‐9.
Migot F, Chougnet C et al. (1995). Lack of correlation between HLA class II alleles and immune responses to Pf155/ring‐infected erythrocyte surface antigen (RESA) from Plasmodium falciparum in Madagascar. Am J Trop Med Hyg 52(3): 252‐7.
Migot‐Nabias F, Fajardy I et al. (1999). HLA class II polymorphism in a Gabonese Banzabi population. Tissue Antigens 53(6): 580‐5.
Miller LH, Howard RJ et al. (1986). Research toward malaria vaccines. Science 234(4782): 1349‐56. Miller LH, Baruch DI et al. (2002). The pathogenic basis of malaria. Nature 415(6872): 673‐9. Modiano D, Petrarca V et al. (1996). Different response to Plasmodium falciparum malaria in west
African sympatric ethnic groups. Proc Natl Acad Sci U S A 93(23): 13206‐11. Modiano D, Chiucchiuini A et al. (1998). Humoral response to Plasmodium falciparum Pf155/ring‐
infected erythrocyte surface antigen and Pf332 in three sympatric ethnic groups of Burkina Faso. Am J Trop Med Hyg 58(2): 220‐4.
Modiano D, Chiucchiuini A et al. (1999). Interethnic differences in the humoral response to non‐repetitive regions of the Plasmodium falciparum circumsporozoite protein. Am J Trop Med Hyg 61(4): 663‐7.
Modiano D, Luoni G et al. (2001). HLA class I in three West African ethnic groups: genetic distances from sub‐Saharan and Caucasoid populations. Tissue Antigens 57(2): 128‐37.
Modiano D, Luoni G et al. (2001). The lower susceptibility to Plasmodium falciparum malaria of Fulani of Burkina Faso (west Africa) is associated with low frequencies of classic malaria‐resistance genes. Trans R Soc Trop Med Hyg 95(2): 149‐52.
Modiano D, Luoni G et al. (2001). Haemoglobin C protects against clinical Plasmodium falciparum malaria. Nature 414(6861): 305‐8.
Modiano D, Bancone G et al. (2008). Haemoglobin S and haemoglobin C: 'quick but costly' versus 'slow but gratis' genetic adaptations to Plasmodium falciparum malaria. Hum Mol Genet 17(6): 789‐99.
Mohan K, Moulin P et al. (1997). Natural killer cell cytokine production, not cytotoxicity, contributes to resistance against blood‐stage Plasmodium chabaudi AS infection. J Immunol 159(10): 4990‐8.
Monks SA, Leonardson A et al. (2004). Genetic inheritance of gene expression in human cell lines. Am J Hum Genet 75(6): 1094‐105.
Morley M, Molony CM et al. (2004). Genetic analysis of genome‐wide variation in human gene expression. Nature 430(7001): 743‐7.
References
107
Morrot A, Hafalla JC et al. (2005). IL‐4 receptor expression on CD8+ T cells is required for the development of protective memory responses against liver stages of malaria parasites. J Exp Med 202(4): 551‐60.
Mota MM, Pradel G et al. (2001). Migration of Plasmodium sporozoites through cells before infection. Science 291(5501): 141‐4.
Mshana RN, Boulandi J et al. (1991). Cytokines in the pathogenesis of malaria: levels of IL‐I beta, IL‐4, IL‐6, TNF‐alpha and IFN‐gamma in plasma of healthy individuals and malaria patients in a holoendemic area. J Clin Lab Immunol 34(3): 131‐9.
Muehlenbachs A, Mutabingwa TK et al. (2006). Hypertension and maternal‐fetal conflict during placental malaria. PLoS Med 3(11): e446.
Nagel RL and Ranney HM (1990). Genetic epidemiology of structural mutations of the beta‐globin gene. Semin Hematol 27(4): 342‐59.
Nardin EH, Oliveira GA et al. (2000). Synthetic malaria peptide vaccine elicits high levels of antibodies in vaccinees of defined HLA genotypes. J Infect Dis 182(5): 1486‐96.
Natividad A, Holland MJ et al. (2008). Susceptibility to sequelae of human ocular chlamydial infection associated with allelic variation in IL10 cis‐regulation. Hum Mol Genet 17(2): 323‐9.
Nei M (1972). Genetic distance between populations. Am Nat 106: 283‐292. Newbold CI, Craig AG et al. (1997). PfEMP1, polymorphism and pathogenesis. Ann Trop Med Parasitol
91(5): 551‐7. Newbold CI (1999). Antigenic variation in Plasmodium falciparum: mechanisms and consequences. Curr
Opin Microbiol 2(4): 420‐5. Newman KC, Korbel DS et al. (2006). Cross‐talk with myeloid accessory cells regulates human natural
killer cell interferon‐gamma responses to malaria. PLoS Pathog 2(12): e118. Nielsen MA, Staalsoe T et al. (2002). Plasmodium falciparum variant surface antigen expression varies
between isolates causing severe and nonsevere malaria and is modified by acquired immunity. J Immunol 168(7): 3444‐50.
Nosten F and White NJ (2007). Artemisinin‐based combination treatment of falciparum malaria. Am J Trop Med Hyg 77(6 Suppl): 181‐92.
Nussenzweig V and Nussenzweig RS (1989). Rationale for the development of an engineered sporozoite malaria vaccine. Adv Immunol 45: 283‐334.
Nyholt DR (2004). A simple correction for multiple testing for single‐nucleotide polymorphisms in linkage disequilibrium with each other. Am J Hum Genet 74(4): 765‐9.
Ocana‐Morgner C, Mota MM et al. (2003). Malaria blood stage suppression of liver stage immunity by dendritic cells. J Exp Med 197(2): 143‐51.
Ockenhouse CF, Schulman S et al. (1984). Induction of crisis forms in the human malaria parasite Plasmodium falciparum by gamma‐interferon‐activated, monocyte‐derived macrophages. J Immunol 133(3): 1601‐8.
Ockenhouse CF and Shear HL (1984). Oxidative killing of the intraerythrocytic malaria parasite Plasmodium yoelii by activated macrophages. J Immunol 132(1): 424‐31.
Ockenhouse CF, Hu WC et al. (2006). Common and divergent immune response signaling pathways discovered in peripheral blood mononuclear cell gene expression patterns in presymptomatic and clinically apparent malaria. Infect Immun 74(10): 5561‐73.
Ofori MF, Dodoo D et al. (2002). Malaria‐induced acquisition of antibodies to Plasmodium falciparum variant surface antigens. Infect Immun 70(6): 2982‐8.
Olerup O, Troye‐Blomberg M et al. (1991). HLA‐DR and ‐DQ gene polymorphism in West Africans is twice as extensive as in north European Caucasians: evolutionary implications. Proc Natl Acad Sci U S A 88(19): 8480‐4.
References
108
Omer FM, de Souza JB et al. (2003). Activation of transforming growth factor beta by malaria parasite‐derived metalloproteinases and a thrombospondin‐like molecule. J Exp Med 198(12): 1817‐27.
Omer FM, de Souza JB et al. (2003). Differential induction of TGF‐beta regulates proinflammatory cytokine production and determines the outcome of lethal and nonlethal Plasmodium yoelii infections. J Immunol 171(10): 5430‐6.
Osier FH, Fegan G et al. (2008). Breadth and magnitude of antibody responses to multiple Plasmodium falciparum merozoite antigens are associated with protection from clinical malaria. Infect Immun 76(5): 2240‐8.
Pagani F and Baralle FE (2004). Genomic variants in exons and introns: identifying the splicing spoilers. Nat Rev Genet 5(5): 389‐96.
Paganotti GM, Babiker HA et al. (2004). Genetic complexity of Plasmodium falciparum in two ethnic groups of Burkina Faso with marked differences in susceptibility to malaria. Am J Trop Med Hyg 71(2): 173‐8.
Pasquetto V, Fidock DA et al. (1997). Plasmodium falciparum sporozoite invasion is inhibited by naturally acquired or experimentally induced polyclonal antibodies to the STARP antigen. Eur J Immunol 27(10): 2502‐13.
Pastinen T and Hudson TJ (2004). Cis‐acting regulatory variation in the human genome. Science 306(5696): 647‐50.
Patarroyo ME, Vinasco J et al. (1991). Genetic control of the immune response to a synthetic vaccine against Plasmodium falciparum. Parasite Immunol 13(5): 509‐16.
Patterson N, Price AL et al. (2006). Population structure and eigenanalysis. PLoS Genet 2(12): e190. Perry JA, Rush A et al. (2004). Dendritic cells from malaria‐infected mice are fully functional APC. J
Immunol 172(1): 475‐82. Plebanski M, Lee EA et al. (1999). Altered peptide ligands narrow the repertoire of cellular immune
responses by interfering with T‐cell priming. Nat Med 5(5): 565‐71. Plebanski M and Hill AV (2000). The immunology of malaria infection. Curr Opin Immunol 12(4): 437‐41. Pritchard JK, Stephens M et al. (2000). Inference of population structure using multilocus genotype data.
Genetics 155(2): 945‐59. Quintana‐Murci L, Alcais A et al. (2007). Immunology in natura: clinical, epidemiological and
evolutionary genetics of infectious diseases. Nat Immunol 8(11): 1165‐71. Rabinowitz D and Laird N (2000). A unified approach to adjusting association tests for population
admixture with arbitrary pedigree structure and arbitrary missing marker information. Hum Hered 50(4): 211‐23.
Ranque S, Safeukui I et al. (2005). Familial aggregation of cerebral malaria and severe malarial anemia. J Infect Dis 191(5): 799‐804.
Rayner JC, Tran TM et al. (2005). Dramatic difference in diversity between Plasmodium falciparum and Plasmodium vivax reticulocyte binding‐like genes. Am J Trop Med Hyg 72(6): 666‐74.
Renquin J, Sanchez‐Mazas A et al. (2001). HLA class II polymorphism in Aka Pygmies and Bantu Congolese and a reassessment of HLA‐DRB1 African diversity. Tissue Antigens 58(4): 211‐22.
Rhee MS, Akanmori BD et al. (2001). Changes in cytokine production associated with acquired immunity to Plasmodium falciparum malaria. Clin Exp Immunol 126(3): 503‐10.
Richie TL and Saul A (2002). Progress and challenges for malaria vaccines. Nature 415(6872): 694‐701. Ricke CH, Staalsoe T et al. (2000). Plasma antibodies from malaria‐exposed pregnant women recognize
variant surface antigens on Plasmodium falciparum‐infected erythrocytes in a parity‐dependent manner and block parasite adhesion to chondroitin sulfate A. J Immunol 165(6): 3309‐16.
Rihet P, Abel L et al. (1998). Human malaria: segregation analysis of blood infection levels in a suburban area and a rural area in Burkina Faso. Genet Epidemiol 15(5): 435‐50.
References
109
Rihet P, Traore Y et al. (1998). Malaria in humans: Plasmodium falciparum blood infection levels are linked to chromosome 5q31‐q33. Am J Hum Genet 63(2): 498‐505.
Riley EM, Allen SJ et al. (1990). Recognition of dominant T cell‐stimulating epitopes from the circumsporozoite protein of Plasmodium falciparum and relationship to malaria morbidity in Gambian children. Trans R Soc Trop Med Hyg 84(5): 648‐57.
Riley EM, Ong CS et al. (1990). Cellular and humoral immune responses to Plasmodium falciparum gametocyte antigens in malaria‐immune individuals. Limited response to the 48/45‐kilodalton surface antigen does not appear to be due to MHC restriction. J Immunol 144(12): 4810‐6.
Riley EM, Allen SJ et al. (1991). Association between immune recognition of the malaria vaccine candidate antigen Pf155/RESA and resistance to clinical disease: a prospective study in a malaria‐endemic region of west Africa. Trans R Soc Trop Med Hyg 85(4): 436‐43.
Riley EM, Jakobsen PH et al. (1991). Immune response to soluble exoantigens of Plasmodium falciparum may contribute to both pathogenesis and protection in clinical malaria: evidence from a longitudinal, prospective study of semi‐immune African children. Eur J Immunol 21(4): 1019‐25.
Riley EM, Olerup O et al. (1992). MHC and malaria: the relationship between HLA class II alleles and immune responses to Plasmodium falciparum. Int Immunol 4(9): 1055‐63.
Riley EM, Wagner GE et al. (2001). Do maternally acquired antibodies protect infants from malaria infection? Parasite Immunol 23(2): 51‐9.
Roberts DJ, Craig AG et al. (1992). Rapid switching to multiple antigenic and adhesive phenotypes in malaria. Nature 357(6380): 689‐92.
Roberts DR, Manguin S et al. (2000). DDT house spraying and re‐emerging malaria. Lancet 356(9226): 330‐2.
Rockett KA, Awburn MM et al. (1991). Killing of Plasmodium falciparum in vitro by nitric oxide derivatives. Infect Immun 59(9): 3280‐3.
Rockman MV and Wray GA (2002). Abundant raw material for cis‐regulatory evolution in humans. Mol Biol Evol 19(11): 1991‐2004.
Rogers DJ, Randolph SE et al. (2002). Satellite imagery in the study and forecast of malaria. Nature 415(6872): 710‐5.
Rogerson SJ, Chaiyaroj SC et al. (1995). Chondroitin sulfate A is a cell surface receptor for Plasmodium falciparum‐infected erythrocytes. J Exp Med 182(1): 15‐20.
Rogerson SJ, Hviid L et al. (2007). Malaria in pregnancy: pathogenesis and immunity. Lancet Infect Dis 7(2): 105‐17.
Ross P, Hall L et al. (1998). High level multiplex genotyping by MALDI‐TOF mass spectrometry. Nat Biotechnol 16(13): 1347‐51.
Ruwende C, Khoo SC et al. (1995). Natural selection of hemi‐ and heterozygotes for G6PD deficiency in Africa by resistance to severe malaria. Nature 376(6537): 246‐9.
Rzepczyk CM, Anderson K et al. (1997). Gamma delta T cells: their immunobiology and role in malaria infections. Int J Parasitol 27(2): 191‐200.
Sabeti PC, Reich DE et al. (2002). Detecting recent positive selection in the human genome from haplotype structure. Nature 419(6909): 832‐7.
Sabeti PC, Schaffner SF et al. (2006). Positive natural selection in the human lineage. Science 312(5780): 1614‐20.
Sachs J and Malaney P (2002). The economic and social burden of malaria. Nature 415(6872): 680‐5. Saito H, Tada S et al. (2001). Interferon regulatory factor 1 promoter polymorphism and response to
type 1 interferon. J Cell Biochem Suppl Suppl 36: 191‐200.
References
110
Saito H, Tada S et al. (2002). The detection of IRF‐1 promoter polymorphisms and their possible contribution to T helper 1 response in chronic hepatitis C. J Interferon Cytokine Res 22(6): 693‐700.
Sakuntabhai A, Ndiaye R et al. (2008). Genetic determination and linkage mapping of Plasmodium falciparum malaria related traits in Senegal. PLoS ONE 3(4): e2000.
Salanti A, Staalsoe T et al. (2003). Selective upregulation of a single distinctly structured var gene in chondroitin sulphate A‐adhering Plasmodium falciparum involved in pregnancy‐associated malaria. Mol Microbiol 49(1): 179‐91.
Salanti A, Dahlback M et al. (2004). Evidence for the involvement of VAR2CSA in pregnancy‐associated malaria. J Exp Med 200(9): 1197‐203.
Sanchez‐Mazas A (2001). African diversity from the HLA point of view: influence of genetic drift, geography, linguistics, and natural selection. Hum Immunol 62(9): 937‐48.
Sartelet H, Rogier C et al. (1996). Malaria associated pre‐eclampsia in Senegal. Lancet 347(9008): 1121. Saul A (1987). Kinetic constraints on the development of a malaria vaccine. Parasite Immunol 9(1): 1‐9. Scheller LF and Azad AF (1995). Maintenance of protective immunity against malaria by persistent
hepatic parasites derived from irradiated sporozoites. Proc Natl Acad Sci U S A 92(9): 4066‐8. Schofield L, Villaquiran J et al. (1987). Gamma interferon, CD8+ T cells and antibodies required for
immunity to malaria sporozoites. Nature 330(6149): 664‐6. Schofield L and Grau GE (2005). Immunological processes in malaria pathogenesis. Nat Rev Immunol
5(9): 722‐35. Sedegah M, Finkelman F et al. (1994). Interleukin 12 induction of interferon gamma‐dependent
protection against malaria. Proc Natl Acad Sci U S A 91(22): 10700‐2. Seguin MC, Klotz FW et al. (1994). Induction of nitric oxide synthase protects against malaria in mice
exposed to irradiated Plasmodium berghei infected mosquitoes: involvement of interferon gamma and CD8+ T cells. J Exp Med 180(1): 353‐8.
Seixas E, Cross C et al. (2001). Direct activation of dendritic cells by the malaria parasite, Plasmodium chabaudi chabaudi. Eur J Immunol 31(10): 2970‐8.
Senaldi G, Shaklee CL et al. (1999). Protection against the mortality associated with disease models mediated by TNF and IFN‐gamma in mice lacking IFN regulatory factor‐1. J Immunol 163(12): 6820‐6.
Sexton AC, Good RT et al. (2004). Transcriptional profiling reveals suppressed erythropoiesis, up‐regulated glycolysis, and interferon‐associated responses in murine malaria. J Infect Dis 189(7): 1245‐56.
Shear HL, Srinivasan R et al. (1989). Role of IFN‐gamma in lethal and nonlethal malaria in susceptible and resistant murine hosts. J Immunol 143(6): 2038‐44.
Silvie O, Franetich JF et al. (2004). Malaria sporozoite: migrating for a living. Trends Mol Med 10(3): 97‐100; discussion 100‐1.
Sim BK, Chitnis CE et al. (1994). Receptor and ligand domains for invasion of erythrocytes by Plasmodium falciparum. Science 264(5167): 1941‐4.
Singh B, Kim Sung L et al. (2004). A large focus of naturally acquired Plasmodium knowlesi infections in human beings. Lancet 363(9414): 1017‐24.
Sjoberg K, Lepers JP et al. (1992). Genetic regulation of human anti‐malarial antibodies in twins. Proc Natl Acad Sci U S A 89(6): 2101‐4.
Skinner EP (1964). The Mossi of the Upper Volta; the political development of a Sudanese people. Stanford, Calif.,, Stanford University Press.
References
111
Skorokhod OA, Alessio M et al. (2004). Hemozoin (malarial pigment) inhibits differentiation and maturation of human monocyte‐derived dendritic cells: a peroxisome proliferator‐activated receptor‐gamma‐mediated effect. J Immunol 173(6): 4066‐74.
Snow RW, Omumbo JA et al. (1997). Relation between severe malaria morbidity in children and level of Plasmodium falciparum transmission in Africa. Lancet 349(9066): 1650‐4.
Snow RW and Marsh K (2002). The consequences of reducing transmission of Plasmodium falciparum in Africa. Adv Parasitol 52: 235‐64.
Snow RW, Guerra CA et al. (2005). The global distribution of clinical episodes of Plasmodium falciparum malaria. Nature 434(7030): 214‐7.
Snow RW, Guerra CA et al. (2008). International funding for malaria control in relation to populations at risk of stable Plasmodium falciparum transmission. PLoS Med 5(7): e142.
Spielman RS, McGinnis RE et al. (1993). Transmission test for linkage disequilibrium: the insulin gene region and insulin‐dependent diabetes mellitus (IDDM). Am J Hum Genet 52(3): 506‐16.
Steketee RW, Nahlen BL et al. (2001). The burden of malaria in pregnancy in malaria‐endemic areas. Am J Trop Med Hyg 64(1‐2 Suppl): 28‐35.
Stenning DJ (1965). The pastoral Fulani of Northern Nigeria. Peoples of Africa. Gibbs JL. New York, Holt, Rinehart and Winston 363‐401.
Stephens HA, Brown AE et al. (1995). The presence of the HLA class II allele DPB1*0501 in ethnic Thais correlates with an enhanced vaccine‐induced antibody response to a malaria sporozoite antigen. Eur J Immunol 25(11): 3142‐7.
Stephens M, Smith NJ et al. (2001). A new statistical method for haplotype reconstruction from population data. Am J Hum Genet 68(4): 978‐89.
Stephens M and Donnelly P (2003). A comparison of bayesian methods for haplotype reconstruction from population genotype data. Am J Hum Genet 73(5): 1162‐9.
Stevenson MM, Ghadirian E et al. (1989). Role of mononuclear phagocytes in elimination of Plasmodium chabaudi AS infection. Parasite Immunol 11(5): 529‐44.
Stevenson MM, Tam MF et al. (1995). IL‐12‐induced protection against blood‐stage Plasmodium chabaudi AS requires IFN‐gamma and TNF‐alpha and occurs via a nitric oxide‐dependent mechanism. J Immunol 155(5): 2545‐56.
Stirnadel HA, Beck HP et al. (1999). Heritability and segregation analysis of immune responses to specific malaria antigens in Papua New Guinea. Genet Epidemiol 17(1): 16‐34.
Stirnadel HA, Al‐Yaman F et al. (2000). Assessment of different sources of variation in the antibody responses to specific malaria antigens in children in Papua New Guinea. Int J Epidemiol 29(3): 579‐86.
Stirnadel HA, Beck HP et al. (2000). Genetic analysis of IgG subclass responses against RESA and MSP2 of Plasmodium falciparum in adults in Papua New Guinea. Epidemiol Infect 124(1): 153‐62.
Strachan T and Read AP (2004). Human molecular genetics 3. London ; New York, Garland Press. Stranger BE, Forrest MS et al. (2005). Genome‐wide associations of gene expression variation in
humans. PLoS Genet 1(6): e78. Su XZ, Heatwole VM et al. (1995). The large diverse gene family var encodes proteins involved in
cytoadherence and antigenic variation of Plasmodium falciparum‐infected erythrocytes. Cell 82(1): 89‐100.
Su Z and Stevenson MM (2000). Central role of endogenous gamma interferon in protective immunity against blood‐stage Plasmodium chabaudi AS infection. Infect Immun 68(8): 4399‐406.
Su Z and Stevenson MM (2002). IL‐12 is required for antibody‐mediated protective immunity against blood‐stage Plasmodium chabaudi AS malaria infection in mice. J Immunol 168(3): 1348‐55.
References
112
Sugimoto N, Oida T et al. (2006). Foxp3‐dependent and ‐independent molecules specific for CD25+CD4+ natural regulatory T cells revealed by DNA microarray analysis. Int Immunol 18(8): 1197‐209.
Sullivan AD, Nyirenda T et al. (1999). Malaria infection during pregnancy: intrauterine growth retardation and preterm delivery in Malawi. J Infect Dis 179(6): 1580‐3.
Sutmuller RP, Morgan ME et al. (2006). Toll‐like receptors on regulatory T cells: expanding immune regulation. Trends Immunol 27(8): 387‐93.
Tan RS, Feng C et al. (1999). Altered immune response of interferon regulatory factor 1‐deficient mice against Plasmodium berghei blood‐stage malaria infection. Infect Immun 67(5): 2277‐83.
Taylor RR, Egan A et al. (1996). Selective recognition of malaria antigens by human serum antibodies is not genetically determined but demonstrates some features of clonal imprinting. Int Immunol 8(6): 905‐15.
Taylor A, Verhagen J et al. (2006). Mechanisms of immune suppression by interleukin‐10 and transforming growth factor‐beta: the role of T regulatory cells. Immunology 117(4): 433‐42.
Taylor‐Robinson AW, Phillips RS et al. (1993). The role of TH1 and TH2 cells in a rodent malaria infection. Science 260(5116): 1931‐4.
Tebo AE, Kremsner PG et al. (2002). Low antibody responses to variant surface antigens of Plasmodium falciparum are associated with severe malaria and increased susceptibility to malaria attacks in Gabonese children. Am J Trop Med Hyg 67(6): 597‐603.
Teo YY, Fry AE et al. (2007). On the usage of HWE for identifying genotyping errors. Ann Hum Genet 71(Pt 5): 701‐3.
Teo YY, Fry AE et al. (2008). Assessing genuine parents‐offspring trios for genetic association studies. Human Heredity: In press.
Timmann C, Evans JA et al. (2007). Genome‐wide linkage analysis of malaria infection intensity and mild disease. PLoS Genet 3(3): e48.
Tishkoff SA, Varkonyi R et al. (2001). Haplotype diversity and linkage disequilibrium at human G6PD: recent origin of alleles that confer malarial resistance. Science 293(5529): 455‐62.
Tishkoff SA and Williams SM (2002). Genetic analysis of African populations: human evolution and complex disease. Nat Rev Genet 3(8): 611‐21.
Tobian AA, Mehlotra RK et al. (2000). Frequent umbilical cord‐blood and maternal‐blood infections with Plasmodium falciparum, P. malariae, and P. ovale in Kenya. J Infect Dis 182(2): 558‐63.
Troye‐Blomberg M, Riley EM et al. (1989). T and B cell responses of Plasmodium falciparum malaria‐immune individuals to synthetic peptides corresponding to sequences in different regions of the P. falciparum antigen Pf155/RESA. J Immunol 143(9): 3043‐8.
Troye‐Blomberg M, Olerup O et al. (1991). Failure to detect MHC class II associations of the human immune response induced by repeated malaria infections to the Plasmodium falciparum antigen Pf155/RESA. Int Immunol 3(10): 1043‐51.
Troye‐Blomberg M, Lepers JP et al. (1994). Presentation of the Plasmodium falciparum antigen Pf155/RESA to human T cells. Variations in responsiveness induced by antigen presenting cells from different but MHC class II identical donors. Immunol Lett 43(1‐2): 59‐66.
Tsuji M, Romero P et al. (1990). CD4+ cytolytic T cell clone confers protection against murine malaria. J Exp Med 172(5): 1353‐7.
Tuikue Ndam NG, Salanti A et al. (2005). High level of var2csa transcription by Plasmodium falciparum isolated from the placenta. J Infect Dis 192(2): 331‐5.
Urban BC, Ferguson DJ et al. (1999). Plasmodium falciparum‐infected erythrocytes modulate the maturation of dendritic cells. Nature 400(6739): 73‐7.
Urban BC, Mwangi T et al. (2001). Peripheral blood dendritic cells in children with acute Plasmodium falciparum malaria. Blood 98(9): 2859‐61.
References
113
Vafa M, Maiga B et al. (2007). Associations between the IL‐4 ‐590 T allele and Plasmodium falciparum infection prevalence in asymptomatic Fulani of Mali. Microbes Infect 9(9): 1043‐8.
van der Heyde HC, Huszar D et al. (1994). The resolution of acute malaria in a definitive model of B cell deficiency, the JHD mouse. J Immunol 152(9): 4557‐62.
Venet F, Pachot A et al. (2006). Human CD4+CD25+ regulatory T lymphocytes inhibit lipopolysaccharide‐induced monocyte survival through a Fas/Fas ligand‐dependent mechanism. J Immunol 177(9): 6540‐7.
Verra F, Mangano VD et al. (2008). The genetics of susceptibility to Plasmodium falciparum: from classical malaria resistance genes towards genome wide association studies. Parasite Immunol: Under review upon invitation.
von der Weid T, Honarvar N et al. (1996). Gene‐targeted mice lacking B cells are unable to eliminate a blood stage malaria infection. J Immunol 156(7): 2510‐6.
Waki S, Uehara S et al. (1995). Interferon‐gamma and the induction of protective IgG2a antibodies in non‐lethal Plasmodium berghei infections of mice. Parasite Immunol 17(10): 503‐8.
Walther M, Tongren JE et al. (2005). Upregulation of TGF‐beta, FOXP3, and CD4+CD25+ regulatory T cells correlates with more rapid parasite growth in human malaria infection. Immunity 23(3): 287‐96.
Walther B and Walther M (2007). What does it take to control malaria? Ann Trop Med Parasitol 101(8): 657‐72.
Weiss WR, Mellouk S et al. (1990). Cytotoxic T cells recognize a peptide from the circumsporozoite protein on malaria‐infected hepatocytes. J Exp Med 171(3): 763‐73.
Weiss WR, Sedegah M et al. (1993). The role of CD4+ T cells in immunity to malaria sporozoites. J Immunol 151(5): 2690‐8.
Williams TN (2006). Red blood cell defects and malaria. Mol Biochem Parasitol 149(2): 121‐7. Wirth DF (2002). The parasite genome. Biological revelations. Nature 419(6906): 495‐6. Wright S (1950). Genetic structure of populations. Br Med J 2(4669): 36. Yan H, Yuan W et al. (2002). Allelic variation in human gene expression. Science 297(5584): 1143. Ye S, Dhillon S et al. (2001). An efficient procedure for genotyping single nucleotide polymorphisms.
Nucleic Acids Res 29(17): E88‐8. Yi H, Zhen Y et al. (2006). The phenotypic characterization of naturally occurring regulatory CD4+CD25+
T cells. Cell Mol Immunol 3(3): 189‐95. Young K, Frodsham A et al. (2005). Inverse associations of human leukocyte antigen and malaria parasite
types in two West African populations. Infect Immun 73(2): 953‐5. Yuan HY, Chiou JJ et al. (2006). FASTSNP: an always up‐to‐date and extendable service for SNP function
analysis and prioritization. Nucleic Acids Res 34(Web Server issue): W635‐41. Zhang L, Cui X et al. (1992). Whole genome amplification from a single cell: implications for genetic
analysis. Proc Natl Acad Sci U S A 89(13): 5847‐51. Zhang K and Jin L (2003). HaploBlockFinder: haplotype block analyses. Bioinformatics 19(10): 1300‐1. Zheng SG, Wang JH et al. (2006). TGF‐beta requires CTLA‐4 early after T cell activation to induce FoxP3
and generate adaptive CD4+CD25+ regulatory cells. J Immunol 176(6): 3321‐9. Zilversmith M and Hartl DL (2005). Evolutionary history and population genetics of human malaria
parasites. Molecular Approaches to Malaria. Sherman IW. Washington, D.C., ASM Press: 95‐109.