
Disruption in honey bee (Apis mellifera) foraging flight ... · Partial solar eclipse of 23 Oct...
3
Bulletin of Insectology 70 (2): 315-320, 2017 ISSN 1721-8861 Disruption in honey bee (Apis mellifera) foraging flight activity during a partial solar eclipse shown by individual flight path tracking Bryan C. HAINS 1,2 , Heather GAMPER 1,3 1 Beekeepers' Guild of San Mateo County, Menlo Park, CA, USA 2 University of California, Berkeley, CA, USA 3 New York Bee Sanctuary, Callicoon, NY, USA Abstract Honey bee (Apis mellifera L.) foraging activity is dependent on solar and celestial cues. To better understand how bee flight activ- ity is influenced during a solar eclipse, individual departing and returning flights were quantitatively analyzed using a video-based tracking tool during a partial solar eclipse on 23 October 2014 in Woodside, California. Compared to a control (non-eclipse) day, there was a significant overall increase in foraging flight activity of 15% (1.16 vs. 1.01 baseline for day 1 and 2, respectively) at maximal solar obscuration (39%). Both departing and returning flights showed increased occurrence corresponding to the eclipse peak, followed by a gradual restoration of normal activity during eclipse resolution. Instantaneous flight activity was correlated (r = −0.63) with changes in global horizontal irradiance during the eclipse. These data provide greater insight into how subtle changes in skylight properties modulate foraging flight behaviour. Key words: eclipse, honey bee, flight analysis, foraging. Figure 1. Partial solar eclipse of 23 Oct 2014 (Espenak, 2014). Maximum solar obscuration at our apiary (in- dicated by a red dot) occurred at 15:17 local time. (In colour at www.bulletinofinsectology.org)
Transcript of Disruption in honey bee (Apis mellifera) foraging flight ... · Partial solar eclipse of 23 Oct...

Bulletin of Insectology 70 (2): 315-320, 2017 ISSN 1721-8861
Disruption in honey bee (Apis mellifera) foraging flight activity during a partial solar eclipse shown by individual
flight path tracking
Bryan C. HAINS1,2
, Heather GAMPER1,3
1Beekeepers' Guild of San Mateo County, Menlo Park, CA, USA
2University of California, Berkeley, CA, USA
3New York Bee Sanctuary, Callicoon, NY, USA
Abstract
Honey bee (Apis mellifera L.) foraging activity is dependent on solar and celestial cues. To better understand how bee flight activ-
ity is influenced during a solar eclipse, individual departing and returning flights were quantitatively analyzed using a video-based
tracking tool during a partial solar eclipse on 23 October 2014 in Woodside, California. Compared to a control (non-eclipse) day,
there was a significant overall increase in foraging flight activity of 15% (1.16 vs. 1.01 baseline for day 1 and 2, respectively) at
maximal solar obscuration (39%). Both departing and returning flights showed increased occurrence corresponding to the eclipse
peak, followed by a gradual restoration of normal activity during eclipse resolution. Instantaneous flight activity was correlated
(r = −0.63) with changes in global horizontal irradiance during the eclipse. These data provide greater insight into how subtle
changes in skylight properties modulate foraging flight behaviour.
Key words: eclipse, honey bee, flight analysis, foraging.
Figure 1. Partial solar eclipse of 23 Oct 2014 (Espenak,
2014). Maximum solar obscuration at our apiary (in-
dicated by a red dot) occurred at 15:17 local time.
(In colour at www.bulletinofinsectology.org)
Casella di testo
Authors’ addresses: Bryan C. HAINS (corresponding author, [email protected]), University of California, Berkeley, 1995 University Ave., Berkeley, CA 94704, USA; Heather GAMPER, New York Bee Sanctuary, Callicoon, NY 12723, USA. Received May 25, 2017. Accepted September 28, 2017.
317
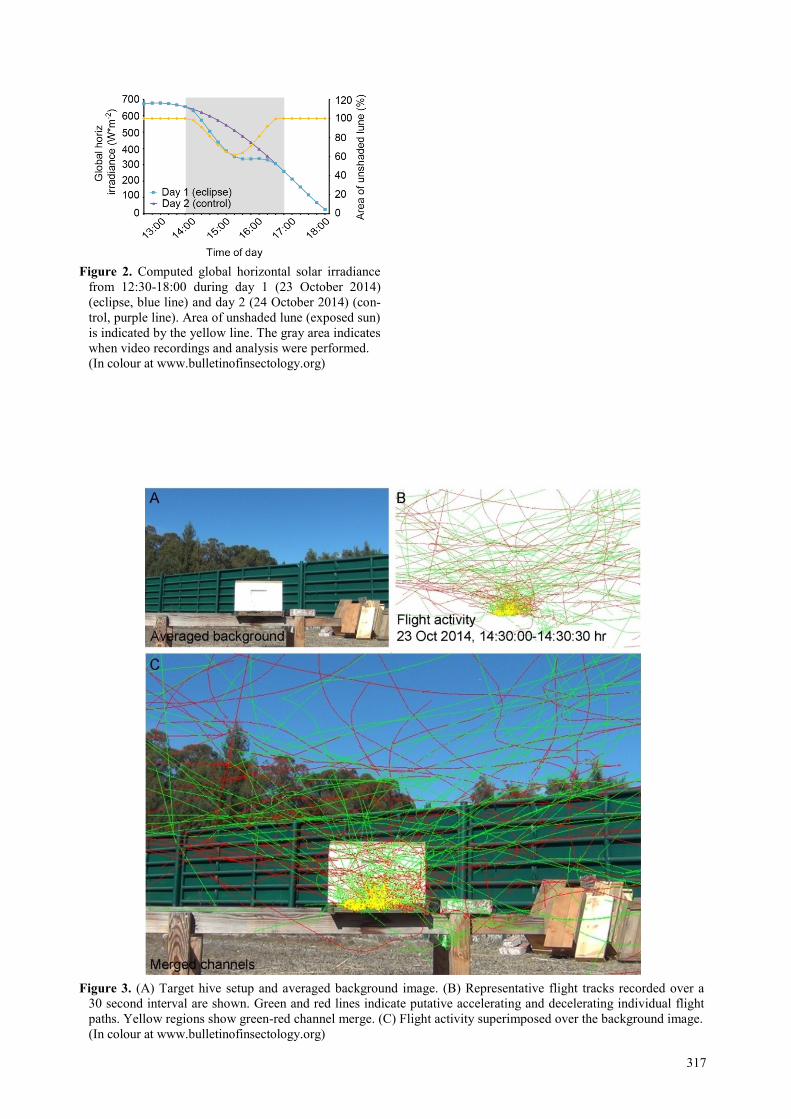
Figure 2. Computed global horizontal solar irradiance
from 12:30-18:00 during day 1 (23 October 2014)
(eclipse, blue line) and day 2 (24 October 2014) (con-
trol, purple line). Area of unshaded lune (exposed sun)
is indicated by the yellow line. The gray area indicates
when video recordings and analysis were performed.
(In colour at www.bulletinofinsectology.org)
Figure 3. (A) Target hive setup and averaged background image. (B) Representative flight tracks recorded over a
30 second interval are shown. Green and red lines indicate putative accelerating and decelerating individual flight
paths. Yellow regions show green-red channel merge. (C) Flight activity superimposed over the background image.
(In colour at www.bulletinofinsectology.org)
Capo Gallo
Raffo Rosso, Monte Cuccio e Vallone Sagana

318
Figure 4. Normalized flight activity during (A) day 1 (23
October 2014) and (B) day 2 (24 October 2014) quanti-
fied over 30 second intervals at time points indicated.
Total flight activity is shown in blue, decelerating
flights in red, and accelerating flights in green. Solar
obscuration is represented graphically for each day. (C)
Total normalized flight activity on days 1 and 2 show-
ing difference at each time point; black bars are differ-
ence values, arrow indicates peak eclipse point at 15:17.
(In colour at www.bulletinofinsectology.org)


![WEDNESDAY POSTERSWEDNESDAY POSTERS - dartmouth.eduhiddenmonsters/talks/posters_2.pdf · Luminous AGN Heavy ‘environmental’ obscuration time [Gyr] N gas m ... Ahn et al . 2012,](https://static.fdocuments.net/doc/165x107/5b5a17967f8b9a657c8e3a6f/wednesday-posterswednesday-posters-hiddenmonsterstalksposters2pdf-luminous.jpg)


