Electromagnetic dispersion modeling and measurements for ...

Dispersion Characteristics of Electromagnetic Wavein Magnetized One Dimensional Ferrite PhotonicCrystals with Mixed Field Con�gurationYOGESH SHARMA ( [email protected] )
SGT University: Shree Guru Gobind Singh Tricentenary University https://orcid.org/0000-0003-3902-2226Surendra Prasad
Banaras Hindu University Faculty of Science
Research Article
Keywords: Ferrite photonic crystal Photonic band gaps. Filling factor Dispersion curve. Phase index,Normalized parallel wave vector, External magnetic �eld
Posted Date: April 27th, 2021
DOI: https://doi.org/10.21203/rs.3.rs-391593/v1
License: This work is licensed under a Creative Commons Attribution 4.0 International License. Read Full License

Dispersion Characteristics of Electromagnetic Wave in Magnetized One Dimensional
Ferrite Photonic Crystals with Mixed Field Configuration
Yogesh Sharma*, Surendra Prasad
*Department of Physics, Faculty of Science, Shree Guru Gobind Singh Tricentenary (SGT) University, Gurgaon-
Badli Road Chandu, Budhera, Gurugram, Haryana 122505 INDIA
Department of Physics, Institute of Sciences, Banaras Hindu University, Varanasi-221005, India
Abstract:
The dispersion characteristics and phase index of electromagnetic waves in two types of magnetized one
dimensional ferrite photonic crystals with mixed field configuration are studied for transverse magnetic mode. The
dispersion equation and formula for phase index are derived using transfer matrix method. It is found that in type-1
& type-2 magnetized one dimensional ferrite photonic crystals, photonic band gaps (PBGs) show dependence on ����� and ���� respectively. The PBGs corresponding to thinner YIG layer are at higher frequency side at fixed �.
The variation of frequency-filling factor shows that PBGs occur in the form of lobe for both types. It is observed that
the phase index is strongly influenced by external magnetic fields, � and filling factor. It is demonstrated that PBGs
in phase index occur in the form of lobes at fixed �. Also, with decrease in the magnitude of phase index, number of
lobe increases. The phase index, field and frequency plots show that there are multiple peaks in the PBGs of phase
index in the lower frequency.
Keywords: Ferrite photonic crystal Photonic band gaps. Filling factor Dispersion curve. Phase index, Normalized
parallel wave vector, External magnetic field
1. Introduction
Over the decades, magneto-optical photonic crystals (MOPhCs) have been active field of
extensive research around the globe due to their unique magneto-optical properties. These
MOPhCs structures have shown promising technical applications viz. cavity enhanced Faraday
rotation [1-2], non-reciprocal super-prisms [3], ultra compact isolator [4-5], highly-directive
miniature antenna arrays [6], non-reciprocal propagation [7], electromagnetic (EM)
unidirectionality [8-9], integrated devices [10-11], etc. The EM responses of these composite
periodic structures are externally controllable and the dispersion properties of EM waves show
external field dependence. These MOPhCs has periodic arrangement of magnetic layers and
other media such as dielectrics, semiconductor and metal layers of various geometries. The
ferrite based photonic crystals [12-17], also known as ferrite photonic crystals (FPhCs),
waveguides [18] and transmission lines [19] are new hot spot in the photonic research due to
their unique characteristics. These structures have ferrites as one of the constituent layer in their
unit cell. Z. Yu et al. [12] have shown one-way total reflections in one dimensional (1-D)
MOPhCs. Ferrite based polarization independent circulator is recently reported [13].
The properties of garnet based MOPhCs are investigated experimentally by A. M. Grishin et
al. [14] and have tailored large Faraday rotation and acceptable transmittance from visible to
infrared. J.-X. Liu et al. [15] studied the filtering properties of FPhCs.

*Author to whom correspondence should be addressed. Electronic mail: [email protected]
K. Bi et al. [16] have simulated the tunability of dielectric properties of metamaterials based
on ferrite-dielectric and verified experimentally. Magnetically tunable circulator in terahertz
frequency regime was reported by F. Fan et al. [17]. V. I. Fesenko et al. [18] made extensive
study on control of single mode operation in a circular wave guide filled with ferrites. N. Dib et
al. [19] simulated the propagation characteristics of cylindrical transmission lines that contain
magnetized ferrite material using the finite-difference time-domain method and the spectral-
domain analysis.
Very recently, Sharma and Prasad [20-21] have investigated the dispersion properties of
EM waves in magnetized 1-D FPhCs structures for transverse electric (TE) and transverse
magnetic (TM) modes for various field configurations such as longitudinal [20] and transverse
magnetization configurations [21]. They have also explored the EM wave propagation in
magnetized 1-D FPhCs structures for TE mode in transverse magnetization configuration [22].
They have shown that phase index and dispersion properties of EM waves can be controlled by
external magnetic fields, incident angle and filling factor. Also, these magnetized 1-D FPhCs
structures behave as dielectric. In these composite structures, ferrites in the sub-layer of unit cell
of 1-D FPhCs structures are either in transverse or longitudinal magnetization configurations. It
would be interesting to study dispersion property of EM waves in such structures for mixed field
configurations.
In this paper, we considered two types of magnetized 1-D FPhCs structures. In the first
type of the structure, we have yttrium iron garnet (YIG) in longitudinal magnetization and nickel
(NI) ferrite in transverse magnetization in the unit cell of the 1-D FPhCs structure. In other type,
we have swapped the arrangement of the YIG layer and NI ferrites. We have tried to investigate
that if we have composite periodic structure with YIG and NI in the unit cell with mixed
configurations, then how the dispersion behavior of EM waves will modify. For the analysis, we
have used well known transfer matrix method. This paper is organized as follows: in section 1
introduction, in Section 2, theoretical formulation and approach are given. The other necessary
formulae used in this paper are also presented. Section 3 is devoted to results and discussion. A
conclusion is drawn in section 4.
2. Theoretical formulation and approach
The dispersion behavior of EM waves is investigated in two types of magnetized 1-D FPhCs.
The unit cell of type-1 (Fig. 1) 1-D FPhCs has two sub-layers. The sub-layer 1 consists of YIG
ferrite which is kept in longitudinal magnetization configuration and sub-layer 2 has NI ferrite
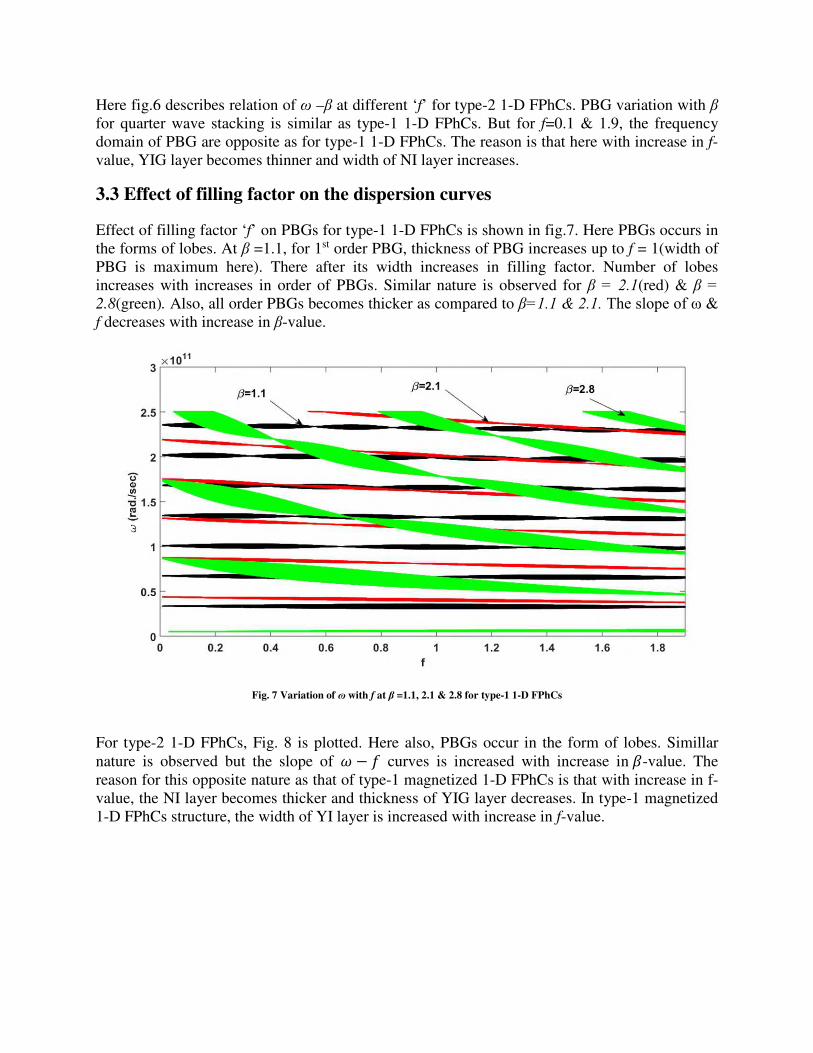
which is in transverse magnetization. The type-2 1-D FPhCs (Fig. 2) has NI ferrite in
longitudinal magnetization in one sub-layer and YIG ferrite in transverse magnetization in other
sub-layer of the unit cell. The thicknesses of YIG and NI ferrites sub-layers in type-1 1-D FPhCs
are ′�′ and ′�′ respectively. Type-2 1-D FPhCs has NI and YIG ferrites with thicknesses as ′�′ and ′�′ respectively.
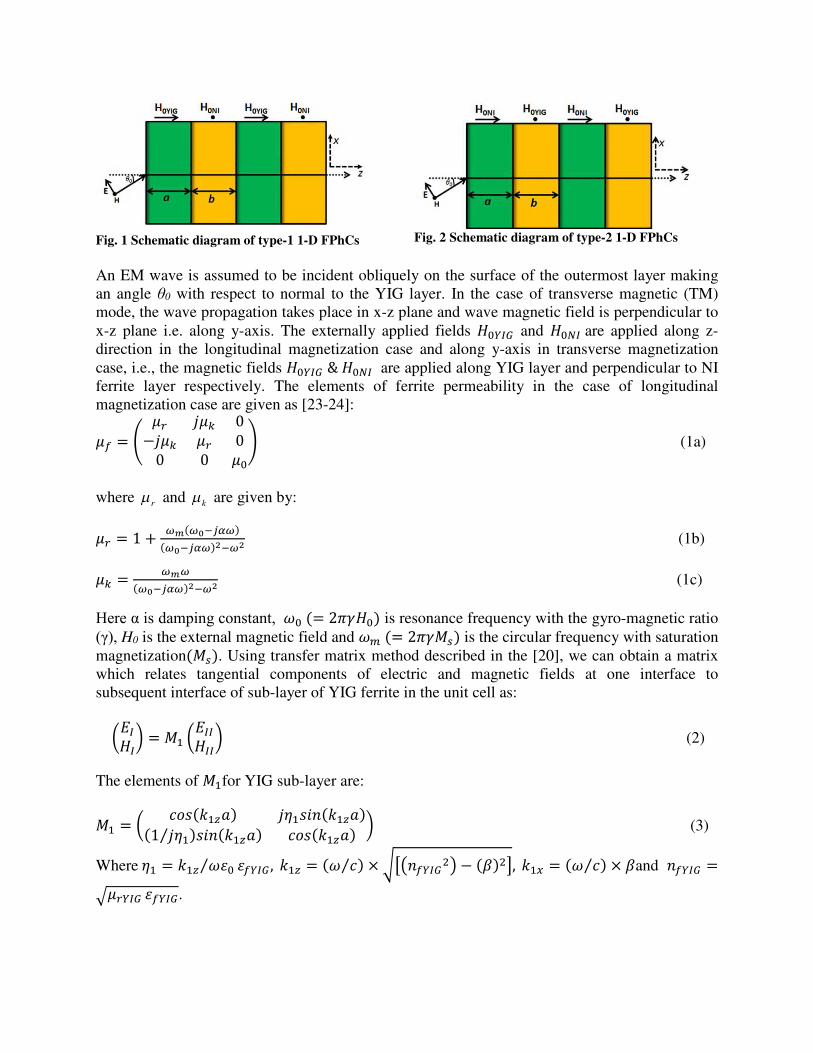
Fig. 1 Schematic diagram of type-1 1-D FPhCs
Fig. 2 Schematic diagram of type-2 1-D FPhCs
An EM wave is assumed to be incident obliquely on the surface of the outermost layer making
an angle θ0 with respect to normal to the YIG layer. In the case of transverse magnetic (TM)
mode, the wave propagation takes place in x-z plane and wave magnetic field is perpendicular to
x-z plane i.e. along y-axis. The externally applied fields ����� and ���� are applied along z-
direction in the longitudinal magnetization case and along y-axis in transverse magnetization
case, i.e., the magnetic fields ����� & ���� are applied along YIG layer and perpendicular to NI
ferrite layer respectively. The elements of ferrite permeability in the case of longitudinal
magnetization case are given as [23-24]: �� = � �� ��� 0−��� �� 00 0 ��� (1a)
where r and k are given by: �� = 1 +��(������)
(������)���� (1b) �� =���
(������)���� (1c)
Here α is damping constant, �� (= 2����) is resonance frequency with the gyro-magnetic ratio
(γ), H0 is the external magnetic field and �� (= 2����) is the circular frequency with saturation
magnetization(��). Using transfer matrix method described in the [20], we can obtain a matrix
which relates tangential components of electric and magnetic fields at one interface to
subsequent interface of sub-layer of YIG ferrite in the unit cell as:
������ = �� �������� (2)
The elements of ��for YIG sub-layer are:
�� = � ���(����) ������(����)
(1 ���⁄ )���(����) ���(����)� (3)
Where �� = ��� ���⁄ ����� , ��� = (� �⁄ ) × ���������� − (�)��, ��� = (� �⁄ ) × �and ����� =������ �����.

We can also express ferrite permeability for transverse magnetization case [23-24]. We obtain
transfer matrix elements for the case of transverse magnetization configuration for NI ferrite sub-
layer of unit cell for TM mode [21] as follows:
�� = � ���(����) ������(����)
(1 ���⁄ )���(����) ���(����)� (4)
�� = ��� �������⁄ , ��� = (� �⁄ ) × ��������� − (�)�� , ��� = (� �⁄ ) × � ��� ���� =��� ���� . The transfer matrix elements of the unit cell can be obtained by multiplying �� and �� as � = ����. By extracting the elements of M, the dispersion relation can be obtained type-
1 1-D FPhCs as: ���(��) = ���(����)���(����) − �� � ��������������� +��������������� � ���(����)���(����) (5)
Where � is Bloch wave number. Similarly, we can obtain dispersion relation for type-2 1-D
FPhCs. The phase index of the considered structure is computed using the following expression: ɸ = �� �⁄ (6)
3. Results and Discussion:
In the article, we have numerically investigated the dispersion properties and phase index of
type-1 & type-2 magnetized 1-D FPhCs using equations (5) and (6). The thicknesses of YIG and
NI layers are � = (��� 4�����⁄ ) and � = (2 − �)�� 4����⁄ where f is the filling factor, �� =(2�� �����)⁄ , ����� = 2������ , ����� = (2.8 × 10� × �����). The resonance frequencies
corresponding to YIG and NI ferrites are given by ������ = 2������� , ������ = (2.8 ×
10� × ������ , ����� = 2������ , ����� = (2.8 × 10� × ����) respectively. The circular
frequency corresponding to NI layer is ���� = 2����� , ���� = (2.8 × 10� × ����) with
saturation magnetization ���� . Normalized parallel wave vector, � = ��� (� �⁄ ) ⁄ is same for the
YIG and NI ferrite layer. The dielectric constant, saturation magnetization (4Ms) and damping
constant (α) of YIG are 15.0, 1780 Oe and 0.0002 and for Ni ferrites are 9.0, 500 Oe and 0.0008
respectively [23]. The trans-tech numbers of YIG ferrite and NI ferrite are G-113 and TT2-113
respectively [23]. In the paper, Oe denotes Oersted. For type-2 1D FPhCs structure � =(��� 4����⁄ ) and� = (2 − �)�� 4�����⁄ . The value of �� is same for type-1 and type-2 1-D
FPhCs structure.
3.1 Effect of magnetic fields on the PBGs:
To observe the effect of magnetic fields on the band structure with different β at quarter wave
staking (f=1), Figs. 3 & 4 are plotted. Fig. 3 shows the variation of photonic band gaps (PBGs)
with H0YIG for type-1 magnetized 1-D FPhCs structure. At β=1.1 (black), with increases in H0YIG,
frequency of 1st PBGs is shifted towards higher frequency domain. The width of 2nd PBGs
increases with increases in H0YIG and frequency domain remains nearly constant. Similar nature

is observed for β=2.1 (red). For β=2.8 (green), new PBGs occur between ω~0 to 1 ×10¹⁰
rad./sec. Also overlapping of PBG occurs in 1st PBG. For 2nd PBG, nature is contradictory as
compared to β (=1.1 & 2.1). It is also found that width and frequency domain of PBGs remain
nearly constant with increase in H0NI (not shown here).
Fig. 3 Effect of magnetic field H0YIG on PBGs for various β (=1.1, 2.1 & 2.8) at fixed H0NI =155 Oe at f (=1) in type-1 1-D FPhCs
For type-2 1-D FPhCs, fig. 4 is plotted. It is found that for β=2.8(green), zero order PBGs is
overlapped with 1st order PBG and PBG is smaller as compared to 1st PBG in type-1 1-D FPhCs.
For β=1.1 & 2.1 width of PBG is small. The frequency domain of 1st PBG is shifted towards
higher frequency domain with increase in H0NI. In this case also, there is no effect of transverse
magnetic field H0YIG on the thickness & frequency domain of PBG (not shown).
Fig. 4 Effect of magnetic field H0NI on PBGs for β (=1.1, 2.1, 2.8) at fixed H0YIG =46 Oe at f (=1) for type-2 1-D FPhCs

3.2 Effect of normalized parallel wave vector (β) on the dispersion curves
Fig. 5 Variation of ω with β at f= (0.1, 1 & 1.9) for type-1 1-D FPhCs
Fig.5 shows variation of � & � at different values of f for ����� = 46 �� & ���� = 155 �� for
type-1 1-D FPhCs. At f=1 (red), frequency domain of PBG is shifted towards higher frequency
domain with increases in β. Also width of PBG decreases with increases in β. After � ≈ 2.38
(Brewster angle), PBGs thickness increases. For, f=0.1 & 1.9, PBGs shows nearly similar nature.
At fixed β, PBGs is shifted to higher frequency with decreases in f-value. The slope of ω-β curve
decreases with increase in filling factor. So, for thicker YIG layer, Phase velocity (ω / β) along
interface decreases. Here Zeroth order PBGs occur correspondingly to f=1.9 (green) only.
Fig. 6 Variation of ω with β at f (=0.1, 1 & 1.9) for type-2 1-D FPhCs
Here fig.6 describes relation of ω –β at different ‘f’ for type-2 1-D FPhCs. PBG variation with β
for quarter wave stacking is similar as type-1 1-D FPhCs. But for f=0.1 & 1.9, the frequency
domain of PBG are opposite as for type-1 1-D FPhCs. The reason is that here with increase in f-
value, YIG layer becomes thinner and width of NI layer increases.
3.3 Effect of filling factor on the dispersion curves
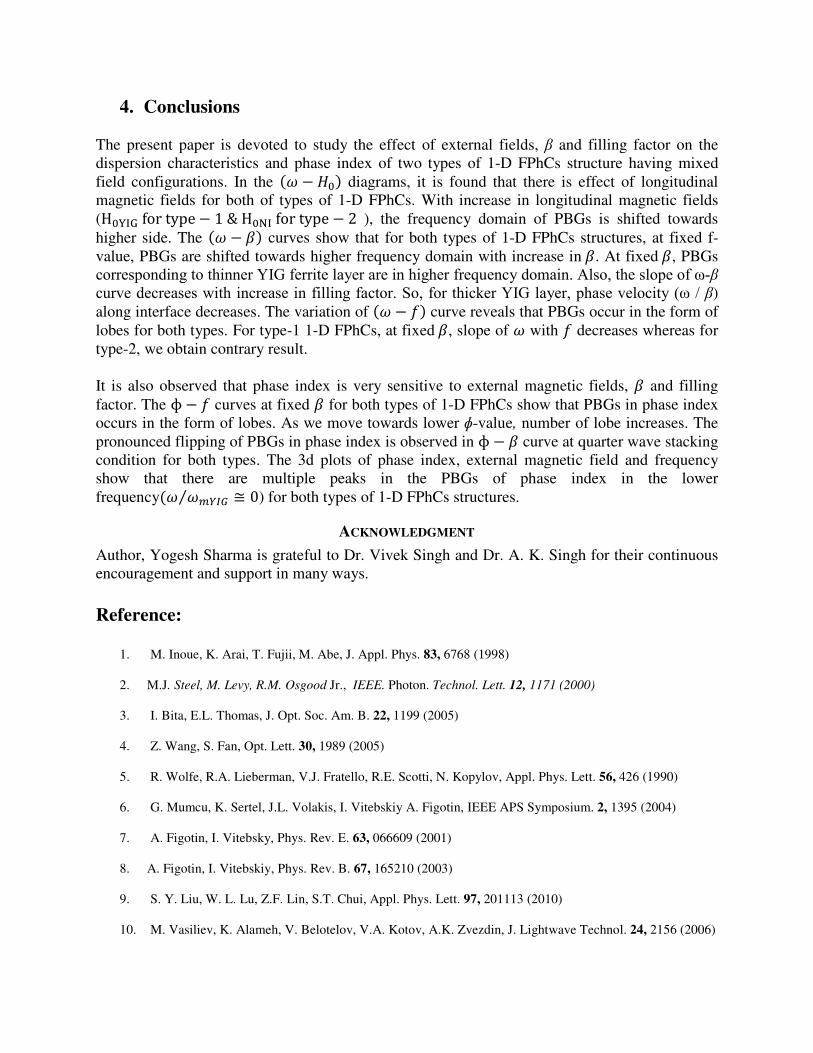
Effect of filling factor ‘f’ on PBGs for type-1 1-D FPhCs is shown in fig.7. Here PBGs occurs in
the forms of lobes. At β =1.1, for 1st order PBG, thickness of PBG increases up to f = 1(width of
PBG is maximum here). There after its width increases in filling factor. Number of lobes
increases with increases in order of PBGs. Similar nature is observed for β = 2.1(red) & β = 2.8(green). Also, all order PBGs becomes thicker as compared to β=1.1 & 2.1. The slope of ω & f decreases with increase in β-value.
Fig. 7 Variation of ɷ with f at β =1.1, 2.1 & 2.8 for type-1 1-D FPhCs
For type-2 1-D FPhCs, Fig. 8 is plotted. Here also, PBGs occur in the form of lobes. Simillar
nature is observed but the slope of � − � curves is increased with increase in �-value. The
reason for this opposite nature as that of type-1 magnetized 1-D FPhCs is that with increase in f-
value, the NI layer becomes thicker and thickness of YIG layer decreases. In type-1 magnetized
1-D FPhCs structure, the width of YI layer is increased with increase in f-value.

Fig. 8
Variation of ɷ with f at β =1.1, 2.1 & 2.8 for type-2 1-D FPhCs
3.4 Variation in phase index (ɸ) with the filling factor at β= (1.1, 2.1 & 3.1)
The phase index of the considered structures is computed using equation (6). Figs. 9 and 10 show
the phase index variation with filling factor at ����� = 46 �� and ���� = 155�� at different �
for type-1 & type-2 1-D FPhCs structures. In Fig. 9, at � = 1.1, PBGs in phase index occurs in
the form of lobes. Also, with increase in f-value, magnitude of ɸ increases. As we move towards
lower ɸ-value, number of lobe increases. Similar nature is observed for other � values. Zero ɸ-value is accessible to EM waves in considered frequency range at � = 1.1, 2.1 & 2.8 at all f-
value.
Fig. 9 Variation of ɸ with f at β = (1.1, 2.1 & 2.8) for type-1 1-D FPhCs

Fig.10 is plotted to show the variation of ɸ with f at β (=1.1, 2.1 & 2.8) for type-2 FPhCs. The
PBGs in phase index also occur in the form of lobes. But the slope of ɸ with f-value is opposite
to type-1 1-D FPhCs structure. The reason is that with increase in f-value, NI layer becomes
thicker whereas in type-11-D FPhCs structure, NI becomes thinner.
Fig. 10 Variation of ɸ with f at β =1.1, 2.1 & 2.8 for type-2 1-D FPhCs
3.4 Variation in phase index (ɸ) at f= (0.1, 1 & 1.9) with β
Figs. 11 is plotted to shows the variation of ɸ with β at different f (= 0.1, 1 & 1.9) for type-1 1-D
FPhCs structure.
Fig. 11 Variation of ɸ with β at f = (0.1, 1 & 1.9) for type-1 1-D FPhCs

At f=0.1 (black), with increase in �, the thickness of PBGs in phase index is reduced. At � =2.38, flipping of PBGs occurs. Similar nature is observed for f = 1 (red) & 1.9 (green). At
quarter wave stacking (f = 1), the flipping of PBGs in phase index is clearly seen. Also, PBGs in
phase is thicker as compared to f=0.1 & 1.9.
Fig. 12 is also plotted for type-2 FPhCs with β at different f (= 0.1, 1.1 & 1.9). If we compare
figs. (11 & 12), it is observed that lower filling factor (f=0.1) PBGs are shifted to upper side of
f=1 case.
Fig. 12 Variation of ɸ with β at f = (0.1, 1 & 1.9) for type-2 1-D FPhCs
3.6 Variation of phase index (ɸ) with external magnetic fields
To make deep insight of phase index ɸ with external magnetic fields at different values of �, we
have shown 3-d plots (Figs. 13 & 14) for type-1 & type-2 1-D FPhCs structures. These figures
are plotted at quarter wave stacking condition. On x-axis, normalized frequency (� �����⁄ ), on
y-axis, ����� and on z-axis, phase index ɸ are displayed. In Fig. 13, it is observed that phase
index ɸ is very sensitive function of �, � and �����. In the lower frequency regime (� �����⁄ ≅0), overlapping of PBGs in phase index is observed. After that PBGs in phase index occur at
different frequency at different magnitude for different values of �. At fixed �����, PBGs in
phase index is shifted towards higher frequency domain when � is increased from 1.1 (black) to
2.8 (green). It is interesting also that PBGs in phase index is reduced to zero at lower frequency

range (� �����⁄ ≅ 0) and multiple PBGs are observed as peaks for 1.1 (black) to 2.8 (green) in
the vicinity of � �����⁄ ≅ 0 . In this case ���� is taken as 155 Oe.
Fig. 13 Variation of ɸ with ����� at different β with the normalized frequency (� �����⁄ ) for type-1 1-D FPhCs
In type-2 1-D FPhCs structure (Fig. 14), these peaks in the lower frequency(� �����⁄ ≅ 0) are
clearly visible for � = 2.1 (red).
Fig. 14 Variation of ɸ with ����� at different β with the normalized frequency (� �����⁄ ) for type-2 1-D FPhCs
4. Conclusions
The present paper is devoted to study the effect of external fields, β and filling factor on the
dispersion characteristics and phase index of two types of 1-D FPhCs structure having mixed
field configurations. In the (� − ��) diagrams, it is found that there is effect of longitudinal
magnetic fields for both of types of 1-D FPhCs. With increase in longitudinal magnetic fields
(H���� for type − 1 & H��� for type − 2 ), the frequency domain of PBGs is shifted towards
higher side. The (� − �) curves show that for both types of 1-D FPhCs structures, at fixed f-
value, PBGs are shifted towards higher frequency domain with increase in �. At fixed �, PBGs
corresponding to thinner YIG ferrite layer are in higher frequency domain. Also, the slope of ω-β
curve decreases with increase in filling factor. So, for thicker YIG layer, phase velocity (ω / β)
along interface decreases. The variation of (� − �) curve reveals that PBGs occur in the form of
lobes for both types. For type-1 1-D FPhCs, at fixed �, slope of � with � decreases whereas for
type-2, we obtain contrary result.
It is also observed that phase index is very sensitive to external magnetic fields, � and filling
factor. The ɸ − � curves at fixed � for both types of 1-D FPhCs show that PBGs in phase index
occurs in the form of lobes. As we move towards lower ɸ-value, number of lobe increases. The
pronounced flipping of PBGs in phase index is observed in ɸ − � curve at quarter wave stacking
condition for both types. The 3d plots of phase index, external magnetic field and frequency
show that there are multiple peaks in the PBGs of phase index in the lower
frequency(� �����⁄ ≅ 0) for both types of 1-D FPhCs structures.
ACKNOWLEDGMENT
Author, Yogesh Sharma is grateful to Dr. Vivek Singh and Dr. A. K. Singh for their continuous
encouragement and support in many ways.
Reference:
1. M. Inoue, K. Arai, T. Fujii, M. Abe, J. Appl. Phys. 83, 6768 (1998)
2. M.J. Steel, M. Levy, R.M. Osgood Jr., IEEE. Photon. Technol. Lett. 12, 1171 (2000)
3. I. Bita, E.L. Thomas, J. Opt. Soc. Am. B. 22, 1199 (2005)
4. Z. Wang, S. Fan, Opt. Lett. 30, 1989 (2005)
5. R. Wolfe, R.A. Lieberman, V.J. Fratello, R.E. Scotti, N. Kopylov, Appl. Phys. Lett. 56, 426 (1990)
6. G. Mumcu, K. Sertel, J.L. Volakis, I. Vitebskiy A. Figotin, IEEE APS Symposium. 2, 1395 (2004)
7. A. Figotin, I. Vitebsky, Phys. Rev. E. 63, 066609 (2001)
8. A. Figotin, I. Vitebskiy, Phys. Rev. B. 67, 165210 (2003)
9. S. Y. Liu, W. L. Lu, Z.F. Lin, S.T. Chui, Appl. Phys. Lett. 97, 201113 (2010)
10. M. Vasiliev, K. Alameh, V. Belotelov, V.A. Kotov, A.K. Zvezdin, J. Lightwave Technol. 24, 2156 (2006)

11. M. Zamani, and M. Ghanaatshoar, Opt. Eng. 54, 097103 (2015)
12. Z. Yu, Z. Wang, Appl. Phys. Lett. 90, 121133 (2007)
13. X. Xi, M. Lin, W. Qiu, Z. Ouyang, Q. Wang, Q. Liu, Scientific Report. 8, 1 (2018)
14. A.M. Grishin, S.I. Khartsev, J. Magn. Soc. Jpn. 32, 140 (2008)
15. J.-X. Liu, H.-Y. Xu, Z.-K. Yang, X. Xie, Y. Zhang, H.-W. Yang, Plasmonics. 12, 971 (2017)
16. K. Bi, K. Huang, L.Y. Zeng, M.H. Zhou, Q. M. Wang, Y. G. Wang, M. Lei, PLOS ONE. 10, 1 (2015)
17. F. Fan, S. -J. Chang, C. Niu, Yu Hou, X. –H. Wang, Opt. Commun. 285, 3763 (2012)
18. V.I. Fesenko, V.R. Tuz, I.V. Fedorin, H.-Bo Sun, V.M. Shulga, W. Han, J. Electromag. Wave. 31, 1265
(2017)
19. N. Dib, A. Omar, IEEE Trans. Microw. Theory Tech. 50, 1730 (2002)
20. Y. Sharma, and S. Prasad, Superlattice Microst. 120, 463 (2018)
21. Y. Sharma, and S. Prasad, Eur. Phys. J. D. 73, 166 (2018)
22. Y. Sharma, S. Prasad, J Supercond Nov Magn (2018). https://doi.org/10.1007/s10948-018-4904-4
23. D. M. Pozar, Microwave Engineering, 3rd ed. (Wiley publication New York, 2004)
24. M. Igarashi, Y. Naito, IEEE. Transactions on Magnetics. 13, 1664 (1997)

Figures
Figure 1
Schematic diagram of type-1 1-D FPhCs
Figure 2
Schematic diagram of type-2 1-D FPhCs

Figure 3
Effect of magnetic �eld H0YIG on PBGs for various β (=1.1, 2.1 & 2.8) at �xed H0NI =155 Oe at f (=1) intype-1 1-D FPhCs

Figure 4
Effect of magnetic �eld H0NI on PBGs for β (=1.1, 2.1, 2.8) at �xed H0YIG =46 Oe at f (=1) for type-2 1-DFPhCs
Figure 5
Variation of ω with β at f= (0.1, 1 & 1.9) for type-1 1-D FPhCs

Figure 6
Variation of ω with β at f (=0.1, 1 & 1.9) for type-2 1-D FPhCs
Figure 7

Variation of with f at β =1.1, 2.1 & 2.8 for type-1 1-D FPhCs
Figure 8
Variation of with f at β =1.1, 2.1 & 2.8 for type-2 1-D FPhCs
Figure 9

Variation of with f at β = (1.1, 2.1 & 2.8) for type-1 1-D FPhCs
Figure 10
Variation of with f at β =1.1, 2.1 & 2.8 for type-2 1-D FPhCs

Figure 11
Variation of with β at f = (0.1, 1 & 1.9) for type-1 1-D FPhCs
Figure 12
Variation of with β at f = (0.1, 1 & 1.9) for type-2 1-D FPhCs

Figure 13
Variation of with H_0YIG at different β with the normalized frequency (ω⁄ω_mYIG ) for type-1 1-DFPhCs
Figure 14
Variation of with H0YIG at different β with the normalized frequency (ω⁄ω_mYIG ) for type-2 1-D FPhCs