
SELECTIVE CONTROL OF EGYPTIAN BROOMRAPE (OROBANCHE AEGYPTIACA PERS

Dispersal biology of Orobanche ramosa in South Australia
Master of Science
Thesis
Emma L. Ginman
School of Earth and Environmental Science
Discipline of Environmental Biology
The University of Adelaide
December 2009

Page 60
Chapter 4. Wind tunnel investigation of
Orobanche ramosa dispersal by wind
Introduction
The seed morphology of O. ramosa suggests that wind is likely to be a dispersal
mechanism (Howe and Smallwood 1982): seeds are small in size (3-6 µg), have a
complex surface morphology (see Figure 3.1), but lack elaborate wings and plumes
often associated with wind dispersal. Kuijt (1969) suggested that the concave cavities
on the surface of Orobanche spp. seeds may assist them to lift up in wind.
The size of Orobanche spp. seeds places them in the ‘dust propagules’ category,
along with the Orchidaceae family (Arditti and Ghani 2000; Cousens et al. 2008).
While Orobanche spp. seldom appear in dispersal literature, the Orchideaceae are
comparatively well studied. For example Arditti and Ghani (2000) reviewed the
physical characteristics and fecundity of 20 orchid genera and related those to likely
dispersal mechanisms (mainly wind and water). Murren and Ellison (1998)
documented the size and shape of the orchid Brassavola nodosa (cigar-shaped seeds,
1.60 µg) and examined wind dispersal in a laboratory setting. B. nodosa seeds were
found to travel up to 7 m at very low wind velocities (mean wind velocity of
1.25 m s-1, height unreported), and greater numbers of seed travelled longer distances
when the height of release increased. Orchid seed dispersal was also investigated by
Machon et al. (2003) who found that most of the Spiranthes spiralis (L.) Chevall.
seeds were detected within 0.15 m of the source. They also noted a low recovery rate
of seeds in traps, trapping around 2% of the estimated total seeds available. The wind
conditions at the time of trapping were not reported (Machon et al. 2003).
Species of Striga parasitise graminaceuos crops and have similar fecundity, seed
longevity and seed size to Orobanche spp. (Musselman and Press 1995). Berner et al.
(1994) trapped seeds of Striga hermonthica (Del.) Benth. at a distance of 12 m from
the host plant. They also found seeds in traps within a S. hermonthica infestation at 2
m height, but none at 3 m and none placed at similar heights outside the infestations.
The wind conditions at the time of trapping were also not reported (Berner et al.
1994).

Chapter 4: Wind Tunnel
Page 61
Bullock and Clarke (2000) measured wind dispersal of the small-seeded Calluna
vulgaris and Erica cinerea in English grasslands. They found that the vast majority
of seeds were trapped within 0.8 m of the parent bush. However their main aim was
to document long-distance dispersal, and the maximum found was in a trap at 80 m
from seed source (Bullock and Clarke 2000).
Wind tunnels have been used for the last 20 years, under laboratory and field
conditions, predominately to investigate erosion (Findlater et al. 1990; Raupach and
Leys 1990; Leys and Raupach 1991; Shao et al. 1993; Leys et al. 1996; Eldridge and
Leys 2003) and crop damage by sandblasting (Bennell et al. 2007). More recently
wind tunnels have been used to examine dispersal of plant propagules (Eldridge and
Leys 1999; Gravuer et al. 2003; Dauer et al. 2006; Baker and Beck 2008). Field
based wind tunnels allow control over the wind velocity and direction applied to the
propagules, whilst maintaining realistic surface conditions.
This chapter investigates the effects of wind speed and ground cover on seed
dispersal of O. ramosa.
Methods
A factorial field experiment of two ground cover treatments (stubble and bare
ground) by three wind velocities was undertaken.
Field site
The study site was located 71 km east of Adelaide, near Mannum, South Australia,
(34.91°S, 139.40°E) (see map Figure 1.1 in Chapter 1), on a farming property within
the South Australian Branched Broomrape quarantine zone.
The field experiment was conducted from 28 February to 3 March 2005.
Site preparation
The experimental field site was a 34.5 x 20 m area of wheat (variety ‘Krichauff’)
sown approximately seven months prior. The field site was divided into two sets of
12 experimental plots, each 5.5 x 1.5 m, with a 1.5 m buffer alongside each plot and
a 9 m wide roadway down the centre of the field site separating each strip of 12 plots
(Figure 4.1).

Chapter 4: Wind Tunnel
Page 62
Plots were divided into four replicate blocks, and within those blocks ‘stubble’ or
‘bare’ plots were randomly assigned. Stubble plots were cut to 0.2 m height with a
sickle-bar mower attached to a tractor. The resultant stubble was sparse, irregularly
spaced, and ≤ 0.2 m in height (Figure 4.2). Bare plots were mowed with a hand-
pushed rotary slasher and cultivated with a tyne plough pulled by a tractor, resulting
in a surface of loose soil, free of vegetation cover. Bare ground is classed ‘erodible’
and cereal stubble ‘stable’ in the event of a dust storm (Butler et al. 1995).
Wind tunnel
A field-based, portable wind tunnel was used to apply a variety of wind velocities (u)
with the resultant seed dispersal measured by a number of trapping techniques
(described below). Raupach and Leys (1990) describe the wind tunnel design in
detail including flow conditioning, and a schematic diagram taken from that paper is
reproduced in Figure 4.3. The tunnel consisted of a working section of 7.2 m in
length, 0.9 m high and 1.2 m wide. The first 2 m of the length of the working section
was covered by a wooden board as part of the flow conditioning; the remaining
5.2 m length was the experimental section open to the ground. A 56 kW diesel
engine turned the 1.5 m axial fan, both mounted on a trailer. A hydraulic crane also
mounted on the trailer was used to lower the working section of the tunnel onto the
ground. The wind tunnel was capable of producing wind velocities of up to
50 km h-1.
Pitot-static tubes (Dwyer Instruments, Inc., Michigan City) were located 1 m from
the open end of the tunnel where wind velocity (uz) was measured at six heights
above the ground surface (z = 0.05, 0.10, 0.15, 0.20, 0.25 and 0.60 m).
Wind velocities
Horizontal wind velocity (u) within the tunnel was applied with three wind
treatments, by setting the turning speed of the fan to 1000, 1300 and 1600 rpm.
These three wind treatments were assumed to equate to low, medium and high wind
velocities. Thus the 2-factorial experiment contained six treatments (bare-low, bare-
medium, bare-high, stubble-low, stubble-medium, and stubble-high) randomly
allocated within four replicate blocks.
For each experimental plot the wind tunnel was run for 60 s once the target fan speed
had been reached and after addition of the seeds.

Chapter 4: Wind Tunnel
Page 63
The roughness of a surface affects how wind passes over it. The rougher the surface,
the more friction or drag is created, thus slowing down the wind velocity near the
surface. For a given wind velocity, the friction created by the surface will reduce the
velocity of the wind to zero at some height above that surface; surface roughness
length (z0) is a calculated value for that height, reported in mm. Surface roughness
length was calculated for all wind tunnel runs to describe the surface roughness
generated in the experimental plots, and for use in the calculation of the wind
velocity at 10 m above the surface.
Friction velocity (u*) is a measure of the velocity gradient adjacent to a surface,
reported in m s-1.
Surface roughness length (z0) and friction velocity (u*) were derived from tunnel
measurements of velocity (u) and height of measurement (z) using Equation 1, from
Leys and Raupach (1991):
Equation 1
where:
z is the height above mean ground level (m),
u(z) is the wind velocity at height z (m s-1),
u* is the friction velocity (m s-1),
k is the von Karman constant (assumed to be 0.4), and
z0 is the surface roughness length (also called aerodynamic roughness)
(calculated in m, reported here in mm).
As described above, wind velocities are affected by surface roughness, so direct
comparisons between wind velocities at heights within the tunnel for bare ground
and stubble plots are generally unrealistic. To make comparisons between treatments
with different degrees of roughness (such as bare ground versus stubble plots),
measured wind velocities were extrapolated to equivalent wind velocities at 10 m
(the Australian Bureau of Meteorology standard for reporting wind velocities in the
field). The wind velocity measured in the tunnel at 0.2 m was converted to the
equivalent wind velocity at 10 m (u10) using the z0 ratio (Equation 2) as described in
Leys et al. (1996):

Chapter 4: Wind Tunnel
Page 64
Equation 2
where symbols are defined as for Equation 1, in addition:
ua is the wind velocity at height a (in this case 10 m), and
ub is the wind velocity measured at height b (in this case measured within the
tunnel at height of 0.2 m).
As z0, a and b are known, the ratio of wind velocity at 10 m to the wind velocity at
0.2 m (ua/ub) can be determined. ua can then be calculated by multiplying ub by the
ratio. Height of 0.2 m is chosen for calculation of the z0 ratio as it is considered to be
the highest measured wind velocity (measured by Pitot tube) within the boundary
layer (the layer of reduced velocity air immediately adjacent to a surface) produced
by the stubble.
Seed traps
Four trap types were used: a Bagnold trap, wind vane samplers, sticky slide traps,
and tube traps. All four trap types were deployed and used for each wind run. Traps
were positioned on each experimental plot without disturbing the ground surface, the
tunnel was then positioned over the top of the deployed traps. Soil cores were also
taken after each run. It was assumed that traps were independent of each other, and
were not affecting other traps. Seeds caught in traps were manually counted in the
laboratory.
Bagnold traps and wind vane samplers are commonly used in wind tunnel
experiments and natural soil erosion surveys in Australia (Leys and Raupach 1991;
Leys et al. 1993; Leys et al. 1996; McTainsh 1999). These traps have been tested for
their sediment trapping efficiency and the Bagnold trap is deemed to oversample the
total mass (i.e. 102% ± 5%) while the wind vane samplers have a trapping efficiency
of 86-95% (Shao et al. 1993). The trapping efficiency of the sticky slide traps and
tube traps was not known.

Chapter 4: Wind Tunnel
Page 65
Bagnold trap
A Bagnold trap was used to calculate seed transport rate down the tunnel. The
Bagnold trap is considered to be the ‘classic’ horizontal sand flux sampler for
estimating sand transport in field and laboratory situations (Goossens et al. 2000). It
is an active, vertically integrating trap, with an opening 5 mm wide by 480 mm high
(Figure 4.4a). A household vacuum cleaner is used to apply constant suction and
material is caught in paper bags. It was positioned on the ground at 4.2 m down the
tunnel and 0.35 m from the left hand side of the tunnel (when facing up-wind)
(Figure 4.5).
Wind vane samplers
Wind vane samplers, also known as Fryrear traps (Fryrear 1986) are passive, point
sampling traps with an intake area 20 mm x 50 mm (Figure 4.4b). Two wind vane
samplers were positioned on the ground 4.2 m down the tunnel and 0.10 m to the left
and right of the Bagnold trap (Figure 4.5).
The cross section of the tunnel had an area of 1.08 m2. The Bagnold trap and wind
vane samplers positioned at the open exhaust end accounted for 0.0044 m2, or 0.41%
of the total cross-section area.
Sticky slide traps
Sticky slide traps were used to measure the distribution of seeds from the release
point along the length of the tunnel at ground level. Each sticky slide trap consisted
of a glass microscope slide 25 mm wide by 76 mm long (Livingstone International
Pty Ltd, Rosebery, NSW) with a strip of double sided tape 18 mm wide (Sellotape
Regd. Dalton Packaging Pty Ltd Bankstown, NSW) placed down the centre. Each
slide was placed on an aluminium rack 86 mm long x 30 mm wide x 10 mm high
(Figure 4.4c). Thirty-five sticky slide traps were placed on the ground at seven
logarithmic positions along the tunnel (0.00, 0.125, 0.05, 0.25, 0.50, 1.00, 2.00 and
4.00 m from the edge of the tunnel’s wooden board). At each of these distances, 5
slides were placed randomly across the tunnel (Figure 4.5).
Tube traps
Tube traps were used to measure the distribution of seeds from the release point at
three distances along the length of the tunnel (1.0, 2.0 and 3.0 m) and at three heights

Chapter 4: Wind Tunnel
Page 66
above the ground (0.10, 0.30 and 0.60 m). Each tube trap consisted of 10 mm
diameter aluminium tube cut in 100 mm lengths with the exhaust opening blocked
off with a piece of nylon mesh (commercial fine grade pantyhose) attached to the
tube with a rubber band. Three tubes were welded horizontally and in parallel onto
an aluminium peg at the three specified heights, making one ‘rack’ (Figure 4.4d).
Three racks were deployed across the width of the tunnel at each of the three
distances (Figure 4.5), giving 27 tube traps per wind run.
Soil cores
Fifteen soil cores were taken from each plot after the tunnel and traps had been
removed. Cores were taken using a metal cylinder (50 mm diameter by 15 mm deep)
and trowel. Five samples were taken across the 1.2 m width of the wind tunnel at
distances of 0.5, 1.0 and 3.0 m from the wooden board. The five samples for each
distance were pooled, weighed to the nearest gram and sieved. Particles greater than
0.3 mm were discarded, and the samples were then weighed again. These samples
were sub-sampled from a homogeneous mix in order to obtain samples of a suitable
size for DNA testing. Testing for O. ramosa DNA was conducted by the South
Australian Research and Development Institute (SARDI) diagnostics group. Methods
for the DNA extraction and the quantitative PCR (Polymerase Chain Reaction) are
the intellectual property of SARDI and the DNA analyses were conducted on a fee
for service basis.
Seeds
For each wind run, forty-thousand O. ramosa seeds were estimated by volume and
introduced into the tunnel via two aluminium tubes. The open ends of the tubes were
located above the wooden board at 0.10 m height, roughly corresponding to the mean
height of flower heads in the field (personal observation). Seeds were released
manually once the fan reached the designated speed, which was approximately 5 s
after the fan began turning. The tunnel was then operated for 60 s from the time the
seeds were added, for each wind run.
Ground cover
Extent of ground cover (plant and rock material) of each plot was estimated by grid
point intercept survey after the wind tunnel and seed traps had been removed. The
grid consisted of 20 transects placed 0.25 m apart and sampled at 0.15 m intervals,

Chapter 4: Wind Tunnel
Page 67
and presence/absence point observations were made for each of 200 sample points.
Data for each plot were pooled to give a total number of points (up to a maximum of
200).
Data analysis
Data collected from traps along the width of the tunnel at the same distance were
pooled, as the dispersal length and height were of interest rather than variation in
lateral movement within the tunnel. Univariate analyses were performed on each of
the four seed trap types and the soil cores, with “number of seeds trapped” as the
response variable. Data were suitably transformed (square root transformation and
natural logarithmic transformation as applicable) and Analysis of Variance, Variance
Ratio Tests (F-tests), and Least Significant Difference tests were performed. Data
were considered significant if P < 0.05 (α = 0.05).
Results
Ground cover
Ground cover estimates showed that bare plots had an average cover of plant or rock
material of 9.2% (18.3 points per 200, S.E. = 1.98) which was significantly different
from the stubble plots (F1,23 = 81.67, P < 0.001) which had an average of 61.2%
cover (122.3 points per 200, S.E. = 10.30).
Wind velocities
Within each ground cover treatment, the measured wind velocities increased with
increasing wind treatment (Table 4.1). At heights up to and including z = 0.25 m, the
average wind velocities measured in stubble were less than those measured on bare
ground. Conversely, wind velocities measured at z = 0.60 m, and derived for z = 10
m, were greater for stubble compared with bare ground (Table 4.1).
Friction velocity (u*), roughness length (z0), and z0 ratio all increased with increasing
wind velocity (although u* was the only one showing a statistically significant
difference, F2,24 = 19.38, P < 0.0001) and were greater on stubble plots than bare
ground (u* F2,24 = 144.14, P < 0.0001; z0 F2,24 = 95.6, P < 0.0001; z0 ratio F2,24 =
170.41, P < 0.0001) (Table 4.2).
As expected, the wind treatments (i.e. fan speed) did not yield equal wind velocities
on bare ground and stubble treatments. However, the wind velocities produced by the

Chapter 4: Wind Tunnel
Page 68
medium (1300 rpm) and high (1600 rpm) wind treatments were consistently higher,
approximately 30% and 60% , respectively, than those produced by the low (1000
rpm) treatment (Table 4.1).
Seed trapping
Table 4.3 shows P-values and significant results for number of seeds trapped and the
significance of wind velocity, ground cover, distance travelled, and height of capture
for each measure.
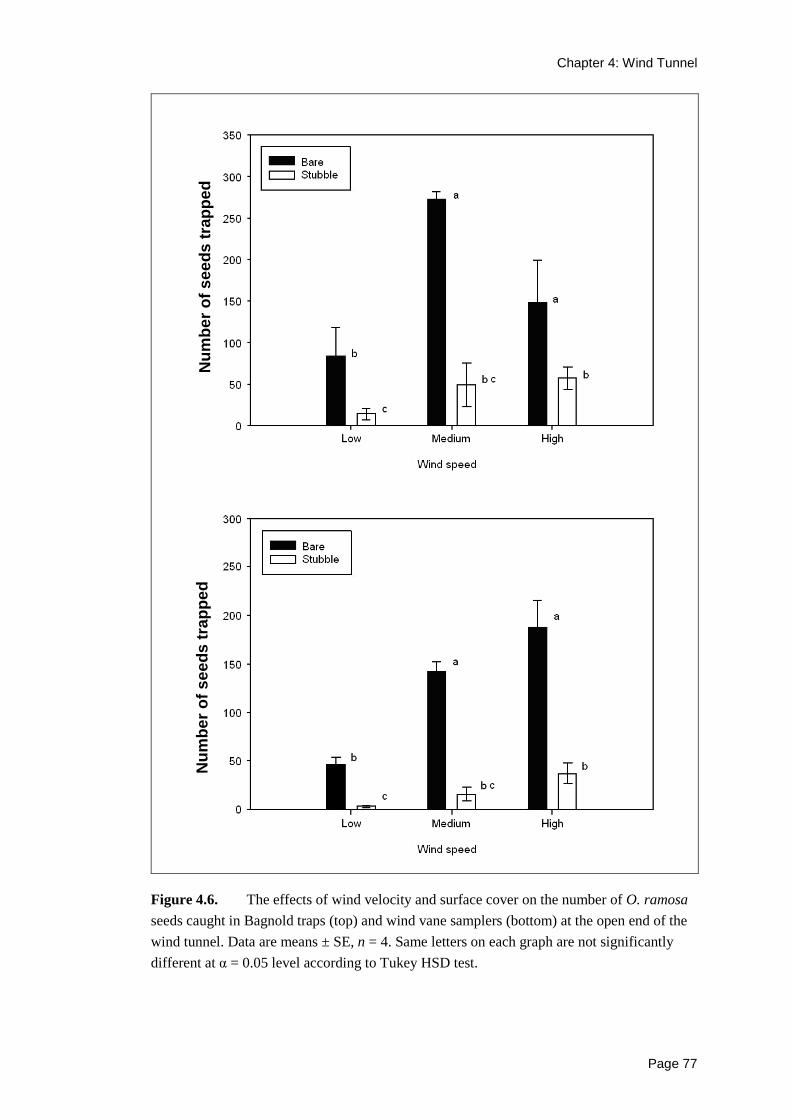
For each wind treatment, higher numbers of seeds were caught exiting the tunnel on
bare ground than on stubble plots, by both the Bagnold traps and the wind vane
samplers (Figure 4.6). Thus, more seeds were reaching the end of the tunnel in the
bare ground treatments than in the stubble treatments.
Sticky slide traps showed that more seeds were trapped within the tunnel on stubble
plots than bare ground plots, for medium and high wind velocities (Figure 4.7). Low
wind velocity showed the sharpest decrease in number of seeds caught with distance
from seed source (Figure 4.7) as it is assumed that at higher wind velocities more
seeds are exiting the tunnel without being trapped. Overall, stubble plots trapped
more seeds on sticky slide traps (P = 0.012).
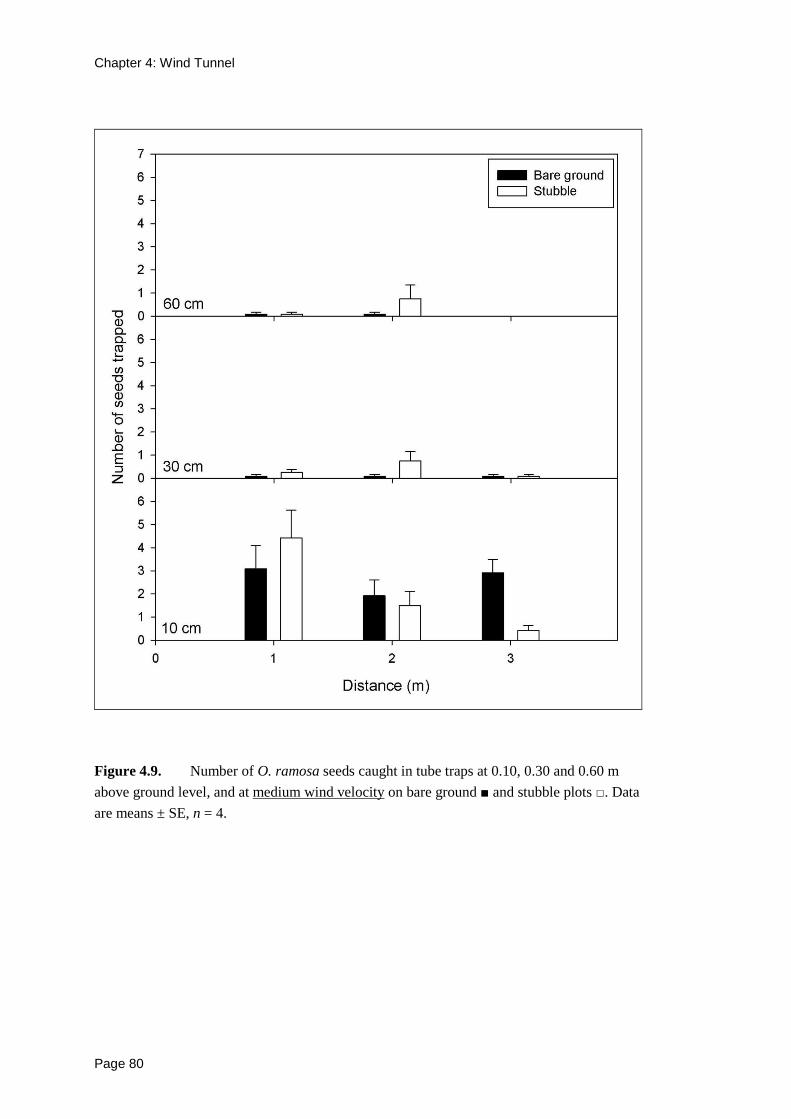
Seeds were trapped in the tube traps at all sampled heights (0.10, 0.30, 0.60 m) with
the majority of seeds trapped at 0.10 m height (Figures 4.8, 4.9 and 4.10), regardless
of wind velocity.
Seed detection rates in soil cores showed no significant effects between treatments at
the α = 0.05 level (Table 4.3) although ground cover x distance resulted in P = 0.06.
There was high variability in seed detection levels, and no clear spatial trends were
evident from the soil cores (Figure 4.11).
On average, 530 seeds were trapped by the four seed traps on each wind run (S.E. =
83). Given approximately 40 000 seeds were released per wind run, the seed trapping
rate ranged from 0.31% to 4.68% of the seeds added for each wind run.

Chapter 4: Wind Tunnel
Page 69
Figure 4.1. Diagram of the site layout for the wind tunnel experiments. Grey areas
indicate buffer zones between the experimental plots. Experimental plots are numbered in
the order in which the wind runs were performed. Three stubble and 3 bare ground plots
were randomly allocated across the 6 plots within each replicate.

Chapter 4: Wind Tunnel
Page 70
Figure 4.2. Examples of the two ground cover treatments used in the wind tunnel
experiment; Stubble plot (top) and bare ground (bottom). White line indicates the
approximate position of the wind tunnel on the plot.

Chapter 4: Wind Tunnel
CSIRO Publishing - http://www.publish.csiro.au/nid/84/paper/SR9900177.htm.
Page 71

Chapter 4: Wind Tunnel
Page 72
A. Bagnold trap
x 1 unit
B. Wind vane sampler
x 2 units
C. Sticky slide trap
x 35 units
D. Tube trap
x 9 racks
(27 tubes)
Figure 4.4. The four seed trap designs that were used in the wind tunnel experiment.
The number of each type of trap used per run is indicated beside each photograph

Chapter 4: Wind Tunnel
Page 73
Figure 4.5. Arrangement of the four trap types in the wind tunnel, view from above
looking down towards the ground. B = Bagnold trap, W = wind vane sampler, dashes =
sticky slide traps, circles = rack of tube traps. The wind tunnel exhausts to the right of the
diagram, the fan and wooden board are to the left of the diagram. The two bullseyes on the
left of the diagram indicates the approximate location of the aluminium tubes through which
seeds were released into the wind stream.

Chapter 4: Wind Tunnel
Page 74
Table 4.1. Velocity profile produced in the wind tunnel experiments. Mean wind
velocities (ū) measured by Pitot tubes placed at heights = 0.05, 0.10. 0.15, 0.20, 0.25 and
0.60 m, n = 4. Wind velocities at 10 m (ū10) have been calculated according to Leys et al.
(1996). % indicate the percent increase in wind velocity compared to the low wind velocity
treatment, for each groundcover treatment.
Treatment ū0.05
(m s-1) ū0.10
(m s-1) ū0.15
(m s-1) ū0.20
(m s-1) ū0.25
(m s-1) ū0.60
(m s-1) ū10
(m s-1) Bare-low 5.08 (0%) 5.86 (0%) 6.24 (0%) 6.56 (0%) 6.82 (0%) 7.27 (0%) 10.69 (0%) Bare-medium 6.48 (27%) 7.65 (31%) 8.18 (31%) 8.61 (31%) 9.00 (32%) 9.81 (35%) 14.61 (47%) Bare-high 7.98 (57%) 9.42 (61%) 10.02 (61%) 10.52 (60%) 10.97 (61%) 12.04 (66%) 17.19 (61%) Stubble-low 3.03 (0%) 4.01 (0%) 4.72 (0%) 5.74 (0%) 6.51 (0%) 7.88 (0%) 14.50 (0%) Stubble-medium 3.78 (25%) 5.08 (27%) 6.15 (30%) 7.56 (32%) 8.56 (31%) 10.34 (31%) 19.57 (39%) Stubble-high 4.86 (57%) 6.51 (56%) 7.82 (58%) 9.11 (53%) 10.19 (53%) 12.56 (59%) 23.63 (58%)

Chapter 4: Wind Tunnel
Page 75
Table 4.2. Friction velocity (u*), surface roughness length (z0) and z0 ratio values
derived from the velocity profile for the wind tunnel experiments.
Treatment u*
(m s-1) z0
(mm) z0 ratio
Bare-low 0.42 0.46 1.63 Bare-medium 0.62 0.74 1.70 Bare-high 0.68 0.80 1.64 Stubble-low 0.93 14.09 2.55 Stubble-medium 1.31 15.67 2.59 Stubble-high 1.52 16.71 2.60

Chapter 4: Wind Tunnel
Page 76
Table 4.3. Probability values (P-values) for Variance Ratio Tests (F-tests) of seed
numbers caught by four trap types and in soil cores. Numbers in bold type indicate the
highest order interaction for each trap type (where effects are significant). * indicates
statistically significant P-values at α = 0.05 level.
Trap type:
Effect:
Ba
gnold
trap
Wind
vane
trap
Sticky
slide
trap
Tube
trap
Soil c
ores
Wind velocity x ground cover x distance x height 0.493
Wind velocity x ground cover x distance 0.020* 0.332 0.061
Wind velocity x ground cover x height 0.603
Ground cover x distance x height 0.010*
Wind velocity x ground cover 0.427 0.095 0.632 0.118 0.651
Wind velocity x distance <0.001* 0.933 0.821
Wind velocity x height 0.005*
Ground cover x distance <0.001* 0.056 0.060
Ground cover x height 0.002*
Distance x height <0.001*
Wind velocity 0.016* <0.001* 0.001* <0.001* 0.901
Ground cover 0.009* <0.001* 0.012* 0.795 0.491
Distance <0.001* <0.001* 0.081
Height <0.001*
Chapter 4: Wind Tunnel
Page 77
Figure 4.6. The effects of wind velocity and surface cover on the number of O. ramosa
seeds caught in Bagnold traps (top) and wind vane samplers (bottom) at the open end of the
wind tunnel. Data are means ± SE, n = 4. Same letters on each graph are not significantly
different at α = 0.05 level according to Tukey HSD test.
Num
ber
of s
eeds
trap
ped
Num
ber
of s
eeds
trap
ped

Chapter 4: Wind Tunnel
Page 78
Figure 4.7. Number of O. ramosa seeds caught in sticky slide traps on bare ground (■)
and stubble plots (□) at three wind velocities: low (A), medium (B), high (C). Numbers of
seeds trapped across the width of the tunnel have been pooled for each distance point. Data
are means, n = 4.

Chapter 4: Wind Tunnel
Page 79
Figure 4.8. Number of O. ramosa seeds caught in tube traps at 0.10, 0.30 and 0.60 m
above ground level, and at low wind velocity on bare ground (■) and stubble plots (□). Data
are means ± SE, n = 4.
Chapter 4: Wind Tunnel
Page 80
Figure 4.9. Number of O. ramosa seeds caught in tube traps at 0.10, 0.30 and 0.60 m
above ground level, and at medium wind velocity on bare ground ■ and stubble plots □. Data
are means ± SE, n = 4.

Chapter 4: Wind Tunnel
Page 81
Figure 4.10. Number of O. ramosa seeds caught in tube traps at 0.10, 0.30 and 0.60 m
above ground level, and at high wind velocity on bare ground (■) and stubble plots (□). Data
are means ± SE, n = 4.

Chapter 4: Wind Tunnel
Page 82
Figure 4.11. Estimated density of O. ramosa seeds in soil cores at three distances down
the wind tunnel, (A) low wind treatment, (B) medium wind treatment, (C) high wind
treatment. Data are means, error bars show SE, n = 4.

Chapter 4: Wind Tunnel
Page 83
Discussion
This experiment confirms that O. ramosa seed can be dispersed by wind, at least 5.2
m after 60 s with a wind velocity at 10 m of 10.69 km h-1. While other researchers
have shown that wind can transport dust propagules (Berner et al. 1994; Murren and
Ellison 1998; Bullock and Clarke 2000; Machon et al. 2003; Bullock and Moy 2004)
including Orobanche sp. specifically (Mesa-García et al. 1986; Castejón-Muñoz et
al. 1991), the current study shows the importance of paddock ground cover in seed
dispersal. This study showed that plant and rock material impeded the movement of
seeds by wind which has important implications for paddock management within the
quarantine zone.
The cereal stubble used in this study was drought affected and even when combined
with rock material afforded only 61% ground coverage. It was considered to be
poorer than other cereal in the district that season, and much poorer than would be
expected in years with higher rainfall (D. Miegel pers. comm.). Despite this, the poor
cereal stubble still had a substantial affect on the dispersal of O. ramosa seeds.
Within the tunnel, it was assumed that wind velocities up to 0.25 m in height were
likely to be influenced by the boundary layer (the layer of air affected by the surface
roughness), whereas ū0.6 were considered to represent the free stream velocities, the
velocity of air which is unaffected by the boundary layer. This boundary layer effect
was demonstrated in the wind tunnel where it can be seen that the wind velocities
were lower where a boundary layer was created by the stubble (Table 4.1).
The wind treatments applied in the experiment did not yield the same resultant wind
velocities, with stubble plots yielding lower ū than bare ground plots for heights up
to z = 0.25 m. At z = 0.6 m the stubble and bare ground plots were both operating at
free stream velocity. A residual effect of the wind tunnel is that the presence of
stubble reduces the total volume of the tunnel, resulting in increased air pressure
above the boundary layer (z = 0.6 m). This is demonstrated by the stubble plots
yielding greater ū at heights above the boundary layer (Table 4.1).
Regardless, the resultant wind velocities were considered to be comparable, as ū
produced by the medium (1300 rpm) and high (1600 rpm) wind treatments were
approximately 30% and 60% higher, respectively, than those produced by the low
(1000 rpm) treatment for both bare ground and stubble treatments (Table 4.1).

Chapter 4: Wind Tunnel
Page 84
The Bureau of Meteorology data indicate that the average wind velocity in nearby
Murray Bridge at 0900 h is 2.5 m s-1, and at 1500 h is 4.0 m s-1. Thus, the resultant
wind velocities created in the wind tunnel (ranging from 10 to 23 m s-1) were much
higher than the average for the area at those times of day. However, such a measure
of average wind velocity at a given clock time would not account for wind gusts and
strong wind events, which as discussed earlier would be important in triggering seed
release and transport.
Constant wind velocities such as those produced by the wind tunnel are not typical in
a field situation: gusts and stochastic wind events are likely to influence the way in
which seeds are released from capsules and subsequently travel through the air, and
this would require further research.
A range of trap types were used, both existing and new designs. This allowed the
comparison of traps that had known trapping efficiencies against new designs
thought to be more suitable for characterising seed dispersal.
The Bagnold trap and wind vane samplers are long standing, proven trap designs,
used for sand trapping to estimate sediment transport rate. The wind vane sampler is
particularly useful for remote field monitoring over long periods of time (J. Leys
pers. comm.). The sticky slide traps were specifically designed for this study and had
not been tested for trapping efficiency. Sticky slides trapped fewer seeds at medium
and high wind velocities, largely contradicting the results of the other traps
(excluding soil cores) that showed increased numbers of seeds trapped during high
wind treatment.
The tube traps were also a new design that was untested for trapping efficiency.
While they did not allow for fine resolution of seed dispersal in the wind profile to be
determined, the tube traps did verify that seeds were carried up into the wind profile,
and were trapped at a greater height than they had been released. This could have
been caused by one or more factors: seeds bouncing off the length of wooden board
at the start of the tunnel, or ricocheting off other obstacles within the tunnel (traps,
plant material, rocks, etc.); turbulence in the air flow; and aerodynamic lift of the
seeds due to the dimples on the seed surface (Kuijt 1969). Indeed in the field
situation other factors may also be acting, for example updraughts have been shown

Chapter 4: Wind Tunnel
Page 85
to drive long distance dispersal of winged seeds of dandelions (Tackenberg et al.
2003b)
It was assumed that seeds trapped in the wind tunnel were the seeds released
manually via the aluminium tubes. However, the field locality was an infested site,
and would have had some level of background seeds in the soil seedbank. The
method most likely to be affected by this seedbank was the soil cores. Soil cores and
DNA analysis have been used in South Australia in attempts to quantify O. ramosa
seedbank levels, but results have been highly variable (Williams et al. 2006).
Similarly van Delft et al. (1997) discovered that seeds of S. hermonthica were not
homogeneously distributed horizontally in the soil of paddocks in South Africa, even
when those paddocks had been ploughed. Williams et al. (2006) hypothesise that
such variability could be due to low seedbank density, spatial variability in the seed
bank, and the potential for the DNA-probe to detect dead O. ramosa seeds or
vegetative material in the sample. While not contributing clear results to the current
experiment, soil cores and DNA extraction have a role in determining O. ramosa
seedbank decline for known infestations (Correll and Marvanek 2006). In contrast,
the trapping methods used here (Bagnold trap, wind vane sampler, sticky slide traps,
and to a lesser extent, tube traps) are more sensitive and are able to elucidate the
patterns of seed distribution throughout the wind tunnel.
While the seed trap designs utilised by some researchers attempt to focus on primary
dispersal (Bullock and Clarke 2000; Bullock and Moy 2004), this study did not
attempt to separate primary (Phase I) and secondary (Phase II) dispersal events.
Indeed all trap types used would have been capable of trapping seeds during primary
and secondary dispersal.
As seeds were released from two point sources (aluminium tubes over the wooden
board at 0.10 m) the resultant lateral distribution of the seeds would not have been
uniform, especially at shorter distances. Instead, there are likely to have been
concentrations of seeds relating to each of the aluminium tubes, and a lateral
‘spreading’ of seeds with increasing distance; somewhat like a Gaussian plume
(Katul et al. 2005). However, the intent of this study was to investigate dispersal
distance and height, rather than lateral distribution of seeds within the tunnel, so the
seed trap data at a given distance were pooled. More detailed investigations of seed

Chapter 4: Wind Tunnel
Page 86
distribution within the wind tunnel would be required to analyse this lateral
distribution more thoroughly.
Conclusion
The current study shows that the presence of cereal stubble, even sparse and short
cereal stubble, combined with some rock material decreases the distance O. ramosa
seed can travel by wind. Surface vegetation can trap small seeds moving on wind,
through physical interaction with the seed, and by slowing down wind velocity near
the ground surface (Findlater et al. 1990; Bullock and Clarke 2000; Bullock and Moy
2004). Land managers with emerged O. ramosa should maintain ground cover in
infested paddocks in order to reduce the distance a seed can travel on wind.
Dispersal of O. ramosa seeds in the soil seedbank could also be reduced by paddock
vegetation cover. It is likely that soil erosion caused by wind would also transport
seeds of O. ramosa present in that soil. Ground cover, such as pasture or cereal
stubble, can substantially reduce soil erosion. Even 30% cover can reduce soil
erosion by four-fold (Findlater et al. 1990). Land managers in paddocks known to
have an O. ramosa seedbank should adopt strategies conducive to reducing soil
erosion, such as maintenance of ground cover and no-till cultivation methods.

Page 87
Chapter 5. Discussion
Seed dispersal is a central process in the ecology of plant population dynamics
(Cousens et al. 2008), and knowledge of seed dispersal vectors is critical in the
management of invasive plant species. Managers of weed infestations need to
understand the specific dispersal mechanisms occurring, in order to limit the spread
of the population and aid eradication. For the South Australian population of
O. ramosa, efforts are focussed around delimitation, containment and extirpation
(Warren 2006; Panetta and Lawes 2007). Containment is achieved by preventing
seed dispersal to new areas outside the quarantine zone, and the prescribed
quarantine procedures can be refined through a better understanding of the dispersal
vectors operating in the South Australian population.
Seed dispersal mechanisms are rarely reported in the literature for Orobanche spp.
(only Mesa-García et al. 1986; Castejón-Muñoz et al. 1991) or other small seeded
parasitic weeds (e.g. S. hermonthica; Berner et al. 1994; van Delft et al. 1997). The
results of investigations into dispersal of comparable ‘dust propagule’ plants such as
orchids show that wind is a vector, but that most propagules remain close to the
source (Murren and Ellison 1998; Machon et al. 2003). Population genetics studies
also demonstrate that the majority of orchid seeds will travel fewer than 10 m (e.g.
Chung et al. 2004).
While information regarding dispersal of small seeded species can be gleaned from
the literature, there is little published on Orobanche species, and vectors will vary
both spatially and temporally. Not every vector will be applicable in every
population; between locations, different biotic and abiotic factors will be significant,
and some vectors may be limited to certain times, seasons or micro-climate
conditions. Land managers need to consider their own unique situation, and ensure
that the most appropriate methods of limiting distribution are being employed, with
the help of local extension officers and in adherence with the Code (DWLBC 2003).
Vectors for O. ramosa seeds
Sheep husbandry is one of the key activities within the branched broomrape
quarantine zone, so sheep were studied as a dispersal vector for O. ramosa; both
internal and external transport of seeds. The gut passage experiment showed the
classic gut passage pattern with a seed half-life of 2 days for O. ramosa seed through

Chapter 5: Discussion
Page 88
the sheep gut. Whether seeds were viable once excreted was untested, but the
literature suggests that as the seeds are small and exhibit high seedbank longevity
(Parker and Riches 1993), it is likely they would survive the passage through the gut
(Pakeman et al. 2002).
Experiments to determine seed transport on the wool aimed to document the two
stages of attachment and retention. These experiments showed that if O. ramosa
seeds were to come into contact with the wool, attachment is possible and retention is
likely to last at least seven days, probably longer. The probability of seeds coming
into contact with wool depends on the behaviour of the sheep (i.e. sitting, lying or
wallowing on the ground), density of seeds in the soil and/or density of seed bearing
plants in the paddock (Fischer et al. 1996).
The Code dictates procedures for inspection and written approval before livestock
can be moved from a paddock within the quarantine zone. Livestock are not the only
animals present in the area: pest animals (including mice, rabbits, hares, cats, and
foxes), domestic dogs, and native fauna (kangaroos and emus) may be present in the
cropping and grazing lands in the region (Anon 2008). The ability of some of these
species to carry various seeds has been reported in the literature, but given the small
seed size of O. ramosa it is likely to be carried in almost any animal fur (Tackenberg
et al. 2006). As such, the limiting factor for seed dispersal is likely to be contact
between seed bearing plants and the body fur. This contact is maximised in small to
medium-sized mammals whose body height will overlap with the height of the
plants. Quarantine measures may need to be expanded to include control of small to
medium-sized pest mammals, particularly those with larger home ranges, in order to
limit the dispersal of O. ramosa seeds.
The initial survey of natural wind dispersal of O. ramosa seeds showed that most
seeds fell near the source, a common pattern found by numerous authors (Berner et
al. 1994; Jongejans and Schippers 1999; Bullock and Clarke 2000; Bullock and Moy
2004; Chung et al. 2004). Control over wind speed is impossible with natural field
surveys, so a portable, field-based wind tunnel was used to control wind velocity and
direction, but maintain authentic soil surface conditions.
The wind tunnel experiment investigated the effects of wind velocity and ground
cover on the dispersal of O. ramosa seeds. It showed that greater wind velocities
Chapter 5: Discussion
Page 89
were associated with fewer seeds trapped along the length of the tunnel and more
seeds trapped exiting the tunnel. In some cases the presence of stubble increased the
number of seeds trapped along the length of the tunnel, suggesting that the stubble
was reducing the dispersal of seeds through the air. Indeed, the role of plants as traps
for small wind-dispersed seeds has been documented by Bullock and Moy (2004).
The wind tunnel used in the experiment was designed and built for the purpose of
conducting soil erosion experiments (Raupach and Leys 1990). The use of
laboratory-based wind tunnels to investigate seed dispersal is a relatively recent
development (vanDorp et al. 1996; Jongejans and Schippers 1999; Gravuer et al.
2003; Dauer et al. 2006; Davies and Sheley 2007). Laboratory-based wind tunnels
and models have been used to show that increased wind velocities give rise to greater
dispersal distances (Jongejans and Schippers 1999; Dauer et al. 2006; Davies and
Sheley 2007), and that seed release height is an important factor in determining
dispersal distance (Murren and Ellison 1998; Dauer et al. 2006). Increased vegetation
height has been associated with shorter dispersal distances (Jongejans and Schippers
1999) as has increased seed mass (Gravuer et al. 2003). To my knowledge, the
experiments reported in this thesis are the first investigating seed dispersal using a
field-based wind tunnel.
The Code does not include any requirements for the management of soil erosion or
wind dispersed seeds (DWLBC 2003). Such absences are not unusual in weed
management guidelines around the world (Davies and Sheley 2007). The wind tunnel
experiment showed that ground cover had a significant effect on the dispersal
distance of O. ramosa seeds. Davies and Sheley (2007) report that vegetation
neighbouring a weed infestation can significantly reduce the dispersal of seeds and
hence spread from that infestation. It would be sensible for land managers with
O. ramosa to maximise neighbouring paddock vegetation or use vegetated buffers
between paddocks to prevent seeds blowing into uninfested paddocks, and to
maintain sufficient levels of ground cover within infested paddocks to prevent topsoil
erosion and concurrent seed dispersal.
Humans and their mechanical farming implements are probably the most frequent
and important vector for dispersal of O. ramosa throughout the quarantine zone
(Secomb 2006). Any equipment that comes into contact with soil (e.g. tillage
equipment, mowers, seeders, harvesters, tractors and transport vehicles) could

Chapter 5: Discussion
Page 90
transport seeds along with soil. Management of farm machinery and the wash down
procedures required before they can be moved from within the quarantine zone are
well covered by the Code (DWLBC 2003).
On a paddock-scale, the use of tillage equipment may assist in mixing seeds through
the vertical profile in the plough layer, thus moving seeds from the soil surface into
the sub-surface levels below (e.g. S. hermonthica van Delft et al. 1997; Colbach et al.
2000). In the absence of tillage, water may play a role in moving seeds from the soil
surface down slopes and into cracks and hollows in the earth (Cousens et al. 2008).
Larger-scale movement of seeds by flood-waters is unlikely, although summer rains
and thunderstorms during the seed shedding period are possible in the region (Anon
1995).
Future research
Investigations into O. ramosa seed dispersal by wind, and internal and external
transport via sheep has been undertaken in this thesis. Further research would
contribute to a better understanding of those two vectors.
Determining the maximum wind dispersal distance (e.g. Bullock and Clarke 2000)
would permit buffer zones to be correctly applied to the margins of the quarantine
zone area. Alternatively, an explanatory model could be developed to describe the
wind dispersal process without the difficult task of measuring seed dispersal at such
long distances (Jongejans and Schippers 1999). The terminal velocity for the seed of
O. ramosa would need to be determined for such modelling to occur (Jongejans and
Schippers 1999).
Testing trap efficiency would allow more refined wind dispersal experiments to be
conducted (e.g. Shao et al. 1993). Testing the ability of seeds to traverse different
environments would allow further refinement of the quarantine methods. Low
biomass cereal and bare ground were investigated here, but pasture, higher biomass
cereal and native vegetation are all present within the quarantine zone and are likely
to differently affect wind dispersal.
For sheep, determining detachment time for seeds in wool would be important for
gauging the appropriateness of quarantine procedures. It would be also be necessary
to determine the viability of seeds at the end of a prolonged period of animal
transport to investigate potential for germination at the new location.

Chapter 5: Discussion
Page 91
Apart from the two vectors studied here, research into other vectors would be
valuable. The likelihood of wild animals transporting O. ramosa seeds should be
tested, particularly for species with large home ranges, although subsequent control
of such vectors would be difficult. Similarly, the role of water in O. ramosa seed
dispersal is unknown.
As well as investigating the possibility of individual vectors acting on O. ramosa
seeds, a useful tool would be a map of all dispersal pathways and relative
probabilities of seeds passing through these vectors (e.g. Figure 5.14, p. 100 in
Cousens et al. 2008).
Grenz and Sauerborn (2007) developed a simulation model to predict areas of risk of
O. crenata infestation, based on lifecycle parameters, soil type, climate, and host
crop production. Australia was identified to be at particular risk, especially the
regions of South Australia and Western Australia where pulses are commonly grown.
Measures to prevent infestation and spread include careful sourcing of clean crops
and plants, extension and education of farmers and land managers, and
implementation of quarantine measures (Eplee and Norris 1995). Should such
prevention methods fail and an infestation occurs, many of the same vectors that
have been discussed here for O. ramosa are likely to be important for O. crenata.
This thesis shows several pathways where seeds might be escaping the quarantine
zone. Indications of failure of containment (i.e. new infestations discovered) (Panetta
and Lawes 2007) are variable: the area of new infestations declined in 2003 and 2005
(Warren 2006) but increased in 2006 (Panetta and Lawes 2007). As such, continual
review and appraisal of possible dispersal vectors should be part of the ongoing
O. ramosa control program.


![suppressor of sessile spikelets1 Functions in the ramosa ... · ramosa Pathway Controlling Meristem Determinacy in Maize1[C][W][OA] ... Department of Biology, The Pennsylvania State](https://static.fdocuments.net/doc/165x107/5af462ea7f8b9a92718d7b67/suppressor-of-sessile-spikelets1-functions-in-the-ramosa-pathway-controlling.jpg)