Disentangling the effect of sheep urine patch size and ...
12
PRIFYSGOL BANGOR / BANGOR UNIVERSITY Disentangling the effect of sheep urine patch size and nitrogen loading rate on cumulative N2O emissions Marsden, K.; Jones, D.L.; Chadwick, D. Animal Production Science DOI: 10.1071/AN15613 Published: 09/02/2016 Publisher's PDF, also known as Version of record Cyswllt i'r cyhoeddiad / Link to publication Dyfyniad o'r fersiwn a gyhoeddwyd / Citation for published version (APA): Marsden, K., Jones, D. L., & Chadwick, D. (2016). Disentangling the effect of sheep urine patch size and nitrogen loading rate on cumulative N2O emissions. Animal Production Science, 56(3), 265-275. https://doi.org/10.1071/AN15613 Hawliau Cyffredinol / General rights Copyright and moral rights for the publications made accessible in the public portal are retained by the authors and/or other copyright owners and it is a condition of accessing publications that users recognise and abide by the legal requirements associated with these rights. • Users may download and print one copy of any publication from the public portal for the purpose of private study or research. • You may not further distribute the material or use it for any profit-making activity or commercial gain • You may freely distribute the URL identifying the publication in the public portal ? Take down policy If you believe that this document breaches copyright please contact us providing details, and we will remove access to the work immediately and investigate your claim. 15. Feb. 2022
Transcript of Disentangling the effect of sheep urine patch size and ...

PR
IFY
SG
OL
BA
NG
OR
/ B
AN
GO
R U
NIV
ER
SIT
Y
Disentangling the effect of sheep urine patch size and nitrogen loadingrate on cumulative N2O emissionsMarsden, K.; Jones, D.L.; Chadwick, D.
Animal Production Science
DOI:10.1071/AN15613
Published: 09/02/2016
Publisher's PDF, also known as Version of record
Cyswllt i'r cyhoeddiad / Link to publication
Dyfyniad o'r fersiwn a gyhoeddwyd / Citation for published version (APA):Marsden, K., Jones, D. L., & Chadwick, D. (2016). Disentangling the effect of sheep urine patchsize and nitrogen loading rate on cumulative N2O emissions. Animal Production Science, 56(3),265-275. https://doi.org/10.1071/AN15613
Hawliau Cyffredinol / General rightsCopyright and moral rights for the publications made accessible in the public portal are retained by the authors and/orother copyright owners and it is a condition of accessing publications that users recognise and abide by the legalrequirements associated with these rights.
• Users may download and print one copy of any publication from the public portal for the purpose of privatestudy or research. • You may not further distribute the material or use it for any profit-making activity or commercial gain • You may freely distribute the URL identifying the publication in the public portal ?
Take down policyIf you believe that this document breaches copyright please contact us providing details, and we will remove access tothe work immediately and investigate your claim.
15. Feb. 2022

Disentangling the effect of sheep urine patch size and nitrogenloading rate on cumulative N2O emissions
Karina A. MarsdenA,B, Davey L. JonesA and David R. ChadwickA
ASchoolof Environment,NaturalResourcesandGeography,BangorUniversity, Bangor,Gwynedd, LL572UW,UK.BCorresponding author. Email: [email protected]
Abstract. Ruminant urine nitrogen (N) concentration and volume are important parameters influencing the size and Nloading rate of urine patches deposited to soil. Such parameters can influence N cycling and emissions of the greenhousegas, nitrous oxide (N2O) from grazed grassland, yet, there is limited information on the effect of these parameters withintypical ranges reported for sheep. We used an automated, high-frequency gas monitoring system to investigate N2Oemissions from varying urine N application rates and patch sizes under field conditions. Using artificial sheep urine, wemanipulated urine N concentration to provide two urine N application rates (4 and 16 g N/L; equivalent to 200 and 800 kgN/ha). We investigated the effect of urine patch size with equal N application rates (4 · 125 cm2 vs 500 cm2, at 200 and800 kg N/ha) and the effect of patch size with unequal N application rates, but the same total amount of N applied(62.5 mL over 125 cm2 at 800 kg N/ha and 250 mL over 500 cm2 at 200 kg N/ha). Cumulative emissions of N2O generallyincreased with N loading rate, whether applied as one large urine patch or four smaller ones. Cumulative N2O emissionsincreased when the N was applied in four smaller urine patches compared with one large patch; this difference wassignificant at 800 kg N/ha, but not at 200 kg N/ha. When the total amount of N applied was held constant (1 g of N), theamount of N2O released was similar when urine was applied as a high N concentration small patch (800 kg N/ha)compared with a lowN concentration large patch (200 kg N/ha). Urine N2O emission factors in this study were, on average,10 times lower than the IPCC default of 1% for sheep excreta. This research clearly demonstrates that the chemical andphysical nature of the urine patch influences N2O emissions, yet further research is required to gather more data on typicalsheep urine volumes (individual and daily), urination frequency, urine N concentrations and the typical volumes of soilinfluenced by urine deposition, to provide more accurate estimates of emissions from sheep grazed pastures.
Additional keywords: agricultural systems, global climate change, microbial processes, ruminants.
Received 15 September 2015, accepted 30 November 2015, published online 9 February 2016
Introduction
Ruminant urine N concentration, volume and frequency varywidely, influencing the size and nitrogen (N) loading rate ofurine patches deposited to pasture soils. These parameters caninfluence the fate of urinary N in grazed pastures, includingemissions of the powerful greenhouse gas nitrous oxide (N2O)and leaching of NO3
– (Li et al. 2012). The default IPCC N2Oemission factor for both cattle and sheep was 2% of applied N;however, due to the lower volume and higher frequency of sheepurine events, and more moderate levels of soil compaction undersheep-grazed pastures, the default emission factor has beenlowered for sheep from 2% to 1% of the applied N (IPCC2006). The range in urine patch sizes deposited by sheep andcattle (0.13–2 L) has been shown to influence N transformationsand processes (e.g. longer retention of mineral N, greater plantgrowth and N uptake in larger patches) even when the total Napplied is constant (Orwin et al. 2009).While these results displaya clear difference between sheep and cattle urine patches, wherelarge differences in urinary volume are produced between thetwo species, less work has been conducted on N cycling and
N2O emissions within the typical ranges of urine patch sizesreported for sheep.
The concentration of N excreted in urine is a function of theamount of surplus metabolised N to be excreted, the volume ofurine produced and the frequency of urine events (Hoogendoornet al. 2010) and can range from1 to 18 gN/L (Bristow et al. 1992;Oenema et al. 1997; Hoogendoorn et al. 2010). Urine volume ismainly influenced by water intake and the mineral load ingestedby the animal (Selbie et al. 2015), and can be high when themoisture content of the diet is high, or when the herbage leavesare wet with rain water or dew (Doak 1952). Urine volume canalso vary as a response to coping with changes in ambienttemperatures (Betteridge et al. 2010a). Data for sheep urinevolume and frequency are scarce, but typically individualsheep urine events range between 100 and 200 mL (Doak1952; Haynes and Williams 1993). However, variation withinindividual sheep urine volumes can be high; for example, themean and range of 40 individual urine events among six Welshmountain ewes fed (ad libitum) a Lolium perenne L. dominatedsward was 104 (18–397) mL (K. A. Marsden, unpubl. data).
CSIRO PUBLISHING
Animal Production Science, 2016, 56, 265–275http://dx.doi.org/10.1071/AN15613
Published Open Access CC BY www.publish.csiro.au/journals/an

Daily sheep urine volume ranged from 0.5 to 3 L in Ledgardet al. (2008) and the frequency of urination events has beenreported to range between 13 and 20 times per day (Doak 1952;Betteridge et al. 2010a, 2010b).
Urine volume, soil moisture status, soil type and topographycan all influence the urine patch-wetted area and volume of soilinfluenced by a urine patch. The wetted area of a urine patch hasbeen defined as the surface area covered by urine followingdeposition to soil, as opposed to the pasture response area,which can extend beyond the wetted area (Lantinga et al.1987; Li et al. 2012). A typical wetted area for a sheep urineevent with a volume of 150 mL is reported to be 300 cm2 (Doak1952) and for 200 mL it is reported to be 430–550 cm2 (Williamsand Haynes 1994). Typical urine applications of 4 L/m2 werereported to be utilised in Kelliher et al. (2014).
Due to the wide range in the volume and frequency of sheepurine, and the interactive effects of dietary N content, energyuse and ambient temperature fluctuations, it is evident that sheepurine patches vary widely in N concentration and volume,resulting in patches of different sizes and of different Nloading rates. It can be envisaged that at times where sheepmay be fed a diet low in moisture content, or when ambienttemperatures are high, their urine will be more concentrated,having a higher N concentration deposited over a small patchsize. However, when the diet is high in moisture and the sheepis fully hydrated, urine may be deposited in larger-sized urinepatches with a lower N concentration. This experiment wasdesigned to test these two extremes, to determine howdifferences in sheep urine patch size and N concentration mayinfluence N cycling and cumulative N2O emissions arising fromsuch urine patches.
Using a high-frequency automated greenhouse gasmonitoring system we assessed whether (1) cumulative N2Oemissions will increase with increasing urine N loading rate,when keeping the urine patch size constant, (2) cumulativeemissions will be higher from four small urine patches thanfrom one large urine patch, when keeping the total N loadingrate constant, and (3) cumulative emissions will be higher froma low N-concentration large urine patch than from a high N-concentration small urine patch, where N loading rate differs,but the total amount of N applied remains constant. The totalamount of applied N equates to the total amount of N in thevolume of applied urine. The N loading rate is a function of theurine N concentration and the surface area the urine is appliedto (Selbie et al. 2015).
Materials and methods
Field siteThe field site was established at the Henfaes Research Station,Abergwyngregyn, North Wales (53�140N, 4�010W) in March2015. The soil at the site is classified as a Eutric Cambisoland is of mixed glacial till in origin, deposited ~10 000 yearsago. The field was re-seeded in 1990 with a Lolium perenne L.and Trifolium repens L. mix. The field has since receivedmoderate fertiliser applications (~120 kg N/ha.year in years1990–2002 and ~60–80 kg N/ha.year in subsequent years) andis regularly grazed by Welsh Mountain ewes at a moderatestocking density (2 or 3 livestock units/ha). The area was
fenced off just over 3 months before treatment application, toprevent the effect of recent livestock urine patches on monitoredgas fluxes from the soil.
Soil sampling and analysisSoil (0–10 cm) was sampled in triplicate at block level (n = 3)to determine soil characteristics (Table 1); this was conducted4 days before treatment application. Soil moisture content wasdetermined by oven drying (105�C, 24 h) and organic matter wasdetermined by the loss-on-ignition (450�C, 16 h; Ball 1964). SoilpH and electrical conductivity were determined using standardelectrodes in 1 : 2.5 (w/v) soil–distilled water suspensions. Totalcarbon (C) and N were determined on oven-dried and groundsamples in a TruSpec® Analyzer (Leco Corporation, St Joseph,MI, USA). Dissolved C and dissolved N were determined in 1 : 5(w/v) soil–0.5 M K2SO4 extracts, according to Jones andWillett (2006). Microbial biomass C and N were determinedvia the chloroform fumigation–extraction method of Voroneyet al. (2008), using KEC and KEN correction factors of 0.35and 0.5, respectively. Total extractable P, NO3
– and NH4+
were determined in 0.5 M K2SO4 extracts via the methods ofMurphy and Riley (1962), Miranda et al. (2001) and Mulvaney(1996), respectively. Exchangeable cations (sodium, potassium,calcium) within 1 : 5 (w/v) soil–1 M NH4Cl extracts weremeasured using a model 410 flame photometer (SherwoodScientific, Cambridge, UK).
Experimental design and treatment applicationArtificial sheep urine was made up according to Lucas and Jones(2006), the composition of which is in line with the suggestionof Kool et al. (2006) in containing at least urea and hippuricacid for a realistic simulation of N2O emissions from artificialurine patches. The N concentration of the artificial urine was
Table 1. Properties of the Eutric Cambisol at the field site receivingartificial urine application
Values represent means � s.e.m. (n = 3) and results are reported on a dryweight basis
Parameter Value
Texture Sandy clay loamBulk density (g/cm3) 1.08 ± 0.05Gravimetric moisture content (%) 42.8 ± 0.80Organic matter (%) 11.1 ± 0.68pH 6.08 ± 0.04EC (mS/cm) 41.7 ± 8.1Total carbon (C) (%) 5.47 ± 0.77Total nitrogen (N) (%) 0.42 ± 0.05C :N ratio 12.8 ± 0.65Dissolved organic C (mg C/kg) 109 ± 13.7Total dissolved N (mg N/kg) 16.2 ± 0.82Microbial biomass C (g C/kg) 2.32 ± 0.09Microbial biomass N (mg N/kg) 186 ± 2.60Extractable NO3
– (mg N/kg) 0.05 ± 0.01Extractable NH4
+ (mg N/kg) 1.47 ± 0.15Extractable phoshorus (mg/kg) 6.56 ± 1.21Exchangeable sodium (mg/kg) 13.4 ± 1.74Exchangeable potassium (mg/kg) 123 ± 37.5Exchangeable calcium (g/kg) 0.46 ± 0.07
266 Animal Production Science K. A. Marsden et al.

modified by adjusting the proportion of urea to obtain a total of4 g N/L and 16 g N/L, where all other urine constituents wereheld constant. The two N concentrations were chosen to reflectlow and high N concentrations in the urine, within typicalreported ranges for N concentration within sheep urine. Theeffect of urine patch size was investigated by comparing asingle large urine patch with four smaller patches, whileholding total N loading rate constant. The effect of patch sizewith unequal N loading rates, but the same total amount ofapplied N, was also assessed, by comparing a low N-concentration large urine patch with a high N-concentrationsmall urine patch.
The study was set up in a randomised block design, with fivetreatments (n = 3), as follows: (1) control (no urine application),(2) large urine patch with a low N concentration (4 g N/L; 1 gofN applied in 250mL covering 500 cm2; N loading rate = 200 kgN/ha), (3) large urine patch with a high N concentration (16 gN/L; 4 g of N applied in 250 mL, covering 500 cm2; N-loadingrate = 800 kg N/ha), (4) four small urine patches with a low Nconcentration (4 g N/L; 4 · 0.25 g of N applied in 4 · 62.5 mL,covering 125 cm2 each; N loading rate = 200 kg N/ha) and(5) four small urine patches with a high N concentration (16 gN/L; 4 · 1 g of N applied in 4 · 62.5 mL, covering 125 cm2 each;N loading rate = 800 kg N/ha).
Duplicate plots were established, one to allow for chambergas flux measurements and the other for soil sampling during thestudy. Artificial urine was applied by evenly pouring onto thesoil, using a fixed template as an area guide. All urine patcheswere smaller than the chamber basal area (2500 cm2), ensuringadditional room inside the chamber for the urine-patch diffusionalarea, which is important for accurately monitoring urine patchN2O emissions (Marsden et al. 2016). Soil cores (0–5 cm) weretaken from the area of immediate urine application, during thecourse of the study. Soil sampling was conducted 4 days beforetreatment application (for measurement of background soilcharacteristics), on the day of a urine application, and 2, 4, 7,10, 14, 17, 21, 28 and 35 days following treatment application.The soil sampling was conducted more frequently at thebeginning of the study (three times in the first week) so as toprovide information on soil N-transformation processes, whichoccur relatively quickly following organic N additions to soil(e.g. urea hydrolysis and nitrification). Soil sampling reduced infrequency throughout the remainder of the study (twice per weekin the second and third week, and once per week, thereafter).When soil cores were taken, they were timed to match manualflux measurements taken from the control plots. Soil cores werereturned immediately to the laboratory, where post-processingtook place within 24 h of sampling. Prior to extraction, soils werehomogenised by gently mixing within the sample bags.
Soil moisture was monitored within each individual chamberby using Acclima SDI-12 digital TDT® sensors (AcclimaInc., Meridian, ID, USA), monitoring at a 0.5-h measurementfrequency. The sensors were inserted diagonally through theurine patch, and were in situ 3 weeks before urine application.Rhizon suction samplers (2.5-mm diameter, 5-cm porous tubelength, 12-cm tubing length; Rhizosphere Research Products,Wageningen, The Netherlands) were also inserted at an angle of45� into the centre of individual urine patches, 3 weeks beforeurine application. This allowed sampling of soil solution within
the chamber in a non-destructive manner when the soil waswet enough for sample collection. Successful soil solutionsamples were collected 4 and 3 days before urine application,on the day of urine application and 2, 4, 7, 10, 14 and 17 daysfollowing urine application. Beyond this point, soil conditionswere too dry, so samples were not collected. Additionally, airtemperature was monitored both inside and outside chambersusing Thermochron iButtons® (iButtonLink, Whitewater, WI,USA) logging temperature every 1 h. A weather station waslocated near the field site, where rainfall, soil (0–10 cm) andair temperature were monitored hourly.
Pasture biomass and N contentThe pasture within chambers was cut 2 and 4 weeks followingurine application. Samples were oven-dried (80�C; 24 h),weighed for biomass, and ground before analysis of N content,as described previously.
Automated and manual greenhouse gas measurementsGreenhouse gas fluxes were measured from 12 non-steady-state,non-through flow chambers connected to a mobile, automatedhigh-frequency measurement system (Queensland Universityof Technology, Institute for Future Environments, Brisbane,Australia) as detailed in Scheer et al. (2014). Stainless-steelchamber bases were inserted into the ground (10 cm depth) for4 weeks before treatment application, to ensure no effects fromsoil disturbance were observed during the study. Chambers(50 cm · 50 cm · 15 cm) were fixed to the bases, whichopened and closed during sampling via pneumatic actuators.Chamber headspace samples were automatically pumped(~200 mL/min) from the chambers, through Teflon tubing tothe sampling unit, which housed a LI-CORLI-820 non-dispersiveinfrared gas analyser (LI-COR, St Joseph, MI, USA) to measurethe CO2 concentration, and a gas chromatograph (SRI 8610C,SRI International, Torrance, USA), equipped with a 63Ni electroncapture detector and flame ionisation detector to measure N2Oand CH4 concentrations in the chamber headspace, respectively.The samples passed through an Ascarite (sodium hydroxide-coated silica) column before entering the gas chromatograph,so as to remove moisture and CO2, which was changedperiodically so as to protect the electron capture detector cell.
The sampling routine consisted of three blocks of fourchambers, where each block of chambers close sequentiallyfor a period of 1 h, while the other two sets are open, allowingrestoration of ambient conditions. During the 1 h closure period,each chamber is sampled for 3 min, followed by a calibrationstandard (0.97 mg/m3 N2O; 1.71 g/m3 CO2; 2.12 mg/m3 CH4;� 2% of the certified value, BOC Gases, Liverpool, UK). The15 min cycle repeats four times, before the next set of chambersare sampled. One entire cycle takes 3 h to complete, allowingup to eight flux measurements per 24 h period.
The automated system consisted of 12 chambers only;therefore, control treatments were sampled manually fromstatic chambers (n = 3), as N2O fluxes were expected to beminimal from this treatment. Manual chamber flux measurementswere taken once per day, between 1000 hours and 1200 hours(de Klein and Harvey 2012) as close to daily as possible, forthe duration of the experiment. The gas samples were taken by
Effect of urine-patch size and N rate on N2O emissions Animal Production Science 267

placing polypropylene upturned buckets (~26 cm in height)onto collars (26-cm diameter), inserted to a depth of 10 cm.The chambers were fitted with a re-sealable vent, to allowpressure equalisation when placing chambers onto bases, andwere fitted with Suba-Seals ® (Sigma, Gillingham, UK) to allowsampling of the headspace. Samples were taken with a syringeevery 15 min, over the period of 1 h, to match the automatedsystem. Samples were stored in pre-evacuated 20 mL glass vials,before being analysed on a Clarus 500 gas chromatograph with aTurboMatrix headspace autoanalyser (Perkin Elmer, CT, USA).
Statistical analysesCumulative N2O emissions were determined by integrationusing the trapezoidal rule. The resulting cumulative emissionswere corrected for the chamber area assumed to be unaffectedby urine application (i.e. total chamber area = 0.25 m2, urinepatch area = 0.05 m2 and control area unaffected by urine =0.2 m2), by deducting the cumulative emissions arising fromthe control treatment over an area of 0.2 m2. Further calculations,e.g. emission factors, were based on the control-corrected valuesfor cumulative emissions. To compare whether cumulativeemissions or emission factors increased with increasing Nloading rate, Student’s t-tests were conducted, comparing theresults from Treatment 2 with those from Treatment 3 and results
fromTreatment 4with those fromTreatment 5. So as to determinewhether emissions are greater from small or large urine patches(with the same N loading rate), the same procedure was used,comparing Treatment 2 with Treatment 4 and Treatment 3 withTreatment 5. To test the third hypothesis that cumulativeemissions would be higher from a low N-concentration largeurine patch (200 kgN/ha) than from a highN-concentration smallurine patch (800 kg N/ha) with the same total amount of Napplied, the results from Treatment 5 were divided by 4(assuming that cumulative emissions from each individualurine patch within the chamber were equal) and comparedwith the results from Treatment 2. Differences in pasturebiomass and foliar N content at 2 and 4 weeks following urineapplication were assessed via ANOVA with Tukey’s post hoctest, after assessing normality and homogeneity of variance.All statistical analyses were conducted in Minitab 17.0(Minitab Inc., State College, PA, USA).
Results
Effect of urine N content and patch size on soil Cand N dynamics
The dynamics of total (free and exchangeable) NH4+ and NO3
–
concentrations in soil can be seen in Fig. 1a, b, and the
Ext
ract
able
am
mon
ium
(mg
NH
4+-N
/kg so
il D
W)
Soi
l sol
utio
n am
mon
ium
(mg
NH
4+-N
/L)
Soi
l sol
utio
n ni
trat
e(m
g N
O3– -N
/L)
Ext
ract
able
nitr
ate
(mg
NO
3– -N/k
g soil
DW
)
(a)
(b)
(c)
(d)
Fig. 1. Mineral nitrogen (N) dynamics following artificial sheepurine applicationof varyingNconcentration and patch size to aEutricCambisol. (a) Extractablesoil ammonium-N. (b) Extractable soil nitrate-N. (c) Soil-solution nitrate-N. (d) Soil-solution ammonium-N. Figure legend applies to all panels. Symbols anderror bars denote means � s.e.m., where n = 3 for a and b; however, n varies (1–3) for c and d, due to variability in successful soil-solution collection byRhizon samplers.
268 Animal Production Science K. A. Marsden et al.

concentration of NH4+ and NO3
– in soil solution (extracted withRhizon samplers within the chambers) is presented in Fig. 1c, d.During the second half of the field trial, the lack of rainfallprevented the acquisition of soil water with the Rhizonsamplers and, thus, there are no results to present. ExtractableNH4
+ increased up to 4 days following urine application in thetreatments receiving a high N loading rate, and then followed adeclining trend. As expected, extractable NH4
+ peaked at alower concentration in the lower N-containing treatments, andbegan to decline 2 days following urine application. There wereno apparent differences in the urine-induced increase of soilNH4
+ concentration due to patch size. The NO3– concentration
steadily increased in the soil extracts and soil solution, withlower amounts of NO3
– produced in the low N-containingtreatments. Differences in NO3
– concentration between patchsizes were evident, with less accumulation of NO3
– in smallerpatches, and with concentrations returning to background valuesfaster than in large urine patches. In the high N-containing largeurine patch, the NO3
– concentration was still higher than thecontrol at the end of the experiment, and it cannot be ruled outthat further N2O emissions would have occurred after this time.
The total extractable dissolved N and organic C present insoil during the course of the study can be seen in Fig. 2a, b, andthe soil-solution total dissolved N and C can be seen in Fig. 2c, d.Concentrations of extractable and soil-solution N were high at
the beginning of the study, due to the large amounts of dissolvedorganicN deposited into the soil within the urine. TheN persistedin the soil for longer periods in the high N-containing urinepatches. The soil solution C was immediately high followingurine application, and rapidly declined to control values.Dissolved organic C may have been higher in the high N-containing treatments, due to the increased proportion of ureain these treatments, and/or it may have been caused by a primingeffect, which has been demonstrated for ruminant urine-influenced soils for both C (Lambie et al. 2013) and N (Di andCameron 2008).
Pasture biomass and foliar N content
The pasture biomass and N content after 2 and 4weeks followingurine application can be seen in Table 2. As expected, the pasturebiomass and foliar N content were generally larger in the urinetreatments than in the control (except pasture biomass 4 weeksafter urine application). Increasing the N loading rate in a singlelarge urine patch did not increase (P > 0.05) pasture biomass 2 or4 weeks after urine application, nor did it increase foliage Ncontent in the first 2 weeks after urine application; however,foliage N did increase after 4 weeks (P < 0.05). Increasing theN loading rate in four smaller urine patches increased pasturebiomass (P < 0.01) 2 weeks after urine application and increased
(a)
(b)
(c)
(d)
Tota
l ext
ract
able
dis
solv
ed n
itrog
en(m
g N
/kg so
il D
W)
Tota
l ext
ract
able
org
anic
car
bon
(mg
C/k
g soil
DW
)
Soi
l sol
utio
n di
ssol
ved
nitr
ogen
(mg
N/L
)S
oil s
olut
ion
diss
olve
d or
gani
c ca
rbon
(mg
C/L
)
Fig. 2. Dynamics of total extractable (a) nitrogen (N) and (b) organic carbon (C), and soil solution (c) N and (d) dissolved organic C, following artificialsheep urine application (of varying patch size and N content) to a Eutric Cambisol. Figure legend applies to all panels, symbols and error bars denotemeans � s.e.m., where n = 3 for a and b; however, n varies (1–3) for c and d, due to variability in successful soil-solution collection by Rhizon samplers.
Effect of urine-patch size and N rate on N2O emissions Animal Production Science 269
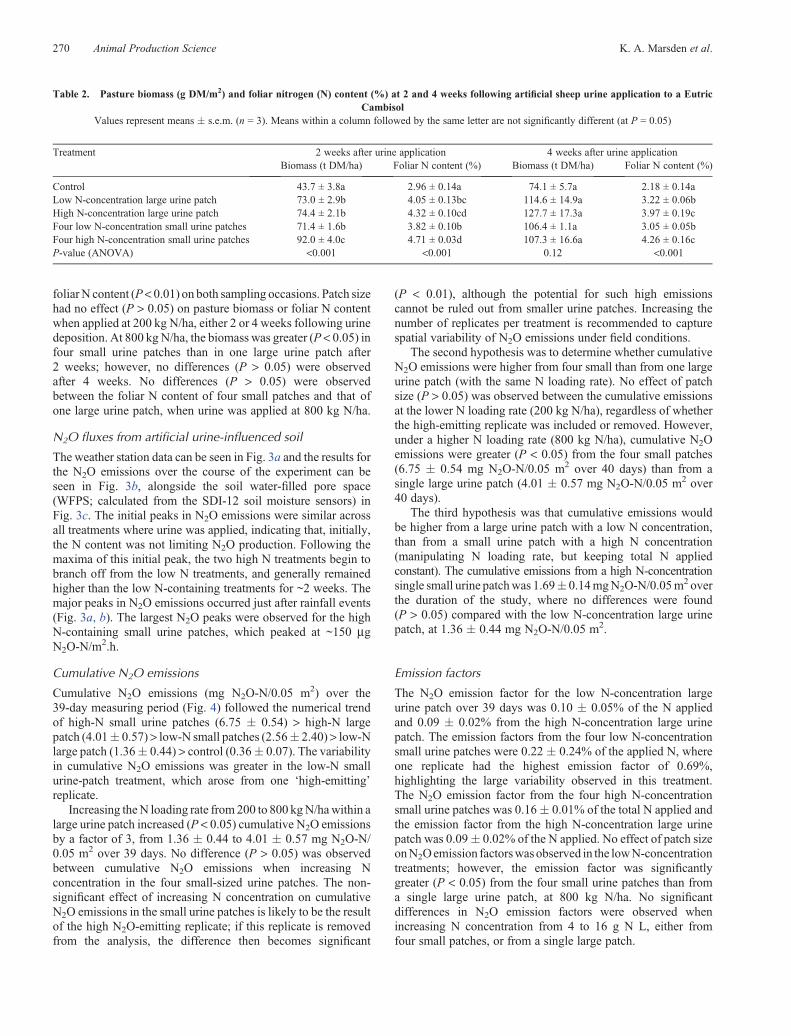
foliarN content (P< 0.01) on both sampling occasions. Patch sizehad no effect (P > 0.05) on pasture biomass or foliar N contentwhen applied at 200 kg N/ha, either 2 or 4 weeks following urinedeposition. At 800 kgN/ha, the biomass was greater (P < 0.05) infour small urine patches than in one large urine patch after2 weeks; however, no differences (P > 0.05) were observedafter 4 weeks. No differences (P > 0.05) were observedbetween the foliar N content of four small patches and that ofone large urine patch, when urine was applied at 800 kg N/ha.
N2O fluxes from artificial urine-influenced soil
The weather station data can be seen in Fig. 3a and the results forthe N2O emissions over the course of the experiment can beseen in Fig. 3b, alongside the soil water-filled pore space(WFPS; calculated from the SDI-12 soil moisture sensors) inFig. 3c. The initial peaks in N2O emissions were similar acrossall treatments where urine was applied, indicating that, initially,the N content was not limiting N2O production. Following themaxima of this initial peak, the two high N treatments begin tobranch off from the low N treatments, and generally remainedhigher than the low N-containing treatments for ~2 weeks. Themajor peaks in N2O emissions occurred just after rainfall events(Fig. 3a, b). The largest N2O peaks were observed for the highN-containing small urine patches, which peaked at ~150 mgN2O-N/m
2.h.
Cumulative N2O emissions
Cumulative N2O emissions (mg N2O-N/0.05 m2) over the39-day measuring period (Fig. 4) followed the numerical trendof high-N small urine patches (6.75 � 0.54) > high-N largepatch (4.01� 0.57) > low-N small patches (2.56� 2.40) > low-Nlarge patch (1.36� 0.44) > control (0.36� 0.07). The variabilityin cumulative N2O emissions was greater in the low-N smallurine-patch treatment, which arose from one ‘high-emitting’replicate.
Increasing theN loading rate from 200 to 800 kgN/hawithin alarge urine patch increased (P < 0.05) cumulative N2O emissionsby a factor of 3, from 1.36 � 0.44 to 4.01 � 0.57 mg N2O-N/0.05 m2 over 39 days. No difference (P > 0.05) was observedbetween cumulative N2O emissions when increasing Nconcentration in the four small-sized urine patches. The non-significant effect of increasing N concentration on cumulativeN2O emissions in the small urine patches is likely to be the resultof the high N2O-emitting replicate; if this replicate is removedfrom the analysis, the difference then becomes significant
(P < 0.01), although the potential for such high emissionscannot be ruled out from smaller urine patches. Increasing thenumber of replicates per treatment is recommended to capturespatial variability of N2O emissions under field conditions.
The second hypothesis was to determine whether cumulativeN2O emissions were higher from four small than from one largeurine patch (with the same N loading rate). No effect of patchsize (P > 0.05) was observed between the cumulative emissionsat the lower N loading rate (200 kg N/ha), regardless of whetherthe high-emitting replicate was included or removed. However,under a higher N loading rate (800 kg N/ha), cumulative N2Oemissions were greater (P < 0.05) from the four small patches(6.75 � 0.54 mg N2O-N/0.05 m2 over 40 days) than from asingle large urine patch (4.01 � 0.57 mg N2O-N/0.05 m2 over40 days).
The third hypothesis was that cumulative emissions wouldbe higher from a large urine patch with a low N concentration,than from a small urine patch with a high N concentration(manipulating N loading rate, but keeping total N appliedconstant). The cumulative emissions from a high N-concentrationsingle small urine patchwas 1.69� 0.14mgN2O-N/0.05m
2 overthe duration of the study, where no differences were found(P > 0.05) compared with the low N-concentration large urinepatch, at 1.36 � 0.44 mg N2O-N/0.05 m2.
Emission factors
The N2O emission factor for the low N-concentration largeurine patch over 39 days was 0.10 � 0.05% of the N appliedand 0.09 � 0.02% from the high N-concentration large urinepatch. The emission factors from the four low N-concentrationsmall urine patches were 0.22 � 0.24% of the applied N, whereone replicate had the highest emission factor of 0.69%,highlighting the large variability observed in this treatment.The N2O emission factor from the four high N-concentrationsmall urine patches was 0.16� 0.01% of the total N applied andthe emission factor from the high N-concentration large urinepatch was 0.09� 0.02% of the N applied. No effect of patch sizeonN2Oemission factorswasobserved in the lowN-concentrationtreatments; however, the emission factor was significantlygreater (P < 0.05) from the four small urine patches than froma single large urine patch, at 800 kg N/ha. No significantdifferences in N2O emission factors were observed whenincreasing N concentration from 4 to 16 g N L, either fromfour small patches, or from a single large patch.
Table 2. Pasture biomass (g DM/m2) and foliar nitrogen (N) content (%) at 2 and 4 weeks following artificial sheep urine application to a EutricCambisol
Values represent means � s.e.m. (n = 3). Means within a column followed by the same letter are not significantly different (at P = 0.05)
Treatment 2 weeks after urine application 4 weeks after urine applicationBiomass (t DM/ha) Foliar N content (%) Biomass (t DM/ha) Foliar N content (%)
Control 43.7 ± 3.8a 2.96 ± 0.14a 74.1 ± 5.7a 2.18 ± 0.14aLow N-concentration large urine patch 73.0 ± 2.9b 4.05 ± 0.13bc 114.6 ± 14.9a 3.22 ± 0.06bHigh N-concentration large urine patch 74.4 ± 2.1b 4.32 ± 0.10cd 127.7 ± 17.3a 3.97 ± 0.19cFour low N-concentration small urine patches 71.4 ± 1.6b 3.82 ± 0.10b 106.4 ± 1.1a 3.05 ± 0.05bFour high N-concentration small urine patches 92.0 ± 4.0c 4.71 ± 0.03d 107.3 ± 16.6a 4.26 ± 0.16cP-value (ANOVA) <0.001 <0.001 0.12 <0.001
270 Animal Production Science K. A. Marsden et al.

Discussion
When urine was applied at the same N loading rate, NO3–
concentrations did not peak as high, and returned to controlvalues faster in four smaller urine patches than in a singlelarge patch. The observed effect could have been due to thelarger wetted perimeter created by the four small urine patches(179 cm) than by one large urine patch (89 cm). This may haveallowed increased plant access to the nutrient-rich patch viaroots and stolons, which may explain the greater plant biomassand foliar N content when increasing urine N loading rate insmaller urine patches. Diffusion away from the urine patch edgehas been identified as an important mechanism for N processingand transformations in urine patches of different sizes (Orwinet al. 2009). The difference in patch sizes may have alloweda greater lateral, as opposed to vertical, diffusion of soluble Nand C into surrounding soil, potentially influencing differingproportions of nitrifying and denitrifying microorganisms.
A greater diffusion of NO3– beyond the area of immediate
urine application may have also resulted in the lower peak ofNO3
– found in smaller urine patches, as soil cores were onlytaken where urine had been directly applied, and Rhizon sampleswere taken at the centre of the urine patch. The soil mineral-Nconcentration remained higher for a longer period withincreasing urine N concentration, which means N losses canoccur under partially differing environmental conditions fromthe high N treatment compared with the lower N treatment(Dijkstra et al. 2013).
Concentrations of NO3–, NH4
+, total N and dissolved organicC in the urine patches (measured in both the soil extracts and thesoil solution) tended to vary widely, having large standard errors.This large spatial variability in factors that can drive N2Oemissions is likely to have contributed to the large observedvariation in N2O emissions in the present study This could alsobe problematic when comparing urine-patch soil properties
Rai
nfal
l (m
m/h
)
Tem
pera
ture
(°C
)
WF
PS
(%
)µg
N2O
-N/m
2 .h
(a)
(b)
(c)
Fig. 3. (a) Weather station data, (b) nitrous oxide emissions and (d) water-filled pore space (WFPS) following application of artificial sheep urine ofvarying nitrogen (N) concentration and patch size to a Eutric Cambisol. Legends apply to each figure, for both b and c, where the traces represent the treatmentmean (n = 3).
Effect of urine-patch size and N rate on N2O emissions Animal Production Science 271

from duplicated plots with N2O emissions from chambers, asprocesses may be occurring at different rates in the differentlocations. We suggest the development of non-destructivesampling techniques for monitoring soil conditions withinchambers to ensure monitored soil properties accurately reflectconditions within chambers.
In the present study, increasing urine N loading rate from200 kg N/ha to 800 kg N/ha generally increased cumulative N2Oemissions, but the emission factors were not significantlydifferent. This is similar to the finding of Selbie et al. (2014),who found a curvilinear increase in cumulative N2O emissionson increasing N loading rate. However, increasing urine Nloading rate had no effect on the fraction of N2O producedunder laboratory (van Groenigen et al. 2005a) and fieldconditions (van Groenigen 2005b; Dai et al. 2013; Luo et al.2013). However, urine-derived N2O emission factors havealso been shown to decrease (Selbie et al. 2014) or increasealongside N loading rate (Singh et al. 2009). Results for theresponse of urine patch N2O emission factors to increasing Nloading rates are contradictory and uncertain (Luo et al. 2013;Selbie et al. 2014).
When manipulating urine patch size and N loading rate, butmaintaining the same total amount of N applied, no differenceswere found in cumulative N2O emissions or emission factors,which is similar to the findings of van Groenigen et al. (2005a).However, cumulative N2O emissions and emission factors weresignificantly greater from four small urine patches than fromone large urine patch, when applied at 800 kg N/ha. It is difficult
to determine a management strategy that would reduce N2Oemissions on the basis of the results of this treatment, as itassumes a difference in the frequency of urine events, but withthe same N concentration and total volume of urine excreted.In reality, ruminant urine N concentration and volume varieswidely among and within days, and among individuals of thesame species (Betteridge et al. 1986, 2013; Hoogendoorn et al.2010). Nevertheless, on the basis of the results of the presentstudy and the sheep urine patch sizes used here, it would seemthat sheep that urinate more frequently in smaller volumes wouldemit more N2O than sheep urinating less frequently in largervolumes, given the same high urinary N concentration. Furtherwork is required to determine how this effects other N-lossprocesses such as NO3
– leaching and NH3 volatilisation, as,given the range of patch sizes excreted by cattle, increasingpatch size has been shown to logarithmically increase NO3
–
leaching (Li et al. 2012).It has been recognised that more information is required
for values of ruminant urine volume, urine N concentrationand urination frequency, where the development of sensor-based technology that can measure all three of these values(e.g. Betteridge et al. 2013) will be important for improvingmodels to predict N losses from grazed grassland. An increasein our knowledge of how ruminant urine N concentration isaffected by dietary factors will also be important; for example,Pacheco et al. (2010) found urinary N concentration of cattleurine to be related to the moisture content, dietary cation–aniondifference and soluble sugar content of the forage. Increasing
Fig. 4. Cumulative nitrous oxide nitrogen (N2O-N) emissions over the duration of thefield trial (40 days), where artificial urine of varying N content and patch size was appliedto a Eutric Cambisol. Vertical bars represent means � s.e.m. (n = 3).
272 Animal Production Science K. A. Marsden et al.

knowledge in these areas will also assist in a better understandingon the effect of differing management and mitigation strategiesto reduce N losses (e.g. feed type, grazing intensity and inclusionof diuretics in the diet).
Increasing urine volume, for example, by the inclusion ofNaCl in the diet, has been suggested as a way to reduce N lossesas it would reduce N loading rate per urination, potentiallypromoting a better dispersion of N across the pasture (Costalland Betteridge 2010; Pacheco et al. 2010), although this willdepend on livestock movement and behaviour. However, theresults of our study have shown that N2O emissions were nodifferent in patches of differing N loading rates, for the sameamount of N applied. Therefore, for a reduction in N2Oemissions from sheep urine patches, it is suggested that areduction in dietary N would need to occur concurrently withany mitigation strategies based on increasing total urine volume(de Klein et al. 2014).
Both Ledgard et al. (2007) and Liu and Zhou (2014) showedthat increasing NaCl in the diet of cattle and sheep, respectively,results in increased urine volume and frequency, but the averagevolume of individual urine events remained similar. Both Liet al. (2012) and Betteridge et al. (2013) showed that consideringmean values (rather than varied values) for cattle urine volume,frequency and N concentration causes differences of ~5–10%in modelled NO3
– leaching losses. The mean values for urinevolume and N concentration are also often used in plot-basedstudies of urine-patch N2O emissions, which may also causeinaccuracies when upscaling such emissions.
Across all urine treatments, N2O emission factors were onaverage 10 times lower than the 1% default IPCC emission factorfor sheep excreta (IPCC 2006). In a large study based onnumerous field trials conducted across New Zealand, the meansheep urine-patch emission factors from lowland pasture soilswere also found to be lower than the default IPCC emissionfactor for excretal N deposited to pasture, at 0.55% of theapplied N (Kelliher et al. 2014). The low emission factorsfound in the present study may have been caused by therelatively dry soil conditions that prevailed during the study.Low emission factors have been previously observed abovesheep-grazed pastures under dry summer months, withmaximum emissions occurring under cooler and wetter soilconditions (Allen et al. 1996; Saggar et al. 2007). Rainfall andsoil drainage class have been identified as key variablesinfluencing N2O emission factors from urine returns (de Kleinet al. 2003), and a consideration of environmental andmanagement factors (which are not considered in the IPCCTier 1 approach) will undoubtedly be important for betterconstraining N2O emission estimates from grazed soils.
The values for emission factors in the present study should beconsidered with care, as they were derived from artificial urineand overall emissions were fairly low and variable, which mayhave masked some effects. It is suggested that similar studiesshould be conducted under differing environmental conditionsto determine whether the effects hold true. Real urine isgenerally advocated for the calculation of emission factors (deKlein et al. 2003); however, the use of artificial urine wasbeneficial in the present study as it allowed the manipulationof N concentration. The artificial urine contained therecommended constituents for adequate representations of
urine for N2O emissions (Kool et al. 2006) and the proportionof urea was increased to manipulate the N content, which isconsistent with an increase in the proportion of urea excretedby ruminants occurring as a result of increased dietary crudeprotein (Dijkstra et al. 2013).
Conclusions
Cumulative N2O emissions generally increased, but emissionfactors remained similar, with increasing N loading rate (200–800 kg N/ha). Emission factors from a lowN-concentration largeurine patch (200 kg N/ha) were similar to those from a high N-concentration small urine patch (800 kg N/ha), when applyingthe same total amount ofN.However, emissionswere larger fromfour smaller patches than from one large urine patch under thesame N loading rate (800 kg N/ha). These conclusions suggestthat a reduction in overall dietary N would need to occur,alongside any mitigation strategies which manipulate urinevolume, so as to be effective at reducing N2O emissions fromsheep urine patches. For the same total volume and concentrationof N excreted in the urine, sheep that urinate little and often maybe causing greater emissions than sheep that urinate lessfrequently with a larger volume and patch size. With this inmind, further research is required to gather more data on typicalsheep urine volume (both individual urine events and dailyvolumes), frequency and N concentrations. Such parametersmay vary due to sheep breed, edaphic and climatic conditions,diet and management or mitigation practices (e.g. inclusion ofsalt in diet). Improving our knowledge on the links within theplant–animal–soil–atmosphere system will be important fordetermining more accurate emission estimates from sheep-grazed grasslands, and for determining the efficacy of N2Omitigation strategies.
Acknowledgements
We thank Christian Brunk at QUT for his assistance and support during theset up phase of the automated GHG system, Lara Jane Pritchard forassistance with field sampling and John Evans, Mark Hughes and LlinosHughes for their assistance setting up the field trial and the two anonymousreviewers for their suggestions for improvements to the manuscript. KAMalso thanks the School of Environment, Natural Resources and Geography,Bangor University, for sponsoring this study. This work was supported bythe Natural Environment Research Council under Grant award NE/MO15351/1.
References
Allen AG, Jarvis SC, Headon DM (1996) Nitrous oxide emissions fromsoils due to inputs of nitrogen from excreta return by livestock on grazedgrassland in the UK. Soil Biology & Biochemistry 28, 597–607.doi:10.1016/0038-0717(95)00186-7
Ball DF (1964) Loss-on-ignition as an estimate of organic matter andorganic carbon in non-calcareous soils. Journal of Soil Science 15,84–92. doi:10.1111/j.1365-2389.1964.tb00247.x
Betteridge K, Andrews WGK, Sedcole JR (1986) Intake and excretion ofnitrogen, potassium and phosphorus by grazing steers. The Journal ofAgricultural Science 106, 393–404. doi:10.1017/S0021859600064005
Betteridge K, Costall D, Balladur S, Upsdell M, Umemura K (2010a)Urine distribution and grazing behaviour of female sheep and cattlegrazing a sheep New Zealand hill pasture. Animal Production Science50, 624–629. doi:10.1071/AN09201
Effect of urine-patch size and N rate on N2O emissions Animal Production Science 273

Betteridge K, Hoogendoorn C, Costall D, Carter M, Griffiths W (2010b)Sensors for detecting and logging spatial distribution of urine patchesof grazing female sheep and cattle. Computers and Electronics inAgriculture 73, 66–73. doi:10.1016/j.compag.2010.04.005
Betteridge K, Costall DA, Li FY, Luo D, Ganesh S (2013) Why we needto know what and where cows are urinating – a urine sensor to improvenitrogenmodels.Proceedings of the New Zealand Grassland Association75, 119–124.
Bristow A, Whitehead DC, Cockburn JE (1992) Nitrogenous constituentsin the urine of cattle, sheep and goats. Journal of the Science of Food andAgriculture 59, 387–394. doi:10.1002/jsfa.2740590316
Costall K, Betteridge K (2010) Methods of delivering salt to cattle.Proceedings of the New Zealand Society of Animal Production 70,296–298.
Dai Y, Di HJ, Cameron KC, He J-Z (2013) Effects of nitrogen applicationrate and a nitrification inhibitor dicyandiamide on ammonia oxidizersand N2O emissions in a grazed pasture soil. The Science of the TotalEnvironment 465, 125–135. doi:10.1016/j.scitotenv.2012.08.091
de Klein CAM, Harvey MJ (2012) ‘Nitrous oxide chamber methodologyguidelines.’ (Global Research Alliance on Agricultural GreenhouseGases, Ministry for Primary Industries: Wellington, New Zealand)
de Klein CAM, Barton L, Sherlock RR, Li Z, Littlejohn RP (2003)Estimating a nitrous oxide emission factor for animal urine from someNew Zealand pasture soils. Australian Journal of Soil Research 41,381–399. doi:10.1071/SR02128
de Klein CAM, Luo J, Woodward KB, Styles T, Wise B, Lindsey S, Cox N(2014) The effect of nitrogen concentration in synthetic cattle urine onnitrous oxide emissions. Agriculture, Ecosystems & Environment 188,85–92. doi:10.1016/j.agee.2014.02.020
Di HJ, Cameron KC (2008) Sources of nitrous oxide from 15N-labelledanimal urine and urea fertiliser with and without a nitrificationinhibitor, dicyandiamide (DCD). Australian Journal of Soil Research46, 76–82. doi:10.1071/SR07093
Dijkstra J, Oenema O, van Groenigen JW, Spek JW, van Vuuren AM,Bannink A (2013) Diet effects on urine composition of cattle and N2Oemissions. Animal 7, 292–302. doi:10.1017/S1751731113000578
Doak BW (1952) Some chemical changes in the nitrogenous constituentsof urine when voided on pasture. The Journal of Agricultural Science42, 162–171. doi:10.1017/S0021859600058767
Haynes RJ, Williams PH (1993) Nutrient cycling and soil fertility in thegrazed pasture ecosystem. Advances in Agronomy 49, 119–199.doi:10.1016/S0065-2113(08)60794-4
Hoogendoorn CJ, Betteridge K, Costall DA, Ledgard SF (2010) Nitrogenconcentration in the urine of cattle, sheep and deer grazing a commonryegrass/cocksfoot/white clover pasture. New Zealand Journal ofAgricultural Research 53, 235–243. doi:10.1080/00288233.2010.499899
IPCC(2006) ‘IPCCguidelines fornationalgreenhousegas inventories.Vol. 4.Agriculture, forestry and other land use.’ Available at http://www.ipcc-nggip.iges.or.jp/public/2006gl/vol4.html [Verified 11 August 2015]
Jones DL, Willett VB (2006) Experimental evaluation methods to quantifydissolved organic nitrogen (DON) and dissolved organic carbon (DOC)in soil. Soil Biology & Biochemistry 38, 991–999. doi:10.1016/j.soilbio.2005.08.012
KelliherFM,CoxN,vanderWeerdenTJ, deKleinCAM,LuoJ,CameronKC,Di HJ, Giltrap D, Rys G (2014) Statistical analysis of nitrous oxideemission factors from pastoral agriculture field trials conducted inNew Zealand. Environmental Pollution 186, 63–66. doi:10.1016/j.envpol.2013.11.025
Kool DM, Hoffland E, Abrahamse S(PA), van Groenigen JW (2006) Whatartificial urine composition is adequate for simulating soil N2O fluxesand mineral N dynamics? Soil Biology & Biochemistry 38, 1757–1763.doi:10.1016/j.soilbio.2005.11.030
Lambie SM, Schipper LA, Balks MR, Baisden WT (2013) Priming of soildecomposition leads to losses of carbon in soil treated with cow urine.Soil Research 51, 513–520. doi:10.1071/SR13148
Lantinga EA, Keuning JA, Groenwold J, Deenen PJAG (1987) Distributionof excreted nitrogen by grazing cattle and its effects on sward quality,herbage production and utilization. In ‘Animal manure on grasslandand fodder crops, fertilizer or waste?’. (Eds HG van der Meer, RJUnwin, TA van Dijk, GC Ennik) pp. 103–117. (Kluwer AcademicPublishers: Lancaster, UK)
Ledgard SF, Welten BG, Menneer JC, Betteridge K, Crush JR, Barton MD(2007) New nitrogen mitigation technologies for evaluation in theLake Taupo catchment. Proceedings of the New Zealand GrasslandAssociation 69, 117–121.
Ledgard SF, Menneer JC, Dexter MM, Kear MJ, Lindsey S, Peters JS,Pacheco DS (2008) A novel concept to reduce nitrogen losses fromgrazed pastures by administering soil nitrogen process inhibitors toruminant animals: a study with sheep. Agriculture, Ecosystems &Environment 125, 148–158. doi:10.1016/j.agee.2007.12.006
Li FY, Batteridge K, Cichota R, Hoogendoorn CJ, Jolly BH (2012) Effectsof nitrogen load variation in animal urination events on nitrogen leachingfrom grazed pastures. Agriculture, Ecosystems & Environment 159,81–89. doi:10.1016/j.agee.2012.07.003
Liu H, Zhou D (2014) Mitigation of ammonia and nitrous oxide emissionsfrom pasture treated with urine of sheep fed diets supplemented withNaCl. Animal Feed Science and Technology 192, 39–47. doi:10.1016/j.anifeedsci.2014.03.006
Lucas SD, Jones DL (2006) Biodegradation of estrone and 17 b-estradiolin grassland soils amended with animal wastes. Soil Biology &Biochemistry 38, 2803–2815. doi:10.1016/j.soilbio.2006.04.033
Luo J, Hoogendoorn C, van der Weerden T, Saggar S, de Klein C, Giltrap D,Rollo M, Rys G (2013) Nitrous oxide emissions from grazed hill landin New Zealand. Agriculture, Ecosystems & Environment 181, 58–68.doi:10.1016/j.agee.2013.09.020
Marsden KA, Jones DL, Chadwick DR (2016) The urine patch diffusionalarea: an important N2O source? Soil Biology & Biochemistry 92,161–170. doi:10.1016/j.soilbio.2015.10.011
Miranda KM, Epsey MG, Wink DA (2001) A rapid, simple,spectrophotometric method for simultaneous detection of nitrate andnitrite. Nitric Oxide 5, 62–71. doi:10.1006/niox.2000.0319
Mulvaney RL (1996) Nitrogen – inorganic forms. In ‘Methods of soilanalysis part 3’. (Ed. DL Sparks) pp. 1123–1184. (Soil ScienceSociety of America Inc.: Madison, WI)
Murphy J, Riley JP (1962) A modified single solution method for thedetermination of phosphate in natural waters. Analytica Chimica Acta27, 31–36. doi:10.1016/S0003-2670(00)88444-5
OenemaO,VelthofGL,Yamulki S, Jarvis SC (1997)Nitrous oxide emissionsfrom grazed grassland. Soil Use and Management 13, 288–295.doi:10.1111/j.1475-2743.1997.tb00600.x
Orwin KH, Bertram JE, Clough TJ, Condron LM, Sherlock RR,O’Callaghan M (2009) Short-term consequences of spatial heterogeneityin soil nitrogen concentrations caused by urine patches of different sizes.Applied Soil Ecology 42, 271–278. doi:10.1016/j.apsoil.2009.05.002
Pacheco D, Lowe K, Hickey M, Burke JL, Cosgrove GP (2010) Seasonaland dietary effects on the concentration of urinary N from grazing cows.In ‘Meeting the challenges of pasture-based dairying: proceedings ofthe 4th Australasian dairy science symposium’. (Eds GR Edwards, RHBryant) pp. 68–73. (Lincoln University: Christchurch, New Zealand)
Saggar S, Hedley CB, Giltrap DL, Lambie SM (2007) Measured andmodelled estimates of nitrous oxide emission and methane consumptionfrom a sheep-grazed pasture. Agriculture, Ecosystems & Environment122, 357–365. doi:10.1016/j.agee.2007.02.006
Scheer C, Rowlings DW, Firrel M, Deuter P, Morris S, Grace PR (2014)Impact of nitrification inhibitor (DMPP) on soil nitrous oxide emissionsfrom an intensive broccoli production system in sub-tropical Australia.
274 Animal Production Science K. A. Marsden et al.

Soil Biology & Biochemistry 77, 243–251. doi:10.1016/j.soilbio.2014.07.006
Selbie DR, Cameron KC, Di HJ, Moir JL, Lanigan JG, Richards KG (2014)The effect of urinary nitrogen loading rate and a nitrification inhibitoron nitrous oxide emissions from a temperate grassland soil. The Journalof Agricultural Science 152, S159–S171. doi:10.1017/S0021859614000136
Selbie DR, Buckthought LE, Shepherd MA (2015) The challenge of theurine patch for managing nitrogen in grazed pasture systems. Advancesin Agronomy 129, 229–292. doi:10.1016/bs.agron.2014.09.004
Singh J, Saggar S, Bolan NS (2009) Influence of dicyandiamide onnitrogen transformation and losses in cow-urine-amended soil coresfrom grazed pasture. Animal Production Science 49, 253–261.doi:10.1071/EA08200
van Groenigen JW, Kuikman PJ, de Groot WJM, Velthof GL (2005a)Nitrous oxide emission from urine-treated soil as influenced by urine
composition and soil physical conditions. Soil Biology & Biochemistry
37, 463–473. doi:10.1016/j.soilbio.2004.08.009van Groenigen JW, Velthof GL, van der Bolt FJE, Vos A, Kuikman PJ
(2005b) Seasonal variation in N2O emissions from urine patches: effectsof urine concentration, compaction and dung. Plant and Soil 273, 15–27.doi:10.1007/s11104-004-6261-2
Voroney RP, Brookes PC, Beyaert RP (2008) Soil microbial biomassC, N, P and S. In ‘Soil sampling and methods of analysis’. 2nd edn.(Eds MR Carter, EG Gregorich) pp. 637–651. (CRC Press: BocaRaton, FL)
Williams PH, Haynes RJ (1994) Comparison of initial wetting pattern,nutrient concentrations in soil solution and the fate of 15N-labelledurine in sheep and cattle urine patch areas of pasture soil. Plant andSoil 162, 49–59. doi:10.1007/BF01416089
Effect of urine-patch size and N rate on N2O emissions Animal Production Science 275
www.publish.csiro.au/journals/an