
discussion papers FS IV 99 - 13 Catherine Matraves · discussion papers FS IV 99 ... uses the new...
36
discussion papers FS IV 99 - 13 Market Integration and Market Structure in the European Soft Drinks Industry: Always Coca-Cola? Catherine Matraves * * Lowry Mays College and Graduate School of Business and Texas A&M University, USA October 1999 ISSN Nr. 0722 - 6748 Forschungsschwerpunkt Marktprozeß und Unter- nehmensentwicklung Research Area Market Processes and Corporate Development
Transcript of discussion papers FS IV 99 - 13 Catherine Matraves · discussion papers FS IV 99 ... uses the new...
discussion papers
FS IV 99 - 13
Market Integration and Market Structurein the European Soft Drinks Industry:Always Coca-Cola?
Catherine Matraves *
* Lowry Mays College and Graduate School of Business andTexas A&M University, USA
October 1999
ISSN Nr. 0722 - 6748
ForschungsschwerpunktMarktprozeß und Unter-nehmensentwicklung
Research AreaMarket Processes andCorporate Development

Zitierweise/Citation:
Catherine Matraves, Market Integration and Market Str ucture in theEuropean Soft Dr inks Industry: A lways Coca-Cola?, Discussion PaperFS IV 99 - 13, Wissenschaftszentrum Berlin, 1999.
Wissenschaftszentrum Berlin für Sozialforschung gGmbH,Reichpietschufer 50, 10785 Berlin, Tel. (030) 2 54 91 - 0

ABSTRACT
Market Integration and Market Structure in the European Soft Drinks Industry:Always Coca-Cola?
by Catherine Matraves*
This paper focuses on the question of European integration, considering whether thegeographic level at which competition takes place differs across the two major segmentsof the soft drinks industry: carbonated soft drinks and mineral water. Our evidenceshows firms are competing at the European level in both segments. Interestingly, theEuropean market is being integrated through corporate strategy, defined as increasedmultinationality, rather than increased trade flows. To interpret these results, this paperuses the new theory of market structure where the essential notion is that in endogenoussunk cost industries such as soft drinks, the traditional inverse structure-size relationmay break down, due to the escalation of overhead expenditures.
ZUSAMMENFASSUNG
Marktintegration und Marktstruktur in der europäischen Getränkeindustrie:Immer Coca-Cola?
In diesem Beitrag wird der Frage nachgegangen, wie sich die europäische Integrationauf den Wettbewerb auswirkt. Am Beispiel der beiden Hauptsegmentenichtalkoholischer Getränke - kohlensäurehaltige �Softdrinks� und Mineralwasser -wird untersucht, ob sie sich im Hinblick auf die geographische Ebene, auf derWettbewerb stattfindet, unterscheiden. Die empirischen Ergebnisse deuten darauf hin,daß die Unternehmen in Europa in beiden Segmenten im Wettbewerb stehen.Interessanterweise wird der europäische Markt eher durch Unternehmensstrategienintegriert, die in wachsendem Maße multinational ausgerichtet sind, als durchzunehmende Handelsströme. Bei der Interpretation der Ergebnisse stützt sich dieAutorin auf die neue Theorie der Marktstruktur, derzufolge in Industrien mit endogenenversunkenen Kosten - und hierzu zählt auch die Getränkeindustrie - die traditionellinverse Beziehung zwischen Marktstruktur und Marktvolumen angesichts der hohenOverhead-Ausgaben aufgehoben wird.
* An earlier version of this paper formed part of my dissertation at the University of East Anglia
(UEA), Norwich. I would like to thank Bruce Lyons, Steve Davies and Mike Waterson for theirmany helpful comments. Financial support for this research was also kindly provided by theWissenschaftszentrum, Berlin. All remaining errors are mine.
1. Introduction
This paper applies the new theory of industrial structure (Sutton, 1991, 1998) to the European
soft drinks industry. Sutton’s major advance was to generate robust and testable predictions from
the theory of strategic behavior, where robustness means broad regularities that hold across a
range of benchmark oligopoly models. Unlike the ‘New Empirical IO’ literature in structural
modeling (see Bresnahan, 1989, and Geroski, 1988, for surveys), this then allows a wide set of
industries to be analyzed. The basic theoretical notion is that in homogeneous ‘Type 1’ industries,
characterized by exogenous sunk costs, the traditional inverse structure-size relation holds.
However, in ‘Type 2’ industries, characterized by endogenous sunk costs, as market size becomes
very large, firms may escalate their advertising and/or R&D expenditure in response, and the
inverse structure-size relation may break down. Sutton’s own empirical work confirms his
predictions, combining cross-section regression analysis with industry cases.1 The detailed
industry histories form the backbone of Sutton (1991); such analysis reveals rather more
qualitative evidence of the differing mechanisms made explicit in the theoretical framework.
Although Sutton investigated the soft drinks industry as an example of how the ‘escalation
mechanism’ operates in an endogenous sunk cost industry, this paper extends his analysis in two
interesting directions. First, we focus on the question of market integration. Over the period that
Sutton considered, he was able to assume that the soft drinks industry was mainly local, with
some multinational production. Essentially, it was assumed that a separate advertising outlay was
necessary to establish a brand image in each member state. This implies that competition within
Europe was taking place at the national rather than at the EU level. However, in 1987, the Single

2
European Act was legislated. If the EU market becomes the relevant competitive market, this is
equivalent to an increase in market size as firms will have access to a larger geographic area. As
market size increases, this yields the prediction that the incentive for firms to endogenously
escalate advertising expenditure is increased. The integration process may also be expected to
have some impact on the issue of where to locate production, or indeed, how to organize
distribution. Thus, our first extension is to consider the appropriate geographic level at which
competition takes place, and interestingly, whether this differs across the two major segments of
the soft drinks industry: carbonated soft drinks (CSDs) and mineral water.
Secondly, Sutton (1991) argues that a first mover may spend more on advertising than would be
the case under strategic symmetry, but may thereby succeed in relegating an equally efficient late
entrant to second place. In other words, it may be unprofitable for such a later entrant to attempt
to equal the leader at the high-quality end of the market, and so its advertising efforts might be
correspondingly muted. The soft drinks industry may be an example of this phenomenon where in
the US, Coca-Cola and PepsiCo are dominant firms and have more or less an equal market share
in the dominant cola segment; competition in advertising has had a large impact on market
structure. In the EU, by contrast, Sutton argued that Coca-Cola has a first mover advantage
dating from World War II. This first mover advantage has muted advertising competition, and
resulted in persistent market dominance. He showed that first, concentration is much lower in the
EU member states due to the large fringe of small producers, with lower advertising to sales
ratios. Secondly, Coca-Cola’s market share relative to Pepsi is much higher within the cola
segment. However, it is important to highlight that market size was also much smaller than in the
1 Robinson and Chiang (1996), Lyons and Matraves (1996), Lyons, Matraves and Moffatt (1999) provide furthercross-section empirical evidence in support of Sutton’s theoretical predictions.
3
US which, in turn, may have reduced the incentive for potential rivals to endogenously escalate
their advertising expenditure. If market size has increased, the soft drinks industry structure in the
EU may come to mirror the US more. Sutton was unable to separate the relative influences of
first mover advantage and market size. We provide such an attempt.
We analyze both segments of the soft drinks industry, using more recent data at the 3-digit level
of aggregation. Section two provides a brief summary of the underlying theoretical framework,
based on Sutton (1991). In section three, we first discuss the structural changes that have taken
place between 1987 and 1993. Second, we generate empirical predictions, feeding the exogenous
structural changes into the theoretical framework. Section four assesses whether the evidence on
concentration and advertising intensity is consistent with the derived hypotheses. It then moves on
to focus on the competitive strategies followed by the firms themselves, within the context of the
theoretical framework. Finally, section five summarizes and concludes.
2. Theoretical Framework: The Sutton Approach
The competitive roles that exogenous and endogenous sunk costs play in the determination of
market structure are now well known: Robinson and Chiang (1996), Lyons and Matraves (1996),
Matraves (1999) provide summaries of the Sutton (1991) approach. Suffice to say that following
Schmalensee (1992), we may split industries into two types: Type 1 and Type 2.2 In Type 1
industries (homogeneous/horizontally differentiated products), the traditional inverse structure-
size relation holds. In Type 2 industries, this relationship may break down due to the notion that
2 Sutton (Chapters 2 and 3, 1991) provide the formal theoretical exposition for both Type 1 and Type 2 industries.

4
expenditure on advertising/R&D in order to increase (perceived) quality is a choice variable. It is
this choice that emphasizes the fundamental difference because firms can react to increases in
market size by investing in quality enhancements. The consequent rise in overheads has a
countervailing effect on market structure by increasing the degree of economies of scale. Thus,
although there appears more room in a larger market, the escalation process raises fixed costs per
firm, possibly even to such an extent that the negative structure-size relation breaks down.
Certainly, the resulting market structure will be less fragmented than in a Type 1 industry.3
Consider the question of market integration within this framework. Since market concentration
results from the interaction between market size and a few key behavioral and technological
factors, it is extremely important that the correct market definition is used in empirical work.4 We
provide an attempt to correctly identify the geographic level at which competition takes place.
The criterion that is typically used to measure the degree of integration is the degree of
international trade: in this case, intra-EU trade. However, although trade is a reasonable indicator
of integration in production, it is unlikely to capture the relevant market for technology and
marketing ideas, particularly if firms are multinational. Endogenous sunk costs therefore introduce
the possibility of intra-firm economies of scope in their international operations.
The soft drinks industry is an advertising intensive industry. Unlike the results from R&D which
can be easily exploited across borders, even if production decisions do remain non-integrated,
advertising is highly dependent on local language, culture and media. This implies that advertising
is more likely to be incurred in each country, as long as the national market is large enough for
3 High production economies of scale work in favor of a more negative relation; while greater consumer sensitivityto endogenous investments weigh in favor of a shallow (or even positive) relation.

5
such spending to be worthwhile. If the relevant production market becomes the EU, but
advertising costs are incurred in each member state, this twists the balance of the fixed cost
mechanisms towards the importance of endogenous fixed costs. However, if advertising decisions
are taken at the EU level or, as is perhaps more likely, if marketing expertise is transferable across
national borders, then it can be argued that the firms’ corporate strategies are integrated. In other
words, given investment in firm specific assets, multinational production may be the best route to
exploit them, particularly as transport costs are high relative to the value of the product, making
price/quantity decisions more likely to be member state specific.
3. Structural Change: Any Predictions
This section considers recent structural changes in the soft drinks industry.5 These are important
to consider in some detail in order to derive predictions in the light of the theoretical framework.
First, ‘europeanization’ is discussed, essentially understood as the effect of the Single European
Market (SEM). This predicted effect of the increase of market size on concentration is derived.
Secondly, we analyze the potential consequences of structural forces on corporate strategy. We
argue that increased multinationality is the likely outcome of the europeanization process, and this
will have an impact on the level of concentration in the market. In other words, we use the notion
of endogenous investment in a firm-specific asset to influence competition in the market.6
4 Lyons, Matraves and Moffatt (1999) estimate a structural model of concentration and market size, developing aneconometric technique that endogenously determines whether the EU or the member state is the appropriate marketlevel for each country (thus consider the geographic dimension rather than the product dimension).5 Sutton separates out his analysis of CSDs and mineral water. We do not this as: i) on the demand side, mineralwater has recently become a direct substitute for CSDs; ii) more pragmatically, we use national statistics which aretypically compiled at the 3-digit level, although we do have some firm level evidence from company accounts.6 The notion of endogenous sunk costs has a direct parallel in the strategic management literature. When a firmmakes a large sunk investment, this commits them to certain strategies. If the industry is such that they expect rivalresponse, they may choose a certain investment to influence rival behavior (Thomas, 1996). For example, Thomasshows, using the RTE breakfast cereal industry, that managers may be able to preempt rivals by introducing newproducts with familiar brand names. Given sunk costs in advertising, incumbents have lower costs of product

6
3.1 Single European Market
By 1987, most tariff barriers had already been removed but many non-tariff barriers (NTBs)
remained. Buigues, Ilzkovitz and Lebrun (1990) identified the soft drinks industry as one with
high NTBs.7 Thus, various benefits from the SEM were expected. First come the direct benefits
associated with the reduction in the cost of trade, due mainly to the decrease in labeling and
packaging costs and the elimination of costs associated with importing. Secondly, and ex ante
difficult to predict, there were expected to be dynamic gains due to the increase in competitive
pressure. Allowing firms to compete directly with one another in a larger market was expected to
yield indirect benefits through increased efficiency, lower prices, and wider product variety.
These forces were not expected to affect all industries equally. Specific to the soft drinks market,
we emphasize that first, production economies of scale are relatively low and therefore, the
majority of firms were not previously operating at a cost disadvantage. Any efficiency benefits are
therefore likely to be low. Secondly, intra-EU trade has not significantly increased (moved from
4% of production in 1987 to 6% in 1992, compared to the average of 13% in an advertising
intensive industry).
introduction which implies preemptive entry if withdrawal costs (in terms of harming the firm’s reputation) arehigh.7 Representative examples include: i) 150 Italian municipalities banned plastic containers implying a significantdomestic advantage due to the lower incentive to import (high transport costs of glass); ii) until 1988, it was illegalin France to sell ‘diet’ soft drinks that contained aspartame; iii) fiscal measures (e.g., VAT differences, exciseduties) that effectively discriminated against importers. Emerson et al (1988) estimate that in 1985, EU pricedispersion was 33.2% when all taxes were included (the average was 19.4% for consumer goods). The EuropeanCommission estimated the benefits from eliminating: i) the plastic containers restriction as 15-50 million ECU peryear; ii) the aspartame restriction as 5 million ECU per year.
7
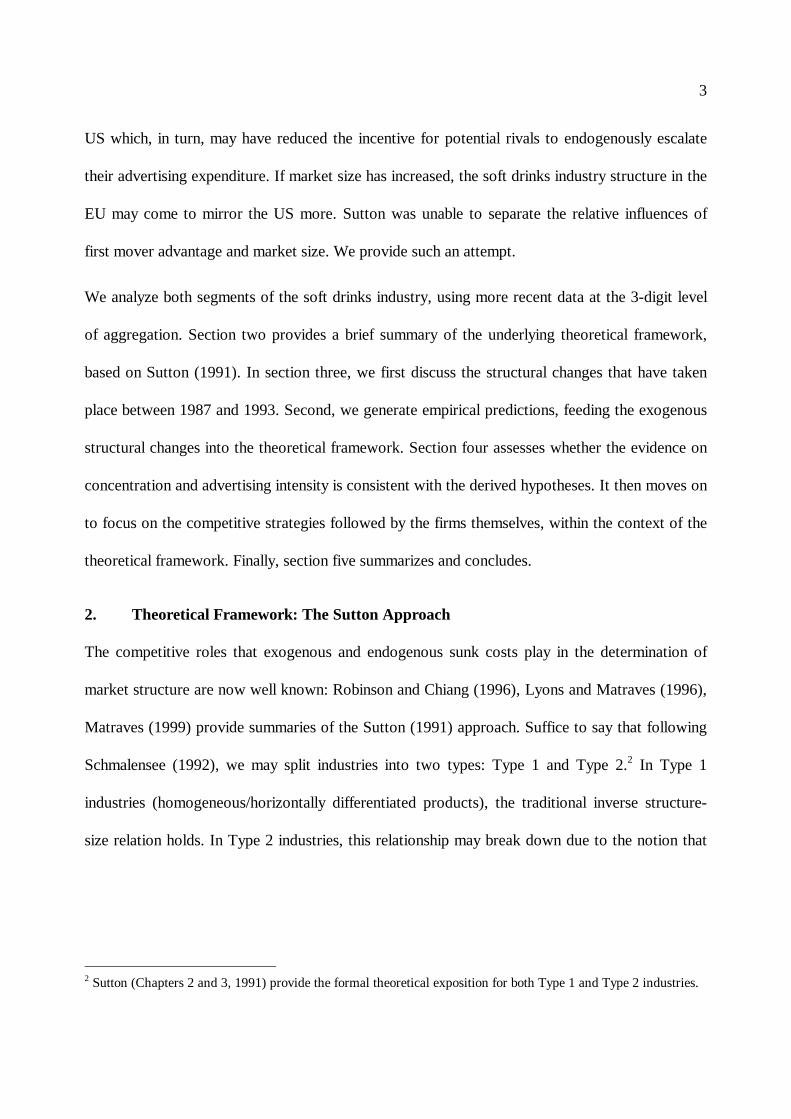
Table 1: Market Size in the Big Four and the EU (current prices, ECUm)
Market Size GER FR UK IT EU Apparent Consn EU Production
1987 2.46 2.08 2.3 1.52 11.06 11.411988 2.48 2.15 2.64 1514 12.39 12.591989 2.85 2.64 3.3 1.66 15.04 15.281990 3.16 3.44 3.42 1.87 16.93 17.21991 3.48 3.13 3.43 2.03 17.47 17.821992 3.62 3.17 3.46 2.25 18.15 18.471993 3.67 3.21 3.51 2.4 17.88 18.24
Source: National data are derived from Eurostat; EU data are derived from Panorama (1995), cross-checked forconsistency using the Eurostat data.
The continuing europeanization process increases effective market size as leading firms have
access to a wider geographical market. Table 1 shows the increase in actual market size due to
many factors including: i) the introduction of lightweight plastic bottles, and in particular, the use
of PET, which led to an expansion in capacity as the distribution range of the products could be
extended;8 ii) PET made possible the introduction of cheaper bulk packs which encouraged
domestic consumption; iii) the geographical spread of fast-food restaurants such as McDonalds;
and iv) consumer demand has increased in both market segments at the expense of alcoholic
drinks.9 Table 1 shows that between 1987 and 1993, the value of EU total soft drink production,
for example, increased from 11.3 to 18.2 billion ECU in 1993, although the growth rate has been
slowing since 1990.10 At current prices, the average annual growth rate in the overall EU market
between 1987 and 1993 was 8.4% for production (a real growth rate of 3.4%).11
8 By 1993, 51% of soft drinks were sold in non-returnable plastic containers in the UK and 65% in Italy(Panorama, 1995) The use of plastic is also increasing rapidly in other member states (apart from Germany due toconcern over environmental issues).9 Demand for mineral water has grown faster than that for CSDs in recent years, due mainly to its super-healthyimage (although diet carbonates and sports drinks have also benefited), and higher concern over tap water quality.Diet drinks are underdeveloped in most member states, apart from the UK (30% market share compared to 10%,on average, in the rest of the EU, Panorama, 1995).10 In 1984, EU market size was 8.8 billion ECU in current prices, compared with 23 billion for the US. By 1993,the gap had considerably decreased, with EU market size estimated at 18.2 and the US at 21.9.11 The EU deflator is obtained from Panorama of EU Industry (1994). Each member state deflator is derived fromOECD, Main Economic Indicators, various annual issues.

8
Table 2: Market Size by volume (billion liters)
1987 1993GermanyMineral Water 4.2 6.3CSDs 4.0a 6.7
FranceMineral Water 3.2b 5.4
CSDs 0.9b 2.3
ItalyMineral Water 4.7 6.7CSDs 1.1c 2.6
UKMineral Water 0.08d 0.5
CSDs 2.6d 4.1
Source: a) 1983 from Sutton (1991); b) Sutton (1991); c) Sutton (1991); d) Sutton (1991). All other figures arefrom Panorama (1995), except for the UK which come from Key Note (1994).
Table 2 shows market size by volume and by segment for the ‘Big 4’. Currently, the mineral water
segment accounts for approximately 40% of the EU market, but is far less important worldwide.
Focusing on intra-EU differences, the dominant market segment in the UK is CSDs, in Germany
the two segments are approximately equal, and in both France and Italy, mineral water dominates.
Reflecting the US pattern, the most popular carbonates flavor in all member states is cola, with a
share ranging from 41% in France to 49% in the UK to 56% in Greece (Panorama, 1995). Time
series evidence shows that over recent years, the volume of sales in the UK mineral water
segment has increased dramatically, although from a very low base, and consumption per capita
has almost trebled since 1990. In France and Italy, this pattern is completely reversed, the volume
increase in CSDs is substantially higher than in mineral water. Finally, in Germany, the volume
increases were almost equal. Table 2 provides some evidence that these two segments are
becoming closer substitutes over time. CSD manufacturers are also starting to focus on new types
of soft drinks that reflect changing consumer preferences towards bottled water and fruit juices
9
(Beverage Industry, 1997). As market size increases, this raises the incentive to escalate
advertising expenditure (Sutton, 1991).12 This yields Hypothesis 1.
Hypothesis 1: an increase in market size is associated with an increase in the level of advertising
by each surviving firm that, in turn, will tend to increase concentration.
3.2 Firms’ Competitive Actions: Changing Corporate Strategy
First, comes the impact of endogenous sunk costs. Our hypothesis is that the benefits of product
differentiation that lend themselves to advertising and associated firm specific talents, may lend
themselves to EU development, even if member state specific advertising campaigns are run. As
discussed in section two, if the integration of corporate strategy is an additional route to market
integration, firms may view their operations in different EU member states as interrelated, and
certain stages of the oligopoly game may be played at the EU level.
Thus, in Type 2 industries such as soft drinks, we cannot assume that integration will result in a
substantially less concentrated market. This is because the endogenous choice variable of
advertising is particularly sensitive to market size, and consequently, there may be little or no
intensification of price competition, with inter-firm rivalry, instead, being channeled into
endogenous fixed costs.13 Overall, our discussion highlights that, given the nature of the soft
drinks industry, we are not likely to observe increased integration through increased trade flows.
12 The toughness of price competition has increased in the 1990s, in the sense that private label started to takeaway market share. Cott Corp. offered comparable quality for its private label products, mostly colas, packaged thebrands well and sold them for 25% less than Coca-Cola or Pepsi. Cott also developed close relationships withdistributors (for example, Wal-Mart in the US, Sainsbury in the UK). It has been shown empirically only (the effectis theoretically indeterminate) that an increase in the toughness of price competition will tend to increaseconcentration irrespective of whether the industry is characterized by exogenous or endogenous sunk costs(Symeonidis, 1997a, 1997b).13 Even when the product is not intrinsically tradable so markets are geographically segmented, if ‘taste’differences are narrowing, then the oligopoly game will involve escalation in advertising at the EU or global leveland increased multi-market contact.
10
Instead, the still separate markets (in terms of production) are likely to become dominated by the
same set of MNEs. This yields Hypothesis 2.
Hypothesis 2: the impact of the SEM will come through merger and acquisition activity and
increased geographic diversification. This will increase concentration at the EU level.
Carbonated Soft Drinks
CSDs are made from concentrate: either small to medium sized firms operating in a local or
regional market obtain syrup from specialist firms or multinational enterprises (MNEs) make their
own syrup and franchise a network of regional and/or national bottlers who add sweeteners and
carbonated water to produce and distribute the final product. Within the EU, Coca-Cola and
PepsiCo historically had their own networks where independent firms were authorized to bottle
and sell the products within certain geographical regions.14 Bottlers could handle more than one
brand, but not brands that were in direct competition with one another (i.e., a bottler could handle
Pepsi and Fanta but would not then handle Coca-Cola). However, the bottler received territorial
exclusivity over its specified region in return.
We argue that there are two important competitive factors associated with the creation of the
SEM that will impact the organizational structure of the CSD segment as described above. First
comes the impact on production and distribution. On the one hand, although NTBs have been
eliminated, it could be the case that due to territorial exclusivity constraints, the EU CSD market
will remain geographically segmented in production. If the EU market becomes the relevant
competitive market, on the other hand, then this existing distribution system of national or
14 The franchisee provides the bottling and transportation equipment, the franchiser supplies the syrup. Thefranchisor’s brand name is displayed throughout, and the franchisor also provides management expertise, in termsof product quality control, marketing, advertising, etc.

11
regional bottlers may be forced to change, even though products such as soft drinks are naturally
less traded, due to transport costs. Also, economies of scale in bottling have increased over time
due to better transportation systems, and the reduction in the use of returnable bottles (Muris et
al, 1992).15 This means that fewer bottlers are required to supply the market.
Muris et al (1992) argue that in the US, changes in the external environment increased the
transaction costs between the concentrate manufacturers and their bottlers.16 Also, the new
competitive environment required new product and marketing strategies, whose implementation
required the close cooperation of the distribution system. In turn, this favored vertical integration
over contracting.17 These arguments can equally be applied to the creation of the single market in
the EU, leading to vertical integration being the preferred corporate strategy. National and indeed,
European supermarket chains are growing, making coordination between the firm and a network
of bottlers more difficult, and so, expensive. Also, in recent years, the rate of new product
introductions has increased. It is easier if the CSD manufacturer owns the bottler to introduce the
new product than convince an independent to make the necessary firm-specific investment, as
most new introductions fail. This yields Hypothesis 3.
Hypothesis 3: increased competitive pressures will be positively associated with increased
vertical integration within the CSD segment.
15 In the US, for example, the number of soft drink bottling plants has persistently decreased in 1950, there weremore than 6000 plants; this had declined to 3100 by 1970 (Katz, 1978), and 800 by 1990 (Muris et al, 1992).16 Historically, the value of CSDs relative to transport costs was low, and the use of returnable (and breakable)containers required local manufacturing and a substantial local delivery system. Thus, despite substantial assetspecificity, it was not possible to effectively organize hundreds of manufacturing and distribution operations, giventhe transportation and communication systems of that time.17 The one vital difference between Coca-Cola’s and Pepsi’s distribution system is that Pepsi’s franchise agreementgave its bottlers exclusive perpetual rights to fountain sales (both had perpetual exclusive territories). This limitedPepsi’s ability to negotiate such sales nationally and thus, their ability to compete effectively in the US fountainmarket (Muris et al, 1992).
12
Mineral Water
Mineral water producers are required by law to bottle at source (1984 EU directive), and are
therefore capacity constrained as compared to CSD firms in the sense that there is a finite supply
of water from each source. As with CSD producers, supply is typically characterized by a large
fringe who compete in a local/regional market, and MNEs.18 The same organizational franchising
system as observed in the CSD segment cannot be used in the mineral water segment due to the
legal requirement to bottle at source. This means that mineral water producers are forced to
export. Given the high transportation costs, this is likely to place a limit on the final market size.
This factor will tend to encourage multinationality as this is a route towards continued growth in
new markets.
4. Evidence
In this section, evidence is presented in support of Hypotheses 1-3. Hypothesis 1 states that in a
Type 2 industry, an increase in market size tends to be associated with an increase in advertising
expenditure and so, concentration. Hypothesis 2 states that the impact of the SEM will be to
increase the degree of multinationality at the firm level. This may have little impact on national
concentration as domestic incumbents are acquired but will have a significant effect on
concentration at the EU level, particularly if this is associated with pan-European advertising
campaigns.19 Hypothesis 3 states that an increase in competitive pressure is likely to have an
impact on how firms organize their production and distribution within the EU market in terms of
the degree of vertical integration.
18 Note that the bottling technology is such that it would be difficult to obtain a technological advantage inproduction in either segment.19 With the spread of satellite TV, we do already observe pan-European advertising for some soft drinks, e.g.,Pepsi, Coca-Cola, Fanta, 7-Up or Orangina.
13
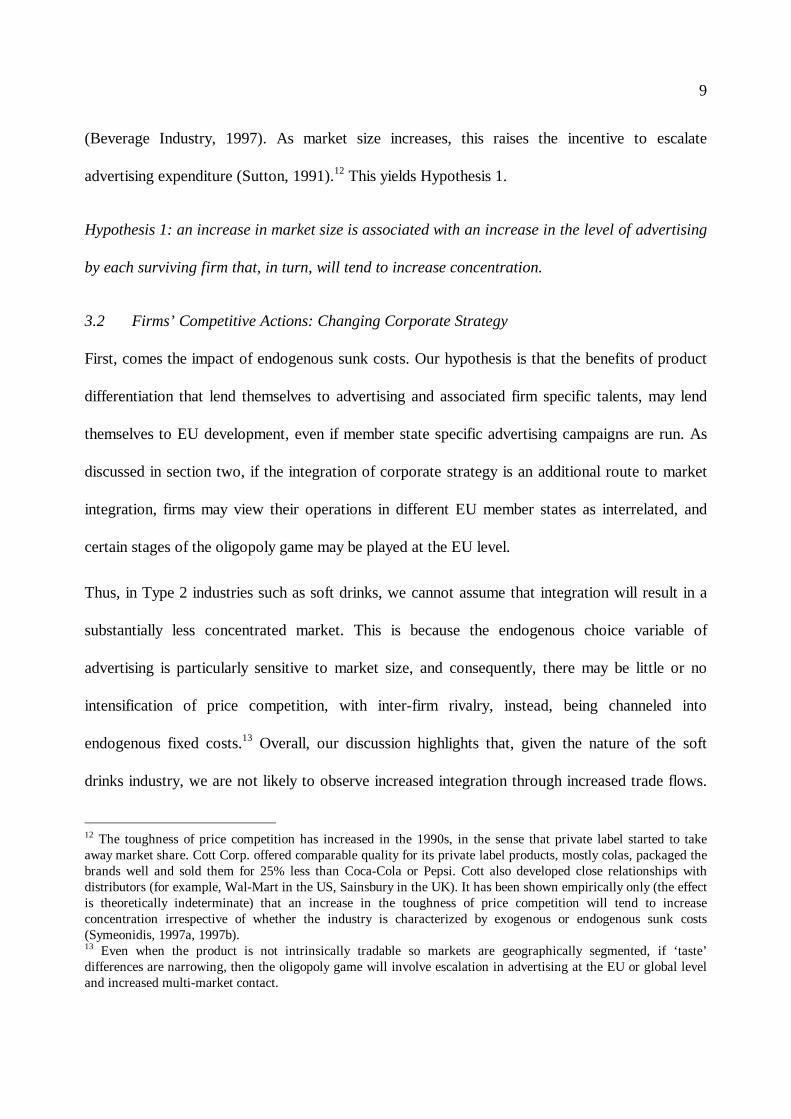
Table 3: UK and German Advertising to Sales Ratios
Year UK Germany1987 2.84 3.551988 2.79 3.671989 2.71 3.711990 2.75 3.501991 1.99 3.271992 2.33 3.561993 1.84 3.53
Source: Advertising Agency (MEAL) data (UK); A C Nielsen (Germany)
Consider first advertising expenditure. Table 3 shows that advertising expenditure has been
consistently above the 1% cut-off point for the industry classification as Type 1 or Type 2 (Davies
and Lyons, 1996) in both the UK and Germany over the period 1987 to 1993. The average
advertising to sales ratio over this period for the UK was 2.5% and for Germany was 3.5%.
However, the advertising to sales ratios do not vary much from year to year, indicating that
although advertising is increasing in line with market size, it is not increasing faster than market
size.
Table 4: Advertising expenditure by segment
Germany UK Italy FranceYear Cola Water Year Cola Water Year Cola Water Year Cola Water1986 13 22 1986 44 7 1985 - 48 1987 43 -1987 16 30 1987 60 14 1989 103 82 1991 - 981988 15 40 1988 75 23 1991 165 971989 15 41 1989 82 35
Source: Euromonitor (1993). Figures were converted into ECUm at the annual average exchange rate, taken fromEurostat, Money & Finance (1994).
Table 4 shows that, consistent with Hypothesis 1, where market size is larger in a particular
segment, advertising expenditure is also larger. Thus, the mineral water segment dominates
France and Italy, and advertising is significantly higher than in CSDs. The reverse is true for the
UK. Interestingly, Table 4 shows that advertising has been increasing far more rapidly in the UK
14
mineral water segment than in cola. The real average annual growth rate for mineral water
between 1986 and 1989 was 63%, compared with 17% for cola. This is suggestive of a response
to the boom in demand for mineral water over the late 1980s.
The mineral water segment is particularly interesting as it may highlight a possible limitation of the
theoretical framework. Sutton (1991) showed that in France, the escalation of advertising outlays
by Perrier was very effective in increasing market share, and subsequently, other currently leading
brands were also heavily advertised. By contrast, nothing similar had occurred in the other major
European markets by 1986. Germany remained fragmented, and Italy lay in between in terms of
concentration although firms were advertising intensively in both countries, and market conditions
were similar in terms of market size and consumer demand. Sutton argued that mineral water is an
outlier. However, if cross-country structural differences do reflect variation in the effectiveness of
advertising to stimulate willingness to pay, then the theoretical framework is flawed. In other
words, the usefulness of the theory is crucially dependent on the assumption that the advertising
response function depends only on certain product characteristics which may be impossible to
proxy but determine the effectiveness of advertising in increasing demand.20 What the theoretical
framework is not consistent with is the notion that the advertising response function depends on
idiosyncratic features of a firm’s advertising campaign. This is because at the heart of the
empirical methodology lies the ability to categorize industries into those in which advertising can
increase perceived quality and those in which it cannot. If variation in concentration across the EU
20 The advertising response function may also depend on observable institutional factors that differ acrosscountries, i.e. differences in regulation where TV advertising is more regulated in Europe than in the US; brandadvertising has never come close to US levels (Quelch and Harding, 1996). Also, there may exist culturaldifferences.
15
member states can be directly linked with the effectiveness of advertising campaigns, then the
theory may be flawed.21
Consider Hypothesis 2 relating to an increase in the degree of multinationality and its consequent
impact on concentration. Within the CSD segment, we observe reorganization of firm structure
(see below); within the mineral water sector, due to the legal requirement of bottling at source,
and a limit on capacity, we should observe an increase in multinationality. We look first at the
most important cross-border merger and acquisition activity that has taken place since 1987.
Secondly, the corresponding impact on concentration is discussed.
The most important acquisition was that of Perrier by Nestlé in 1992, and the subsequent sale of
Volvic to the French firm, Danone (the firm was then called BSN) - the sale of Volvic was
stipulated by the European Commission, along with certain other conditions. This acquisition
fundamentally altered the EU mineral water segment. In 1987, the combined market share of the
top three firms was about 60%.22 Pre-merger, Perrier had considerable free capacity in the
majority of its sources, Nestlé was operating close to capacity in all its sources and in the case of
Danone, its still water brand, Evian, was not operating to maximum capacity, but its sparkling
water brand, Badoit, was. The sale of Volvic to Danone, with Nestlé retaining the Perrier sources,
gave both firms considerable extra capacity and more brands.23 Also, through the acquisition of
Perrier, Nestlé now controls major springs in a number of EU member states (e.g., Buxton in the
21 Differences in concentration could arise from observing disequilibrium market structure in certain countries. Ifthis is true, German market structure may, over time, come to approximate the market structure observed inFrance.22 As the demand for mineral water has increased, new springs have been opened, mainly by small firmscompeting in price only. These local firms do not have a large enough market, due to the limitations imposed bytransport costs, to invest in advertising.23 Interestingly, Danone’s leading brands (Evian and Volvic) are both waters of low mineral content (< 500 mg perliter) whereas Nestlé’s leading brands (Contrex, Vittel and Hépar) are waters of high mineral content (> 500 mg

16
UK). Therefore, any future EU-wide increase in demand could then be fulfilled by these two
firms. Post-merger, the 1993 combined market share of Nestlé and Danone was about 82% in
France, and approximately 35% of the overall EU mineral water market (Panorama, 1994).24
Focusing on other important EU markets in terms of size,25 in both Italy and Germany, the leading
brands are typically bottled in glass, substantially increasing the importance of transport costs. As
there exist few national retailers, this hinders the nationalization of the market due to
distributional problems. In Germany, 1993 mineral water consumption was higher than in France,
but the industry remains fragmented: the top four firms controlled approximately 25% of the
market. The leading firms are subsidiaries of major food and drink manufacturers (e.g. Apollinaris
is owned by a leading brewer, Brau und Brunnen; Blaue Quellen is owned by Nestlé). Although
the mineral water market segment is advertising intensive, there is comparatively little TV
advertising in contrast to CSDs. However, Euromonitor (1993) asserts that demand for premium
brands has risen in recent years, primarily due to their sophisticated yet healthy image.
Notwithstanding this, the production of mineral water remains dominated by relatively small
enterprises; only a few brands go beyond regional or even local boundaries. In Italy, since 1986,
as market size has increased, advertising has also increased, and the market has become more
concentrated over the past decade. Danone sold the Fabia and Sangemini brands to Terme Di
per liter). As a result of the merger, Danone and Nestlé have also succeeded in further segmenting the Frenchmarket horizontally (in terms of the product characteristics), as well as by perceived quality.24 Since 1987, Danone has expanded substantially in Spain and Italy; and Nestlé in Germany and Italy (acquiringSan Bernardo in 1993, and 25% of San Pellegrino through Perrier).25 In the UK, Perrier was the leading brand in 1987, with the highest advertising and a 60% market share. Marketsize has been rapidly increasing, although from a very small base. As mineral water production is low-tech, newfirms can enter relatively easily which has contributed to the strong own-label growth (accounting for 42% of 1993sales in the grocery sector). In 1993, advertising was as follows: Evian=£0.7m; Highland Spring=Volvic=£0.69m;Perrier=£0.44m. As the theoretical framework predicts, such expenditures are reflected in the firms’ marketshares. It is estimated that Evian is now the market leader in terms of volume, with a market share of 11.2%, thenBuxton with 6.5%, Volvic with 6.1%, and Highland Spring with 5.8% (Key Note, 1994). Perrier now has only a3.9% market share (although it still has a high price premium).
17
Acqui (Ciarrapico) in order to concentrate on Ferrarelle and Boario; Nestlé took a 25% interest in
San Pellegrino through the acquisition of Perrier.
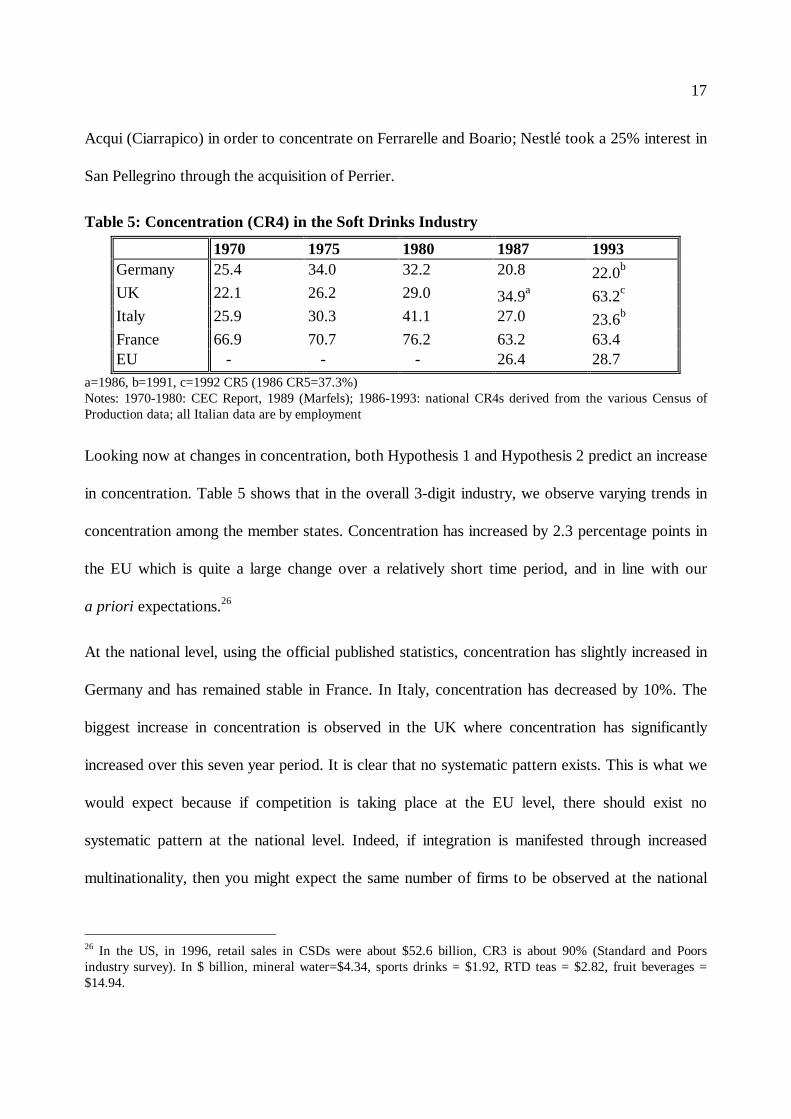
Table 5: Concentration (CR4) in the Soft Drinks Industry
1970 1975 1980 1987 1993Germany 25.4 34.0 32.2 20.8 22.0b
UK 22.1 26.2 29.0 34.9a 63.2c
Italy 25.9 30.3 41.1 27.0 23.6b
France 66.9 70.7 76.2 63.2 63.4EU - - - 26.4 28.7
a=1986, b=1991, c=1992 CR5 (1986 CR5=37.3%)Notes: 1970-1980: CEC Report, 1989 (Marfels); 1986-1993: national CR4s derived from the various Census ofProduction data; all Italian data are by employment
Looking now at changes in concentration, both Hypothesis 1 and Hypothesis 2 predict an increase
in concentration. Table 5 shows that in the overall 3-digit industry, we observe varying trends in
concentration among the member states. Concentration has increased by 2.3 percentage points in
the EU which is quite a large change over a relatively short time period, and in line with our
a priori expectations.26
At the national level, using the official published statistics, concentration has slightly increased in
Germany and has remained stable in France. In Italy, concentration has decreased by 10%. The
biggest increase in concentration is observed in the UK where concentration has significantly
increased over this seven year period. It is clear that no systematic pattern exists. This is what we
would expect because if competition is taking place at the EU level, there should exist no
systematic pattern at the national level. Indeed, if integration is manifested through increased
multinationality, then you might expect the same number of firms to be observed at the national
26 In the US, in 1996, retail sales in CSDs were about $52.6 billion, CR3 is about 90% (Standard and Poorsindustry survey). In $ billion, mineral water=$4.34, sports drinks = $1.92, RTD teas = $2.82, fruit beverages =$14.94.
18
level, perhaps with concentration increasing over time due to exploitation of firm-specific assets,
and an increase in concentration at the EU level.
Hypothesis 3 linked increasing competitive pressure and reorganization of the franchise network
in order to better exploit the wider market and expand internationally. We argued that leading
firms were more likely to vertically integrate to exploit the new market opportunities. This is
observed in the data, particularly in the case of Coca-Cola, giving the firm direct control over the
distribution and marketing of the product.
In France, for example, Pernod-Ricard used to hold the Coca-Cola franchise. Coca-Cola was
dissatisfied with sales because: i) CSD market size was very small compared with other EU
markets; ii) Coca-Cola was not the market leader. Coca-Cola’s main objectives in taking over
bottling were to improve its distribution system and customer relationships, and sales have
dramatically increased since. The 1993 company report shows that over the past 5 years, the
average annual growth rate (volume) was 15%, compared with an industry average of 9%.
In Germany, a wholly-owned subsidiary manages a national network of local bottlers. In 1983,
there were more than 100 bottlers franchised; by 1989, this number was 61.27 This indicates, as
also observed in the US market, the movement towards consolidation as the market became more
mature. Coca-Cola dominates the German market with a 1996 volume market share of 56%,
compared to Pepsi’s 5% and is also the largest advertiser, mainly via television (Euromonitor,
1993). Coca-Cola also dominates the Italian market (48% volume market share in 1996)
27 Traditionally, most bottling plants were under the control of the brewers, of whom there are hundreds as theywere protected by the German beer purity laws. However, following the EU decision that the beer purity law isillegal, substantial restructuring is expected as German firms will now face increased competition.
19
compared to PepsiCo’s 13%, which has been slowly increasing since 1988 when San Benedetto,
an established mineral water producer, began to bottle Pepsi and 7-Up.
UK market structure was radically altered in 1986 when two new ventures were formed: i) a JV
between Coca-Cola and Schweppes Beverages (hereafter, CCSB); ii) a merger between the soft
drinks businesses of Britvic and Britannia Soft Drinks, forming Britvic.28 The main incentive was
that the market was becoming national rather than regional (equivalent to an increase in effective
market size), and retail chains and other buyers wanted to do business with one national rather
than many regional suppliers.29 Also, using several bottlers meant that marketing incentives were
lessened as advertising efforts would, in part, be appropriated by other firms.
A 1991 Monopolies and Mergers Commission (MMC) inquiry found that CCSB had a 42.7%
share by market value and Britvic a 22.4% market share. Since 1987, Britvic had increased their
market share from 19.5%, but at the expense of smaller firms, rather than CCSB.30 It was
estimated that the number of firms operating in the UK was 100, compared with the 1986
estimate of 270 firms (Sutton, 1991). By 1993, the number of firms operating in the UK was
28 At this point in time, CCSB controlled the Coca-Cola, Fanta and Lilt brands, and also Schweppes, Russchian,etc., giving them a presence in most market niches; since 1990, they have considerably expanded abroad, acquiringPerrier’s non-water interests to give a strong position in Spain and France. Britvic is the only other UK firm toproduce a full range, including Pepsi and 7-Up, with a far stronger position in the licensed trade due to connectionswith leading brewers.29 In the UK, the top 5 supermarkets account for 62% of sales, versus 21% in the US; 54% of Sainsbury’s salescome from own-brand labels (Quelch and Harding, 1996). When Sainsbury’s Classic was first introduced in 1994,2 liters cost 59 pence versus 105 pence for Coke; Coca-Cola’s market share initially slumped from 63% to 33% inSainsbury supermarkets. In 1995, own-label cola took 65% of total cola sales in Sainsbury and 15% of the total UKcola market (Quelch and Harding, 1996).30 In 1993, Britvic/PepsiCo launched a new brand, Pepsi Max, a diet cola with a trendy appeal, spending £3.5m onadvertising. This was the first time PepsiCo had launched a new product in any other market apart from the US,first introducing it in Scotland. By contrast, CCSB spent only £1.2m on its diet brand, Diet Coca-Cola. Thus, anabsolutely higher amount was spent by Britvic/PepsiCo and Pepsi Max immediately took a 10% market share, andaccounted for 20% of Pepsi’s UK sales by the end of 1995. The observed successful strategy is not to compete withCoca-Cola on exactly the same product, but instead to innovate, to develop new market niches. Britvic alsointroduced a new innovative and award winning advertising campaign for its Tango brand, highlighting its tangyorange flavor. The packaging was also redesigned, and the brand increased its market share.

20
further reduced to 70 (Panorama, 1995). The evidence on the number of firms is consistent with
the Sutton hypothesis that the less efficient firms or the large fringe of small firms can no longer
compete as advertising expenditure escalates. The firms escalating their expenditure will break
free from the rest of the pack, and either merger and/or exit takes place. In 1996, Coca-Cola
bought out the franchise agreement, ending the 10 year old UK joint venture, and consistent with
Hypothesis 2, this shows further evidence of forward vertical integration.
In 1997, Coca-Cola created a new ‘anchor bottler’ in the Nordic countries called Coca-Cola
Nordic Beverages to serve Denmark, Sweden and Norway. This was a joint venture between
Coca-Cola (49%) and Carlsberg A/S (51%). In 1998, the largest Coca-Cola bottler outside North
America was split into two companies. Coca-Cola Amatil Limited of Australia which had
expanded to include operations in 18 countries on three continents spun off its European bottling
operations as a separate publicly listed company, Coca-Cola Beverages (Coca-Cola owns 50%).31
Overall, the evidence is consistent with Hypothesis 3.
5. Summary and Conclusions
The main objective of this industry case was to assess the effect of European integration on the
competitive process in the soft drinks industry, applying the new theory of industrial structure as
developed most fully in Sutton (1991). Our results showed first that as market size increased, so
too did advertising expenditure, although not faster than market size. Secondly, an increase in
concentration was observed at the EU level, and no systematic pattern was observed at the
national level. We predicted that market integration would have differential effects on the two
31 1997: Coca-Cola Enterprises is the world’s largest bottler, accounting for over half of all Coke products bottledin the US (44% owned by Coca-Cola in 1997). Pepsi bottling operations accounted for 52% of Pepsi’s soft drinksales in the US.

21
major segments within the soft drinks industry in the way that firms responded. Undertaking such
a case study allowed us to assess how different structural features impacted the way that firms
respond to the underlying Type 2 industry nature.
Within the mineral water segment, firms are capacity constrained by the legal requirement of
bottling at source. Market size has been increasing over the past decade across all member states
(starting from a very low base in the UK). Both the French and Italian market structures have
been characterized by increasing consolidation, and the extent of MNE activity has also rapidly
increased. It was argued (Sutton, 1991) that the French market was relatively stable. We believe
that one of the major reasons the Nestlé-Perrier merger took place was in order to exploit the
Perrier brand name across the entire EU. In general, it is difficult for advertising campaigns to be
transferable across borders, if only because of language difficulties, but it may be easier to transfer
management expertise. Thus, the EU may become unified through integration of corporate
strategy. As observed in the data, MNEs such as Nestlé and Danone are acquiring mineral water
springs in various member states; distribution is limited only by the degree of transport costs.
Within the CSD segment, we then investigated the extent of a first-mover advantage. We showed
that market size increased, raising the incentive for PepsiCo and other CSD firms to escalate their
advertising expenditure. If other soft drink firms such as PepsiCo do begin to heavily advertise
their products as market size increases, but Coca-Cola does not lose market share, then we can
conclude that the first-mover advantage must be stronger than the market size effect. On the other
hand, if we were to observe an erosion in Coca-Cola’s market share, this would suggest that other
firms are successfully convincing consumers that the (perceived) quality of their products is higher
than Coca-Cola. In all member states, Coca-Cola has not been losing market share. Only in the
22
UK market is PepsiCo succeeding in persuading consumers to buy their product, with the
introduction and subsequent intensive advertising of their innovative product, Pepsi Max.
Interestingly, this implies that the first-mover advantage is stronger than the market size effect.
In conclusion, we have shown that the soft drinks industry is currently in transition, becoming
increasingly dominated by MNEs who make decisions based on overall opportunities within the
European market. Thus, this case study suggests that trade integration is not the only route to
market integration. Integration of corporate strategy through multinationality is an additional way.
23
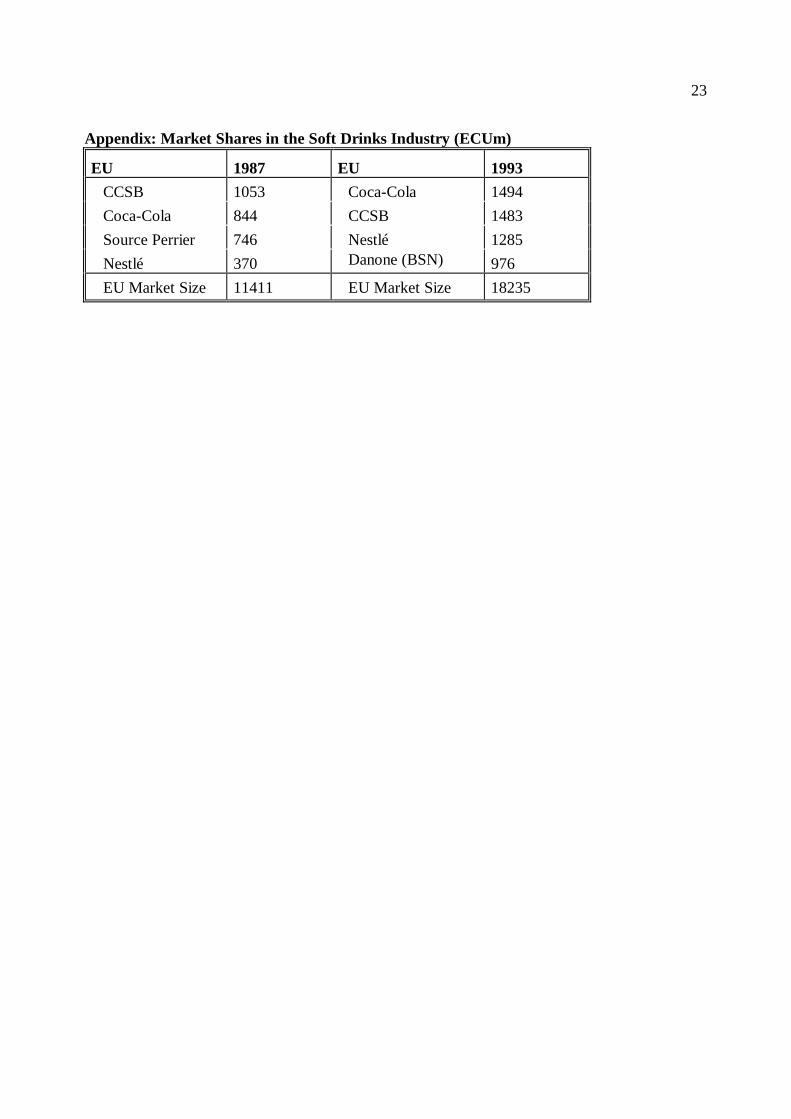
Appendix: Market Shares in the Soft Drinks Industry (ECUm)
EU 1987 EU 1993
CCSB 1053 Coca-Cola 1494
Coca-Cola 844 CCSB 1483
Source Perrier 746 Nestlé 1285
Nestlé 370 Danone (BSN) 976
EU Market Size 11411 EU Market Size 18235
24
References
Bresnahan, T. F., 1989, ‘Empirical Studies of Industries with Market Power’, in R. Schmalensee
and R. Willig, eds., Handbook of Industrial Organization, Amsterdam: North Holland, 1011-
1057.
Buigues, P., Ilzkovitz, F. and J. F. Lebrun, 1990, The impact of the internal market by industrial
sector: the challenge for the Member States', European Economy, Brussels, Special Edition.
Emerson, M., et al., 1988, The Economics of 1992, Oxford: Oxford University Press.
Euromonitor, 1993, Soft Drinks in Europe, London.
European Commission, Case Number IV/M 190: Nestlé and Perrier, 92/553/EEC; Case Number
IV/M 794: Coca-Cola/Amalgamated, 97/540/EC.
Geroski, P., 1988, 'Im pursuit of Monopoly Power: Recent Quantitative Work in Industrial
Economics', Journal of Applied Econometrics, 3, 107-123.
Katz, B., 1978, ‘Territorial Exclusivity in the Soft Drink Industry’, Journal of Industrial
Economics, 27, 85-96.
Kay, J. A., 1990, ‘Identifying the Strategic Market’, Business Strategy Review, 2-24.
Key Note Market Review, 1994, The UK Soft Drinks Market, Middlesex.
Lyons, B. R., and C. Matraves, 1996, ‘Industrial Concentration’, in Davies, S. W. and Lyons, B.
R. (eds.), Industrial Organization in the European Union: Structure, Strategy and the
Competitive Mechanism, Oxford: Oxford University Press.
Lyons, B. R., Matraves, C, and P. Moffatt, 1999, ‘Industrial Concentration and Market
Integration in the European Union’, Working Paper.
Matraves, C., 1999, ‘Market Structure, R&D and Advertising in the Pharmaceutical Industry’,
Journal of Industrial Economics, 169-194.
Marfels, C., 1984, Concentration, Competition and Competitiveness in the Beverages Industries
of the European Community, Report for the Commission of the European Communities, Belgium.
Monopolies and Mergers Commission, 1991, A report on the supply by manufacturers of
carbonated drinks in the UK, London.
Muris, T. J., Scheffman, D. T. and P. T. Spiller, 1992, 'Strategy and Transactions Costs: the
Organization of Distribution in the Carbonated Soft Drink Industry', Journal of Economics and
Management Strategy, 1, 84-128.

25
Panorama of EC industry, Commission of the European Communities, Brussels - 1994, 1995 and
1997 issues.
Quelch, J.A. and D. Harding, 1996, 'Brands versus private labels: fighting to win', Harvard
Business Review, 99-111.
Robinson, W. T., and Chiang, J., 1996, ‘Are Sutton’s Predictions Robust? Empirical Insights into
Advertising, R&D and Concentration’, Journal of Industrial Economics, 389-408.
Schmalenesee, R., 1992, ‘Sunk Costs and Market Structure: A Review Article’, Journal of
Industrial Economics, 125-134.
Standard & Poors Industry Surveys, ‘Foods and Nonalcoholic Beverages’, 1997.
Sutton, J., 1991, Sunk Costs and Market Structure: Price Competition, Advertising, and the
Evolution of Concentration, MIT Press.
Sutton, J., 1998, Technology and Market Structure: Theory and History, MIT Press.
Symenoidis, G., 1997a, ‘Price Competition and Market Structure: the impact of Restrictive
Practices Legislation on Concentration in the UK’, LSE Sticerd, EI/18.
Symenoidis, G., 1997b, ‘Cartel Policy, Non-Price Competition and Market Structure: Theory and
Evidence from the UK’, LSE Sticerd, EI/19.
Thomas, Louis A., 1996, ‘Advertising Sunk Costs and Credible Spatial Preemption’, Strategic
Management Journal, 17, 481-498.
Tollison, R., Kaplan, D. and R. Higgins, 1991, Competition and Concentration: the Economics of
the Carbonated Soft Drinks Industry, Lexington Books, USA.
Bücher des Forschungsschwerpunkts Marktprozeß und Unternehmensentwicklung
Books of the Research Area Market Processes and Corporate Development
(nur im Buchhandel erhältlich/available through bookstores)
Horst Albach, Ulrike Görtzen, Rita Zobel (Hg.)Information Processing as a CompetitiveAdvantage of Japanese Firms1999, edition sigma
Dieter KösterWettbewerb in Netzproduktmärkten1999, Deutscher Universitäts-Verlag/Gabler Verlag
Christian WeyMarktorganisation durch Standardisierung: EinBeitrag zur Neuen Institutionenökonomik desMarktes1999, edition sigma
Horst Albach, Meinolf Dierkes, Ariane BerthoinAntal, Kristina Vaillant (Hg.)Organisationslernen � institutionelle undkulturelle Dimensionen1998, edition sigma
Lars Bergman, Chris Doyle, Jordi Gual, LarsHultkrantz, Damien Neven, Lars-Hendrik Röller,Leonard WavermanEurope�s Network Industries: ConflictingPriorities - TelecommunicationsMonitoring European Deregulation 11998, Centre for Economic Policy Research
Manfred FleischerThe Inefficiency TrapStrategy Failure in theGerman Machine Tool Industry1997, edition sigma
Christian GösekeInformation Gathering and DisseminationThe Contribution of JETRO toJapanese Competitiveness1997, Deutscher Universitäts-Verlag
Andreas SchmidtFlugzeughersteller zwischen globalemWettbewerb und internationaler KooperationDer Einfluß von Organisationsstrukturen aufdie Wettbewerbsfähigkeit vonHochtechnologie-Unternehmen1997, edition sigma
Horst Albach, Jim Y. Jin, Christoph Schenk (eds.)Collusion through Information Sharing?New Trends in Competition Policy1996, edition sigma
Stefan O. GeorgDie Leistungsfähigkeit japanischer BankenEine Strukturanalyse des Bankensystems inJapan1996, edition sigma
Stephanie RosenkranzCooperation for Product Innovation1996, edition sigma
Horst Albach, Stephanie Rosenkranz (eds.)Intellectual Property Rights and GlobalCompetition - Towards a New Synthesis1995, edition sigma.
David B. AudretschInnovation and Industry Evolution1995, The MIT Press.
Julie Ann ElstonUS Tax Reform and Investment: Reality andRhetoric in the 1980s1995, Avebury
Horst AlbachThe Transformation of Firms and Markets:A Network Approach to EconomicTransformation Processes in East GermanyActa Universitatis Upsaliensis, Studia OeconomiaeNegotiorum, Vol. 341994, Almqvist & Wiksell International(Stockholm).
Horst Albach"Culture and Technical Innovation: A Cross-Cultural Analysis and PolicyRecommendations"Akademie der Wissenschaften zu Berlin (Hg.)Forschungsbericht 9, S. 1-5971994, Walter de Gruyter.
Horst AlbachZerissene Netze. Eine Netzwerkanalyse desostdeutschen Transformationsprozesses1993, edition sigma.
Zoltan J. Acs/David B. Audretsch (eds)Small Firms and Entrepreneurship: An East-West Perspective1993, Cambridge University Press.
Anette BoomNationale Regulierungen bei internationalenPharma-Unternehmen: Eine theoretischeAnalyse der Marktwirkungen1993, Nomos Verlagsgesellschaft.
DISCUSSION PAPERS 1997
Rabah Amir R&D Rivalry and Cooperation under FS IV 97 - 1John Wooders One-Way Spillovers
Frank Verboven Testing for Monopoly Power when Products FS IV 97 - 2are Differentiated in Quality
Frank Verboven Localized Competition, Multimarket Operation FS IV 97 - 3and Collusive Behavior
Jim Y. Jin Comparing Cournot and Bertrand Equilibria Revisited FS IV 97 - 4
Reinhard Koman Human Capital and Macroeconomic Growth: FS IV 97 - 5Dalia Marin Austria and Germany 1960-1992
Lars-Hendrik Röller Why Firms Form Research Joint Ventures: FS IV 97 - 6Mihkel M. Tombak Theory and Evidence
Ralph Siebert
Rabah Amir Cooperation vs. Competition in R&D: FS IV 97 - 7John Wooders The Role of Stability of Equilibrium
Horst Albach Learning by Doing, Spillover and Shakeout in FS IV 97 - 8Jim Jin Monopolistic Competition
Dietmar Harhoff Innovationsanreize in einem strukturellen FS IV 97 - 9Oligopolmodell
Catherine Matraves Die deutsche Industriestruktur im internationalen FS IV 97 - 10Vergleich
Yair Tauman A Model of Multiproduct Price Competition FS IV 97 - 11Amparo Urbano
Junichi Watanabe
Dalia Marin The Economic Institution of International FS IV 97 - 12Monika Schnitzer Barter
William Novshek Capacity Choice and Duopoly Incentives FS IV 97 - 13Lynda Thoman for Information Sharing
Horst Albach Wirtschaftspolitische und technologie- FS IV 97 - 14politische Folgen der Globalisierung
Horst Albach Humankapitaltheorie der Transformation FS IV 97 - 15
Horst Albach Gutenberg und die Zukunft der Betriebs- FS IV 97 - 16wirtschaftslehre
Horst Albach Risikokapital in Deutschland FS IV 97 - 17Dieter Köster
Hiroyuki Okamuro Risk Sharing in the Supplier Relationship: New FS IV 97 - 18Evidence from the Japanese Automotive Industry
Bernard Sinclair-Desgagné Career Concerns and the Acquisition FS IV 97 - 19Olivier Cadot of Firm-Specific Skills
Steven Casper Corporate Governance and Firm Strategy FS IV 97 - 20Catherine Matraves in the Pharmaceutical Industry
Bruce R. Lyons Industrial Concentration and Market Integration FS IV 97 - 21Catherine Matraves in the European Union
Peter Moffatt
Petri Lehto Consolidations and the Sequence FS IV 97 - 22Mihkel M. Tombak of Acquisitions to Monopoly
Vesa Kanniainen Project Monitoring and Banking Competition FS IV 97 - 23Rune Stenbacka under Adverse Selection
Dalia Marin Economic Incentives and International Trade FS IV 97 - 24Monika Schnitzer
Ila M. Semenick Alam Long Run Properties of Technical Efficiency FS IV 97 - 25Robin C. Sickles in the U.S. Airline Industry
Dietmar Harhoff Citation Frequency and the Value FS IV 97 - 26Francis Narin of Patented Innovation
Frederic M. SchererKatrin Vopel
Dietmar Harhoff Exploring the Tail of Patented FS IV 97 - 27Frederic M. Scherer Invention Value Distributions
Katrin Vopel
Jim Jin The Effect of Public Information on FS IV 97 - 28Michael Tröge Competition and R&D Investment
Daniel A. Traca Import-Competition, Market Power FS IV 97 - 29and Productivity Change
Michael Tröge Banking Competition as Mixed Common and FS IV 97 - 30Private Value Auction
Lars-Hendrik Röller Capacity and Product Market Competition: FS IV 97 - 31Robin C.Sickles Measuring Market Power in a "Puppy-Dog" Industry
Talat Mahmood Survival of Newly Founded Businesses: FS IV 97 - 32A Log-Logistic Model Approach
Silke Neubauer Interdivisional Information Sharing - The Strategic FS IV 97 - 33Advantage of Knowing Nothing
Silke Neubauer The Consequences of Endogenous Timing for FS IV 97 - 34Diversification Strategies of Multimarket Firms
Christoph Schenk Capacity Decisions and Subcontracting FS IV 97 - 35
Michael Tröge Industry Ownership of Banks and Credit FS IV 97 - 36Market Competition
Petra Korndörfer The Link Between Interest Rates on Interbank Money FS IV 97 - 37and for Credit Lines: Are Asymmetric Interest RateAdjustments Empirically Evident?
Damien J. Neven Union Power and Product Market Competition: FS IV 99 - 5Lars-Hendrik Röller Evidence from the Airline Industry (FS IV 97 - 38)
Zhentang Zhang
Horst Albach Dokumentation der Kaisha-Datenbank - Zur FS IV 97 - 39Ulrike Görtzen Datenbank der Jahresabschlüsse japanischerTobias Miarka Industrieaktiengesellschaften 1970-1997
Andreas MoerkeThomas Westphal
Rita Zobel
Tobias Miarka New Directions in Japanese Bank-Firm-Relationships: FS IV 97 - 40Jianping Yang Does a Relationship Matter for Corporate Performance?
Ulrike Görtzen R&D Activities and Technical Information Flow FS IV 97 - 41in Japanese Electronic Corporations
Andreas Moerke Japanische Unternehmensgruppen - eine FS IV 97 - 42empirische Analyse
Andreas Moerke Does Governance Matter? Performance and FS IV 97 - 43Corporate Governance Structures of Japanesekeiretsu Groups
Rita Zobel Employee-Transfer as an Instrument of Information- FS IV 97 - 44Transfer through Vertical Relations?
Dietmar Harhoff Are there Financing Constraints for R&D and FS IV 97 - 45Investment in German Manufacturing Firms?
Lutz Bellmann Zur Analyse von Gründungen und Schließungen FS IV 97 - 46Dietmar Harhoff auf Grundlage der Beschäftigtenstatistik
Norbert Schulz
Andreas Stephan The Impact of Road Infrastructure on Productivity FS IV 97 - 47and Growth: Some Preliminary Results for theGerman Manufacturing Sector
Jim Y. Jin Incentives and Welfare Effect of Sharing FS IV 97 - 48Firm-Specific Information
Jim Y. Jin Information Sharing about a Demand Shock FS IV 97 - 49
DISCUSSION PAPERS 1998
Horst Albach Unternehmensgründungen in Deutschland FS IV 98 - 1Potentiale und Lücken
Dietmar Harhoff Vertical Organization, Technology Flows and R&D FS IV 98 - 2Incentives - An Exploratory Analysis
Karel Cool Der Einfluß des tatsächlichen und des potentiellen FS IV 98 - 3Lars-Hendrik Röller Wettbewerbs auf die Rentabilität von Unternehmen
Benoit Leleux der pharmazeutischen Industrie
Horst Albach Blühende Landschaften? FS IV 98 - 4Ein Beitrag zur Transformationsforschung
Shiho Futagami Shukko in Japanese Companies and its Economic FS IV 98 - 5Tomoki Waragai and Managerial Effects
Thomas Westphal
Dietmar Harhoff Lending Relationships in Germany: Empricial FS IV 98 - 6Timm Körting Results from Survey Data
Johan Lagerlöf Are We Better Off if Our Politicians Know FS IV 98 - 7How the Economy Works?
Justus Haucap Location Costs, Product Quality, and Implicit FS IV 98 - 8Christian Wey Franchise Contracts
Jens Barmbold
Manfred Fleischer Patenting and Industrial Performance: The C ase FS IV 98 - 9of the Machine Tool Industry
Dieter Köster Was sind Netzprodukte? - Eigenschaften, FS IV 98 - 10Definition und Systematisierung von Netzprodukten
Andreas Blume Coordination and Learning with a Partial Language FS IV 98 - 11
Andreas Blume An Experimental Investigation of Optimal Learning FS IV 98 - 12Uri Gneezy in Coordination Games
Andreas Blume Learning in Sender-Receiver Games FS IV 98 - 13Douglas V. DeJong
George R. NeumannNathan E. Savin
Hans Mewis The Stability of Information Cascades: How Herd FS IV 98 - 14Behavior Breaks Down
Lars-Hendrik Röller The Incentives to Form Research Joint Ventures: FS IV 98 - 15Mihkel M. Tombak Theory and Evidence
Ralph Siebert
Christine Zulehner Econometric Analysis of Cattle Auctions FS IV 98 - 16
Catherine Matraves Market Structure, R&D and Advertising FS IV 98 - 17in the Pharmaceutical Industry

DISCUSSION PAPERS 1999
Suchan Chae Bargaining Power of a Coalition in Parallel Bargaining: FS IV 99 - 1Paul Heidhues Advantage of Multiple Cable System Operators
Christian Wey Compatibility Investments in Duopoly with Demand FS IV 99 - 2Side Spillovers under Different Degrees of Cooperation
Horst Albach Des paysages florissants? Une contribution FS IV 99 - 3à la recherche sur la transformation
Jeremy Lever The Development of British Competition Law: FS IV 99 - 4A Complete Overhaul and Harmonization
Damien J. Neven Union Power and Product Market Competition: FS IV 99 - 5 Lars-Hendrik Röller Evidence from the Airline Industry
Zhentang Zhang
Justus Haucap The Incentives of Employers’ Associations FS IV 99 - 6Uwe Pauly to Raise Rivals’ Costs in the Presence
Christian Wey of Collective Bargaining
Jianbo Zhang Asymptotic Efficiency in Stackelberg Markets FS IV 99 - 7Zhentang Zhang with Incomplete Information
Justus Haucap Standortwahl als Franchisingproblem FS IV 99 - 8Christian Wey
Yasar Barut A Comparison of Multiple-Unit All-Pay and FS IV 99 - 9Dan Kovenock Winner-Pay Auctions Under Incomplete Information
Charles Noussair
Jim Y. Jin Collusion with Private and Aggregate Information FS IV 99 - 10
Jos Jansen Strategic Information Revelation and Revenue Sharing FS IV 99 - 11in an R&D Race with Learning Labs
Johan Lagerlöf Incomplete Information in the Samaritan’s Dilemma: FS IV 99 - 12The Dilemma (Almost) Vanishes
Catherine Matraves Market Integration and Market Structure in the FS IV 99 - 13European Soft Drinks Industry: Always Coca-Cola?
Absender/From:
Versandstelle - WZBReichpietschufer 50
D-10785 Berlin
BESTELLSCHEIN / ORDERFORM Bitte schicken Sie bei Ihren Bestellungen von WZB-Papers unbedingt eine 1-DM-Briefmarke pro paperund einen an Sie adressierten Aufkleber mit. Danke.
Bitte schicken Sie mir aus der Liste derInstitutsveröffentlichungen folgende Papiere zu:
For each paper you order please send a"Coupon-Réponse International" (internationalmoney order)plus a self-addressed adhesive label. Thank You.
Please send me the following papers from your Publication List:
Paper Nr./No. Autor/Author + Kurztitel/Short Title


![Untitled-2 [] · FS 78 FS 68 , FOCUS ÉkJ ËFOCUS FS 78 FS 68 FS 68 , , , FS 68 Foundation FS 68 , FS 68 68 fi , FOCUS F-s 688 , , 68 , 688 FOCUS FS , FS 68 , , , 688 ,](https://static.fdocuments.net/doc/165x107/5b75f9b67f8b9a3b7e8b5e04/untitled-2-fs-78-fs-68-focus-ekj-efocus-fs-78-fs-68-fs-68-fs-68.jpg)