Discussion Paper - Welcome to the United Nations · 2014-03-10 · Discussion Paper Capturing...
28
Discussion Paper Capturing Mineral Revenues in Zambia: Past Trends and Future Prospects August 2013 EU-UN Global Partnership on Land, Natural Resources and Conflict
Transcript of Discussion Paper - Welcome to the United Nations · 2014-03-10 · Discussion Paper Capturing...

Discussion PaperCapturing Mineral Revenues in Zambia:Past Trends and Future Prospects
August 2013
EU-UN Global Partnership on Land, Natural Resources and Conflict
Capturing Mineral Revenues in Zambia: Past Trends and Future Prospects
By
Anthony Simpasa, Degol Hailu, Sebastian Levine and Roberto Julio Tibana
United Nations Development Programme
And
EU-UN Global Partnership on Land, Natural Resources and Conflict
August 2013

Copyright © August 2013
United Nations Development Programme Poverty Practice, Bureau for Development Policy and Regional Bureau for Africa One United Nations Plaza New York, NY 10017, USA
E-mail: [email protected] site: www.undp.org/poverty and www.undp.org/extractiveindustries
and
EU-UN Global Partnership on Land, Natural Resources and Conflict UN Interagency Framework Team for Preventive Action One United Nations Plaza New York, NY 10017, USA
Acknowledgements
This Discussion Paper was written by Anthony Simpasa, Degol Hailu, Sebastian Levine and Roberto Julio Tibana. The authors are with the African Development Bank (Simpasa) and UNDP (Hailu, Levine and, until recently, Tibana). The opinions expressed in this paper are theirs and should not be attributed to the organisations they work for. Sebastian Levin passed away before the paper was finalised. We would like to pay special tribute to him for his commitment to the project and accordingly dedicate this work to him.
The authors would like to thank, without implication, the following people for their inputs and comments: Francis Chipimo, Elda Chirwa, Pedro Conceicao, Moono Herryman, Jan Isaksen, Edmond Kangamungazi, George Lwanda, Rumbidzai Masango, Kampaila Munkoni, Felix Mwenge, Emmanuel Ngulube, Fuvya Nyirongo, Emmanuel Pamu, Gregory Pape, Perry Perone, Goodson Sinyenga, Joseph Tembo and Kanni Wignaraja. Any errors or omissions remain entirely of the authors’.
Contact Information
Anthony Simpasa: [email protected]. Degol Hailu: [email protected].
Disclaimer
The views expressed in this publication are those of the authors and do not necessarily represent those of the institutions to which they are affiliated or the United Nations or their Member States, including UNDP.

ContentsAbstract 3
1. Introduction 5
2. Trends in output, prices and revenue 5
2.1 State ownership and decline in profitability 7
2.2 Private ownership and generous concessions 7
3. Legislate, don’t negotiate 11
4. Estimates of past and future revenue generation 13
4.1 Counterfactual estimates 13
4.2 Baseline scenario 14
4.3 Alternative Scenarios 14
4.4 The Projections 16
5. Policy implications 17
6. Conclusion 18
Notes 19
References 21
Appendix I: Assumptions on Mineral Revenue Projection 23
Appendix II: Revenue from other minerals 24
Appendix III: Stream of Projected Mineral Revenues 25

3Capturing Mineral Revenues in Zambia: Past Trends and Future Prospects
Abstract
Abstract
Zambia has been exporting copper for more than a century. The country’s mining sector has undergone significant changes during this period. It was under private hands during the colonial era; under public ownership after independence; and then back under private hands during the wave of liberalization in the 1990s. Under both ownership modalities, the revenue accruing to the public purse has been in a long-term decline. Limited revenue generation under state ownership has often been attributed to poor management of the mines, exacerbated by the decline in copper prices. Under private ownership, meagre revenue streams—even during favourable market conditions—resulted from tax policies that provided overly generous terms to companies as well as practices of transfer pricing. A new legislation was passed in 2008 to capture a greater share of revenues. This paper presents an estimate of revenues that could have been generated, had the reforms been implemented earlier. It also provides estimates for the higher levels of revenue that the new fiscal regime is expected to generate in the future. If the reforms had been applied earlier, an additional 3.7 percent of GDP in revenue would have been raised. Our calculations show that, from 2013 to 2025, on average, 5 percent to 7 percent of GDP can be raised from mining operations.
5Capturing Mineral Revenues in Zambia: Past Trends and Future Prospects
Introduction
1. Introduction
Copper production in Zambia began with the arrival of the British South Africa Company (BSAC) over a century ago. When Zambia declared independence in 1964, it was already producing 12 percent of the world’s copper (Sklar, 1974). Seeing the potential for financing the country’s development, the industry was nationalized. In 1969, the share of state ownership reached 51 percent (Adam and Simpasa, 2011). By 1979, it had increased to 60 percent. 1 In 1982, the Zambia Consolidated Copper Mines (ZCCM) was created to amalgamate the state’s control of the copper sector. Subsequently, the nationalized copper mines fell into financial difficulties. In the mid-1990s, policy makers reversed their decision and began the privatization of ZCCM. In 2008, a new legislation was passed to reform the fiscal regime and capture a greater share of the revenues.
The trials and tribulations of the Zambian mineral sector, particularly that of copper, has been told and retold (see, for instance, Bostock and Harvey, 1972; Cunningham, 1981; and Gulhati, 1989). The purpose of this paper is not to retell the story, but to: 1) with the convenience of hindsight, estimate the revenues that would have been generated, had tax policy reforms of 2008 been implemented earlier; and 2) forecast future revenue levels that will accrue to the public purse in response to taxes and royalties introduced by the reforms and subsequent changes made to the mining fiscal regime. Our objective is to highlight the possibility of capturing revenues so that policy makers address the economic and social challenges the country faces.
The analysis contained in this paper should be of considerable interest to policy makers in resource-rich economies, given the growing importance of the extractive sector. In particular, it provides lessons for countries that have reduced the direct role of the public sector in extractive operations. It is therefore most applicable to countries that remain saddled with ineffective taxation regimes and are locked into contractual arrangements that reflect the well-known bargaining and information asymmetries (Stiglitz, 2007 and Soros, 2007). Our findings show that, if the 6 percent royalty rate and 30 percent corporate tax rate were applied in the past decade, an additional US$1.6 billion (3.7 percent of GDP) in revenue would have been raised. In terms of future projections, over the period 2013-2025, on average, 5-7 percent of GDP can be raised from mining operations.
The paper is organized as follows. Section 2 traces the historical trends in mineral output and prices. This section also discusses past changes in the fiscal regimes and the challenges faced in capturing the revenues. Section 3 discusses the renegotiation of longstanding contracts and the introduction of the new fiscal regime in 2008, which showed considerable promise. Section 4 seeks to quantify this promise by presenting a counterfactual analysis of past flows of foregone revenue and a series of alternative scenarios for the coming few years. Section 5 outlines the policy implications of higher revenue capture. Concluding remarks are provided in Section 6.
2. Trends in output, prices and revenue
There are three distinct periods of copper output and price movements in Zambia’s mining history (see Figure 1). The first period is characterized by rising output and prices beginning around 1930 and ending around 1974. In the second period, between 1975 and 1999, copper prices and output plummeted. Since 2000, copper outputs and prices have been rising. In 2011, output reached 833 metric tons, just short of the industry’s peak of 877 metric tons reached in 1973. A combination of above trend copper prices and increased output translated into correspondingly high copper export earnings, which reached a record US$6.7 billion in 2011 (36 percent of GDP), up from US$0.6 billion (14 percent of GDP) in 2003.
In terms of revenue flows, in the years when prices and output were falling between the mid-1970s and early-2000s, mineral revenue as a share of total government revenue was, on average, about 4 percent. Between 2001 and 2007, when copper output and prices were rising, the average mineral revenue remained at 1.6 percent (see Figure 2). This decline in mineral revenues may be interpreted as a relative one, which could have been the result of diversification of revenue sources. However, this was not the case. Total revenue, excluding grants, as a share of GDP also declined, from 20 percent in 1990 to 17 percent in 2010.

6 Capturing Mineral Revenues in Zambia: Past Trends and Future Prospects
Trends in output, prices and revenue
Figure 1: Copper Output and World Price (constant 2008 prices)
Sources: Bank of Zambia Fortnightly Statistics and World Minerals Yearbook (various years).
Figure 2: Mineral Revenue (percent of total revenue)
Sources: Authors’ estimates using data from Zambian authorities.

7Capturing Mineral Revenues in Zambia: Past Trends and Future Prospects
Trends in output, prices and revenue
Output and prices were on the upward trend when the sector was under private control. A downward trend is observed when the mines fell under public ownership. In the next section, we look at some of the factors that may have contributed to the fluctuations in output, prices and sub-optimal revenue generation under both ownership modalities. One important implication, however, is that revenue flows are on a long-run downward trend. Neither private ownership nor state ownership seems to have made any significant difference in terms of the level of revenues raised from the sector and accruing to the state.
2.1 Stateownershipanddeclineinprofitability
Explanations vary as to what caused the deterioration of the mining sector under public ownership. In the years immediately prior to independence, foreign private companies reduced their investments, perhaps anticipating the nationalization agendum of the new government. As a consequence, dividend payments between 1964 and 1969 consumed 80 percent of total profits (Chisala et al., 2006). Subsequently, when the mines came under state ownership, neither did they receive adequate recapitalisation nor undergo modernization. Gross capital formation (GCF) fell from a peak of 38 percent of GDP in 1975 to just 7 percent in 1989. 2 Direct capital investment in mining was not even sufficient to cover depreciation of the capital stock (Adam and Simpasa, 2011).
Chisala et al. (2006) also emphasize the Unilateral Declaration of Independence (UDI) by Southern Rhodesia in 1965, which cut Zambia off from its two transport links for exporting copper. In fact, at one point, there was an attempt to airlift Zambia’s copper (Rotberg, 2002). Skilled Zambians also left the country, attracted by job opportunities in South Africa, which created severe skill shortages in the mining and related sectors.
Moreover, under state ownership, unit costs of production increased far beyond what could be expected from changes in geological conditions. ZCCM also became a major provider of social services (schools, hospitals, housing, etc.) in the mining areas, which added to its expenses. Additional costs resulted from expansion in unprofitable non-core activities and a progressive dissolution of the boundaries between the state, the ruling party and ZCCM, which highlights the confluence of political and economic interests in the management of the mining sector (Bates and Collier, 1995).
Most importantly, the copper industry was severely affected by the collapse in international prices, coinciding with the time when the mines came under state ownership. This increased the pressure on the authorities to privatize ZCCM. Initially, the response to the price shock was borrowing, which unsustainably increased the public debt (Bigsten and Kayizzi-Mugerwa, 2000). The new government, which was elected in 1991, embarked on a marked shift in economic policy. This was within the broader framework of international financial institution- backed stabilization and structural adjustment programmes, a key element of which was the privatization of the copper sector (Chisala et al., 2006; Adam and Simpasa, 2011). 3
2.2 Privateownershipandgenerousconcessions
Soon after the privatization process was complete in the early 2000s, global demand for base metals, including copper, soared. Even after the impact of the economic slowdown induced by the global financial and economic crisis in 2008, the price of copper surged between 2003 and 2011 to above US$8,000 per ton in 2011. Investments picked up, too: gross capital formation averaged 23 percent of GDP between 2003 and 2009. 4 In the same period, foreign direct investment (FDI) in the mining sector increased to more than 60 percent (US$4.5 billion) of total FDI (GRZ, 2010).
Despite the price and output booms, weak revenue generation continued even in the post-privatization period. This was a direct consequence of the contractual agreements and associated generous incentives granted to the private foreign mining companies. 5 During the privatization process, the sale of ZCCM assets was negotiated bilaterally between the government and the mining companies in contracts referred to as “Development Agreements”.

8 Capturing Mineral Revenues in Zambia: Past Trends and Future Prospects
Trends in output, prices and revenue
The general terms of sale embodied highly generous tax and other concessions. Table 1 and Table 2 give a snapshot of the general terms of the agreements. Several issues stand out: there was no VAT charge for mine products; capital expenditure had a deductible allowance of 100 percent; and “stability periods” of 15 to 20 years during which no changes could be made to the agreements. Mining companies have been enjoying excise duty rebates on electricity supplied by the state utility firm. A major concern was the low average rate of mineral royalty, which in most cases was set at 0.6 percent and thus way outside the global average range of 2 percent to 6 percent and below the IMF’s own estimates of between 5 percent and 10 percent for developing countries (Adam and Simpasa, 2011).
It is worth noting that the first batch of privatized companies paid royalty rate of between 2 percent to 3 percent. But this rate was revised downwards following negotiation of a highly generous 0.6 percent by Anglo America Corporation, which was subsequently applied uniformly across all mining firms. This reflects the dangers to governments of negotiating discretionary tax regimes applicable to individual companies, a tendency prevalent in countries emerging from crisis situations and eager to attract foreign direct investment by offering overly generous terms and conditions.
The Foreign Investment Advisory Service (2004) of the World Bank argued that, due to the incentives granted to the mining sector, the marginal effective tax rate was in the neighbourhood of 0 percent. The subsidy granted to the purchase of mining machinery, at 18.3 percent, represented the largest in any sector for any asset. Adam and Simpasa (2011) estimate that the positive shock from price increases generated a permanent income stream in excess of 5 percent of pre-boom GDP, translating into a potential saving of US$1.4 billion (39 percent of 2002 GDP) in net present-value terms. However, the private mining companies, through profit repatriation, appropriated the bulk of this windfall and made dividend pay-outs to foreign shareholders. 6
Five main factors explain the generous incentives provided to the private operators of the mines. First, the mining infrastructure and ZCCM’s assets were by and large dilapidated. Attracting viable investors would have been difficult without favourable concessions. 7 Second, low copper prices weakened the bargaining power of the government. Third, ZCCM was incurring debt equivalent to US$1 million per day. Fourth, given the geological features, copper mines in Zambia have higher cost structures, which can add to investor caution. The 2008 figures show that the unit production cost in Africa was US$160.6 cents/lb., compared to US$96.5 cents in Latin America and US$138.2 cents in Asia (Meller and Simpasa, 2011). Finally, as part of its aid conditionality, the IMF pressed for transfer of ownership of ZCCM with concluded sale marked for March 1999 (Adam and Simpasa, 2011). The government also yielded to the IMF’s conditions by committing to refrain from granting fiscal incentives, except provision of specific tax concessions to buyers of ZCCM (GRZ, 1999).
Copper price increases from 2003 onwards represented a huge resource windfall for the new private owners. For instance, in the case of the First Quantum’s Kansanshi Copper Project, the annual average operating cost for the initial five years was estimated at US$11.26 per ton of copper. Then the forecast was that the cost would fall to US$10.30 per ton over the next five years, but then increase to US$11.23 per ton during the last five years of the 16-year mine life. 8 Under the Development Agreement, the average annual price for the project was set as at end-December 2002 level, that is US$0.72 per pound (GRD Minproc, 2003). However, the actual realized price was US$2.6 per pound over the same period. 9 With such cost-price configuration, the boom allowed most mining firms to recoup their investment much faster than scheduled.
At 25 percent corporate tax rate, Kansanshi was expected to pay US$161.2 million in taxes after recovery of capital costs and US$14.2 million in royalties over the project life. 10 But these figures were based on the conservative cost-price estimates without recognizing the possibility of a significant turnaround in international copper prices. Thus, given the surge in prices, it is likely that the payback period may have come even earlier, bringing the company into profitability much quicker.
Recent estimates indicate that Zambia lost US$17.3 billion (in real 2010 prices) in illicit capital flight in the period between 1970 and 2010. This was driven by unaccounted-for balance of payment movements as well as transfer mispricing, mainly through manipulation of prices in trade between multinational companies in different tax jurisdictions (Boyce and Ndikumana, 2012).

9Capturing Mineral Revenues in Zambia: Past Trends and Future Prospects
Trends in output, prices and revenue
Table 1: Development Agreements Prior to 2008Company/Unit General terms and conditions
Konkola Copper Mine (KCM)
• Stability period (originally 20 years for AAC, amended to 16 years following acquisition by Vedanta four years after the initial sale)
• Company income tax fixed at 25 percent (on net income arising from all mining activities) for duration of stability period
• Royalty rate of 0.6 percent on gross revenues, except in the first five years, charged at 0 percent. Throughout the stability period, royalty payable deductible against liability of corporate income tax.
• Customs duty set at 15 percent, payment of which was limited to US$16 million in first year, and US$15 million per year, inclusive for four years thereafter
• Excise duty on purchase of electricity set at 0 percent
• Withholding tax of 0 percent; after expiry of stability period, charged at 10 percent
• Loss carry forward permitted for 10 years from date incurred
• Capital expenditure deductible allowance of 100 percent
• Price participation payment to be treated as expense and thus deductible when calculating corporate income tax; royalty payments also deductible for income tax liability purposes
• VAT on mine products charged at 0 percent.
• Facilities to be treated as single large-scale mining unit.
Mopani Copper Mine (MCM)
• As in the case of KCM, except:
• Stability period was set at 15 years
• Excise duty on purchase of electricity set at 10 percent of the amount paid to ZESCO by Copperbelt Energy Company and only payable after expiry of stability period
Kansanshi • Stability period of 15 years
• Royalty rate of 3 percent on net back value, however, actual royalty rate was scaled down to 0.6 percent in tandem with KCM and MCM, see (GRD Minproc, 2003)
• Import duty exempt for level above 5 percent under section 97(1) of the Act
• Payment of duty on rural electrification levy at applicable rate for duration of stability period
Chambishi • Same as in KCM/MCM, except:
• Stability period of 15 years
• Company income tax of 35 percent, but, if listed on Lusaka Stock Exchange, reduced to 30 percent
• Royalty rate of 2 percent on net back value and payment deductible for income tax liability purposes
• Excise duty on purchase of electricity same as in the case of Mopani
• VAT on mine products charged at 0 percent
Chibuluma • Similar to Chambishi’s incentive structure
• As in KCM/MCM
Sources: Development Agreements in possession of the authors; and Lumwana Project Technical Report (Equinox Minerals Ltd, 2011).
10 Capturing Mineral Revenues in Zambia: Past Trends and Future Prospects
Trends in output, prices and revenue
According to KPMG (2012, p. 1), “There are no detailed rules on transfer pricing in Zambia.” This is precisely what some companies have exploited. For instance, companies registered in Switzerland have copper producing subsidiaries in Zambia. One such Zambian-based subsidiary reportedly sells copper to its Swiss-based counterpart at below-market price. Then, the Swiss-based company sells the copper at world prices as if it originated from Switzerland (netting the price difference as profit whilst consistently reporting losses in Zambia). Switzerland has in effect become a “major copper exporter”. 11
The share of Zambian exports to Switzerland in total exports increased from 1 percent in 1995–1998 to more than 50 percent in 2008 (Cobham, 2012) shows. According to Cobham, “The use of Switzerland for transit in commodities in this way is well known, but remains highly opaque. […] What is absolutely clear is that declared Zambian copper exports, on which the country depends economically, effectively disappear once they leave the country.” (p. 363)
The Mopani Copper Mines (MCM) Plc, which is the second largest mining company and acquired by Glencore in 2000, was implicated in the transfer-pricing plot. In 2009, the Zambian Revenue Authority contracted the Norwegian tax auditors Grant Thornton and Econ Poyri to investigate tax avoidance and tax evasion related to the operations of the MCM. Secondary sources indicate that the auditors found serious malpractices, which were in breach of the OECD guidelines. 12 It was found that the company: 1) overestimated operating costs, compared to other firms in the industry; 2) underestimated production volumes; and 3) manipulated its financial statements, particularly the selling price of copper. The company was selling copper to its parent company Glencore at a quarter of the official price quoted at the London Metal Exchange. At the same time, it was reporting losses in its operations in Zambia (Sherpa et al., 2011).
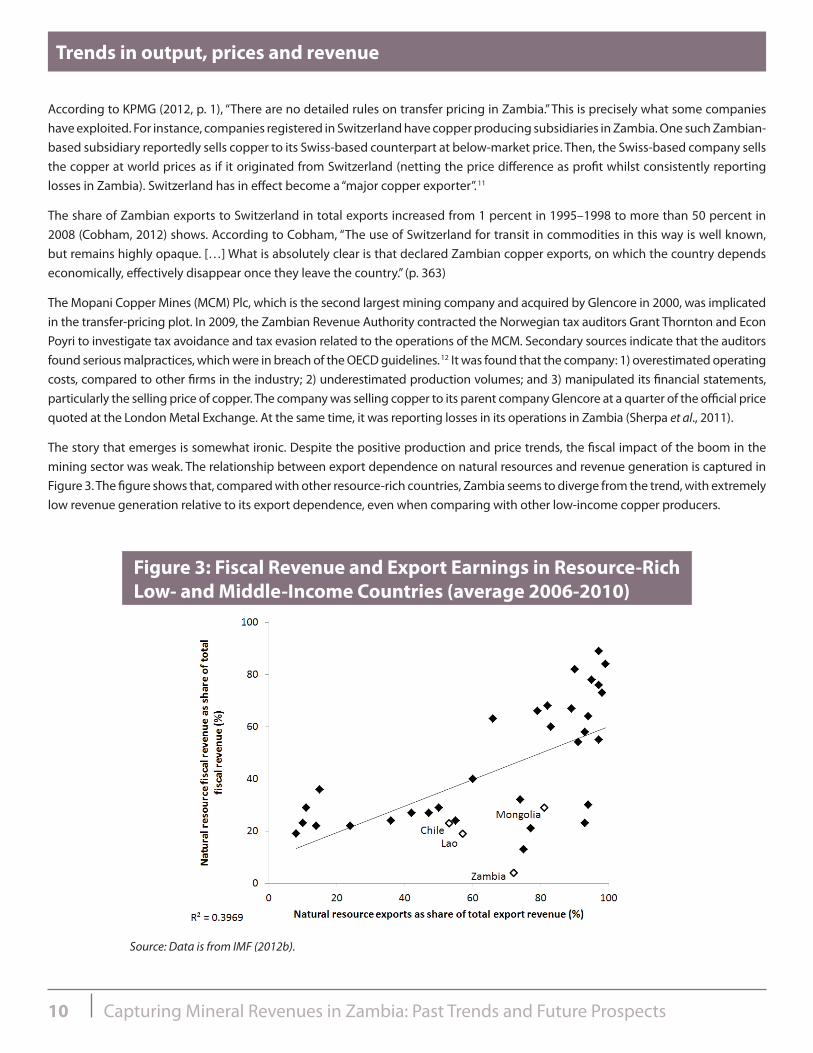
The story that emerges is somewhat ironic. Despite the positive production and price trends, the fiscal impact of the boom in the mining sector was weak. The relationship between export dependence on natural resources and revenue generation is captured in Figure 3. The figure shows that, compared with other resource-rich countries, Zambia seems to diverge from the trend, with extremely low revenue generation relative to its export dependence, even when comparing with other low-income copper producers.
Figure 3: Fiscal Revenue and Export Earnings in Resource-Rich Low- and Middle-Income Countries (average 2006-2010)
Source: Data is from IMF (2012b).
11Capturing Mineral Revenues in Zambia: Past Trends and Future Prospects
Legislate, don’t negotiate
3. Legislate, don’t negotiate
The recovery in copper prices in the early 2000s prompted the government to renegotiate the contracts. There was also political expediency as the public expected gains from the copper boom. This became evident during the 2006 presidential elections when the copper-producing areas voted overwhelmingly for the main opposition candidate Michael Sata (now president, elected in September 2011) of the Patriotic Front. Mr Sata campaigned against the Development Agreements (Oshionebo, 2011).
The challenge for the government and the ruling Movement for Multiparty Democracy was to recalibrate the Agreements, whilst exercising caution not to disappoint foreign investors by violating prior commitments. However, cutting across the Development Agreements was a ‘stabilization clause’ binding the government not to make alterations either to the magnitude or structure of any of the incentive provisions. The excerpt from one of the contracts makes this explicit:
Government further undertakes that during the stability period, it shall not by general or special legislation or by administrative measures or decree or by any other action or omission whatsoever […] vary, amend, cancel or terminate this Agreement or the rights and obligations of the Parties under this Agreement, or cause this Agreement or the said rights and obligations to be varied, amended, cancelled or terminated, or prevent or hinder performance of this Agreement by any party thereto. (Clifford Chance, 2004. p. 41) 13
The major constraints for revising the Development Agreements were the fact that they were agreed on a bilateral basis. Uniformly applicable legislation leaves less room for collusive behaviour, as the burden of coordination is passed on to the mining companies. Doing away with the individualized and bilaterally negotiated contracts makes for a more transparent process that reduces the risk of corruption and special deal-making. Upon recognizing the difficulty to renegotiate the contracts individually, the government introduced new legislation: the Mines and Minerals Act 2008. This Act annulled the 1995 Act and introduced a new fiscal code. The following is an excerpt from the Act:
A development agreement which is in existence before the commencement of this Act shall, notwithstanding any provisions to the contrary contained in any law or in the development agreement, cease to be binding on the Republic from the commencement of this Act […]. The Mines and Minerals Act 1995 is hereby repealed […]. (GRZ, 2008: p.153)
The new Act paved the way for the introduction of the below provisions:
i. A graduated windfall tax levied at a rate of 25 percent on gross proceeds when the copper price exceeds US$2.50 per pound (US$5,600 per ton); 50 percent when the copper price exceeds US$3.00 per pound (US$6,720 per ton); and 75 percent in excess of US$3.50 per pound (US$7,840 per ton).
ii. An increase in the royalty rate to 3 percent from 0.6 percent of gross revenue on copper and from 2 percent for other base metals. Note: In 2012, the royalty rate was further raised to 6 percent.
iii. The corporate income tax rate was revised from 25 percent to 30 percent. Simultaneously, the rate applicable for non-mining sectors was reduced to 30 percent from 35 percent.
iv. A new variable profit tax rate under which the marginal tax rate would rise from 30 percent to 45 percent when taxable profits exceed 8 percent of gross revenue.
v. Withholding tax on interest, royalties, management fees and payments to affiliates or subcontractors for all mining companies was reintroduced and pegged at a standard rate of 15 percent.
vi. Reduction of capital allowances from 100 percent of expenses to a conventional 25 percent per annum (and deductible only in the year production commences rather than in the year the expense is incurred).
vii. Hedging as a risk management mechanism treated as a separate activity from mining.

12 Capturing Mineral Revenues in Zambia: Past Trends and Future Prospects
Legislate, don’t negotiate
The changes were not without dispute. Mining firms contended that the government had no legal right to revise the taxes or annul the contracts. Lungu (2009: p. 20) notes that “the Chamber of Mines have always maintained that the Development Agreements were legal contracts and that the Zambian government could do nothing to alter them until the stability periods expire.” The main force of criticism was that the new regime radically increased the marginal burden of tax and the degree of price ‘distortion’ it entailed, especially through the variable and windfall taxes that were deemed punitive for high-cost mines. Notably, the effective tax rate increased from 31 percent to 47 percent (Adam & Simpasa, 2011).
The windfall tax was withdrawn in the 2009 budget. According to the authorities, the decision was largely due to the adverse impacts of the global financial and economic crisis that began in 2008 and that threatened mine closure and job losses. The Zambian mining sector is reported to have lost 6,000 jobs in November 2008 alone (AfDB, 2009). According to press reports, “mines such as the Luanshya Copper Mines (LCM) closed down, putting thousands out of work. Mopani Copper Mines (MCM) threatened to put their Nkana and Mufulira mines in the Copperbelt province on care and maintenance.” 14 Given the impending crisis, government officials argued that the windfall tax could not be enforced and it was revoked in 2010. 15 Another clarification of the new fiscal regime was that, when the graduated windfall tax was in effect, the variable profit tax would not be, and vice versa.
Table 2: Changes in the Fiscal Regime for the Mining SectorCompany/Unit 2006 2007 2008 2009 2010
Royalty 0.6% 3% 3% 3% 6%
Corporate Income Tax 25% 30% 30% 30% 30%
Variable Income Tax? No No Yes Yes Yes
Hedging activity considered part of mining activity?
Yes Yes No Yes No
Windfall tax No No Yes No No
Capital Expenditure Allowance
100% for all capital
expenditure
100% for all capital
expenditure
100% for prospecting and exploration; 25% for other capital
expenditure
100% for all capital
expenditure
100% for all capital
expenditure
Loss Carry Forward 10 years 10 years 10 years 10 years 10 years
Custom Duties Exports are zero-rated
Exports are zero-rated
15% for unprocessed
copper
15% for unprocessed
copper
15% for unprocessed
copper
Withholding Taxes (non-treaty rate)
On income of foreign sub-contractors and interest
0% 0% 15% 15% 15%
On dividends and payments to residents
0% 0% 0% 0% 0%
Sources: Zambia Revenue Authority (various years) and IMF (2012a).

13Capturing Mineral Revenues in Zambia: Past Trends and Future Prospects
Legislate, don’t negotiate
The government calculated that, at prevailing international copper prices, revenue from mining under the new fiscal regime would increase to approximately US$250 million (1.7 percent of GDP) in 2008 from US$20 million (0.1 percent of GDP) in 2007. The source was mainly royalty payments generated from gross mining proceeds estimated at US$3.8 billion at the time. 16 However, actual collections from new tax measures amounted to about US$90 million, generated from export receipts of US$4.0 billion. This amounted to a 65 percent underperformance. In part, the reason for low revenue collection following the revision of the fiscal regime stemmed from the contest mounted by some mining houses, which later was captured through windfall tax arrears after reaching a settlement following negotiations between the government and the mining companies. Since 2010, copper prices have rebounded, which has created opportunities to capture a sizable share of mineral revenues.
To cure the problem of capital flight and in particular the underreporting of mineral export earnings, the Zambian Government recently enacted a law for monitoring international transactions (GRZ, 2013). The Bank of Zambia (Balance of Payments) Regulation enacted as Statutory Instrument No. 55 (SI 55), which came into effect on 1 July 2013, applies to all international transactions including profits, dividends, remittances, loans granted to non-residents, and investments abroad by persons resident in Zambia, among other things. The law also applies to payments for imports and settlement of private external debt, on principal and interest cost.
The legislation is meant to accurately capture revenues from exports, but also – crucially – to better understand how funds generated from exporting activities are externalized. Among other requirements, exporters must deposit cash receipts into a foreign currency account held in a local commercial bank while foreign investors are also required to deposit the cash of their pledged investment component in a similar account. Exporters must also declare the value of their exports to the central bank, while mining companies must also declare the quantity and grade of minerals being exported. This is aimed at accurately capturing the value of mineral exports. The impact of the 1 July 2013 legislation is yet to be seen.
4. Estimates of past and future revenue generation
In this section, we present results of a counterfactual analysis that looks at past revenue flows in the pre-2013 period and of an analysis of future projections of revenue from 2013 to 2025 under baseline and alternative scenarios. The estimates take into account maturity of investment in the sector, depreciation in capital stock, the possibility of new mining investments, the global environment, and the termination of any remaining legally binding concessions after the 2008 fiscal reforms. 17 Details of the underlying assumptions are provided in Appendix I.
4.1 Counterfactualestimates
How much revenue could have been raised between 1998 and 2012 if past Agreements had applied a 6 percent royalty rate and 30 percent corporate tax rate? 18 This question brings to the fore the cost of delayed reforms. We analysed the data on output, exports, and prices as reported in the Bank of Zambia’s fortnightly statistics while unit costs are obtained from the World Bank database on metals and minerals. 19 The data is split into three periods: pre-boom (1997-2002), boom (2003-2007) and weaker demand period (2008-2012). 20
Figure 4 shows the actual versus the counterfactual revenue trend, measured as a share of GDP. For the whole period (1997-2012), the average actual revenue share was 1.8 percent while, for the counterfactual analysis, it is estimated at 5.5 percent (the forgone revenue is equal to 3.7 percent of GDP). 21 The pre-boom revenue share was much lower at 0.8 percent against 2.4 percent for the counterfactual. For the boom period, the counterfactual share of revenue in GDP was 5.9 percent, consistent with the positive price shock. 22 However, during the boom period, the actual fiscal take from the increase in metal earnings was low, at less than 1.5 percent of GDP. Subtracting realized revenue from potential, we find that about 5 percent of GDP in revenue was lost during the boom period.

14 Capturing Mineral Revenues in Zambia: Past Trends and Future Prospects
Estimates of past and future revenue generation
While forgone revenues represent missed opportunities, we quantify the potential revenue streams for the coming years (2013–2025). This type of analysis is useful for policy makers in terms of assessing the potential impact of the change in the fiscal regime and for providing an envelope of future revenue levels.
4.2 Baselinescenario
The baseline scenario takes end-2012 as the starting point for copper output and exports throughout the projection period. Copper prices, the royalty rates, the mining sector corporate tax rate, VAT (14.5 percent), the exchange rate and the discount rate (used to compute net present value cash flows) are all assumed to be constant, at end-2012 levels. Mining investment is projected to remain fixed throughout the period at two thirds of the US$4.5 billion total FDI as captured in the 2009 investment survey (GRZ, 2010).
4.3 AlternativeScenarios
We compare the baseline with two alternative scenarios, which are designed to be more ambitious, but instructive for the purposes of discussing the limits of mineral taxation policy.
Scenario 1: Builds on the baseline case, but introduces changes in the evolution of output, prices, exports and unit costs. The level of output in current period Qt is calculated by applying the average percentage change for the preceding five-years (i.e., Qt = Qt-1 * (1+average(r ) ), where r is the average growth rate in the preceding five years. We assume an increase in the proportion of tax liable mineral production from 24 percent of the total output of the industry to 80 percent, effective 2015.
Figure 4: Advance Market Commitments (AMC) in practice
Source: Authors’ computations.
15Capturing Mineral Revenues in Zambia: Past Trends and Future Prospects
Estimates of past and future revenue generation
The projection of copper prices is computed by taking the average price for the preceding five years as the prevailing price for the current period, Pt, and adjust it by the corresponding average percent change (i.e., Pt = ( average (Pt-1 , …., Pt-n )* (1+average (δ ) ), where δ is the average percent change in P over the respective five-year period.
To generate the revenue flows accruing from the mining sector, we use projected exports in tons, costs and copper prices in estimating unit rent per ton of copper exported. Total rents are then generated by multiplying unit rents by copper exports (in tons). Unit costs are assumed to track copper prices and domestic inflation. Thus, unit costs throughout the projection period are assumed to increase by the average percentage change for the preceding five years, starting with 2008 to 2012. This method combines the effect of the slump and assumes that firms adopt mining technology and strategies aimed at minimizing production costs in order to optimize the ensuing rent.
The corporate profit tax rate is pegged at 30 percent, applicable to the sector. In addition, the royalty rate is pegged at 6 percent. The projections assume away the windfall tax, given that the government is unlikely to re-introduce it. The projections also exclude payments of dividend to ZCCM-IH. Current financial records show that the firm received an equivalent of about US$15.5 million in 2012 and approximately US$32.8 million in 2011 as dividend payments from its residual equity holding in mining firms (ZCCM-IH, 2012). These receipts, however, may be used to settle huge outstanding debt and other legacies inherited from ZCCM, estimated at about US$1.0 billion at inception (Rakner, 2003, cited in Lundstøl, et al., 2013). Or the income could be reinvested in extractive and non-extractive sectors to increase and diversify the firm’s portfolio away from traditional copper mining. 23 Thus, excluding dividend payments from the revenue computations does not alter the analysis.
The projection focuses exclusively on large mining companies, which account for more than 90 percent of total revenue. Currently, there are 10 active large-scale foreign mining companies, nine of which produce copper and the other being a gold and nickel mine. Out of the total corporate tax paid by these companies in 2009 and 2010, Kansanshi accounted for more than 90 percent while Chibuluma made up 2 percent in 2009 and about 5 percent in 2010.
The share of other mines was small at less than 1 percent. Although there is great potential for increased revenue take from small mines and those involved in mineral-processing activities, there is also no loss of generality in excluding them, as the basic message we seek to convey remains unaffected. The potential for diversification into non-traditional minerals, particularly gemstones, is considered substantial. However, data limitations need to be overcome before they are incorporated into the analysis (see Appendix II for some details on this potentially rich emerging sector).
Scenario 2: Retains most of the assumptions of Scenario 1. The fundamental difference is that all mining companies are considered to become fully tax liable from 2015 when loss-carry forwards and other tax holidays are assumed to have terminated and firms are making profits. In this scenario, no firm enjoys any tax exemptions. In addition, the royalty rate is adjusted to 10 percent from 2013 onwards, which is taken as the upper end for developing countries. 24
Assumptions: It should be emphasized that the projections are based on a simple static model that uses historical data and does not factor in possible sudden price changes or a deep contraction in demand for copper. Nor does it factor in other dynamics such as behavioural changes (e.g., changes in tax avoidance among companies or investor sentiments), second-order effects that lead to shifts in relative prices, technological changes, or new discoveries. We base our analysis on readily available statistics on taxes paid by the mining companies, namely, royalty payments, corporate tax, VAT and pay-as-you-earn (PAYE), which also broadly depict the largest share of revenue remitted by the mining firms, which we call ‘total revenue’. Then a separate measure with only corporate tax and royalty payments is provided, dubbed ‘direct revenues’. For these and other reasons, the projections should be regarded more as indicative rather than as precise forecasts.
16 Capturing Mineral Revenues in Zambia: Past Trends and Future Prospects
Estimates of past and future revenue generation
4.4 TheProjections
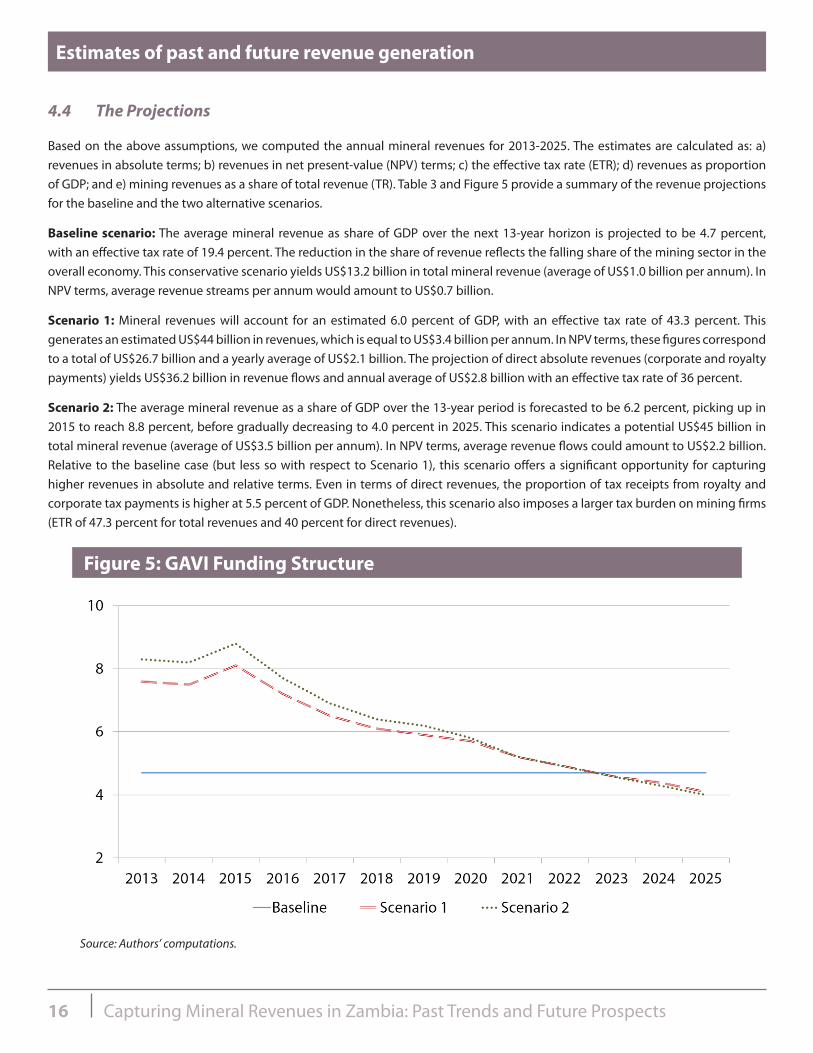
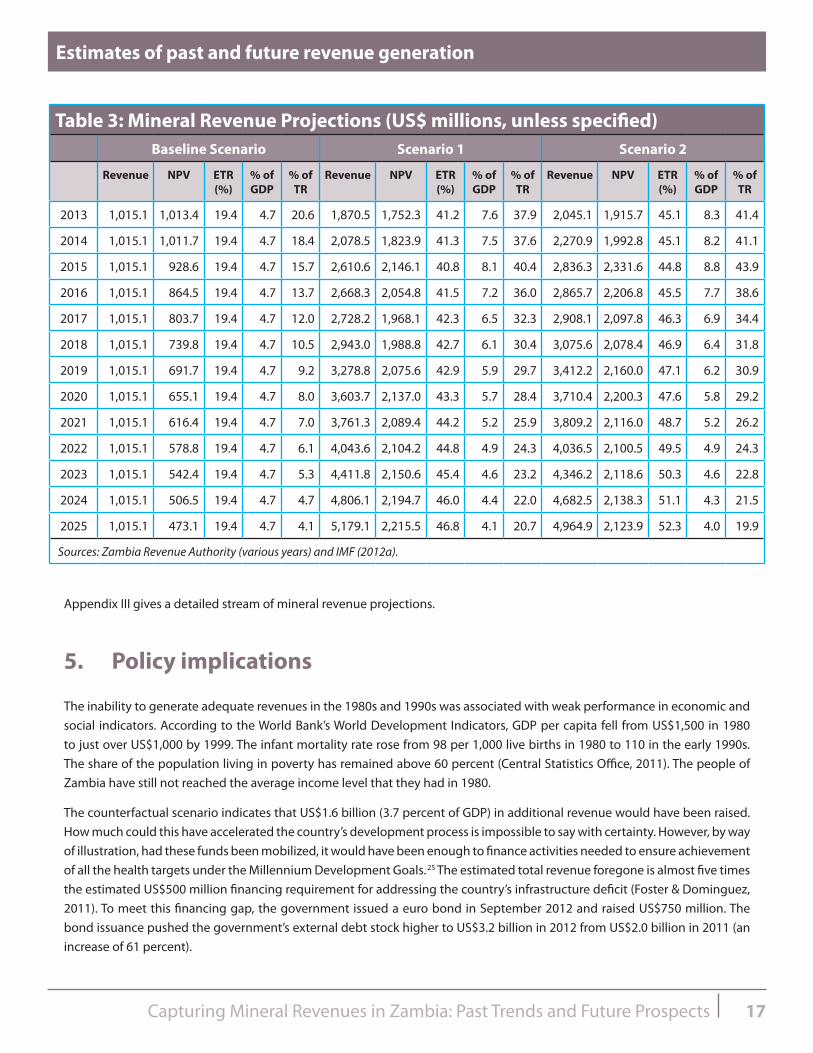
Based on the above assumptions, we computed the annual mineral revenues for 2013-2025. The estimates are calculated as: a) revenues in absolute terms; b) revenues in net present-value (NPV) terms; c) the effective tax rate (ETR); d) revenues as proportion of GDP; and e) mining revenues as a share of total revenue (TR). Table 3 and Figure 5 provide a summary of the revenue projections for the baseline and the two alternative scenarios.
Baseline scenario: The average mineral revenue as share of GDP over the next 13-year horizon is projected to be 4.7 percent, with an effective tax rate of 19.4 percent. The reduction in the share of revenue reflects the falling share of the mining sector in the overall economy. This conservative scenario yields US$13.2 billion in total mineral revenue (average of US$1.0 billion per annum). In NPV terms, average revenue streams per annum would amount to US$0.7 billion.
Scenario 1: Mineral revenues will account for an estimated 6.0 percent of GDP, with an effective tax rate of 43.3 percent. This generates an estimated US$44 billion in revenues, which is equal to US$3.4 billion per annum. In NPV terms, these figures correspond to a total of US$26.7 billion and a yearly average of US$2.1 billion. The projection of direct absolute revenues (corporate and royalty payments) yields US$36.2 billion in revenue flows and annual average of US$2.8 billion with an effective tax rate of 36 percent.
Scenario 2: The average mineral revenue as a share of GDP over the 13-year period is forecasted to be 6.2 percent, picking up in 2015 to reach 8.8 percent, before gradually decreasing to 4.0 percent in 2025. This scenario indicates a potential US$45 billion in total mineral revenue (average of US$3.5 billion per annum). In NPV terms, average revenue flows could amount to US$2.2 billion. Relative to the baseline case (but less so with respect to Scenario 1), this scenario offers a significant opportunity for capturing higher revenues in absolute and relative terms. Even in terms of direct revenues, the proportion of tax receipts from royalty and corporate tax payments is higher at 5.5 percent of GDP. Nonetheless, this scenario also imposes a larger tax burden on mining firms (ETR of 47.3 percent for total revenues and 40 percent for direct revenues).
Figure 5: GAVI Funding Structure
Source: Authors’ computations.
17Capturing Mineral Revenues in Zambia: Past Trends and Future Prospects
Estimates of past and future revenue generation
Appendix III gives a detailed stream of mineral revenue projections.
5. Policy implications
The inability to generate adequate revenues in the 1980s and 1990s was associated with weak performance in economic and social indicators. According to the World Bank’s World Development Indicators, GDP per capita fell from US$1,500 in 1980 to just over US$1,000 by 1999. The infant mortality rate rose from 98 per 1,000 live births in 1980 to 110 in the early 1990s. The share of the population living in poverty has remained above 60 percent (Central Statistics Office, 2011). The people of Zambia have still not reached the average income level that they had in 1980.
The counterfactual scenario indicates that US$1.6 billion (3.7 percent of GDP) in additional revenue would have been raised. How much could this have accelerated the country’s development process is impossible to say with certainty. However, by way of illustration, had these funds been mobilized, it would have been enough to finance activities needed to ensure achievement of all the health targets under the Millennium Development Goals. 25 The estimated total revenue foregone is almost five times the estimated US$500 million financing requirement for addressing the country’s infrastructure deficit (Foster & Dominguez, 2011). To meet this financing gap, the government issued a euro bond in September 2012 and raised US$750 million. The bond issuance pushed the government’s external debt stock higher to US$3.2 billion in 2012 from US$2.0 billion in 2011 (an increase of 61 percent).
Table 3: Mineral Revenue Projections (US$ millions, unless specified)Baseline Scenario Scenario 1 Scenario 2
Revenue NPV ETR (%)
% of GDP
% of TR
Revenue NPV ETR (%)
% of GDP
% of TR
Revenue NPV ETR (%)
% of GDP
% of TR
2013 1,015.1 1,013.4 19.4 4.7 20.6 1,870.5 1,752.3 41.2 7.6 37.9 2,045.1 1,915.7 45.1 8.3 41.4
2014 1,015.1 1,011.7 19.4 4.7 18.4 2,078.5 1,823.9 41.3 7.5 37.6 2,270.9 1,992.8 45.1 8.2 41.1
2015 1,015.1 928.6 19.4 4.7 15.7 2,610.6 2,146.1 40.8 8.1 40.4 2,836.3 2,331.6 44.8 8.8 43.9
2016 1,015.1 864.5 19.4 4.7 13.7 2,668.3 2,054.8 41.5 7.2 36.0 2,865.7 2,206.8 45.5 7.7 38.6
2017 1,015.1 803.7 19.4 4.7 12.0 2,728.2 1,968.1 42.3 6.5 32.3 2,908.1 2,097.8 46.3 6.9 34.4
2018 1,015.1 739.8 19.4 4.7 10.5 2,943.0 1,988.8 42.7 6.1 30.4 3,075.6 2,078.4 46.9 6.4 31.8
2019 1,015.1 691.7 19.4 4.7 9.2 3,278.8 2,075.6 42.9 5.9 29.7 3,412.2 2,160.0 47.1 6.2 30.9
2020 1,015.1 655.1 19.4 4.7 8.0 3,603.7 2,137.0 43.3 5.7 28.4 3,710.4 2,200.3 47.6 5.8 29.2
2021 1,015.1 616.4 19.4 4.7 7.0 3,761.3 2,089.4 44.2 5.2 25.9 3,809.2 2,116.0 48.7 5.2 26.2
2022 1,015.1 578.8 19.4 4.7 6.1 4,043.6 2,104.2 44.8 4.9 24.3 4,036.5 2,100.5 49.5 4.9 24.3
2023 1,015.1 542.4 19.4 4.7 5.3 4,411.8 2,150.6 45.4 4.6 23.2 4,346.2 2,118.6 50.3 4.6 22.8
2024 1,015.1 506.5 19.4 4.7 4.7 4,806.1 2,194.7 46.0 4.4 22.0 4,682.5 2,138.3 51.1 4.3 21.5
2025 1,015.1 473.1 19.4 4.7 4.1 5,179.1 2,215.5 46.8 4.1 20.7 4,964.9 2,123.9 52.3 4.0 19.9
Sources: Zambia Revenue Authority (various years) and IMF (2012a).
18 Capturing Mineral Revenues in Zambia: Past Trends and Future Prospects
Policy implications
Looking ahead, the projections for the period 2013-2025 suggest that revenues from the mining sector could on average be 6 percent of GDP. As another example, consider how the additional revenues could contribute to poverty reduction. In 2010, poverty incidence was 60.5 percent. The depth of poverty was 0.28. The poverty line was US$30.4 /month. With the total population of 13 million it is possible to estimate what it would cost in financial terms to lift households above the poverty line. Assuming a uniform transfer of the value of the poverty line to all those under it would cost roughly US$2.9 billion annually. This amount is well within the average annual revenue estimates under the revenue scenarios outlined above. 26
Success, however, depends on how far information and bargaining asymmetries between the tax authorities and mining companies are tackled. Even at low tax rates, the revenue yield would remain pitifully low, given the incentives for investors to understate revenues and the often pervasive transfer pricing schemes. 27 National efforts at strengthening tax administration and collection, including audit capacities and closing remaining loop holes in existing legislation, especially in relation to large-scale mining operations, are essential. These measures will hopefully stem capital flight and trade mispricing.
6. Conclusion
Zambia is one of the world’s major copper exporters. Ownership of the mines underwent momentous changes. The colonial mode of private ownership continued well into the independence period. Then, with the emergence of a nationalist agenda and a political philosophy of self-reliance, the mines were nationalized. However, due to internal and external factors, the sector’s performance was unsatisfactory. Copper output declined steadily, as did prices, which are determined internationally. With the advent of a new global political and economic hegemony, the mines were privatized. To the fortunes of the new owners of the mines, almost immediately after privatization, world prices rebounded strongly and have remained above the 30-year average, thereby igniting the sector’s recovery.
However, a central feature of the Zambian copper sector is that the revenues that flow into the state’s budget have not been much different under either state or private ownership. The weak revenue generation under state ownership is often attributed to the poor performance of the sector. In the case of private ownership, inadequate revenue flows can be explained by the nature of the contracts, which provided exceptionally favourable incentives in the form of low taxes, low royalty rates and longer stability periods. Illicit financial flows and transfer pricing schemes have also deprived Zambia of much-needed resources.
Therefore, despite the high share of copper exports in total exports, the country still has very low revenue take from copper relative to total public revenues. This is a deeper reflection of the political economy and weak state capacities for governing natural resources in many least-developed countries (Barma et al., 2012). In particular, it highlights the dangers of case-by-case negotiation of fiscal regimes, often a temptation that applies countries emerging from crisis eager to attract foreign investment yet facing limited knowledge of markets and negotiation capacity. However, the new fiscal regime introduced in 2008, if well implemented, provides the opportunity to capture adequate revenues.
Nevertheless, success will not be automatic. Issues related to governance, transparency and accountability over the revenues will remain central. If Zambia can get this balance right, the country’s mineral wealth can finally begin to contribute to its long-term economic and social development.

19Capturing Mineral Revenues in Zambia: Past Trends and Future Prospects
Notes
Notes
1. The nationalisation coincided with the formation of two state mining firms—the Nchanga Consolidated Copper Mines and the Roan Copper Mines. The Nchanga Consolidated Copper Mines was born out of Anglo America Corporation’s (AAC) controlling stake, while the Roan Copper Mines was the successor of the Roan Selection Trust (RST).
2. World Development Indicators 2012.
3. Nonetheless, to protect its interests in privatized companies, the government retained a residual ownership of the mines through ZCCM-IH’s equity stake holding of between 10 percent and 21 percent.
4. World Development Indicators 2012.
5. For instance, in the project document outlining the proposed development of Lumwana Copper Project operated by Equinox (Equinox Minerals Ltd, 2011), it is indicated that the provisions of the Development Agreements would apply to the project, despite the revocation of the instruments in 2008.
6. The price boom started in 2003 and peaked in the first half of 2008 before the global financial and economic crisis pushed the price of copper towards the 2003 levels, but remained above the long-run average. Thus, 2002 is used as a counterfactual while the end of 2008 represents termination of the boom when the prices were at all-time low in December 2008.
7. The investors had full information of the state of the mines, mainly revealed through execution of due-diligence investigations.
8. Total annual project operating costs, including royalty payments, were estimated at US$10.59/ton of copper for the 16-year mine life.
9. Since the actual years of operation are not specified in the report in terms of calendar period, we have taken 2005 for which Kansanshi mine data are available as the starting point in comparing costs and prices.
10. US$0.91 million per annum calculated at 0.6 percent of gross revenue or US$0.1 per ton. Although the royalty rate embodied in the Development Agreement was 3 percent, ultimately Kansanshi renegotiated for 0.6 percent following award of similar concessions to KCM and MCM.
11. This story is excellently captured by a documentary entitled Stealing Africa – Why Poverty? See www.youtube.com/watch?v=WNYemuiAOfU
12. The Arm’s Length Principle of the Organisation for Economic Cooperation and Development (OECD) is stipulates that “transactions should be valued as if they had been carried out between unrelated parties, each acting in his own best interest” (OECD, 2006).
13. All Development Agreements had this clause embedded in them.
14. Inter Press Service News Agency: www.ipsnews.net/2010/11/zambia-debate-over-windfall-tax/
15. Mining experts lauded the authorities on this move. In particular, the Fraser Institute posited that, with its long history of copper mining, Zambia understood the risks involved in regulatory uncertainty and was prepared to negotiate and discuss (Fraser Institute, 2010).
16. The tax measures also eliminated the price participation schemes. Although this had no revenue implications for central government budget, it risked eroding the income base of ZCCM-IH, which drew the bulk of its income from these schemes, thereby possibly drawing government into either recapitalization of the company or providing an increased current subvention.
17. For instance, even after the lapse of the resource contracts, Lumwana was still making the projections using the old regime of incentives (Equinox Minerals Ltd, 2011).
18. Other variables remaining constant.
19. Data on unit cost go up to 2008. Data for 2009 to 2012 are projections derived from previous year’s figures adjusted for domestic inflation.
20. Our simulations use a discount rate of 8 percent. As a robustness check, a lower discount rate of 5 percent was also used, yielding a higher present-value but lower permanent income. Nonetheless, variations in discount rates do not materially alter the central message that mining firms appropriated significant resource savings against the government’s low revenue capture.

20 Capturing Mineral Revenues in Zambia: Past Trends and Future Prospects
Notes
21. Lundstøl, et al. (2013) estimate that, if Zambia had performed at par with Chile in terms of contribution of mining value added to GDP, a total of US$6.0 billion in mineral revenue would have been generated. They calculated that actual average revenues amounted to US$1.6 billion between 1998 and 2011. Under their scenario, the forgone revenue is equal to US$316 million per annum, which translates to 3.7 percent of GDP, the same as our estimate under the counterfactual scenario from 1997-2012.
22. This is even higher than in Chile, the world’s largest exporter of copper. Through its model of mixed public and private ownership, the share of copper revenues to GDP in Chile rose from 1.5 percent in the 1990s to 5.2 percent during the boom years from 2003 to 2008 (Meller and Simpasa, 2011).
23. For instance, ZCCM-IH has entered into joint venture with Nava Bharat of Singapore on a 35:65 investment ratio in Maamba Collieries Limited to be operated as an integrated coal mining and thermal power plant company with potential to generate 300 Mega Watts in the first phase of investment. The investment is valued at a total of US$750 million (see ZCCM-IH: www.tinyurl.com/mejhllm)
24. See Adam and Simpasa (2011).
25. These related to the goals on child (MDG4) and maternal health (MDG5) and infectious disease (MDG7). The calculations were made by Mphuka (2005) by summing the estimated costs for prevention and treatment of HIV/AIDS, malaria, and maternal health, and the cost of providing a basic health care package.
26. The examples are not meant to suggest that the only route to poverty alleviation is by turning mineral revenues into cash transfers—although enhancing social protection should be part of the national development debate. They merely illustrate the order of magnitude of the required resource flow to address Zambia’s poverty. Alternatively, the additional resources depicted by our projected revenue stream from taxing the mining industry could be spent on upgrading the transport, energy and other infrastructure to raise productivity and competitiveness of the non-mineral sector, which has large-scale job-creating potential.
27. The audit by PriceWaterhouseCoopers (2011) demonstrates in part this asymmetry in capacity and information flow between mining companies and the revenue authority.

21Capturing Mineral Revenues in Zambia: Past Trends and Future Prospects
References
References
Adam, C., and A Simpasa (2011) Copper Mining in Zambia: from Collapse to Recovery. In P. Collier, & A. J. Venables (Eds.): Plundered Nations? Successes and Failures in Natural Resource Extraction. London: Palgrave Macmillian.
AfDB (2009) Impact of the Crisis on African Economies – Sustaining Growth and Poverty Reduction African Perspectives and Recommendations to the G20, A report from the Committee of African Finance Ministers and Central Bank Governors, African Development Bank
Barma, N. H., K. Kaiser, T.M Le and L. Viñuela (2011) Rents to Riches? The Political Economy of Natural Resource-Led Development. Washington DC: World Bank.
Bates, R. H. and P. Collier (1995) The Politics and Economics of Policy Reform in Zambia, Journal of African Economies, 4(1): 115-43.
Bigsten , A. and S. Kayizzi-Mugerwa (2000) The Political Economy of Policy Failure in Zambia, Working Papers in Economics 23, Göteborg University, Department of Economics.
Bostock, M., and C Harvey (1972) Economic Independence and Zambian Copper: A Case Study of Foreign Investment. New York: Praeger Publishers.
Boyce, James K and L. Ndikumana, Capital Flight from Sub-Saharan African Countries: Updated Estimates, 1970-2010. Political Economy Research Institute Research Report (October 2012). University of Massachusetts Amherst.
Central Statistics Office (2010) Labour Force Survey Report 2008. Lusaka: Central Statistics Office.
Central Statistics Office (2011) The Monthly. October, 2011. Lusaka: Central Statistics Office.
Chance, Clifford (2004) Government of the Republic of Zambia and Konkola Copper Mines Plc. Amended and restated Development Agreement.
Chisala, V., A. Geda, H. Dagdeviren, T. McKinley, A. Saad-Filho and Carlos Oya (2006) Economic Policies for Growth, Employment and Poverty Reduction: Case Study of Zambia. UNDP and School of Oriental and African Studies: Lusaka
Cobham, A. (2012) Tax Havens and Illicit Flows. in Reuter, P. (ed.) Draining Development? Controlling Flows of Illicit Funds from Developing Countries. Washington DC: World Bank.
Cunningham, S. (1981) The Copper Industry in Zambia: Foreign Mining Companies in a Developing Country. New York: Praeger.
Equinox Minerals Ltd. (2011) Lumwana Project Technical Report. Perth: Equinox Minerals Ltd.
Foreign Investment Advisory Service (2004) Zambia Sectoral Study of the Effective Tax Burden.
Foster, V., and C. Dominguez (2011). Zambia’s Infrastructure: A continental perspective. Policy Research Working Paper, WPS5599. Washington, DC: World Bank.
Fraser Institute. (2010). Annual survey of mining companies (2007/2008). Vancouver: Fraser Institute.
GRD Minproc (2003) The Kansanshi Copper Project. Perth: GRD Minproc Limited (for Kansanshi Minerals Limited).
Government of the Republic of Zambia [GRZ] (1999) Zambia Letter of Intent. Memorandum of Economic and Financial Policies. International Monetary Fund.
GRZ (2008) Budget Address. Lusaka: Government Printers.
GRZ (2010) Foreign Private Investment and Investor Perception in Zambia. Lusaka: Bank of Zambia, Zambia Development Agency and Central Statistical Office.
GRZ. (2013). The Bank of Zambia (Monitoring of Balance of Payment) Regulations, 2013. Statutory Instrument (SI) No 55. Government Printers.
22 Capturing Mineral Revenues in Zambia: Past Trends and Future Prospects
References
Gulhati, R. (1989) Impasse in Zambia: The Economics and Politics of Reform. World Bank Economic Development Institute Development Policy Case Studies No.2. . Washington, DC: World Bank.
IMF (2012a) Country Report No. 12/200. Zambia 2012 Article IV Consultation, International Monetary Fund (IMF)
IMF (2012b) Macroeconomic Policy Frameworks for Resource-Rich Developing Countries, Policy Paper, 24 August 2012. International Monetary Fund: Washington DC.
Inter Press Service News Agency: www.ipsnews.net/2010/11/zambia-debate-over-windfall-tax/
KPMG (2012) Global Transfer Pricing Review: Zambia. KPMG International.
Lundstøl, O., G. Raballand and F. Nyirongo (2013), Low Government Revenue from the Mining Sector in Zambia and Tanzania: Fiscal Design, Technical Capacity or Political Will? ICTD Working Paper 9, International Centre for Tax and Development (ICTD)
Lungu, J. (2009) The Politics of Reforming Zambia’s Mining Tax Regime, Resource Insight, Issue No. 8, August. Southern Africa Resource Watch.
Meller, P. and A. Simpasa (2011) The Role of Copper in the Chilean and Zambian Economies: Main Economic and Policy Issues. GDN Working Paper No 43, June 2011. Global Development Network.
Mphuka, C. (2005) The Cost of Meeting the MDGs in Zambia, October 2005. Lusaka: University of Zambia.
OECD (2006) Annual Report on the OECD Guidelines for Multinational Enterprises: Conducting Business in Weak Governance Zones, Organization of Economic Development and Cooperation (OECD), Paris.
Oshionebo, E. (2011) Fiscal Regimes for Natural Resource Extraction: Implications for Africa’s Development, in F.N. Botchway (ed.): Natural Resource Investments and Africa’s Development. Cheltenham: Edward Elgar.
PriceWaterHouseCoopers (2011), Zambia Extractive Industries Transparency Initiative-Independent Reconciliation Report for Year End 2008, PriceWaterHouseCoopers, Lusaka
Reuter, P. (2012) Draining Development? Controlling Flows of Illicit Funds from Developing Countries. Ed. Washington DC: World Bank.
Sherpa (2011) Specific Instance Regarding Glencore International AG and First Quantum Minerals Ltd. and their alleged violations of the OCED guidelines for multinational enterprises via the activities of Mopani Copper Mines Plc. in Zambia. Press Folder. SHERPA, Déclaration de Berne, the Centre for Trade Policy and Development, L’Entraide Missionnaire and Mining Watch Canada.
Sklar, Richard L. Zambia’s response to the Rhodesian unilateral declaration of independence. Politics in Zambia 15 (1974): 320.
Soros, G. (2007) Foreword, in Humphreys, M., J. D. Sachs and J. E. Stiglitz (eds.): Escaping the Resource Curse. New York: Columbia University Press.
Stiglitz, J. E. (2007) What is the Role of the State?, in Humphreys, M., J. D. Sachs and J. E. Stiglitz (eds.): Escaping the Resource Curse. New York: Columbia University Press.
World Bank (2004) Zambia Country Economic Memorandum: Policies for Growth and Diversification. Washington DC: World Bank.
ZCCM-IH (2012) Annual Report. Lusaka: ZCCM-IH.
ZCCM-IH: www.tinyurl.com/mejhllm
23Capturing Mineral Revenues in Zambia: Past Trends and Future Prospects
Appendix
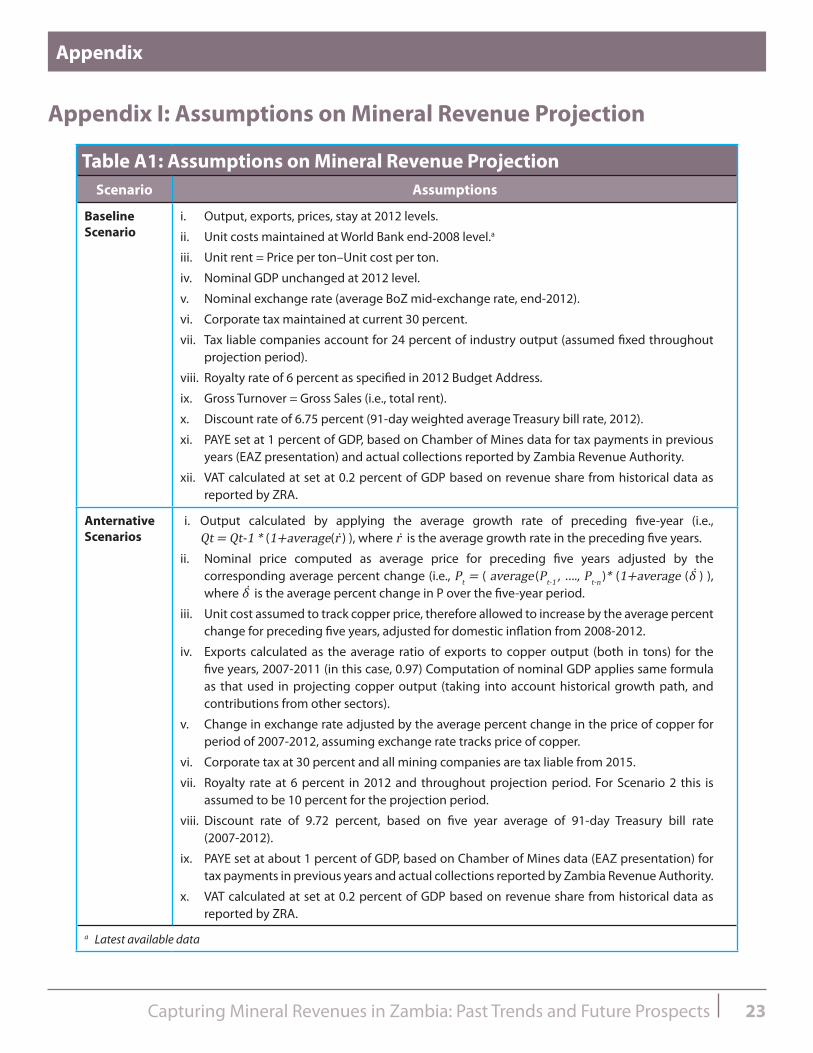
Appendix I: Assumptions on Mineral Revenue Projection
Table A1: Assumptions on Mineral Revenue ProjectionScenario Assumptions
Baseline Scenario
i. Output, exports, prices, stay at 2012 levels.
ii. Unit costs maintained at World Bank end-2008 level.a
iii. Unit rent = Price per ton–Unit cost per ton.
iv. Nominal GDP unchanged at 2012 level.
v. Nominal exchange rate (average BoZ mid-exchange rate, end-2012).
vi. Corporate tax maintained at current 30 percent.
vii. Tax liable companies account for 24 percent of industry output (assumed fixed throughout projection period).
viii. Royalty rate of 6 percent as specified in 2012 Budget Address.
ix. Gross Turnover = Gross Sales (i.e., total rent).
x. Discount rate of 6.75 percent (91-day weighted average Treasury bill rate, 2012).
xi. PAYE set at 1 percent of GDP, based on Chamber of Mines data for tax payments in previous years (EAZ presentation) and actual collections reported by Zambia Revenue Authority.
xii. VAT calculated at set at 0.2 percent of GDP based on revenue share from historical data as reported by ZRA.
Anternative Scenarios
i. Output calculated by applying the average growth rate of preceding five-year (i.e., Qt = Qt-1 * (1+average(r ) ), where r is the average growth rate in the preceding five years.
ii. Nominal price computed as average price for preceding five years adjusted by the corresponding average percent change (i.e., Pt = ( average (Pt-1 , …., Pt-n )* (1+average (δ ) ), where δ is the average percent change in P over the five-year period.
iii. Unit cost assumed to track copper price, therefore allowed to increase by the average percent change for preceding five years, adjusted for domestic inflation from 2008-2012.
iv. Exports calculated as the average ratio of exports to copper output (both in tons) for the five years, 2007-2011 (in this case, 0.97) Computation of nominal GDP applies same formula as that used in projecting copper output (taking into account historical growth path, and contributions from other sectors).
v. Change in exchange rate adjusted by the average percent change in the price of copper for period of 2007-2012, assuming exchange rate tracks price of copper.
vi. Corporate tax at 30 percent and all mining companies are tax liable from 2015.
vii. Royalty rate at 6 percent in 2012 and throughout projection period. For Scenario 2 this is assumed to be 10 percent for the projection period.
viii. Discount rate of 9.72 percent, based on five year average of 91-day Treasury bill rate (2007-2012).
ix. PAYE set at about 1 percent of GDP, based on Chamber of Mines data (EAZ presentation) for tax payments in previous years and actual collections reported by Zambia Revenue Authority.
x. VAT calculated at set at 0.2 percent of GDP based on revenue share from historical data as reported by ZRA.
a Latest available data

24 Capturing Mineral Revenues in Zambia: Past Trends and Future Prospects
Appendix
Appendix II: Revenue from other minerals
With the support of the European Union, the Zambian Government has been implementing a Mining Sector Diversification Project. This strategy has been aimed at increasing export earnings from non-traditional minerals, generating employment opportunities and contributing to poverty alleviation. However, generating more revenue from emeralds and other gemstones is largely conditional on improved efforts at better data capture. The authorities rely chiefly on self-declaration by individual mining firms. Moreover, gemstone minerals are largely produced by small artisanal miners scattered across the country (mainly rural areas) using rudimentary equipment, with limited technical expertise and financing capital.
In 2011, the Bank of Zambia started collecting data on exports of gold and nickel with exports totalling US$126 million, out of which US$81 million was in gold exports. Nickel production has in recent years suffered from disruptions at the Munali Nickel Mine and, to this end, there were no recorded exports of nickel in 2012. Only US$94 million was realized from gold exports. Some estimates put potential total earnings from gemstone exports at more than US$600 million per annum (World Bank, 2004). Data for 2012 shows that US$232 million was generated from exports of gemstones and, together with gold, total exports from non-traditional minerals stood at about US$330 million.
Zambia’s emeralds feature among the world’s richest in terms of quality. As shown in Table A2, production of emeralds remained relatively stable between 1991 and 1999. Beginning 2000, emerald outputs increased from 7.2 metric tons to 14 metric tons in 2003. Then production shot up in 2006 to reach 41 metric tons and reached 48 metric tons in 2010. Similarly, export earnings from emerald increased significantly from 3 million in 1992 to 50 million in 2010.
Table A2: Emeralds Production and Exports1991 0.6 10.7
1992 2.6 2.8
1993 0.7 1.6
1994 0.4 1.8
1995 0.6 2.9
1996 1.2 6.5
1997 1.0 9.2
1998 1.9 7.3
1999 1.8 9.6
2000 7.2 9.8
2001 not available not available
2002 7.3 11.6
2003 13.6 14.2
2004 not available not available
2005 not available not available
2006 40.8 18.1
2007 29.0 28.6
2008 40.3 32.4
2009 46.0 38.9
2010 48.3 49.8
Source: Ministry of Mines and Bank of Zambia.
25Capturing Mineral Revenues in Zambia: Past Trends and Future Prospects
Appendix
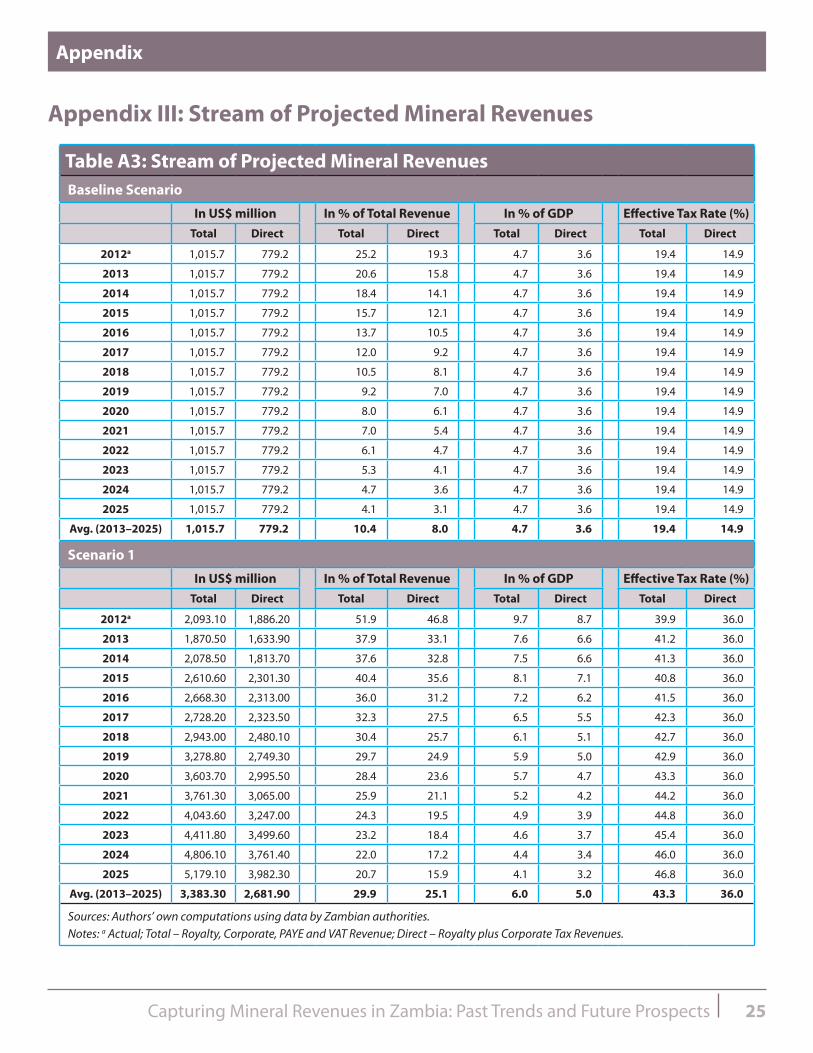
Appendix III: Stream of Projected Mineral Revenues
Table A3: Stream of Projected Mineral RevenuesBaseline Scenario
In US$ million In % of Total Revenue In % of GDP Effective Tax Rate (%)Total Direct Total Direct Total Direct Total Direct
2012a 1,015.7 779.2 25.2 19.3 4.7 3.6 19.4 14.9
2013 1,015.7 779.2 20.6 15.8 4.7 3.6 19.4 14.9
2014 1,015.7 779.2 18.4 14.1 4.7 3.6 19.4 14.9
2015 1,015.7 779.2 15.7 12.1 4.7 3.6 19.4 14.9
2016 1,015.7 779.2 13.7 10.5 4.7 3.6 19.4 14.9
2017 1,015.7 779.2 12.0 9.2 4.7 3.6 19.4 14.9
2018 1,015.7 779.2 10.5 8.1 4.7 3.6 19.4 14.9
2019 1,015.7 779.2 9.2 7.0 4.7 3.6 19.4 14.9
2020 1,015.7 779.2 8.0 6.1 4.7 3.6 19.4 14.9
2021 1,015.7 779.2 7.0 5.4 4.7 3.6 19.4 14.9
2022 1,015.7 779.2 6.1 4.7 4.7 3.6 19.4 14.9
2023 1,015.7 779.2 5.3 4.1 4.7 3.6 19.4 14.9
2024 1,015.7 779.2 4.7 3.6 4.7 3.6 19.4 14.9
2025 1,015.7 779.2 4.1 3.1 4.7 3.6 19.4 14.9
Avg. (2013–2025) 1,015.7 779.2 10.4 8.0 4.7 3.6 19.4 14.9
Scenario 1
In US$ million In % of Total Revenue In % of GDP Effective Tax Rate (%)Total Direct Total Direct Total Direct Total Direct
2012a 2,093.10 1,886.20 51.9 46.8 9.7 8.7 39.9 36.0
2013 1,870.50 1,633.90 37.9 33.1 7.6 6.6 41.2 36.0
2014 2,078.50 1,813.70 37.6 32.8 7.5 6.6 41.3 36.0
2015 2,610.60 2,301.30 40.4 35.6 8.1 7.1 40.8 36.0
2016 2,668.30 2,313.00 36.0 31.2 7.2 6.2 41.5 36.0
2017 2,728.20 2,323.50 32.3 27.5 6.5 5.5 42.3 36.0
2018 2,943.00 2,480.10 30.4 25.7 6.1 5.1 42.7 36.0
2019 3,278.80 2,749.30 29.7 24.9 5.9 5.0 42.9 36.0
2020 3,603.70 2,995.50 28.4 23.6 5.7 4.7 43.3 36.0
2021 3,761.30 3,065.00 25.9 21.1 5.2 4.2 44.2 36.0
2022 4,043.60 3,247.00 24.3 19.5 4.9 3.9 44.8 36.0
2023 4,411.80 3,499.60 23.2 18.4 4.6 3.7 45.4 36.0
2024 4,806.10 3,761.40 22.0 17.2 4.4 3.4 46.0 36.0
2025 5,179.10 3,982.30 20.7 15.9 4.1 3.2 46.8 36.0
Avg. (2013–2025) 3,383.30 2,681.90 29.9 25.1 6.0 5.0 43.3 36.0
Sources: Authors’ own computations using data by Zambian authorities. Notes: a Actual; Total – Royalty, Corporate, PAYE and VAT Revenue; Direct – Royalty plus Corporate Tax Revenues.
26 Capturing Mineral Revenues in Zambia: Past Trends and Future Prospects
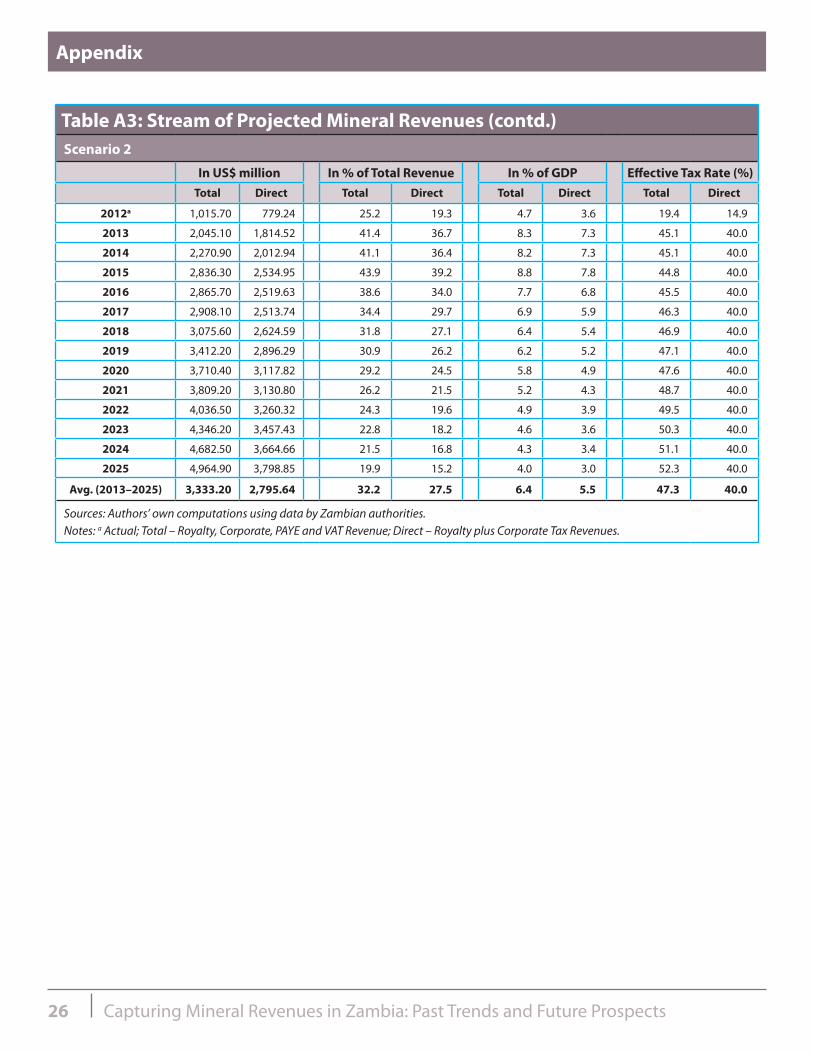
Appendix
Table A3: Stream of Projected Mineral Revenues (contd.)Scenario 2
In US$ million In % of Total Revenue In % of GDP Effective Tax Rate (%)Total Direct Total Direct Total Direct Total Direct
2012a 1,015.70 779.24 25.2 19.3 4.7 3.6 19.4 14.9
2013 2,045.10 1,814.52 41.4 36.7 8.3 7.3 45.1 40.0
2014 2,270.90 2,012.94 41.1 36.4 8.2 7.3 45.1 40.0
2015 2,836.30 2,534.95 43.9 39.2 8.8 7.8 44.8 40.0
2016 2,865.70 2,519.63 38.6 34.0 7.7 6.8 45.5 40.0
2017 2,908.10 2,513.74 34.4 29.7 6.9 5.9 46.3 40.0
2018 3,075.60 2,624.59 31.8 27.1 6.4 5.4 46.9 40.0
2019 3,412.20 2,896.29 30.9 26.2 6.2 5.2 47.1 40.0
2020 3,710.40 3,117.82 29.2 24.5 5.8 4.9 47.6 40.0
2021 3,809.20 3,130.80 26.2 21.5 5.2 4.3 48.7 40.0
2022 4,036.50 3,260.32 24.3 19.6 4.9 3.9 49.5 40.0
2023 4,346.20 3,457.43 22.8 18.2 4.6 3.6 50.3 40.0
2024 4,682.50 3,664.66 21.5 16.8 4.3 3.4 51.1 40.0
2025 4,964.90 3,798.85 19.9 15.2 4.0 3.0 52.3 40.0
Avg. (2013–2025) 3,333.20 2,795.64 32.2 27.5 6.4 5.5 47.3 40.0
Sources: Authors’ own computations using data by Zambian authorities. Notes: a Actual; Total – Royalty, Corporate, PAYE and VAT Revenue; Direct – Royalty plus Corporate Tax Revenues.

For more information: www.undp.org/poverty and www.undp.org/extractiveindustries
United Nations Development Programme
One United Nations Plaza • New York, NY 10017 USA