DISCUSSION DRAFT Electronic Monitoring and Electronic ... · 1 on electronic monitoring and...
79
DISCUSSION DRAFT Electronic Monitoring and Electronic Reporting: Guidance & Best Practices for Federally-Managed Fisheries National Oceanic and Atmospheric Administration National Marine Fisheries Service in collaboration with Regional Fishery Management Councils Interstate Marine Fisheries Commissions State Marine Fisheries Agencies Tribes Commercial and Recreational Fishermen Fishing Community Organizations Environmental and Non-Governmental Organizations Electronic Technology Service Providers August 2013
Transcript of DISCUSSION DRAFT Electronic Monitoring and Electronic ... · 1 on electronic monitoring and...
DISCUSSION DRAFT
Electronic Monitoring and Electronic Reporting:
Guidance & Best Practices for
Federally-Managed Fisheries
National Oceanic and Atmospheric Administration
National Marine Fisheries Service
in collaboration with Regional Fishery Management Councils
Interstate Marine Fisheries Commissions
State Marine Fisheries Agencies
Tribes
Commercial and Recreational Fishermen
Fishing Community Organizations
Environmental and Non-Governmental Organizations
Electronic Technology Service Providers
August 2013

EM/ER Discussion Draft Page ii

EM/ER Discussion Draft Page iii
Foreword
What is a “Discussion Draft”? A discussion draft is a draft work in progress intended to stimulate reader thought and to extract reader’s reaction to a topic. The purpose is to mine reader’s additional ideas and contributions for completion of a final document.
What is the intended use for this document?
The objective of the discussion draft is to promote discussion and thinking within regions and across regions about electronic monitoring (EM) and electronic reporting (ER).
Our collective goal for the final document, scheduled for completion this Fall, is to help managers and stakeholders consider the questions of how EM/ER tools can help contribute to a more cost-effective and sustainable collection of fishery dependent data in our federally-managed fisheries.
Are these Mandatory Requirements?
No. The guidance in the document is not prescriptive or regulatory in nature and is offered simply as preliminary advice and suggested best practices. As consideration of EM/ER proceeds in the eight Council regions it is hoped that additional feedback and guidance will be submitted for addition to this document over time as a “living document” to improve the knowledge base and information available to assist decision makers.
Who should read this document?
This document is for anyone interested in evaluating EM/ER tools for possible adoption; those that are interested in refining their programs and learning from other regions’ experiences; and for those who already have experience with implementing EM/ER who are willing to share their knowledge with others.
If my region is already using EM/ER, why should I read and provide input on this document?
Each region is at a different stage in implementing EM/ER. There are lessons learned that can be applied across regions and fisheries. If a reader has experience with approaches or tools that did or did not work well for a particular fishery, this knowledge could assist others in designing their programs and save others from wasted time, effort and expense.
How to Comment on this Document:
If you have any input, additional ideas, guidance or suggestions on EM/ER to add to the document, especially advice or suggested best practices based on your direct experience, please submit them via an email to: [email protected].

EM/ER Discussion Draft Page iv
Table of Contents
Foreword ............................................................................................................................ iii Executive Summary ........................................................................................................... vi 1.0 Introduction ....................................................................................................................1 1.1 NOAA Fisheries Service Policy on Electronic Technologies ...................................... 2 2.0 A Roadmap for Developing a Monitoring Strategy .......................................................3 2.1 Roadmap Phase I - Assessment ....................................................................................4 2.2 Roadmap Phase II - Identification of goals for a monitoring program .........................7 2.3 Roadmap Phase III - Program design ...........................................................................9 2.4 Roadmap Phase IV - Pre-implementation ...................................................................11 2.5 Roadmap Phase V - Implementation ..........................................................................12 2.6 Roadmap Phase VI - Review and adapt ......................................................................13 2.7 Roadmap Conclusion ..................................................................................................13 3.0 Evaluating Alternative Monitoring Strategies ............................................................15 3.1 Evaluation methods .....................................................................................................15 3.2 Example of a multi-attribute analysis ..........................................................................15 3.3 Defining EM/ER Requirements ...................................................................................18 4.0 Design Decision Points and Technical Guidance .......................................................19 4.1 System Structure and Adaptive Management .............................................................19 4.2 Controlling and Computing Costs of EM/ER .............................................................20 4.3 Generating Revenues for EM/ER ...............................................................................25 4.4 Technical Guidance ....................................................................................................26 Durability Threshold .............................................................................................27 Enforceability of data ............................................................................................28 Data quality ...........................................................................................................30 Operability/Maintenance .......................................................................................31 Infrastructure, Data Integration, and Timeliness ..................................................31 Data for Both Fisheries governance and fisheries business ..................................33 Fish/Catch Handling .............................................................................................34 Confidentiality ......................................................................................................34 Archiving Data ......................................................................................................35 Applicability of EM/ER ........................................................................................ 35 4.5. Examples of U.S. EM/ER and VMS Programs ..........................................................38 5.0 Moving Forward .........................................................................................................45 5.1 Filling Performance Gaps ..........................................................................................45 5.2. Towards a Shared Future ............................................................................................47 5.3 Next Steps ..................................................................................................................50 6.0 Citations .....................................................................................................................52 7.0 References ..................................................................................................................54

EM/ER Discussion Draft Page v
Appendices Appendix A List of Terms… .............. …………………………………………………A-1 Appendix B1 Summary of fishery-dependent Electronic Vessel Reporting and E-Logbooks………………… .............……………………………………………B1-1 Appendix B2 Summary of fishery-dependent Electronic Dealer trip reporting… ……B2-1 Appendix B3 Summary of Electronic Video Monitoring Projects in U.S. Fisheries …B3-1 Appendix B4 Other Existing EM/ER Technologies……………………………… ..…B4-1

EM/ER Discussion Draft Page vi
Executive Summary
Advice and best practices is provided in a discussion document format for NMFS and Councils to evaluate, add to, and apply where applicable in developing regionally-appropriate fishery dependent data collection programs utilizing electronic monitoring and electronic reporting. The document was informed by findings of five white papers on electronic monitoring and electronic reporting (EM/ER)1 commissioned by the NMFS leadership in 2012 and other expert input and experience. It includes principles consistent with the Agency’s April 2013 policy on adoption of electronic technologies. The core principle is a regionally-driven focus to promote shared information and improve coordination across regions to improve overall Agency data collection efficiency and effectiveness. The goal is to obtain the appropriate amount and quality of data at the least cost in time and money over the long term. This could mean equal or better data at a less cost, or perhaps slightly less data (but still sufficient to meet management needs) at greatly reduced costs. This may require the consideration of a realignment of fishery management regulations with the range of current or emerging electronic technologies. The guidance acknowledges the importance of integrated reporting, monitoring, and information systems, and that a mix of EM/ER and existing methods may be the most effective solution.
A strategic process of goal identification, priority setting, implementation and evaluation/feedback is proposed as the roadmap of the steps and flow of decisions associated with the design and implementation of a fishery dependent data collection program that considers EM/ER tools. The early and frequent role of stakeholders in every step in this collaborative effort is paramount, and a series of checklists is provided for the six phases comprising the strategic process.
To evaluate the pros and cons of different EM/ER choices, a number of decision tools are described for consideration and an example is presented of a comparative matrix analysis of EM/ER options. Several sections follow examining EM/ER technical guidance, focusing on equipment, hardware, software, data handling, quality assurance, timeliness and infrastructure requirements of EM/ER. Specific decision parameters are discussed for durability; enforceability; operability/maintenance; fish/catch handling procedures; confidentiality; data archiving; and dual governance and business uses of data. The applicability of EM/ER is examined for its use in fixed gear fisheries, full retention fisheries, small boat fisheries and recreational fisheries. The section concludes with three regional case examples: a Vessel Monitoring System application in the Northwest; an ER application in the Northeast; and an EM application in Alaska.
Short and long-term technical and institutional gaps affecting the successful application of an EM/ER strategy are identified. This is followed by a discussion of a potential shared future
1For the purpose of this document, EM/ER is used broadly to mean any electronic tool used to support catch monitoring efforts, including electronic reporting (e.g., e-logbooks, tablets, and other input devices) and electronic monitoring (Vessel Monitoring Systems, electronic cameras, and sensors on-board).

EM/ER Discussion Draft Page vii
strategy for NMFS, Councils and stakeholders based on shared experiences and lessons learned, but that also results in some creative tension. The advice promotes economies of scale and other cost-efficiencies by endorsing systems that can be expanded or replicated to support more than one fishery, Fishery Management Plan (FMP), Council area or region. However, the guidance also promotes the accommodation of specific fishery and regional goals, requirements and needs of specific Councils and fishermen. Accomplishing these two goals is not as simple as developing a single solution for the entire country – there is no single EM/ER solution, single service provider, or a single hardware type. The solution is more complex and a strategy and timeline for creating a shared vision for moving forward based on collaboration across regions and common sense is discussed. The strategy is a multistep process and includes a January 2014 workshop to: 1) share information and EM/ER work in progress; 2) help Councils resolve technical and process impediments; and 3) assist Council’s work towards a decision by the end of 2014 on where EM/ER tools can best help improve the data collection programs associated with their FMPs.
As a Discussion Draft, it is anticipated that feedback on the draft material or additional advice and best practices will be submitted by readers for inclusion in the final document to improve the knowledge base and information available to assist decision makers. Additional input, advice or best practices to add to the document should be submitted to: [email protected] by September 30, 2013.

EM/ER Discussion Draft Page 1
Section 1
1.0 Introduction
The ability of the National Marine Fisheries Service (NMFS) to achieve management objectives for the Nation’s fisheries is contingent on being able to collect high quality, timely and cost-effective fishery dependent and fishery independent data. This document focuses on fishery dependent data collection. The document offers advice and best practices for NMFS and Councils to use in developing regionally-appropriate fishery dependent data collection programs utilizing electronic monitoring and electronic reporting where and when applicable.
Monitoring is an important, yet complex component of fisheries management. For each fishery, NMFS and the Regional Fishery Management Councils (Councils) are responsible for determining the nature and extent of monitoring necessary to meet scientific data requirements and/or achieve management goals.
Flat or declining budgets and other drivers, however, have highlighted the need to evaluate and improve existing fishery dependent data collection approaches, in particular their cost and cost-effectiveness. Several current approaches are not sustainable, and emerging electronic technologies may offer the opportunity to collect data in ways that improve cost-effectiveness and efficiency in the long term.
The document was informed by findings of five white papers1 on electronic monitoring and electronic reporting (EM/ER)2 commissioned by the NMFS leadership in 2012, and additional input from NMFS staff, Councils, outside experts and stakeholder groups. It includes principles consistent with the Agency’s April 2013 policy on adoption of electronic technologies.3 The core process envisioned in the Agency policy is regionally driven and focused, and seeks to share information and improve coordination across regions to improve agency efficiency and effectiveness.
This document looks to potential future reporting and monitoring approaches that support the Agency’s goal to achieve a more cost-effective and sustainable approach to fishery dependent data collection: i.e., equal or better data at a reduced cost in time and/or money for the long term. This may require a realignment of fishery management regulations with the range of current or emerging electronic technologies. It recognizes the importance of integrated reporting, monitoring, and information systems, and that a mix of EM/ER and existing methods may be the most effective solution.
1 http://www.nmfs.noaa.gov/sfa/reg_svcs/Councils/ccc_2013/K_NMFS_EM_WhitePapers.pdf Electronic Monitoring White Paper on Existing Technologies Electronic Monitoring White Paper on Enforcement Electronic Monitoring White Paper on Research and Development Electronic Monitoring White Paper on Alignment of Objectives Electronic Monitoring White Paper on Funding Options 2For the purpose of this document, EM/ER is used broadly to mean any electronic tool used to support catch monitoring efforts, including electronic reporting (e.g., e-logbooks, tablets, and other input devices) and electronic monitoring (Vessel Monitoring Systems, electronic cameras, and sensors on-board). 3 http://www.nmfs.noaa.gov/op/pds/documents/30/30-133.pdf
EM/ER Discussion Draft Page 2
The resulting document is based on three overarching principles that the program be:
1) Flexible to satisfy multiple requirements; 2) Scalable to varying industry and agency capabilities; 3) Inclusive and collaborative with the fishing industry, Councils, states, commissions and
tribes, NOAA Office of Law Enforcement (OLE), NOAA General Counsel, NMFS fishery managers, NMFS scientists, third-party service providers, and all other stakeholders such that they can participate in the design, development, and implementation of the program.
The guidance put forth in this document is organized into six sections. Section 2 provides process guidance in the form of a Roadmap on the steps and flow of decisions associated with the design and implementation of a fishery dependent data collection program that considers EM/ER tools. Section 3 provides tools and case examples to conduct comparative analyses of EM/ER options. Section 4 examines EM/ER technical guidance, focusing on equipment, hardware, software, data handling, quality assurance, and infrastructure requirements of EM/ER. It includes three case examples highlighting many of the process steps described in section 2. Section 5 identifies key policy and decision points in the development of a program that considers EM/ER options, and Section 6 presents short and long-term information gaps affecting the successful application of an EM/ER strategy that must be resolved and concludes with a brief discussion of a way forward. Appendix A provides a glossary of Terms, while Appendix B provides a set of tables outlining existing electronic reporting systems in place for seafood dealers and vessels, shows the history of electronic monitoring projects carried out in the US since 2002, and lists a variety of other electronic technologies currently used to obtain fishery dependent data in the United States.
1.1 NOAA Fisheries Service Policy on Electronic Technologies
On April 16, 2013, NOAA Fisheries Service adopted a new policy governing the direction of its staff with regard to the consideration of electronic technologies for fisheries dependent data collection. The policy, while not binding on Regional Councils and other stakeholders, is highly relevant to this guidance document because it outlines eight principles NOAA will be following for the consideration of electronic monitoring and electronic reporting options in the future. The policy statement is posted on line at http://www.nmfs.noaa.gov/op/pds/documents/30/30-133.pdf and reads as follows:
It is the policy of NOAA Fisheries to encourage the consideration of electronic technologies to complement and/or improve existing fishery-dependent data collection programs. The goal is to achieve the most cost-effective and sustainable approach that ensures alignment of management goals, data needs, funding sources and regulations.
The policy’s includes eight main principles are:
1. All forms of electronic technology should be considered. 2. Data collection programs must be periodically reviewed 3. Each data program may be comprised of a combination of methods. 4. Where full retention regulations and associated dockside catch accounting measures are
in place, NMFS supports and encourages evaluation and adoption of video cameras.

EM/ER Discussion Draft Page 3
5. Open source code or IT standards should be used 6. NOAA Fisheries will assemble guidance and best practices. 7. Programs will not be approved if they create an unsustainable cost of implementation. 8. NOAA Fisheries will work with Councils and stakeholders to develop transition plans.
This Policy Directive also established several authorities and responsibilities relevant to the application of this guidance document:
• The NOAA Fisheries Science Board and Regulatory Board are the Executive-level sponsors of the execution of this policy, including oversight of the development of guidance and best practices.
• Implementation of this policy will rely on Regional Offices (and the Office of Sustainable Fisheries with respect to Atlantic Highly Migratory Species) initiating consultations in FY 2013 with their respective Science Centers, Councils, States, Commissions, industry, and other stakeholders on the consideration and design, as appropriate, of fishery-dependent data collection programs that utilize electronic technologies for each Federal fishery.4
Building off this policy, NOAA Fisheries presented the Council Coordination Committee meeting in February 2013 a draft implementation process and schedule for their review and comment, and a follow-up report was presented at their May 2013 meeting. NOAA’s goal is to work collaboratively with Councils, fishing industry, states, commissions and other partners to improve and establish revised monitoring programs.
Section 2
2.0 A Roadmap for Developing a Monitoring Strategy
Introduction
The purpose of this section is to outline a process to facilitate the assessment, development, implementation, and evaluation of a well-designed monitoring strategy, with an emphasis on whether a well-integrated EM/ER program could augment or replace existing systems for fishery dependent data collection5. The specific parameters of monitoring programs are described in Section 4. While each fishery has its own ecological, social, and economic characteristics, we offer this roadmap to assist federal and state managers in developing durable monitoring systems that meet the short and long-term needs of fisheries managers, scientists, and industry stakeholders alike. For the purpose of this document, monitoring systems are defined broadly as the hardware, software, infrastructure and processes of collecting and processing fishery dependent data.
4 All references throughout this document to management responsibilities of Regional Offices also implicitly include the Office of Sustainable Fisheries Highly Migratory Species Division. 5 Although EM/ER is used as a collective term throughout this document, ER and EM are significantly different in terms of design, purpose, and application. To the extent possible, these distinctions between ER and EM should be maintained during evaluation and choice of different electronic options for data collection.

EM/ER Discussion Draft Page 4
The roadmap process below follows the general planning principles for continuous improvement of processes and products frequently applied in the business world. 6 This iterative planning approach is not new to fisheries and several recent adaptations of the process can be found in Guiding Principles for Development of Effective Monitoring Programs (MRAG Americas, 2011), Developing Effective Monitoring for the Northeast Multispecies Fishery: Methods and Considerations (NEFMC, 2012) and Fisheries Monitoring Roadmap (Lowman et al., 2013). These papers share the common goal of a planning cycle, placing particular emphasis on the importance of observing current conditions, defining goals, engaging stakeholders, executing the plan and then adapting to differences in planned versus actual results, and changes in management objectives/conditions and technology over time. Building off these ideas, the roadmap described in this section is broken down into six interconnected phases:
Phase I. Assessment
Phase II. Identification of goals
Phase III. Program design
Phase IV. Pre-implementation
Phase V. Implementation
Phase VI. Review and adaptation
2.1 Roadmap Phase I – Assessment
There are many monitoring tools that can be used to collect fishery dependent data. Each tool has a set of unique strengths and weaknesses. To determine which tool, or assemblage of tools, is most appropriate for a given fishery, state and federal fisheries managers must have a clear understanding of the capabilities of potential EM/ER technologies, the current monitoring system, and the existing fishery and regulatory framework (the goals). Managers must compile
6 For example, the Plan-Do-Check –Act cycle popularized by W. Edwards Deming.
Figure 1. The six Phases of the monitoring strategy development roadmap planning cycle

EM/ER Discussion Draft Page 5
these necessary data as a first step in assessing what changes need to be made to a monitoring program, since EM/ER will more often than not be implemented as a change to an existing system rather than initiated in an entirely new fishery. In addition, each assessment should also review potential funding sources for the monitoring program. The ultimate success of a transition from a non-EM/ER approach to one utilizing electronic technologies will depend on the quality of the groundwork done in this assessment phase, essentially determining what do you have to work with as a starting point?
In many cases there will be multiple sources of fishery dependent information that allow for verification of each other, such as the use of dockside monitors or port agents to confirm the accuracy of weigh-out slips or dealer records. An assessment of the current monitoring program will also reveal whether there are some EM or ER technologies already in the mix. Tables in Appendix B summarize current fishery-dependent ER vessel and dealer reporting systems, EM pilot programs, and other EM/ER technologies currently used in US fisheries.
Stakeholders: There are a variety of stakeholders in the fisheries management process dependent on the credibility of the data used to assess and manage fish stocks. Stakeholders include NMFS, the states, tribes, the fishing industry, the environmental community, and the public at-large. It is critical that the data used to manage fisheries are credible and the stakeholders have confidence in the information.
The successful deployment and use of electronic technologies relies heavily on the industry stakeholder’s desire and incentive to make them work. Some e-technologies work with no or limited industry interaction (VMS for example) where others require industry input (e-logs) or maintenance (EM camera lens cleaning). Therefore, part of the initial assessment in Phase 1 requires evaluating the industry’s willingness to adopt EM/ER solution. Another necessary analysis is the readiness of state and federal participants to back and promote EM/ER solutions and their capacity to generate the support of all the sectors being asked to adopt the technology. Some part of this activity is an assessment of industry technical/educational readiness: typical questions might include literacy and language barriers to navigate electronic screens and help systems; social and cultural familiarity or aversion to technology; and willingness to assume a greater share of the responsibility for delivering more accurate or more detailed data collection and recordkeeping. These answers will help identify the duration and costs of program design and training program requirements, ongoing support requirements, and help estimate operational and enforcement costs during the short and long term.
Another part of the industry stakeholder assessment is behavioral: if industry members are not initially assessed as willing or readily converted over as partners in accepting EM/ER solutions then the EM/ER success rate will be unacceptably low. Uncooperative stakeholders will not modify back deck procedures to accommodate EM deployment and will find a myriad of ways to defeat the integrity of the automated systems if they don’t have incentives and buy-in from the outset to make the systems work. Correct position of cameras, modification of sorting and fish handling procedures, adjustments in haul back and data recording are all typical types of adjustments that must be discussed and agreed to during the roadmap process, and stakeholders need to know up front that these types of discussions and agreements need to take place to ensure the expectations of the managers, enforcement agents and the users are met.

EM/ER Discussion Draft Page 6
In summary, communications with impacted industry members at the assessment stage of how things work today, and how things expect to change as the roadmap cycle moves forward, is a critical starting point; don’t wait to bring industry stakeholders in at some later Phase.
Infrastructure: What is the current status of the infrastructure of the fleet, the government and the service provider sector when it comes to current technology for the capture, communication, extraction, analysis, archival and subsequent retrieval of fishery dependent information? The roadmap contemplates a goal of ingesting significantly greater quantities of data on a more frequent basis, and processing images and storing outcomes securely in tamper-resistant vaults for evidentiary purposes. We need a thorough assessment of current vessel infrastructure and power to install, secure and operate electronics; shore side infrastructure capabilities in ports to transfer such data, and government infrastructure to receive and process, analyze and store/archive such data for extended periods in a highly secure manner in harsh environments. The infrastructure assessment extends beyond hardware to personnel; what is the future skill sets and deployment of staff needed to install, train and support EM/ER in field locations given the current staffing complement? A current assessment of the infrastructure gives us a reference point. Are there sufficient EM/ER vendors available who can provide technological solutions and field support? Are there an adequate number available to your region to ensure competition and downward pressure on costs? This may be an especially critical issue in EM systems where there have been a limited number of vendors supporting this work.
Funding: The roadmap process assumes that there will be no large influx of additional government funds on a continuing basis, and that a redirection of funds from existing data collection approaches to support future EM/ER approaches is one option for consideration, as is the development of industry-funded approaches. Therefore, an assessment of the current government funding being expended on fishery dependent data is an essential step, accounting for all federal and states sources.
In preparation for future consideration of options of how to implement EM/ER, it would also be prudent to conduct an assessment of the current fleet share of the cost of current implementation and/or operation of record keeping and reporting and how that might change for an EM/ER solution. This baseline cost information is an essential element of the evaluation of future choices. Therefore, conducting an economic accounting of revenue and cost streams by vessel class or sector (harvesting, processing, etc.) and what share of the business costs are spent on reporting and record keeping under the current system would fulfill an assessment of the current monitoring system impacts (the “before” model).
Best Practice: As part of the Assessment Phase, plan on engaging the Regional Councils, their Industry Advisory Panel, and Science and Statistical Committee in early discussions about the potential adoption of electronic technologies and what differences they could make to a specific fishery. Local contacts within any particular Region may be very helpful. The NMFS Regional Offices and Science Centers can provide regional contacts. Our numerous partners such as states’ marine fisheries agencies, the Interstate Marine Fisheries Commission Fisheries Information System Networks (ACCSP, GulFIN, PACFIN, AKFIN, WestPACFIN), the NOAA Sea Grant Marine Fisheries Advisory network, cooperating Universities such as Oregon State University, and other partners such as the Gulf of Maine Research Institute, are also excellent contacts for regional information.

EM/ER Discussion Draft Page 7
2.2 Roadmap Phase II – Identification of Objectives for a Monitoring Program
Councils in partnership with their fishermen and NMFS are responsible to clearly define specific objectives for a monitoring program that align with the broader goals of their fishery management plan. The process of identifying objectives should include collaboration with scientists and enforcement staff to ensure the monitoring program meets scientific and compliance data needs. The range of data needs and enforcement requirements will vary based on the goals of the fishery management plan, protected species needs, and characteristics of the fishery (e.g., fleet size, season duration, gear types, international agreements). This includes identification of the information needed to support stock assessments and other science and management requirements. This process should take place coincident with the fishery management plan initial planning or revision process.
Councils may consider using an existing Council committee or panel (e.g., Scientific and Statistical Committee, Plan Development Team, Advisory Panel, Observer committee, ad hoc Data Collection committee, etc.), a new steering committee, or a neutral entity to solicit input from stakeholders to objectively evaluate monitoring program needs. Caution should be exercised since unconstrained by reality, the list of objectives can become extremely unwieldy, burdensome, costly and perhaps infeasible for any subsequent data collection design to satisfy. Therefore, for purposes of this guidance, stay away from developing exhaustive wish lists of every conceivable data need, of which there are already many in existence. Instead, focus on the essential data that are necessary to manage the current and near-term fishery needs with the intent to evaluate where there may be net gains to the adoption of EM/ER alternatives to the status quo.
Furthermore, during the discussion of the alignment of fishery management goals and the specific objectives for a monitoring program, it may be worthwhile to consider the pros and cons of changes in the industry’s governance responsibilities for data collection. There is a continuum from government-specified and funded reporting and recordkeeping forms, methods and tools, to co-management, to greater devolvement of responsibility and more self-governance. Each level has a correspondingly greater effect on recordkeeping and reporting design and execution. For example, under a greater self-governance model the government might articulate its minimum
PHASE I Checklist: Current Assessment
Describe current monitoring system Inventory current fleet, government & service
provider infrastructure Evaluate strengths/weaknesses of existing
monitoring tools (e.g., observers, dockside monitors, ER, EM, etc.) relative to specific fishery
Summarize existing regulatory framework Identify potential funding sources
EM/ER Discussion Draft Page 8
monitoring requirements and then the industry comes up with the data collection design options, tools, validation and funding to implement the management requirements. These important conversations need to begin at the assessment phase. Feedback from these consultations with industry could become valuable input back to the normal Council FMP process for consideration.
In addition to ensuring there is alignment between the monitoring approach and the fishery management goals, it is at this phase in the roadmap that specific goals for the data collection program itself are specified. Some examples: If the goal is to be self-funded through recovery of some or all of the costs of data collection from the industry, then that goal should be evaluated and agreed to at this stage in the cycle; If the monitoring program should be scaled to account for different sizes of operators (e.g., use of EM on larger vessels and use of ER on smaller vessels), then that should be identified at this stage of planning; If data standards for multiple third-party developers to generate ER software solutions are desired, then that goal should be specified at this stage in the cycle. In other words, this phase begins by establishing the broad outcomes for an EM/ER data collection approach and finishes with a set of requirements that we want to design for in the Phase III EM/ER design step.
One caveat: At this stage of the roadmap cycle, some final decisions on goals cannot be made until detailed elements of the design are worked out to see if the desired goals are feasible from a financial, legal and practical standpoint. The linear sequence described in Table 1 is actually far more complex as there are ongoing feedback loops between steps in the process. Some degree of tradeoff, compromise or negotiation may be necessary. For example, along a continuum to collect the minimum essential data to the nice-to-have data elements, the element of cost may skew the choice toward one end of the range or another for this goal. Similarly, trade-offs in coverage, risk-tolerance, precision, uncertainty and cost are all intermingled such that an iterative solution will usually be necessary in the roadmap cycle before a final solution is reached. Therefore, it is recommended that for each goal identified a relative priority be assigned to its importance in anticipation of answering subsequent questions of ranking and making trade-off decisions. These priorities can be derived in a variety of ways, from simple nominal group techniques using multi-voting to reach consensus on priorities, to the use of prioritization matrices to make comparative choices via systematically selecting, weighting and applying criteria.
Best Practice: As part of the identification of goals phase, plan on engaging the Science and Statistical Committees of the Councils on the biological, social and economic data elements essential to the regulatory framework chosen for the subject fishery. Engage Council staff, Science Center staff and Regional Office staff together early in the discussion to ensure alignment of the regulatory program goals and reporting and recordkeeping goals. EM/ER expertise within the Councils and government agencies may be limited in some regions; therefore seek out multiple external sources of knowledgeable professional expertise in EM/ER with extensive practical experience for advice, even outside the fisheries world. Anticipate making trade-offs in coverage, risk-tolerance, precision, uncertainty and cost goals as the reporting and recordkeeping goals interact (perhaps even conflict) with the regulatory framework goals chosen for the fishery in the design phase. Whatever the goal setting process, it should be open, transparent, inclusive and iterative since the outcome of defining these goals are critical to evaluate which EM/ER tools are most appropriate for the fishery (Phase III)

EM/ER Discussion Draft Page 9
2.3 Roadmap Phase III – Program Design
The design of a monitoring program should be informed by the assessment of the fishery (Phase I), the goals identified by NMFS, Councils, and stakeholders (Phase II), and the technical design parameters defined in Section 4 of this document. For each fishery, NMFS and/or Councils will be faced with a myriad of potential trade-offs (e.g., flexibility, timeliness of data processing, ease of use, industry needs, accuracy and reliability, costs, and infrastructure requirements) associated with each tool and must select the combination that best balances management, science, and enforcement requirements with the needs of stakeholders. In most if not all instances, EM/ER tools will be incorporated into existing and often very complex management frameworks. As part of the design process, NMFS and Councils should take care to identify regulatory barriers that could impede (intentionally or unintentionally) the use of certain technologies.
A variety of decision-making methods exist to evaluate which monitoring strategies work the best to attain the primary goals and objectives of the fishery. For example, a utility index is one tool that can be used to identify which monitoring strategies could work the best. This was described in detail in the Alignment of Objectives White Paper. The design of each monitoring program will be constrained by the capacity and cost of existing technologies, the characteristics of the fishery, and must adhere to the statutory requirements on confidentiality. NMFS and Councils will also need to consider the diversity of stakeholders in the fishery during program design.
If the fishing fleet of a particular fishery is heterogeneous, varying by size, gear, target species, by geography or other attribute, it may be appropriate to create a monitoring program that is flexible, offering different options for monitoring the different segments of the industry (e.g.,
PHASE II Checklist: Identification of goals
Identify data needs based on FMP objectives, scientific needs, protected species requirements, and characteristics of fleet
Engage stakeholders including scientists, enforcement staff, managers, and industry to discuss and adjust, if needed, identified data needs
Based on input, define monitoring goals as explicitly as possible:
o Precision ranges on catch and discards o Spatial, temporal, and gear characteristics needed for
stock assessments o Non-target and protected species o Timeliness and frequency

EM/ER Discussion Draft Page 10
PHASE III Checklist: Program Design
Using identified goals, conduct preliminary comparative analysis of different monitoring tools, including cost
Once monitoring options(s) are identified, evaluate:
Durability Enforceability Data quality Operability/maintenance requirements Timeliness and data integration Fish/catch handling consequences Confidentiality Archiving needs Costs (start-up & maintenance)
Identify any needed regulatory changes to support new monitoring program
Evaluate funding mechanisms identified in Phase I
Select final preferred monitoring tool(s)
Establish a timeline for review of monitoring program
small vs. large vessels). Consistent with the National Standards, Councils must analyze the trade-offs of monitoring options including an analysis of the costs and socio-economic impacts on the industry. This impact analysis will be critical to analyzing possible funding sources for the monitoring programs such as evaluating different cost or fee structures that may vary by vessel size or some other characteristic. Lastly, managers should develop a timeline that specifies a review and refinement process for adapting and improving the initial program (Phase VI of the roadmap).
Best Practice: The most effective use of resources may result from a design that combines new EM/ER approaches with existing approaches such as VMS, dockside monitors, observers and logbooks maintained by dealers or processors that can be integrated into a single fishery information system. This can take advantage of common coding conventions and protocols for quality control and quality assurance, utilizing cross-checks of data from multiple sources for validation purposes as necessary.
Moreover, the most cost-effective design may account for a transition period from current to future approaches in a phased time-line to account for different scales of financial readiness by vessel size or port and/or to utilize an adaptive strategy to implementation that allows the infrastructure to scale up gradually over time to minimize catastrophic failure points. From an agency point of view, designs that take advantage of economies of scale are more advantageous from a cost perspective. Hence, liberal exchange of information between fisheries and re-use of
EM/ER Discussion Draft Page 11
strategies, software solutions and technical approaches across multiple applications will help keep costs down and help stretch limited federal and industry funds.
In the design phase, frequent feedback and rapid prototyping from stakeholders can help efficiently advance EM and ER solutions that might otherwise lag; they should be active participants in the design team. For deployment of EM, individualized Vessel Monitoring Plans should be considered for every vessel in an EM fishery. These Plans will help to optimize the placement and use of video components as well as the conduct of back-deck operations in a video environment. The Plan’s content should also include contingency plans to cover circumstances when technology fails as well as logistical and video transfer responsibilities of the vessel operator to cover his role in maintaining the integrity of the data/chain of custody.
2.4 Roadmap Phase IV – Pre-Implementation
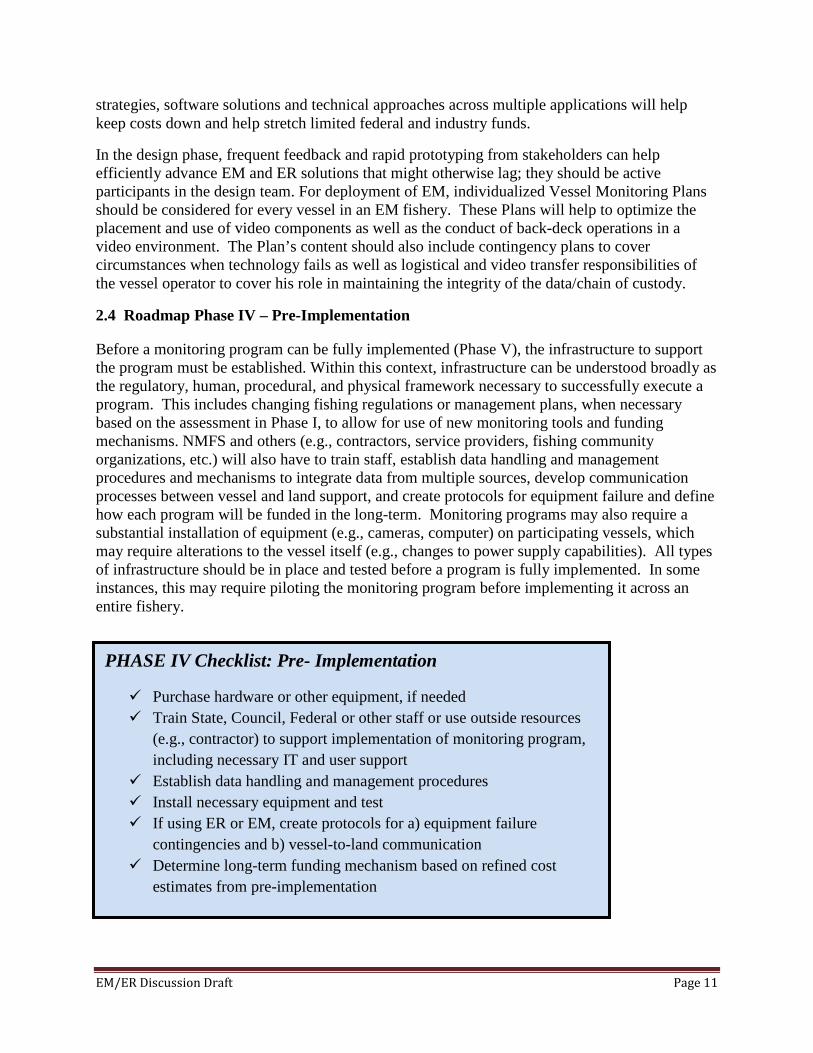
Before a monitoring program can be fully implemented (Phase V), the infrastructure to support the program must be established. Within this context, infrastructure can be understood broadly as the regulatory, human, procedural, and physical framework necessary to successfully execute a program. This includes changing fishing regulations or management plans, when necessary based on the assessment in Phase I, to allow for use of new monitoring tools and funding mechanisms. NMFS and others (e.g., contractors, service providers, fishing community organizations, etc.) will also have to train staff, establish data handling and management procedures and mechanisms to integrate data from multiple sources, develop communication processes between vessel and land support, and create protocols for equipment failure and define how each program will be funded in the long-term. Monitoring programs may also require a substantial installation of equipment (e.g., cameras, computer) on participating vessels, which may require alterations to the vessel itself (e.g., changes to power supply capabilities). All types of infrastructure should be in place and tested before a program is fully implemented. In some instances, this may require piloting the monitoring program before implementing it across an entire fishery.
PHASE IV Checklist: Pre- Implementation
Purchase hardware or other equipment, if needed Train State, Council, Federal or other staff or use outside resources
(e.g., contractor) to support implementation of monitoring program, including necessary IT and user support
Establish data handling and management procedures Install necessary equipment and test If using ER or EM, create protocols for a) equipment failure
contingencies and b) vessel-to-land communication Determine long-term funding mechanism based on refined cost
estimates from pre-implementation

EM/ER Discussion Draft Page 12
Best Practice: At Phase IV in the Roadmap, a sustainable funding plan, including any required cost recovery element, should be completed. Proceeding on to full implementation without this funding plan in place may result in an unfunded mandate on the government or stakeholders and jeopardize the successful implementation of the EM/ER solution.
Funding plans may include loan programs for the purchase or lease of video equipment or computer technology, or voucher programs to defray all or part of the purchase price of technology components. Capital to support such programs may be secured from appropriations, the asset value of the fisheries resources themselves, or third-parties as part of fisheries improvement projects. More detailed discussions of such funding options were provided in the white paper on funding sources.
2.5 Roadmap Phase V – Implementation
Once NMFS and Councils have completed an assessment of a fishery (Phase I), identified goals (Phase II), designed a program to meet these goals (Phase III) which has been approved by NMFS, and established the appropriate infrastructure and funding (Phase IV), the monitoring program can be implemented. During the implementation phase, NMFS and Councils should maintain constant and consistent communication with stakeholders to address and resolve unforeseen challenges or issues. Once the monitoring program is in use, NMFS and Councils need to collect feedback on the system for use in future evaluations to continually improve the program and ensure it is meeting its objectives.
Best Practice: All implementation strategies must have pre-determined metrics, measures of success or critical success factors. Each of these terms are designed to provide feedback for Phase VI reviews. In the best implementation plans, collection of these data is continuous from the outset and a routine part of the program rather than deferred until a future program review interval. It is the continuous feedback and communication with stakeholders that allows real-time
PHASE V Checklist: Implementation
Implement any required regulatory changes Ensure funding mechanisms are working Expand infrastructure purchases and installation to entire
fleet/fishery Ensure appropriate amount of human resources are trained and
ready to support program implementation, including IT support If using ER or EM, update or refine protocols from pre-
implementation for a) equipment failure and b) vessel-to-land communication
Execute hotline, user-support or other troubleshooting process Establish process for collecting feedback on monitoring tool(s) on
regular basis to inform future improvements

EM/ER Discussion Draft Page 13
feedback on how well the technology and the human elements are working together to provide quality data and avoid compliance missteps. This requires one-on-one feedback on fishing operations and deck procedures that may be affecting video quality or logging and data entry procedures in electronic logbook records. Both fishermen and government staff may have suggestions for improvements in the processes and regulations governing the use of EM/ER and the implementation phase of a new system needs to acknowledge the necessity of such changes during a transition period.
More importantly, because improvements in EM/ER technology occur more rapidly than fishery managers and regulators are used to, the regulatory framework implementing EM/ER should be structured around requirements rather than specific devices to account for the dynamic nature of hardware and software improvements, substitutions, replacements and revisions.. EM/ER programs should strive to support circumstances where third-parties are willing and able to provide applications that satisfy both business and government regulatory requirements.
2.6 Roadmap Phase VI – Review and Adapt
NMFS and Councils should periodically review and modify the monitoring program to optimize its performance effectiveness, following the timeline set in Phase III. Each review should assess the monitoring tools, funding mechanism(s), and alignment with goals and objectives. If new tools or funding mechanisms are identified through internal or external research and development, or if the program no longer aligns with its goals, NMFS and Councils should work with stakeholders to make appropriate adjustments.
Best Practice: These reviews should be open, public, transparent and well documented with respect to where industry funds have been expended for the capitalization and/or operation of the EM/ER program. To the extent practicable, where industry funds are contributing to the program operation a commensurate degree of devolvement of governance of the program management, control and review should be considered.
2.7 Roadmap Conclusion
Most monitoring programs will tend to evolve over time, adapting to changes in fisheries and advancements in technology. The most successful programs will be those that are responsive to new opportunities and ideas such as considering use of technology that has proven effective in
PHASE VI Checklist: Review and Adapt
Using feedback collected and engagement with stakeholders, evaluate performance of monitoring program versus identified goals
Every 5 years, or as otherwise determined in Phase I, re-evaluate goals of the monitoring program and funding mechanism (i.e., return to Phase I and refresh cycle)

EM/ER Discussion Draft Page 14
other industries. Collectively, the roadmap outlined above represents a cyclical planning process that will enable managers to make modifications to programs to account for the dynamic nature of fisheries and technology. As described above, the current situation is assessed (Phase I); goals are established (Phase II); a program is designed (Phase III); the program is developed and implemented (Phases IV & V); modifications and improvements are made (Phase VI); and the process is repeated (Phases II – VI), thereby refreshing the tools available to meet the latest needs of the stakeholders and management authority.

EM/ER Discussion Draft Page 15
Section 3
3.0 Evaluating Alternative Monitoring Strategies
As described in Section 2, the key sequence in developing an effective monitoring program is to identify the goals and objectives of the fishery management plan (FMP) and other mandates (e.g., Endangered Species Act, Marine Mammal Protection Act, etc.), and then determine how different monitoring tools can best contribute to measuring the achievement of those goals and objectives (Gregory et al. 2001, Miller and Hobbs 2007, Beechie et al. 2008). It is critical that clear objectives of the monitoring program be established at the outset.
In general, the uses for monitoring programs can be categorized as follows: management (e.g., monitoring catch and landings); science (e.g., socio-economic and stock assessment needs); and enforcement (e.g., compliance, enforcing regulations). In each case the solution needs to be cost-effective. These categories are inter-connected and therefore integrated monitoring approaches are critical.
3.1 Evaluation methods
Many different monitoring strategies or programs exist that produce data for management, science and enforcement use. A variety of structured decision-making methods also exist to evaluate which monitoring strategies work the best to attain the primary goals and objectives for the fishery. The majority of these structured decision-making methods fall into the following categories:
• Multi-attribute analysis (Keeney and Raiffa 1976, Moffett and Sarkar 2006, Yang et al. 2011);
• Cost effectiveness and cost-utility analysis (Hughey et al. 2003, Beechie et al. 2008); and • Cost-benefit analysis (Arrow et al. 1996, Kemp and O’Hanley 2010).
Although these structured decision-making methods are more time consuming to conduct than traditional open discussion processes, they often provide better and more transparent results (Kahneman et al. 1982, Janis 1983, VonWinterfeldt and Edwards 1986, Ahlfinger and Esser 2001). Therefore, panels or committees formed to identify which monitoring strategies work the best for attaining the primary goals and objectives of the fishery should use a structured decision-making process. Once the most likely strategies have been identified, more detailed impact analyses done under National Environmental Policy Act requirements can be completed.
3.2 Example of a multi-attribute analysis
A utility index (i.e., a simple multi-attribute analysis) shown in Table 1 illustrates one way of identifying which monitoring strategy could work the best to meet stated goals. In this example, the index evaluates the utility of video monitoring to achieve common monitoring goals (e.g., management, science, enforcement.) The pros and cons of video monitoring have been previously referenced in the white papers and elsewhere (e.g., McElderry et al. 2005, Cahalan et al. 2010, Stanley et al. 2011), and were used to construct the utility index. To evaluate the utility

EM/ER Discussion Draft Page 16
of other technologies or strategies (e.g., dock-side monitoring, electronic reporting, etc.) additional utility indexes would need to be constructed and scored for comparison.
The utility index lists the benefits of video monitoring in a column format ranging from “very useful” to “less useful,” relative to common monitoring program objectives which are listed along the rows.
Table 1. An example of a utility index for video monitoring for a sample of potential fishery-dependent objectives.
Objectives 1 – Very Useful 2 – Somewhat
Useful 3 – Less Useful Species identification (Commercial, Recreational, or Protected Species)
Species of interest can be easily and reliably identified using video monitoring.
Species of interest can be reliably identified to the genus or family level using video monitoring.
Species of interest cannot be reliably identified (even at the family level) using video monitoring.
Catch needs to be quantified in terms of weight.
Weights of all species of interest can be easily and reliably estimated using video monitoring.
Weights from a majority of the species of interest can be reliably estimated using video monitoring.
Weights of species of interest cannot be reliably estimated using video monitoring.
Platform suitability (e.g., small vessels).
The vessel is considered fully adequate to deploy and meet video requirements.
The vessel is somewhat adequate to deploy video, but may be limited by power or other requirements.
The vessel is difficult to monitor using video due to power requirements or camera installation angle setup.
Biological tissue samples
N/A – current technology is not applicable.
A small percentage of fishing trips need biological tissue samples taken at-sea or can be taken by other means (e.g., dealer sampling, existing field surveys, etc.)
A large percentage of fishing trips needs biological tissue samples taken at-sea or rare events (e.g., endangered species interactions) require tissue samples.
Biological measurements
Biological measurements of weight or length can easily be calculated using video monitoring.
A small percentage of fishing trips need biological measurements taken at-sea or can be taken by other means (e.g.,
A large percentage of fishing trips need biological measurements taken at-sea and video monitoring is not a

EM/ER Discussion Draft Page 17
dealer sampling, existing field surveys, etc.)
viable option.
Socio-economic data
All relevant socio-economic data can be collected from video monitoring.
Some of the relevant socio-economic data can be collected from video monitoring.
None of the relevant socio-economic data can be collected by video monitoring.
Effort Effort can be reliably monitored by video.
Fisheries using multiple gears (e.g., gill nets, pots, hook & line) can only be partially monitored using video.
Observer coverage is required to estimate fishing effort, and the gear and/or fishing activity cannot be reliably monitored by video.
Vessel operation compliance
The fishery operations (e.g., sorting) can be fully video monitored.
The fishery operations (e.g., sorting) can be somewhat video monitored.
The fishery operations (e.g., sorting) cannot be video monitored.
Gear compliance
The fishery has gear requirements that can be fully monitored by video.
The fishery has gear requirements that can be somewhat monitored by video.
The fishery has gear requirements that cannot be video monitored.
Regulatory/ Enforcement Authority
OLE has the ability to enforce regulations with video monitoring technologies.
OLE has limited ability to enforce regulations with video monitoring technologies
OLE has no ability to enforce regulations with video monitoring technologies
In some cases, where video monitoring lacks the capability to collect certain types of information it would not score “very useful” whereas in other rows video monitoring would score very highly, depending on the circumstances of the fishery.
The panel or committee established to develop the monitoring program would review the list of monitoring objectives and score the objectives that were identified as primary objectives earlier in the process. In this example, once the relevant objectives have been reviewed and scored, the average score can be used to give a general idea of how useful video monitoring may be for meeting their monitoring objectives. An average score of 1 suggests that video monitoring would be very useful, while an average score of 3 suggests that video monitoring is less useful. Comparing scores between different monitoring strategies utility indexes can be an important starting point for helping making a decision.
In some cases, however, stakeholders may find that the majority of the objectives are met by video monitoring (i.e., scored 1) but one or more important primary objectives are not met (i.e., scored 3). For the objectives in which video monitoring is less useful, the stakeholders might

EM/ER Discussion Draft Page 18
find a solution through a hybrid approach that includes both video monitoring and other traditional approaches that is cost-effective and provides quality data.
3.3 Defining EM/ER Requirements
The goal of fisheries monitoring is to provide cost-effective solutions for collecting data which meets the needs of a range of scientific, management, and compliance objectives. The design of any fishery monitoring program needs to address specific minimum performance requirements with respect to the following:
• Timeliness of data delivery (e.g., in terms of GPS/VMS polling interval; transfer interval of video records or e-logbook records)
• Quality of data (e.g., in terms of accuracy, statistical variation and precision of estimates; Specific precision ranges for estimates of key parameters such as overall catch, allowable discards (if any))
• Resolution of data (e.g., in terms of time/polling interval; geospatial scale; pixels/frame rates for images; Detail spatial, temporal and gear characteristics associated with catch to be collected for use in stock assessments and for other ecosystem science purposes)
• Capability for integrating and reconciling data from different sources (e.g., interoperability standards; formats/coding conventions)
• Accessibility of data and statistical results to the various customers (e.g., frequency and timeliness of data submission including availability/permissions to managers, stakeholders, etc.)
• Industry-shared or borne costs of operation and maintenance (e.g., hardware and software purchase and lease/license agreements; communication charges; training and support contracts; (if any)); and
• Flexibility to adapt to changing requirements (e.g., interactions with non-target and protected species)
Requirements will vary among fisheries and will depend on what types of data are collected and how those data are used. Requirements are also likely to evolve over time. The specification and parameterization of these requirements is generally best left to regional decision makers and are not set in this document. Moreover, those contributing to these regional decisions will likely be a mix of technical and policy experts from the government and private sector, and stakeholders and managers from the Council and their constituents. However, best practices and technical guidance is offered below and in Section 4 to share information, minimize duplication of effort, and promote economies of scale – all to help inform and achieve the most effective and efficient EM/ER solutions by regional decision makers. It should be noted that there are many general government-wide statutory and regulatory standards not set by NOAA that must be complied with, as well as industry-wide technical performance specifications set by expert groups that do affect EM/ER implementation. If any additional standards are required to facilitate cross-regional application of EM/ER, then NMFS will consult with the Councils and industry on their content and implementation.

EM/ER Discussion Draft Page 19
During the development of any EM/ER program, it is important to keep in mind that certain management tools require more comprehensive infrastructure systems than others. This requires a careful alignment of the management measures and the EM/ER tools. This includes a willingness to modify regulations to meet the tool if necessary, not just a willingness to only choose a tool if it can meet a current regulation. The choice of tool can have significant impacts on costs and effectiveness of the data collection program to produce data with the desired attributes to manage the fishery. Each of the requirements specified in the roadmap process should be subject to carefully evaluating the trade-offs of the needs of the ultimate user against the cost. For example, it is important to specify the time frame, the means and the custodian(s) associated with each transfer of EM/ER data from first receiver through receipt by NOAA. Are we willing to incur longer delivery periods and/or more handlers of electronic records if it results in cheaper costs? The final requirement should specify the timing and means in sufficient detail to account for quality control and analysis while at the same time maintaining the chain of custody necessary to ensure the integrity of data as possible evidence for enforcement proceedings. Best Practice: Whether considering in-house sources or service providers, each should be requested to provide a range of options in service level for such parameters as timeliness to evaluate the variation in associated costs. This will enable an analysis of trade-offs in outcomes that may be acceptable to the management authorities and stakeholders in the design phases of the EM/ER roadmap. Defining requirements in such detail is important regardless of whether the cost is paid entirely by appropriated funds or shared with the industry.
Section 4
4.0 Design Decision Points and Technical Guidance
While the final design of any monitoring program must be tailored to the relevant fishery and region-specific characteristics, every program evaluating the adoption of EM/ER will face a similar array of policy and decision points along the way. The following generic EM/ER fishery dependent monitoring program guidance is derived from the many successful existing or pilot EM/ER systems in the U.S. and internationally. The references section at the end of this document includes links to many of the reports describing these systems, with annotations to help sort through the listings. Following this guidance makes use of best practices, sets clearer expectations between stakeholders and Councils, and promotes efficiencies and cost-effective solutions via improved coordination among fisheries and regions.
4.1 System Structure and Adaptive Management
Best Practice: Experience has shown that wherever possible managers should consider the adoption of an adaptive and dynamic approach to reporting and recordkeeping system structure that describes the scientific, accountability and reporting requirements without locking-in prescriptive approaches that are inflexible and difficult to change in regulation. Changing environmental or fishery circumstances and direct experience with the consequences of initial data collection program requirements suggest allowing some flexibility in the suite of tools with which the fishery chooses to meet those standards or requirements. This is particularly important

EM/ER Discussion Draft Page 20
when it comes to revising regulatory text. Prescribing a specific piece of electronic technology hardware or software within a regulation becomes problematic when future changes are required because of obsolescence, market entry of competitive vendors or advent of innovative product improvements, such as unmanned aerial systems for surveillance. Moreover, rapid evolution and advancement of technology is commonplace, improving component’s cost, accuracy, and reliability. As new goals and tools are identified in the future they can easily be incorporated into the existing program through an adaptive management approach.
The first step of this process is for NMFS and Councils to conduct a thorough review of existing programs and an evaluation into the respective advantages and disadvantages of various available tools. It should be noted that no single monitoring tool (such as at-sea or dockside observers, EM, or ER) will provide all required data. Rather each should be viewed as one necessary component in a comprehensive system to meet a suite of fishery needs. Upon settling on one or more tools for the initial data collection design, NMFS and Councils should specify a review interval and process as appropriate for their specific fishery to evaluate the efficacy of the tools and allow for carefully moderated changes in approach where necessary.
Another decision in establishing the system structure is the scale and scope of electronic technology applicability. It is likely that not all fishery-dependent data needs will be covered by EM/ER tools and they will not be the sole approach to data collection. How readily electronic technologies can co-exist with other tools will need to be evaluated for each specific fishery. In addition, the application of an EM/ER solution may have differential impacts across the fishery participants, varying perhaps by species sought, gear type, and vessel size. A vessel’s technical capabilities (e.g., electrical power and navigational capacity), an operator’s financial capabilities (i.e., for lease, purchase, operation and maintenance of hardware and software) and fishing practices (e.g., on-deck procedures) will also influence system structural design. Although only certain participants in a fishery may be proposed for adoption of EM technologies (e.g., only certain gear types, ports, vessel sizes, etc,), funding might only be available or sufficient if EM/ER was applied across all participants in a fishery. Thus the technical, operational and financial ability of different participants to deploy electronic technology solutions should be accounted for in the initial system design, and be subject to review as experience and performance information becomes available.
4.2 Controlling and Computing Costs of EM/ER
It is a joint NMFS and Council responsibility to minimize the economic burden of monitoring on fishermen as well as on taxpayer-funded state, local and federal agencies. All efforts should be made to identify and utilize the most cost-effective monitoring tools able to meet management, science, and enforcement objectives, including the use (where appropriate) of approved third-party providers operating under the oversight and in coordination with NOAA. Unnecessary duplication in data collection should be eliminated, whether they are between different federally managed fisheries or between federal and state and/or international management regimes.
Controlling costs requires a thorough evaluation of the cost and effectiveness of trade-offs in program design. NMFS and Councils should evaluate the relative scale of costs to benefits of design alternative (e.g., 100% video monitoring with full review of all video vs. smaller percent coverage or audit approach to review of video) to identify the most cost effective solutions. For

EM/ER Discussion Draft Page 21
example, a fundamental question must be answered when developing an EM/ER solution: How fast and accurate does it need to be? The answer has a direct impact on costs.
If a video monitoring system needs to be fast and accurate (i.e., quick access to the images, quick review of data, quick turnaround of analysis, be verifiable against observer or other data, avoid all blind spots and have the best optics available for potential species identification) it will be relatively more expensive to implement and maintain. If the budget constraint requires the system to be less costly, then a trade-off may be necessary in the turnaround time for review and analysis (it will be slower), there may be blind spots due to fewer cameras, and/or optics may not provide the resolution needed for species identification for catch accounting and evidentiary requirements. However, the system may still be adequate for identifying discard events. Here is where alignment of management objectives and tools takes place.
Ultimately, program design attributes should not be recommended or approved by NMFS or Councils if they create an unfunded requirement. For example, selecting a sampling rate whose cost exceeds available appropriated funding would violate anti-deficiency laws. Thus, costs of a program design should be chosen carefully and stay within projected limits, and be monitored by actual performance tracking over time.
Standards for Evaluating Costs - Currently there is no standard approach for comparing and evaluating different data collection methods and technologies with respect to the costs of implementation, operation, and maintenance. Collaboration with all stakeholders is an important step in developing such standards, so that all partners are involved in decisions on which potential solutions are the most cost-effective.
Ultimately, implementation decisions should be based on balancing trade-offs between benefits and costs. The implementation of a newer technological approach that is more costly than the current approach may be worthwhile if it enables substantial improvements in the timeliness or accuracy of data collection. Therefore, research should focus both on the development of less expensive technologies that can deliver the same level of performance that we currently have, as well as reasonably affordable technologies that can deliver higher levels of performance.
However, each fishery around the country has a different scale and different objectives for data collection, requiring different combinations of equipment and therefore, incurring varying costs. System specifications for video hardware such as analog or digital, the frame rate, amount and type of data compression, individual image size, number of required cameras, and the extent to which EM data must be retained (volume) or submitted for analysis (frequency) can vary widely and have an effect on cost depending on the application. A frame rate and image size that is adequate for determining whether a vessel has deployed seabird avoidance gear would be inadequate for determining whether or not crew discarded a single fish. A video application ensuring no discard occurs is simpler than would be required under a program where the discard by species will be required. To make such a system as the latter work, vessels would be required to ensure that all discards took place in specified locations so that it was clear exactly what is being discarded. Thus, application of an EM program to verify no discarding occurred could conceivably take place without requiring changes in crew behavior or vessel layout, whereas an application in which discards must be enumerated would probably require changes in number, placement and operation of cameras. The point is, as each application for EM is developed,

EM/ER Discussion Draft Page 22
there will be many individual decisions to make that will affect the viability and cost of the resultant program.
With respect to providing guidance on EM/ER costs, accurate and complete cost data on existing data collection programs are difficult to come by, even though these are the most frequently cited determinants of a choice between EM/ER versus other data collection methodologies. In reality, there is no one universally “cheapest” data collection methodology as costs do vary widely for EM, ER, observers, logbooks, dealer reports and other methods depending on the specifics of the fishery and the program design. Therefore, knowing what the EM/ER or an observer program cost in another fishery may seem useful information but it will not be the cost for the application of that method in your fishery because your parameters will be unique.
Moreover, caution should be exercised in evaluating available pilot program costs because in pilot studies the full capital costs are usually shown even though the hardware are not used to full capacity, nor amortized over the useful life of the asset (overestimating the costs of EM/ER). Conversely pilot program costs don’t usually account for long term maintenance or replacement costs. These costs would need to be identified separately to avoid underestimating the long term costs of EM/ER. Similarly, when evaluating case examples of existing non-EM/ER programs, care should also be exercised as complete data are also not usually provided. Fixed costs and overheads costs are often not reported, depreciation of durable goods is not considered, nor are labor attrition and replacement costs accounted for fully. Thus, while somewhat informative, the reported costs of EM/ER should not be considered authoritative of what deployment costs would be in your fishery.
Best Practice: Costs should always be viewed in the context of the relative benefits they accrue (the cost-value proposition described earlier) to a specific fishery circumstance; they should be assessed and interpreted in the context of standardized reporting time periods, and should not be the sole determinant of a data collection methodology choice.
Therefore, in evaluating data collection options it is important that cost templates be developed and completed for each particular fishery and program design under consideration to ensure fair and relevant cost comparisons of future policy options. For example, a template would ensure initial capital, installation and other one-time costs for hardware and software development associated with EM, ER and other methods are amortized over the useful life of the inputs. In all comparisons of EM/ER to other data collection methods, overhead costs (e.g., support personnel, travel, training, facilities, IT infrastructure) must be uniformly accounted for and comparable templates used to compare the costs of different methods.
The categorized program costs for an EM/ER monitoring approach in the templates shown in Tables 2 and 3 below can be attributed as one-time or recurring costs. These costs can be subsequently allocated among different payees to model different scenarios (government funded, industry funded, etc.). During the Discussion Draft comment period, experts familiar with costs associated with observers, dockside monitoring and other non-EM/ER data collection methods are asked to submit cost templates for these types of data collection approaches. Taken together, these frameworks can then be populated and used by Councils and stakeholders to evaluate the range and distribution of costs associated with different EM/ER design options under consideration in the future for their specific fishery attributes. Ultimately, the final set of regulations may be some combination of multiple methodological approaches.

EM/ER Discussion Draft Page 23
Table 2. Cost Template of major categories for calculating electronic monitoring costs, contingent on completion of specification of system design attributes through Phase 3 of the monitoring strategy roadmap. Camera-based Electronic Monitoring
Frequency e.g., One time, recurring?
Cost range (high – to low)
Average cost or Median cost/vsl/year?
Useful life of investment?
Lease vs purchase?
% Govt cost share?
% Industry cost share?
Use Service provider?
Planning (technical system design, vessel monitoring plans, support system design)
Hardware - Camera(s) - Sensors - Media/storage Govt IT infra Field Support -Installation ---labor ---Wiring, connections, etc
-Training (labor, materials, travel)
-Maint/Repair Data Comms & Reporting
- At sea - Shoreside Govt IT infra Data Analysis - software ---development ---license - labor Data Storage/Archiving
- On board - On shore -Govt IT infra Other (specify)

EM/ER Discussion Draft Page 24
Table 3. Cost Template of major categories for calculating electronic reporting costs via e-logbooks, contingent on completion of specification of system design attributes through Phase 3 of the monitoring strategy roadmap.
`
Frequency e.g., One time, recurring?
Cost range (high – to low)
Average cost or Median cost/vsl/year?
Useful life of investment?
Lease vs. purchase?
% Govt cost share?
% Industry cost share?
Use Service provider?
System Development
- Specifications setting
- Technical SW system design QA/QC, metadata, integration
- Support system -Commercial off- the shelf option
Hardware - CPU (PC, Laptop, tablet, etc.)
- GPS, VMS, other sensors, (specify)
- Telecomms Satellite, cellular, (specify)
- Govt IT infra Field Support -Installation ---labor ---Wiring, backup power, connections, etc
-Training (labor, materials, travel)
-Maint/Repair Data Comms & Reporting
- At sea - Shoreside -Govt IT infra

EM/ER Discussion Draft Page 25
4.3 Generating Revenues for EM/ER
Collecting timely and accurate fishery-dependent information always requires funds which are often in short supply. Some of the funds for new methods may come from existing data collection programs that are being replaced by EM and ER systems. In addition to appropriated funds, innovative funding mechanisms such as set-asides of the allowable harvest and public-private funding should be investigated to support data monitoring. The approach of having industry pay some share of monitoring costs should be considered, especially when an exclusive privilege to harvest a quantity of fish is allocated to an individual or group (i.e., Limited Access Privilege Program LAPP) since this policy transfers the value of the public resource to private hands.
However, special consideration should be given to the timing of this cost sharing requirement, especially during the initial years of implementation. To support the economic viability of the fishing industry during a period of transition, the use of loans and/or deferred cost contributions could help ensure their economic sustainability. Councils, government and industry should remember, however, that the lack of adequate monitoring data is also costly, often in terms of over- or under-exploitation of important marine resources, loss of long-term yield or foregone fishing revenue, and increased risk.
NMFS and Councils could possibly make more and better use of existing authorities to generate revenues via cost recovery and/or securing a share of resource value for the public. This discussion can be initiated by encouraging an evaluation of the opportunities possible under the existing statutory authorities at:
• MSA 303a (d) Auctions/other royalty payments for LAPPs • MSA 303(b)(11) Research Set-asides; • MSA 305 (h) Central Registry Fees • MSA 16 USC 1891b Fisheries Conservation and Management Fund • MSA 303(b)(4) Requiring Certain Equipment
Data Analysis - Reports ---management needs
---industry needs - labor Data Storage/Archiving
- On board - On shore -Govt IT infra Other (specify)

EM/ER Discussion Draft Page 26
Details of the use of these existing authorities are described in the previously referenced EM/ER white paper on funding options.
In addition, new authorities and innovative financing approaches could be evaluated. For example, Councils and NMFS may want to seek new authorities under the NOAA Fisheries Finance Loan program as an option to finance low interest long term industry debt for EM/ER costs. Other examples of possible revenue avenues to consider pursuing include:
• Partnerships with third-party technology developers and service providers through Cooperative Research and Development Act Agreements;
• Collaboration with value-chain partners interested in certification/traceability through the adoption and use of EM/ER; and
• Corporate social responsibility funds and philanthropic or foundation endowments interested in fishery improvement projects related to EM/ER.
These are conceptual options for discussion and should be evaluated on their merits and for their applicability in each region for their potential contribution to defray costs of EM/ER start-up and operational costs. They are offered for consideration as alternatives to traditional funding models that are reliant on appropriations of taxpayer funds, which are becoming increasingly scarcer.
4.4 Technical Guidance
The section above lays out key decision points for designing a fishery dependent monitoring program. In instances where EM/ER technologies will be utilized, the requirements described below are non-traditional, providing a minimum performance threshold that gives managers the leeway to utilize the best available technology (or suite of technologies) so long as it performs at a level that meets the science and management needs of the fishery. Rather than set standards-based requirements for each of the myriad of electronic monitoring tools (e.g., notebooks, cameras, VMS), the requirements outlined below are based on the desired effectiveness of the monitoring program and managers’ willingness to tolerate different forms of risk (e.g., damage by weather, human error, optics). Departing from a more traditional standards-based approach affords managers flexibility and incentivizes the industry and technology developers to be innovative in identifying more efficient and effective tools. There are two potential trade-offs in adopting the flexibility afforded by such case-by-case requirements.
First, designers may view this flexibility as a mandate to re-invent completely different standards than currently exist for a particular technology or policy requirement. This is not the intent of this guidance. This guidance acknowledges that there are many government, independent and third-party standards already in existence that govern the tools and practices likely to be encountered by fisheries managers when adopting EM/ER into the fisheries realm. Therefore, there will be few reasons to establish separate fisheries-specific standards, such as for water resistance in cameras, or encryption or electronic signature requirements for computers just for fisheries. The decision by managers, then, is to generally focus on picking from among the appropriate existing standards versus crafting entirely new standards from scratch. Choosing among existing standards, more often than not, is a cost versus value proposition. That is, will the

EM/ER Discussion Draft Page 27
cost of adopting a “higher” standard return more in value in terms of “quality” attributes deemed important by the fishery managers and the stakeholders versus a lower cost standard? A simple value proposition example: Does a device need to be water-resistant or waterproof? Fishery managers don’t need to define these existing standards, they simply need to pick one. Similarly, what is the value proposition for a tamper-proof versus tamper–resistant versus a tamper-evident requirement for a blackbox electronics device? In this case the value assessment explicitly must account for how much risk the government is willing to take if there is potential for compromise of evidentiary data for enforcement. Being able to identify objectives and then specify the requirements to satisfy them is at the heart of considering the performance required of EM/ER as an alternative. The second potential trade-off in adopting the flexibility of a case-by case set of requirements is the potential loss of economies of scale. There are 46 federal Fishery Management Plans currently in the United States, each with scores of directed fisheries and sectors. At one extreme, it is conceivable that a Council could proceed to address EM/ER requirements on a sector by sector basis and come up with a different set of requirements each time. This would not allow for cost savings in volume purchasing of hardware, nor allow for amortizing costs for hardware installation, support and training or software development over larger numbers of users; nor reduce/minimize duplication of systems for government and fishermen holding multiple fisheries permits, etc. At the other extreme is one EM/ER system that attempts to resolve all fishery circumstances and conditions simultaneously but fails to meet any needs exactly. There is a “sweet-spot” or middle ground where economies of scale can save money and time for all involved that would be advantageous to the government, service providers and fishermen who hold permits in more than one fishery, but still retains regional fishery-specific requirements and decision-making autonomy. Specific design criteria, hardware, software specifications, and other requirements developed on a case-by-case basis during regional development of monitoring plans that result in some level of regional or cross-regional standardization may actually promote a higher return on investment of the development costs through increased use/sales in multiple fisheries. Consistent with NMFS’ policy on electronic technology, the agency is encouraging cost-effectiveness as a criterion for a solution, and looking for opportunities for region-wide solutions that enable economies of scale, rather than adoption of single fishery-by-fishery solutions that would be less appealing.
Best Practice: Regional Councils and NMFS are encouraged to look beyond existing regulatory and geographic boundaries for opportunities to achieve economies of scale and develop a more holistic systems approach to fisheries monitoring. This is where EM/ER would be part of an integrated solution, not just for a single fishery or FMP but part of a regional or coast-wide monitoring solution for satisfying both fisheries governance and fisheries business purposes. Durability Threshold – Equipment must function effectively and reliably. The marine environment poses numerous challenges for EM/ER equipment, particularly sensitive electronics, video cameras, computers, hard drives, and sensors. Dirt, salt, spray, slime, ice, wind, rain, and temperature may limit the functionality of equipment or impact the quality of

EM/ER Discussion Draft Page 28
data. To prevent loss of data, equipment must be designed to withstand at-sea conditions and inclement weather. This document does not attempt to impose durability standards for each type of equipment, hardware, or software, but acknowledges every monitoring system must maintain levels of durability. Technology that cannot withstand the ocean environment and that fails to meet the minimum durability threshold is not permissible. Levels of protection are needed from water, dust, ice, chemical or splash intrusion and such standards are specified and maintained by many authorities including the National Electrical Manufacturers Association (NEMA), International Electrotechnical Commission (IEC), and the United States Military Standards (MIL-STD).
• Equipment must be designed to function effectively and reliably in harsh environmental conditions. Specifying durable equipment to withstand these demanding conditions and which meet national or international standards authorities will be another cost-value decision. Service providers and government procurement offices are a source of such technical information.
Enforceability of data – The role of EM/ER for use in ensuring compliance with regulations highlights an additional set of policy and decision points. While the intended use of data will vary from program to program, it is critical that specific protocols, standards, and practices be adopted and strictly followed to ensure the admissibility of data in legal proceeding when the data are intended for use in enforcement of regulations. Early consultation with NOAA’s Office of Law Enforcement (OLE) and NOAA’s General Counsel for Enforcement and Litigation (GCES) in defining specific requirements is advised.
Equipment must be sufficiently tamper-proof and tamper-evident so that the data the tool(s) generate can be used for evidentiary purposes. Past experience suggests that EM data can be advertently and inadvertently modified. Data may be corrupted in many ways, occurring as a result of physical manipulation (e.g., moving a monitoring device) or human manipulation (e.g., modifying data). To maintain the integrity of the data, the architects of each regional implementation plan will need to devise mechanisms to prevent both forms of data manipulation or corruption.
• Equipment must be as tamper-proof as possible; no device is completely tamper-proof. • Data collected for fisheries management must be stored, archived, and accessible for
further review and/or use in the investigation and adjudication of potential violations, and would likely require an investment in secure data storage infrastructure. (However, NOAA has no specific policies yet on the storage, archival, and accessibility of video information and the protection of confidential data.)
• Data must have a clear and secure “chain of custody” from the collection point to the final user to confirm the authenticity and reliability of the data, for prosecution and for other evidentiary needs. Any steps to ensure that transmittal or transfer of data products is compliant with local and national chain of custody requirements should be reasonably related to avoiding fraud and other misreporting. While such steps apply to paper records as well, these requirements may need to be more prescriptive in nature to maintain the fidelity of electronic records. However, NMFS and Councils should still seek means within these constraints to allow for flexibility and adaptive changes in the program where feasible.

EM/ER Discussion Draft Page 29
• Where the capability for electronic signatures exists, e-signatures are beneficial in allowing OLE to identify and track the chain of custody of who submitted the data (for accountability purposes). NOAA has an internal policy directive on use of electronic signatures called “Evaluation and implementation of electronic signatures” that has useful references at http://www.nmfs.noaa.gov/op/pds/documents/32/110/32-110-01.pdf
• Implementation and operational costs of EM/ER approaches on OLE should be considered because they can be high and vary between fisheries and regulatory frameworks.
• Best Practice: Data should be automatically validated and cross-checked using multiple self-reported and independent sources/entries (e.g., sensors, GPS, time/date).
For effective enforcement of Federal and/or state mandates, the following planning factors should be considered when using ER:
1) Data must be collected, processed and maintained in an accountable fashion to withstand prosecutorial challenges.
2) Data must have a clear and secure “chain of custody” from the collection point to the final user to confirm the authenticity and reliability of the data, for prosecution and other evidentiary needs.
3) NOAA/NMFS should ensure the data collection requirements are consistently applied to help level the playing field. a) If data are not submitted as required, the entity requiring the data should work with
OLE who will assist in obtaining the data. Actions may range from phone contacts to attempt to gain compliance with reporting requirements to referral to GCES for consideration of an enforcement action.
b) OLE recommends that all data be maintained by the entity/agency that collected it for a minimum of 5 years (civil statute of limitations) to support potential enforcement actions.
4) The data should be available to OLE when needed for investigative purposes. 5) Agency staff with pertinent information, including observers and/or catch monitors,
should be available for debriefing or interviewing by OLE staff. 6) Where the capability for electronic signatures exists, e-signatures are beneficial in
allowing OLE to identify who submitted the data (for accountability purposes). 7) As the Agency analyzes implementing ER, implementation and operational costs to OLE
should be considered because they can be high and vary between fisheries and regulatory frameworks.
Based on OLE’s involvement with video cameras and sensors monitoring fishing activity, in pilot projects and as implemented via regulations, the following are “lessons learned” nationally. In general, OLE and GCES <acronym 1st use?> should have input into development of programs that have the potential to use video camera and sensor equipment to ensure the regulations are specifically written for enforceability. Each fishery and the objectives of using EM/ER may vary, so it is important, on a case-by-case basis, for OLE and GCES to address the following types of issues to ensure evidentiary (chain of custody, original evidence) and prosecutorial (best evidence) concerns are taken into consideration:

EM/ER Discussion Draft Page 30
• What is the digital file format of the video and how is it stored on the vessel? • Who has access to the video files and data on vessels? • What frame rate, how many frames per second, is adequate for enforcement purposes? • Does the video contain a date/time stamp and counter embedded in the video file that
cannot be altered? • How often is the data (hard drive) retrieved from the vessel and who retrieves the data? • How will enforcement obtain access to data and how does OLE ensure a forensically
sound digital transfer from the recording devices storage to OLE’s storage for evidence? • How long can video be stored on the vessel (what is the maximum storage capacity in
hours)? • What is the minimum resolution needed for enforcement purposes? • Will images be captured in black and white or color? • What are the low light capabilities of the system and are there alternative light sources? • What are the power supply requirements and does the system require uninterrupted power
supply (battery back-up) to ensure system stays on line? • What are the operator’s responsibilities to ensure the system remains up and running and
cameras remain unobstructed due to environmental or other conditions? • How is the information on the video used to address a possible violation? • Will the video data be compared to observer data? Or other data? And how long will that
take?
Data quality – Any fishery dependent data collection method should establish minimum standards for assuring and maintaining the quality of the fisheries data needed for effective monitoring and EM/ER methods are no exception. New EM/ER technologies have the advantage of providing capabilities for checking of data and correction of data entry or transcription errors at the source. Faster data are not necessarily better data. However, faster turn-around of data checks at the time of and closer to the source of the fishing activity can allow for a considerable reduction of possible response errors (recorded or reported) or measurement errors. Appropriate data checking software should be utilized to assure this feature in any new EM/ER technology that is implemented. Standard methods for the checking and validation of self-reported data must be also established, as many of the incentives for misreporting observed with paper-based systems may remain with electronic logbooks, although such abuse may be easier to detect. Also, all new EM/ER technologies should support compliance with the Agency’s standards for metadata. (see http://www.nmfs.noaa.gov/op/pds/documents/04/111/04-111-01.pdf).
Data must be documented and of sufficient quality to achieve management, science or enforcement objectives described in relevant FMPs and/or regulations. Past experience with EM/ER technologies suggests that data quality may be compromised in a variety of fashions including user input error, misreporting, inadequate error checking, inadequate camera coverage, blind spots, lack of adequate lighting for nighttime use of cameras, and inadequate choice of image optics/resolution. Design and camera placement to monitor catch and discards from large trawlers and factory vessels can be particularly challenging because such vessels can discard in several places (e.g., rail, deck, trawl alley, scuppers, sorting areas, factory, etc.).

EM/ER Discussion Draft Page 31
• With ER, the accuracy of catch data should be validated through the use of time/date stamps, GPS validation, winch sensors reports, bottom, trawl and depth sensors. The degree of catch accounting validation will depend on gear, vessel size and back deck operations and may include data on discarded and retained catch by species in number and size.
• Software should include automated error checking at the point of data entry to ensure the accuracy of submitted data. Real-time error checking should be conducted for quality control prior to submission.
• Systems should minimize human review of data to the extent possible, such as through automatic error checking at the source.
• For video monitoring, a sufficient number of cameras should be used to fully capture catch events and, as necessary, discard events while avoiding blind spots. The number of cameras will vary depending on the size and configuration of the vessel.
• Cameras should have sufficiently high resolution or image quality and placement to allow for accurate species identification when necessary.
Operability/Maintenance – Some technologies can be complex and have a steep learning curve for fishermen to use. Maintaining familiarity with the tools, equipment, or systems, like VMS, video camera systems, or flow scales, may require in-depth training, consistent use, and significant agency or industry staff time to maintain equipment and systems. Agency and service providers designing EM/ER monitoring systems must balance the desired list of data requirements with operability and usability functions. User interfaces must be readily understood by non-technical users.
With respect to roles and responsibilities for ensuring operational readiness and routine maintenance of EM/ER equipment, the assignment of these functions need to be clearly listed in written operating agreements between the agency and the fishermen. Both the time period for routine service interval responsibilities necessary at-sea (e.g., cleaning lenses before haul backs, polling position prior to setting nets, checking back up power supplies) and the liability for maintenance, damage or replacement of EM/ER gear should be specified in advance. For example, a reliable power supply is needed to ensure that cameras and other monitoring equipment are functioning when required. A well-designed modern EM/ER hardware system employing “smart” sensors can have much longer independent battery and back-up capability but will likely be dependent on being tied-in to a vessels’ electrical generation system for any fishing event longer than a day-trip. Infrastructure, Data Integration, and Timeliness – NMFS partners with fishermen, the Councils, interstate commissions, coastal states, and tribes to collect data and provide appropriate statistics that support the strategic goals of building sustainable fisheries, ensuring recovery and conservation of protected species, protecting and restoring living marine resource habitat, as well as supporting fishery-dependent communities. It is necessary to collect and integrate data from a variety of sources to achieve complete coverage of fishing operations and to ensure that fisheries statistics are as comprehensive and accurate as possible. To do so requires an infrastructure that allows us to efficiently compile and integrate data from a variety of sources in an efficient and timely manner. This allows managers and other stakeholders to compare data obtained from different sources to reconcile or explain differences

EM/ER Discussion Draft Page 32
and/or estimate appropriate statistics. Sample survey data collection programs may have high rates of non-response and logbook data are likely to include self-reporting and measurement errors. An infrastructure that allows easy integration to take all of these different data feeds and their metadata into account is desirable.
Infrastructure – Making a series of small revisions and programmatic additions to legacy information management systems to incorporate EM/ER adoption will eventually result in inefficiencies, low performance, and multiple potential points of failure. While NMFS and state database systems are complicated and costly to alter, there is a benefit in working towards integrated systems with consistent standards for streamlined and effective collection and management of video and numerical data in the future. For example, the potential volume of video records obtained through EM will place unprecedented stress on existing transmission and storage infrastructure throughout the data’s lifecycle from capture to archive. In evaluating adoption of EM/ER options, these needed changes in infrastructure to manage the volume and types of records must be included as part of the design and cost accounting process. These records must be retained by the federal government for varying periods of years as required by several federal statutes just as current paper records are archived, but with different technical storage and security requirements. Ideally, using uniform electronic formats and standardized interfaces wherever feasible facilitates the collection of additional data elements and provides opportunities for faster and easier access. It also comes at a cost. Certifying third-party service provider technology solutions as meeting management standards (e.g., in the form of technical requirements that software or hardware vendors can satisfy) should be considered and made available by NMFS and Councils. This can promote competition in EM/ER services and presumably result in lower prices to the industry, simplify the burden on the government to deliver in-house electronic technology solutions, and offer diversity in the range of available products and services.
Data Integration – To support managers in their compliance and enforcement use of the fishery data, the capability for integrating electronic data feeds from different sources should be included in the solution design. For example, in most commercial fisheries, it is very important to be able to compare data obtained from seafood dealers, vessel operators, and at-sea observers to get accurate statistics on total catch by species. To do this, the ability to obtain data quickly from all three sources, integrate the data to reconcile differences in landings numbers (between dealer and vessel trip reports), and then combine the reconciled landings with the observer-reported discards is needed. Designing and implementing appropriate EM/ER technologies for each data source ensures data are available sooner, but it does not ensure that data can be readily combined unless the program is designed to include this integration.
Making data integration a conscious policy goal will also positively contribute to the public transparency needed for oversight of the management of a public trust resource. When data management and infrastructure are considered in this manner during the early stages of plan development (i.e., allowing fisheries and boats to choose their preferred data collection and management software systems, as long as they meet the overall requirements), it ensures an effective infrastructure is available to use the data for its intended purposes.
Timeliness – EM/ER technology should be held to the standards for the timeliness of data capture, data processing, and/or data transmission necessary for the specific fishery management
EM/ER Discussion Draft Page 33
design that it supports. Due to the potential costs associated with the implementation any new methodology, such performance standards should only be set as high as needed to support the specific regulatory strategy for the particular fishery. Fisheries managed with individual catch shares versus those managed by in-season quota monitoring for a fleet will have different timeliness standards. Fisheries managed with multi-year targets will have yet different turnaround times. The particular EM/ER technology applied to any specific fishery should be matched to the timeliness requirement. More costly EM/ER system components should not be purchased if a less costly one is sufficient. In some fisheries, data may be required on a near real-time basis to close a fishery –where an annual catch limit of a choke species is measured in only hundreds of pounds, for example. In other cases, near real-time transmission of data may not be necessary given the management approach. Near real-time transmission of data may become problematic when dealing with large volumes of data such as video (e.g., it may be cost-prohibitive via satellite or impractical in remote Internet-limited areas). Assuming the video itself is the basis for taking the management action, demands for rapid review of data may also be a significant cost driver. Retrieval of hard drive data for review and analysis may also require a careful evaluation of the alignment of design of the regulatory program and the monitoring program. Timeliness of data and integration of data sources should be addressed in regional implementation plans taking into account the following factors:
• EM/ER technology should be in alignment with the timeliness of data capture, data processing, and/or data transmission for the specific fishery that it supports.
• Common programming language should be used when possible. Open source code or standards should be considered rather than becoming tied to a particular suite of software, particularly if it is proprietary.
• To the extent practicable, EM/ER equipment should be integrated with sensors and other vessel systems such as GPS to ensure that all fishing events are recorded and to provide a complete profile of fishing activity and where possible to validate ER data.
• EM hardware should be designed to be computational and compatible with ER/VMS with the goal of integration between the systems, or having a computation video-based monitoring unit (CVM) that provides all functions of EM/ER/VMS.
Data for both fisheries governance and fisheries business purposes – To help minimize overall costs, NMFS and Councils should consider making EM/ER design decisions that closely align with the business information needs of the fishermen, such that separate information technology solutions for fishermen’s business needs and government’s management purposes are not necessary. This would improve the efficiency of fishing businesses by capturing and recording their data once but using it for multiple purposes (sales, marketing, profit/loss and other business planning, tax filing purposes, fishing regulation compliance, etc.). There are several examples already in place where ER data are captured electronically at-sea using third-party software and used to support sales and marketing agreements with dealers, wholesalers, restaurants, etc. Moreover these value-chain driven ER data uses also support fisheries traceability purposes such as sustainability and responsibly–fished marketing, food safety purposes and product control/chain of custody uses. Multiple service providers or vendors could produce specialized value-added products to analyze and interpret data for these other business uses while satisfying
EM/ER Discussion Draft Page 34
the government-furnished technical data standards for management purposes. This may be a cost effective solution where third-party service providers who have fisheries business applications may also be able to meet the requirements specified by NMFS and Councils for governance purposes.
In addition, providing improved data access to any federally-collected data in the federal archive back to the fisherman submitting the data, including efficient data transfer technologies and data summarization and decision support tools, should be considered as EM/ER design requirements. This would also benefit multiple users interested in the use and disposition of public fishery resources in addition to helping stakeholders to satisfy their own business and regulatory needs.
The ultimate step in this progression is the option of devolving responsibility for data collection from the government to the stakeholders entirely by giving the industry the responsibility to come up with the design options that meet the management, science and enforcement criteria specified by the government. In this example the industry would be responsible for the administration, oversight, and any contractual arrangements, etc. and the government would not be involved in the selection of EM/ER vendors or type-approving their individual products. This requires a high degree of organization and cooperation on the part of the industry and clarity in the articulation of the government’s requirements.
Fish/Catch Handling – Monitoring catch and discards will require specific configuration of catch handling systems (discard handling, catch control points on an individual vessel level, discard chutes) and processing equipment on board each vessel. Automating the counting of fish discarded is possible, given the right configuration of discard chute(s) and cameras.
Automating the identification and weights of those fish discarded is much more difficult. Initial attempts to automate the video data analysis appear promising, but considerably more work and investment by the agency, Councils, and industry is needed to automate the process.
Species that are prohibited from being brought on board present their own identification and accounting challenges. Species-level identification of protected species may or may not be possible using video monitoring systems.
• Given the wide variety of fishing vessels, EM/ER equipment and its configuration must be tailored to each individual vessel and a vessel-specific monitoring plan developed.
• Modification of the deck layout of fish handling and processing equipment may be required to optimize video camera views and coverage for some monitoring objectives.
Confidentiality – Much of the raw data collected by observers or monitors is confidential under the MSA and some information could also be confidential under the Trade Secrets Act. NOAA’s existing regulations implementing the Magnuson-Stevens Act confidentiality sections are in development and specific guidance in this document is not possible at this time. However, there will be a number of confidentiality decision points facing NMFS and Councils as they evaluate the adoption of EM/ER. Systems will be developed in such a manner as to fulfill legal obligations prohibiting disclosure of confidential information to unauthorized persons. Pending the outcome of final confidentiality regulations, appropriate measures must be taken to ensure the confidentiality of EM/ER data.

EM/ER Discussion Draft Page 35
• The agency and Councils must ensure that appropriate measures are in place to maintain the confidentiality of data.
• The data should be available to NMFS fishery managers and scientists when needed for management purposes.
• Agency staff with pertinent information, including observers and/or catch monitors, should be available for debriefing or interviewing by OLE staff.
Archiving data – Data collected through EM/ER systems will need to be archived for enforcement, management, or regulatory purposes. Records collected by the agency are subject to records retention requirements and appropriate measures must be taken to ensure the security, accessibility, and viability of data. Short-term storage concerns include sufficient hard drive space on board vessels. Long term storage challenges include the cost of archiving and potential loss of data. Regional implementation plans for EM/ER should take into account the following factors:
• Sufficient storage capacity is needed on board vessels to store data until it can be retrieved or submitted.
• Data storage systems should function harmoniously with other current data systems and be standardized as much as possible to align with historic data sets.
• All data collected by the Agency should be maintained for a minimum of 5 years (civil statute of limitations) to support potential enforcement actions.
• Scientific and management needs may require longer storage, depending on the current records retention policy – check with regional NMFS records retention officer for details.
Applicability of EM/ER - When considering any new idea or policy there is oftentimes a wide range of opinions about the capabilities and the shortcomings of both the status quo and the possibility of changing direction. When it comes to specialized fields, particularly science and technology, public opinions oftentimes contain false information based on hearsay or lack any credible supporting evidence. Such false information becomes problematic when it clouds fair judgment and biases decision making. This section highlights some of circumstances most often associated with the applicability of EM/ER, and seeks to promote an objective consideration of EM/ER options based on factual information. It is acknowledged that for any particular fishery the facts may weigh against adopting EM/ER as the tool of choice, and that outcome is consistent with NMFS policy. Fixed Gear Fisheries – Fixed gear fisheries are the subject of several operational EM applications and many more pilot projects. Why have these fisheries been successful in adopting EM? What about the gear itself and the circumstances of fishing and management regime associated with the gear that have made EM monitoring approaches an attractive alternative to consider for discard compliance and/or catch accounting for fixed gear fisheries? Some of the common factors are: the relatively low scale or low volume of fishing per unit of effort; the relative low diversity of species caught and/or relatively low degree and diversity of bycatch and discards; relative simple operational on-deck fish handling procedures; and, in some cases, management policies/rules on full catch retention. In other fisheries it is not the gear/fishery combination but the information objective that made EM an attractive choice. In some fixed gear and trawl fisheries the monitoring objective for EM

EM/ER Discussion Draft Page 36
is secondary for use as a validation tool for an electronic logbook rather than the primary tool for catch accounting itself; i.e., confirming a subsample of self-reported logbook records of a haul or set using the corresponding video record to confirm a specific catch and/or discard. Small Boat Fisheries – Small boat fisheries can be strong candidates for consideration of EM/ER where other monitoring approaches may be less applicable because of vessel size or expense relative to the data required. For example, EM/ER may be desirable because the expense or logistics of paying for and stationing an observer (e.g., providing them a bunk, food and/or deck working space) may be impractical or infeasible for a small day boat, or on a coastal trip fishing boat with low net revenues. Nevertheless, the accountability of the catch and effort of these craft is important to the successful management of the fishery. In some cases the resulting fishery dependent data available from EM/ER monitoring may even be the only source of data for use in stock assessments and fishery impact statements as well. However, EM or ER cannot automatically be selected as the best choice without the relative benefits and costs of different monitoring tools being computed on a case-by-case basis. Many scenarios are possible for consideration by the Councils. EM/ER does not have to be a one-size-fits-all solution for the entire fishery. It is conceivable that a tiered usage of EM/ER could be devised such that smaller vessels could opt for EM/ER solutions. Further, in this hypothetical case, those costs might be paid for by the government. Certain larger vessels, willing and able to undergo greater surveillance by onboard observers, could opt to pay for that privilege in exchange for higher risk fishing behavior requiring that scrutiny. This of course requires alignment of the Councils’ management approach and monitoring approach. Another hypothetical variation is all vessels would use EM/ER, and only chronic/repeat violators of regulations would be required to carry and pay for onboard observers as a result of their prior offenses. These hypothetical examples are meant to highlight the opportunity to customize the use of EM/ER tools to the scale, financial conditions and circumstances found in a particular fishery. Full Retention Fisheries – EM systems often perform well at catch accounting when it comes aboard in small numbers at a time. Catch accounting with EM is much more difficult in seine and trawl fisheries because of the larger catch quantities and limited onboard sorting. As with fishermen and human observers, identification of catch where families or genera of fish have many similar-looking species is also problematic for EM systems While advances in fisheries species identification through video imaging continue to be made, there are limitations on the applicability of EM for catch accounting right now that make it more complex. However, this should not preclude the consideration of EM use in these fisheries for fine scale temporal and spatial definition of fishing operations, observations of fishing gear, mitigation device use and catch handling procedures. For example, in full retention fisheries where catch accounting procedures are taken care of shore side, EM can help validate no-discard management objectives to ensure the integrity of the full retention provisions. Full retention for fisheries is not customary practice in the US. However, a no-discards policy monitored by EM/ER is a cornerstone of the European Union’s reformed Common Fisheries Policy currently under adoption, and this may have some future implications for US fisheries policy.

EM/ER Discussion Draft Page 37
Recreational fisheries – The recreational charter for-hire sector, with relatively small vessels with concentrated but highly effective effort of few anglers, may be well-suited to EM and ER applications for catch accounting and compliance monitoring. Charter vessels and/or their operators are usually readily identifiable through licenses or permits, and their frequency of trips and generally higher-than-average catch rates make them of high interest for management monitoring purposes. For example, one or two cameras may be deployed and used as an independent validation means for self-reported electronic logbook data recorded and transmitted through smart-phone devices. This sector may be a candidate for consideration of an EM/ER solution instead of dealing with un-validated self-reporting, isolated landing sites, rare-event species and other problematic sampling issues through a paper logbook or dockside interview based approaches. The use of an EM/ER combination on larger recreational head boats requires further consideration of issues of scale, camera placement and negotiation of modified fishing operations similar to what would need to be done for commercial fishing vessel consideration of EM/ER. There have been several smart phone and tablet-based ER applications developed in the last few years to record for-hire and private recreational fishing activity. Many of the pilot programs and research and development efforts have been funded by NOAA or other federal grant or contract funds or have involved NOAA in cooperative efforts with researchers and service providers. The data are input in the field on a trip basis and usually transmitted to a central site when within range of cellphone tower coverage. The reliability and cost of the software and hardware, the presence of competition in the service provider marketplace for different applications, and use in some state fisheries all suggest this technology is close to adoption in federally-managed fisheries. In the case of ER hand-held entry device usage by private recreational anglers, the challenge is not from the capability of the technology to produce observations. The challenge is to ensure there is a proper statistical design and program that will make valid use of the resulting observations. This requires an initial NOAA-Council-stakeholder agreement on the types of data that need to be collected for a particular fishery, and more importantly, how they will be applied or used in the management, science and enforcement of the fishery. Only after this agreement is reached should the next step be taken to evaluate the available methods (e.g., hand-held devices, dockside interviews, etc.) to capture those data in the most cost-effective and sustainable manner over time. This was the process described in detail in the EM/ER roadmap process in Section 2: First establish explicit monitoring goals (Phase II of the roadmap) and then specify the program design (Phase III of the roadmap). Choosing a collection methodology first and then trying to reverse-engineer the application of the resulting data into productive uses is fraught with problems. For example, fishery statisticians have long been challenged to make meaningful use of paper records submitted by “self-selected” volunteer fishermen for management or science purposes. Oftentimes fishing club or individual paper logbook records from commercial or recreational fishermen have been shared with NOAA on the number or size of fish caught or where captured. With sufficiently long time series and consistency and sufficient detail in reporting, the information can sometimes be very useful, for example producing indicators or trends in catch rates or catch diversity for a particular area over time. However, such observations may not be

EM/ER Discussion Draft Page 38
applicable or produce relevant measures to represent the entire fish population status or trends (size frequency of total catch, evidence of overfished stocks or overfishing, etc.) or the management performance of the entire fishery (estimates of total catch, total bycatch, total discards, etc.). Without a proper statistical design, the representativeness of the self-selected observations can be extremely biased and produce misleading information. The steps for establishing sampling fractions, accounting for response rates, and designing and testing estimation procedures when using ER devices are complex tasks that must be accounted for prior to the deployment of the technology. However, these are not impossible survey sample design tasks. The steps are not unlike sample survey programs that don’t use ER devices. In fact, these electronic hand-held devices also share many of the same well-documented data quality caveats associated with angler self-reported data, such as poor species identification and biases in numbers and sizes of fish reported. Note however that ER devices can produce large volumes of data very quickly, and without proper forethought in statistical design, sample execution or quality assurance, the outcomes can quickly become unsatisfactory for stakeholders, the Councils and NOAA. 4.5 Examples of U.S. EM/ER and VMS Programs
The following are examples of ER, EM, and VMS technologies in place in US federally managed fisheries. They are not an endorsement for a particular approach, nor did they necessarily follow a priori all the steps described in the Roadmap strategy in Section 2. However, they are illustrative demonstrations of how one or more of the key factors discussed above resulted in the successful application of EM/ER technologies in US fisheries.
4.5.1 Case Study for ER in the Northeast
In the Northeast Region (Region), owners or operators of commercial groundfish vessels with federal permits have the option of submitting logbooks electronically via an electronic vessel trip report or eVTR. The voluntary use of eVTRs is authorized for vessels that possess a valid federal multispecies permit and participate in either the sector vessel fleet, cooperative research study fleet, or were in the Gulf of Maine Research Institute’s (GMRI) eVTR pilot study.
Phase I: Assessment
Amendment 16 to the Northeast Multispecies Fishery Management plan – implemented in 2010 – put in effect significant revisions to the management structure of northeast groundfish stocks, including the adoption of annual catch limits (ACLs) and a catch share program. This program allocates the ACL among various sector participants and a common pool for the commercial fishery. The adoption of this program and the successful management of sectors meant an increased burden on the agency and the industry to provide more data, and more timely data, in a way that was faster and more efficient than past systems. Until recently, commercial vessels have reported their landings via paper-based logbooks with an associated financial burden on the Region of approximately $400,000 per year, largely for data entry. Additional costs of printing and mailing paper reports were also incurred. The need for more timely accurate data (less time than manual entry of records on paper, fewer transcription, spelling and coding errors), as well as more efficient delivery of data (necessitated by shorter time periods between conclusion of trips and delivery of data) prompted the development of electronic vessel trip reporting. Spurring on

EM/ER Discussion Draft Page 39
this development was the general request from industry members to move away from a paper-based reporting system.
Phase II: Identification of Goals
To meet the increased demands of Amendment 16 on the information management systems, the Region identified several requirements, or goals, for a revised catch management system. First, Amendment 16 significantly increased the expected volume and frequency of landings records to be submitted since multispecies permit holders would be required to submit trip reports (including “negative” reports of no fishing activity) weekly, rather than monthly. The Region needed a way to handle this increased volume quickly and cheaply, and to get away from a paper-based system to avoid the expense.
In addition, the continued focus on the status of the stocks – ending overfishing and rebuilding stocks to target levels – meant that data needed to be shared quickly with scientists for assessment purposes. The system also needed to support better resolution for where fish were caught (spatial resolution) and where fishing actually occurred – a goal that also supports the fishery’s area management programs.
Lastly, given that the regulation requiring that a vessel trip report be completed at sea (and submitted to the agency by close of business on the Tuesday of the following week), the system needed to support special requirements regarding timing, signature, encryption, and chain of custody.
Phase III: Program Design
Regulations set a vessel’s reporting requirements. Those regulations may be met by submitting either the traditional paper logbook (VTR) or by submitting an eVTR. The eVTR – or any similarly designed software application – must meet some general design requirements.
• The software program must provide error checking and quality control measures at the point of data entry to improve data quality and reduce processing time.
• The program must allow the operator to complete entry prior to the vessel landing and then must allow submission prior to midnight Tuesday of the following week.
• The program must allow flexibility in that the reports may be submitted by email either while at sea using the vessel’s VMS email or upon the vessel landing utilizing wireless internet, DSL, cable, etc. They may also be submitted by uploading the file to a web portal known as Vessel Electronic Reporting System (VERS) which is housed by the Northeast Fisheries Science Center. VERS is used by vessel operators not only to upload reports, but also to review and amend previously submitted reports.
Approving an eVTR -- Prior to the development and implementation of Amendment 16, the Northeast Fishery Science Center’s (NEFSC) Cooperative Research Program was developing an electronic reporting application known as Fisheries Logbook Data Recording System (FLDRS). FLDRS was being used primarily to support the Study Fleet program to primarily engage in cooperative research projects with the NEFSC. However with the advent of eVTR, FLDRS was modified to satisfy the eVTR requirements and was approved for use as an eVTR in the Northeast in July 2011. At present, only the FLDRS software application is approved for use as

EM/ER Discussion Draft Page 40
an eVTR. At this time (June 2013), FLDRS software (version 3.1) is used by approximately 30 vessel operators to support eVTR. Another 120 vessels are scheduled to adopt FLDRS by the fall of 2013. However, there are numerous other eVTR-like applications being developed by private industry. Several of these privately developed software applications may be completed and approved for use soon as they meet NMFS’ design requirements.
Phases IV: Pre-implementation
Prior to implementation, the currently approved eVTR was tested through two different programs. The NEFSC Study Fleet program began using FLDRS to electronically submit their Study Fleet reports and to serve as their VTR submissions. This allowed participants to aid in the research and development of the program while still staying consistent with the regulations regarding their commercial fishing. At the same time, the GMRI ran a pilot program specifically to test eVTR. During both of these pilots, vessel operators continued submitting paper VTRs. Upon the completion of testing in July 2011, eVTR was approved for general use in the Northeast Region with an approved eVTR application.
Phase V: Implementation
Currently, eVTR is approved for use in the Region by any vessel possessing a multispecies permit and is either a member of a groundfish sector, is a member of the Study Fleet, or was a participant in the GMRI pilot program. As more eVTR applications are approved for use and as infrastructure is further developed, the intention is to approve eVTR for use by all segments of the fishing community.
To use eVTR applications, vessels must have a computer on board loaded with an approved eVTR software application. This setup enables the vessel to meet the VTR requirement of having to complete the report prior to landing. Subsequent to the completion of the report, the vessel may submit the report while at sea, through the use of its VMS email system or upon the vessel landing either by uploading the eVTR file to the VERS web portal or by traditional email. Data submitted to VERS are uploaded from the NEFSC to the Region on a nightly basis where it then resides in the VTR database alongside paper VTR submissions.
Phase IV: Review and Adaption
The eVTR is one option for vessel operators to use; they also have the option of using paper logbooks. The Region is also working with fishing industry groups (i.e., groundfish sectors or groups of sectors) to complete development of custom eVTR applications for those sectors. These applications would provide broader fleet data management capabilities, in addition to the electronic submission of mandatory reports. The Northeast Region supports the industry in building its own custom eVTR applications that meet their individual business needs and specifications since this is not a government function. Improving the collection of fishery dependent data for fisheries management is the primary driver for the Region. Historically, approximately 50% of the paper-based VTRs have had some degree of errors or problems. Most are minor (e.g., lack of crew number), but some are critical errors, such as no area or state specified, that require that the report be sent back to the submitter for correction. Inherent in the eVTR applications are data quality controls. Quality controls are in place to

EM/ER Discussion Draft Page 41
ensure accurate and valid data are entered before the record is accepted for submission. Additionally, electronic submission of the data significantly reduces errors associated with manual data entry such as misinterpreting handwriting, making transposition errors, and keypunch errors.
4.5.2 Case Study for EM in Alaska
In Alaska, EM is currently implemented in three fisheries in the Bering Sea/Aleutian Islands (BSAI): American Fisheries Act (AFA) pollock (Amendment 91), Amendment 80 (non-pollock trawl), and the Pacific cod freezer longline fishery.7 In all three cases, video cameras are used for compliance monitoring to ensure that catch and bycatch is being properly sorted, sampled, and/or weighed. The following case study of Amendment 91 focuses on the successful application of the phases described in Section 2.
Phases I: Assessment
Action was required in the Bering Sea pollock fishery because this fishery catches up to 95 percent of the allowable Chinook salmon taken incidentally as bycatch in the BSAI groundfish fisheries. Salmon in the Bering Sea occur in the same locations and depths as pollock and are, therefore, caught in the nets as fishermen target pollock. As a prohibited species, salmon must be avoided as bycatch, and any salmon caught must either be donated to the Prohibited Species Donation Program or be returned to the sea after an observer has determined the number of salmon and collected any scientific data or biological samples. Monitoring requirements at the time included 2 observers (“200% observer coverage”), VMS, and electronic reporting. The existing regulatory and monitoring framework was sufficient for determining targeted catch of pollock, but insufficient at precisely determining Chinook salmon bycatch to support transferable Prohibited Species Catch limits.
Phase II: Identification of Goals
The goals were identified in the Draft Environmental Impact Statement (EIS) for Amendment 918. The FMP process provided decision-makers and the public with an evaluation of the environmental effects of alternative measures to minimize Chinook salmon bycatch in the BSAI pollock fishery, including monitoring goals and options. In addition to Council meetings, NMFS held several public meetings to involve all stakeholders in the identification of goals and potential solutions.
As part of the development of EM in Alaska, an EM workshop sponsored by the NMFS Alaska Fisheries Science Center, the NMFS Alaska Region, North Pacific Research Board, and the Council was held in Seattle in 2008. The goal of the workshop was to assess the current state of
7 See http://alaskafisheries.noaa.gov/sustainablefisheries/amds/80/default.htm and http://alaskafisheries.noaa.gov/sustainablefisheries/bycatch/salmon/chinook/monitoring/faq.htm 8 Discussion of the monitoring requirements for Amendment 91 can be found in section 2.2.5.7 of the Chinook Salmon bycatch Environment Impact Statement (http://www.fakr.noaa.gov/sustainablefisheries/bycatch/salmon/chinook/feis/eis_1209.pdf) and sections 6.3.3-6.3.5 of the final Regulatory Impact Review (http://www.fakr.noaa.gov/sustainablefisheries/bycatch/salmon/chinook/rir/rir1209.pdf).

EM/ER Discussion Draft Page 42
video monitoring technology in fisheries, the applicability of EM to research and management of North Pacific fisheries, the future potential of EM, and research and development needs. Workshop materials and findings were posted on the NMFS Alaska Region website.
In addition to the workshop, a number of EM pilot projects in Alaska in recent years have built the foundation for development of EM in the pollock fishery. EM has been tested in a number of different applications including monitoring seabird interactions, estimating halibut discards, monitoring bin activity for presorting, and automating the analysis of video data.
Phase III: Program Design
Amendment 91 provided an innovative approach to managing Chinook salmon bycatch in the BSAI pollock fishery by combining a limit on the amount of Chinook salmon that could be caught incidentally with incentive plan agreements and a performance standard. The program was designed to minimize bycatch and prevent bycatch from reaching the limit, while providing the pollock fleet with the flexibility to harvest the total allowable catch.
Each Chinook salmon properly accounted for contributes to the potential limit on the catch of pollock. This increased the economic incentive to misreport Chinook salmon bycatch. To ensure effective monitoring and enforcement of transferable Chinook salmon bycatch caps, NMFS implemented a census, or a count, of all salmon bycatch in the directed pollock fishery in the Bering Sea. The most significant additional requirement for the catcher/processors and motherships was a requirement to install a video system with a monitor in the observer sample station that provides views of all areas where salmon could be sorted from the catch and the secure location where salmon are stored until they can be counted by an observer.
Phases IV: Pre-implementation
The implementation of EM in the pollock fishery was built on the experience and regulations that were developed to implement similar technology into the Amendment 80 fishery. Prior to implementation of the EM monitoring option for Amendment 80, NMFS asked several vessels to carry EM systems for one season to test the durability of the systems and allow the vessels time to understand how the systems operated prior to implementation. There were some initial technical issues with the Amendment 80 systems; however, those were quickly resolved and overall, EM worked well in a compliance monitoring application. As such, Amendment 80 provided an important foundation and learning experience for implementing similar technology in the Bering Sea pollock fishery.
Phase V: Implementation
NMFS implemented the program in January 2011 for the BSAI pollock fishery. The regulations for Amendment 91 contain the second EM requirement9 that NMFS has implemented in Alaska. In this application, EM serves as a compliance monitoring tool for enforcement and allows observers to monitor all areas where salmon could be sorted from the catch. NMFS is currently 9 Discussion of the monitoring requirements for Amendment 91 can be found in section 2.2.5.7 of the Chinook Salmon bycatch Environment Impact Statement (http://www.fakr.noaa.gov/sustainablefisheries/bycatch/salmon/chinook/feis/eis_1209.pdf) and sections 6.3.3-6.3.5 of the final Regulatory Impact Review (http://www.fakr.noaa.gov/sustainablefisheries/bycatch/salmon/chinook/rir/rir1209.pdf).

EM/ER Discussion Draft Page 43
completing its third full year of the program and the program appears to be highly successful, with many added benefits that developed through the use of EM.
Some characteristics of the EM in this fishery are:
• The industry bears the burden of cost and maintenance of the EM equipment. • Tampering is not an issue because it is detectable in real time (the observer can see the
images). • The industry has regulatory requirements to keep the system working and to maintain
sufficient data storage capacity for an entire trip. • The data must be retained onboard the vessel for no less than 120 days after the date the
video is recorded unless specifically noted otherwise by NMFS. • NMFS manually extracts the data, addressing chain of custody concerns. • NMFS only collects the video data if a problem has been reported or to ensure systems
are working properly or to conduct quality control checks. This reduces agency costs needed for data review and storage.
Phase VI Review and Adaptation
Review, assessment and adaptation of Amendment 91 monitoring components is an ongoing process. A NMFS team consisting of staff from the Alaska Regional Office, Alaska Fisheries Science Center and observer program, and the Office of Law Enforcement was formed to coordinate the implementation this program. The group meets regularly to review implementation issues and develop solutions, including identifying potential program modifications. The team provides outreach to the fishing fleet and shoreside processing facilities to ensure compliance with regulations and has solicited feedback from the industry on program improvements.
4.5.3 VMS Example – Northwest Region
In the Northwest Region, owners or operators of commercial groundfish vessels with federal permits and open access vessels that take, retain, or possess groundfish in the EEZ are required to install, operate, and maintain VMS units 24/7 throughout the fishing year.
The following items highlight some of the important factors of the program:
• Regulations supporting the VMS requirements exist and are enforceable.
• Vessels operators are assisted in complying with regulatory requirements through a NMFS sponsored reimbursement program of up to $3,100 for equipment purchase. Fishermen are responsible for all other maintenance and transmission costs.
• NMFS manually extracts the data, addressing chain of custody concerns.
• OLE receives direct VMS position data feeds from the type-approved satellite providers. These direct VMS data feeds ensure that chain of custody is maintained.

EM/ER Discussion Draft Page 44
• Tampering has not been an issue with VMS because of safeguards built into the system. If a unit stops transmitting, OLE has a program to find and correct non-reporting VMS units.
• VMS data are retained onboard the vessel. VMS type-approval requires that the units be able to store the last 100 position reports. Storing VMS position data locally on the VMS unit enables OLE to retrieve the data at a later date if transmission to the satellite network has been interrupted.
The process to achieve this successful VMS program flowed from the development of groundfish regulations based on depth-based management and the tracking and monitoring system required to ensure that vessels were in compliance with newly developed regulations. Development of the tracking and monitoring component (VMS and declarations) was a long and iterative process that had been successfully developed and it was used as a model for other projects like the whiting video monitoring pilot and trawl rationalization.
Phase 1–Assessment. Scientific research determined that bycatch of overfished species within the west coast groundfish fishery demanded a change in the way the fishery was managed. The deliberative Council process assessed the need to shift to managing through depth-based management and later incorporated an individual quota program.
Depth-based management required gear-type specific groundfish conservation areas (GCAs) that are closed to certain classes of vessels. These GCA’s are geographically large areas stretching from Canada to Mexico. Traditional law enforcement methods were determined to be ineffective at monitoring the vast conservation areas developed through depth-based management. VMS was identified as the only realistic alternative to monitor these large areas in near-real time on a 24/7 basis.
Phase II – Identification of Goals. The Council determined that the program must be able to identify and track vessels fishing with groundfish gear types and ensure that those vessels fished outside of GCAs closed to their specific gear type. Gear-specific GCAs and depth-based management required a VMS and declaration system to track gear-type and vessel activity to ensure that vessels with certain gear types fished outside of GCAs that were prohibited to that gear type.
Phase III - Program Design. The requirement for near-real time monitoring of the groundfish fishery required a system that could monitor fishing activity in relation to GCAs on a 24/7 basis. VMS had been successfully implemented in other NMFS Regions. Software, hardware and processes (declaration systems) had been successfully developed and implemented and could be transferred for use in the Pacific coast groundfish fishery.
Phase IV - Pre-implementation. The in depth collaborative processes with fisheries managers, scientists, enforcement staff, fishing industry representatives and coastal communities were primarily based on Council analysis with public input every step of the way. During this process the Council decided that a pilot program was necessary to test the efficacy of VMS. The pilot program was developed using the limited entry fleet of approximately 350 vessels. To achieve the Council’s goals, groundfish regulations were promulgated by the NWR and OLE hired new

EM/ER Discussion Draft Page 45
staff including the VMS Program Manager, an enforcement technician and an IT specialist to support the program. Declaration codes were developed to track gear-types used by fishing vessels and VMS software and hardware was installed on all units to collect vessel position reports in furtherance of monitoring efforts.
Phase V – Implementation. Once the limited entry pilot program was deemed successful the Council began the process of implementing VMS regulations for the larger open access fleet. The open access fleet is a large group of smaller non-federally permitted vessels that fished using trip limits. The open access vessels only required a state landing license to participate in the groundfish fishery and they had limited NOAA oversight. Identifying the scope of the open access fleet and the vessels that potentially impacted the federal groundfish fishery required a longer deliberative process by the Council. Once the scope of the fleet was successfully identified the Council initiated public notice and outreach which included town hall meetings throughout the west coast to assist fishers preparing for program implementation. The outreach process included numerous meetings, developing a compliance guide, and discussions with industry, VMS manufacturers and local marine electronics vendors (service providers) to make sure that implementation of the program would go smoothly.
Phase VI – Review and Adapt. At the onset of implementation and for well over one year, OLE took a compliance assistance approach to enforcing the VMS regulations by proactively contacting owners and operators when issues or problems were discovered through the VMS program. Since early implementation of the VMS program, additional outreach and Council meetings have been held to gain feedback on the VMS program.
OLE continues to review the VMS program with the goal to provide recommendations for future modifications as new technologies emerge that may enhance monitoring and tracking or make it more efficient and effective.
Section 5
5.0 Moving Forward
5.1 Filling Performance Gaps in Fisheries Data Collection Technologies
Although advancements in VMS, EM, and ER technologies are greatly improving our capability to monitor fishing operations, there are a number of ways in which the existing technologies may fall short of what is ideal for efficient and accurate real-time catch accounting, and monitoring of regulatory compliance and protected species interactions. Research and development will continue to focus on addressing known performance gaps in collecting and managing data given existing technologies. By closing these gaps we will improve the cost-effectiveness and efficiency of monitoring programs.
Performance gaps for existing EM technologies actually vary depending on the intended application, for example with the same device being better suited to monitoring of on-board fishing operations versus monitoring of protected species interactions, etc. Since any monitoring

EM/ER Discussion Draft Page 46
program may have multiple objectives, there are usually going to be a number of different performance issues to address and trade-offs as new technologies are developed and evaluated. The relevancy of these performance gaps for managers considering the application of EM and ER options for data collection is one of informed decision making. No fishery dependent data collection tool or approach is perfect. By highlighting performance gaps in EM and ER, the guidance is not suggesting these options be discounted simply because they could be improved. Best Practice: Consider the strengths and weakness of various approaches and the likely direction of future research and development improvements as you evaluate EM/ER options. Technology improvements occur rapidly and a current impediment may be short-lived. Given this knowledge, the choice of an appropriate tool will be better informed.
5.1.1 VMS Gaps
The following improvements are needed to address existing performance issues with VMS: • There is a need to develop systems that are tamper proof, as well as tamper evident. • Improving data transmission capabilities to ensure real-time tracking is not interrupted.
5.1.2 EM Gaps
A number of improvements are needed to address existing issues with the use of EM for different objectives: • For monitoring compliance and all other purposes:
o There is a need to develop systems that are tamper proof, as well as tamper evident.
o Improvements in the resolution of recorded images are needed, especially at night or under low light conditions.
o More durable systems are needed to avoid breakdowns and assure continuous monitoring.
o Improvements in data transmission capabilities are needed to: ensure more reliable transmission of large volumes of data, and submit data on a closer to a near real-time basis.
o More efficient and cost-effective methods are needed for timely processing and analysis of recorded information to support near real-time monitoring (this may actually be a combination of resolving technology and human capacity constraints).
• For monitoring protected species interactions: o Innovations are needed to allow better monitoring of interactions with mammals,
birds, sea turtles, or fish not brought aboard the vessel. • For catch accounting:
o Innovations are needed to find ways to measure or estimate weights of individual discarded fish (or lengths and conversions to weights).
o Improvements are needed to provide the capability to reliably identify the species and disposition of discards.
• For biological data:

EM/ER Discussion Draft Page 47
o Innovations may be needed to allow collection of biological samples on boats that can be equipped with EM but are too small to carry observers.
5.1.3 ER Gaps
There are several ways in which ER could be improved to address current performance issues for catch accounting:
• Wide-spread application of options to record tow-by-tow, set-by-set or other fine-scale resolution of catch and discard by area and time are desirable. This would reduce possible recall errors, especially for accurate accounting of discards by species and disposition when they are recorded at the conclusion of a trip.
• Improvements in data transmission capabilities are needed to allow more reliable and closer to real-time monitoring of compliance, landings, discards, and fishing conditions (depth, water temperature, etc.). This could improve bycatch hot-spot monitoring, and sector and fleet catch accounting in non-IFQ fisheries. Improvements in data transmission capabilities at-sea would allow more effective validation of compliance with reporting requirements and validation of self-reported catch data. Current transmission of data via satellite is possible on larger boats with some existing systems; it is relatively expensive.
5.1.4. Institutional Gaps
In addition to the technical and biological areas for R&D, there are also a suite of institutional gaps that warrant research, including: • Social research is needed to better understand the sociocultural impediments to adoption
of EM/ER technologies. In particular, focus should be given to assessing the institutional characteristics (e.g., norms, formal and informal rules) of fishing communities and how these characteristics can facilitate or challenge the adoption of these technologies. Understanding this context can inform the design of regional or fishery specific EM/ER systems and will increase the likelihood that these technologies are adopted.
• Research is needed to identify ways to increase compliance outside the traditional
regulatory framework. Although technological innovation will help to reduce intentional and unintentional data manipulation, developing mechanisms for individuals affected by these technologies to participate in developing, enforcing, and modifying the rules may help increase compliance and overall buy-in into the system.
5.2 Towards a Shared Future
To meet our future needs for fishery dependent data, NOAA, the Councils, tribes, states, Interstate Commissions, the fishing industry, and other stakeholders have to be innovative, and embracing technology is one option to consider because it may provide us tools to obtain more cost-effective and sustainable sources of data to support our fisheries stewardship responsibilities. There are new EM and ER tools available for collecting data that should be evaluated because they may be more effective and cheaper than our more traditional approaches; however, in some cases they may not. NMFS is interested in working with its partners along with

EM/ER Discussion Draft Page 48
leading researchers and service providers to make smart choices about the future use of electronic technologies and use the right data collection methods, traditional or electronic, for the right purposes.
However, state and federal government budgets are flat or declining, and additional funding for electronic technologies will be in short supply. Any existing funds we have for data collection have to be used wisely. Therefore, we cannot afford to pursue EM/ER outcomes unilaterally or independently. Our approach to EM and ER research, to development, and to implementation must be a shared one. We cannot afford to conduct duplicative research programs; we cannot afford to sponsor redundant pilot efforts, and we shouldn’t use limited funds to prove a concept more than once.
To be efficient the NMFS regions and the eight Councils should design EM/ER systems that are flexible, that can be expanded to support more than one FMP, and/or that can be re-used or easily customized and applied in more than one fishery, Council area or region. For example, a fisherman operating in federal waters should have only one EM system and one ER system to satisfy all his reporting obligations, not multiple systems o his boat for each fishery, Council area or NMFS region. Working in partnership, this strategy will require sharing knowledge and best practices on ER and EM research and development, using our limited internal and contract and grant funds across regions wisely without duplication, and taking advantage of the market power of economies of scale in procuring EM and ER systems where possible to save on costs for the benefit of the fishing industry and the government.
The shared future for NMFS, Councils and stakeholders does hold some creative tension. While the advice above is to promote economies of scale and other cost-efficiencies, the guidance suggested throughout this document is also to accommodate the regional requirements and needs of different Councils and fishermen. Thus, it is not envisioned that there will be a single EM/ER solution, a single service provider, or a single hardware type – the goal is not as simple as developing a single solution for the entire country. Rather, the solution is more complex. We need a shared vision for moving forward that is based on collaboration and common sense. Four examples of collaboration across regions, based on lessons learned over the last few years, are described below.
5.2.1 Research Priorities: We need to jointly determine appropriate priority areas for new research on EM/ER technologies, and focus on what is needed to optimize performance of commercial and recreational fishery data collection systems. Continuous market research is important to identify new capabilities that have potential for application in fisheries monitoring and priority should be placed on those technologies that integrate multiple capabilities. Agency and Council staff should collaborate on monitoring developments in technology and share new breakthroughs. The Agency and Councils should also take a broad view of ongoing research activities to see if there are redundancies, gaps, or weaknesses. As part of the review of monitoring programs, State and Federal fishery managers should identify priority research areas and annually compare lists of intended projects, contracts and grants to be funded. This list of priorities should be coordinated across the country to reduce redundancy and improve efficiency.

EM/ER Discussion Draft Page 49
5.2.2. Reducing Redundancies
Much of the recent electronic data collection technology research has focused on developing and testing EM and ER pilot systems. Many of the projects funded in recent years have tested similar technologies that perform many of the same functions, primarily with the same EM vendor, but it is not clear if the results have been adequately shared and reviewed to identify optimal solutions for implementation. A number of solutions exist to improve fishery monitoring. For future work we need to ask an important question: Do we want to have a wide variety of solutions in operation for different fisheries, or do we want to develop fewer standardized solutions that we can use in a variety of different fisheries? It may not be necessary to standardize methods across a wide variety of fisheries, and there will always be strong arguments for different approaches in different regions, or fisheries with different monitoring needs. However, there are likely to be significant gains in efficiency (cost-savings) that could follow from better sharing of information and collaborative planning to develop some degree of standardization of technology solutions across regions and fisheries. Unnecessary overlaps in R&D efforts could be avoided if standards were developed for reporting and sharing results of projects. For work already completed, widely sharing the results and the knowledge gained across fisheries and regions is essential.
5.2.3 Requiring Sound Experimental Designs
Many of the previous studies have focused on evaluating the performance of a specific technology application and lacked a formal experimental design that allowed effective comparisons of alternative solutions. This makes it difficult to interpret results and highlights the need for a more formal process when designing, implementing, and reporting results for future projects. It is important to determine what questions to answer, what performance metrics to measure, and what standards to meet before starting a project. The design of any proposed research study should ensure that specific hypotheses can be tested to determine feasibility for applying the technology to address specified needs for improvement. Greater scientific collaboration, rigor and peer review of studies could help ensure research is of the highest caliber possible.
5.2.4 Emphasize Data Integration
Future research should focus on the development of technology solutions that better integrate data feeds from different sources, regardless of whether they are of electronic or non-electronic origin. As new technologies are developed for the collection of data from specific sources, it will be important to ensure that those technologies are also developed to promote improved integration with data from other sources. Designing and implementing appropriate data collection technologies for each data source ensures that better data are obtained faster, but it does not ensure that data can be readily combined unless the planning and development of data collection systems with appropriate metadata is a priority.

EM/ER Discussion Draft Page 50
5.3 Next Steps.
There are many groups already organized and poised to contribute to this shared effort of developing regionally-appropriate fishery dependent data collection programs utilizing electronic monitoring and electronic reporting, including: the Council Coordinating Committee (CCC) Electronic Monitoring Working Group; individual Council Industry Advisory Panels, SSCs, and EM/ER Committees under various names; NMFS Regional Offices, Science Centers, and Headquarters Offices with EM/ER Committees under various names; commercial and recreational fishermen’s groups, fishing community organizations, and NGOs with direct interest in furthering EM/ER adoption; States and Interstate Fisheries Commissions; Regional Fisheries Information Networks; Universities and regional research institutes; and EM and ER contractors and service providers. NMFS is relying on the public participatory Council process to engage these partners in considering the fisheries where EM and ER is most applicable and developing implementation plans to make these tools a reality in each region.
Within NMFS, implementation of this guidance will rely heavily on the leadership of the Regional Offices (and the Office of Sustainable Fisheries with respect to Atlantic Highly Migratory Species) to initiate consultations in FY 2013 with their respective Councils on the consideration and design, as appropriate, of fishery-dependent data collection programs that utilize electronic technologies for each Federal fishery. These consultations could take the form of briefings at Council meetings; listening sessions, focus groups, and local workshops with fishermen and Council members; creation of regional data collection strategic plans, white papers or EM/ER discussion documents, etc. The process will rely on collaboration with the respective Science Centers, States, Commissions, industry, and other stakeholders and partners. As discussed at the 2013 CCC meetings, the goal is to complete a process by the end of calendar year 2014 that results in a schedule of where and how to adopt appropriate electronic technologies to improve the outcomes and sustainability of data collection from all fishery management plans (FMPs). While the process can begin to achieve this goal sooner than 2014, as proposed it includes the following steps:
June - Sept 2013: Conduct outreach and solicit input on this Guidance Discussion Draft; Finalize Guidance Document & roll-out by the end of summer.
July 2013 – End of 2013: Initiate regional evaluation on the role of EM/ER by Council. Begin development of regional strategies on consideration of EM/ER.
January 8-9, 2014: Seattle, Invited National Workshop on EM/ER. Questions, challenges and ideas raised in initial regional consultations will be brought forward for discussion and resolution at national workshop and used at regional feedback sessions.
December 2014: Completion of Regional Plans: Includes a schedule of tactical approach for FMP amendments and/or regulatory changes in 2015 and beyond for each Council, as appropriate.

EM/ER Discussion Draft Page 51
How to Comment on this Document:
A discussion draft is a draft work in progress intended to stimulate reader thought and to extract reader’s reaction to what’s written. The purpose is to mine reader’s additional ideas and contributions for completion of a final document. It will only be deemed a success if you contribute to it.
Our collective goal for the final document is to help managers and stakeholders consider the questions of how EM and ER can help contribute to a more cost-effective and sustainable collection of fishery dependent data in our federally-managed fisheries.
The document is not intended to be prescriptive or regulatory in nature and is offered as preliminary draft advice and best practices. As consideration of EM/ER proceeds in the eight Council regions it is hoped that additional feedback and guidance will be submitted for addition to this document over time as a “living document” to improve the knowledge base and information available to assist these decision makers.
If you have any input and additional ideas or suggestions on EM/ER to add to the document, especially advice or suggested best practices based on your direct experience, please submit them via an email to: [email protected] by September 30, 2013.

EM/ER Discussion Draft Page 52
Citations
Akcakaya, H.R., S. Ferson, M.A. Burgman, D.A. Keith, G.M. Mace, and C.R. Todd. 2000. Making consistent IUCN classifications under uncertainty. Conservation Biology 14: 1001-1013.
Arrow, K.J., M.L. Cropper, G.C. Eads, R.W. Han, L.B. Lave, R.G. Noll, P.R. Portney, M. Russel, R. Schmalensee, V.K. Smith, and R.N. Stavins. 1996. Is there a role for benefit-cost analysis in environmental, health, and safety regulation? Science 272: 221-222
Beechie, T., G. Pess, and P. Roni. 2008. Setting river restoration priorities: a review of approaches and a general protocol for identifying and prioritizing actions. North American Journal of Fisheries Management 28: 891-905.
Cahalan, J.A. et al. 2010. Bycatch Characterization in the Pacific Halibut Fishery: A Field Test of Electronic Monitoring Technology. U.S. Dep. Commerce., NOAA Tech. Memo. NMFS-AFSC-213, 66p.
Gregory, R., T. McDaniels, and D. Fields. 2001. Decision aiding, not dispute resolution: creating insights through structured environmental decision. Journal of Policy Analysis and Management 20: 415-432.
Hughey, K.F.D., R. Cullen and E. Moran. 2003. Integrating economics into priority setting and evaluation in conservation management. Conservation Biology 17: 93-103.
Janis, I. 1983. Groupthink: Psychological Studies of Policy Decisions and fiascoes. Houghton Mifflin Company, Boston.
Kahneman, D., P. Slovic, and A. Tversky. 1982. Judgment Under Uncertainty: Heuristics and Biases. Cambridge University Press, New York.
Keeney, R., and H. Raiffa. 1976. Decision with multiple objectives, preferences and value tradeoffs. John Wiley & Sons, New York.
Kemp, P.S. and J.R. O’Hanley. 2010. Procedures for evaluating and prioritizing the removal of fish passage barriers: a synthesis. Fisheries Management and Ecology 17: 297-322.
Lowman, Dorothy et al., 2013. Fisheries Monitoring Roadmap: A guide to evaluate, design and implement an effective fishery monitoring program that incorporates electronic monitoring and electronic reporting tools. Available online at: http://www.edf.org/sites/default/files/FisheryMonitoringRoadmap_FINAL.pdf
McElderry et al. 2005. Electronic monitoring of the Cape Cod haddock fishery in the United States – A pilot study. Archipelago Marine Research Ltd., Victoria, BC Canada.
Miller, J.R., and R.J. Hobbs. 2007. Habitat restoration – do we know what we’re doing? Restoration Ecology 15; 382-290.
Moffett, A. and S. Sarkar. 2006. Incorporating multiple criteria into the design of conservation area networks: a mini review with recommendations. Diversity and Distributions 12: 125-137.

EM/ER Discussion Draft Page 53
MRAG Americas. 2011. Guiding Principles for Development of Effective Monitoring Programs Available online at: http://blogs.edf.org/edfish/files/2011/05/MRAG-EDF-Guiding-Principles-for-Monitoring-Programs-Final-Final.pdf
New England Fishery Management Council, 2012. Developing Effective Monitoring for the Northeast Multispecies Fishery: Methods and Considerations. White paper presented at June 21, 2012 NEFMC Meeting Groundfish Committee, Agenda item 6. Available online at: http://www.nefmc.org/nemulti/council_mtg_docs/June%202012/6_WHITE-PAPER.pdf
Stanley, R.D., et.al. 2011. The advantages of an audit over a census approach to the review of video imagery in fishery monitoring. ICES Journal of Marine Science, 68:1621-1627.
VonWinterfeldt, D., and W. Edwards. 1986. Decision Analysis and Behavioral Research. Cambridge University Press, New York.
Yang, M., F.I. Khan, and R. Sadiq. 2011. Prioritization of environmental issues in offshore oil and gas operations: a hybrid approach using fuzzy inference system and fuzzy analytic hierarchy process. Process Safety and Environmental Protection 89: 22-34.

References
EM/ER Discussion Draft Page 54
Location
Design
Case Study
Proceedings
Tech-nology
Other
Alaska Fisheries Science Center (AFSC). 2007. North Pacific Groundfish Observer Manual. North Pacific Groundfish Observer Program. Seattle, WA. Available: http://www.afsc.noaa.gov/FMA/Manual_pages/MANUAL_pdfs/manual2008.pdf.
Alaska
Y
Alaska Fisheries Science Center (AFSC). 2008. Electronic Fisheries Monitoring Workshop Proceedings. Seattle, WA. July 29‐30, 2008. 55 pp. Available: http://alaskafisheries.noaa.gov/npfmc/PDFdocuments/conservation_issues/EMproceedings.pdf
Alaska
Y
Ames, R. T. 2005. The efficacy of electronic monitoring systems: a case study on the applicability of video technology for longline fisheries management. International Pacific Halibut Commission Scientific Report Number 80. Available: http://www.iphc.int/publications/scirep/SciReport0080.pdf
Alaska, West coast
Y
Ames, R. T., B. M. Leaman, K. L. Ames. 2007. Evaluation of video technology for monitoring of multispecies longline catches. North America Journal of Fisheries Management. 27: 955-964. Available: http://www.tandfonline.com/doi/pdf/10.1577/M06-029.1
Y
Ames, R.T., G.H. Williams, S.M. Fitzgerald. 2005. Using digital video monitoring systems in fisheries: application for monitoring compliance of seabird avoidance devices and seabird mortality in Pacific halibut longline fisheries. U.S. Department of Commerce, NOAA Tech. Memo. In prep. 88 p.
Alaska, West coast
Y
Baker Jr., M. Scott. (Univ. of North Carolina, Sea Grant). 2012. Characterization of Bycatch Associated With the South Atlantic Snapper-Grouper Bandit Fishery With Electronic Video Monitoring, At-Sea Observers and Biological Sampling, Final Report .CRP Contract No. NA09NMF4540138, 101 p. with appendix. CR. Available: https://grunt.sefsc.noaa.gov/P_QryLDS/download/CR927_CRR%20Report_NA09NMF4540138.pdf?id=LDS
South Atlantic Y
Bonney, J., K. McGauley. 2008. Testing the Use of Electronic Monitoring to Quantify At sea Halibut Discards in the Central Gulf of Alaska Rockfish Fishery EFP 07-02 Final Report. Alaska Groundfish Data Bank. Kodiak, AK. 50 p. Available: http://alaskafisheries.noaa.gov/sustainablefisheries/efp/efp07-02_rockfish_rpt.pdf
Alaska Y
Bonney, J., Kingsolving, A., McGauley, K. 2009. Continued assessment of an electronic monitoring system for quantifying at-sea discards in the central Gulf of Alaska rockfish fishery. EFP 08-01 Final Report. Available: http://www.fakr.noaa.gov/npfmc/PDFdocuments/conservation_issues/EM909.pdf
Alaska Y
Bryan, M.J. Ramos, H. McElderry, 2011. Use of an Electronic Monitoring System to Estimate Catch on Groundfish Fixed Gear Vessels in Morro Bay California- Phase II. Unpublished report prepared for The Nature Conservancy by Archipelago Marine Research Ltd., Victoria British Columbia, Canada. 51 p.
West coast Y
Cahalan, J.A. et al. 2010. Bycatch characterization in the Pacific halibut fishery: a field test of electronic monitoring technology. North Pacific Research Board Project Final Report, Project 712, 58 pages. Pacific States Marine Fisheries Commission. Seattle, WA. Available: http://www.afsc.noaa.gov/Publications/AFSC-TM/NOAA-TM-AFSC-213.pdf
Alaska Y
Cahalan, J.A. 2013. Detection of Rare Events Analysis. Pacific States Field Study. 6 p. Pacific States Marine Fisheries Commission. Seattle, WA.
Alaska Y

References
EM/ER Discussion Draft Page 55
Location
Design
Case Study
Proceedings
Technology
Other
Caswell, J.A. Quality assurance, information tracking, and consumer labeling. Marine Pollution Bulletin 53, 650-656 (2006).
Y
Cusick, J., J. LaFargue, G. Parkes. 2003. NMFS Small Boats Workshop. March 18-20, 2003. National Marine Fisheries Service. Seattle, WA. Available: http://www.st.nmfs.noaa.gov/st4/nop/workshops/NMFS_Small_Boats_Workshop_Summary_Report.pdf
West coast Y
Y
Davis, E. S. 2002. Evaluations of the digital observer project and segmentation algorithms for identifying fish with machine vision. Master’s thesis, University of Alaska Fairbanks, Fairbanks, United States. University of Alaska Fairbanks Available: http://www.cs.uaf.edu/public/observer/DigitalObserverMastersProject.doc
Alaska
Y
Evans, R. and Molony, B. 2011. Pilot evaluation of the efficacy of electronic monitoring on a demersal gillnet vessel as an alternative to human observers. Fisheries Research Report No. 221. Department of Fisheries, Western Australia. 20 p. Available: http://www.fish.wa.gov.au/Documents/research_reports/frr221.pdf
Australia Y
Environmental Defense Fund. 2012. Electronic Monitoring: Lessons Learned and Recommendations for Further Development: A Review of EM Pilot Studies Relevant to U.S. Groundfish Fisheries. Available: http://www.pcouncil.org/wp-content/uploads/I4d_SUP_PC2_APR2012BB.pdf
Y
Feehan, Timothy L. (Perot Systems Government Services). 2006. Assessing the Use of Electronic Logbook Reporting For the South Atlantic Snapper Grouper Fishery. CRP Contract No. NA03NMF4540421, 11 p. CR. Available: https://grunt.sefsc.noaa.gov/P_QryLDS/download/CR144_Perot%20System%20Gov%20Services-CRP_%20NA03NMF4540421.pdf?id=LDS
South Atlantic Y
Gilroy, H. L., Geernaert, T. O., Kaimmer, S. M., Williams, G. H., and Trumble, R. J. 2001. A feasibility study that investigates options for monitoring bycatch of the short-tailed Albatross in the Pacific halibut fishery off Alaska. Pacific Halibut Commission. Contract number 40HANF000046.
Alaska
Y
Haist, V. 2008. Alaska Groundfish Data Bank study to evaluate an electronic monitoring program for estimating halibut discards: Statistical analysis of study data. Unpublished report prepared for Marine Conservation Alliance Foundation, Juneau, AK. 28 p. Available: http://www.mcafoundation.org/doc/FINAL_REPORT_EM_Analysis_Halibut_Discards_March_2008_HAIST.pdf
Alaska
Y
Helies, Frank C. and Judy L. Jamison. (Gulf & South Atlantic Fisheries Foundation, Inc.). 2012. Continuation of a Project to Augment the Data Collection of an Electronic Logbook System Used Within the Gulf of Mexico Shrimp Fishery, Final Report .CRP Contract No. NA09NMF4540135, 68 p. CR. Available: https://grunt.sefsc.noaa.gov/P_QryLDS/download/CR926_CRP%20Report_NA09NMF4540135.pdf?id=LDS
Gulf of Mexico Y
Holliday, M. 2013. Electronic Monitoring White Papers (Appendix A-F). Available: http://www.nmfs.noaa.gov/sfa/reg_svcs/Councils/ccc_2013/K_NMFS_EM_WhitePapers.pdf
Y
Jepson, Michael and Judy Jamison (Gulf & South Atlantic Fisheries Foundation Inc.). 2008. A Project to Augment the Data Collection and Development of an Electronic Logbook System Used Within the Gulf of Mexico Shrimp Fishery. CRP Contract No. NA05NMF4540044, 13 p. with appendix. CR. Available: https://grunt.sefsc.noaa.gov/P_QryLDS/download/CR173_NA05NMF4540044.pdf?id=LDS
Gulf of Mexico Y

References
EM/ER Discussion Draft Page 56
Location
Design
Case Study
Proceedings
Technology
Other
Kinsolving, A. 2006. Discussion Paper on Issues Associated with Large Scale Implementation of Video Monitoring. Discussion paper presented at the June, 2006 NPFMC meeting. 15 pp. Available: http://alaskafisheries.noaa.gov/npfmc/PDFdocuments/conservation_issues/VMS606.pdf
Y
Kindt-Larsen, L., E. Kirkegaard, J. Dalskov. 2011. Full documented fishery: a tool to support catch quota management system. ICES Journal of Marine Science. 68(8), 1606-1610. Available: http://icesjms.oxfordjournals.org/content/68/8/1606.full.pdf+html
Denmark Y
Lowman, D. et al. 2013. Fisheries Monitoring Roadmap: A guide to evaluate, design and implement an effective fishery monitoring program that incorporates electronic monitoring and electronic reporting tools. Available: http://www.edf.org/sites/default/files/FisheryMonitoringRoadmap_FINAL.pdf
Y
McElderry et al. 2005. Electronic monitoring of the Cape Cod haddock fishery in the United States – A pilot study. Archipelago Marine Research Ltd., Victoria, BC Canada. Available: http://www.ccchfa.org/documents/Haddock%20EM%20Report%20Final.pdf
New England Y
McElderry, H. 2003. Sustainable Fisheries Management Using Electronic Fisheries Monitoring. Seafood New Zealand. 11(6): 18-19 p.
New Zealand
McElderry, H., D. McCullough, J. Illingworth, and J. Schrader. 2002. Electronic Monitoring for the Shoreside Hake Fishing – A Pilot Study. Northwest Fisheries Science Center, NMFS, Seattle, WA, USA by Archipelago Marine Research Ltd., Victoria, BC, Canada. 23 p.
West coast Y
McElderry, H., J. Schrader, and J. Illingworth. 2003. The efficacy of video-based monitoring for the halibut fishery. Fisheries and Oceans Canada, Research Document 2003/042. Available: http://www.nwr.noaa.gov/publications/nepa/groundfish/bycatch_eis/bycatch-eis-appd.pdf
Canada Y
McElderry, H., J. Schrader, D. McCullough, J. Illingworth, S. Fitzgerald, S. Davis. 2004. Electronic monitoring of seabird interactions with trawl third-wire cables on trawl vessels – a pilot study. U.S. Department of Commerce, NOAA Tech. Memo. NMFS-AFSC-147 39 p.
West coast Y
McElderry, H., R. Reidy, J. Illingworth, and M. Buckley, 2005. Electronic Monitoring for the Kodiak Rockfish Fishery - A Pilot Study. Unpublished report prepared for the Pacific States Marine Fisheries Commission by Archipelago Marine Research Ltd., Victoria British Columbia, Canada, and Digital Observer Inc., Kodiak, Alaska. 43 p.
Alaska Y
McElderry, H., D. McCullough, J. Schrader, J. Illingworth. 2007. Pilot study to test the effectiveness of electronic monitoring in Canterbury fisheries. Department of Conservation. Science and Technical Publishing. Wellington, New Zealand. Available: http://www.conservation.co.nz/documents/science-and-technical/drds264.pdf
New Zealand Y
McElderry, H., R. Reidy, D. Pahti. 2008. A Pilot Study to evaluate the use of electronic monitoring on a Bering Sea groundfish factory trawler. Unpublished report prepared for the Pacific States Marine Fisheries Commission by Archipelago Marine Research Ltd., Victoria British Columbia, Canada, and Digital Observer Inc., Seattle, WA. 32 p.
Alaska Y
McElderry, H., J. Schraeder, T. Wallin, S. Oh. 2008. Trials on F/V Sea Mac To Evaluate the Use of Electronic Monitoring for the Kodiak, AK Rockfish Pilot Program. Unpublished report prepared for Marine Conservation Alliance Foundation, Juneau, AK. 17 pp.
Alaska Y

References
EM/ER Discussion Draft Page 57
Location
Design
Case Study
Proceedings
Technology
Other
McElderry, H., M. Beck, M. J. Pria, S. A. Anderson. 2010. Electronic Monitoring in the New Zealand Inshore Trawl Fishery: A Pilot Study. Unpublished report prepared for the New Zealand Department of Conservation by Archipelago Marine Research Ltd and Lat 37 Ltd., Victoria British Columbia, Canada. 46 p. Available: http://www.doc.govt.nz/documents/science-and-technical/dmcs9entire.pdf
New Zealand Y
McElderry, H., M. J. Pria, M. Dyas, R. McVeigh. 2010. A Pilot Study Using EM In The Hawaiian Longline Fishery. Unpublished report prepared for the Western Pacific Fishery Management Council by Archipelago Marine Research Ltd., Victoria British Columbia, Canada. 35 p.
Hawaii Y
McElderry, H.J.; Schrader, J.; Anderson, S. 2008: Electronic monitoring to assess protected species interactions in New Zealand longline fisheries: a pilot study. New Zealand Aquatic Environment and Biodiversity Report No. 24. Ministry of Fisheries. Wellington, New Zealand. 39 p. Available: http://docs.niwa.co.nz/library/public/NZAEBR24.pdf
New Zealand
Y
MRAG (2004). Fisheries Monitoring Technologies. A project report submitted to the North Pacific Management Council by MRAG Americas, Inc. Tampa, FL. 59 p.
MRAG Americas. 2011. Guiding Principles for Development of Effective Monitoring Programs. Y
National Observer Program Advisory Team (NOPAT). (in prep). Draft Electronic Monitoring White Paper. NMFS Office of Science and Technology, Silver Spring, MD.
Y
National Oceanic and Atmospheric Administration (NOAA). 2007. National Observer Program FY 2006 Annual Report. December, 2007. Available: http://www.st.nmfs.noaa.gov/st4/nop/Outreach/FY2006_NOP_Annual_Report_FINAL.pdf
Y
New England Fishery Management Council. (in prep). Developing Effective Monitoring for the Northeast Multispecies Fishery: Methods and Considerations. Available: http://www.nefmc.org/nemulti/cte_mtg_docs/120530/2012%20monitoring%20white%20paper_120518.pdf
Northeast Y
Northern Economics, Inc. 2011. A Review of Observer and Monitoring Programs in the Northeast, the West Coast, and Alaska. Prepared for Environmental Defense Fund.
West coast
NPFMC (North Pacific Fishery Management Council). 2008. Electronic fisheries monitoring workshop proceedings. Available at: http://www.fakr.noaa.gov/scales/elecmonworkshop_proceedings2008.pdf
Alaska
Y
Pria M.J., H. McElderry, S. Oh, A. Siddall, R. Wehrell, 2008. Use of a Video Electronic Monitoring System to Estimate Catch on Groundfish Fixed Gear Vessels in California: A Pilot Study. Unpublished report prepared for the National Marine Fisheries Service by Archipelago Marine Research Ltd., Victoria British Columbia, Canada. 46 p. Available: http://www.edf.org/sites/default/files/California%20Fixed%20Gear%20EM%20Study%202008.pdf
West coast Y
Pria, M.J., Bryan, J., McElderry, H. 2010. New England Electronic Monitoring Project 2010 Annual Report. Archipelago Marine Research Ltd. August, 2011. 69 p. Available: http://www.nefsc.noaa.gov/fsb/ems/2010_EMS_REPORT_FINAL.pdf
Northeast Y
Pria, M.J., H. McElderry, M. Dyas, P. Wesley. 2008. Using electronic monitoring to estimate reef fish catch on bottom longline vessels in the Gulf of Mexico: A Pilot Study. Available: http://www.nmfs.noaa.gov/by_catch/docs/pria_florida_empilot_oct08.pdf .
Gulf of Mexico Y

References
EM/ER Discussion Draft Page 58
Location
Design
Case Study
Proceedings
Technology
Other
Pria, M.J., McElderry, H., Fedoruk A., McVeigh R. 2012. Estimating Weight and Identifying Species Through Electronic Monitoring (EM): A Preliminary Comparison of Electronic and Observer-based Reporting. Interim Technical Review Option Period I. Available: http://www.pcouncil.org/wp-content/uploads/EMBckgrnd_Obs_Electronic_Comparison.pdf
Y
Regattieri, A., M. Bell, M. Pria, J. Bryan, H. McElderry. 2010. Morro Bay/ Port San Luis Exempted Fishing Permit Electronic Monitoring Pilot Project Progress Report for the Pacific Fisheries Management Council. Available: http://www.pcouncil.org/wp-content/uploads/H4a_ATT3_TNC_EFP_NOV2010BB.pdf
West coast Y
Sommerville, B. 2004. Electronic Monitoring gets Thumbs up. Seafood New Zealand. 12(6). 36-37.
New Zealand Y
Stanley R.D., H. McElderry, T. Mawani, J. Koolman. 2011. The advantages of an audit over a census approach to the review of video imagery in fishery monitoring. ICES Journal of Marine Science. DOI:10.1093/icesjms/fsr058. Available: http://icesjms.oxfordjournals.org/content/early/2011/05/09/icesjms.fsr058.full.pdf+html
Y
Stanley R.D., N. Olsen, A. Fedoruk, 2009. Independent validation of the accuracy of yelloweye rockfish catch estimates from the Canadian groundfish integration pilot project. Marine and Coastal Fisheries: Dynamics, Management, and Ecosystem Science. DOI: 10.1577/C09-005.1. 354–362 p. Available: http://www.bioone.org/doi/pdf/10.1577/C09-005.1
Canada Y
Y
Stanley, R. D., Olsen, N., and Fedoruk, A. 2009. The accuracy of yelloweye rockfish catch estimates from the British Columbia groundfish integration project. Marine and Coastal Fisheries: Dynamics, Management, and Ecosystem Science, 1:354–362 p.
Canada
Stebbins, S., R.J. Trumble, and B. Turris. 2009. Monitoring the Gulf of Mexico commercial reef fish fishery, a review and discussion. Archipelago Marine Research, Ltd., Victoria, BC. 99 p. Available: http://www.archipelago.ca/docs%5CGOM_RF_FisheryReview.pdf
Gulf of Mexico Y
Steinberg, N., G. Sylvia, J. Dresler. 2012. Development of Electronic Fishery Information Systems for West Coast and National Fisheries: Proceedings of Two Workshops. http://hdl.handle.net/1957/33201
West coast
Y
Zollett, E. et al. 2011. Guiding Principles for Development of Effective Monitoring Programs. Report prepared for Environmental Defense Fund. MRAG Americas, Essex, MA. 59 pp. Available: http://blogs.edf.org/edfish/files/2011/05/MRAG-EDF-Guiding-Principles-for-Monitoring-Programs-Final-Final.pdf
Y

Appendix A – List of Terms
EM/ER Discussion Draft Appendix A Page 1
Commercial Groundfish Integration Program (CGIP) - The catch monitoring component provides Fisheries and Oceans Canada with accurate information on harvesting practices, catch composition, and location of fishing. The monitoring component of the program consists of two parts: 100% At Sea Monitoring and the Dockside Monitoring Program. Electronic Data Collection (EDC) – Includes any electronic technology used to enhance fisheries data collection, include electronic reporting and monitoring.
E-Log – Canada’s Pacific Electronic Logbook initiative used for the collection of catch reporting information for Commercial, Recreational and First Nations fisheries.
Electronic monitoring (EM) – The use of technologies – such as vessel monitoring systems or video cameras – to passively monitor fishing operations through observing or tracking. Video monitoring is often referred to as EM.
Electronic reporting (ER) – The use of technologies - such as phones or computers - to record, transmit, receive, and store fishery data.
eVTR – The option to submit the required VTR to the Northeast Regional Administrator via electronic means.
Fisheries information networks (FINs) - Regional co-operative state-federal programs to design, implement and conduct marine fisheries statistics data collection programs and to integrate those data into a single data management system that will meet the needs of fishery managers, scientist, and fishermen.
Fisheries Information System (FIS) – NOAA’s FIS Program delivers fisheries information collection, management, and dissemination solutions to improve accuracy, completeness, timeliness, and accessibility. The Program leverages Federal-State partnerships and investments to provide the information needed to help understand the effects of fishing on living marine resources, and to improve the quality of resource management decisions.
Fisheries Logbook Data Recording Software (FLDRS) - The electronic logbook developed by the Northeast Fisheries Science Center.
Global Positioning System (GPS) - is a space-based satellite navigation system that provides location and time information.
Interagency Electronic Reporting System (IERS) – Alaska’s system for reporting commercial fishery landings. It is used to report landings and/or production data, and is a collaborative effort of the Alaska Department of Fish and Game, the International Pacific Halibut Commission, and NMFS.

Appendix A – List of Terms
EM/ER Discussion Draft Appendix A Page 2
IUU – Illegal, unreported, and unregulated fishing activity.
Logbook – Generally, a paper record of the activities of a vessel at sea, including fishing activities and catch, discard, and crew information. This logbook may serve as the basis for VTR submissions.
Marine Recreational Information Program (MRIP) – NOAA’s MRIP Program is responsible for counting and reporting marine recreational catch and effort.
National Fish and Wildlife Foundation (NFWF) - The National Fish and Wildlife Foundation (NFWF) is a 501(c)(3) non-profit that preserves and restores our nation’s native wildlife species and habitats.
National Observer Program (NOP) – NOAA’s NOP seeks to support observer programs and increase their usefulness to the overall goals of NMFS. Improvements in data collection, observer training, and the integration of observer data with other research are among the important issues that the NOP works to achieve on a national level.
Standard Atlantic Fisheries Information System (SAFIS) - A real-time, web-based reporting system for commercial landings on the Atlantic coast.
Trip Ticket – Specific to the Northwest and the Southeast regions. Trip tickets are used in the Gulf of Mexico states to allow seafood dealers to electronically report commercial seafood landings.
Vessel Monitoring System (VMS) – VMS allows the tracking of commercial fishing vessels, including their position, time at position, course, and speed.
Vessel trip report (VTR) –Specific to the Northeast region, reporting regulations require that the owner or operator of any vessel issued a permit for any of the species listed below submit an accurate fishing log report detailing the fishing activity for each trip, regardless of species fished for or taken and regardless of the area fished, on forms supplied by or approved by the Regional Administrator. If no fishing trip is made during a month, a report stating so must be submitted. Vessel trips must be reported on National Marine Fisheries Service approved forms or approved methods of reporting. These reports are called vessel trip reports.

Appendix B1. Summary of fishery-dependent Electronic Vessel Reporting and E-Logbooks
EM/ER Discussion Draft Appendix B1 Page 1
Region System(s) Name FMPs supported Fishery/Species Gear Cost IT Infrastructure Comments
ACCSP SAFIS: eTrips; eLogbooks State fisheries
Commercial, charter/party, and recreational
Hook gear (anglers) ND
Web based, secure transmission, oracle database
SAFIS is a unified reporting system deployed on the Atlantic Coast used by state vessels in most NE and Mid-Atlantic states and includes the following applications:
eTRIPS - allows fishermen to view their own data-of-record with confidential access, protecting personal information; provides fishermen an online form that satisfies multiple state and federal reporting requirements; offers some limited bio-samples from the recreational fisheries.
eLogbooks - a web-based application that collects data from private recreational anglers on a voluntary basis.

Appendix B1. Summary of fishery-dependent Electronic Vessel Reporting and E-Logbooks
EM/ER Discussion Draft Appendix B1 Page 2
Northeast
eVTR -- Fisheries Logbook Data Recording System (FLDRS); Study Fleet -- Fisheries Logbook Data Recording System; eVTR -- Vessel Electronic Reporting System,
All All All ND Web based, secure transmission through email, oracle database
e-reporting is optional to the mandatory paper reporting
About 80-90% of NE landings volume comes through systems that the NER has created or supports.
Southeast GoMex Snapper/Grouper IFQ system
Gulf of Mexico Reef Fish
Gulf of Mexico IFQ fishermen and permitted dealers
ND
$235k to develop; $150K to maintain
PC based, any browser, Adobe Flash;
Postgres SQL database
Southwest
Electronic Troll and Baitboat Logbook;
Electronic Troll and Baitboat Logbook (FLDRS);
South Pacific Tuna Treaty purse seine fishery logbook and port fish size sampling
HMS and Treaties relating to HMS
South and North Pacific Troll;
North Pacific Baitboat; Commercial;
U.S. South Pacific Tuna Treaty purse seine
Troll, baitboat,and purse seine
$0-50k to develop
$0-20K to deploy
Vessel PC transmits data via email or CD in the mail;
Access, Oracle, and Excel databases

Appendix B1. Summary of fishery-dependent Electronic Vessel Reporting and E-Logbooks
EM/ER Discussion Draft Appendix B1 Page 3
Northwest
Pacific Coast Groundfish Quota Share/Vessel Account Balance System
Pacific Coast groundfish
Commercial IFQ Trawl Sector; and all groundfish
ND
Over $1M to develop;
$450K to maintain
Fishermen use pc’s to manage their vessel accounts and quota share accounts.
Personnel are mixture of NWFSC employees (full or part time) and number of contractors. Excludes NMFS Region staff who oversee the entire program. Upcoming projects in support of the NW IFQ program is to develop an online system for reporting ownership and changes in ownership for the various IFQ related permits. Current system provides public reports on permits.
Alaska eLandings - Interagency Electronic Reporting System
BSAI Groundfish FMP; GOA Groundfish FMP; Crab FMP; Salmon FMP
All state and federally managed groundfish fisheries; all halibut and sablefish IFQ fisheries; all rationalized crab fisheries; several state managed crab fisheries; and 50% of all state managed salmon fisheries (implementation in progress); no recreational;
All gear types
$1M to develop; $300k to maintain, includes travel for training, server hosting, licenses, etc. Does not include help desk support.
Web based online forms, web service XML submission; email XML submission; desktop applications for at-sea vessels via email transmission; desktop applications for tender vessels using a jump drive transfer, data are transmitted via ftp or email to oracle database
IFQ, rationalized crab, and halibut sablefish cost recovery provides funding support for a portion of the costs of maintaining elandings
2011 - At-Sea Production Reports: 17,856; Shoreside Production Reports: 10,756; Groundfish Landings Reports (excluding halibut): 15,008; Groundfish Landings Reports with IFQ halibut: 6,654; Rationalized Crab Landing Reports: 1,430; Non-Rationalized Crab Landings Repots: 618; Salmon Landing Reports: 23,887; Groundfish Logbooks: 17.

Appendix B1. Summary of fishery-dependent Electronic Vessel Reporting and E-Logbooks
EM/ER Discussion Draft Appendix B1 Page 4
Pacific Islands
HDAR and WPacFIN Web-Based Reporting for Hawaii Commercial Fishermen
All HI-based FEPs
Commercial sector ND ND Data are entered via a secure website
ND – No data; ACCSP – Atlantic Coastal Cooperative Statistics Program; SAFIS – South Atlantic Fishery Information System; IFQ – Individual Fishing Quota; HDAR – Hawaii Division of Aquatic Resources; WPacFIN – Western Pacific Fishery Information Network

Appendix B2. Summary of fishery-dependent Electronic Dealer trip reports
EM/ER Discussion Draft Appendix B2 Page 1
Region System(s) Name FMPs
supported Fishery/ Species
Gear Cost IT Infrastructure Comments
ACCSP SAFIS: eDR State fisheries Commercial All ND
Web based, secure transmission, oracle database
eDR allows dealers to view their own data-of-record with confidential access, protecting personal information; provides dealers an online form that satisfies multiple state and federal reporting requirements, and dealers have the option to upload electronic files in lieu of data entry. Near real time quota monitoring is possible for partners that utilize the system for 100% of landings.
Northeast
Dealer Electronic Reporting File Upload, Dealer Electronic Reporting (Bluefin Data L.L.C.), Surf Clam / Ocean Quahog File Upload System
All All All ND Web based (HTTPs) , sFTP, oracle database
e-reporting by federally permitted seafood dealers is mandatory
Southeast
SE Electronic Trip Ticket; GoMex Snapper/Grouper IFQ system
SA snapper/grouper, SA golden crab, Gulf reef fish, Coastal Migratory Pelagic
Commercial sector only; Holder of snapper/grouper, reef fish, golden crab dealer permit or dealer buying king or Spanish mackerel; Gulf of Mexico IFQ fishermen and permitted dealers
ND
$200-235K to develop; $100-150K to maintain
PC based, any browser, Adobe Flash; Postgres SQL database
Includes NC-TX. SC and GA were developed separately from FL-TX during 2010. Systems were developed for states and then utilized by NMFS. Costs for development are for initial development to meet state requirements.
Southwest No dealer reporting at this time
Northwest Electronic Fish Ticket System;
Pacific coast groundfish
Commercial IFQ Trawl
Trawl and fixed gear
$700k to develop
Fish Ticket Data are transmitted over the
Personnel are mixture of PSMFC employees (full or part time) and number of

Appendix B2. Summary of fishery-dependent Electronic Dealer trip reports
EM/ER Discussion Draft Appendix B2 Page 2
Region System(s) Name FMPs
supported Fishery/ Species
Gear Cost IT Infrastructure Comments
IFQ Catch Monitor System
Sector (due to provision that allows gear switching, IFQ trawl sector participants can use trawl or fixed gear to fish their trawl allocations)
who participate in the IFQ system
(includes cost of catch monitor system); $100k to maintain (includes fish ticket and catch monitoring system, combined)
web to an Oracle database; IFQ system uses specially designed software on a notebook p.c.
contractors; E tix system actually began in 2007 in with the Pacific whiting fishery. Costs presented reflect expansion to IFQ fishery and working with states. Oregon will use e-tix in lieu of paper tickets. Expectation is that Washington will follow suit.
Alaska
eLandings - Interagency Electronic Reporting System
BSAI Groundfish FMP; GOA Groundfish FMP; Crab FMP; Salmon FMP
All state and federally managed groundfish fisheries; all halibut and sablefish IFQ fisheries; all rationalized crab fisheries; several state managed crab fisheries; and 50% of all state managed salmon fisheries (implementation in progress); no recreational;
All gear types
$1M to develop; $300k to maintain, includes travel for training, server hosting, licenses, etc., but does not include help desk support.
Web based online forms, web service XML submission; email XML submission; desktop applications for at-sea vessels via email transmission; desktop applications for tender vessels using a jump drive transfer, data are transmitted via ftp or email to oracle database
IFQ, rationalized crab, and halibut sablefish cost recovery provides funding support for a portion of the costs of maintaining elandings 2011 - At-Sea Production Reports: 17,856; Shoreside Production Reports: 10,756; Groundfish Landings Reports (excluding halibut): 15,008; Groundfish Landings Reports with IFQ halibut: 6,654; Rationalized Crab Landing Reports: 1,430; Non-Rationalized Crab Landings Repots: 618; Salmon Landing Reports: 23,887; Groundfish Logbooks: 17.
Pacific Islands
HDAR and WPacFIN HI Web Based Dealer Reporting System
All HI-based FEPs
Commercial sector
ND ND Data are entered via Excel on a p.c. and transmitted via email
HMS eDealer (currently 2006 Atlantic sharks, All $676,000 to Dealer data are All HMS dealers must report non-bluefin tuna HMS purchases electronically as of
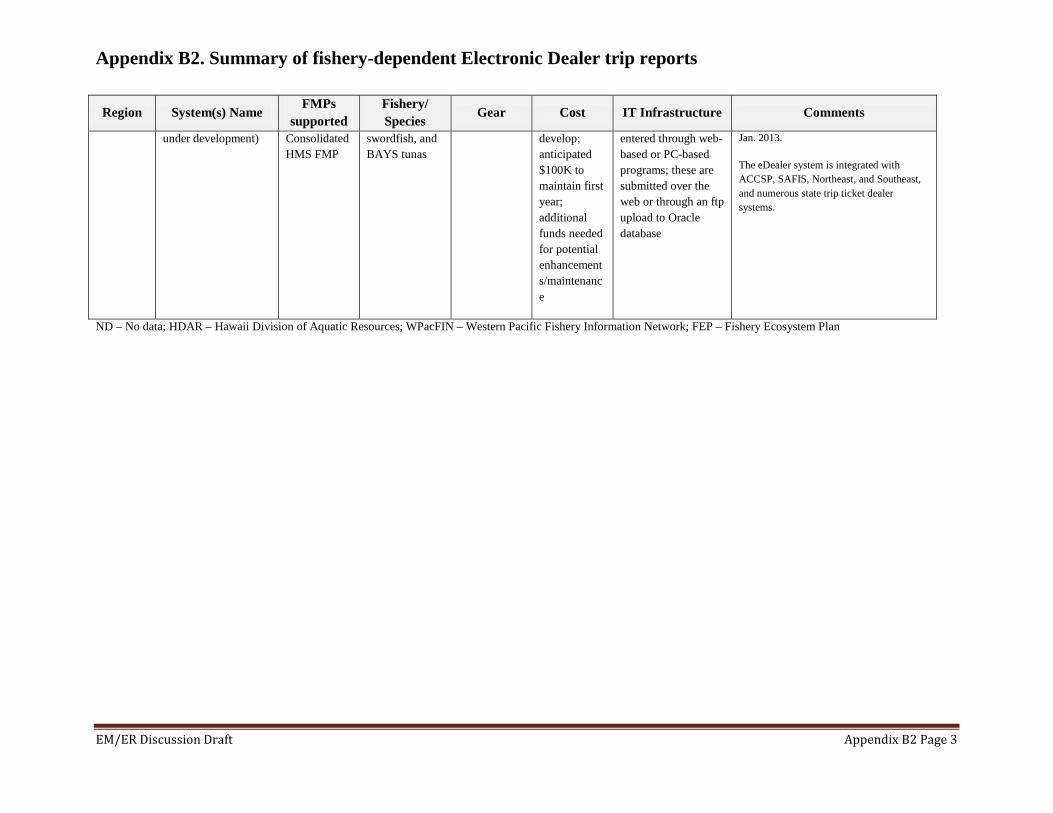
Appendix B2. Summary of fishery-dependent Electronic Dealer trip reports
EM/ER Discussion Draft Appendix B2 Page 3
Region System(s) Name FMPs
supported Fishery/ Species
Gear Cost IT Infrastructure Comments
under development) Consolidated HMS FMP
swordfish, and BAYS tunas
develop; anticipated $100K to maintain first year; additional funds needed for potential enhancements/maintenance
entered through web-based or PC-based programs; these are submitted over the web or through an ftp upload to Oracle database
Jan. 2013.
The eDealer system is integrated with ACCSP, SAFIS, Northeast, and Southeast, and numerous state trip ticket dealer systems.
ND – No data; HDAR – Hawaii Division of Aquatic Resources; WPacFIN – Western Pacific Fishery Information Network; FEP – Fishery Ecosystem Plan

Appendix B.3 Summary of Electronic Video Monitoring Projects in U.S. Fisheries
EM/ER Discussion Draft Appendix B3 Page 1
Region Year Objective/Purpose Fishery/Species Gear Project Type Vessels/Sea
Days Cost Alaska
2002 Protected Species/Seabirds Halibut Longline Pilot 2/120
2002 Protected Species Groundfish Factory Trawl Pilot 5/22
2002 Protected Species Halibut Longline Pilot 2/90
2004 Catch monitoring Halibut Longline Pilot 3/120
2005 Discard monitoring Rockfish Trawl Pilot 10/38
2005 Bin Monitoring Groundfish Factory Trawl Pilot 1/14
2007 Bin Monitoring Groundfish Factory Trawl Pilot 4/328 $42,690
2007 Compliance Bin Monitoring Groundfish Factory Trawl Implemented – Amendment 80 11/11,177
2007 Bycatch monitoring Halibut Longline Pilot 4/13
2007 Discard monitoring Rockfish Trawl Pilot - Phase 1 1/14
2008 Discard monitoring Rockfish Trawl Pilot - Phase 2 4/104 $108,380
2010 Discard monitoring Rockfish Trawl Automated Video Analysis 5/118 $77,830
2011 Compliance Monitoring – sorting of prohibited species Groundfish Trawl Implemented - Amendment 91 20/2,605
2013 Compliance Monitoring Flow Scale Pacific Cod Longline Implement – 50 CFR Part 679 20
2013 Catch and Bycatch estimation Halibut/Sablefish Longline
Develop performance standards n/a $100K
2013 EM Infrastructure Development All Fisheries All Gears
Dev. Data Mgt. Sys. and Image Process. Sys. n/a $75K
2013 Binocular Vision Estimation Any Fishery Any Gear Camera Prototype n/a $15K
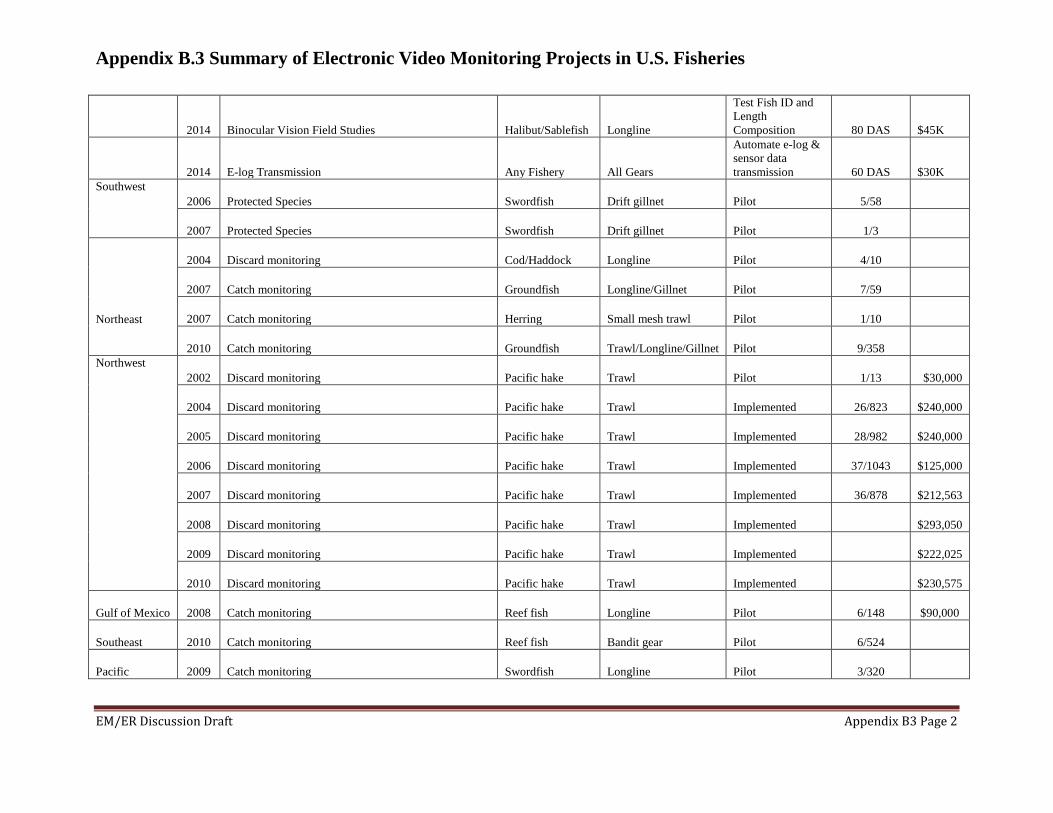
Appendix B.3 Summary of Electronic Video Monitoring Projects in U.S. Fisheries
EM/ER Discussion Draft Appendix B3 Page 2
2014 Binocular Vision Field Studies Halibut/Sablefish Longline
Test Fish ID and Length Composition 80 DAS $45K
2014 E-log Transmission Any Fishery All Gears
Automate e-log & sensor data transmission 60 DAS $30K
Southwest 2006 Protected Species Swordfish Drift gillnet Pilot 5/58
2007 Protected Species Swordfish Drift gillnet Pilot 1/3
Northeast
2004 Discard monitoring Cod/Haddock Longline Pilot 4/10
2007 Catch monitoring Groundfish Longline/Gillnet Pilot 7/59
2007 Catch monitoring Herring Small mesh trawl Pilot 1/10
2010 Catch monitoring Groundfish Trawl/Longline/Gillnet Pilot 9/358 Northwest 2002 Discard monitoring Pacific hake Trawl Pilot 1/13 $30,000
2004 Discard monitoring Pacific hake Trawl Implemented 26/823 $240,000
2005 Discard monitoring Pacific hake Trawl Implemented 28/982 $240,000
2006 Discard monitoring Pacific hake Trawl Implemented 37/1043 $125,000
2007 Discard monitoring Pacific hake Trawl Implemented 36/878 $212,563
2008 Discard monitoring Pacific hake Trawl Implemented $293,050
2009 Discard monitoring Pacific hake Trawl Implemented $222,025
2010 Discard monitoring Pacific hake Trawl Implemented $230,575
Gulf of Mexico 2008 Catch monitoring Reef fish Longline Pilot 6/148 $90,000
Southeast 2010 Catch monitoring Reef fish Bandit gear Pilot 6/524
Pacific 2009 Catch monitoring Swordfish Longline Pilot 3/320

Appendix B.4. Other Existing EM/ER Technologies
EM/ER Discussion Draft Appendix B4 Page 1
Region Fishery/Observer Program EM type EM Activity Details Critical
need Status
Alaska North Pacific Groundfish Observer Program
At sea data entry & transmission
ATLAS software used to allow observers to enter catch and sample information used for near real time fisheries management. Able to transmit data using a variety of methods (1998 first deployed). Details available upon Request.
At sea data transmission Implemented
Scales Motion compensated scales to weigh total catch aboard factory trawlers and crab catcher processors.
Catch Weight Implemented
Scales Motion compensated scales used to allow observers to weigh samples
Catch Weight Implemented
Scales Motion compensated scales used to weigh only Pacific Cod aboard factory longliners (2011). Details available upon request.
Catch Weight In Progress
Southeast Pelagic longline observer program, Southeast Shark Driftnet and Shark Bottom Longline Observer Program, Shrimp and Reef Fish Observer Programs
PIT tags Passive Integrated Transponder (PIT) Tag readers to scan sea turtles for existing tags.
Monitor Discard
Implemented
Satellite phones
Satellite phones capable of data transmission although not used to date. Details available upon request.
Data Transmission
In Progress
Northeast Northeast Fisheries Observer Program
iPAQ OBSCON and Special Access Program (SAP) Reporting,PDA
Handheld PDA with a data entry program using Microsoft Mobile 5.0 Operating System and secure upload website using Wi-Fi or ActiveSync, to provide accurate and timely observer trip summary and catch information of Species of Concern within 24 hours of landing. Used to examine seaday accomplishments and provide data for quota estimates for the Northeast Regional Office. Details available upon request. Data Entry Program (ObsCon) using Microsoft Mobile 5.0 Operating System and secure upload website using Wi-Fi or ActiveSync, provide accurate and timely observed trip summary information and SAP Species of Concern weights of kept and discarded within 24 hours of landing for seaday accomplishments and SAP data to the Northeast Regional Office for Total

Appendix B.4. Other Existing EM/ER Technologies
EM/ER Discussion Draft Appendix B4 Page 2
Allowable Catch and bycatch monitoring.
Electronic Data Entry at Sea (EDES)GPS, computer
Collection of observer data electronically at sea, replacing paper data collection. Uses rugged laptops, Windows XP operating system, C# (data entry screens), My SQL (database conversion), GPS (haul locations), secure upload website, barcode scanner (samples/age structures), and digital cameras integrated into entry screens. Details available upon request.
Cooperative Research Study Fleet Project; GPS, computer
The NEFSC is conducting a Study Fleet cooperative research project that includes research and development of an electronic laptop program to collect tow-by-tow self-reported catch data including kept and discarded components. The system supports the collection of sub-trip composite records that included all of the Northeast data elements in the existing vessel trip reporting (VTR) requirements for permitted vessels and can track effort on a tow-by-tow basis, are integrated with vessel GPS and VMS systems and include a TD probe fixed to trawl doors. Details and demonstration available upon request.
Marel Scale Pilot Project; Digital, motion-compensated scales
The NEFOP is in the field testing phase of the Marel scales. The scales have been tested and compared to the hand-held spring scales, now they are being field tested prior to a more broad scale implementation.
More accurate catch weights
In Progress
Southwest Southwest Observer Program; California/Oregon drift gillnet fishery
Electronic observer forms; PDA
Using an Allegro PC, HP iPAQ handheld PDA, and Hagloff-Mantax digitech electronic calipers in California/Oregon drift gillnet fishery to collect observer data.
PacFIN/FIS Electronic calipers
Electronic calipers in albacore port sampling program
Pacific Islands Region
NMFS Longline Observer Program
PDA Proposed project testing the use of Trimble Nomad hand held collection units as a tool to gather at sea data. After testing this using our data forms, it was not practical to continuing with this device.
data transmission
canceled- we have decided
to explore other data collection options

Appendix B.4. Other Existing EM/ER Technologies
EM/ER Discussion Draft Appendix B4 Page 3
HQ Fisheries Scientific Computing System (FSCS)
Computer This system will enable research scientists and/or observers to capture and store environmental, gear performance, and biological data from survey or commercial fishing operations using any gear type for integration and validation into a quality-controlled Oracle database in near real time. Details available upon request.
In Progress
Atlantic Highly Migratory Species
PIT tags PIT Tags used when requested for shark display permits (also use dart tags). Aids in enforcement. Pop-up satellite archive tags (PSAT) used for HMS. Research on migrations and habitat use.
Northwest West Coast Groundfish Observer Program
Database Oracle apex database that uses Oracle express installation, and web-services to transport xml data back to main oracle enterprise server. Data can be entered via a web-based GUI or via a client application on netbooks which then transmit data via broadband cards.
Catch Data and near-real time reporting
Oracle database:
implemented
Scales Motion compensated scales used aboard West Coast Trawl Catch Share vessels
Catch Weight
Implemented
PIT tag readers Pit tag readers used to scan green sturgeon for existing tags.
ESA Implemented
Computer Netbooks, with broadband cards, using Oracle Apex client for data entry at-sea. Data can be transmitted once observer is in range of network which allows near real-time reporting.
Catch data and near real-time reporting
Netbooks: implemented
Client application:
Development Coded wire tag wands
Wands used to scan salmon for coded wire tags.
ESA Implemented
Satellite phones
Satellite phones are used to report catch over specified weight to observer program.
Data transmission
Implemented