Discrimination between Fatigue Cracking and Mechanical ... · PDF fileUNCLASSIFIED...
44
UNCLASSIFIED UNCLASSIFIED Discrimination between Fatigue Cracking and Mechanical Damage in Aircraft Fastener Holes by Eddy- Current Phase Rotation M E Ibrahim, G D Surtees 1 , G R Hugo, H J Morton 1 and S K Burke Maritime Division 1 Aerospace Division Defence Science and Technology Group DST-Group-TR-3289 ABSTRACT Fatigue cracking in metallic aircraft structure often originates at fastener holes and can be detected using the nondestructive inspection technique of bolt-hole eddy-current (BHEC) testing. BHEC testing is based on detection of a disturbance in the induced current or magnetic field caused by a surface-breaking crack in the bore of the hole. However, if the surface of the hole contains benign mechanical damage or superficial scoring, false positives can be produced leading to potentially unnecessary maintenance on a hole that is otherwise sound. In principle, analysis of the phase of the eddy-current response can assist in distinguishing fatigue cracking from such mechanical damage. In the present work, a systematic BHEC and fractographic study has been conducted by inspecting several hundred fastener holes in ex-service F/A-18 aircraft bulkheads, following fatigue testing. The results demonstrate that measurement of the relative phase of the eddy-current response provides additional information which can assist in discrimination between genuine cracks and mechanical damage. RELEASE LIMITATION Approved for public release
Transcript of Discrimination between Fatigue Cracking and Mechanical ... · PDF fileUNCLASSIFIED...

UNCLASSIFIED
UNCLASSIFIED
Discrimination between Fatigue Cracking and Mechanical Damage in Aircraft Fastener Holes by Eddy-
Current Phase Rotation
M E Ibrahim, G D Surtees1, G R Hugo, H J Morton1 and S K Burke
Maritime Division 1Aerospace Division
Defence Science and Technology Group
DST-Group-TR-3289
ABSTRACT Fatigue cracking in metallic aircraft structure often originates at fastener holes and can be detected using the nondestructive inspection technique of bolt-hole eddy-current (BHEC) testing. BHEC testing is based on detection of a disturbance in the induced current or magnetic field caused by a surface-breaking crack in the bore of the hole. However, if the surface of the hole contains benign mechanical damage or superficial scoring, false positives can be produced leading to potentially unnecessary maintenance on a hole that is otherwise sound. In principle, analysis of the phase of the eddy-current response can assist in distinguishing fatigue cracking from such mechanical damage. In the present work, a systematic BHEC and fractographic study has been conducted by inspecting several hundred fastener holes in ex-service F/A-18 aircraft bulkheads, following fatigue testing. The results demonstrate that measurement of the relative phase of the eddy-current response provides additional information which can assist in discrimination between genuine cracks and mechanical damage.
RELEASE LIMITATION
Approved for public release

UNCLASSIFIED
UNCLASSIFIED
Published by Maritime Division Defence Science and Technology Group 506 Lorimer St Fishermans Bend, Victoria 3207 Australia Telephone: 1300 333 362 Fax: (03) 9626 7999 © Commonwealth of Australia 2016 AR-016-677 August 2016
APPROVED FOR PUBLIC RELEASE

UNCLASSIFIED
UNCLASSIFIED
Discrimination between Fatigue Cracking and
Mechanical Damage in Aircraft Fastener Holes by Eddy-Current Phase Rotation
Executive Summary
Bolt-Hole Eddy Current (BHEC) testing is a nondestructive inspection (NDI) technique used for the detection of surface-breaking cracks occurring in fastener holes in metallic aircraft structure. The technique involves the removal of fasteners and the insertion of a rotating spindle containing an eddy-current coil into the hole. The eddy-current coil scans the bore surface of the hole as the spindle rotates. The coil is excited by an alternating current with frequencies typically 100 kHz – 2 MHz and cracks within the hole are detected via the induced currents and fields produced by coil. If a defect is detected, the hole is typically ‘oversized’ via machining with a larger diameter drill to remove the discontinuity. A matching fastener is then inserted into the larger-diameter hole. BHEC has been in active use for several decades and finds significant application in the Royal Australian Air Force (RAAF) fleet. A difficulty can arise if the hole is free of cracking but instead contains mechanical damage such as gouges, heavy scoring or surface roughness. These discontinuities may be benign in terms of structural integrity, but disturb the induced field and currents, resulting in a change in coil impedance that is erroneously assumed to be cracking. These false positives can lead to unnecessary oversizing in the cases where the mechanical damage does not pose a structural risk to the aircraft. The presence of mechanical damage also places an artificial limit on the defect reporting threshold and consequently may reduce the achievable inspection reliability. A given hole may only be oversized a number of times, due to geometry limitations such as the distance from other holes or component edges, and this unscheduled maintenance also adds a logistics, cost and time burden, so it is desirable to avoid unnecessary maintenance by attempting to discriminate between fatigue cracks and mechanical damage. Analysis of the phase rotation of the eddy-current defect signal has been suggested as a method for discriminating between cracking and mechanical damage. This technique is employed informally by NDI technicians, and in some cases is referred to explicitly in aircraft maintenance standards. However, it has not been the subject of any formal studies published in the open literature. The absence of such published studies has prompted the program of work reported here. In the present study, a systematic BHEC and fractographic study was conducted by inspecting several hundred fastener holes in ex-service F/A-18 aircraft bulkheads, following fatigue testing. During the course of the work a total of 365 eddy-current
UNCLASSIFIED
UNCLASSIFIED
defect indications were recorded and the eddy-current phase rotation was used to provisionally classify the defects as either possible cracking or possible mechanical damage. A large sample of the inspected holes were subsequently broken open and 165 of the defects were examined using fractography to determine the nature of the defect: whether mechanical damage or cracking. The results demonstrate that measurement of the relative phase of the eddy-current response provides additional information which can assist in discrimination between the BHEC responses from genuine cracks and mechanical damage. The data also illustrate the burden imposed on the BHEC inspection process by mechanical damage, with of the order of 30% of defect indications arising solely from damage in this case. The use of BHEC phase rotation has the potential to improve inspection reliability, increase accuracy of estimates of the fatigue crack population in an aircraft fleet, and reduce unnecessary over-sizing of holes in aircraft structure. There is however a clear risk to structural integrity if a defect is incorrectly identified and a crack is mistakenly assumed to be benign mechanical damage and left in place. Assessment of this risk and formulation of a framework for aircraft structural management which incorporates both imperfect defect detection and imperfect defect classification, together with associated confidence levels, would require a formal probability-of-detection trial and NDI reliability study. BHEC phase discrimination is clearly a useful tool and we recommend that the significance of the technique and its limitations should be introduced to RAAF eddy-current inspector training to assist in defect classification and to broaden the understanding of the BHEC techniques.

UNCLASSIFIED
UNCLASSIFIED
Authors
Matthew Ibrahim Maritime Division Matthew is the Technical Lead for nondestructive inspection of Aircraft Structures at DST Group. He has over 15 years’ experience in nondestructive evaluation research using ultrasonics and electromagnetic methods on a variety of Air and Maritime materials and structures. He has a BSc in materials science and physics, and an MSc in theoretical and experimental NDE from Monash University.
____________________ ________________________________________________
Gregory Surtees Aerospace Division Greg is a Level 3 NDI technician with over 30 years’ experience in the Industrial, Aerospace, Land and Maritime environments, using the key NDI technologies of ultrasonics, eddy-current testing, radiography, dye-penetrant, and magnetic-particle testing. His qualifications are recognised by the National Aerospace NDT board of Australia (standards EN4179, NAS 410).
____________________ ________________________________________________ Geoffrey Hugo Maritime Division Geoff is Group Leader Corrosion Science within Maritime Division. He has previously led research programs in advanced NDE for aircraft applications. Geoff has BSc and BE degrees, and a PhD from Monash University, and is a former Australian National Leader for The Technical Cooperation Program Materials Group Technical Panel on Nondestructive Characterisation and Materials State Awareness.
____________________ ________________________________________________

UNCLASSIFIED
UNCLASSIFIED
Howard Morton Aerospace Division Howard is a Level 3 technician for nondestructive testing & inspection of aircraft components and structures with several decades experience in nondestructive evaluation using a variety of techniques. His NDT qualifications are recognised by the National Aerospace NDT board of Australia (standards EN4179, NAS 410). Howard retired from the DST Group in 2014.
____________________ ________________________________________________
Stephen Burke Maritime Division Steve is Group Leader Acoustic Material Systems within Maritime Division and Task Leader for AIR 07/101 Assessment and Control of Aircraft Materials Degradation. He has carried out research in electromagnetic nondestructive evaluation for several decades. He was awarded a BSc (Hons) from Monash University, and a PhD from Imperial College, London. In 2014, Steve received the Minister’s Award for Achievement in Defence Science for his contributions to NDI and structural integrity.
____________________ ________________________________________________
UNCLASSIFIED DST-Group-TR-3289
UNCLASSIFIED
Contents
1. INTRODUCTION ............................................................................................................... 1 1.1 Discrimination of Fatigue Cracking from Mechanical Damage ...................... 1
2. NONDESTRUCTIVE INSPECTION OF FASTENER HOLES .................................. 2 2.1 Fatigue Cracking and Mechanical Damage in Fastener Holes ......................... 2 2.2 Rotating Bolthole Eddy-Current Inspection ........................................................ 3 2.3 Interpretation of Eddy-Current Data .................................................................... 5
2.3.1 Defect Size and Signal Amplitude ........................................................ 5 2.3.2 Detection of Mechanical Damage through Phase Rotation ............... 5
3. PREPARATION OF REPRESENTATIVE TEST SPECIMENS .................................. 6
4. EXPERIMENTAL PROCEDURE ...................................................................................... 8 4.1 Bolt Hole Eddy Current Inspection Procedure .................................................... 8
4.1.1 Calibration on Machined Slots .............................................................. 8 4.1.2 Inspection for fatigue cracks and fastener hole damage .................... 8
5. RESULTS OF BHEC INSPECTION ................................................................................ 9 5.1 Discrimination of Suspected Mechanical Damage .......................................... 10 5.2 Phase Rotation Histogram ..................................................................................... 11
6. FRACTOGRAPHY ............................................................................................................ 12 6.1 Data Trends for Various Crack Types ................................................................ 13 6.2 Fractography Comparison with BHEC Indications .......................................... 15 6.3 Example Fractographs ............................................................................................ 16
7. THEORY AND MODELLING........................................................................................ 22
8. TIME-GATED PHASE ANALYSIS ............................................................................... 27
9. DISCUSSION .................................................................................................................... 28
10. CONCLUSIONS AND RECOMMENDATIONS ....................................................... 31
11. REFERENCES .................................................................................................................... 33
APPENDIX A: FRACTOGRAPHIC DATA .................................................................... 34

UNCLASSIFIED DST-Group-TR-3289
UNCLASSIFIED
Abbreviations
Ampl Signal Amplitude aNDI Minimum reliably detectable defect size BHEC Bolthole Eddy-Current Testing COTS Commercial Off-The-Shelf DGTA-ADF Directorate General Technical Airworthiness – Australian Defence
Force DST Group Defence Science and Technology Group, formerly DSTO (Defence
Science and Technology Organisation) EDM Electrodischarge machining FSH Full Screen Height on an eddy-current instrument IVD Ion Vapour Deposition NDT/I/E Nondestructive Testing/Inspection/Evaluation POD Probability of Detection RAAF Royal Australian Air Force δ Electromagnetic skin depth, standard depth of penetration ∆u Opening width of a surface-breaking planar defect (crack, scoring or
gouge) θ Phase Rotation Angle

UNCLASSIFIED DST-Group-TR-3289
UNCLASSIFIED 1
1. Introduction
Detection and remediation of fatigue cracking in metallic aircraft structures is a key consideration for the safe ongoing operation of aircraft. Military aircraft experience high cyclic loads, often resulting in the initiation of fatigue cracks at regions of stress concentration. Unchecked, these cracks pose a severe risk to flight safety. Typically, stress concentrations occur at the many thousands of fastener holes that are drilled into wing skin planks and auxiliary structure. Fatigue cracks may then initiate and grow between adjacent holes, eventually traversing an entire wing plank, or the underlying spars and ribs. For aircraft managed using a safety-by-inspection airworthiness philosophy, the early detection and characterisation of cracks in fastener holes is a major focus of a rigorous, targeted nondestructive inspection (NDI) regime to ensure the continued airworthiness of the airframe. These inspections require the removal of fasteners and cleaning of the fastener holes, supplemented by light honing if permitted. If small cracks are detected, it is often possible to remove them by ‘oversizing’ the hole, i.e. drilling out the hole with a slightly larger diameter bore, thereby removing the fatigue cracking. The existing fastener is then replaced to match the increased bore size. Bolthole eddy-current (BHEC) testing is a reliable and effective NDI technique for the detection of surface-breaking cracks in fastener holes. It has been employed extensively in the aerospace industry for several decades, and is widely used within the Royal Australian Air Force (RAAF) fleet. The minimum reliably detectable crack size aNDI for BHEC of Al alloys is of the order of 1 mm depth for quadrant cracks at the corner of the holes and 1.5 mm long × 0.5 mm deep for cracks in the bore of the hole. During routine BHEC inspection, the condition of the fastener holes inspected is often sub-optimal due to scratching, scoring and mechanical damage resulting from the removal of the interference-fit fasteners or out-of-round hole geometry. These imperfections can lead to either (i) a high degree of ‘noise’ on the signal [1,2], or (ii) a large number of false positive defect indications which must then be remediated together with any holes containing cracks to avoid the risk of leaving any fatigue damage in the structure. Holes may be oversized a maximum of two or three times, depending on their location and the status of surrounding holes, before no further material can be removed. Thus, it is desirable to eliminate unnecessary oversizing of fastener holes.
1.1 Discrimination of Fatigue Cracking from Mechanical Damage The literature on BHEC inspection obtains a number of recommendations for minimising unwanted signals due to superficial mechanical damage and hole out-of-roundness. LaCivita et al. [3] and subsequently Brausch et al. [4] suggest that a careful choice of bandpass filters can be used to minimise such noise. The use of band-pass filters exploits the difference in spatial frequency for signals due to cracking and the more slowly varying signals due to mechanical damage or out-of-roundness to minimize the noise signal.

UNCLASSIFIED DST-Group-TR-3289
UNCLASSIFIED 2
LaCivita et al. [3] also observed that there is a difference in phase between the signals due to mechanical damage compared with cracks and suggested that this phase difference could be used to discriminate between the two. This approach, while used as an informal means of defect discrimination by eddy-current inspectors, does not appear to have been the subject of any formal studies published in the open literature. The absence of such studies limits the ability of RAAF to acknowledge the potential use of the phase rotation technique to assist in defect discrimination and has prompted the program of work reported here. In the present study, we report the results of a systematic BHEC and fractographic study to investigate the use of phase rotation to discriminate between cracking and mechanical damage in fastener holes. The study is based on BHEC inspections of several hundred fastener holes in ex-service F/A-18 aircraft bulkheads. These Al-alloy bulkheads contained cracks which initiated and grew either in service or while undergoing laboratory-based fatigue testing of the F/A-18 centre barrel.
2. Nondestructive Inspection of Fastener Holes
2.1 Fatigue Cracking and Mechanical Damage in Fastener Holes Fatigue cracking can occur at several locations within fastener holes, as shown schematically for a simple single layer aircraft structure in Figure 1, with the fasteners removed. The figure also provides a simplified nomenclature for fatigue cracking at the range of locations possible within a single-layer structure. Figure 1 is somewhat idealised as fastener holes often contain multiple cracks which have joined together to form multi-origin cracks with an irregular shape.
Figure 1. Schematic diagram of fastener holes in a single layer of aircraft structure showing types of cracking that can initiate at the hole surface and grow radially through the structure.
Holes can have significant levels of damage present, such as the example shown in Figure 2, from a 3/16”1 (4.76 mm) diameter fastener hole which was broken open as part of this work.
1 Dimensions related to US-manufactured aircraft are traditionally presented in imperial units.
Through
Corner
Corner Bore
Through
Hol
e B
ore
Hol
e B
ore

UNCLASSIFIED DST-Group-TR-3289
UNCLASSIFIED 3
Figure 2. Typical mechanical damage in a 3/16” diameter F/A-18 bulkhead fastener hole
following fastener removal. The hole has been broken open for fractographic examination.
2.2 Rotating Bolthole Eddy-Current Inspection Eddy-current inspection is a well-established NDI method that employs the induced magnetic fields and electrical currents produced by a small probe coil to detect defects in conducting materials [1]. For the inspection of fastener holes using BHEC, the fasteners are removed and a rotating spindle containing the eddy-current coil is inserted into the hole. The eddy-current coil mechanically scans the entire circumference of the hole as the spindle rotates. The operator then moves the probe head through the entire hole bore giving a 100% inspection of the fastener hole within seconds. Figure 3 shows a typical BHEC probe.
Probe head containing eddy-current coil
Mechanical damage in an F/A-18 fastener hole

UNCLASSIFIED DST-Group-TR-3289
UNCLASSIFIED 4
Figure 3. Typical BHEC probe. The coil is located at the end of the polymer spindle, which itself is typically split to provide a light pressure and thus a constant lift-off from the hole surface.
Figure 4 shows a schematic diagram of a typical BHEC inspection. A small (1–2 mm diameter) coil is wound differentially and potted in the polymer spindle. During an inspection, the probe spindle is rotated at a constant speed of up to 3,000 rpm as the inspector moves the probe down the length of the hole. The coil is excited by an alternating current at a selected frequency typically in the range 100 kHz – 2 MHz. When the coil passes over a crack, the eddy currents induced in the alloy around the hole are disrupted, and the resulting change in coil impedance (magnitude and phase) is detected using the associated inspection test-set instrumentation.
Figure 4. Schematic cut-away diagram for a typical BHEC inspection. The spindle contains a small differential (dual) coil embedded just beneath its surface. As the spindle rotates, the coil scans the bore surface of the hole at a constant lift-off from the surface.
Figure 5 shows a typical screen presentation when a BHEC coil passes over a narrow electrodischarge machined (EDM) slot in an Al-alloy calibration standard. Two traces are shown:
(a) Voltage change as a function of time (Y-t). The time base is synchronised to the probe rotation so that the horizontal axis is in effect the angular position of the probe on the hole circumference.
(b) Phase plane display [5]. The locus (X-Y) traced by the in-phase (X) and out-of-phase (Y) components of the voltage change as the coil traverses the EDM slot2. This is in effect a polar plot of the voltage represented as a phasor quantity as it evolves in time.
2 Here, for simplicity, X and Y are loosely referred to the “in-phase” and “out-of-phase” components of the voltage (relative to the coil excitation current). As the overall phase can be rotated by an arbitrary value, it is more usual to simply refer to the vertical (Y) and horizontal components (X) with respect to the screen coordinates.
coil
defect
fastener hole
rotating spindle

UNCLASSIFIED DST-Group-TR-3289
UNCLASSIFIED 5
The distinct peaks appearing to the left in (a) and the distinct loops appearing in the impedance plane display (b) indicate the presence of a defect. Most modern BHEC instruments have a split-screen X-Y (phase plane)) & Y-t (voltage/time) to allow the operator to interpret the defect indications more easily.
Figure 5. Eddy-current equipment display showing (a) signal vs hole circumference trace and
(b) impedance plane (or polar plot) when inspecting a single calibration slot in a test standard.
2.3 Interpretation of Eddy-Current Data 2.3.1 Defect Size and Signal Amplitude
While detection of defects is relatively straightforward, reliable sizing of a suspected crack using BHEC is difficult and prone to error – particularly for crack depth. As a general rule, the signal amplitude increases with increasing crack size so that an estimate of crack size can be attempted by comparison with a narrow slot with known length and depth in a calibration block. These slots or idealised cracks are made via electrodischarge machining. The amplitude and phase of the impedance signal on the standard slot is used to set the signal to 80% of the full-screen-height (FSH) amplitude and then, the phase is rotated such that the probe lift-off signal will be horizontal on the impedance plane. The real crack signal can then be compared to the standard setup position to attempt to estimate the crack dimensions. As shown in Section 6.1, the plots of signal amplitude vs actual crack depth show a large degree of scatter, indicating large errors in size determination if attempted this way. Sizing of fatigue cracks using eddy-current NDI still remains an open area of research so that in the present study, a definitive measurement of crack size required the hole to be broken open and the crack dimensions measured fractographically. 2.3.2 Detection of Mechanical Damage through Phase Rotation
The BHEC signal arising from a crack in Al alloys is similar in nature to that shown in Figure 5 but with some subtle differences. The amplitude of the signal is somewhat
(a) (b)

UNCLASSIFIED DST-Group-TR-3289
UNCLASSIFIED 6
smaller for cracks than EDM slots of the same length and depth [6]. There is also a slight phase rotation of the signal in the impedance plane, which depends to some degree on the radial depth of the crack perpendicular to the bore. When displayed on most eddy-current instruments, a crack signal is rotated clockwise in the impedance plane relative to the EDM slot. The contention is that shallow mechanical damage or scoring, which presents as a blunt scratch or shallow gouge in the hole bore will have the opposite effect on the phase, causing an anti-clockwise phase rotation of the signal compared to the EDM setup signal. This assumed phase rotation in BHEC of Al alloys can be traced to the differences in the width of the defect: for defects of the same depth and length, the phase of signals for narrow defects is rotated clockwise relative to wider defects. Thus, cracks would be expected to have phase rotations to the right of the EDM slot signal and mechanical damage to the left.
3. Preparation of Representative Test Specimens
For this study it was essential that the cracking and damage in the fastener hole test specimens was representative of real in-service aircraft structure. As DST Group had been undertaking a laboratory fatigue test on F/A-18 Hornet centre barrels, the opportunity was taken during this fatigue testing program to inspect the fastener holes in genuine ex-service aircraft structure. This provides a sound experimental basis to examine the BHEC ‘phase discrimination’ technique. The bulkheads tested had a Wing Root Fatigue Life Expended Index of 0.6 and had achieved 4704 airframe hours. Approximately 1/3 of the eddy-current indications used in the study were from fastener holes in the Y453 bulkhead, with the remaining 2/3 coming from the Y470.5 bulkhead. The fasteners were removed following fatigue testing to allow for BHEC inspection. Figure 6 shows an image of an F/A-18 centre barrel undergoing fatigue testing at the DST Group facility and a schematic diagram showing the arrangement of the three bulkheads. Figure 7 shows a number of the holes that were inspected using the BHEC technique. Subsequent to the fatigue test, a random selection of bulkhead fragments containing holes of both 3/16” (4.76 mm) and 1/4” (6.35 mm) diameter were obtained for the purposes of the inspection demonstration. This study was not designed to meet the requirements of a NDT reliability or POD study, as the inspection method itself was under development rather than it being an assessment of an established procedure. Additionally, any reliability study related to this work will require a large sample of unflawed holes, and an appropriate distribution of defect sizes in order to satisfy the requirements of defining a POD curve, and hence a value for aNDI [7,8].

UNCLASSIFIED DST-Group-TR-3289
UNCLASSIFIED 7
Figure 6. (a) F/A-18 centre barrel undergoing fatigue testing at DST Group test facility. The load
on the wings on the centre barrel is provided by the yellow/black actuators attached to blue I-beams located on either side of the bulkheads. (b) Schematic diagram of the centre barrel showing the three bulkheads Y453, Y470.5 and Y488 [9].
Figure 7. A selection of F/A-18 bulkhead fragments showing a number of holes that were
inspected using the BHEC phase-discrimination technique. Yellow markings denote no eddy-current indications found, red markings denote either a crack or damage has been detected.
(a) (b)

UNCLASSIFIED DST-Group-TR-3289
UNCLASSIFIED 8
4. Experimental Procedure
The initial inspection procedure for the BHEC NDI of the fastener holes followed the general requirements of the RAAF procedure for performing BHEC testing [10]. Two mainstream COTS eddy-current testing instruments were used for the inspections and the inspections were performed by qualified Level II (Aus) nondestructive testing technicians or DST Group NDE research staff. The BHEC instruments used were the GE Inspection Technologies Hocking Phasec 2d and the Olympus Staveley Nortec 500D. All measurements were performed at 500 kHz using differential-wound eddy-current coils. Several probes were used interchangeably during the inspection process with the two inspection units, and for the different diameter fastener holes. The probe rotation speed was typically 1800 rpm and the low and high pass filter settings were 500 Hz and 150 Hz respectively. The F/A-18 bulkhead material is Al-alloy 7050-T7451. This alloy has an electrical conductivity of 41.5% IACS [11] so that at the inspection frequency of 500 kHz the standard depth of penetration or electromagnetic skin depth δ is 0.15 mm in the fastener holes3.
4.1 Bolt Hole Eddy Current Inspection Procedure 4.1.1 Calibration on Machined Slots
The BHEC probe was set up using a 0.030” × 0.030” (0.76 mm x 0.76 mm) corner EDM slot in a VM Products VM 30889-C1A/AF 7075-T6 Al-alloy reference standard fastener hole, rather than using a 0.5 mm deep through-thickness EDM slot. The EDM slot width (opening) was 0.09 mm. Otherwise the setup followed the general requirements of the RAAF procedure for BHEC testing. 4.1.2 Inspection for Fatigue Cracks and Fastener Hole Damage
After set-up, the probe was placed into a test fastener hole and the inspections performed according to the RAAF general procedure. If an indication was detected an additional step was performed to measure the phase rotation and amplitude of the defect indication relative to the calibration EDM slot. First, the indication of the EDM slot was rotated to the vertical, the amplitude set to FSH and the gain GainEDM recorded. The change in phase of the defect signal relative to the EDM slot phase was measured by recording the phase change required to rotate the peak defect signal to the vertical position and whether the phase of the defect indication initially lay to left or to the right of the vertical. The gain Gaindefect in dB required to set the defect signal to FSH was also recorded. The phase and amplitude of the defect indication relative to the reference EDM slot could then be calculated according to the following relationships 3 The bulkhead Al alloy is IVD coated for corrosion protection but this coating is assumed to be absent within the bare holes.

UNCLASSIFIED DST-Group-TR-3289
UNCLASSIFIED 9
phase rotation = 𝜃𝑑𝑑𝑑𝑑𝑑𝑑 − 𝜃𝐸𝐸𝐸,
relative amplitude ( ) / 2010 −= defect EDMGain Gain . The phase rotation is negative if the phase of defect indication is to the left of the EDM slot indication and positive if the phase lies to the right Figure 8 shows an example of defect impedance signal before and after rotation to the vertical position corresponding to the phase of the EDM slot indication, and application of gain to bring the indication to the appropriate FSH.
Figure 8. Screen shots of BHEC indications showing (a) the raw impedance plane data with a counter-clockwise rotation from the vertical of about 45°, a negative phase rotation, indicating the presence of likely mechanical damage. (b) The signal rotated to the vertical position to align with the phase orientation of the EDM slot indication.
5. Results of BHEC Inspection
Several hundred fastener holes were inspected using the method described in Section 4. Fastener holes that did not immediately produce an eddy-current indication were disregarded and played no further role in the study. In total, 365 BHEC indications were recorded by the inspectors, with many fastener holes giving multiple indications. A scatter plot of the normalised amplitude and relative phase of the BHEC defect signals with respect to the EDM slot setup signal is shown in Figure 9.
(a) (b)
negative θ
positive θ

UNCLASSIFIED DST-Group-TR-3289
UNCLASSIFIED 10
Figure 9. Defect indications detected in 3/16” () and 1/4” () diameter holes via BHEC testing.
The amplitude and phase rotation are both measured relative to the setup condition on the EDM slot in the calibration standard.
A considerable spread in both amplitude and phase of the indications is seen in the data, including:
• variations in relative amplitude from under 10% to nearly 3 times the size of the EDM slot indication amplitude
• variations in phase of up to some ±50° from the EDM reference phase.
On first inspection, there is a noticeable clustering of the data at a phase rotation of +20°, for a wide range of amplitudes and for both hole diameters.
5.1 Discrimination of Suspected Mechanical Damage The acquired data were then provisionally categorised via the phase-discrimination method and were labelled as either likely cracks or likely mechanical damage. Initially, all data points with a negative phase rotation were denoted as likely damage, and all data points with a positive phase rotation were denoted as likely fatigue cracks. Special treatment was required for defects with a phase close to zero due to the inherent experimental and systematic errors in determining the phase rotation (c.f. Figure 30). In these cases, a preliminary assignment was made based on other factors judged by the inspector, such as the geometry, location, or ‘cleanliness’ of the eddy-current signal. The
-60 -50 -40 -30 -20 -10 0 10 20 30 40 500
50
100
150
200
250
300
3/16" diameter hole 1/4" diameter hole
Ampl
itude
(%)
Phase rotation (°)

UNCLASSIFIED DST-Group-TR-3289
UNCLASSIFIED 11
resultant assignments are plotted in Figure 10 and show that 129 of the 365 BHEC indications were considered likely to be due to mechanical damage rather than fatigue cracking.
Figure 10. BHEC inspection data with the notional assignment of likely cracks () or likely
damage () within the holes.
For the data set presented above, over 1/3 of the BHEC indications would not necessarily require corrective maintenance assuming the phase rotation was able to discriminate accurately between cracks and damage in every case. The number of holes which hypothetically would not require reworking would be somewhat less, as some holes contained both damage indications and crack indications.
5.2 Phase Rotation Histogram Figure 11 shows the number of occurrences of the phase rotation values in 5-degree bins. Many of the indications considered likely cracks had rotations of close to +20° for the setup conditions used in this study, with 92 of the total 236 likely crack indications (39%) falling into this category. If the two adjacent bins from +11° to +25° are included, the fraction increases to 68%. For the negative phase rotation region, a weak maximum occurs in the data for phase rotations in the range –15° to –11°. If the two adjacent bins are included, 63% of the negative phase rotation data occur in the range –20° to –6°.
-60 -50 -40 -30 -20 -10 0 10 20 30 40 500
50
100
150
200
250
300
Likely Cracks Likely Damage
Phase rotation (°)
Ampl
itude
(%)

UNCLASSIFIED DST-Group-TR-3289
UNCLASSIFIED 12
Figure 11. Frequency histogram showing the number of occurrences in five-degree bins. Peaks
occur for positive phase rotations around +16° to +20°, and for negative phase rotations at -15° to -11°.
6. Fractography
In order to assess the effectiveness of the BHEC phase discrimination method, fractographic analyses were performed for 165 of the 365 recorded indications. The analyses were carried out by breaking open the relevant fastener holes and performing optical microscopy. Of the 165 indications examined, 112 were initially categorised as likely cracks and 53 as likely non-cracked (other damage). As the study was related to defect discrimination rather than probability of detection, and that holes may contain both mechanical damage and small cracks, a number of assumptions were made when cracks were detected in the fractographs:
• any cracks with radial depth < 0.05 mm (0.002”) in a hole were disregarded and not recorded
• any cracks with a radial depth in the bore of less than 0.25 mm (0.010”) were recorded but, as they were considered too small to be reliably detected by BHEC, the hole was categorized as damaged and not containing a crack. The assumption
-55:-
51-5
0:-46
-45:-
41-4
0:-36
-35:-
31-3
0:-26
-25:-
21-2
0:-16
-15:-
11-1
0:-6
-5:-1 0:5 6:10
11:15
16:20
21:25
26:30
31:35
36:40
41:45
46:50
0
10
20
30
40
50
60
70
80
90
100
Freq
uenc
y
Phase rotation (°)

UNCLASSIFIED DST-Group-TR-3289
UNCLASSIFIED 13
being that an overlapping combination of defects was present and the dominant signal was due to mechanical damage.
• In the cases where the inspectors identified that a hole contained both damage and cracking, fractography was conducted for completeness but the results were not included in the present analysis.
A number of additional holes that had exhibited fatigue crack indications were broken open for examination but a crack surface was unable to be found via fractography, therefore the result was unable to be confirmed.
6.1 Data Trends for Various Crack Types The cracks examined by fractography were further categorised according to crack type to identify trends in the signal amplitude and phase. A scatter plot showing the relative amplitude and phase for through-, corner- and bore cracks for the majority of confirmed cracks is shown in Figure 12. The variation of relative amplitude and phase rotation with crack depth for the three crack types is shown in Figures 13–14. The through-thickness cracks emerge as a distinct population compared with bore- and corner cracks. A tabulated list of the results is also given in the Appendix.
Figure 12. Distribution of through-thickness, corner, and bore cracks as confirmed by
fractography. Through-thickness crack are strongly clustered about +20° phase rotation.
-10 0 10 20 30 40 500
50
100
150
200
250
300
Phase rotation (°)
Through crack Bore crack Corner crack
Ampl
itude
(%)

UNCLASSIFIED DST-Group-TR-3289
UNCLASSIFIED 14
Figure 13. Phase rotation vs crack depth for the confirmed cracks.
Figure 14. Relative amplitude vs crack depth for the confirmed cracks.
-10 0 10 20 30 40 509
8
7
6
5
4
3
2
1
0
Phase rotation (°)
Through crack Bore crack Corner crack
Radi
al c
rack
dep
th (m
m)
0 50 100 150 200 250 3009
8
7
6
5
4
3
2
1
0
Amplitude (%)
Through crack Bore crack Corner crack
Radi
al c
rack
dep
th (m
m)

UNCLASSIFIED DST-Group-TR-3289
UNCLASSIFIED 15
6.2 Fractography Comparison with BHEC Indications The results of the fractographic analysis are overlaid on the BHEC defect assignments in Figure 15. Overall, there is a strong correlation between the fractographic results and the assignment of defect type based on BHEC phase rotation for the defects investigated. While all indications with amplitudes greater than 100% were correctly identified, discrepancies in assigning defect type are noticeable for smaller amplitude indications with phase rotations within a band of some ±10° about zero phase rotation. In this region, seven of the holes examined by fractography were incorrectly classified. Outside this band, all of the defects examined were classified correctly. Any procedures which employ BHEC phase rotation will therefore require an allowance for a margin of error around zero phase rotation for defect discrimination.
Figure 15. Summary of results from the BHEC phase rotation study. Indication types that have
been confirmed using fractography are indicated by a solid marker.
-60 -50 -40 -30 -20 -10 0 10 20 30 40 50 600
50
100
150
200
250
300
Likely cracks Confirmed cracks Likely damage Confirmed damage
Phase rotation (°)
Ampl
itude
(%)

UNCLASSIFIED DST-Group-TR-3289
UNCLASSIFIED 16
6.3 Example Fractographs The fracture surfaces of a number of the fastener holes which were broken open are reproduced in this Section. The results provide a sample of the crack and/or damaged surfaces for a variety of amplitude and phase rotation values. Figure 16 depicts the location of the eight selected fractographs in relation to the relative amplitude – phase rotation scatter plot.
Figure 16. Phase rotation vs amplitude results showing location on the plot of the eight example
fractographs presented in this Section.
The corresponding fractographs and a detailed description of the defects are presented below in Figures 20–27. A tabulated list of the results shown in Figures 15–17, together with the relevant crack dimensions, when they could be obtained, is given in the Appendix.
-60 -50 -40 -30 -20 -10 0 10 20 30 40 500
50
100
150
200
250
300
Fatigue crack Mechanical damage Fractography highlight: crack Fractography highlight: damage
Phase rotation (°)
Ampl
itude
(%)
A
B
C
D
E F
G H

UNCLASSIFIED DST-Group-TR-3289
UNCLASSIFIED 17
A. Fragment 14, hole 19AFT in the LHS AFT upper flange of bulkhead CB1 453. A large through-thickness crack in a 1/4” diameter hole, having the highest recorded signal amplitude (269%) and a phase rotation of +19° relative to the EDM calibration slot. The fractograph in Figure 17 shows significant tapering of the crack depth from a maximum of 3.104 mm down to approximately 1 mm.
Figure 17. Fragment 14, hole 19C/D (AFT). A large through thickness crack with tapering depth.
B. Fragment 12, hole 10FWD in the RHS AFT upper flange of bulkhead CB1 453. A near-through crack in a 1/4” diameter hole, having a relative amplitude of 62% and a phase rotation of +25°. Length in the bore was 4.883 mm and radial depth 0.608 mm.
Figure 18. Fragment 12, hole 10A/B (FWD). A multi-origin fatigue crack having a mid-range
amplitude and phase rotation response.

UNCLASSIFIED DST-Group-TR-3289
UNCLASSIFIED 18
C. Fragment 1, hole 17AFT in the RHS AFT upper flange of bulkhead CB1 470.5. A very small crack in a 3/16” diameter hole, having a relative amplitude of 8% and a phase rotation of +7°. Length in the bore was 0.697 mm with radial depth 0.237 mm, meaning that the original indication was counted as due to damage rather than a crack.
Figure 19. Fragment 1, hole 17C/D (AFT). A very small fatigue crack of depth < 0.25 mm.
D. Fragment 12, hole 9AFT in the RHS AFT upper flange of bulkhead CB1 453. A large crack in a 1/4” diameter hole, having a relative amplitude of 57% and a very large phase rotation of +48°. Length in the bore was 5.888 mm and radial depth 1.189 mm.
Figure 20. Fragment 12, hole 9C/D (AFT). A near-through crack exhibiting high phase rotation.
1 mm
UNCLASSIFIED DST-Group-TR-3289
UNCLASSIFIED 19
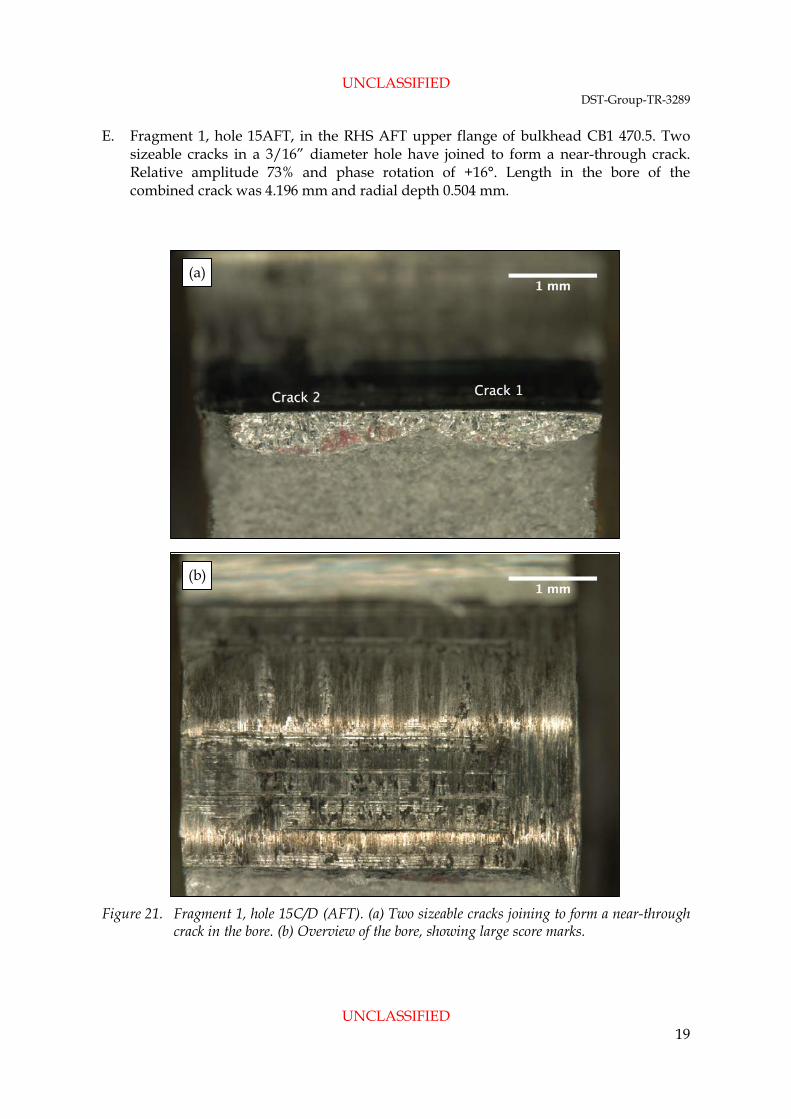
E. Fragment 1, hole 15AFT, in the RHS AFT upper flange of bulkhead CB1 470.5. Two sizeable cracks in a 3/16” diameter hole have joined to form a near-through crack. Relative amplitude 73% and phase rotation of +16°. Length in the bore of the combined crack was 4.196 mm and radial depth 0.504 mm.
Figure 21. Fragment 1, hole 15C/D (AFT). (a) Two sizeable cracks joining to form a near-through
crack in the bore. (b) Overview of the bore, showing large score marks.
(a)
(b)
(a)
(b)

UNCLASSIFIED DST-Group-TR-3289
UNCLASSIFIED 20
F. Fragment 1, hole 20, in the RHS AFT upper flange of bulkhead CB1 470.5. A damaged 3/16” diameter hole with no fatigue cracking. Relative amplitude 76% and relative phase rotation –13°.
Figure 22. Fragment 1, hole 20. Mechanical damage within the fastener hole resulting in a
significant BHEC indication.
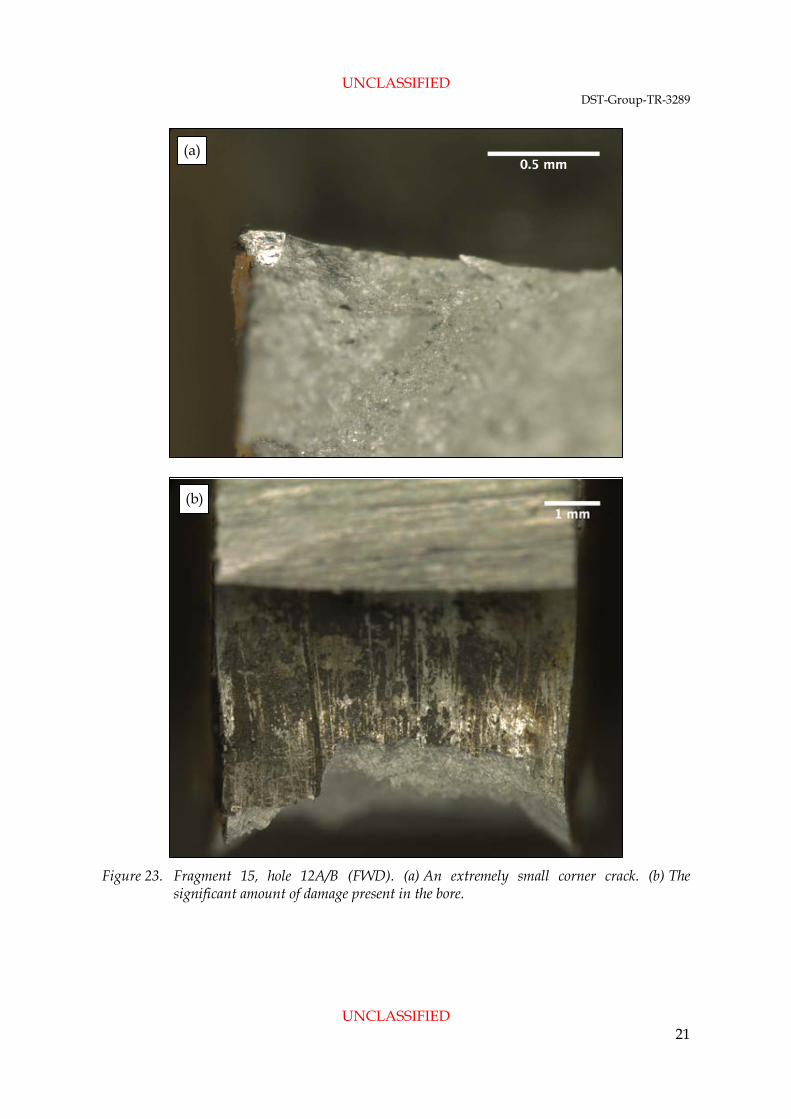
G. Fragment 15, hole 12FWD in the LHS FWD upper flange of bulkhead CB1 453. An extremely small corner crack and significant damage in the bore, resulting in a relative amplitude of 45% and phase rotation of –38°. Here, the negative phase rotation indicates the damage in the hole far outweighs any signal from the tiny corner crack, which was of length in the bore 0.213 mm and radial depth 0.151 mm.
UNCLASSIFIED DST-Group-TR-3289
UNCLASSIFIED 21
Figure 23. Fragment 15, hole 12A/B (FWD). (a) An extremely small corner crack. (b) The
significant amount of damage present in the bore.
(a)
(b)

UNCLASSIFIED DST-Group-TR-3289
UNCLASSIFIED 22
H. Fragment 13, hole 2FWD in the RHS upper FWD flange of bulkhead CB1 453. A small mid-bore crack of length 0.758 mm and radial depth 0.270 mm in a 3/16” diameter hole. Relative amplitude 41% and a very small relative phase rotation of -1°.
Figure 24. Fragment 13, hole 2A/B (FWD). A small mid-bore crack giving very little phase
rotation compared to the EDM calibration slot.
7. Theory and Modelling
To our knowledge, there are currently no published theoretical studies underpinning the use of phase-rotation for defect discrimination in BHEC. Some overall observations can be made from numerical modelling and by drawing on the general theory of eddy-current NDI in the limit of small skin depth, which is applicable for BHEC of Al alloys. For simplicity, it will be assumed that both cracking and mechanical damage are linear defects oriented along the bore of the hole – they are longitudinal rather than circumferential defects. In the limit of small skin-depth δ (or high frequency), it can be shown that the change in coil impedance ∆Z due to parallel-sided surface breaking slot in a non-magnetic conductive plate can be written in the form [12]
20
1 1(1 ) { }2 2
µ ω δ δ ∆ = ∆ + + − ∆ + + 2f f s kZ i ug i g g u g (1)

UNCLASSIFIED DST-Group-TR-3289
UNCLASSIFIED 23
where µ0 = 4 π × 10-7 H/m is the permeability of free space, ∆u is the opening width of the defect and ω = 2πf, where f is the coil excitation frequency. The quantities gf, gs and gk which appear in Eq.(1) are functions of the coil geometry, the defect depth d, defect surface length 2c and the defect shape [13-15]. The significance of Eq.(1) is that it demonstrates the effect of defect opening ∆u on the eddy-current response. Varying the defect opening can be viewed as changing the defect type. For a fatigue crack we expect the opening of a crack to be small (∆u ≈ 0) whereas for a gouge or scoring we expect ∆u to be of the same size or larger than the defect depth (∆u ≥ d). The opening width of an EDM slot is an intermediate case. Examination4 of Eq.(1) at high frequency leads to the following changes in coil resistance (∆R) and reactance (∆X) with defect opening width
0
0
1 Re[ ]2
1Re[ ] Re[ ]2
µ ω δ
µ ω δ
∂∆≈ −
∂∆∂∆ ≈ − ∂∆
s
f s
R guX g gu
(2)
From Eq.(2) it then follows, for a given defect shape and size and for a given probe position, that increasing the opening width leads to (i) a decrease in ∆R, (ii) an increase in ∆X, and hence (iii) an anticlockwise phase rotation5. Thus for a given scan location, the phase for a parallel-sided gouge will lie to the left of the phase for a crack with the same depth and length, and the phase of the corresponding narrow EDM slot will lie between the two. In practice, there is a population of defect shapes and sizes rather than just one, so that the simple argument presented above needs further refinement. A series of model calculations for a range of model defects was performed by coding Eq.(1) using Mathematica. In the model, the probe was an air-cored coil with outer diameter 1.42 mm operating at 500 kHz and the plate was Al-alloy 2024 with a conductivity of 30% IACS. The defects were as follows:
• Crack-like defects (∆u = 0) A series of rectangular slots (2c × d): 7.0 × 3.5 mm2, 7.0 × 1.0 mm2, 4.0 × 2.0 mm2, 4 × 1.0 mm2, 2.0 × 1.0 mm2 was used to simulate bore-cracks and a series of long slots (2c = ∞) with depths of 3.5 mm, 2.0 mm and 1.0 mm was used to simulate through-cracks in the bore. A total of eight cracks were modelled.
• EDM slot (∆u = 0.2 mm)
4 This can be shown by expanding the RHS of Eq.1 into real and imaginary parts, taking the derivative and neglecting the imaginary parts of the g-functions (at high frequency, the real part of the g-functions is large compared with the imaginary parts). 5 Note that Re[gs] and Re[gf] are positive here.

UNCLASSIFIED DST-Group-TR-3289
UNCLASSIFIED 24
A long slot (2c = ∞) with depth of 0.75 mm was used to simulate an EDM calibration slot.
• Gouges (∆u = 0.5 mm) Mechanical damage (longitudinal scores or gouges) was simulated using two long shallow slots (2c = ∞) with depths of 1.0 mm and 0.50 mm, and two rectangular slots (2c × d): 4.0 × 1.0 mm2, 4.0 × 0.5 mm2.
The corresponding impedance change was computed for scans across the defect at the position of maximum signal. The model results are presented in Figure 25 and show a separation in phase for cracks compared with mechanical damage.
Figure 25. Calculated probe response (Eq.1) in the impedance plane for (i) model cracks, (ii) an
EDM slot and (iii) mechanical damage in a flat 2024 Al-alloy plate. The coil was scanned across the defect at the position of maximum signal response, f = 500 kHz. The signal (arrowed) is for a small crack where the scan was not at the position of maximum response.
One caution needs to be made for small cracks and underlines the potential importance of taking data at the correct position for the coil relative to the crack. For small cracks (in this case 2c = 2.0 mm) the maximum signal was obtained for scans passing across the crack tip and this scan is plotted in Figure 25. The calculated scan when the coil passes across the crack centre, which is not the scan location for maximum signal, is also shown for comparison in Figure 25 and has a relative phase of the opposite sign (–) which could be interpreted as mechanical damage. The relative amplitude and phase rotation were calculated from the thin-skin model results and are shown in Figure 26. As the impedance plane loci are curved, a line connecting the origin and the position of the maximum excursion was used to determine the phase rotation. The model reproduces phase rotations of the same sign and similar magnitude to those observed, although not reproducing some of the large phase rotations
‘cracks’ (∆u=0)
EDM slot (∆u=0.2mm)
‘gouges’ (∆u=0.5mm)

UNCLASSIFIED DST-Group-TR-3289
UNCLASSIFIED 25
(25°–50°) apparent in Figure 15. The relative amplitude from the modelling tended to be smaller than observed for cracks. These results should be treated as indicative, given the simplifications in the model, the coil geometry and the choice of the reference EDM slot.
Figure 26. Calculated phase rotation and relative amplitude for model cracks and mechanical
damage (gouges) in a flat 2024 Al-alloy plate. The phase and amplitude are calculated relative to a model EDM slot 0.75 mm deep, 0.2 mm wide and with infinite length.
Numerical calculations were also carried out using the boundary element method within the NDT-modelling package CIVA6. This software package permits the calculation of probe response for a wider variety of coil-specimen geometry configurations and is much less restrictive than the simple thin-skin model described above. A BHEC test problem was set up using the 3-D fastener hole model shown schematically in Figure 27. In this case an Al-alloy 2024 block containing a cylindrical hole was generated and three surface-breaking normally-aligned rectangular slots simulating a crack, a narrow EDM slot and a mechanical score were inserted. The defects had the same length 2c = 2.5 mm in the bore but with different width ∆u and radial depth d. The dimensions were as follows: crack ∆u = 0.01 mm and d = 0.85 mm, narrow EDM slot ∆u=0.10 mm and d=0.45 mm, and the mechanical score ∆u = 0.50 mm and d= 0.22 mm. The coil was air cored and had an outer diameter of 1 mm. The operating frequency was 500 kHz.
6 CIVA NDT simulation software, produced by Extende SA, France.

UNCLASSIFIED DST-Group-TR-3289
UNCLASSIFIED 26
Figure 27. Three-dimensional model of a BHEC inspection, showing a BHEC coil scanning around
a fastener hole radius, across two simulated surface-breaking defects. (a) View down the bore, showing the defects, and (b) 3-D view showing the parent material and inspection geometry inside the fastener hole.
The impedance response vs position for the three defects is shown in Figure 28, with the most crack-like defect at left, and the simulated mechanical damage at right.
Figure 28. Impedance response for the rotating BHEC coil around the radius of a simulated
aluminium fastener hole containing a crack-like defect, and EDM notch, and a gouge-like defect.
Figure 30 shows the impedance plane presentation for the three defects in the fastener hole, with a clear discrimination being able to be made via the rotating phase, which rotates in an anticlockwise direction around the plane as the mouth of the idealised crack opens and the defect type changes from crack-like to gouge-like. Note the curvature of the impedance plane signals in Figure 29, particularly for the defects with larger opening width. This introduces a degree of uncertainty in defining when the tip of the crack has reached the vertical position during a phase rotation.
(a) (b)
‘crack’
‘EDM’
‘gouge’

UNCLASSIFIED DST-Group-TR-3289
UNCLASSIFIED 27
Figure 29. Phase-rotation effect as demonstrated via modelling in CIVA, with detail (inset). (a) Simulated crack, being a slot of width 0.01 mm and depth 0.85 mm, (b) intermediate slot of width 0.10 mm and depth 0.45 mm, and (c) simulated mechanical damage, being a slot of width 0.50 mm and depth 0.22 mm.
The results from the thin-skin theory and CIVA modelling support the proposal that mechanical damage and fatigue cracking in BHEC inspection of fastener holes can be distinguished according to their relative phase, at least for the idealised defects which were modelled.
8. Time-Gated Phase Analysis
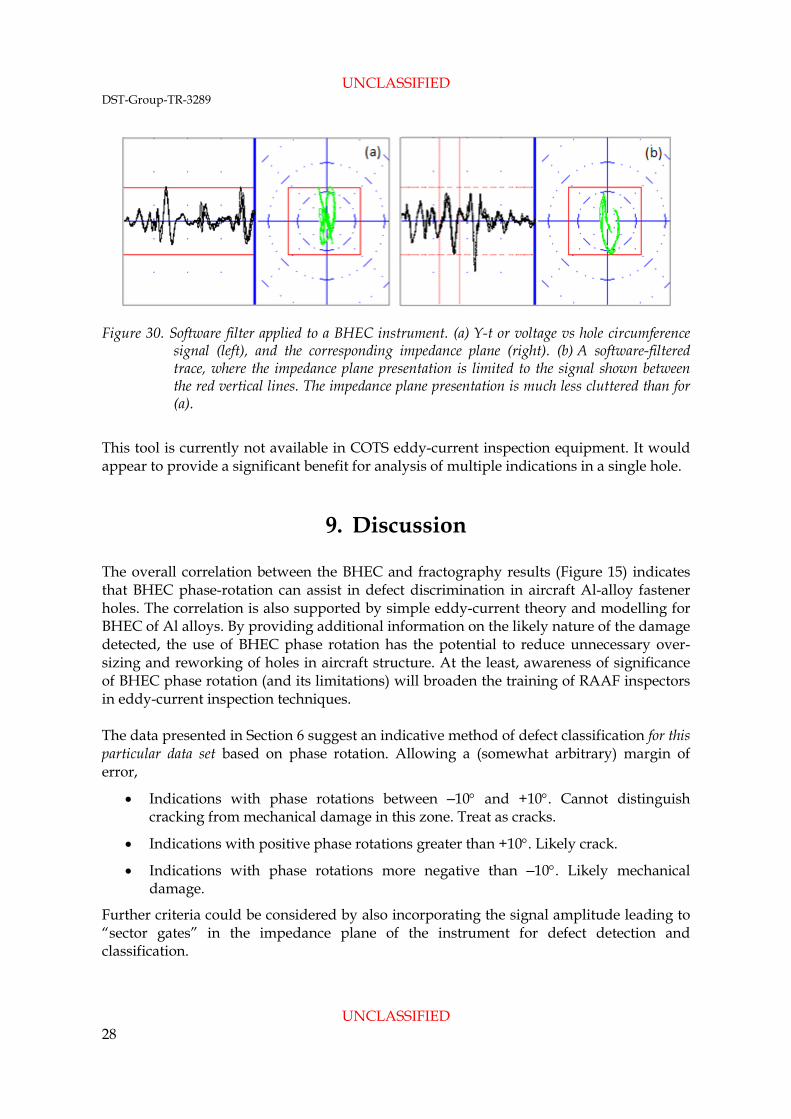
A complicating factor in the trials is when there is both significant mechanical damage and cracks in the same hole. If the indications are not overlapping, an inspector can attempt to isolate the amplitude and phase of the two indications by very careful probe positioning. This approach is time-consuming and prone to error. Improvements can be made through the use of software gates on the acquired signal, in similar fashion to the convention in ultrasonic testing. The time gate is applied by selecting the region of interest in the Y-t (amplitude vs time) trace and the impedance plane display is then restricted to the single indication which is to be studied. This enhancement of the usual BHEC software also permits removal of spurious noise signals in holes where both damage and cracking exist, to give an uncluttered impedance plane plot as well as permitting individual phase-discrimination measurements to be made for multiple defects, as is shown in a demonstration version of such software in Figure 31.
(a)
(b) (c)
UNCLASSIFIED DST-Group-TR-3289
UNCLASSIFIED 28
Figure 30. Software filter applied to a BHEC instrument. (a) Y-t or voltage vs hole circumference
signal (left), and the corresponding impedance plane (right). (b) A software-filtered trace, where the impedance plane presentation is limited to the signal shown between the red vertical lines. The impedance plane presentation is much less cluttered than for (a).
This tool is currently not available in COTS eddy-current inspection equipment. It would appear to provide a significant benefit for analysis of multiple indications in a single hole.
9. Discussion
The overall correlation between the BHEC and fractography results (Figure 15) indicates that BHEC phase-rotation can assist in defect discrimination in aircraft Al-alloy fastener holes. The correlation is also supported by simple eddy-current theory and modelling for BHEC of Al alloys. By providing additional information on the likely nature of the damage detected, the use of BHEC phase rotation has the potential to reduce unnecessary over-sizing and reworking of holes in aircraft structure. At the least, awareness of significance of BHEC phase rotation (and its limitations) will broaden the training of RAAF inspectors in eddy-current inspection techniques. The data presented in Section 6 suggest an indicative method of defect classification for this particular data set based on phase rotation. Allowing a (somewhat arbitrary) margin of error,
• Indications with phase rotations between –10° and +10°. Cannot distinguish cracking from mechanical damage in this zone. Treat as cracks.
• Indications with positive phase rotations greater than +10°. Likely crack.
• Indications with phase rotations more negative than –10°. Likely mechanical damage.
Further criteria could be considered by also incorporating the signal amplitude leading to “sector gates” in the impedance plane of the instrument for defect detection and classification.

UNCLASSIFIED DST-Group-TR-3289
UNCLASSIFIED 29
The data also illustrate the burden imposed on the inspection process by mechanical damage, with of the order of 30% of defect indications arising from damage in this case. While the sign of the BHEC phase-rotation is expected to broadly discriminate between cracks and mechanic damage for high-frequency BHEC and ECT of Al alloys, the typical size of the rotation will vary depending on the application and setup. Therefore great caution must be used in applying the specific results of the present study more generally. For example, in Figure 15, ambiguities in defect discrimination are evident in a ± 10° band centred about zero phase. This band of ambiguity could be larger depending on the choice of operating frequency, the selection of the EDM calibration slot, the hole diameter, probe type and set-up, and the alloy involved. For lower conductivity materials, such as Ti alloys, the phase rotation method may break down completely. Great care also needs to be taken in ensuring that the particular test sets, probes and set-up procedures do not actually reverse the overall phase compared with the present study. To an extent, the presence of a systematic phase reversal due to the instrumentation could be eliminated by ensuring that the lift-off locus is always set to the left but for some instruments this may not be possible or is ambiguous. A better check would be to include an additional wide, shallow EDM slot in the test procedure to verify the correct overall phase by simulating mechanical damage. As described above, the trials were performed for a specific geometry, material, frequency and test/calibration set up. These limitations on the generality of the results are as follows:
• The trials were conducted in a single layer structure rather than in a multi-layer structure and the holes did not contain countersinks
• The crack population is dominated by large amplitude indications from through-thickness cracks
• The test frequency was 500 kHz and the material was Al-alloy AA7050-T7451 which has a higher electrical conductivity than many Al alloys. Changes in operating frequency and alloy conductivity will influence the phase rotation
• The phase rotation was measured with respect to a specific EDM calibration slot used in the setup procedure. Changing the EDM slot dimensions (including the opening width) and test block material will directly lead to a change in the measured defect phase rotation and relative amplitude
• Two hole diameters (1/4” and 3/16”) were used in the trials. The phase rotations for through-thickness cracks in the 1/4” holes were slightly larger on average than for the 3/16” holes. This difference may be due to the differences in the probes used in the two cases or may also indicate that the hole diameter has an influence.
As mentioned previously, a complication occurs when there is both significant mechanical damage and cracks in the same hole. According to limited fractographic analyses performed in these cases, the expected correlation between phase rotation and defect type was also observed for non-overlapping indications in the same hole. If the indications are coincident then such a separation should not be attempted. A further source of

UNCLASSIFIED DST-Group-TR-3289
UNCLASSIFIED 30
complication arises from edge effects, for which a phase rotation also occurs, and the edge effect signal may potentially interfere with that obtained from very small quadrant cracks, such as that shown in Figure 23a. BHEC defect signals typically form single or double loops in the impedance plane depending on the probe, filtering and instrumental signal processing employed, as in Figure 5. In the present study, the phase and amplitude were deduced using the maximum loop excursion from the origin (balance position) in the impedance plane. While this choice has the advantage of simplicity, there may be other more refined methods to characterise the phase and amplitude of the BHEC defect response which are worth exploring. Setting aside such complications and limitations, the additional information provided by BHEC phase rotation for defect discrimination has the potential to be used in a number of possible ways, depending on the level of engineering risk that can be accepted. Some of these possibilities are given below:
• Improved inspection reliability. If cracks can be reliably discriminated from mechanical damage it may be possible to reduce the defect amplitude reporting threshold in the inspection procedure, irrespective of the state of the hole, allowing smaller cracks to be reported. This may lead to a reduction in aNDI and hence an improvement in the inspection reliability. The impact could only be assessed following a formal NDI reliability study.
• Better statistics for fleet fatigue condition. Holes would be treated assuming all indications are cracks but the BHEC phase information is used to obtain a better statistical estimate of the underlying aircraft fatigue crack population for fleet management purposes. This may be especially useful if widespread fatigue damage is a concern and risk/reliability studies are required.
• Additional confirmation for problematic holes. For holes containing large amplitude indications, use of the BHEC phase discrimination in conjunction with other information (such as visual inspection and a judgement on the other characteristics of the BHEC indication) may provide more reliable information on the defect type and hence the required maintenance actions on a case-by-case basis.
• Prioritisation for hole maintenance and reduction in hole oversizing
o Holes assessed by BHEC phase discrimination as containing a likely crack could be oversized to remove the indication and then further oversized using a “confidence cut” of depth equal to aNDI to take into account the reliability of inspection. A hole assessed as containing likely damage could be oversized to remove the BHEC indication but the additional oversizing confidence cut is omitted.
o Holes containing indications with a large negative phase change but small amplitude could possibly be left in place or given minimal rework to avoid unnecessary maintenance. However, as such defects can act as crack initiators if left untreated [9] this option would require careful structural fatigue analyses.

UNCLASSIFIED DST-Group-TR-3289
UNCLASSIFIED 31
It should be emphasised that there is a clear risk to structural integrity if the defect is incorrectly identified and a crack is mistakenly assumed to be more benign mechanical damage and left in place. Assessment of this engineering risk requires a formal probability of detection (POD) trial in which a BHEC inspection procedure is used both to detect and classify a known population of defects. Hit/miss data for correctly identified and detected cracks could then in principle be used to calculate an appropriate aNDI.
If a phase-discrimination technique is to be implemented as a quantitative measurement technique (in which the degree of rotation is recorded), an alteration to the current RAAF setup practice would need to be implemented. This is due to the current practice of setting the lift-off signal to the horizontal position.
10. Conclusions and Recommendations
The data obtained from this experimental study show that BHEC phase discrimination method can assist in distinguishing cracks from mechanical damage in Al-alloy fastener holes. Of the 165 holes successfully examined by fractography, all of the high amplitude defect indications (relative amplitude >100%) were correctly classified and all of the lower amplitude indications (relative amplitude <100%) with phase rotations outside a band of ±10° centred on zero phase rotation were correctly classified. However, within the phase rotation band spanning -10° to +10°, seven of the lower amplitude indications were incorrectly classified using phase rotation alone. In a number of cases, co-located cracking and damage within a single hole could be discriminated using this method. The introduction of time-gated phase-analysis would further improve the operation of the phase discrimination method. The data also illustrate the burden imposed on the BHEC inspection process by mechanical damage, with of the order of 30% of defect indications arising from damage in this case. The use of BHEC phase rotation has the potential to improve inspection reliability, increase accuracy of estimates of the fatigue crack population in an aircraft fleet, and reduce unnecessary over-sizing of holes in aircraft structure. There is however a clear risk to structural integrity if the defect is incorrectly identified and a crack is mistakenly assumed to be benign mechanical damage and left in place. Assessment of this risk and formulation of a framework for aircraft structural management which incorporates both imperfect defect detection and imperfect defect classification, together with associated confidence levels, would require a formal POD trial and NDT reliability study. BHEC phase discrimination is clearly a useful tool and we recommend that the significance of the technique and its limitations should be introduced to eddy-current inspectors to assist in defect classification and to broaden the understanding of the BHEC techniques.

UNCLASSIFIED DST-Group-TR-3289
UNCLASSIFIED 32
The understanding of this phenomenon would also benefit from a comprehensive theoretical study on the fundamental effects of defect opening width on eddy-current signal response for realistic BHEC configurations.

UNCLASSIFIED DST-Group-TR-3289
UNCLASSIFIED 33
11. References
[1] Forsyth, D. S., Estimating the effect of noise on POD from the GBHET POD study, TRI-A-NDE-2008-001, Texas Research International, NDE Division, (2008).
[2] Fahr, A., Khan, M., Mandache, C., Yanishevsky, M., and Brothers, M., Generic bolt hole eddy current testing probability of detection, LTR-SMPL-2007-0138, National Research Council, Ottawa, Canada (2008).
[3] LaCivita, K. J., Brausch, J. C., and Laufersweiler, D., Improved bolt hole eddy current rotational filtering procedures and phase-analysis based interpretation to reduce false calls,United States Air Force, Wright-Patterson AFB, OH, USA
[4] Brausch, J. C., Butkus, L., Campbell, D., Mullis, T., and Paulik, M., Recommended practices and best practices for nondestructive inspection (NDI) of safety-of-flight structures, AFRL-RX-WP-TR-2008-4373, United States Air Force, Wright-Patterson Air Force Base, OH, USA (2008).
[5] Hagemaier, D. J. “Eddy-current inspection of boltholes” in Nondestructive Testing Handbook, Vol.4, 2nd ed., R. C. McMaster, P. McIntyre and M. L. Mester eds., (American Society for Nondestructive Testing), pp. 400-404, (1986).
[6] Larson, B., Lo, C. and Nakagawa, N., Investigation of the effects of notch width on eddy current signal response and comparison of signals from notches and cracks, Review of Progress in Quantitative NDE, vol.29, pp.1973–1979 (2010).
[7] United States Department of Defense, Nondestructive evaluation system reliability assessment MIL-HDBK-1823A (United States Department of Defense, 2009).
[8] Singh, R., Three decades of NDI reliability assessment, Karta-3510-99-01, Karta Technologies, San Antonio, TX, USA (2000).
[9] Barter, S. and Dixon, B., Investigation using quantitative fractography of an unexpected failure in an F/A-18 centre fuselage bulkhead in the FINAL teardown program, Eng.Failure.Analysis., vol.16, pp.833–848 (2009)
[10] RAAF, “Rotating eddy-current testing of bolt holes using a differential coil probe, Section 5.2 ECT/GEN/2” in Australian Air Publication 7002.043-36 Non Destructive Inspection Methods General Data Book 1 (1992).
[11] Calero, J. and Turk, S., Effects of thermal damage on the strength properties of 7050-T7451 and 7075-T7351 aluminium alloys, Defence Science and Technology Group, DSTO-TR-2104 (2008).
[12] Burke, S. K. and Ditchburn, R. J., Mutual impedance of planar eddy-current driver pickup spiral coils, Res.Nondestr.Eval, vol.19, pp.1-19 (2008).
[13] Ditchburn, R. J. , Burke, S. K. and Posada, M., Eddy-current non-destructive inspection using thin spiral coils: long cracks in steel, J. Nondestr. Eval., vol.22, pp.63-77 (2003).
[14] Bowler, J. R. and Harfield, N., Evaluation of probe impedance due to thin-skin eddy-current interaction with surface cracks, IEEE Trans. Magn., vol.36, pp.515-523 (1998).
[15] Bowler, J. R. and Harfield, N. Thin-skin eddy-current interaction with semielliptical and epicyclic cracks, IEEE Trans. Magn., vol.34, pp.281-291 (2000).

UNCLASSIFIED DST-Group-TR-3289
UNCLASSIFIED 34
Appendix A: Fractographic Data
Table A1 summarises the fractographic data for those cracks that could be both found and measured in the opened fastener holes (shown in Figures 12-14). For holes with multiple cracks, the dimensions and type correspond to the largest crack (*). Overlapping multi-origin cracks which extended almost the entire length of the bore (such as in Figure 21) were classified as through cracks.
Table A1. Detailed crack measurements obtained via fractographic analysis.
Hole Identification BHEC Inspection Crack Measurements
Piece Hole Diameter (inch) Rotation (°) Amplitude
(%) Length (mm)
Depth (mm)
Crack Type
15 12 1/4 -38 45% 0.213 0.151 Corner 15 12 1/4 -27 30% 0.213 0.151 Corner 1 17a 3/16 -1 11% 0.697 0.237 Bore
13 2 3/16 -1 41% 0.758 0.270 Bore* 14 13 1/4 2 32% 0.428 0.286 Corner 13 8 1/4 5 47% 0.702 0.262 Corner* 14 14 1/4 5 21% 0.400 0.202 Bore* 1 16 3/16 6 30% 0.316 0.304 Corner 1 16 3/16 7 20% 0.316 0.304 Corner 1 17 3/16 7 8% 0.697 0.237 Bore 1 18 3/16 8 33% 4.485 0.742 Through*
12 4 1/4 8 19% 0.403 0.219 Corner 1 18 3/16 11 51% 4.485 0.742 Through* 1 3 3/16 12 221% 4.543 8.400 Through
13 3 3/16 13 54% 2.069 0.511 Bore 13 3 3/16 13 99% 2.510 0.559 Bore* 1 4 3/16 14 168% 4.484 2.347 Through
12 11 1/4 14 25% 1.594 0.345 Bore* 1 2 3/16 15 94% 4.366 2.787 Through 1 12 3/16 16 160% 2.246 0.986 Corner* 1 15 3/16 16 73% 4.196 0.504 Through 1 10 3/16 16 180% 4.408 2.147 Through 1 11 3/16 16 155% 4.418 1.764 Through 1 8 3/16 16 195% 4.426 2.483 Through 1 7 3/16 16 204% 4.484 3.344 Through 1 13 3/16 16 168% 4.485 1.379 Through
14 14 1/4 16 97% 2.415 0.714 Bore* 1 15 3/16 17 22% 1.884 0.460 Bore* 1 15 3/16 17 60% 4.196 0.504 Through 1 6 3/16 17 178% 4.371 6.290 Through 1 4 3/16 17 157% 4.418 4.836 Through

UNCLASSIFIED DST-Group-TR-3289
UNCLASSIFIED 35
1 5 3/16 17 157% 4.484 4.313 Through 1 14 3/16 17 81% 4.485 0.793 Through 1 12 3/16 18 164% 1.587 1.216 Bore* 1 2 3/16 18 126% 4.361 2.185 Through 1 2 3/16 18 158% 4.366 2.787 Through 1 4 3/16 18 172% 4.418 4.836 Through
14 18 1/4 18 254% 6.494 1.892 Through 1 6 3/16 19 211% 4.371 6.290 Through 1 10 3/16 19 191% 4.408 2.147 Through 1 7 3/16 19 202% 4.484 3.344 Through 1 9 3/16 19 184% 4.484 2.603 Through 1 14 3/16 19 168% 4.485 0.793 Through*
14 19 1/4 19 221% 6.482 2.628 Through 14 18 1/4 19 248% 6.494 1.760 Through 14 15 1/4 19 157% 6.518 1.213 Through 14 19 1/4 19 269% 6.530 3.104 Through 14 17 1/4 19 234% 6.541 1.641 Through 1 8 3/16 20 150% 4.426 2.483 Through 1 9 3/16 20 211% 4.484 2.603 Through 1 13 3/16 20 162% 4.485 1.379 Through
12 5 1/4 20 207% 6.601 2.784 Through 12 6 1/4 20 209% 6.601 1.511 Through 14 16 1/4 20 160% 6.553 1.855 Through 1 11 3/16 21 184% 4.418 1.764 Through
12 2 1/4 21 143% 5.102 0.952 Bore* 12 5 1/4 21 191% 6.732 2.391 Through 14 12 1/4 21 107% 2.676 0.678 Bore 14 11 1/4 21 123% 4.044 0.726 Bore 14 13 1/4 21 122% 4.615 0.774 Bore* 14 17 1/4 21 254% 6.577 1.808 Through 14 15 1/4 21 188% 6.589 1.415 Through 12 9 1/4 22 148% 6.603 1.166 Through 14 14 1/4 22 130% 4.329 0.821 Corner 14 16 1/4 22 214% 6.541 1.701 Through 14 15 1/4 23 172% 6.589 1.415 Through 12 8 1/4 24 119% 6.602 1.344 Through 12 10 1/4 25 62% 4.883 0.608 Bore 12 10 1/4 26 88% 5.114 0.678 Bore 12 6 1/4 26 164% 6.663 1.499 Through 12 8 1/4 28 107% 6.590 1.725 Through 12 7 1/4 32 193% 6.649 1.641 Through 12 7 1/4 32 124% 6.661 1.558 Through 12 2 1/4 40 74% 6.054 0.904 Through 12 11 1/4 42 15% 2.534 0.500 Bore 12 9 1/4 48 57% 5.888 1.189 Through

UNCLASSIFIED
UNCLASSIFIED
DEFENCE SCIENCE AND TECHNOLOGY GROUP
DOCUMENT CONTROL DATA 1. DLM/CAVEAT (OF DOCUMENT)
2. TITLE Discrimination between Fatigue Cracking and Mechanical Damage in Aircraft Fastener Holes by Eddy-Current Phase Rotation
3. SECURITY CLASSIFICATION (FOR UNCLASSIFIED REPORTS THAT ARE LIMITED RELEASE USE (L) NEXT TO DOCUMENT CLASSIFICATION) Document (U) Title (U) Abstract (U)
4. AUTHOR(S) M E Ibrahim, G D Surtees, G R Hugo, H J Morton and S K Burke
5. CORPORATE AUTHOR Defence Science and Technology Group 506 Lorimer St Fishermans Bend Victoria 3207 Australia
6a. DST NUMBER DST-Group-TR-3289
6b. AR NUMBER AR-016-677
6c. TYPE OF REPORT Technical Report
7. DOCUMENT DATE August 2016
8. FILE NUMBER 2015/1063867
9. TASK NUMBER AIR 07/445
10. TASK SPONSOR DGTA-ADF
11. NO. OF PAGES 35
12. NO. OF REFERENCES 15
13. DOWNGRADING/DELIMITING INSTRUCTIONS
14. RELEASE AUTHORITY Chief, Maritime Division
15. SECONDARY RELEASE STATEMENT OF THIS DOCUMENT
Approved for public release OVERSEAS ENQUIRIES OUTSIDE STATED LIMITATIONS SHOULD BE REFERRED THROUGH DOCUMENT EXCHANGE, PO BOX 1500, EDINBURGH, SA 5111 16. DELIBERATE ANNOUNCEMENT No limitations 17. CITATION IN OTHER DOCUMENTS Yes 18. RESEARCH LIBRARY THESAURUS Nondestructive Testing, Eddy Current Testing, Aircraft Structures, Crack Detection and Sizing 19. ABSTRACT Fatigue cracking in metallic aircraft structure often originates at fastener holes and can be detected using the nondestructive inspection technique of bolt-hole eddy-current (BHEC) testing. BHEC testing is based on detection of a disturbance in the induced current or magnetic field caused by a surface-breaking crack in the bore of the hole. However, if the surface of the hole contains benign mechanical damage or superficial scoring, false positives can be produced leading to potentially unnecessary maintenance on a hole that is otherwise sound. In principle, analysis of the phase of the eddy-current response can assist in distinguishing fatigue cracking from such mechanical damage. In the present work, a systematic BHEC and fractographic study has been conducted by inspecting several hundred fastener holes in ex-service F/A-18 aircraft bulkheads, following fatigue testing. The results demonstrate that measurement of the relative phase of the eddy-current response provides additional information which can assist in discrimination between genuine cracks and mechanical damage.