Discovering Pathways to Sustainability: Small … · Discovering Pathways to Sustainability: Small...
263
Discovering Pathways to Sustainability: Small Communities in Transition by Nigel Forrest A Thesis Presented in Partial Fulfillment of the Requirements for the Degree Master of Science Approved July 2011 by the Graduate Supervisory Committee: Arnim Wiek, Co-Chair Aaron Golub, Co-Char Charles Redman Dave White ARIZONA STATE UNIVERSITY August 2011
Transcript of Discovering Pathways to Sustainability: Small … · Discovering Pathways to Sustainability: Small...

Discovering Pathways to Sustainability: Small Communities in Transition
by
Nigel Forrest
A Thesis Presented in Partial Fulfillment
of the Requirements for the Degree
Master of Science
Approved July 2011 by the
Graduate Supervisory Committee:
Arnim Wiek, Co-Chair
Aaron Golub, Co-Char
Charles Redman
Dave White
ARIZONA STATE UNIVERSITY
August 2011
i
ABSTRACT
Driven by concern over environmental, economic and social problems,
small, place based communities are engaging in processes of transition to become
more sustainable. These communities may be viewed as innovative front runners
of a transition to a more sustainable society in general, each one, an experiment in
social transformation. These experiments present learning opportunities to build
robust theories of community transition and to create specific, actionable
knowledge to improve, replicate, and accelerate transitions in real communities.
Yet to date, there is very little empirical research into the community transition
phenomenon. This thesis empirically develops an analytical framework and
method for the purpose of researching community transition processes, the
ultimate goal of which is to arrive at a practice of evidence based transitions.
A multiple case study approach was used to investigate three community
transitions while simultaneously developing the framework and method in an
iterative fashion. The case studies selected were Ashton Hayes, a small English
village, BedZED, an urban housing complex in London, and Forres, a small
Scottish town. Each community was visited and data collected by interview and
document analysis. The research design brings together elements of process
tracing, transformative planning and governance, sustainability assessment,
transition path analysis and transition management within a multiple case study
envelope. While some preliminary insights are gained into community transitions
based on the three cases the main contribution of this thesis is in the creation of
the research framework and method. The general framework and method

ii
developed has potential for standardizing and synthesizing research of community
transition processes leading to both theoretical and practical knowledge that
allows sustainability transition to be approached with confidence and not just
hope.

iii
To Carole

iv
ACKNOWLEDGMENTS
I would like to thank my committee members for their help and support. In
particular, I thank my co-chair Arnim for his patience and guidance, for the time
he gave over the summer, and for pushing me across the finish line. Thank you to
Aaron for his willingness at a late hour to become a co-chair, and thank you to
Chuck and Dave for putting up with my numerous scheduling changes and the
near interminable wait to see something of this work.
I would like to thank the transition communities for allowing me to see
inside their world and making time for interviews (names have been withheld for
anonymity). I would also like to thank the following people for their help in
scheduling interviews, responding to my inquiries and making me welcome in
their busy schedules: Marie Jacques of Forres, John Riley of Biggar, Kate
Harrison of Ashton Hayes, Maggie Fyffe of the Isle of Eigg, Jennie Organ of
BioRegional (BedZED), and Lianne Milligan of the Findhorn Foundation. For the
most part, the people involved are voluntary community members and the time
they gave to this research was their own, for which I am very grateful.
Finally, I would like to acknowledge and thank the School of
Sustainability at Arizona State University for the travel grant awarded towards
this research.

v
TABLE OF CONTENTS
Page
LIST OF TABLES ix
LIST OF FIGURES xiii
CHAPTER
1 BACKGROUND ................................................................................... 1
Introduction ......................................................................................... 1
Research Questions and Contribution ................................................ 2
Communities in Transition ................................................................. 4
Transition Management ...................................................................... 7
Community Transition Concepts ..................................................... 10
2 RESEARCH DESIGN ........................................................................ 13
Overview ........................................................................................... 13
Case Selection ................................................................................... 14
Conducting the Single Case Study ................................................... 16
Analyzing the Single Case Study ..................................................... 17
Analytical Method for Community Transitions............................... 19
Community Analysis Framework ........................................ 23
Sustainability Appraisal Framework ................................... 25
Transition Path Analytical Framework................................ 33
Transition Management Analytical Framework .............................. 40
3 RESULTS ............................................................................................ 45
Case Selection ................................................................................... 45

vi
CHAPTER Page
Conducting the Single Case Studies ................................................ 48
Ashton Hayes .................................................................................... 50
Introduction .......................................................................... 50
Summary of Transition Output Sustainability Appraisal .... 51
Analysis of Transition Outputs ............................................ 54
Transition Path Analysis ...................................................... 62
Transition Management Appraisal ...................................... 76
Outlook for Ashton Hayes ................................................... 79
Summary of Ashton Hayes Transition Strategic Factors .... 80
BedZED ............................................................................................ 82
Introduction .......................................................................... 82
Summary of Transition Output Sustainability Appraisal .... 85
Analysis of Transition Outputs ............................................ 89
Transition Path Analysis .................................................... 100
Transition Management Appraisal .................................... 114
BedZED Outlook ............................................................... 117
Summary of BedZED Transition Strategic Factors .......... 118
Forres ............................................................................................... 121
Introduction ........................................................................ 121
Summary of Transition Output Sustainability Appraisal .. 122
Analysis of Transition Outputs .......................................... 124
Transition Path Analysis .................................................... 132

vii
CHAPTER Page
Transition Management Appraisal .................................... 145
Outlook for Forres .............................................................. 148
Summary of Forres Transition Strategic Factors .............. 150
4 CASE COMPARISON ..................................................................... 151
Case Level Comparison .................................................................. 151
Sustainability Appraisal ..................................................... 158
Indicator Level Comparison ........................................................... 161
Car Dependency ................................................................. 162
Energy Use and CO2 Emissions ........................................ 167
Food Production ................................................................. 172
Transition Management Comparison ............................................. 176
5 DISCUSSION ................................................................................... 180
Understanding Community Transitions ......................................... 180
Overall Community Transition Results and Transition
Theory ................................................................................. 180
Insights into Community Transitions ................................ 182
Future Research Directions ................................................ 185
Research Design: ............................................................................ 186
Shortcomings in the Research Method .............................. 186
Data Collection and Preparation ........................................ 187
Analytical Method and Frameworks ................................. 188
Templates & Tools ............................................................. 190

viii
CHAPTER Page
Application of the Research ........................................................... 190
6 CONCLUSION ................................................................................. 194
REFERENCES 197
APPENDIX
A COMMUNITY BASED SUSTAINABILITY ORIENTED
TRANSITION GROUPS ............................................................. 202
B INTERVIEW QUESTIONS ............................................................ 205
C SUSTAINABILITY INDICATOR DESCRIPTIONS .................... 208
D SUSTAINABILITYAPPRAISALS ................................................ 218
E TRANSITION PATH CHART LEGEND ...................................... 234
F SUMMARY DESCRIPTIONS OF PATH ACTIVITIES BY
CASE ............................................................................................. 237
G COPYRIGHTED WORK ................................................................ 245
H INSTITUTIONAL REVIEW BOARD APPROVAL .................... 247

ix
LIST OF TABLES
Table Page
1. Transition Community Dimensions ....................................................... 7
2. Case Selection Criteria .......................................................................... 15
3. Criteria Used For Sustainability Appraisal........................................... 27
4. Community Transition Sustainability Indicator Set. ............................ 29
5. Sustainability Appraisal Rating ............................................................ 31
6. Transition Path Analytical Framework Activities ................................ 37
7. Transition Path Analytical Framework Actors..................................... 38
8. Transition Path Analytical Framework Barrier Classes ....................... 39
9. Transition Path Analytical Framework Output Classes ....................... 39
10. Theoretical Principles of Transition Management ............................. 41
11. Adapted Transformative Planning and Governance Steps ................ 44
12. Case Selection Short List .................................................................... 46
13. Ashton Hayes Transition Profile ........................................................ 50
14. Ashton Hayes Transition Outputs and Sustainability Appraisal ....... 52
15. Ashton Hayes HOUSEHOLD ENERGY USE Output Analysis ...... 55
16. Ashton Hayes TREE PLANTING Output Analysis .......................... 57
17. Ashton Hayes STATION FOOTPATH Output Analysis.................. 59
18. Ashton Hayes RECYCLING Output Analysis .................................. 60
19. Ashton Hayes COMMUNITY SHOP Output Analysis .................... 61
20. Ashton Hayes Transition Path Segment To Output Map .................. 63

x
Table Page
21. Appraisal of Ashton Hayes Similarity to Transition Management
Principles ............................................................................................. 77
22. Appraisal of Ashton Hayes Similarity to Transformative Method
Steps .................................................................................................... 79
23. Ashton Hayes Strategic Factors Contributing To Successful
Outcomes ............................................................................................ 81
24. BedZED Profile ................................................................................... 82
25. BedZED Transition Outputs and Sustainability Appraisal ................ 86
26. BedZED LOW ENERGY HOUSING Output Analysis ................... 90
27. BedZED LOW WATER Output Analysis ......................................... 91
28. BedZED COMMUNITY Output Analysis. ....................................... 94
29. BedZED GWTP Output Analysis. ..................................................... 98
30. BedZED CHP Output Analysis. ......................................................... 99
31. BedZED MBR-WTP Output Analysis. ............................................ 100
32. BedZED Path Segments .................................................................... 101
33. Appraisal of BedZED Similarity to Transition Management
Principles ........................................................................................... 115
34. Appraisal of BedZED Similarity to Transformative Method Steps 117
35. BedZED Strategic Factors Contributing To Successful Outcomes . 119
36. BedZEDStrategic Factors Contributing To No Change Or a Decrease
In Sustainability Indicator. ............................................................... 120
37. Forres Profile ..................................................................................... 121

xi
Table Page
38. Forres Transition Outputs and Sustainability Appraisal .................. 123
39. Forres PLASTIC BAG Output Analysis .......................................... 125
40. Forres COMMUNITY GARDEN Output Analysis ........................ 126
41. Forres FARMERS’ MARKET Output Analysis ............................. 128
42. Forres LOCAL FOOD GUIDE Output Analysis............................. 129
43. Forres CARBON PLEDGES Output Analysis ................................ 131
44. Forres Transition Path Segment To Output Map ............................. 132
45. Appraisal of Forres Similarity to Transition Management
Principles ........................................................................................... 146
46. Appraisal of Forres Similarity to Transformative Method Steps .... 148
47. Forres Strategic Factors Contributing To Successful Outcomes ..... 150
48. Cross Case Comparison of Actors .................................................... 152
49. Cross Case Comparison of Activities ............................................... 156
50. Output Types, Cost and Workforce .................................................. 158
51. Change In Sustainability Indicator Case Comparison ..................... 162
52. Comparison Of Strategic Actions And Factors For Car Dependency
Indicator ............................................................................................ 163
53. Comparison Of CO2 Emissions And Sustainability Appraisals. .... 168
54. Comparison Of Strategic Actions And Factors For Energy Use And
CO2 Emissions Indicator .................................................................. 170
55. Comparison Of Strategic Actions And Factors For Food Production
Indicator ............................................................................................ 174

xii
Table Page
56. Comparison Of Transformative Planning And Governance
Appraisals .......................................................................................... 179
57. Illustrative Actions to Influence Transition Variables ..................... 192

xiii
LIST OF FIGURES
Figure Page
1. Community transition concepts. ........................................................... 11
2. Multiple-case study method. ................................................................. 13
3. Single case analytical method. .............................................................. 20
4. Analytical framework for community based sustainability research .. 25
5. Transition path analysis process ........................................................... 35
6. Ashton Hayes sustainability of appraisal of outputs by sustainability
criterion. .............................................................................................. 53
7. Ashton Hayes sustainability appraisal of outputs by domain. ............. 53
8. Ashton Hayes transition path.. .............................................................. 64
9. Ashton Hayes transition path segment 1(STARTUP) ......................... 65
10. Ashton Hayes transition path segment 2 (HOUSEHOLD ENERGY
USE) .................................................................................................... 67
11. Ashton Hayes transition path segment 3 (TREE PLANTING) ........... 71
12. Ashton Hayes segment 4 (STATION FOOTPATH) ........................... 72
13. Ashton Hayes transition path segment 5 (RECYCLING) ................... 73
14. Ashton Hayes transition path segment 6 (COMMUNITY SHOP) ..... 74
15. BedZed tiered design concept linked to sustainability outcomes ........ 84
16. BedZED sustainability appraisal of outputs by sustainability
criterion. .............................................................................................. 88
17. BedZED sustainability appraisal of outputs by domain. ..................... 88
18. BedZED transition path.. .................................................................... 102

xiv
Figure Page
19. BedZED transition path segment 1 (STARTUP) ............................... 103
20. BedZED transition path segment 2 (LOW ENERGY HOUSING,
LOW WATER HOUSING) ............................................................. 104
21. BedZED trasition path segment 3 (COMMUNITY) ......................... 108
22. BedZED trasition path segment 4 (CHP, GWTP, MBR-WTP) ........ 111
23. Forres sustainability of appraisal of outputs by sustainability
criterion. ............................................................................................ 124
24. Forres sustainability appraisal of outputs by domain. ........................ 124
25. Forres transition path........................................................................... 133
26. Forres transition path segment 1 (STARTUP). .................................. 134
27. Forres transition path Segment 2 (PLASTIC BAGS) ........................ 137
28. Forres transition path Segment 3 (COMMUNITY GARDEN) ........ 138
29. Forres transition path Segment 4 (FARMERS MARKET) ............... 140
30. Forres transition path segment 5 (LOCAL FOOD GUIDE) ............. 142
31. Forres transition path segment 6 (CARBON PLEDGES) ................. 143
32. Cross case change in sustainability over time. ................................... 159
33. Cross case change in sustainability by sustainability criterion .......... 160
34. Cross case change in sustainability by community domain .............. 161
35. Mapping of cases to transition management principles.. ................... 179

1
BACKGROUND
Introduction
The importance of community participation, in sustainable development
has been recognized at least as early as the Brundtland Report and the idea was
further developed in Local Agenda 21 (Warburton, 1998). Of course, there have
long been communities intent on seeking alternatives to mainstream society for
various purposes (Schapiro, 1962) and the idea of creating urban utopias is not
new (Miles, 2008). Alternative communities based at least partly on
environmental ideals became quite common the 1960's, some of them surviving
until today (Dawson, 2006; Miles, 2008). More recently however, the idea of
sustainable communities has moved more into the mainstream from its marginal
status on the periphery of western society. In reaction to the erosion of community
by the rise of individualism, globalization and commercialization over the last
fifty years (Putnam, 2001) and in response to escalating persistent, inter-related,
global social and environmental problems community based solutions may offer a
way forward. Many hundreds of community based sustainability transitions have
been initiated in the last decade, mostly in Europe, N. America and Australasia.
Government, especially in the U.K., has recognized the possibility of
communities being an effective driving force for sustainable development and has
been an important source of funding for some (Seyfang & Smith, 2007), though
perhaps also because it relieves them of the responsibility and places the burden
on others (Alexander, Hope, & Degg, 2007).
2
This thesis concentrates on the possibility that community based
sustainability transitions offer useful knowledge to support transformation of
society from its current unsustainable state to one of sustainability. These
communities may be viewed as front runners or "site[s] of innovation for
sustainability" (Seyfang & Smith, 2007), each one an experiment in social
transformation. What can be learned from this rich seam of information about the
process of transition and critically, how can this knowledge be used to accelerate
and reproduce the most beneficial and desirable results in other communities? The
overall concept behind this research is to combine inductive, empirical study of
transitional communities with theoretical models of transformative change to
produce practical knowledge that is directly applicable in the field. Ultimately, the
goal is to produce actionable knowledge and a practice of evidence based
transition, towards which this thesis is just a first step.
Research Questions and Contribution
In line with the overarching goal that this research contributes to, the
following research questions are asked:
1. What outputs did the transition community produce and how effective
were the outputs at increasing community sustainability?
2. How did the transition community produce the outputs?
3. How closely does the transition process conform to the transition
management approach?
4. What should other communities do to make their transitions more
successful?

3
The general research strategy consists of a multiple case study with an
emphasis on theory building as opposed to theory testing. The research is very
much exploratory as there is very little empirical research on community based
sustainability transitions to build on (Middlemiss, 2008). While empirical studies
of sustainability transitions abound for various units of analysis (e.g. community,
city, region) they tend to focus on accomplishments and not process, and those
that do analyze process tend to do so in a way that is specialized and not generally
reproducible. To build knowledge of transitions empirical studies producing data
that is robust and consistent are needed. Baty's (2010) multiple case study of
sustainable transitions at city level is an exception to this and provided conceptual
seeding for this thesis. Middlemiss's (2008) work has similarities to the current
work in that it creates a framework of community contexts, mechanisms and
outcomes for the purpose of building research across case studies in a generalized
manner. However, it is more specifically designed for linking community action
to individual sustainable behavior and it does not analyze process in detail.
Given the lack of prior work on which to model community transition case
studies a fifth research question must be added:
5. How should we do research to understand how community transitions
work?
A large part of this thesis has gone into answering this question. The
primary contributions of this work then are twofold: (1) the development of an
analytical framework and method for the empirical study of community transition

4
processes; and (2) a multiple case study of three community transitions using the
aforementioned method.
Communities in Transition
What is meant by a "community transition" or more precisely, a small,
place based, community sustainability transition? For the purposes of this
research, community is defined as "a place-oriented process of interrelated actions
through which members of a local population express a shared sense of identity
while engaging in the common concerns of life" (Theodori, 2005). This definition
does not necessarily constrain the size of the community: it could equally well
apply to a city or a village, thus the "small" qualifier is used to emphasize the
importance of personal relationships. Warburton describes community as being
about "relationships between people" and "relationships between people and the
place in which they are located" (Warburton, 1998) of which the former will be
stronger in smaller communities. Personal relationships matter because they can
translate into "caring" for others, or neighborliness (Warburton, 1998), which can
begin to break down the culture of individualism and build community values in
its place (McIntosh, 2008). Strong communities however, are not necessarily
sustainable communities but they are more likely to be so than weak communities
(McIntosh, 2008). The attachment to place is also important for sustainability as
the place that people live in is their most immediate connection to the
environment (Warburton, 1998), whether it is through litter, smog, noise, the
weather, the view, the park, the local wildlife or whatever else.

5
The second part of the unit of analysis for this research is that the
community should be in a "sustainability transition". This is taken to mean here
that the community, or a community within the community, is part of a deliberate
attempt to change the community towards a more sustainable future, or create a
new community that is more sustainable than the current standard for new
construction.
Community transitions exist in many forms. Some of them belong to
movements, with internal communications, organization and operation, others to
looser umbrella organization or peer networks, while some are independent. Some
examples are: Transition Towns which have a strong localization focus aimed at
creating more resilient, capable and sustainable communities (Brangwyn &
Hopkins, 2009); EcoVillages which make community and spirituality central to
their mission and developing sustainable lifestyles and infrastructure around it
(van Schyndel Kasper, 2008); New Urbanism (www.newurbanism.org) which
constructs community oriented urban developments with the expectation that this
will in build stronger communities; community land trusts empowering
communities through property rights (Bailey, 2010; Mackenzie, MacAskill,
Munro, & Seki, 2004). See Table 1, Appendix A for a list of types. While these
communities and others like them do not all have sustainability as their primary
objective, they do all have some sort of transition targeting relatively small, place
based communities as their aim, and where sustainability was not the original
motivation, it may become an important goal.

6
The choice of "small" communities for this research then, arises from their
propensity to sustainability and the current trend for action that is apparent at this
scale. However, there is another reason for focusing at small scale, and that is that
small communities are assumed to be easier to study than large. Baty's (2010)
case study of cities showed the difficulty of analyzing complex phenomenon like
transitions at this scale. Neighborhoods, villages, small islands and towns may be
better research subjects than cities, regions or countries because their smallness
makes them simpler: they have less data and less noise, there are fewer actors and
interactions, more people have greater knowledge of the entire system, and they
are more accessible.
These communities do not exist in isolation. To varying degrees they
depend on neighboring or "host" communities, they function within the context of
local and national government, they utilize general infrastructure, services and
amenities, and they are influenced by the prevailing societal landscape. This
places a limitation on the degree to which they can become sustainable and may
be an important factor in determining what the optimum size should be of a
community pursuing sustainability. BioRegional estimate it might be somewhere
around populations of 2,000 to 5,000 (M. Peacock, personal communication,
January 13, 2011). But transition communities may also be an influence on their
surroundings as well as being influenced by them, and may exert sufficient
pressure on the host systems to bring about change. For some community
transitions wider "regime change" is an explicit part of their purpose: to change
the existing institutions, norms and standards to support mainstream movement

7
towards sustainability. This "activism" may also extend to deliberate efforts to
replicate transitions in other communities. Thus transition communities may seek
to advance sustainability in three ways: through internal growth, through
replication, and through regime change. In addition to "purpose" other
characteristics of transition communities are defined in Table 1.
Table 1.
Transition Community Dimensions
Dimension From To
Purpose - Is the community
seeking regime change?
(Seyfang & Smith, 2007)
Active – deliberately pursues
institutional change and
seeks to initiate new
communities (external
growth).
Passive – Is focused on
'intrinsic' benefits only and is
agnostic to wider change.
Dispersal - How is the
community contained within
or coexisting with other
communities? Closely
related to the growth model.
Concentrated – the
community is spatially
contiguous residing within
clearly definable physical
boundaries. There is no
spatial mixing with another
'non-transition' community.
Dispersed – the transition
community exists within a
'host' community and
members are dispersed
throughout it.
Growth - Assuming internal
growth is desirable and
possible how does the
community increase its
population?
Migration – the community
must attract new members
who deliberate move to
become part of it. This is the
same as an 'intentional'
community.
Conversion – the transition
community seeks to convert
the population of the host
community to join it.
Transition Management
According to transition theory, fundamental change to the structure of
society moves through distinct phases, typically over a period of 1 – 2
generations, and can be one of two types: evolutionary, in which the outcome is

8
not planned, and teleological, in which a specific goal is sought (Loorbach &
Rotmans, 2006). Transition to a sustainable society is clearly of the goal seeking
type. Transition management attempts not to directly implement change, but to
manage properties of the system and the process, through experimentation,
learning and anticipation, in order to steer the overall direction and accelerate
change towards the goal (Loorbach & Rotmans, 2006). The transition
management framework operationalizes transition management theory into a
prescriptive method for initiating and managing sustainable transitions of socio-
technical systems (Loorbach, 2007). The approach focuses on creating "protected"
space to allow "innovation niches" to operate, in which experiments in alternative
culture, structures and practices can take place relatively unhindered by the
"regime", where the regime is the dominant set of culture, structures and
practices, or in other words, the standard "rules of the game" (Rotmans &
Loorbach, 2010). The most promising innovations are selected from the niche and
policy measures are taken to assist their deployment into the mainstream
(Rotmans & Loorbach, 2010).
Transition management then, might be a means by which community
transitions can be diffused into mainstream society. Seyfang and Smith (2007)
identify community transitions as "social" innovation niches. Kemp and Martens
(2007) point to the use of transition management as an appropriate approach to
sustainable development but note that its application to date has tended to be
confined to sectoral projects, water or waste management for example, and
question its ability to change culture and behavior. But relying on technocratic

9
solutions alone is unlikely to be a viable long term strategy for attaining
sustainability as they do little to change upstream drivers such as excessive
consumerism and unbounded economic growth (Ehrenfeld, 2008; Wiek, 2010). In
reality, the social and technical sides of socio-technical systems are not separable.
Geels (2005, p. viii) sees technology as a "heterogeneous configuration of
elements that work" in which "social and technical aspects are always intertwined
and constitute each other". Focusing transition efforts on one or more discrete
socio-technical systems will have unknown wider societal outcomes (Ehrenfeld,
2008; Shove & Walker, 2010). If the goal is societal transformation, then the
subject of transition should be the entire social system and not just specific sectors
of it. Loorbach (2007) describes two cases in which transition management is
applied more generally to regional scale societal systems but application at small
community level is, to my knowledge, new.
Wiek (2010) draws on concepts from transition management and other
planning and governance approaches that have been developed over the last
decade or so to create a synthesized template for transformative planning and
governance for developing strategies for the transformation of regions and cities
and, why not also small communities? The template embodies several key
principles: long term future orientation; systemic understanding of problems;
sustainability as a guiding concept; future visions and pathways from the present;
and stakeholder participation.
Neither of these approaches has been empirically validated. If we assume
however that the theory on which they are based is valid then it follows that

10
successful community transitions might be expected to exhibit the same
operational principles, though not necessarily known to the transition community.
If more successful community transitions tend to correlate positively with
transition principles than less successful community transitions then this would be
a validation of transition theory. A negative correlation could suggest the theory is
invalid or more likely, that there are multiple ways to achieve successful
transitions.
Community Transition Concepts
Before describing details of the analytical frameworks used some basic
concepts of community transitions used throughout the thesis need to be
established. Community transitions consist of the transition process and the
transition substance as shown in Figure 1. The transition’s purpose is to effect
change in the community that leads towards the goal of sustainability. Typically
transitions do this by executing projects to produce outputs where an output is
some substantive change in the community. The output of a project consists of
one or more components. Outputs vary from a single, easily identifiable
component to a complex, multi-stranded basket of components. Output
components are direct, tangible changes in the community "system" that may be
structural or behavioral in nature, but they are deliberative. For example, closing a
road or banning driving every Wednesday are structural changes (infrastructural
and regulative) whereas asking people to "Walk on Wednesdays" is a deliberative,
direct action, behavioral change. Component implementation may take place at a
discrete point in time or over an extended period, in some cases several years.

11
Output components may result in further changes to the system or outcomes,
intended or not, that may occur immediately following implementation or lag
behind it. In the above example, increased pedestrianism may result from either of
the structural changes. The eventual cumulative change resulting from an output
is the sum of all direct and indirect changes resulting from the implementation of
all the components.
Figure 1. Community transition concepts.
A simple hypothetical example may help to explain these concepts further.
A transition community executes a traffic reduction project aimed at reducing
high street traffic congestion. The traffic reduction project output consists of a
new parking fee component which takes effect immediately on its
implementation. Over some time following implementation high street traffic
declines and pedestrianism increases. The outcomes of the project then are: (1)
new parking regulations; (2) less traffic; and (3) more pedestrians. The elements
of this example are: the project (traffic reduction); the project output (traffic

12
reduction); the output components (implement parking fee); the project outcomes
consisting of structural change (regulations) and behavioral change (driving,
walking).

13
RESEARCH DESIGN
Overview
The overall research method follows that of the typical multiple-case study
method described by Yin (Yin, 2003) and shown in Figure 2 in which cases are
selected and data collection instruments designed around the research question, an
independent single case study is conducted and analyzed for each case, and the
findings from each of the single case studies are compared and conclusions made.
Figure 2. Multiple-case study method. Adapted from figure 2.5 in Case Study
Research: Design and Methods (p50), by R. K. Yin, 2003, Thousand Oaks, Calif:
Sage Publications. Copyright 2003 by Sage Publications Inc. Adapted with
permission
A case study research strategy was chosen because it is most suited to the
nature of the research. Yin recommends using case studies when "a how or why

14
question is being asked about contemporary set of events over which the
investigator has little or no control" (Yin, 2003, p. 9). Attempting to understand
how successful transitions work is research of an explanatory type (it is a "how
question"), focused on live and active communities (is contemporaneous), and
can only be studied in-situ in its real-world context (no investigator control).
Multiple case study was selected over single case study because of its ability to
produce more robust results: conclusions are stronger when arrived at from
independent cases and findings are more generalizable when originating from two
cases of differing context (Yin, 2003, p. 53). Grin et al. (2010, p. 99) also note
that case studies allow "detailed process tracing" and "exploration of patterns"
which is important for investigating transition phenomena.
Case Selection
Selection of cases for study was based on criteria relating to the unit of
analysis (small, place based communities engaged in a sustainability transition)
and practical considerations. The criteria are described in Table 2. The number of
cases was targeted at between five and eight thereby providing sufficient cases for
possibilities of "literal replication" and "theoretical replication" across cases as
recommended by Yin (2003, p. 53). However, the nature of the research is more
exploratory than theory testing and no attempt has been made to select cases
based on hypothesized controlling variables.

15
Table 2.
Case Selection Criteria
Criteria Description
Sustainability
Transition
The community, or a significant subset of the community, is trying to
change the community to become sustainable or in the direction of
sustainability.
Place Based Community members reside within and identify with a common area
bounded by well defined geographical features. This excludes
communities of interest.
Spatial Extent Roughly rural < 5,000 ha, Urban < 500 ha.
The community should be small enough in area that members can
routinely interact on a daily basis and be familiar with the whole area.
This could be defined as "walking scale" but this might not be totally
accurate in larger area, rural communities.
Total
Population
50 < P <5,000
This is the total number of people residing within the community
boundaries. Minimum population is important to lend credibility to the
initiative and for it to have some wider significance.
Transition
Participation
The level of participation, i.e. to what extent is the population actively
engaged in the transition. This is important for the initiative to have
significance and credibility but exactly what this level should be is an
arbitrary choice. It will also vary depending on the type of initiative and
phase of transition. Transition Towns for instance, as dispersed
conversion transitions, start as a small group with the intention of
growing until the transition subpopulation approaches the total
population. Intentional communities however, as concentrated
migration transitions, may begin with a transition subpopulation equal
to the total population and grow the total population while keeping
participation high. It is also important to allow for communities early in
transition that may have low participation because they only recently
started. The degree of participation can also vary from total non-
participation through to full time activist. Thus the absolutely minimum
participation needs to be considered on a case by case basis but as a
loose guideline it should at least be 10 people active on a weekly or
greater basis. Below this, questions of significance and credibility
become increasingly relevant, regardless of other considerations.
Transition
Initiated Date
The date that community transition began. This should be no later than
2008 or there will be little data to collect and analyze.

16
Criteria Description
Location The community is accessible and realistic for travel, which is
constrained by time and budget. The set of cases should all be from the
same country.
Agreeable The community needs to be willing and able to participate.
Conducting the Single Case Study
Case data collected consists of documents, literature, observation notes
and interview transcripts. Site visits are part of the case study in order to conduct
face-to-face interviews and to gain first-hand experience of the community and
place. Falleti (2006) recommends in-depth analysis of primary sources for the
detailed familiarity with the case it produces. Generally, two interviews are
conducted at each site with community members closely involved or familiar with
the transition and its history. Interviews are about two hours long and consist of a
mixture of open and closed ended questions. The questions are loosely designed
around transition management theory as this is where the research was most
strongly focused at that stage however, they are also general and open enough to
allow the interviewee to provide a great deal of data on the transition. The
interview questions are listed in Appendix B.
Using interview data, documents, literature and follow up emails a case
chronicle is compiled consisting of a chronological table of events and activities.
Each entry in the chronicle consists of the date, a narrative (description and notes
on the action), the action (what happened), the actors (who was involved), the
motivation (why was it done), the inputs (what factors shaped the particular form
of the action), and the outcome (what impact did it have on the community or

17
outside the community, i.e. the "regime"). The purpose of the chronicle is to
create a general database of the transition process that supports various higher
level analyses for the current research but potentially future studies as well. The
chronicle then should be as complete as possible and ideally, not filtered by the
researcher compiling it. In practice this is very time consuming and some amount
of selectivity on what to include is necessary, the most common being level of
detail. The data entered in these chronicle fields are specific to the case being
documented. Compiling the chronicle on one hand is straightforward descriptive
documentation but it also begins the analytical process, starting with the
breakdown of the narrative into actions, actors, motives etc. Chronicle analysis
continues with the mapping of case specific actions and actors to general
analytical framework categories.
Analyzing the Single Case Study
The analytical method is embedded within the single case study part of the
overall research method shown in Figure 2. The same process is applied to each
case, taking raw case data as input and converting it into a generalized form
aligned with the research questions. As Langley put it, the task is to move "from a
shapeless data spaghetti toward some kind of theoretical understanding that does
not betray the richness, dynamism and complexity of the data" (as cited in Grin et
al., 2010, p. 99). The data produced by the analysis is in a form that lends itself to
comparison across cases. This is standard procedure for multiple-case studies
(Yin, 2003, pp. 49-50).

18
The specific analytical method used needs to take into account the
essential nature of the research question being asked: how can communities
become sustainable. It attempts to do this by pursuing three basic lines of inquiry:
1. What did they (the community) do?
2. How did they do it?
3. How successful was it?
"What did they do?", or just "What?" refers to the changes in the
community produced by the transition process. This is the substantive difference
in the state of the system (the community) before and after some transition event.
The "What" is important because if transitions are to be evaluated for their
effectiveness at moving towards sustainability then there needs to be something
tangible to evaluate.
"How did they do it?" or just "How?" refers to the actions that led to the
completion of a project and the production of outputs. This is the transition
process as opposed to the transition substance (the "What"). The "How" is
important if an understanding of how to reproduce desirable transition outcomes
(or avoid undesirable outcomes) is to be obtained. Understanding how an output
is produced is not concerned with implementation details but is focused on the
"process that unfolds over time" (Grin et al., 2010, p. 99), of which
implementation is usually just the last in a complex series of steps involving
multiple, diverse actors and activities.
"How successful was it?" or just "Success?" refers to how successful in
terms of sustainability a project is judged to be. An appraisal of success (or

19
failure) is important as ultimately the objective is to understand how to reproduce
successful results.
There are no prior case studies to my knowledge, single or multiple, with a
similar unit of analysis (small communities transitioning to sustainability) that use
an analytical framework that is generalizable and reusable and that aligns with
these basic lines of inquiry. There are many studies of individual and multiple
community transitions but they do not adequately generalize to an extent that
makes them transferable and they do not address all three of these questions.
Valid in their findings and interesting as they may be, these studies cannot lead to
robust theory while they remain in the specific realm of unique cases and do not
attempt to link process to substance to outcomes in a reproducible manner. A
major part of this thesis therefore, is directed towards the development of an
analytical method to support the needs of the immediate research but also that can
be used in future studies to test and further develop community transition theory.
Analytical Method for Community Transitions
A general method for analysis of community transitions is developed as
part of, and used directly in, this thesis. The usefulness of this method however,
extends beyond the current research to future case studies of community
transitions for purposes of testing and further developing community transition
theory.
The overall analytical method is shown in Figure 3. Taking case data as
input, a process of filtering, classifying, and mapping converts the data into a
generalized form structured around the three basic lines of inquiry (What, How &

20
Success) that can be compared directly across cases. There are three important
aspects to the overall process: (1) the splitting and the recombining of the process
into two analytical channels , one analyzing process (How) and the other
analyzing substance (What and Success); (2) the structuring of the analysis and
the data is related to the community transition concepts of projects, outputs and
components described above; (3) the use of multiple analytical frameworks to
support systematic and generalized structuring of data in ways that are relevant to
the end needs. Existing analytical frameworks are used when available and new
ones developed when they are not.
Figure 3. Single case analytical method.
Using the case data collected and prepared in conducting the single case
study, transition outputs are identified. The outputs correspond to projects that the
transition community executed which, within cases and across cases, vary greatly
in their scope, magnitude and nature. Where it is not clear if some
accomplishment is the only component of a single component project or if it

21
belongs to a bigger project it is generally added to the larger project. However,
large projects with many output components that are too highly aggregated to
allow informative analysis at the output level are split into multiple outputs,
keeping more closely related components along implementation or structural lines
together.
Taking the lower analytical branch first, (the transition substance), the
process proceeds as follows:
1. Components of project outputs are identified by scanning the case
data. Components are the products directly implemented during the
project. After identification, they are used to construct a more in depth
analysis of both direct and indirect changes to the system (the
community) using the community analysis framework (2). See
Community Analysis Framework for more detail on this framework.
2. Community impacts are mapped onto the sustainability appraisal
framework (3) by identifying which sustainability indicators may be
influenced by them.
3. An appraisal of the change in the identified sustainability indicators
using the sustainability appraisal framework (3) provides an indication
of the movement towards (or away) from sustainability relative to the
state of the system before the output was implemented. See
Sustainability Appraisal Framework for more details on this process.

22
4. At the end of the transition substance analysis, for each transition
output there will be:
Output components
A descriptive analysis of the impacts on the community system
Identification of sustainability indicators influenced by the impacts
An appraisal of the change in each identified sustainability
indicator
Now taking the upper analytical branch (the transition process), the
process proceeds as follows:
1. The transition path to the output is reconstructed in reverse from case
data. Paths for all outputs are merged to create an overall transition
paths chart. Paths identify major conjunctions of activities, actors,
intermediate outputs and barriers in a time dependent sequence. See
Transition Path Analysis Framework for a more detailed description.
2. Using the transition paths chart and case data, rich narratives are
written describing aspects of the path to each output salient to an
understanding of how the output was accomplished such as important
collaborations, enablers, and barriers.
3. Key strategic success or failure factors that led to the output are
identified from the rich narratives.
4. At the end of the transition process analysis, for each transition output
there will be:
A transition path chart.

23
A rich narrative.
Strategic factors
The final step in the analytical method is to combine the results from the
lower (substance) and upper (process) analyses at the level of transition output.
For each output, the appraised change in sustainability, as represented by a subset
of sustainability indicators, can be associated with the key strategic factors that
led to the output. More specific mapping of indicators to strategic factors
however, is not possible with the method used here because strategy applies to the
whole process in which multiple transition components are not independently
produced but are the result of integrated projects.
Community Analysis Framework
The purpose of community analysis framework is to understand where in
the community changes are happening as a result of transition outputs. At least as
important as the structural aspects of communities (e.g. technical, architectural,
infrastructural) are the behavioral aspects: what people do, for it is the actions of
people, driven by "upstream" needs, desires and rules that utilize the
"downstream" services that the structure provides (Wiek, 2010; Wiek, Kay,
Boone, & Ledlow, 2010, pp. 14-15). Wiek’s (2010) Activity – Supply framework
(Figure 4) centers on activities and their corresponding supply systems thereby
addressing "actor-structure dichotomy" and is used here for descriptive analysis of
transition induced change. Wiek et al. summarize the features of the framework as
follows:

24
The horizontal structure of the framework comprises of eight activity
domains and corresponding supply systems. The rationale behind this set
of activity domains is that they cover about 90% of the personal time
budget. Cutting across these activity domains and supply systems are
community values including health, safety, quality of the natural
environment, and so forth (vertical structure) (2010, p. 15).

25
Figure 4. Analytical framework for community based sustainability research
(Wiek, 2010)
Sustainability Appraisal Framework
Sustainability appraisal is used to evaluate the relative change in the
sustainability of the community as a result of transition. The sustainability
appraisal framework used for this purpose consists of analytical and normative
parts. The analytical part consists of a set of sustainability indicators and the

26
normative part, a set of criterion for judging sustainability. The combined
normative-analytical framework provides a structure and a process by which to
appraise the change in sustainability resulting from a transition output.
The term sustainability appraisal is deliberately chosen over sustainability
assessment to differentiate the processes used and the comprehensiveness and
degree of rigor applied in evaluating sustainability. Sustainability assessment is a
much used term referring to a "vast diversity" of practices, something that Gibson
(2006) has attempted to address by proposing a move towards "comprehensive
adoption and more consistent application of the requirements and processes".
Although drawing on some of Gibson’s requirements, the sustainability
evaluation here is not a full assessment à la Gibson and is therefore referred to as
an appraisal.
Sustainability is a normative concept and it is therefore important to define
the standards by which an evaluation of sustainability is made. For the
sustainability appraisal here, a modified version of Gibson’s (2006) set of core
criteria for sustainability assessment is used (Table 3).
27
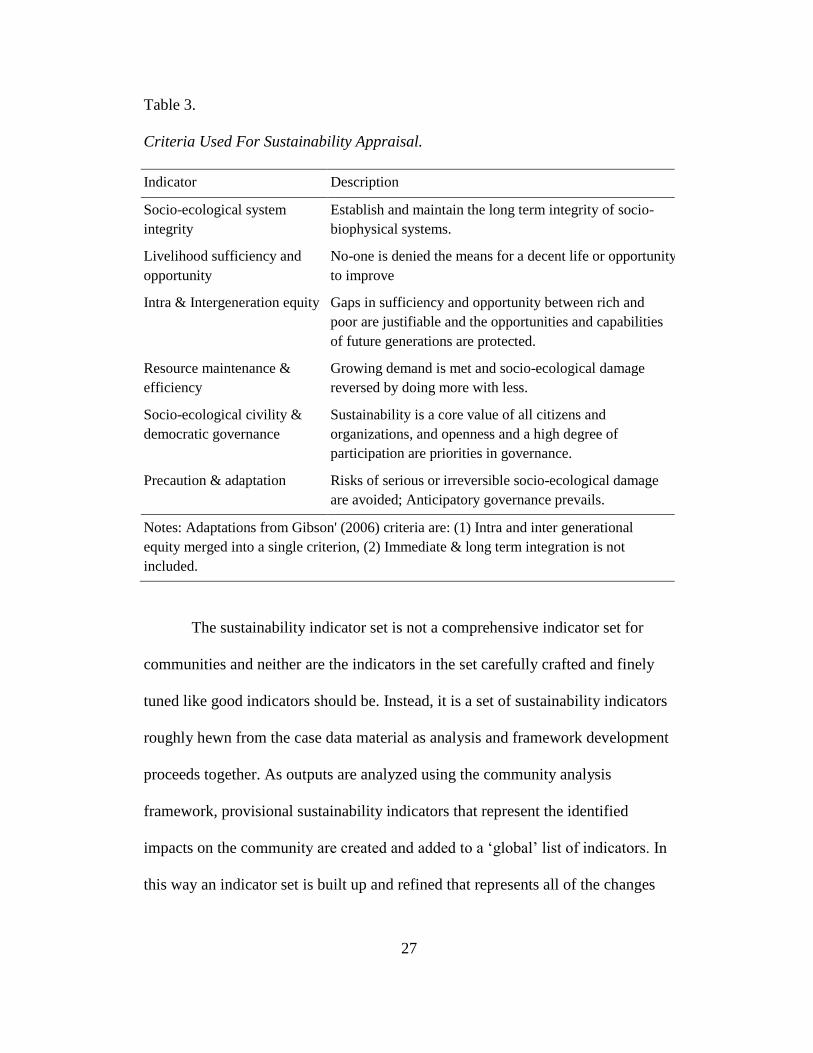
Table 3.
Criteria Used For Sustainability Appraisal.
Indicator Description
Socio-ecological system
integrity
Establish and maintain the long term integrity of socio-
biophysical systems.
Livelihood sufficiency and
opportunity
No-one is denied the means for a decent life or opportunity
to improve
Intra & Intergeneration equity Gaps in sufficiency and opportunity between rich and
poor are justifiable and the opportunities and capabilities
of future generations are protected.
Resource maintenance &
efficiency
Growing demand is met and socio-ecological damage
reversed by doing more with less.
Socio-ecological civility &
democratic governance
Sustainability is a core value of all citizens and
organizations, and openness and a high degree of
participation are priorities in governance.
Precaution & adaptation Risks of serious or irreversible socio-ecological damage
are avoided; Anticipatory governance prevails.
Notes: Adaptations from Gibson' (2006) criteria are: (1) Intra and inter generational
equity merged into a single criterion, (2) Immediate & long term integration is not
included.
The sustainability indicator set is not a comprehensive indicator set for
communities and neither are the indicators in the set carefully crafted and finely
tuned like good indicators should be. Instead, it is a set of sustainability indicators
roughly hewn from the case data material as analysis and framework development
proceeds together. As outputs are analyzed using the community analysis
framework, provisional sustainability indicators that represent the identified
impacts on the community are created and added to a ‘global’ list of indicators. In
this way an indicator set is built up and refined that represents all of the changes

28
across all of the cases. The list is presented in summary form in Table 4 and more
detailed indicator definitions are given in Appendix C.

29
Table 4.
Community Transition Sustainability Indicator Set.
Indicator Description
Access to basic
services & amenities
Equitable access to services and amenities such as daily groceries
and household needs, health service, education, green space and
information
Biodiversity The quality of the natural environment, directly related to its
ability to support biodiversity and other ecosystem services.
Car Dependency The degree to which community members' well-being and
general welfare depend upon having access to and using a car.
Community Assets Anything that is useful or of value to the community.
Employment Direct employment created (or supported) in the community.
Energy use & CO2
emissions
The amount of energy used and CO2 it produces.
Food production The amount of food produced by community members or the
local food industry and the methods of food production. Thus
local, low impact food is generally more desirable than
centralized, industrially produced.
Health & wellbeing Access to and use of resources that improve health and wellbeing.
Local Economy The strength of local economy that the community is part of
where local businesses, diversity and integration are generally
desirable aspects.
Low impact
consumerism
Choices to reduce consumption of consumer products and to
make ethically and environmentally responsible consumer
product choices.
Participatory
Governance
The degree, level and effectiveness of democratic participation by
community members in governance of the community.
Social Cohesion The degree of "solidarity, trust and association" (Bryden &
Geisler, 2007) among the community.
Social Housing
Provision
The degree to which the community provides for the housing
needs of low income and special needs members.
Sustainable Wood
Fuel Resource
Management of local woodland as a sustainable fuel resource.
Utility Bills The significance of utility bills as part of the household budget

30
Indicator Description
Waste Production The amount of waste sent to landfill and the amount recycled or
composted.
Water use & waste
water treatment
The total amount of water used by households, the amount of that
coming from the water provider and the amount of wastewater
discharged to the utility provider.
Sustainability appraisal of a transition output proceeds by individually
appraising the sustainability indicators that apply in each of the community
domains impacted by the transition output. The impacts across community
domains are identified and described in the community impact analysis step.
Indicators may apply across multiple impacts within the domain. As an example,
the Energy Use & CO2 Emissions indicator in the Housing domain would be
influenced by both an energy saving behavior campaign and by installation of a
community renewable electric grid implemented together as part of a single
project. If there is no suitable indicator available in the global set a new one is
created or if appropriate, an existing one generalized to make it fit. Once
identified, data relating to the change in the indicator are sought and an appraisal
made.
Indicator definitions identify the sustainability criteria that may apply to
an indicator. Appraisal of an indicator’s value in a specific output / domain
context involves the researcher subjectively rating the change in each criterion on
a four point scale using the guide lines shown in Table 5. Criteria within the
indictor are rated individually. Negative ratings are possible where the change led
to a decrease in sustainability. A maximum score of 18 is therefore possible only

31
if an indicator scores 3 in all 6 criteria. This will not happen with the current
indictor set because there are no indicators in which all six criteria apply.
When appraising a change, saturation throughout the community is
considered and not just the change that occurred within those who participated.
So, for example, two communities achieve a 10% reduction in CO2 emissions
among transition participants, which by most reckonings is a moderate
achievement, scoring 2 in each of the criteria that apply to this indicator.
However, if the first community has a high participation rate and the second
community a low participation rate then the rating is adjusted to represent change
at the overall community level. The first community keeps its score of 2 but the
second community's score is reduced to a 1 or perhaps a zero, reflecting that the
overall change in the community is low or even negligible. As a rule of thumb,
community participation is estimated at high if above 75%, medium if between
25% and 75%, low if below 25% and negligible if below a few percent.
Table 5.
Sustainability Appraisal Rating
Amount of change Rating Value
No change or negligible change 0
Small change 1
Moderate change 2
Substantial change, up to the maximum 3

32
The appraisal method is far from perfect. It does however: indicate if the
sustainability is changing; the direction it is changing in; and a rough magnitude
of the change. There are some specific points that need to be made:
The appraisal is relative, not absolute. It does not say anything about a
case’s absolute state of sustainability and it therefore follows that it
cannot be used to compare cases and conclude that one case is more or
less sustainable than another.
The appraisal is relative to a case specific baseline. The baseline is
different for each case and it depends on the transition type. For in-situ
transitions acting on an existing community the baseline would
normally be the state of the community prior to transition beginning.
For a new community, one that did not exist before, the baseline is
taken to be the state of the neighboring community and the local area.
An alternative baseline might be the state of the residents prior to the
community being created but this would be very difficult to determine.
While ratings can be added to arrive at aggregate changes in
sustainability the results are not strictly logical in that three small
changes are not necessarily equivalent to one large one.
Appraisal ratings are not based on the size of community. If a small
community and large community both substantially decrease their car
dependency they are both rated at 3. This suggests it is much more
difficult for larger communities to transition than smaller ones.

33
Transition Path Analytical Framework
Process Tracing
The transition path analysis framework is used to analyze the transition
process within individual cases with the objective of gaining insight into the
causal mechanisms that result in transition outputs. The framework follows
aspects of the process tracing method that has emerged as a tool in political
science (Falleti, 2006) that Falleti states "incorporate[s] historical narratives
within highly abstract theories and explanations". Process tracing attempts to
explain "the outcomes of interest by going back in time and identifying the key
events, processes, or decisions that link the hypothesized cause or causes with the
outcomes" (Falleti, 2006) and is particularly suited for researching phenomena
that involve "temporality, critical junctures, and path dependence". As noted by
Geels and Schot (2010, p. 99), transitions are such phenomena and process tracing
is therefore an appropriate method for their investigation.
Process tracing is applicable for either theory testing (process verification)
or theory building (process induction) objectives (Bennett & George, 1997). The
state of research into community sustainability transitions has not yet produced
any theory and the transition path analytical framework developed here is
therefore of the process induction type, supporting exploratory research aimed at
building theory. Transition management theory (Loorbach, 2007) however,
focuses on socio-technical transitions more generally, and does to some extent
inform the framework.

34
The challenge in the current research is in operationalizing process tracing
for use in the community sustainability transition field. This is done in an iterative
fashion in parallel with performing the analysis. The salient points of the method
and supporting framework are:
Tracing backwards from transition outputs to reconstruct the sequence
of events and activities (the transition output path).
Tracing back to the transition's point of inception or to a point of
convergence with other transition output paths.
Focusing on activities, actors and barriers.
Generalizing types of outputs, activities, actors and barriers
Aggregating activities and events to a similar level of detail across
cases
Producing a graphical representation of the transition path
Creating a rich narrative
Transition Path Reconstruction Process
Figure 5 illustrates the basic workflow and work products used in the path
analysis process. Starting from a transition output the sequence of events and
activities that led to its implementation are identified and plotted on two levels of
intermediate trace charts before being transformed to the final transition path
chart. The sequence to the output is subjectively reconstructed in reverse by the
researcher using the case chronicle as a primary source of reference. The
chronicle contains useful information on events and activities but it does not link
them: this relies on the researcher’s familiarity with the case developed during

35
data collection and preparation. Reverse reconstruction has the advantage that it
narrows the choices of where you can go: there is more certainty of the events and
activities that immediately precede and are necessary for a particular step.
Forward reconstruction on the other hand, opens up many more possible routes to
take, many of which are not necessary in getting to the destination of interest (the
transition output). The disadvantage with reverse tracing is that ‘wrong turns’ and
"dead ends" that were made by the transition community will be omitted from the
path and potentially important observations missed.
Figure 5. Transition path analysis process
The trace charts are Gantt style charts plotting activities, events and
outputs on a time axis using shapes in Microsoft Excel and then linking the shapes
with connecting lines. Activities and actors are generalized through three levels of

36
detail from the chronicle through two levels of trace before being transposed to
the final transition path chart. This could probably be streamlined but it would be
much more difficult to jump directly from the chronicle to the final chart: the
intermediate steps incrementally approach the desired level of detail and
generalization. From the level 1 (highest level) trace a list of activities leading to
each output is generated and from this a skeletal transition path chart is
constructed and the details (actors, types, barriers) filled in.
Transition Path Analytical Framework Dimensions
Process tracing needs to be structured with a specific orientation towards
the research objective. The current research is concerned with establishing a
knowledge of how community sustainability transitions produce outputs.
Community transitions are the result of people interacting and doing things. To
understand how this results in a particular effect it follows that the types of
interactions that take place and the types of people or groups of people interacting
are important, as is the sequence of interactions. Thus these are the primary
dimensions of the transition path framework: activities, actors and sequencing;
that come together in the transition path chart as a collection of directionally
related conjunctures. Sequencing captures the concept of path dependency but
less so temporality. Generalized sets of activities (Table 6) and actors (Table 7)
iteratively distilled from specific, detailed events are used to characterize who was
involved and what did they do. Other aspects of the framework are barriers that
prevent or limit the effectiveness of an action and the type of outputs that are

37
produced. The framework captures the type of barrier (regulative, technical,
behavioral etc.) and if it was overcome.
Table 6.
Transition Path Analytical Framework Activities
Activity Description
Networking Working with other organizations to achieve short term or long
term, specific or general, objectives. Includes building coalitions,
negotiating, participating in peer groups.
Mobilizing Getting community members to participate in the transition
through providing information, holding motivational events,
providing support.
Planning Identifying goals and objectives and how they are to be achieved
through identification of future actions, their sequence and timing.
Includes strategy building, high level decision, shorter term action
planning.
Organizing Organization of people and resources, their acquisition
(recruitment), use, direction, and control. Includes creating
organizational structures, appointing staff, project management,
financial management, etc.
Monitoring Measuring or monitoring the system's current state and
performance.
Publicizing The outward dissemination of information about what the
transition community is doing, what they have achieved, what they
plan to do. This may be to raise the transition's profile, for
transparency, for advocacy or for numerous other reasons.
Fundraising Raising funds from business sponsorship, government grants,
public appeal or any other source.
Changing External
Systems
Changing of external systems or services by external agents that
has an effect on the transition community. For example, bus routes
are changed.

38
Table 7.
Transition Path Analytical Framework Actors
Actors Description
Core Group A relatively small group at the ore of the transition, providing
leadership, vision, practical skills and knowledge, and management
NGOs Mission oriented non-profit organizations. May be local to national
to international in scope, volunteer, grass roots or highly
professional in nature..
Business Commercial organizations, ranging from local business, through
national and multinational enterprises.
Government Government administrations an elected representatives, ranging
from local (e.g. county councils) to national (e.g. Scottish or U.K.
government) to supra-national (e.g. the E.U.).
Higher Education Universities, colleges.
Community Groups Other community led and staffed groups in the community such as
gardening clubs, Women's Institute, church groups, sports clubs.
Also includes community schools.
Community
Members
Individuals who are part of the community undergoing transition,
though not necessarily involved in (or even aware of) the transition
activities.

39
Table 8.
Transition Path Analytical Framework Barrier Classes
Barrier Class Description
Regulative /
Governance
A law or regulation prohibits an action, an administrative procedure
takes too long or is excessively demanding, or the decision making
process is opaque and exclusive. Also includes institutionalized
norms such as professional standards.
Technical A deficiency or failing of available technology prohibits an action.
Infrastructural A lack of or deficiency in infrastructure (common, shared physical
structure) prohibits an action.
Service A lack of or deficiency in service provision prohibits an action.
Behavioral Cultural and behavioral norms probibit an action.
Ecological Protection of ecosystems may prohibit an action, or from another
angle, a lack of or deficiency of ecosystem services may be the
problem.
Economic The action is too expensive.
Table 9.
Transition Path Analytical Framework Output Classes
Output Class Description
Regulative /
Governance
A change to laws, regulations, procedures, organization etc.
Technical A change to technical components of a system or a reconfiguration
of system components.
Infrastructural A change to the common, shared physical structures and system of
the community
Service A change to the services provided to the community
Behavioral A change in community behavior
Ecological A change to ecological systems in the community

40
Transition Management Analytical Framework
The final analysis of each case is to make an appraisal of its similarity to
theoretical principles of transition management. Transition management theory
draws on insights from complex systems theory and governance theory (Rotmans
& Loorbach, 2010). According to Rotmans and Loorbach, effective management
of a transition should conform to the set of principles which are summarized in
Table 10 and to which two additional principles have been added: Selective
participation and Applying normative principles of sustainability. Using
knowledge of the case data a subjective appraisal against each principle is made
and a rating of 0 is given for no fit or very little fit, 1 for partial fit and 2 for a
good fit.

41
Table 10.
Theoretical Principles of Transition Management (Rotmans & Loorbach, 2010)
Theoretical
Principles TM
Description
creating space
for niches
Creating and maintaining a protected environment that allows a small
core of agents to emerge and operate differently from, and free from
interference and influence by the regime. Thus a niche is formed that to
some degree is out of alignment with the dominant structures, cultures
and practices. Outputs from the niche, i.e. what it produces and
supports, would not survive long or even begin to form outside of the
protected environment. Freedom from interference and influence is
also a matter of degree with some factors being easier to escape from
than others.
focus on
forerunners
Frontrunners are agents who are innovators, strategists, visionaries.
People who can break free from and think beyond the dominant
structure, culture and practices. They are the leading agents of change.
Focusing on frontrunners means bringing the right combination of
agents together into a protected space (an "arena") where they can
interact and maximize their collective potential.
guided variation
and selection
Keeping a diverse set of innovative options open for as long as
possible, avoiding premature selection and potential lock-in.
Experimentation provides information to help make decisions and
select some options over others. Flexibility is maintained which may
result in redundancy and inefficiency. There is a tension between
variation (creating a diverse and balanced portfolio of pathways and
experiments) and selection, which limits variation to within the
transition criteria.
radical change
in incremental
steps (guided by
a long term
vision)
Radical change is the ultimate goal of transitions but it does not happen
through abrupt forcing. Instead, directed incremental steps work within
the capacity of the existing system to absorb change and adapt, moving
the whole system towards the goal. Such directed incremental change
may also take advantage of potential "tipping points" where a small
incremental step destabilizes the system and leads to acceleration
towards the goal. Implicit in this principle is the establishment of a
long term guiding vision by which agents are guided in their actions.
The vision evolves in response to insights gained from new knowledge,
experience or events.

42
Theoretical
Principles TM
Description
learning-by-
doing and
doing-by-
learning
Social learning, or second order learning, differs from direct
knowledge creation in that it reframes perspectives and changes the
transition goals and transition process through interaction and
reflection. Individuals or groups question and reflect on the values,
assumptions and policies that drive their actions and through this
change them. Inductive and deductive approaches to experimentation
are used to modify ideas and theories that apply back to the overall
transition management but interaction with other actors through
transition activities is also an important source of social learning.
multi-level
approach, multi-
domain
approach
An integrative approach. An understanding of the system as a multi-
level (e.g. individual - household - neighborhood - city - state -
national) and multi-domain (e.g. economic, cultural, technological,
ecological, institutional) that operates on multiple timescales (e.g. fast -
slow) is important for identifying patterns and mechanisms of change
and for identifying how these patterns and mechanisms may be
influenced.
anticipation and
adaptation
Anticipating future trends and developments is a key element of
transition management as is acting on that information to keep the
transition (substance and process) on track. Monitoring the system is
important to provide information to help identify such trends and for
evaluation. Anticipation is the basic steering mechanism by which the
transition navigates towards the goal.
empowering
niches
Niches are empowered as they gain resources such as knowledge,
finances, and competencies, exemption of rules and laws, and
influence of policy. Empowerment may also refer to the degree of
control that the niche has over decision making.
Selective
participation
TM is defined as a multi-actor process in which individuals and
representatives from government, societal organizations, business,
knowledge institutions and intermediary organizations participate. All
actors influence in some way societal change and governance of
activities must therefore be participatory. The participatory approach is
deliberately selective based on narrow and temporary consensus on
problem definition and long term ambition amongst frontrunners. Short
term consensus is limited thereby allowing involvement, innovation
and creativity to flourish

43
Theoretical
Principles TM
Description
Applying
Normative
principles of
sustainability
Long term vision and short term action should be driven by normative
principles for sustainable development integrated across all sectors
(Loorbach, 2007, p. 80).
The transition management principles are quite detailed in nature and the
distinction between some of them can be subtle. For example, anticipation and
adaptation and learning-by-doing and doing-by-learning both have to do with
monitoring performance of the system (substance) and the transition (process) and
adapting to stay on track. The difference is that the former is first order learning
whereas the latter is second order. The difference between creating space for
niches and empowering niches is subtle too, the former deriving from the concept
of emergence in complex systems theory and the latter from co-evolution
(Rotmans & Loorbach, 2010, pp. 144-145). For this reason, appraisal against
transition management principles may be too esoteric to be practically useful. As
an alternative appraisal Wiek's (2010) transformative planning and governance
methodology is also used. In particular the four methodological steps are used: (1)
creating and crafting sustainability visions; (2) historical and current state system
analysis; (3) scenario construction and sustainability assessment; and (4)
backcasting and testing of intervention and transition strategies. These have been
modified to simplify them further, ignoring scenario construction and subdividing
backcasting and testing into two steps. The adapted transformation process steps
are in Table 11. Using knowledge of the case data a subjective appraisal against

44
each method step is made and a rating of 0 is given for no fit or very little fit, 1
for partial fit and 2 for a good fit.
Table 11.
Adapted Transformative Planning and Governance Steps
Visioning Creating and crafting sustainability visions
Analysis Historical and current state system analysis
Intervention Building transition strategies and intervening
Evaluating Testing of intervention strategies and transformative process

45
RESULTS
Case Selection
Data collection for compiling a short list of case candidates was based on
readily available internet sources such as the community’s website, press or
online magazine articles. The short list is shown in Table 12. As can be seen from
the short list, the cases are all in the United Kingdom in either Scotland or
England. The conditions between Scotland and England – including funding
available to community groups - were judged to be sufficiently similar to allow
cases from both of these countries. The U.K. was chosen as a suitable region for
the study because of the abundance of interesting cases, their relative proximity,
and ease of travel: it would have been substantially more expensive and time
consuming to perform field work on a set of U.S. cases.

46
Table 12
Case Selection Short List
Community Country Move-
ment
Setting Type Start Pop
Isle of Eigg Scotland CLT Rural Island 1997 86
Isle of Gigha Scotland CLT Rural Island 2002 158
Findhorn
Foundation
Scotland EV Rural Village 1962 450
Biggar Scotland TT Rural Village 2007 ~2000
Portabello Scotland TT Urban Suburb 2005 -
BedZED England PC Urban N/Hood 2002 ~200
Ashton Hayes England GCN Semi-Rural Village 2005 919
Forres Scotland TT Semi-Rural Town 2007 9,500
CLT: Community Land Trust; EV:EcoVillage; TT: Transition Town; PC: Planned
Community; GCN:Going Carbon Neutral
From the short list Portabello was eliminated due to no response to inquiry
and the Isle of Gigha was eliminated due to similarity to the Isle of Eigg. The six
remaining cases formed the set of cases to be studied. Brief descriptions of the
cases follow.
Isle of Eigg – A community land trust formed following a public donor
supported buyout in 1997. Governed by residents through a board of
directors, the community has achieved a long list of sustainable
development accomplishments in areas of housing, education,
livelihoods, ecological restoration and resource management,
renewable energy, and transport (www.isleofeigg.net).

47
The Findhorn Foundation – an EcoVillage intentional community that
began in a caravan park in 1962 and has grown to be an ecological –
spiritual center of worldwide renown. Sustainable values and living are
expressed through "ecological building, renewable energy systems,
waste water treatment, local organic food production, currency and
LETS schemes, decision-making processes". It has active business
development with links to the wider community as well as being a
leading educational center. Spirituality has always been a cornerstone
of the community. (www.findhorn.org)
Biggar – a small commuter town that set a target in 2007 of becoming
Scotland’s first carbon neutral town. It later joined the Transition
Town movement. They have worked on raising awareness in the
community, have initiated a weatherization program in conjunction
with local utilities, started a community garden, rideshare and
shopping bag project (www.cnbiggar.moonfruit.com). Further inquiry
into Biggar revealed that the transition failed to take off and was
disbanded in 2009.
BedZED - a 99 unit low ecological footprint housing development
designed to encourage sustainable living. Developed by a private –
non-profit partnership, now managed by The Peabody Trust non-profit
housing association, tenure is a mixture of private ownership, rental
and worker occupied and also includes commercial workshop space
(http://www.bioregional.com/what-we-do/our-work/bedzed/).

48
Forres - a small Scottish town that became a Transition Town in late
2007. A handful of enthusiastic volunteers have grown to become a
significant presence in the community. They have worked at raising
awareness in the community of the climate change and peak oil threats
and have implemented community gardens, farmer's market, and
carbon reduction and other projects and are currently working on
community energy generation (www.ttforres.org).
Ashton Hayes - is best summed up in their own words:
Located in rural Cheshire, Ashton Hayes is a well knit community of
about 1000 people that is aiming to become England's first carbon
neutral community. We started our journey in January 2006 and since
then we have already cut our carbon dioxide emissions by 23% - by
working together, sharing ideas and through behavioural change. We
are about to start work on our community owned renewable energy
power station. (www.goingcarbonneutral.co.uk).
Conducting the Single Case Studies
The six selected cases were all visited in December 2010 – January 2011.
One to two days were spent in each community and two interviews were
completed in each case with the exception of Findhorn Foundation where only
one interview was completed. All interviews were recorded. To maintain
interviewee anonymity real names have not been used.
Not all cases have been used in the research. Interviews from four of the
cases were transcribed and chronicles produced: Ashton Hayes, BedZED, Forres

49
and the Eigg. Three cases, Findhorn Foundation, Biggar, and Eigg were not used.
The main reason for not using all cases was lack of time. The decision to omit
Findhorn Foundation was based on the somewhat different character of this
community. The Findhorn Foundation is a living, working community with many
aspects that are relevant to the current study. It differs from the other five
communities however in that it is an intentional community, made up of a large
proportion of temporary visitors paying to participate in the many short and long
term residential educational and experiential programs. The visitors and long term
residents originate from all over the world. This is a unique community that
stands out from its neighboring communities (including Forres). The other cases
are all "mainstream" communities. At this exploratory stage of research having
one obviously dissimilar case was unlikely to help in case comparison and
generalization. The other omitted case, Biggar, was chosen to be left out because
this is a case of a failed transition. While this is an excellent opportunity to learn
from failure, again, at this stage in the research it was decided to concentrate on
the four "successful" transitions. Leaving Eigg out was a late necessity due to
time constraints.

50
Ashton Hayes
Introduction
Table 13.
Ashton Hayes Transition Profile
Transition Began 2005
Current Status Active Just completed two new major projects
in 2011 not included in the current study
Purpose Active In addition to pursuing internal goal, is
very active helping other communities
and has been active lobbyist of national
government
Dispersal Moderately
concentrated
A majority of the community are
supportive of the transition and
participate in its programs (Alexander et
al., 2007).
Growth Conversion The transition grows by conversion of
non participating community residents
Community Population 919 2001 census (Ashton Hayes Parish Plan
2009, 2009, p. 8)
The essence of the Ashton Hayes transition is captured in its goal, which is
quite simply for the village to become carbon neutral. Garry Charnock, one of the
initiators made this appeal to the community at the public launch event:
We are trying to see if this community can work together to become
carbon neutral, we don't know how to do it, nobody has ever done it
before, would you join with us on this journey (R. Green, personal
communication, January 8, 2011).
Overall, it is seen as a long term transition that they approach with
incremental steps without preconceived, fixed notions of how it will be

51
accomplished. The core group agreed on a simple two stage strategy early in the
transition that reflects the uncertainty they had about meeting the challenge they
had set themselves.
1. In the short to medium term, encourage villagers to reduce energy
usage through individual and household level change.
2. In the longer term, investigate larger scale community CO2 reduction
schemes and pursue the most promising of these.
Summary of Transition Outputs Sustainability Appraisal
The Ashton Hayes transition outputs are summarized in Table 14. Details
of the sustainability appraisal are in Appendix D.

52
Table 14.
Ashton Hayes Transition Outputs and Sustainability Appraisal
Output Components of Output Sustainability Indicators a Domains ΔS
HOUSE-
HOLD
ENERGY
USE
Energy saving behavior
Energy saving
technology
Renewable energy
generation
Energy use & CO2
emissions
Utility Bills
Social Cohesion
Working
Housing
Mobility
13
TREE
PLANTING
14,000 trees planted ? Energy use & CO2
emissions
Biodiversity
Sustainable Wood Fuel
Resource
Cross
Cutting
3
STATION
FOOTPATH
400m path to station ? Energy use & CO2
emissions
Car Dependency
Mobility 2
RECYCL-
ING
Improved recycling
system
Waste Production Housing 2
COMMUN-
ITY SHOP
Community shop Employment
Energy use & CO2
emissions
Social Cohesion
Access to basic services
& amenities
Community Assets
Mobility
Commun-
icating
Shopping
4
aResource use is relative to pre-transition baseline or national averages
ΔS = Appraised Change in Sustainability
Indicator Changes: increased; decreased; negligible; ? unknown
The breakdown of sustainability appraisal by sustainability criterion
(Figure 6) shows a small sustainability gain widely spread across all criteria but
more concentration in socio-ecological integrity and resource maintenance &
efficiency reflecting decreased energy and fossil fuel use. Distribution across

53
domains (Figure 7) is strongest in housing with eating, educating and recreating
having no change.
Figure 6: Ashton Hayes sustainability of appraisal of outputs by sustainability
criterion.
Figure 7. Ashton Hayes sustainability appraisal of outputs by domain.
0
1
2
3
4
5
SEI LS&O I&IGE RM&E SEC&DG P&A
ΔS
Change in Sustain-abiity
HOUSEHOLD ENERGY USESTATION FOOTPATHRECYCLING
TREE PLANTINGCOMMUNITY SHOP
012345678
ΔS
Change in Sustain-ability
HOUSEHOLD ENERGY USESTATION FOOTPATHRECYCLING
TREE PLANTINGCOMMUNITY SHOP

54
Analysis of Transition Outputs
Household Energy Use
Villagers were asked to do whatever they could to reduce their energy use
overall and increase their energy from renewable sources. A breakdown of the
output using the Activity – Supply System analytical framework is shown in
Table 15.

55
Table 15.
Ashton Hayes HOUSEHOLD ENERGY USE Output Analysis
Domain Supply System / Service Activity
Working No Impact Villagers carried over their
energy awareness and reducing from
community life into work (Alexander
et al., 2010; R. Green, personal
communication, January 8, 2011a).
However, there is no data on the effect
on the employing organization and in
most cases this is outside the
community.
Housing No or low cost (with
rebates) technology upgrades such
as replacing light bulbs or shower
heads, or insulating walls.
More expensive changes
such as new windows, solar water
heaters, or wood burning stoves
have also been made
Behavioral changes such as
turning off lights when not in use or
adjusting thermostats.
Mobility Villagers are replacing old
cars with more fuel efficient cars
(R. Green, personal
communication, January 8, 2011).
Being a semi-rural community
with few amenities and limited public
transport it has been very difficult to
cut down on car use (M. White,
personal communication, January 7,
2011).
Villagers have reduced the
number of flights by 37%. Much of
this has been employment related
(Alexander et al., 2010; R. Green,
personal communication, January 8,
2011).
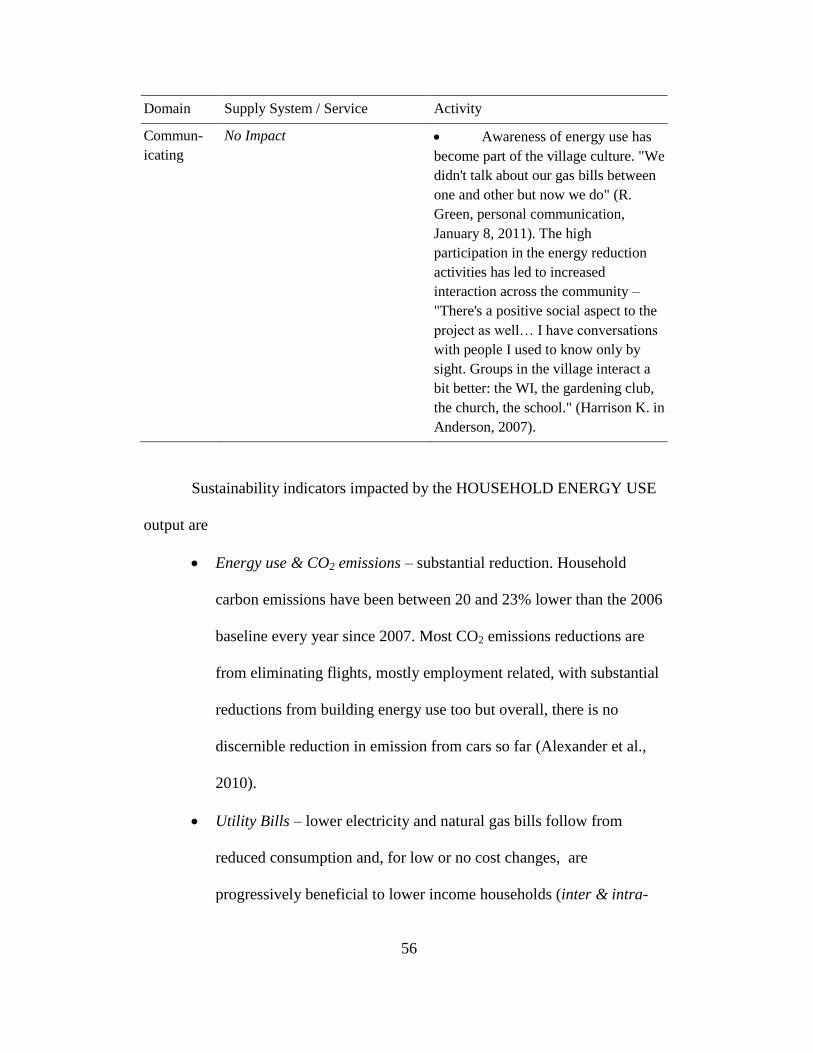
56
Domain Supply System / Service Activity
Commun-
icating
No Impact Awareness of energy use has
become part of the village culture. "We
didn't talk about our gas bills between
one and other but now we do" (R.
Green, personal communication,
January 8, 2011). The high
participation in the energy reduction
activities has led to increased
interaction across the community –
"There's a positive social aspect to the
project as well… I have conversations
with people I used to know only by
sight. Groups in the village interact a
bit better: the WI, the gardening club,
the church, the school." (Harrison K. in
Anderson, 2007).
Sustainability indicators impacted by the HOUSEHOLD ENERGY USE
output are
Energy use & CO2 emissions – substantial reduction. Household
carbon emissions have been between 20 and 23% lower than the 2006
baseline every year since 2007. Most CO2 emissions reductions are
from eliminating flights, mostly employment related, with substantial
reductions from building energy use too but overall, there is no
discernible reduction in emission from cars so far (Alexander et al.,
2010).
Utility Bills – lower electricity and natural gas bills follow from
reduced consumption and, for low or no cost changes, are
progressively beneficial to lower income households (inter & intra-

57
generational equity). However, this equitable outcome is partly
counteracted by greater long term cost benefits being only accessible
at greater initial outlay that is out of reach of lower income
households.
Social Cohesion – increased, and positively with respect to
sustainability. There has been a cultural shift in the community to
incorporate energy use and issues like climate change into everyday
thinking.
Tree Planting
Tree planting as a carbon sink was initially identified as solution to carbon
neutrality but later discounted due to uncertainty about the science (R. Green,
personal communication, January 8, 2011). A breakdown of the output using the
Activity – Supply System analytical framework is shown in Table 16.
Table 16.
Ashton Hayes TREE PLANTING Output Analysis
Domain Supply System / Service Activity
Mobility 14,000 trees were planted
around the village on farmland and
private estates. Nothing is known
about the plantations such as the
type of trees, the land they were
planted on, who owns them or will
there be public access.
The trees will eventually
be coppiced (sustainable firewood
production) (R. Green, personal
communication, January 8, 2011).
There are no data on any
activities related to the plantations.

58
Sustainability indicators impacted by the RECYCLING output are
Energy use & CO2 emissions – unknown.
Biodiversity – increased. Not knowing anything about the nature of the
plantations not much can be said about how they will impact local
ecosystem services. A sweeping assumption is that they will increase
biodiversity.
Sustainable Wood Fuel Resource – increased. The plantations will
eventually be used as a renewable fuel source increasing resource
management & efficiency and precaution and adaptation.
Station Footpath
Prior to 2007 there was no footpath to the train station just outside the
village. Villagers would have to walk on the road and move on to the verge to
avoid passing vehicles, or drive to the station. Cheshire County Council
constructed the footpath following a request from the core group. This was a long
standing wish of the community and the core group saw it as an important
contribution to Going Carbon Neutral by making public transport more
accessible. A breakdown of the output using the Activity – Supply System
analytical framework is shown in Table 17.

59
Table 17.
Ashton Hayes STATION FOOTPATH Output Analysis
Domain Supply System / Service Activity
Mobility Cheshire County Council
constructed a 400m footpath from
the village to the train station.
Pedestrians can now safely and
cleanly walk to the station from the
village. The 2009 parish plan reports
anecdotally that the path has been
successful in increasing the use of the
train service (Ashton Hayes Parish Plan
2009, 2009, p. 14).
Sustainability indicators impacted by the STATION FOOTPATH output
are
Energy use & CO2 emissions – negligible. There is no data on the
effect on CO2 emissions but any effect is very small as overall, is no
discernible reduction in emission from cars so far (Alexander et al.,
2010).
Car Dependency – slightly reduced. The lack of public transport is
stated as the "worst thing about living in Ashton Hayes" by many
villagers (Ashton Hayes Parish Plan 2009, 2009, p. 14). Making it
easier to use the existing public transport may be considered to have a
small effect on inter & intra-generational equity and on livelihood
sufficiency & opportunity sustainability criteria as it increases mobility
options in general and expands the places of employment that can be
reached for those without a car. However, the anecdotally observed
increase in train service use may be in addition to car use and not in

60
place of. Improved access also does nothing to improve the actual train
service, which is very basic, slow, and limited in destinations.
Recycling
On discovering that "our recycling was 23%, it's pretty appalling" the core
group decided this was an area they needed to improve on (R. Green, personal
communication, January 8, 2011a). Cheshire County Council made simple
changes to the recycling system to make it more effective in response to requests
from the core group. A breakdown of the output using the Activity – Supply
System analytical framework is shown in Table 18.
Table 18.
Ashton Hayes RECYCLING Output Analysis
Domain Supply System / Service Activity
Housing Provide surplus bags to
householders so they don’t run
out.
The council weighs the
recycle truck from each village
and provides the data to the core
group.
Villagers responded to the
changes by increasing the recycling rate
to 36%.
Sustainability indicators impacted by the RECYCLING output are
Waste Production – decreased.
Community Shop
The existing village shop was going to close so the community stepped in
to take it over. A breakdown of the output using the Activity – Supply System
analytical framework is shown in Table 19.

61
Table 19.
Ashton Hayes COMMUNITY SHOP Output Analysis
Domain Supply System / Service Activity
Working No Impact The shop employs a full
time manager and 2 part time
employees who are assisted by
community volunteers.
Mobility No Impact The shop avoids car trips
to the supermarket with an
increase in the number of villagers
travelling shorter distances to shop
reported (Alexander et al., 2010).
Shopping The previously privately
owned village shop was taken
over by the community.
The shop provides access
to basic day to day groceries and
goods
As far as possible the
refit was done using recycled
materials (M. White, personal
communication, January 7, 2011).
The shop tries to be an
outlet for local produce (M.
White, personal communication,
January 7, 2011).
No Impact
Communication No Impact The shop is a village focal
point and casual meeting place.
Sustainability indicators impacted by the COMMUNITY SHOP output are
Employment - increased. The shop provides two jobs to the
community that would otherwise have been lost.
Energy use & CO2 emissions – no change. While the shop might be
responsible for the avoidance of some car trips, the annual survey

62
shows no overall reduction in carbon emissions from cars (Alexander
et al., 2010).
Social Cohesion – increased. This does not necessarily translate into
sustainable behavior but in Ashton Hayes it does seem to be a factor,
contributing to socio-ecological civility & democratic governance.
Access to basic services & amenities – increased. This is especially
important for inter & intra-generational equity in the community by
not disadvantaging those without cars (any more than they were
already).
Community Assets - increases the resources of the community and its
capacity to manage them. Managed in a sustainably oriented way and
returning benefits to the community, the shop is an important
contribution to the community’s socio-ecological civility &
democratic governance.
Transition Path Analysis
The complete reconstructed transition path for Ashton Hayes is shown in
Figure 8. It is broken into the segments identified in Table 20:

63
Table 20.
Ashton Hayes Transition Path Segment To Output Map
Segments Output
1 (STARTUP)
1,2 HOUSEHOLD ENERGY USE
1,3 TREE PLANTING
1,4 STATION FOOTPATH
1,5 RECYCLING
1,2,6 COMMUNITY SHOP

64
Figure 8: Ashton Hayes transition path. (See Appendix E for legend).

65
Startup (Segment 1)
Figure 9: Ashton Hayes transition path segment 1(STARTUP)
Segment 1 (Figure 9) is common to all of the Ashton Hayes transition
outputs. It began with conceptualization and culminated in a grand public launch
event in January 2006. Aside from bringing together the key individuals who
formed the core group around the initial concept this initial ‘startup’ segment
established several elements that were crucial in underpinning the subsequent
pathways and achievement of outputs.
1. Engagement of key stakeholder groups in a way that secured their buy-
in.
2. Obtaining a democratic mandate to proceed.
3. Establishing legitimacy and credibility.

66
There was a great deal of networking and behind the scenes activity but
the critical event that brought everything together to achieve these aims was the
grand launch. It got numerous actors (local businesses, local government, NGOs,
universities) to publicly pledge their support to the idea, foremost among them
being Cheshire County Council who said "we are going to back this basically" (R.
Green, personal communication, January 8, 2011). The large public turnout
responded favorably to the proposal and put pressure on government and
politicians in attendance to support it and satisfied the parish council1 that this
was something they must endorse. The parish council accepted the initiative as a
formal sub-committee, giving it additional legitimacy as well as administrative
support. The involvement of Chester University as a partner added credibility. All
of these factors related to each other and amounted to a very positive start but the
biggest factor was perhaps the very clever use of local to national, newspaper,
radio and television media to project the story positively. Media attention has
been a characterizing feature of the transition since then that has undoubtedly
helped to gain favor with local (and national) government who want to avoid
being seen as obstructive and to share some of the limelight, to attract interest and
offers of ‘help’ from businesses who want the exposure, and to motivate
community
1 Parish councils are the lowest level of local government in England. Ashton
Hayes Parish Council serves the residents of Ashton Hayes and has direct
dealings with the county level government (Cheshire County Council) on matters
relating to the village.

67
Household Energy Use (Segment 2)
Figure 10: Ashton Hayes transition path segment 2 (HOUSEHOLD ENERGY
USE)
The first point to note about segment 2 is that it suggests a linear path to a
discrete output. In fact, the ENERGY USE output, which is a distributed process,
not a concrete entity, began soon after the January 2006 launch and has continued
to the present although the intensity of activity was probably greatest during 2006
and 2007. The preliminary steps of the segment consisted of MOBILIZING the
community to act which was initiated by the launch event and followed up with
email and website communication, meetings and general chatter, plus
NETWORKING with NGOs (Energy Saving Trust) and local businesses who

68
provided information, demonstrations, and services on energy efficiency and
renewable energy.
Overcoming BEHAVIORAL Barriers to lower ENERGY USE.
Ashton Hayes has had significant success in getting the community to change
their behavior related to energy use and developing energy ‘awareness’ to unusual
heights. This has been achieved through a multi-pronged "viral" mobilizing
approach backed up with feedback data shown as the MONITORING –
MOBILIZING – ORGANIZING activity group in Figure 10 and described as
follows:
Providing Information – Keeping people informed of what is going on,
events, energy saving tips and such like through the website and email.
Also, providing results of energy use activity, for example posting
individual utility bill data on the website. When the survey data were
available overall results were made known to the whole community
and individual households were given their own results privately,
highlighting where savings could most easily be made.
Providing Support - putting on demonstrations, holding carbon clinics,
providing help when needed.
Motivating - Media attention, guest speakers, visits from politicians
and making a film all contributed to the motivation of the community.
Community motivation turned into action and results. This in turn
continued to attract attention and accolades reaching national and even
international audiences.

69
Sharing experiences - People were talking to each other about what
they had done and how effective it was. Successful practices diffused
through the community.
Monitoring – Motivation encouraged participation in annual surveys
which in turn yielded better data. Presenting the data back to the
community added to motivation as people could see that what they
were doing was making a difference. It also highlighted to them where
they could make improvement.
Organizing - Motivation led to more volunteers wanting to get more
involved. Organizing volunteers into workgroups (e.g. the carbon
clinic group) helped to make the workforce more effective.
Thus what seemed to be happening was something like a self-organizing
system with an emerging property of energy saving behavior.
Overcoming ECONOMIC Barriers to lower ENERGY USE. There is
considerable scope for households to reduce carbon emissions at no or little cost
but a point will be reached where the cost of energy saving or renewable energy
generation technologies will become prohibitive for many households. "It is very,
very difficult for individual homes to come up with the amount of money required
to invest in the technology" (M. White, personal communication, January 7,
2011). This barrier still stands. Ashton Hayes did work with organizations like the
Energy Saving Trust and utilities to make sure any available assistance such as
house insulation rebates was known to residents.

70
Overcoming REGULATIVE Barriers to lower ENERGY USE. There
is evidence that Ashton Hayes was becoming more capable of overcoming local
building regulations. Alexander et al. (2007) point to the granting of permission to
install the demonstration wind turbine and solar panel on the school. Green
(personal communication, January 7, 2011) tells the story of the couple who were
given permission to build a radically designed ‘Gaia house’ that they had been
unable to get from any other authority. Thus it appears that the community was
becoming empowered in its dealings with local government (Alexander et al.,
2007). Contributing factors to this empowerment may have been the democratic
mandate behind the initiative that was so publicly demonstrated at the launch and,
cognizant of the high profile media attention, the desire by Cheshire County
Council to avoid bad publicity that might result from rejecting requests. In
addition to these pressures on local government to respond positively, Ashton
Hayes was bringing benefits to the council and the politicians in the form of
publicity and interest from national politicians and government. Aleaxander et al.
(2007) also point out that this empowerment may also be interpreted as
communities doing the work of government for them, so there is good reason for
local authorities to lower a few barriers.
Key points contributing towards this outcome were:
Using a complex combination of mobilization, monitoring and
feedback ("viral" mobilization).
Community empowerment through popular, political and media
support.

71
Positive engagement with local government
Tree Planting (Segment 3)
Figure 11: Ashton Hayes transition path segment 3 (TREE PLANTING)
Following the launch (and even prior to the launch) the core group
negotiated with local landowners and silvicultural businesses to further the tree
plantation objective (Charnock, 2007) (Figure 11). It was a straightforward
physical (ecological) output but it needed land, a supply the trees, labor and an
agreement on ownership and long term management. There is little information
available on this project but these negotiations seem to have been successful
despite there being no funding, drawing instead on the creation of benefits for
each party and collective goodwill toward the community. Eventually, 14,000 out
of a target of 16,000 trees were planted before the idea was mothballed due to
doubts about the validity of the science around CO2 emissions of plantations (R.
Green, personal communication, January 8, 2011a).

72
Key factors contributing to the TREE PLANTING output were:
Designing multi-party deals based on the creation and distribution of
diverse benefits rather than standard market transactions ("social
entrepreneurship").
Goodwill towards the community.
Station Footpath (Segment 4)
Figure 12: Ashton Hayes segment 4 (STATION FOOTPATH)
The path segment leading to the STATION FOOTPATH output (Figure
12) is very similar to TREE PLANTING. A period of negotiation between a
limited set of parties follows directly on from the launch. In this case the
negotiation was between the core group and Cheshire County Council where the
core group made a request for a footpath to the station. The same request had been
made on more than one occasion before and had been unsuccessful but this time
the council agreed. This again seems to be a good example of empowerment of
the community. Where before the council could safely dismiss the request without
consequence, they now had to think about the political and professional

73
ramifications arising from the public commitment of support they gave to the
community at the launch, the democratic mandate given to the transition by the
community, and the continued interest of local and national media.
Key factors contributing to the STATION FOOTPATH output were:
Community empowerment.
Positive engagement with local government
Recycling (Segment 5)
Figure 13: Ashton Hayes transition path segment 5 (RECYCLING)
The path segment leading to the RECYCLING output (Figure 13) has
similarities to the STATION FOOTPATH output in that it involved lobbying
Cheshire County Council to get something done. In this case the request was to
make modifications to the recycling system that the core group believed would
increase the recycling rate. The council agreed. Again, as with planning

74
permissions and infrastructure construction, this may be attributable to the
community’s empowerment.
Following the changes, there was activity similar to the energy use
reduction mobilization, where information was provided to the community (what
are we doing, why are we doing it, what has changed etc.) as well as performance
data (the council now supplied village recycling data by weight). The regular
performance feedback data helped to motivate community members to increase
their efforts but it was also publicized on the website along with other villages’
data to create inter-village competition which further motivated community
members.
Key factors contributing to the STATION FOOTPATH output were:
Community empowerment.
Positive engagement with local government
Mobilization through feedback and competition
Community Shop (Segment 6)
Figure 14: Ashton Hayes transition path segment 6 (COMMUNITY SHOP)

75
The COMMUNITY SHOP output came about through effective
community governance.
A problem was anticipated (the existing owner alerted the parish
council she wanted to close the shop),
The parish council asked some community members to investigate the
impact and make recommendations
A new community group was formed to work towards taking over
ownership of the shop
The Going Carbon Neutral group because of synergetic aims and
helpful capabilities.
While the shop takeover might have happened in an earlier time, there is a
suggestion that the community’s experience with Going Carbon Neutral had
increased its confidence and desire to do more for itself. The shop development
may be "an example of people being receptive to the idea of something new
because of things they’d already done" (M. White, personal communication,
January 7, 2011) and according to Green "what we are looking at is … the
empowerment phase of the whole community, but not just for carbon neutrality"
(personal communication, January 8, 2011).
The shop was not just seen as an important amenity for the community but
also as an opportunity for synergetic development with the Going Carbon Neutral
group. Not only in avoiding car trips to the supermarket but in its potential to
develop in other directions such as supporting local producers.

76
Key factors contributing to the COMMUNITY SHOP output were:
Cross group development of synergetic community opportunities
Transition Management Appraisal
An appraisal of how well the Ashton Hayes transition process conforms to
transition management principles is shown in Table 21.

77
Table 21.
Appraisal of Ashton Hayes Similarity to Transition Management Principles
Theoretical
Principles TM
Appraisal Notes
creating space
for niches
Partial - becoming a parish council subcommittee created a protected
environment to a limited extent. Empowerment w.r.t. Cheshire Council
gives Ashton Hayes more leeway than other communities might be
expected to receive. Also, may have influenced national level policy in
favor of supporting community based action, such as DECC funding,
feed-in tariffs.
focus on
forerunners
Yes - the core group has strong leadership, motivational and visionary
qualities. They are innovative in the way they mobilize and work with
the community to accomplish tasks - social, not technical, innovation.
They challenge the existing order.
guided
variation and
selection
Partial - the accomplishments have been diverse: across domains (e.g.
housing, mobility, shopping) and supply systems (e.g. energy, transport).
Although the primary transition criterion is carbon neutrality, selection of
projects has not been narrowly constrained to directly address this.
However, the 'portfolio' of projects is not deliberatively designed: it is
more opportunity driven
radical change
in incremental
steps (guided
by a long term
vision)
Yes - the, actions have taken have all been relatively small and non
controversial. Their rules are to be apolitical and to ecourage people to
participate but there is no criticism for not doing so. Overall, it is a 'softly
softly' approach of small steps intended to build support and momentum
and to avoid conflict and resistance. They do not have grand plans and do
not impose solutions. The 'carbon neutral' goal is their mission, but not a
vision: they have no preconceptions of the end state will consist of.
learning-by-
doing and
doing-by-
learning
No - There is some reflection on what they are doing and the effect it is
having (e.g. Alexander et al. evaluate the project from a sustainable
development perspective (2007)) but this has not so far noticeably caused
them to change their goals or approach. There has been no real linking
of transition theory to practice and attempting to learn from this.
multi-level
approach,
multi-domain
approach
No - while it is not accurate to say they do not have an understanding of
the systemic nature of what they are trying to change, they have not
systemically analyzed them.

78
Theoretical
Principles TM
Appraisal Notes
anticipation
and adaptation
Partial - They have used the annual survey results to inform future
actions. The survey indicated that the household energy use tactic
quickly reached its limit and so they switched their attention to other
tactics (i.e. renewable generation).
empowering
niches
Yes - the project has remained under community control and ultimately
can be stopped by the community if they wish. They have formed a
relationship with local government that ensures they get heard and can
often get the help that they need. Their use of the media gives them a
powerful voice. Nationally, they have established networks that give
them input to decision making - they have become part of the discourse.
Selective
participatory
process
Yes - the project is essentially community driven as represented by a
small, self selected core group. It is open to question and scrutiny
(through the parish council) and does not deny volunteers who want to
contribute, on condition that they are willing to make the commitment
and take the responsibility that goes with it. Business and higher
education participate as partnerships and local government is often
engaged. So overall, there is a healthy mix of participants.
Normative
principles of
sustainability
No - while in practice there is nothing suggest that the core group is not
generally aligned with sustainability principles there are none defined nor
is there an explicit commitment to sustainability in general, only to
becoming carbon neutral.
An appraisal against transformative planning and governance method
steps is shown in Table 22.

79
Table 22.
Appraisal of Ashton Hayes Similarity to Transformative Method Steps
Step Appraisal
Visioning No – other than the mission statement to become carbon neutral, no
desirable future vision has been created.
Analysis No –There has been no attempt to systematically understand the
system's current or historical state.
Intervention Yes – There has been a lot of activity to intervene in the system
either directly or indirectly.
Evaluation Partial – Monitoring of carbon footprints is used to inform future
transition actions.
Outlook for Ashton Hayes
The current study really only tells the first chapter of the Ashton Hayes
story. Although the household energy use activity stabilized round about 2008 the
transition team has not been idle. With their strategic partners (University of
Chester and EA Technology) they have been working on a community energy
scheme that has been recently completed (www.goingcarbonneutral.co.uk). With
the help of £400,000 funding from the U.K. Department of Energy and Climate
Change they have constructed a low carbon playing field pavilion powered by
solar panels in collaboration with other community groups and initiated an
electric car club with a car acquired from Nissan, also powered by solar. The
grant will also be used to install renewable energy generation on the school. A
another aspect of this work is the creation of a not for profit pro bono professional
services organization in the City of London called "Carbon Leapfrog" that takes
on community projects and provides financial and legal services that Ashton

80
Hayes were closely involved in through Garry Charnock (R. Green, personal
communication, January 8, 2011). These types of services are essential to
overcome the regulative and economic barriers in establishing community energy
schemes. The DECC funding is obviously critical to these outputs but it can be
seen again that the transition team use collaboration with strategic partners, other
community groups and "social entrepreneurship" to maximize opportunities.
Ashton Hayes see the way forward from here being strongly influenced by
the need to find revenue sources and mechanisms to achieve results that do not
depend on government grants which constrain and drain the flexibility and human
resources of the transition team (R. Green, personal communication, January 8,
2011). Feed in tariffs from community energy will generate revenue (although the
U.K. government just announced cuts to this program (Macalister, 2011)) and
Ashton Hayes has built considerable social capacity that will no doubt help them
find a way forward. Another challenge Ashton Hayes face is their reliance on a
small number of key people who have given huge amounts of time on a voluntary
basis.
Summary of Ashton Hayes Transition Strategic Factors
Summary results bringing the sustainability indicators together with the
transition path strategic factors for each output are presented in Table 23.

81
Table 23.
Ashton Hayes Strategic Factors Contributing To Successful Outcomes
Output Sustainability Indicator Strategic Factor
ALL Entrepreneurial core group
Strong local government support
Low funding
Bottom-up, grass roots
Diversity of actors
(STARTUP) Early engagement of key stakeholders
Obtain democratic mandate
Establish legitimacy and credibility
HOUSEHOLD
ENERGY USE
Energy use & CO2
emissions
Utility Bills
Social Cohesion
Using a complex combination of
mobilization, monitoring and feedback.
Community empowerment through
popular, political and media support.
Positive engagement with local
government
TREE
PLANTING
? Energy use & CO2
emissions
Biodiversity
Sustainable Wood Fuel
Resource
Social Entrepreneurship
Goodwill towards the community.
STATION
FOOTPATH
? Energy use & CO2
emissions
Car Dependency
Community empowerment.
Positive engagement with local
government
RECYCLING Waste Production Community empowerment.
Positive engagement with local
government
Mobilization through feedback and
competition

82
Output Sustainability Indicator Strategic Factor
COMMUNITY
SHOP
Employment
Energy use & CO2
emissions
Social Cohesion
Access to basic services
& amenities
Community Assets
Cross group development of synergetic
community opportunities
Indicator Changes: increased; decreased; negligible; ? unknown
BedZED
Introduction
Table 24.
BedZED Profile
Transition Began 1995
Current Status Completed Following completion of construction in 2002 and
residents moving there has been no change other
than maintenance since 2003.
Purpose Passive The community's purpose is passive.
Dispersal Concentrated All residents are participants, many of them
passively, some more actively.
Growth None Growth is not possible (physically constrained and
all residents are participants)
Community
Population
220 (Chance, 2009)
BedZED or Beddington Zero Energy Development2 is a mixed occupancy,
housing and office development in the working class suburb of Hackbridge in the
London Borough of Sutton. It was purposely designed and built on a brown field
urban site with two goals in mind:
2 More accurately zero fossil energy or zero net CO2 emissions

83
1. To create a sustainable, urban community.
2. To demonstrate to government, the construction industry and the
public, that sustainable housing can compete in the mainstream
housing market.
Simply put, the first aim was to make sustainable living "easy, attractive
and affordable" (BRESCU, 2002) by creating an environment that enables residents
"to live more sustainably, perhaps even within their share of the earth's renewable
resources, without sacrificing a modern, urban and mobile lifestyle" (Lazarus,
2003). The second aim is experimental to some extent, from which lessons are to
be learned and applied to future projects, and interest and growth in the
sustainable housing market stimulated. In practice however, the scope for
experimentation was very limited given that the buildings were to be occupied by
real people to whom BedZED is home, and not a living laboratory.
Achieving the first goal, a sustainable community, was predicated on a
three tiered design concept ("BedZED," n.d.), which may be broadly
characterized as technical, behavioral and social, each one assumed to lead to
greater levels of sustainability by building on the lower tiers (Figure 15). The
second goal, demonstrating competitiveness and attractiveness of sustainable
housing, would be achieved through approaching the project on a commercial
basis and making the three design tiers appealing to the mainstream.

84
Figure 15: BedZed tiered design concept linked to sustainability outcomes
The development core group consisted of a small group of visionary,
entrepreneurial, and innovative individuals and their respective organizations.
Bill Dunster, architect and founder of Bill Dunster Architects (BDA), a
green architecture practice.
Pooran Desai, director and co-founder of BioRegional, an eco-
entrepreneurial organization.
Dickon Robinson, director of development at Peabody Trust, London’s
biggest housing association and registered social landlord3 with a
"long-term commitment to innovation in construction, providing high-
quality affordable housing and minimizing fuel poverty" (BRESCU,
2002).
Dunster, who after building his own ‘zero energy’ home had the vision of
a larger scale zero energy community, developed the sustainable urban
community concept further and the strategy to realize it with Desai. BDA would
3 A Registered Social Landlord is an independent, not for profit organization that
provides property development and management services to tenants receiving
government housing support.
•Site designed to create a strong community which, in combination with tiers 1 & 2, will lead to further sustainable development
Tier 3 -Social
•Homes, site and facilities designed to encourage residents to make more sustainably choices
Tier 2 -Behavioral
•Physical infrastructure and buildings with intrinsically low ecological impact.
Tier 1 -Technical

85
provide design and construction expertise while BioRegional’s would "ensure that
sustainability was considered at every step" (Hodge & Haltrecht, 2009, p. 2). The
coalition was completed by Peabody who would be project developer, owner and
long term manager. In addition to the three core partners, Sutton Council was also
an important player through their active support driven internally by a strong
green lobby (Minton, 2001).
Summary of Transition Output Sustainability Appraisal
The BedZED transition, summarized in Table 25, essentially produced one
large, aggregated output: a new housing and office complex. Reporting results at
such a highly aggregated level is not very informative so for greater resolution the
main output is disaggregated into three largely independent outputs - energy,
water, and "community" - any of which could conceivably have been left out of
the overall design without greatly affecting the others. The energy and water
outputs are physical systems mostly independent of the residents that map directly
to energy and water supply systems of the Activities – Supply Systems analytical
framework and to the first tier (technical) of the BedZED design model. The
"community" output integrates site, buildings and residents and maps to various
elements in the Activities – Supply Systems analytical framework and to the
second (behavioral) and third (social) tiers of the BedZED design model. Details
of the sustainability appraisal are in Appendix D.

86
Table 25.
BedZED Transition Outputs and Sustainability Appraisal
Output Components of Output Sustainability Indicators a Domains ΔS
LOW
ENERGY
HOUSING
Passive energy design
Onsite renewable
generation
High efficiency
appliances
Visible metering
Energy Use & CO2
emissions
Utility Bills
Housing 15
LOW
WATER
HOUSING
Rainwater collection
Grey water recycling
High efficiency
appliances
Water Use & Waste
Water Treatment
Utility Bills
Biodiversity
Housing 10
COMMUN-
ITY
Mixed income &
backgrounds
Mixed occupancy type
Integral recycling
Community allotments
& composting
Community playing
field, pavilion & square
Cycle paths and
marginalized roads &
parking
Neighbor interaction
Car club, limited
parking, parking fees,
proximal public transport
Waste Production
Social Housing
Provision
Car Dependency
Food production
Health & wellbeing
Social cohesion
Participatory
Governance
Energy use & CO2
emissions / transport
Housing
Mobility
Eating
Recreating
Commun-
icating
8
GREEN
WATER
TREAT-
MENT
PLANT
Green water treatment
plant discontinued
Water Use & Waste
Water Treatment
Housing -3
COMBINED
HEAT &
POWER
Combined heat &
power plant discontinued
Energy use & CO2
emissions
Housing -3

87
Output Components of Output Sustainability Indicators a Domains ΔS
MEMBR-
ANE BIO-
REACTOR
WATER
TREAT-
MENT
PLANT
Experimental
membrane bio-reactor
water treatment plant
installed
Water Use & Waste
Water Treatment
Housing 3
aResource use is relative to local averages
ΔS = Appraised Change in Sustainability
Indicator Changes: increased; decreased; negligible; ? unknown
The breakdown of sustainability appraisal by sustainability criterion and
domain (Figure 6 and Figure 7) show most of the sustainability gain to be in the
housing domain and to be distributed over socio-ecological integrity, inter &
intra-generational equity, resource maintenance & efficiency, and precaution &
adaptation sustainability appraisal criteria. The sustainability gain in socio-
ecological integrity, resource maintenance & efficiency, and precaution &
adaptation can be broadly attributed to the low building energy use and renewable
energy generation whereas in inter & intra-generational equity it reflects the
socially equitable aspect of the housing.

88
Figure 16: BedZED sustainability appraisal of outputs by sustainability criterion.
Figure 17: BedZED sustainability appraisal of outputs by domain.
Being a new community there is no prior state to compare with, so, the
baseline against which the change in sustainability is appraised is taken to be the
local or in some cases the national average. This is a valid approach given that the
aim of BedZED is to create a ‘mainstream’ sustainable community but it is not
perfect in at least two respects. First, there are significant demographic
differences between the BedZED and local populations where BedZED has a
higher proportion of both social housing tenants and middle class professionals
-2
-1
0
1
2
3
4
5
6
7
8
SEI LS&O I&IGE RM&E SEC&DG P&A
ΔS
Change in Sustain-ability
LOW ENERGY HOUSING
LOW WATER HOUSING
COMMUNITY
GWTP
MBR-WTP
CHP
-4
-2
0
2
4
6
8
10
12
14
ΔS
Change in Sustain-ability
LOW ENERGY HOUSING
LOW WATER HOUSING
COMMUNITY
GWTP
MBR-WTP
CHP

89
than the more working class Hackbridge community and second, there is
uncertainty about whether new residents have modified or have not modified their
previous lifestyle when they moved to BedZED.
Analysis of Transition Outputs
Low Energy Housing
Low Energy Housing is a technical and infrastructure output which, along
with the Low Water Housing output, forms the main part of the first tier
(technical) of the BedZED design model that aims to create a physical
environment with intrinsically low ecological impact. For energy, the objective is
to create an energy supply system with zero net CO2 emissions so that from a
resident’s perspective "you don’t have to think about it, you’re not even aware of
it" (sustainable housing manager at environmental charity in Lovell, 2008) and
you would have to actively work against the system to not benefit from it (Lovell,
2008). The design solution was to maximize the use of passive energy sources,
minimize the use of ‘active’ energy in the building, and meet the residual energy
demand from onsite renewable energy generation. A breakdown of the output
using the Activity – Supply System analytical framework is shown in Table 26.

90
Table 26.
BedZED LOW ENERGY HOUSING Output Analysis
Domain Supply System / Service Activity
Housing Passive thermal & lighting
design
Wind driven ventilation
Visible energy metering
High efficiency appliances
Solar Photovoltaic electricity
generation
CHP heat (water & space) and
electricity generation from
sustainable woodchip fuel (see
separate CHP output as due to
operational problems it was
eventually discontinued).
There is some evidence that
residents interact with the building in
ways that interfere with the effective
operation of passive thermal control
through installation of blinds, or
opening or closing of inner and outer
windows (Chance, 2009) which can
lead to over or under-heating. Reasons
for this include increasing privacy
because of the ‘socially open’ design
(Lovell, 2008), using rooms for
unexpected purposes, or for security
(Hodge & Haltrecht, 2009, p. 19).
Residences have also been reported to
overheat in the summer (ROOF, 2007;
Slavin, 2006) even when operating as
designed.
Sustainability indicators impacted by the LOW ENERGY HOUSING
output are
Energy use & CO2 emissions - building energy use per person
(electricity and heating) is 60% less than the local average, with 20%
supplied from renewable source (solar PV) and while the CHP was
running the site was a net energy producer and with negative CO2
emissions (Hodge & Haltrecht, 2009). This reduces ecological damage
from fossil fuel extraction and combustion (socio-ecological integrity),
conserves finite resources (resource management & efficiency) and
vulnerability to fuel supply (precaution & adaptation).

91
Utility Bills – residents have substantially lower energy costs than
U.K. average (Lazarus, 2003) which is progressively beneficial to
lower income households (inter & intra-generational equity).
Low Water Housing
Low Water Housing is a technical and infrastructure output playing a
similar part to the Low Energy Housing output in the first tier (technical) of the
BedZED design model that aims to create a physical environment with
intrinsically low ecological impact. The design solution for water was to
maximize the use of rainwater and water from onsite recycling, minimize the use
of water in the building, and to meet the residual demand from the water utility. A
breakdown of the output using the Activity – Supply System analytical
framework is shown in Table 27.
Table 27.
BedZED LOW WATER Output Analysis
Domain Supply System / Service Activity
Housing Green roofs
Rainwater collection
High efficiency appliances
Onsite ‘green’ water recycling,
also included as two other outputs:
(1) the GWTP (green water
treatment plant) which was
eventually discontinued due to
operational problems; and (2) an
experimental MBR (membrane
bio-reactor) plant, subsequently
installed as a replacement.
Pervious paving

92
Sustainability indicators impacted by the LOW WATER HOUSING
output are
Water Use & Waste Water Treatment - water use per person is 50% of
the local average, about 17% is from recycling (Hodge & Haltrecht,
2009) increasing resource management & efficiency, socio-ecological
integrity, and precaution & adaptation. There is zero wastewater
discharge: surplus recycled water is discharged to a ditch (Hodge &
Haltrecht, 2009) and pervious paving eliminates runoff. This lessens
the load on conventional treatment system (precaution & adaptation).
Utility Bills – residents have lower water costs than the U.K. average
(Lazarus, 2003) contributing to inter & intra-generational equity.
Biodiversity – The excess treated water is discharged into surrounding
ditches and wetlands. increasing biodiversity (socio-ecological
integrity).
Community
This output relates to the second (behavioral) and third (social) tiers of the
BedZED design model that aim to encourage more sustainable lifestyles through
an integrative design of site and facilities that seeks to make sustainable choices
convenient for residents. There are many components to this output, many of
which could be treated as smaller outputs in themselves, but due to their
integrated nature and implementation (i.e. all of the system & service components
were produced around the same time as part of the overall project), it would have
been difficult to separate out them out. The breakdown of the output using the

93
Activity – Supply System analytical framework in Table 25 however helps to
understand this output in more depth.
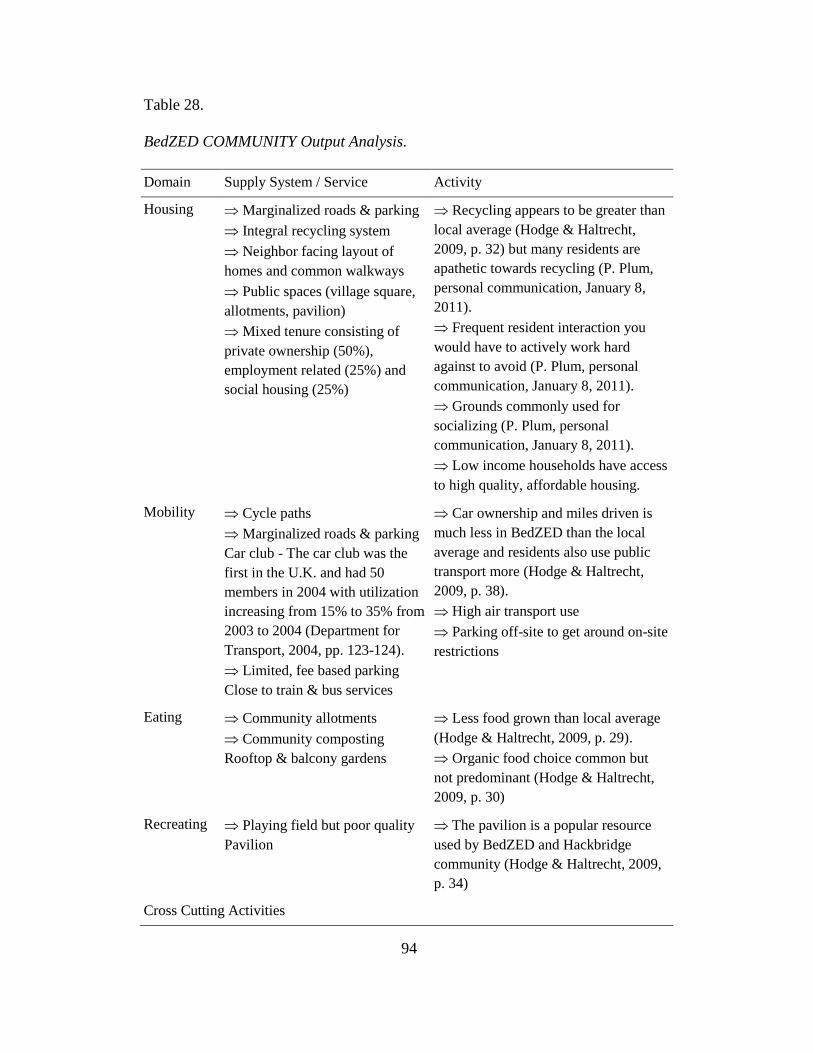
94
Table 28.
BedZED COMMUNITY Output Analysis.
Domain Supply System / Service Activity
Housing Marginalized roads & parking
Integral recycling system
Neighbor facing layout of
homes and common walkways
Public spaces (village square,
allotments, pavilion)
Mixed tenure consisting of
private ownership (50%),
employment related (25%) and
social housing (25%)
Recycling appears to be greater than
local average (Hodge & Haltrecht,
2009, p. 32) but many residents are
apathetic towards recycling (P. Plum,
personal communication, January 8,
2011).
Frequent resident interaction you
would have to actively work hard
against to avoid (P. Plum, personal
communication, January 8, 2011).
Grounds commonly used for
socializing (P. Plum, personal
communication, January 8, 2011).
Low income households have access
to high quality, affordable housing.
Mobility Cycle paths
Marginalized roads & parking
Car club - The car club was the
first in the U.K. and had 50
members in 2004 with utilization
increasing from 15% to 35% from
2003 to 2004 (Department for
Transport, 2004, pp. 123-124).
Limited, fee based parking
Close to train & bus services
Car ownership and miles driven is
much less in BedZED than the local
average and residents also use public
transport more (Hodge & Haltrecht,
2009, p. 38).
High air transport use
Parking off-site to get around on-site
restrictions
Eating Community allotments
Community composting
Rooftop & balcony gardens
Less food grown than local average
(Hodge & Haltrecht, 2009, p. 29).
Organic food choice common but
not predominant (Hodge & Haltrecht,
2009, p. 30)
Recreating Playing field but poor quality
Pavilion
The pavilion is a popular resource
used by BedZED and Hackbridge
community (Hodge & Haltrecht, 2009,
p. 34)
Cross Cutting Activities

95
Domain Supply System / Service Activity
Governance Traditional landlord – tenant or
factor – private owner property
management structure between
Peabody and residents.
A resident association
represents residents’ interests
Poor participation in residents’
association. (P. Plum, personal
communication, January 8, 2011).
The residents’ association would like
to direct more effort into sustainable
development of the community but it
spends all of its time dealing with
tenant – landlord issues (P. Plum,
personal communication, January 8,
2011).
Residents perceive Peabody to be
poorly responsive to issues (Hodge &
Haltrecht, 2009, p. 36; P. Plum,
personal communication, January 8).
Peabody has been dismissive of
residents’ attempts to take more control
and responsibility (P. Plum, personal
communication, January 8, 2011).
Sustainability indicators impacted by the COMMUNITY output are
Waste Production – slight increase due to recycling and composting
appearing to be greater than local average (Hodge & Haltrecht, 2009,
p. 32).
Energy use & CO2 emissions / transport – no change overall. CO2
emissions are slightly more than the surrounding average due to the
high number of flights taken by residents more than negating the
reductions from low car use and miles. However, neither of these
transport behaviors (high flight use or low car use) appears to have
been a result of living in BedZED but that "it is likely that tenure is a

96
more important influence on car ownership than any environmental
imperative" (Hodge & Haltrecht, 2009, p. 26).
Car Dependency – increased by the range of transport options
available that allow many residents to live in BedZED without a car.
Food production – slightly increased since residents choose organic
produce more often than the surrounding average, helped by the
organic grocery delivery service. However, despite the resources
residents have at hand, food production (on-site allotments and
composting, access to balcony or roof gardens), less food is grown in
BedZED than the surrounding average (Hodge & Haltrecht, 2009, p.
29).
Health & wellbeing – slightly increased by use of pavilion for fitness
classes and generally pleasant and safe grounds. Generally, people
really like living in BedZED for many different reasons (M. Peacock,
personal communication, January 8, 2011; P. Plum, personal
communication, January 8, 2011), be it the architecture, the
peacefulness, the sustainability, the child friendly environment, the
neighborliness (Hodge & Haltrecht, 2009, p. 35). However, there is
little to suggest that this translates into greater sustainability.
Social Housing Provison – substantial increase. The mixed tenure
housing and mobility options make BedZED strong in the inter &
intra-generational equity criterion which it does in three ways: (1) it
provides basic needs (housing); (2) it reduces stratification of society;

97
and (3) it avoids ‘sustainable’ housing only being for those who can
afford it.
Social Cohesion – higher as evident from residents reporting strong
community as what they like best about living in BedZED and
residents knowing 20 neighbors on average (Hodge & Haltrecht, 2009,
p. 35). However, this in itself does not necessarily translate into
sustainability. Arguably, the trust and security among residents does
increase social equity by providing mutual social support and lead to
greater, although unrealized, governance capacity.
Participatory Governance – no change. There is a suggestion that with
greater responsibility, residents could manage the site more
satisfactorily, greater interest and participation among residents could
be achieved, and more attention and action focused on sustainable
development (P. Plum, personal communication, January 8, 2011).
GWTP (Green Water Treatment Plant)
The original water supply system of the main construction included an on-
site waste water treatment plant and recycling of water. This has been separated
out as a distinct output because of its eventual discontinuation due to operational
problems. A breakdown of the output using the Activity – Supply System
analytical framework is shown in Table 29.

98
Table 29.
BedZED GWTP Output Analysis.
Domain Supply System / Service Activity
Housing The GWTP, a turbo reed bed,
activated sludge system, based on
Living Technology Ltd’s Living
Machine (Lazarus, 2003, p. 26),
was taken out of operation due to
cost and energy inefficiencies
compared to off-site utility
sewerage treatment (Hodge &
Haltrecht, 2009, p. 24).
There was no impact on residents.
Sustainability indicators impacted by the GWTP output are:
Water Use & Waste Water Treatment – increased. An additional 15
litres of water per day per person being was taken from the water
utility and all waste water (87 litres per day per person) was now
discharged off-site (Hodge & Haltrecht, 2009, p. 24). Although this
detracts from sustainability achievements (socio-ecological integrity,
resource maintenance & efficiency, and precaution & adaptation)
there is no functional impact on residents and negligible difference in
cost.
CHP (Combined Heat & Power)
The original energy supply system of the main construction included an
on-site CHP plant for supply of heat and electricity from renewable fuel. This has
been separated out as a distinct output because of its eventual discontinuation due

99
to operational problems. A breakdown of the output using the Activity – Supply
System analytical framework is shown in Table 30.
Table 30.
BedZED CHP Output Analysis.
Domain Supply System / Service Activity
Housing Technical problems were at
least in part due to Sutton Council
imposing a mandatory 6 hour
nightly shutdown (M. Peacock,
personal communication, January
13, 2011; Hodge & Haltrecht,
2009, p. 22).
Energy to replace the CHP heat
and electricity is now produced by
an onsite natural gas boiler and
from the electricity utility (Hodge
& Haltrecht, 2009).
There was no impact on residents.
Outcomes from discontinuation of the CHP were:
Energy Use & CO2 Emissions – CO2 emissions increased due to the
replacement of the renewable energy supply with fossil fuel (socio-
ecological integrity, resource management & efficiency, precaution &
adaptation).
MBR-WTP (Membrane Bio-reactor Water Treatment Plant)
Continuing the operation and maintenance of the water supply system this
output reinstated on-site waste water treatment. A breakdown of the output using
the Activity – Supply System analytical framework is shown in Table 31.

100
Table 31.
BedZED MBR-WTP Output Analysis.
Domain Supply System / Service Activity
Housing An experimental MBR-WTP
was installed by Thames Water
replacing the service, at least
temporarily, originally provided
by the GWTP (Hodge &
Haltrecht, 2009, p. 24). .
There was no impact on residents.
Sustainability indicators impacted by the GWTP output are:
Water Use & Waste Water Treatment – decreased. An estimated 15
litres of water per day per person less is taken from the water utility
and all waste water (87 litres per day per person) is now treated and
used or discharged on-site. This restores the original sustainability
achievements (socio-ecological integrity, resource maintenance &
efficiency, and precaution & adaptation).
Transition Path Analysis
The complete reconstructed transition path for BedZED is shown in Figure
8. It is convenient to break the overall transition path into segments as listed in
Table 32. All of the BedZED transition outputs stem from the completion of the
construction project and therefore have segments 1 and 2 in common.

101
Table 32.
BedZED Path Segments
SEGMENT OUTPUT DESCRIPTION
1 (STARTUP) Conceptualization – inception to finding a
developer
1,2 LOW ENERGY HOUSING
LOW WATER HOUSING
Design & Construction – the construction
project
1,2,3 COMMUNITY Sales / Transfer – residents move in and it
becomes a living community
1,2,4 GWTP
CHP
MBR-WTP
Maintenance – about one year after
construction to the present
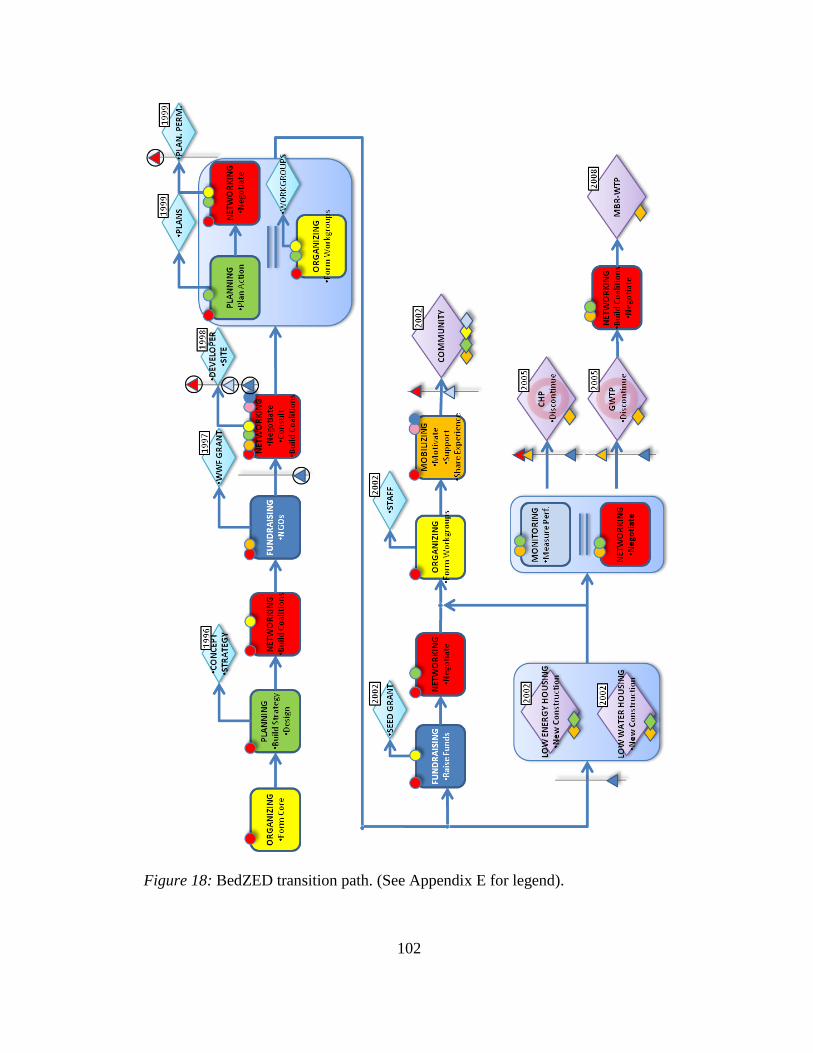
102
Figure 18: BedZED transition path. (See Appendix E for legend).

103
Startup (Segment 1)
Figure 19. BedZED transition path segment 1 (STARTUP)
The initial segment of the BedZED transition (Figure 19) is about the
formation of an innovation nucleus and the development of a visionary concept
into a marketable proposal. Dunster and Desai and their organizations BDA and
BioRegional came together to form a core group around their complementary
skill-sets of technical know-how and entrepreneurial sustainability to develop the
sustainable community concept further and to build a strategy to take it forward.
The biggest problem was going to be finding a developer willing to fund such an
ambitious and radical project and money would be needed to professionally
develop and market a proposal. BioRegional overcame this economic barrier by
using an existing relationship to obtain funding from the World Wildlife Fund.
BioRegional’s existing network was also important in adding Sutton Council as a
partner. Local authority planning difficulties would be perceived as a potential
stumbling block to prospective developers so having a local authority on board
would be advantageous.

104
Key aspects path this path segment were:
The formation of a innovative core group
Obtaining local authority support
Developing and marketing a proposal
Low Energy Housing And Low Water Housing (Segment 2)
Figure 20: BedZED transition path segment 2 (LOW ENERGY HOUSING,
LOW WATER HOUSING)
Segment 2 (Figure 20) is characterized by an expansion in the
number and type of actors involved, dominated by the core group,
business and government. The outputs of interest from this segment are
the Low Energy Housing and Low Water Housing outputs. These are not
separate constructions but are different aspects of the main construction
disaggregated for analytical purposes. Following an initial period of
NETWORKING to find a developer and a site, the main phase in this

105
segment was a complex combination of PLANNING, NETWORKING
and ORGANIZING activities in which the main tasks were building
coalitions and business relationships, developing detailed designs and
plans, negotiating contracts and planning permission. Planning permission
was granted in 1999 and construction began in 2000. The more interesting
actions taken that were important to producing the outputs are described
below.
Finding a developer (NETWORKING to overcome cost & norms
barriers). Neither BioRegional nor BDA could finance the project or had the
capabilities to take long term ownership of it and so BioRegional "spent a long
time trying to find a suitable development partner" that could (M. Peacock,
personal communication, January 8, 2011). Barriers to finding a developer were
twofold: cost and property development norms. Cost was a major barrier because
it was high risk (nothing had been done like it before) but also because the
requirement to include social housing imposed by Sutton Council, and the
objective to keep the end price competitive with mainstream property meant that
it was not an attractive prospect in purely market terms. It needed an organization
that could not only fund it but that was prepared to put other considerations ahead
of financial; an organization that behaved outside the usual standards. Eventually
they found the Peabody Trust. The barriers were overcome by perseverance,
networking, presenting a convincing case, and building a coalition of
organizations with commitments to non market standards and with strongly
overlapping interests.

106
Finding a site (NETWORKING to overcome cost, norms & regulative
barriers). The higher construction costs of the project compared to the industry
standard meant that costs had to be reduced or values increased in other areas in
order to remain competitive overall. Soon after Peabody joined the project Sutton
Council alerted the core group to the availability of a site they were selling.
Sutton Council accepted a density-for-parking planning tradeoff that increased the
site revenue value (Lazarus, 2003, p. 7), and they set a national precedent by
accepting a lower bid on the basis that the value of future environmental benefits
flowing to the council from the development would make up for the shortfall
(BRESCU, 2002, pp. 6-7). Several factors were therefore important in acquiring
the site: the partnership already established with Sutton Council; the willingness
of parties to look beyond existing standards; and an integrated design approach
(where density and parking also relate to the transport system and the water and
energy systems that in turn supported the environmental value of the bid).
Technical Innovation (ORGANIZING to develop technical solutions).
This is discussed under Segment 4.
Obtaining Planning Permission (NETWORKING to overcome
regulative barriers). More planning negotiation with Sutton Council than for a
standard construction project was needed to overcome the unique and irregular
design features such as pervious paving (M. Peacock, personal communication,
January 8, 2011). Generally, Sutton Council was willing to find ways to work
around issues, although the requirement for the CHP plant to be shutdown nightly

107
for 6 hours was a one notable exception. The established partnership with Sutton
Council was therefore important in obtaining planning permission.
Overcoming Escalating cost. Cost overrun during construction was a
barrier that in one respect was not overcome if simply paying the extra cost is
disregarded as being a ‘solution’ to the problem. The cost of the project is
believed to have exceeded initial estimates of almost £12 million (BRESCU,
2002) by somewhere in the range of £5 million (Lovell, 2008) to almost £11
million (ROOF, 2007). The reasons for the overrun are not known and it is an
aspect of the project that is not well publicized (Lovell, 2008). Had it been a
publicly funded project the overrun would likely have been much more damaging.
Being privately funded was probably an important factor in avoiding adverse
publicity and being able to make the decisions necessary to see it through.
Key aspects of segment 2 were:
Challenging and breaking down accepted standards and norms
A strongly supportive local government
Largely independently funded

108
Community (Segment 3)
Figure 21: BedZED trasition path segment 3 (COMMUNITY)
The first part of the segment (FUNDRAISING and NETWORKING
activities) took place while construction was being completed and the second part
(ORGANIZING and MOBILIZING) after construction. Much of the pathway to
the COMMUNITY output then, comes from the design and construction (segment
2) but segment 3 adds to this in a way that tries to steer resident interaction with
their surroundings towards more sustainable outcomes. Segment 3 can be thought
of as the "soft construction" of community following the "hard construction" of
the actual buildings and therefore corresponds to the second and third tiers of the
BedZED design model. The more important actions taken towards the output are
described below.
Implementing and adhering to guiding principles. From the outset, a
systemic approach to design, guided by principles of sustainable development,
was central to achieving the project goals and staying on track. It was

109
BioRegional’s "role during the planning and construction stages was to ensure
that sustainability was considered at every step" (Hodge & Haltrecht, 2009, p. 2).
BioRegional were able to build a coalition around these principles, that may have
even strengthened the commitment to sustainability in some respects. For
example, the requirement for social housing was initiated early by Sutton Council
and strongly supported and extended by Peabody, greatly increasing the social
equity outcomes of the development. It is not known if this would have been
achieved with different partners. Assigning a party to oversee and direct
sustainability seems to have been very important in keeping a balance of
perspectives. It also seems that the commitment of partners to sustainability
principles was strong even though there must have been many occasions when
commercial or professional standards exerted strong pressure in other directions.
Implementing a systemic approach to design. It is clear that the design
team put a great amount of effort into holistic design of the "community" aimed at
maximizing sustainability. Outcomes such as high density, walkability, social
cohesion, low car use, low income households and passive thermal home design
are systemically related and neglecting any one of them in design may produce
substantially different results. There are numerous systemic linkages interwoven
into the design of the complex (BRESCU, 2002, p. 4). The systemic design
approach was a result of the innovative thinking, unconstrained by existing
standards that BDA and BioRegional brought. Peabody also brought similar
thinking with respect to solving social problems of the housing market (Weaver,

110
2002). The diversity of the development parties may also have helped to increase
the systemic linkages in design by each bringing different aspects to consider.
Developing a Culture of Sustainability. Despite the integrated design,
BioRegional saw that new residents would not automatically become models of
sustainability as soon as they moved in but that they would need help and
encouragement. Prior to residents moving in a government SEED grant was
obtained to cover the appointment of a "green lifestyle officer" (GLO) for a period
of one year who would motivate and support residents to adopt more sustainable
behaviors by providing information, training, and support. The idea "was get the
ball rolling and then that knowledge would hopefully be retained in the
community" (M. Peacock, personal communication, January 13, 2011).
Individuals from BioRegional and BDA organized sustainability oriented social
events and residents shared information and experiences in the first year or so,
and from all of this, it was hoped that a culture of sustainability would grow (P.
Plum, personal communication, January 8). It is thought that this strategy was
working but when funding for the green lifestyle officer ended in 2003, and as the
pioneering spirit of the first year or two faded and resident turnover began, any
early gains were lost and resident apathy and indifference towards sustainability
now seems to be the norm (M. Peacock, personal communication, January 13,
2011; P. Plum, personal communication, January 13, 2011).
Consideration of community governance. Although the development
was radical in many aspects this was not the case from a governance aspect. There
seems to have been an assumption that Peabody’s standard governance model

111
(landlord or factor to tenant or resident), would be suitable for the new
community.
Key aspects of the path to the COMMUNITY output were:
Create a balanced diversity of interests but united in their commitment
to sustainability
Creative and visionary innovators with competence for systems
thinking.
Appointment of a party responsible for ensuring sustainable
development
Appointment of a sustainable lifestyle coach
The lack of a long term sustainable development plan
No consideration of new forms of governance
CHP, GWTP, MBR-WTP (Segment 4)
Figure 22: BedZED trasition path segment 4 (CHP, GWTP, MBR-WTP)

112
The remaining path outputs (CHP, GWTP and MBR-WTP) as shown in
Figure 22 all follow directly on from the main construction. CHP and GWTP
outputs were both technical failures that followed similar patterns. The immediate
path to the discontinuation of these systems consisted of monitoring operational
performance and negotiating with the contracted operator to try to resolve the
problems and eventually to make the decision to terminate them. However, the
roots of the problems lie in the main design and construction phase (segment 2).
The reinstatement of on-site water treatment with the experimental MBR system
came about following a period of NETWORKING by Peabody to build new
coalitions. No such replacement for the CHP has yet been made.
Technical Innovation (ORGANIZING to develop technical solutions).
The systems were adapted from very specialized technologies that are not in
widespread use. Specialist design and development groups were created
consisting of core group, supplier companies, and local government to adapt the
technology for the site (Segment 3 – ORGANIZING). While all parties were
united around finding solutions that maximized sustainability they also had
differing motives and interests that played a part in the failure. The supplying
companies were generally interested in getting their innovative technology into
practice, not so much for the immediate sales revenue but to use it as a technology
proving demonstration to future customers and to learn lessons and improve the
technology. BioRegional and BDA on the other hand were driven by the targets
they had set for themselves for CO2 emissions and water use and were therefore
perhaps overoptimistic in their appraisal of the readiness of the technology to

113
achieve these targets. This seems to have been the opinion at Peabody where "a
development manager at the trust, says the project was over-ambitious, using
untested technology and a complicated wastewater treatment system that were not
economic to run" (Slavin, 2006). Peabody’s main concern was a reliable system at
an affordable price for tenants. Thus the choice seems to have been to pursue
maximum goals when safer, more tried and tested technologies could have
provided more reliability but lesser gain. The reasons for this choice however, go
further than just naked ambition: the project success would be judged by its
achievement of the goals and the development team had to some extent staked
their reputations on it. Also, the inclusion of environmental benefits in the site
purchase put added pressure on achieving low carbon emission and other
environmental goals.
Regulative Barriers. In the case of the CHP plant Sutton Council insisted
on the nightly shutdown of the plant for noise reasons and this was a factor in the
frequent technical failures of the system, resultant high cost of maintenance, and
supplier ceasing trading. The shutdown was damaging but also unnecessary as the
equipment was not noisy, but Sutton Council did not relax the regulations (M.
Peacock, personal communication, January 13, 2011; Hodge & Haltrecht, 2009).

114
Key aspects leading to the CHP, GWTP outputs were:
The use of collaborative technical development workgroups
The deployment of unproven technology at full scale
Transition Management Appraisal
An appraisal of how well the BedZED transition process conforms to
transition management principles is shown in Table 33.

115
Table 33.
Appraisal of BedZED Similarity to Transition Management Principles
Theoretical
Principles TM
Appraisal Notes
creating space
for niches
Yes - The support of Sutton Council provided planning flexibility and
allowed the site to be purchased by unconventional means. Peabody, as
the developer and funder, appear to have been very committed to
allowing the project to achieve its aims despite the cost overruns, where a
less committed and tolerant developer may have forced many
compromises. It was still subject to a great deal of externally imposed
control though (legal, professional standards, management etc,).
focus on
forerunners
Yes – Dunster, Desai and Robinson have all the characteristics of
forerunners as do their organizations. Other frontrunners were companies
like Exus Energy and Albion Water.
guided
variation and
selection
No - the project essentially followed a strict construction project
blueprint type of pattern. The goal was defined in great detail and there
would have been little flexibility in achieving it.
radical change
in incremental
steps (guided
by a long term
vision)
No - the project was radical in design and technologies but very
conventional in its implementation. It was a single phase development.
While there was a vision of a sustainable community, it was short term to
medium term (around 5 years) and it was translated into a blueprint
during the design process.
learning-by-
doing and
doing-by-
learning
No - No doubt there was a great deal of first order learning during the
project about materials and technologies and design etc. but this learning
did not alter the goal or the process. At a higher level, there has been
reflection by all parties about the project as a whole, that has been
applied to future projects. BioRegional for example, have changed their
ideas about what the scale and focus of sustainable development should
be.
multi-level
approach,
multi-domain
approach
Partial - The raison d'etre of the project was as a solution (both live and
demonstration) to numerous societal problems and many design features
exist in response to the problem they are trying to solve. Also, the site
design was carfeully integrated in several respects across mobility,
social, ecological, and technical aspects to try to achieve outcomes that
exceed what more narrowly focused solutions could acheve.

116
Theoretical
Principles TM
Appraisal Notes
anticipation
and adaptation
No - While there has been follow up monitoring studies on the results of
the project, they were not part of any ongoing, adaptive management.
They were just static observations. Response to the poor performance of
the GWTP and CHP plant were to some extent adaptive but this was
reactive and unplanned.
empowering
niches
No - the community has little power over its own affairs or with the
regime it exists in (Peabody being the first regime 'layer') and apparently
has little interest in having more. At a higher level, the core group and
close partners like Sutton Council have grown in strength through the
attention attracted.
Selective
participatory
process
Partial - the core group (BioRegional and BDA) self selected each other
and went on to select to Sutton Council, Peabody to create something
resembling the main transition 'arena' from which 'arenas of arenas'
developed as needed. The selection was functional but very narrow and
some decisions may have been top down command control from
Peabody instead of consensus.
Normative
principles of
sustainability
Yes - Both BDA and BioRegional were committed to sustainability as an
outcome and made great effort to apply it in the design and the
construction process.
An appraisal against transformative planning and governance method
steps is shown in Table 34.

117
Table 34.
Appraisal of BedZED Similarity to Transformative Method Steps
Step Appraisal
Visioning NO – no participatory visioning exercise was held although the core
group did have a vision of a low ecological footprint community
leading 'mainstream' lives.
Analysis Partial –The project was based on an analysis of urban development
in the context of sustainability and building a new community
scratch was concluded to be an effective intervention against
problems such as urban sprawl and CO2 emissions.
Intervention Yes – The project was one large intervention.
Evaluation No – Wile there have been numerous assessment studies the
knowledge obtained has not been used to further the community
transition (although it has been used to inform other projects).
BedZED Outlook
There is no development plan at BedZED or any real push for one. In
transition terms, the community is stable, meaning it is not in transition. This is
unlikely to change until the community decides it is something they want to do
which does not appear likely given the apathy and disinterest of most residents (P.
Plum, personal communication, January 13, 2011). One possible opening that
might make a difference to this is the disgruntlement of residents in general with
the property management by Peabody and the moves that some residents have
made towards exercising their "right to manage" option in which they would take
over management responsibility from Peabody although so far they have hit a
stone wall on this (P. Plum, personal communication, January 13, 2011). Such a
development would move the community up several rungs on the ladder of

118
participation and may lead them on from dealing with routine maintenance issues
to more ambitious and development in the direction of sustainability.
Summary of BedZED Transition Strategic Factors
Summary results bringing the sustainability indicators together with the
transition path strategic factors for each output are presented in Table 35 and
Table 36.

119
Table 35.
BedZED Strategic Factors Contributing To Successful Outcomes
Output Sustainability Indicators Strategic Factors
(STARTUP)
Forming a visionary & entrepreneurial
core group
Obtaining local authority support
Developing and marketing a proposal
LOW
ENERGY
HOUSING
Energy Use & CO2
emissions
Utility Bills
Top down, professional & expert driven
Network of technical & professional
expertise
The use of collaborative, technical
development workgroups
Challenging and breaking down
accepted standards and norms
A strongly supportive local government
independently funded
LOW WATER
HOUSING
Water Use & Waste
Water Treatment
Utility Bills
Biodiversity
COMMUNITY Waste Production
Social Housing Provision
Car Dependency
Food production
Health & wellbeing
Social cohesion
A core group with a balanced diversity
of interests, united by a commitment to
sustainability
Use of creative and visionary innovators
with systems thinking competence in
design.
Appointment of a party responsible for
ensuring sustainable development
Appointment of a sustainable lifestyle
coach
Challenging and breaking down
accepted standards and norms
MBR-WTP Water Use & Waste
Water Treatment
Network of technical & professional
expertise
The use of collaborative technical
development workgroups
Indicator Changes: increased; decreased; negligible; ? unknown

120
Table 36.
BedZEDStrategic Factors Contributing To No Change Or a Decrease In
Sustainability Indicator.
Output Outcomes Strategic Factor
COMMUNITY Participatory Governance
Energy use & CO2
emissions / transport
Food production /
household
No long term sustainable development
plan
Failure to consider new forms of
governance
GWTP Water Use & Waste
Water Treatment
The deployment of unproven
technology at full scale
CHP Energy Use & CO2
emissions
Indicator Changes: increased; decreased; negligible; ? unknown

121
Forres
Introduction
Table 37.
Forres Profile
Transition Began 2007
Affiliation Transition
Town
Current Status Active Currently completing the second development plan
and applying for funding. Actively working on
community energy company, completing transition
"pavilion" and expanding community gardens
(Transition Town Forres Final CCF Report 2008-
11, 2011)
Purpose Semi-Active Active within the Transition Town Network and
work with other communities.
Dispersal Dispersed At least 5% of community population participate in
activities. Active involvement is much lower.
Growth Conversion Community participation is slowly growing.
Community
Population
9,500 (Piper & Villani, 2009, p. 5)
Forres is a small Scottish town that began its transition in late 2007. Carin
Schwartz founded Transition Town Forres (TTF) after reading about the
Transition Town movement and discussing it with two acquaintances she had met
through the nearby Findhorn Foundation (C. Mustard, personal communication,
January 6, 2011). TTF’s goals and motives closely align with Transition Towns'
of building "local resilience in the face of the potentially damaging effects of Peak
Oil and Climate Change" (Piper & Villani, 2009, p. 6) and its aims closely follow
the Transition Town model of (Piper & Villani, 2009, p. 9):

122
1. Developing the sustainability and resilience of the community,
2. Planning to end fossil fuel dependence,
3. Improving the health and empowerment of the community based on
ecological and ethical principles
The aims closely interlink and overall seek both physical change such as
independence from fossil fuels, and cultural change in the way the community
thinks of itself and acts with respect to its local to global relationships and
responsibilities. The concept of a resilient community is an important aim of the
transition that is not only concerned about being physically prepared for
anticipated change but about building the capacity of the community to withstand
shocks and adapt to change. TTF has set a timeframe of 20 years to achieve its
aims (Piper & Villani, 2009, p. 9).
Summary of Transition Output Sustainability Appraisal
The Forres transition outputs are summarized in Table 14. Details of the
sustainability appraisal are in Appendix D.

123
Table 38.
Forres Transition Outputs and Sustainability Appraisal
Output Components of Output Sustainability Indicatorsa Domains ΔS
PLASTIC
BAGS
Distribute Fair Trade
shopping bags
Waste Production
Low Impact
Consumerism
Shopping 1
COMMUN-
ITY
GARDENS
70 allotment plots
No artificial inputs
Bees, chickens &
composting
Food production
Local Economy
Community Assets
Social Cohesion
Eating 6
FARMERS
MARKET
Monthly farmers
market
Food Production
Community Assets
Social Cohesion
Eating
Shopping
6
LOCAL
FOOD
GUIDE
Published a directory
of local food
? Food Production Eating
Shopping
0
CARBON
PLEDGES
CO2 emission
reduction behavior
Energy use & CO2
emissions
Utility Bills
Food production
Low Impact
Consumerism
Housing
Mobility
Eating
Shopping
7
aResource use is relative to local or national averages
ΔS = Appraised Change in Sustainability
Indicator Changes: increased; decreased; negligible; ? unknown
The appraised sustainability gain of Forres is small but well distributed
across all sustainability criteria with the exception of livelihood sufficiency &
opportunity. Distribution across domains (Figure 24) is concentrated in only 4 out
of 9 domains with Eating being the strongest.

124
Figure 23. Forres sustainability of appraisal of outputs by sustainability criterion.
Figure 24. Forres sustainability appraisal of outputs by domain.
Analysis of Transition Outputs
Plastic Bags Output
Transition Town Forres aim to eliminate plastic bags in the town as a
positive step in itself but also because they are highly visible examples of
environmentally damaging behavior. It is hoped that the task of eliminating them
will raise awareness of other issues and encourage people to participate in other
TTF activities (Piper & Villani, 2009, pp. 19-20).
0
1
2
3
4
5
SEI LS&O I&IGE RM&E SEC&DG P&A
ΔS
Change in Sustain-abiity
PLASTIC BAGS
COMMUNITY GARDENSFARMERS MARKETLOCAL FOOD GUIDECARBON PLEDGE
01234567
ΔS
Change in Sustain-abiity
PLASTIC BAGS
COMMUNITY GARDENSFARMERS MARKETLOCAL FOOD GUIDECARBON PLEDGE
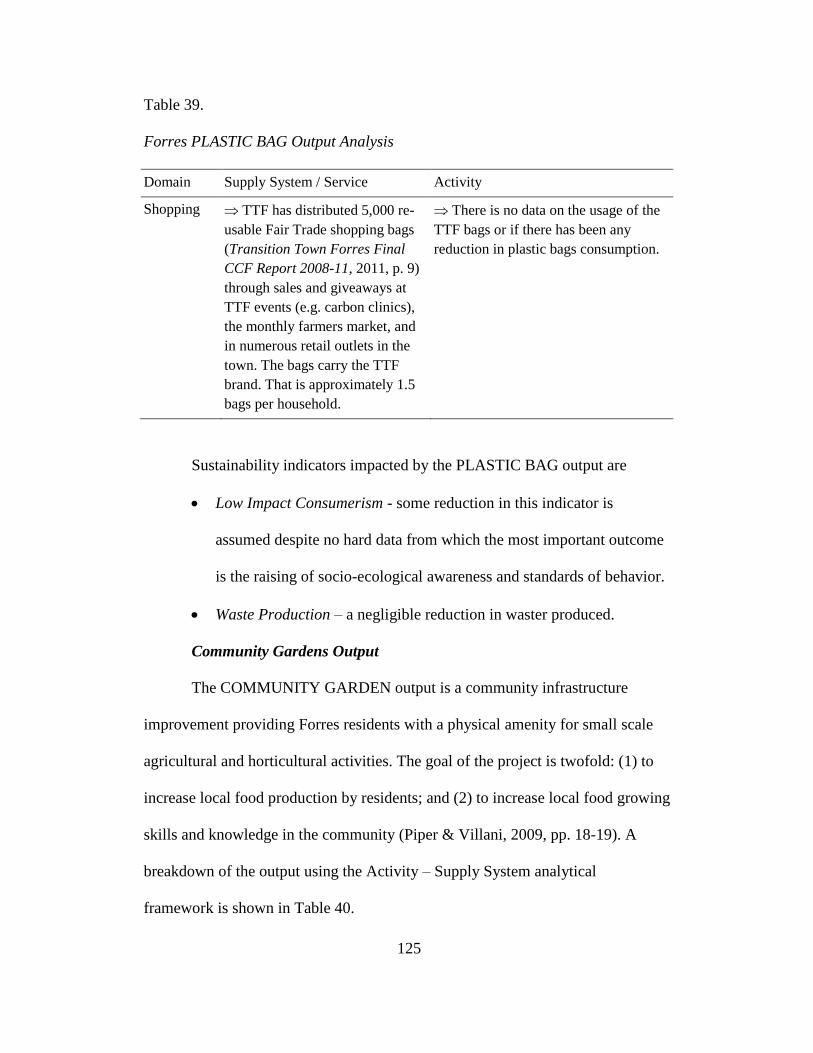
125
Table 39.
Forres PLASTIC BAG Output Analysis
Domain Supply System / Service Activity
Shopping TTF has distributed 5,000 re-
usable Fair Trade shopping bags
(Transition Town Forres Final
CCF Report 2008-11, 2011, p. 9)
through sales and giveaways at
TTF events (e.g. carbon clinics),
the monthly farmers market, and
in numerous retail outlets in the
town. The bags carry the TTF
brand. That is approximately 1.5
bags per household.
There is no data on the usage of the
TTF bags or if there has been any
reduction in plastic bags consumption.
Sustainability indicators impacted by the PLASTIC BAG output are
Low Impact Consumerism - some reduction in this indicator is
assumed despite no hard data from which the most important outcome
is the raising of socio-ecological awareness and standards of behavior.
Waste Production – a negligible reduction in waster produced.
Community Gardens Output
The COMMUNITY GARDEN output is a community infrastructure
improvement providing Forres residents with a physical amenity for small scale
agricultural and horticultural activities. The goal of the project is twofold: (1) to
increase local food production by residents; and (2) to increase local food growing
skills and knowledge in the community (Piper & Villani, 2009, pp. 18-19). A
breakdown of the output using the Activity – Supply System analytical
framework is shown in Table 40.

126
Table 40.
Forres COMMUNITY GARDEN Output Analysis
Domain Supply System / Service Activity
Eating An 11 year lease was obtained
from Moray Council on 1.5 acres
of common ground and converted
it into 14 permaculture style pods
(Transition Town Forres Final
CCF Report 2008-11, 2011, p. 6).
There is an annual fee of £40
and all residents of Forres are
eligible, subject to availability.
Shared tools, including a
tractor
The plots are fully utilized by 71
gardeners.
The garden plots are mostly used for
growing food, permaculture principles
are encouraged and artificial fertilizers
and pesticides are not allowed.
Gardeners share experiences and there
are occasional organized workshops.
Shared worm bed composting, free
rage hens and bee keeping.
The gardens are also enjoyed by
gardeners for their social benefit –
organizers are "constantly
…commended on how beautiful the
community garden is and what a
friendly and open space it is" (C.
Mustard, personal communication,
January 6, 2011).
Sustainability indicators impacted by the COMMUNITY GARDEN
output are
Food production / community, low input – slight increase. More
people in Forres are now growing their own food than before and
using low impact methods. This has benefits of socio-ecological
integrity benefits (reduced impacts from fossil fuels and artificial
agricultural inputs), resource management & efficiency (reduced use
of finite resources) and intra & inter-generational equity (increased
access to a source of low cost, healthy food particularly helping lower

127
income households). Additionally it increases community resilience to
food supply shocks and interruptions (precaution & adaptation).
Community Assets – increases the resources under the control of the
community and their capacity to manage them. Managed in a
sustainably oriented way the garden is an important contribution to the
community’s socio-ecological civility & democratic governance.
Social Cohesion – slight increase through the strong camaraderie
among the gardening community (intra & inter-generational equity).
Farmers’ Market Output
The FARMERS’ MARKET output is a community service to "provide
opportunities for members of the Forres and other local communities to purchase
and/or sell healthy, fresh and locally grown food and other products, as well as
providing a vehicle for TTF to promote health and raise awareness of
environmental and other sustainability issues" (Piper & Villani, 2009, p. 19). A
breakdown of the output using the Activity – Supply System analytical
framework is shown in Table 40.

128
Table 41
Forres FARMERS’ MARKET Output Analysis
Domain Supply System / Service Activity
Eating Monthly market held in a high
street location with local traders
selling locally produced food and
crafts.
Much of the produce is low
input (M. Scarlett, personal
communication, January 5, 2011;
C. Mustard, personal
communication, January 6, 2011)
An average of 500 visitors per
month (approximately 5% of Forres
population) (Transition Town Forres
Final CCF Report 2008-11, 2011, p. 6).
There is no data on how much
produce is sold or the impact on local
producers.
Shopping The market has created a new
public space.
The market appears to be a popular
social event where the community
interacts as well as for shopping.
Scarlett (personal communication,
January 5, 2011) cites two
conversations she had with community
members at the market.
Sustainability indicators related by the FARMERS’ MARKET output are
Food production / local – slight increase. It is assumed that the market
has increased demand for local produce although there is no data to
confirm this.
Local Economy – slight increase. It is assumed that the market has had
a positive impact on the local economy creating employment in food
production and distribution in the local area and region.
Community Assets – in its short history the market has become a well
established and popular part of town life and can be considered a
community asset to some extent.

129
Social Cohesion – the market point has become a "focal point" for
TTF (M. Scarlett, personal communication, January 5, 2011) and it has
created a new "public space" that increases social cohesion of the
community.
Local Food Guide Output
The LOCAL FOOD GUIDE output is a community service output
providing Forres residents and the wider regional population with information on
local food. The aim of the guide is to increase interest and demand for local food,
supporting the local economy and encouraging a healthy "Moray" diet.
Table 42.
Forres LOCAL FOOD GUIDE Output Analysis
Domain Supply System / Service Activity
Eating 3,000 copies of the food guide
were printed and distributed free
of charge through various outlets.
That is approximately one per
household (although many will
have gone outside the town).
The guide provides a directory
of information on local foods,
producers and outlets.
There is no data on whether there
has been any change in eating or
shopping activity.
Sustainability indicators related to the LOCAL FOOD GUIDE output are:
Food Production / local – no change. Going by the demand and
reports of very favorable comments, the guide has been very popular
and indicates a strong interest in local food. However, there is no data

130
(and it is probably too early to tell) to indicate a change in local food
production.
Carbon Pledges Output
The CARBON PLEDGES output is a behavioral output used by TTF as a
method to measure and reduce community carbon footprints. Using elements
from various NGOs, academic institutions, and other communities that have used
it, 160 households (approximately 5% of the Forres total) have been engaged in
face-to-face interviews to create individual carbon footprints that highlight where
reductions can be most easily achieved. Householders are encouraged to make
pledges on what they will do and a future follow up interview will assess the
result (Transition Town Forres Final CCF Report 2008-11, 2011, p. 11).
Footprints are analyzed across categories of energy, food, travel, consumables and
recycling, and pledges are based on behavioral changes that in most cases save the
household money (Carbon Cutting Challenge Report, October - December 2010,
2011, pp. 15-20). A breakdown of the output using the Activity – Supply System
analytical framework is shown in Table 43.

131
Table 43.
Forres CARBON PLEDGES Output Analysis
Domain Supply System / Service Activity
Housing No Impact Pledges to take actions such as
adjusting thermostats or air drying
clothes yielded the greatest gain (47%)
in the school sample (Carbon Cutting
Challenge Report, October - December
2010, 2011).
Pledges to reduce waste and increase
recycling.
Mobility No Impact Pledges such as using public
transport more often or walking, taking
the train instead of flying, and avoiding
unnecessary car trips yielded substantial
reduction (29%) in the school sample
(Carbon Cutting Challenge Report,
October - December 2010, 2011).
Eating No Impact Pledges such as reducing meat,
buying local and organic.
Shopping No Impact Pledges to reduce consumption.
Sustainability indicators related to the CARBON PLEDGES output are:
Energy use & CO2 emissions / housing, transport – has decreased. On
average, a reduction of 2 MT CO2 per year per household was pledged
(Transition Town Forres Final CCF Report 2008-11, 2011, p. 11) for
the households that tool part. The data is not clear but this appears to
be reduction of approximately 15% in household CO2 emissions. This
outcome increases socio-ecological integrity, resource maintenance &
efficiency and precaution & adaptation.

132
Utility Bills – has decreased. Implementing the pledges will save
households money on electricity and natural gas bills and gasoline.
Pledge actions are all no or very low cost and are progressively
beneficial to lower income households (inter & intra-generational
equity).
Food production or choices / low input – small increase. Although
pledges made only a small contribution to CO2 reductions there are
other socio-ecological benefits to choosing low input food. Perhaps the
food choice pledges made have as much or more benefits than the
farmers’ market or the community garden food production.
Low Impact Consumerism – small increase.
Transition Path Analysis
The complete reconstructed transition path for Forres is shown in Figure 8.
It can be decomposed into one common root segment from which each output
branches along similar, though distinct paths. The segments are listed in Table 44.
Table 44.
Forres Transition Path Segment To Output Map
SEGMENT OUTPUT
1 (STARTUP)
1,2 PLASTIC BAGS
1,3 COMMUNITY GARDEN
1,4 FARMERS MARKET
1,5 LOCAL FOOD GUIDE
1,6 CARBON PLEDGES

133
Figure 25: Forres transition path. (See Appendix E for legend).

134
Startup (Segment 1)
Figure 26: Forres transition path segment 1 (STARTUP).
Segment 1 is common to all of the Forres transition outputs. Following the
initial ORGANIZATION there was a period of informal though serious
MOBILIZING of volunteers through film nights (C. Mustard, personal
communication, January 6, 2011) and NETWORKING to build a network of
support with other community organizations, businesses and NGOs. More
significant to the course of the transition however, were the three intermediary
products that were produced over six months from March 2008:
1. A formal organization structure consisting of a board of directors, a
management team, and multiple workgroups.

135
2. A detailed three year action plan.
3. A Scottish government grant for £184,000 to implement the action
plan.
As in indicated by the REGULATIVE barrier to FUNDING in Figure 26
the first two items were prerequisites of the third, i.e. in order to qualify for
government funding, the recipient organization had to be a registered company
(M. Scarlett, personal communication, January 5, 2011) and had to have a plan
clearly stipulating what would be done and how much it would cost. The corollary
of this was that the transition was then obligated to adhere to the plan for the next
three years. Thus the funding was both enabling and constraining at the same
time, perhaps locking the transition into actions that they identified early on more
than they would have liked to have been. The commitment to a detailed three year
action plan early in the transition is also somewhat at odds with the Transition
Town "12 steps of transition" which, in the early stages of the transition
recommends "the need to demonstrate visible progress, without embarking on
projects that will ultimately have no place on the Energy Descent Action Plan"
(Brangwyn & Hopkins, 2009, p. 26). There is no suggestion here that the actions
identified in the plan were not well chosen or will turn out to be ineffectual, it is
just a procedural observation. There was also a valid reason for it happening this
way. A window for the government funding opened in March 2008 and the core
group decided it was in their best interest to be in the first tranche of awards and
so an application would have to be submitted within a few months.

136
The organizational structure and operation of the transition around March
2008 then took a rapid shift from the first few months of informal activity to the
very formal organizational and managerial approach needed to form a company
with a board of directors, write the grant application and take on the responsibility
that goes with a £184,000 grant (M. Scarlett, personal communication, January 5,
2011).
Key actions in segment 1 were:
Creating a formal organizational structure
Committing to a short term (three year) action plan
Common pattern of output path segments. Prior to receiving the grant,
workgroups (or "hubs" as they are called) began to be created to focus on the
different objectives identified in the grant application. On receipt of the grant in
October 2008, pathways to each of the five transition outputs followed a similar
pattern. Typically there would be a period of networking where a workgroup
would engage with outside actors to get information and help, negotiate with them
to acquire resources that were needed, or enlist their participation. Following on
from this, or to some extent in parallel, the workgroup would be mobilizing the
community to actually use, take-up or participate. This pattern is explained for
each of the outputs below.

137
Plastic Bags (Segment 2)
Figure 27: Forres transition path Segment 2 (PLASTIC BAGS)
The path to the PLASTIC BAGS output consisted of NETWORKING
(negotiations) with suppliers to order the bags and with local retailers to stock and
sell or otherwise them. MOBILIZING the community to take (or buy) a bag was
not a problem but motivating them to overcome the BEHAVIORAL BARRIER to
discontinuing the use of plastic bags is more difficult. Other than distributing the
bags and providing information at that that time, there was no extended
motivational or follow up campaign to get people to use them. As noted before,
there is no data on the usage of the bags so it is not known by how much the
behavioral barrier has been overcome. The transition's development plan
identifies indicators to be tracked for the number of bags distributed and the
number of outlets carrying them but not for actual use of the bags or consumption
of plastic bags by the community (Piper & Villani, 2009, p. 24).
Key aspects points contributing towards this outcome were:
Using a highly visible, ‘symbolic’ target to increase awareness of other
issues

138
Use of promotional type marketing to encourage participation
Lack of monitoring to track results
Community Garden (Segment 3)
Figure 28: Forres transition path Segment 3 (COMMUNITY GARDEN)
Again, initiating the COMMUNITY GARDENS output consisted of
NETWORKING activity to get help and advice on setting up the gardens and
negotiations with Moray Council to acquire a lease on the land. Once a site had
been acquired MOBILIZING was not a problem: the plots were rapidly taken up
on the basis of the information provided through newsletters, website and notice
boards. However, the TTF team working on this project did not stop there.
Using support and mobilizing to maximize outcomes. Providing
support (training, advice, resources, etc.) and the strong cohesion and sharing of
experiences that has developed among gardeners has made sure the gardens have
been successful. This added value came about through a high degree of
organization, planning for months beforehand and continuing to add value in

139
many ways to the basic amenity. The workgroup did not assume that simply
acquiring the land and dropping in gardeners would be enough.
Finding land at an affordable price (overcoming an ECONOMIC or
REGULATIVE barrier). The biggest problem creating the COMMUNITY
GARDENS was obtaining a lease on the land. The 1.5 acre site, about half of
which is used for the gardens (the other half will be used for the TTF pavilion) is
"common good land4". However, although TTF were attempting to use the land
(which was unused at the time) for the good of the community, Moray Council
were difficult to deal with and were imposing a substantial but standard cost on
the lease. "We really found it very hard to think we were using common good
land but we had to pay £40,000 for an 11 year lease for a community activity" (M.
Scarlett, personal communication, January 5, 2011). Direct NEGOTIATION and
appeal failed to move Moray Council on the issue. Scarlett sees this as part of a
bigger problem that local government "is not community based, it is not
community aligned" (2011) and in this sense this may be interpreted as a
REGULATIVE barrier where the existing rules are inappropriate or even unjust
(this was common good land that the community were being obstructed from
using for the common good). In the end there was no option but to agree to the
full cost which was only possible for TTF to do because they had substantial
funds (FUNDRAISING in segment 1).
4 Common good land is land originally owned by the "burghs" of Scotland for the good of its
citizens now held in stewardship by local government since abolition of the burghs in 1975 (Wightman & Perman, 2005).

140
Key factors contributing to the COMMUNITY GARDENS output were:
Having substantial funds available
Direct dealing with unsympathetic local authorities through standard
channels was unsuccessful
Using support and mobilizing to maximize outcomes.
Farmers Market (Segment 4)
Figure 29: Forres transition path Segment 4 (FARMERS MARKET)
The path segment leading to the FARMERS MARKET output follows the
same NETWORKING – MOBILIZING pattern as COMMUNITY GARDENS.
Building a network of traders, getting advice from organizations like the Scottish
Association for Farmers’ Markets and obtaining all the hardware followed by
informing the public and mobilizing the small army of volunteers were all
essential parts of getting the market up and running. As with the COMMUNITY
GARDEN, organization, planning and hard work have been key to making the
FARMERS’ MARKET successful. Other highlights of path are described below.

141
Conducting Exploratory Trial Runs. Before the current, regular
monthly market on the High Street began in April 2010 a series of trial events
were held on a site at the edge of the town to gauge public and trader response
and decide what would work best. It was decided to concentrate on food with
some crafts, to move to a new site on the High Street and have two markets per
month. The first two decisions worked very well but two markets per month was
too much and it was dropped to monthly.
Mobilizing the Volunteer Workforce through Community Networks.
The market requires a lot of effort: "setting up the farmers market, the
permissions, licenses, it was a full time job on its own, and then every time we
have a market 15 or 16 [volunteers] are involved in putting it up and taking it
down" (M. Scarlett, personal communication, January 5, 2011). The help of other
community groups is often received for this job. Mobilizing the volunteer
workforce has not so far been a barrier but could easily become one.
Obtaining a license (NETWORKING to overcome REGULATIVE
BARRIER). While still at the edge of town site Moray Council insisted TTF
widen the vehicular access at a cost of £16,000. When a site was identified on the
High Street it took months of wrangling with the local council to get a license. As
Mustard says, the "clear barrier we have had is a lot of red tape from the local
council. It has been very disruptive, very infuriating" (personal communication,
January 6, 2011). There have been other incidents that suggest a combination of
individual council officer obstructionism, poor organizational communication and
coordination, inappropriate standards and procedures, and possibly even

142
professional self-interest as some of the reasons for this barrier (M. Scarlett,
personal communication, January 5, 2011; C. Mustard, personal communication,
January 6, 2011). The barriers erected by the council have been overcome by
nothing more than "doggedness" while TTF has now established some political
support and has developed a lot of capacity for dealing with the council (C.
Mustard, personal communication, January 6, 2011).
Key factors contributing to the FARMERS’ MARKET output were:
Persistence in overcoming local government obstructionism
Mobilizing the volunteer workforce through community networks
Pilots and trials to find what works best.
Local Food Guide (Segment 5)
Figure 30: Forres transition path segment 5 (LOCAL FOOD GUIDE)
This output consisted of building the networks to acquire the information
and distribute the product, and making it known to the public that it is available,
who produced it and why. There are no follow up actions planned in relation to
this output (other than a second edition of the guide).

143
Key factors contributing to the LOCAL FOOD GUIDE output were:
Performing detailed research to compile and make accessible local
knowledge
Lack of evaluation and monitoring to understand the impact of this
output
Carbon Pledges (Segment 6)
Figure 31: Forres transition path segment 6 (CARBON PLEDGES)
The CARBON CLINIC output first required NETWORKING activities to
identify a methodology to use (through contacts with Going Carbon Neutral
Stirling, Energy Savings Trust, Edinburgh University and other groups) and to
negotiate with local organizations (e.g. businesses, schools) as a means of gaining
access to potential subjects. MOBILIZING and MONITORING then ran together
where subjects are recruited, their carbon footprint measured and results shown to

144
them, motivating them to make pledges and to participate in the follow up
monitoring to see how they have done. The highlights of the path to this output
are described below.
Recruiting Participants (Overcoming BEHAVIORAL BARRIER to
participation). Motivating people to participate was a problem. Initial attempts to
recruit people "off the street" to participate were not very successful and those
who did agree to participate tended to be already low footprint. Working with a
local business to be allowed access to employees and running a series of drop in
"carbon clinics" in the community center were other methods of recruitment used.
The most successful method was to work with two classes in a primary school and
integrate the footprinting and pledging with an eight week lesson plan and gaining
access to around 40 households.
Labor intensive. Conducting face-to-face interviews with every
participant is time consuming. Much of the carbon pledge work was performed by
dedicated volunteers but a project management consultancy specializing in
community projects was used for the school project.
Overcoming Behavioral Barriers to Reduce Energy Use. The face-to-
face pledge system has the advantages of highlighting where to make changes and
answering participants questions on the spot, person-to -person. It also lends more
weight to the pledge having the participants do it in front of a "witness" and
knowing that there will be a follow up.
Key factors contributing to the CARBON PLEDGES output were:
Using community networks to mobilize participation.

145
Integrating projects with educational programs can provide dual
benefits.
A heavy reliance on volunteer workers
Use of funding to employ consultant staff
Transition Management Appraisal
An appraisal of how well the Forres transition process conforms to
transition management principles is shown in Table 45.

146
Table 45.
Appraisal of Forres Similarity to Transition Management Principles
Theoretical
Principles TM
Appraisal Notes
creating space
for niches
Partial - the lack of support from Moray Council and the low level of
participation in the town means that the transition team have to work
extra hard to accomplish tasks and sustain their success. However,
despite the barriers, they have succeeded in creating their own protective
space.
focus on
forerunners
Yes - the core group has initiated significant change in the town. The
ideas are not novel but they are social innovations in Forres. It is not also
the basic ideas that are new, but the details of their implementation
reinforce the break from standards. The allotments for example, were
laid out in a permaculture design as opposed to orthodox layouts, and the
shopping bags were Fair Trade products.
guided
variation and
selection
Partial - a broad portfolio directed to local food has been the main focus
radical change
in incremental
steps (guided
by a long term
vision)
Yes - the actions have all been relatively small steps but within an overall
strategic framework and aims.
learning-by-
doing and
doing-by-
learning
No - There is no strong indication of second order learning taking place.
The goals and approach are those of the Transition Town movement and
these do not seem to have been seriously questioned or any evaluation of
them instantiated. There has been no real linking of transition theory to
practice and attempting to learn from this.
multi-level
approach,
multi-domain
approach
No - The standard analysis of the Transition Towns movement was
accepted as being applicable.
anticipation
and adaptation
No - while attention is paid to how well some individual actions are
performing in terms of participation, there is no monitoring of the impact
on the community. For example, what impact has the local food guide
had, or has the farmers' market resulted in increased demand on local
producers? Carbon footprint measuring is providing some data but there
is no program for continuous monitoring of this.

147
Theoretical
Principles TM
Appraisal Notes
empowering
niches
Partial - the transitions organizational structure, growing support base
and participation, and accomplishments are increasing its legitimacy and
credibility. It is learning to deal with local government. It has
accumulated resources. All of these things indicate growing
empowerment, of a community exercising some control over their
development.
Selective
participatory
process
Partial - the project is community driven as represented by a sizeable,
self selected core group, with input from and oversight by a separate,
though not entirely independent, board. Membership is open and
encouraged but to get involved at the core management level or as a
project leader some demonstration of commitment and responsibility
need first be shown that goes with it. There is no direct representation
from business, higher education, government or NGOs in the
organization. The core group formed from like minded residents,
influenced by the nearby Findhorn Foundation and Transition Town
movement. There was no deliberate attempt to create diverse and
representative membership although it has always been entirely open to
new members. The Board was initially filled from original core group
members but there has been a conscious effort to broaden the
membership to be more representative of the grater community.
Normative
principles of
sustainability
Partial - the transition has a set of operating principles, some of which
relate to what might be accepted as general sustainable development
principles. However, they are incomplete, their normative qualities are
not defined and there are no guidelines for their application.
An appraisal against transformative planning and governance method
steps is shown in Table 46.
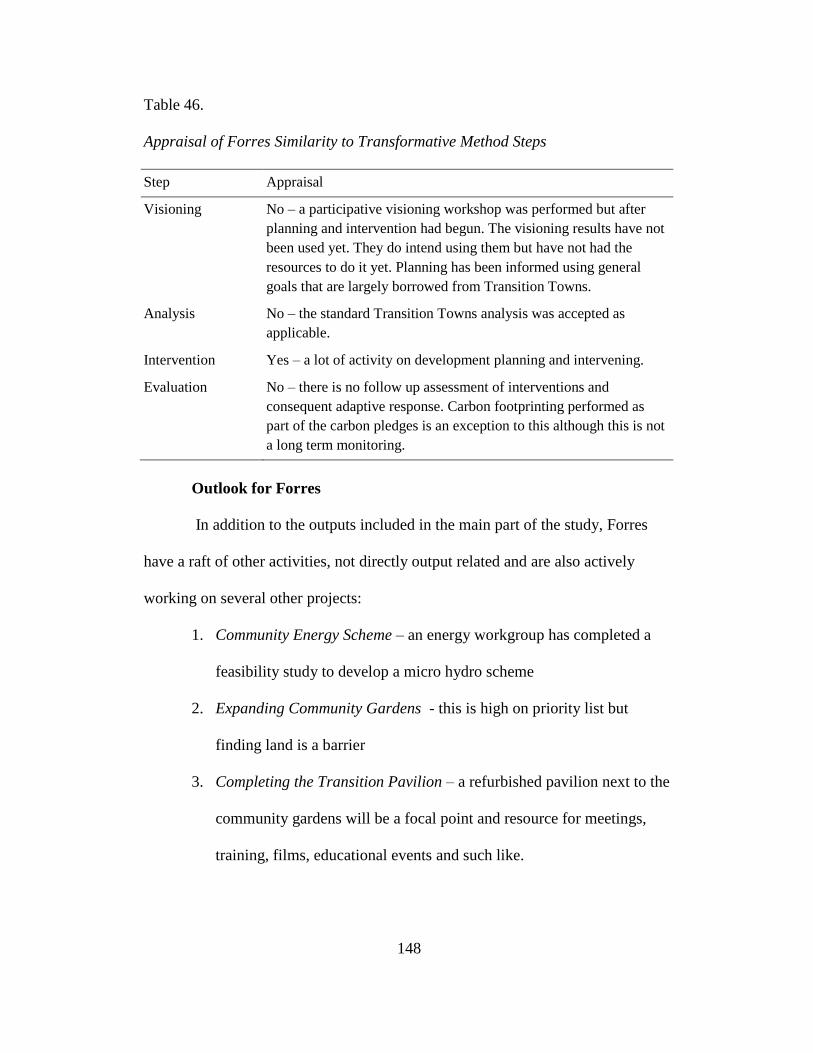
148
Table 46.
Appraisal of Forres Similarity to Transformative Method Steps
Step Appraisal
Visioning No – a participative visioning workshop was performed but after
planning and intervention had begun. The visioning results have not
been used yet. They do intend using them but have not had the
resources to do it yet. Planning has been informed using general
goals that are largely borrowed from Transition Towns.
Analysis No – the standard Transition Towns analysis was accepted as
applicable.
Intervention Yes – a lot of activity on development planning and intervening.
Evaluation No – there is no follow up assessment of interventions and
consequent adaptive response. Carbon footprinting performed as
part of the carbon pledges is an exception to this although this is not
a long term monitoring.
Outlook for Forres
In addition to the outputs included in the main part of the study, Forres
have a raft of other activities, not directly output related and are also actively
working on several other projects:
1. Community Energy Scheme – an energy workgroup has completed a
feasibility study to develop a micro hydro scheme
2. Expanding Community Gardens - this is high on priority list but
finding land is a barrier
3. Completing the Transition Pavilion – a refurbished pavilion next to the
community gardens will be a focal point and resource for meetings,
training, films, educational events and such like.

149
Forres are applying for Scottish government funding for 2011 – 2012
while they seek alternative funding and develop revenue sources (Transition
Town Forres Final CCF Report 2008-11, 2011).
Forres have created considerable momentum in their short history but they
have not yet reached the "critical mass" needed for take off, something that
Scarlett feels is getting closer but it may take some external stimulus to trigger it
(personal communication, January 5, 2011). They also face some significant
challenges that they continue to work on.
1. The high reliance on volunteer work is a risk
2. The need become financially independent
3. The need to develop a positive partnership with local government
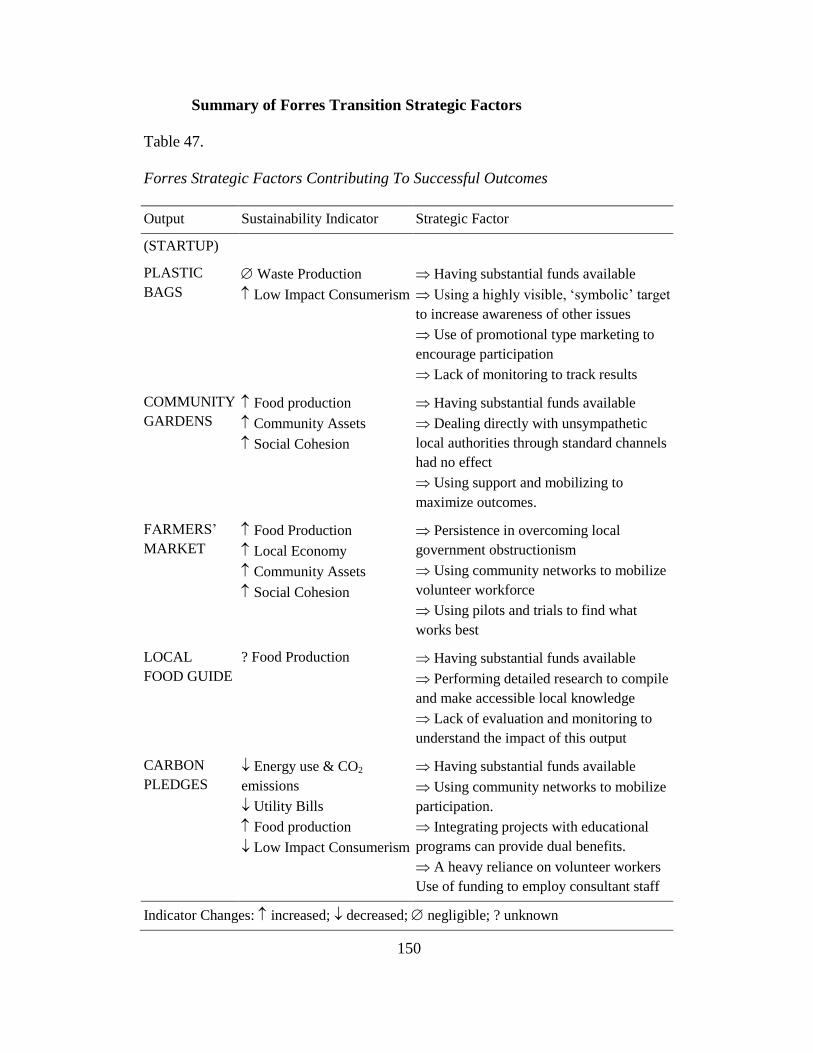
150
Summary of Forres Transition Strategic Factors
Table 47.
Forres Strategic Factors Contributing To Successful Outcomes
Output Sustainability Indicator Strategic Factor
(STARTUP)
PLASTIC
BAGS
Waste Production
Low Impact Consumerism
Having substantial funds available
Using a highly visible, ‘symbolic’ target
to increase awareness of other issues
Use of promotional type marketing to
encourage participation
Lack of monitoring to track results
COMMUNITY
GARDENS
Food production
Community Assets
Social Cohesion
Having substantial funds available
Dealing directly with unsympathetic
local authorities through standard channels
had no effect
Using support and mobilizing to
maximize outcomes.
FARMERS’
MARKET
Food Production
Local Economy
Community Assets
Social Cohesion
Persistence in overcoming local
government obstructionism
Using community networks to mobilize
volunteer workforce
Using pilots and trials to find what
works best
LOCAL
FOOD GUIDE
? Food Production Having substantial funds available
Performing detailed research to compile
and make accessible local knowledge
Lack of evaluation and monitoring to
understand the impact of this output
CARBON
PLEDGES
Energy use & CO2
emissions
Utility Bills
Food production
Low Impact Consumerism
Having substantial funds available
Using community networks to mobilize
participation.
Integrating projects with educational
programs can provide dual benefits.
A heavy reliance on volunteer workers
Use of funding to employ consultant staff
Indicator Changes: increased; decreased; negligible; ? unknown

151
CASE COMPARISON
Case Level Comparison
Table 48 summarizes the involvement of different actor groups in each of
the cases. In short, BedZED was a professional venture bringing together
professional and technical services and resources from business, non-profit and
government sectors but with very little community engagement. Ashton Hayes
and Forres on the other hand rely on strong community participation, with help
from non-profits and local businesses. Whereas Ashton Hayes managed to gain
support from their local government Forres have been held back by theirs. Ashton
Hayes is the only case in which higher education plays a prominent role.

152
Table 48.
Cross Case Comparison of Actors
Ashton Hayes BedZED Forres
Core Group 3 community members
who interact frequently,
informally and fluidly.
Professional
partnership between a
business and 2 non-
profit organizations.
5 to 10 community
members formally
organized into a
management team
NGOs For specialized
knowledge and support
2 core members are
non-profits and seed
funding was provided
by WWF.
For education and
training, for
specialized knowledge
and support.
Businesses Receive strong support
from local businesses.
An important
partnership formed with
one business in
particular.
Key partnerships;
extensive networking
for technical &
professional services;
specialist 'technology'
cross business
workgroups
Local businesses
engaged peripherally
in activities. Some
pro-bono support.
Government Mostly positive
relationship with local
government.
Strong support from
local government
Local government
relationship has been a
hindrance. Central
government provided
funding.
Higher
Education
Partnership with local
university
Community
Groups
Mutually supporting
relationship with many
community groups,
sometimes becoming
more extensive
collaborations.
Mutually supporting
relationship with
many community
groups,
Community
Members
Volunteer workforce;
Activity participation;
Participation in early
residency period.
Volunteer workforce;
Activity participation;
Table 49 summarizes the occurrence of different activities in each of the
cases. Networking features in all three cases as one of the dominant activities

153
(after startup). This is not surprising given that transition tasks generally require
access to all sorts of resources, skills, information, etc. that no single group can
provide for itself. What is more interesting is that in BedZED the networking is
accompanied by planning and organizing as the other dominant activities but in
Ashton Hayes and Forres the accompanying activity is mobilizing. So mobilizing
is important in Ashton Hayes and Forres but not in BedZED, though BedZED
does feature some mobilizing in segment 3 (Figure 21). This is the green lifestyle
officer and BioRegional / BDA social involvement during the community
building for the first year after construction. Mobilizing is absent from other parts
of BedZED pre-residency because there is no community to mobilize at that time,
and post community building, because there is no-one willing to do it. In Ashton
Hayes and Forres however, mobilizing plays a part in the startup period as well as
a significant part in pathways to some of the outputs (all of the outputs in Forres
case).
Mobilizing encourages participation by whatever means possible. It
engages the community in collective action, gets them involved, and can instill in
them a sense of responsibility and ownership. This is seen in the Forres
community gardens where there was a strong program of mobilization to provide
workshops, education, and value adding after they were up and running.
Mobilization also feeds off results so in Ashton Hayes, as the community were
fed back the results of their energy and CO2 reduction efforts they could see that
collectively, the community have achieved much, even though their individual
contribution may have been small. So mobilization is an important driver of

154
behavioral change (Edwards, 2007; Middlemiss, 2008). As noted in the BedZED
results, the effect of removing the mobilizing force in 2003 was a halt, or even
reversal, of sustainable community development gains made in the first year, a
state that has persisted until today.
If mobilizing were to cease in the Forres garden or in Ashton Hayes would
there be a loss in the advances made? While Ashton Hayes are no longer pushing
household energy saving with the same vigor as a few years ago, they continue to
mobilize in other ways and there has been no decline noted in annual carbon
footprint results.
Planning featured in varying degrees and different natures in each case.
Planning very broadly refers to any type of consideration given to future actions.
In Ashton Hayes planning is loose and informal giving them a great deal of
flexibility as they move forward. They do not commit to detailed plans and they
make decisions based on what they learn as they proceed and guided by the
overarching goal to become carbon neutral. Detailed planning is much more
important in the BedZED case and, like any construction project, becomes
progressively more specific as the project proceeds until it is complete. In Forres,
planning was a major part of the startup and it defined numerous tasks to be
accomplished over the next three years. The plan is largely informed by
Transition Town guidelines. Organization of work in the cases reflects the
different planning approaches. In Ashton Hayes, organizational structure comes
and goes depending on what is going on. They recruit volunteers, form
workgroups and engage in networks on an as need basis. BedZED created

155
technical workgroups across business partners to develop technology sub-
systems. In Forres, workgroups of volunteers were formed around the tasks
identified in the plan and responsibility to complete the tasks delegated to them.

156
Table 49.
Cross Case Comparison of Activities
Ashton Hayes BedZED Forres
Networking Occurs throughout.
Very diverse during
startup then targeted
towards outputs
Occurs throughout,
mainly with business
& local government
Occurs throughout.
Quite diverse during
startup, then targeted
as part of each output.
Mobilizing Important in gaining
community support and
then in energy use and
recycling outputs
Only during
community building
output.
Important to build
initial momentum and
then in each of the
outputs
Planning Light, and only during
startup
Important during
concept and proposal
development and again
during design and
construction stage,
producing blueprint
type plans
Detailed planning
during startup
Organizing Flexible, only when
needed. At the peak of
energy use output
volunteers were
organized into
workgroups.
Important during
design and
construction to manage
development work.
Also during
community building
output.
During startup,
organized into formal
management and
operational structures
Monitoring Regular monitoring of
carbon footprints.
Monitoring of new
technology CHP &
GWTP.
As part of carbon
pledge output.
Publicizing Used to great effect at
startup and interest has
been maintained
Not in the direct output
path (but used for other
purposes)
There has been local
publicity but it has not
been used as direct
tool toward outputs
Fundraising Not for 'first phase'
outputs.
During startup for
proposal & marketing
and as part of
community building
During startup
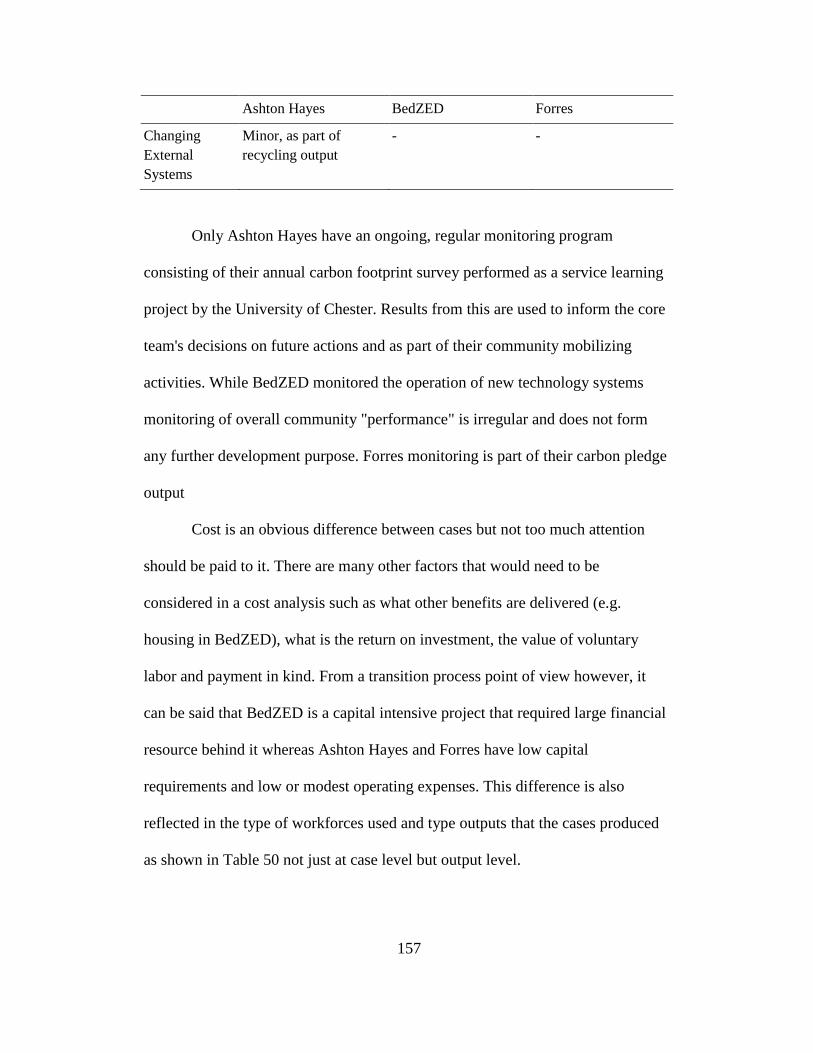
157
Ashton Hayes BedZED Forres
Changing
External
Systems
Minor, as part of
recycling output
- -
Only Ashton Hayes have an ongoing, regular monitoring program
consisting of their annual carbon footprint survey performed as a service learning
project by the University of Chester. Results from this are used to inform the core
team's decisions on future actions and as part of their community mobilizing
activities. While BedZED monitored the operation of new technology systems
monitoring of overall community "performance" is irregular and does not form
any further development purpose. Forres monitoring is part of their carbon pledge
output
Cost is an obvious difference between cases but not too much attention
should be paid to it. There are many other factors that would need to be
considered in a cost analysis such as what other benefits are delivered (e.g.
housing in BedZED), what is the return on investment, the value of voluntary
labor and payment in kind. From a transition process point of view however, it
can be said that BedZED is a capital intensive project that required large financial
resource behind it whereas Ashton Hayes and Forres have low capital
requirements and low or modest operating expenses. This difference is also
reflected in the type of workforces used and type outputs that the cases produced
as shown in Table 50 not just at case level but output level.
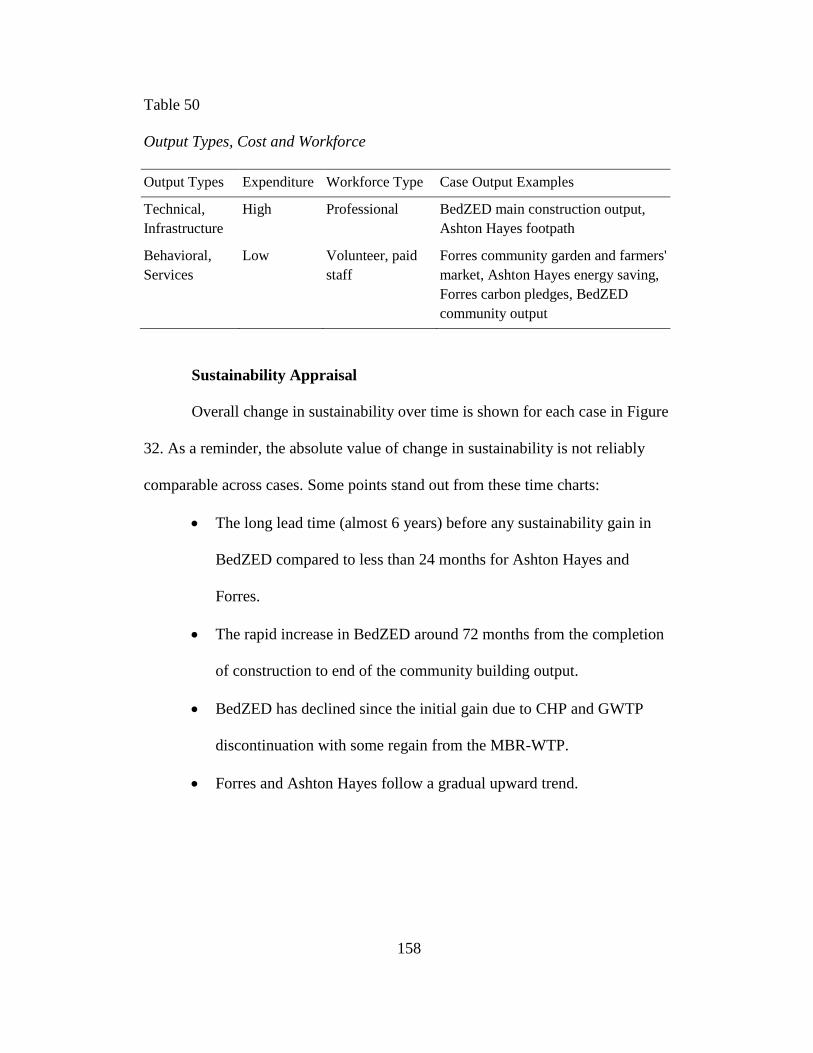
158
Table 50
Output Types, Cost and Workforce
Output Types Expenditure Workforce Type Case Output Examples
Technical,
Infrastructure
High Professional BedZED main construction output,
Ashton Hayes footpath
Behavioral,
Services
Low Volunteer, paid
staff
Forres community garden and farmers'
market, Ashton Hayes energy saving,
Forres carbon pledges, BedZED
community output
Sustainability Appraisal
Overall change in sustainability over time is shown for each case in Figure
32. As a reminder, the absolute value of change in sustainability is not reliably
comparable across cases. Some points stand out from these time charts:
The long lead time (almost 6 years) before any sustainability gain in
BedZED compared to less than 24 months for Ashton Hayes and
Forres.
The rapid increase in BedZED around 72 months from the completion
of construction to end of the community building output.
BedZED has declined since the initial gain due to CHP and GWTP
discontinuation with some regain from the MBR-WTP.
Forres and Ashton Hayes follow a gradual upward trend.

159
Figure 32: Cross case change in sustainability over time.
Overall change in sustainability across sustainability criterion for each
case is shown in Figure 33. Points of note include:
Ashton Hayes is remarkably well distributed across all criteria.
BedZED does not make any gain in socio-ecological civility &
democratic governance reflecting the general disinterest in
sustainability among residents and low level of participatory
governance exercised and is weak in livelihood security & opportunity
0
10
20
30
40
50
0 12 24 36 48 60
ΔS
Changein
Sustain-ability
Time (months)
Ashton Hayes
0
10
20
30
40
50
0 12 24 36 48 60 72 84 96 108 120 132 144 156 168
ΔS
Changein
Sustain-ability
Time (months)
BedZED
0
10
20
30
40
50
1 3 5 7 9 11 13 15 17 19 21 23 25 27 29 31 33 35 37 39
ΔS
Change
in
Sustain
-ability
Time (months)
Forres

160
reflecting little economic or employment opportunity created for the
community.
BedZED is particularly strong in inter & intra-generational equity due
to the social housing provision and strong social cohesion.
Forres is weak in livelihood security & opportunity reflecting little
economic or employment opportunity for the community has been
created with the accomplishments so far.
Figure 33: Cross case change in sustainability by sustainability criterion
Overall change in sustainability across community domains for each case
is shown in Figure 34. Points of note include:
Ashton Hayes is dominated by changes in housing and mobility from
the reduced energy use and CO2 emissions in these domains.
Change in BedZED is very concentrated in housing, reflecting the
dominance of the low carbon and low water features of the housing
and the social equity in the housing tenure.
Forres is very strong in the eating and shopping domains reflecting
their focus on food.
Ashton Hayes BedZED Forres SEI
LS&O
I&IGE
RM&E
SEC&DG
P&A

161
The absence of educating from all cases
The near absence of recreating from all cases.
Figure 34: Cross case change in sustainability by community domain
Indicator Level Comparison
To perform more detailed comparison than the overall case level it is
necessary to go to the sustainability indicators level. Outputs in this study are
unique to cases and so cannot be compared. However, when comparing across an
indicator it needs to be remembered that the indicator may have been impacted by
more than one output in each case, and more than one component in each output.
The change in indicator values for each case is listed in Table 51. Comparisons
are not made for all indicators. Of the seventeen indicators seven were only
impacted in one case so there is not much to compare except for asking why the
other two cases did not have any impact. Indicators scoring very low (e.g. 0 or 1)
across cases are not strong comparisons due to the uncertainty involved.
Ashton Hayes BedZED Forres Working
Housing
Mobility
Eating
Educating
Recreating
Communicating
Shopping
Cross-Cutting

162
Table 51.
Change In Sustainability Indicator Case Comparison
Sustainability Indicator
Ashton
Hayes BedZED Forres
• Access to basic services & amenities 1
• Biodiversity 1
• Car Dependency 2 5 0
• Community Assets 1 2
• Employment 1 0
• Energy use & CO2 emissions 10 9 6
• Food production 2 9
• Health & wellbeing 1
• Local Economy 1 1
• Low impact consumerism 3
• Participatory Governance 1
• Social Cohesion 3 1 2
• Social Housing Provision 3
• Sustainable Wood Fuel Resource 2
• Utility Bills 1 4 1
• Waste Production 2 2 0
• Water use & waste water treatment 0 9
Grand Total 26 36 24
Car Dependency
Reducing car dependency means providing alternative mobility options
and, even better, reducing mobility needs by making services more accessible
(Machler, 2010). Three cases touched on this indicator with varying results (Table
52).

163
Table 52.
Comparison Of Strategic Actions And Factors For Car Dependency Indicator
Case Output ΔS Action Contributing to
Indicator Improvement
Strategic Factors
(+ Positive, - Negative)
Ashton
Hayes
STATION
FOOTPATH
2 Improved pedestrian
access to train station
+Strong partnership with local
Government
+Use popular, political and
media support to empower
COMMUNITY
SHOP
1 Basic service
provision within the
community
+Intra community group
collaboration
BedZED COMMUNITY 5 Provision of
multiple transport
options
Disincentivize car
ownership
Bring services to the
community
+Strategic coalition with
balanced interests.
+Systems approach to design.
+Assign responsibility for
ensuring sustainable
development.
+Appoint sustainability coach
+Challenging standards &
norms.
Forres CARBON
PLEDGES
0 Ask for personal
commitments to reduce
car use in various ways
+Access to Funding
+Hiring staff or consultants
+Integrate projects with
education
+Mobilizing volunteer
workforce
Ashton Hayes is a very car dependent community due to its rural location.
The immediate problems they face in reducing car dependency are structural:
poor public transport links and few community located services. They have been
able to make small advances in both of these areas by successfully lobbying local
government to provide pedestrian access to the train station and by working with
other community groups to keep and improve the community's general store. The

164
relationship with local government, developed early in the transition, was very
important in the first action, as was being able to bring pressure to bear on the
council through public support, political support and media exposure. The second
action was possible through good community governance in identifying a problem
(or an opportunity), bringing together community groups to work on it and take
effective action. Thus the community have been able to marginally decrease car
dependency through marginally increasing both mobility options and
accessibility. Both areas of action were possible due to capacity built in the
community as part of the overall transitional process. The changes reportedly
have led to behaviour change with an increase in train use (Ashton Hayes Parish
Plan 2009, 2009) and a reduction in distance driven for shopping trips (Alexander
et al., 2010). However, these changes are too small to result in any noticeable
change in car ownership or CO2 emissions. Ashton Hayes is continuing to address
the mobility issue and will increase mobility options in 2011 by starting a
community car club with a solar charged electric car (R. Green, personal
communication, January 8, 2011).
BedZED's urban location and new construction make it quite different
from Ashton Hayes. Allowing residents to live without a car was considered from
the start and is built into the community as both hard and soft design features such
as the proximity to public transport, parking restrictions, cycle paths, car club and
grocery delivery service. Parking restrictions are not popular but the sustainability
aims and principles have been maintained by Peabody, the housing association.
The appointment of a sustainability coach, although only temporary played an

165
important role in developing the car club (the first in the U.K.) into an effective
operation (Department for Transport, 2004). BioRegional partnered with a small
business to form the car club and the sustainability coach worked with local
businesses for delivery service. However, while the community has much lower
car ownership and miles travelled than the local average, this is thought to be due
to demographics at least as much by design and choice (Hodge & Haltrecht, 2009,
p. 26) but arguably, maintaining a similar quality of life to that enjoyed in
BedZED without a car in other locations would be difficult to achieve. Thus,
despite the structural orientation away from car ownership and use, BedZED has
apparently not significantly changed resident behaviour. BioRegional attribute
much of this to the scale of development being insufficient to meet many resident
needs and the relatively few services available in the immediately surrounding
Hackbridge area but also to the need for continuous active community
development to break down behavioural barriers and maximize structural
possibilities (Desai, 2008; M. Peacock, personal communication, January 13,
2011). In later projects BioRegional have made the sustainability coach a
permanent position (M. Peacock, personal communication, January 13, 2011) and
perhaps had this been the case in BedZED car ownership would be even lower
than it is.
Forres has consciously not focussed on transport issues yet, as it was not
in their first three year plan. However, it has come up in the CARBON PLEDGES
output where one of the five areas for carbon emission reduction is transport. The
process is time consuming and labor intensive for which Forres have used both

166
voluntary and paid workers. The simple behavioural actions pledged include
reducing car trips to the supermarket, car pooling and using public transport.
Thus, they are appealing to residents to change their behaviour without any
structural change to encourage or make it easier for them and so, while there
might be some reduction of miles driven, it does not reduce car dependency by
improving mobility options or accessibility. The main point of the carbon pledge
scheme however, is to reduce carbon emissions as quickly, simply and cheaply as
possible. It is not a systemic intervention tool. Forres are aware of this and "are
looking at a car pool scheme ...during the past year ...are trying to promote more
biking ... are also working with Moray Council [on] bus routes and availability of
public transport".
The mobility domain of community life is a complex intertwining of
infrastructure, services and behaviour at community, local and regional scales
(Machler, 2010). The three cases here illustrate three different approaches each
with different outcomes:
Ashton Hayes used the community’s social capacity, much of it built
by the transition process, to effect small structural changes that have
produced marginal positive behavioral change.
BedZED used an integrated design approach and partnered with local
businesses to build low car dependency potential into the new
construction. That potential has been taken up by those who have no
choice (lower income households) or those who would choose to
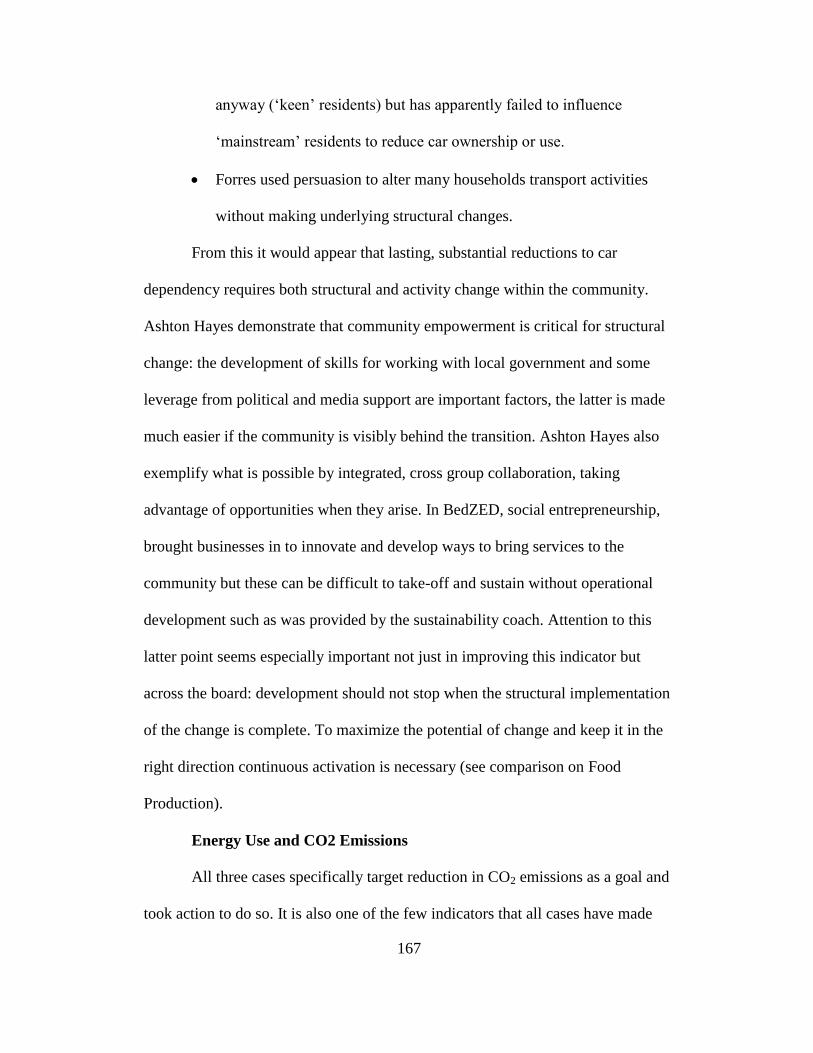
167
anyway (‘keen’ residents) but has apparently failed to influence
‘mainstream’ residents to reduce car ownership or use.
Forres used persuasion to alter many households transport activities
without making underlying structural changes.
From this it would appear that lasting, substantial reductions to car
dependency requires both structural and activity change within the community.
Ashton Hayes demonstrate that community empowerment is critical for structural
change: the development of skills for working with local government and some
leverage from political and media support are important factors, the latter is made
much easier if the community is visibly behind the transition. Ashton Hayes also
exemplify what is possible by integrated, cross group collaboration, taking
advantage of opportunities when they arise. In BedZED, social entrepreneurship,
brought businesses in to innovate and develop ways to bring services to the
community but these can be difficult to take-off and sustain without operational
development such as was provided by the sustainability coach. Attention to this
latter point seems especially important not just in improving this indicator but
across the board: development should not stop when the structural implementation
of the change is complete. To maximize the potential of change and keep it in the
right direction continuous activation is necessary (see comparison on Food
Production).
Energy Use and CO2 Emissions
All three cases specifically target reduction in CO2 emissions as a goal and
took action to do so. It is also one of the few indicators that all cases have made

168
some measurement of. Without becoming embroiled in detailed analysis of how
they made those measurements and exactly what they mean, the results are
presented simply in Table 53 along with the sustainability appraisal.
Table 53.
Comparison Of CO2 Emissions And Sustainability Appraisals.
Ashton Hayes a BedZED
b Forres
c
Baseline Reference 2006 survey Local average Local average
Baseline Emissions (MT) 14 11.2 14
Current Emissions (MT) 11 9.9 12
Reduction 21% 12% 14%
Community Saturation 100% 100% 5%
Sustainability Appraisal 10 9 6
CO2 emissions are annual household a (Alexander et al., 2010),
b (Hodge & Haltrecht, 2009),
c (Carbon Cutting Challenge Report, October - December 2010, 2011, Transition Town
Forres Final CCF Report 2008-11, 2011)
Table 54 shows how each case impacted their Energy Use and CO2
Emissions indicator and what strategic factors were important. Ashton Hayes
achieved by encouraging residents to do whatever they then can. The community
responded positively and emissions have been 20% to 23% below the 2006
baseline every year since 2007 mostly through air travel and home energy.
BedZED reductions are mainly from the intrinsically low carbon footprint of the
buildings though this was substantially increased when the renewably fueled CHP
plant was replaced with a natural gas boiler. Net reductions from resident activity
are zero where below average car use is cancelled out by above average air travel,

169
and residents appear to have similar behaviors to their pre-BedZED lives. Forres
reductions were achieved through individualized resident pledges from around
5% of households mainly by no or low cost home energy and transport behavioral
change.

170
Table 54.
Comparison Of Strategic Actions And Factors For Energy Use And CO2
Emissions Indicator
Case Output ΔS Action Contributing to
Indicator Improvement
Strategic Factors
(+ Positive, - Negative)
Ashton
Hayes
HOUSEHOLD
ENERGY USE
10 Energy saving
behavior in home and
transport
Energy saving
technology upgrades in
home
Installing home
micro-renewables
+ Using a complex combination
of mobilization, monitoring and
feedback.
BedZED LOW
ENERGY
HOUSING
9 Low energy use
building design
Low energy use
appliances
Renewable energy
generation
+ Challenging and breaking
down accepted standards and
norms
+ A strongly supportive local
government
CHP -3 Replace CHP with
natural gas boiler
- The deployment of unproven
technology at full scale
BedZED COMMUNITY 0 Provision of multiple
transport options
Disincentivize car
ownership
Bring services to the
community
+Strategic coalition with
balanced interests.
+Systems approach to design.
+Assign responsibility for
ensuring sustainable
development.
+Appoint sustainability coach
+Challenging standards &
norms.
Forres CARBON
PLEDGE
6 Ask for personal
commitments to reduce
energy use in home and
transport through
behavior change
+ Access to Funding
+ Hiring staff or consultants
+ Integrate projects with
education
+ Mobilizing volunteer
workforce

171
There are contextual differences between the cases but the general
message is that motivating community members to make CO2 reducing changes
in behavior is an effective method that delivers results quickly, easily and
cheaply, as in Ashton Hayes and Forres. The results can be improved when
residents also make technology changes, as in Ashton Hayes, although there is a
cost barrier to this. This method however, approaches limits as residents’
willingness to make bigger and bigger changes in behavior decreases and they
face the constraints of services and infrastructure on which they depend on.
BedZED also demonstrates the limitation of what building technology alone can
deliver: a "keen"BedZED resident can achieve much more through their mobility
activities, consumer and food choices (Hodge & Haltrecht, 2009). Desai (2008),
from his work on BedZED and other projects concludes that the most progress
towards sustainable communities will be made by focusing on lifestyle and
changing local and regional service infrastructure, supplemented with local or
community scale renewable generation. The cases studied here support this
conclusion.
Ashton Hayes and Forres both achieved results by persuading community
members to participate in taking action but they do so in different ways. Forres
quietly, methodically, and analytically worked its way through one household at a
time with its pledge system, whereas in Ashton Hayes it was a viral, motivational
campaign, though backed up with information and support. They have both been
effective (although longer term results of pledges remain to be seen). Perhaps the
viral campaign method is more suited to a small, close community like Ashton

172
Hayes than a larger town like Forres. In BedZED, if every resident was keen CO2
emissions would be around 45% below the baseline (Hodge & Haltrecht, 2009)
but there has been nothing being done to pursue this since the green lifestyle
officer finished in 2003.
Food Production
Both BedZED and Forres had explicit aims of residents producing food,
supporting local food producers and making low impact food choices (Hodge &
Haltrecht, 2009, p. 29; Piper & Villani, 2009, p. 29) but with markedly different
results despite providing similar functionality. In both cases residents were
provided with allotments, composting, training and support, access to local
produce, education and encouragement. In addition, BedZED residents all have
access to balcony and rooftop gardens. The difference in food production is stark:
in BedZED "it is clear that the quantity of food grown is not significant and many
of the troughs are empty for much of the year" (Hodge & Haltrecht, 2009, p. 29)
whereas Forres have around 70 gardeners and "have had much fewer drop outs
than the average according to national allotment associations statistics … [and are
constantly] commended on how beautiful the community garden is and what a
friendly and open space it is" (C. Mustard, personal communication, January 6,
2011). The cases are more similar when it comes to choosing local, organic food
through monthly farmers' market (Forres) or weekly on-site vegetable trader and
organic grocery delivery (BedZED). Forres has also worked hard to persuade
many households to make more sustainable food choices through the pledge
system. In Forres the indications are of a vibrant and growing local food culture.

173
In contrast, BedZED seems to have declined since 2003 (Hodge & Haltrecht,
2009, p. 30; P. Plum, personal communication, January 13, 2011). The cases also
followed quite different paths to their outputs.

174
Table 55.
Comparison Of Strategic Actions And Factors For Food Production Indicator
Case Output ΔS Action Contributing to
Indicator Improvement
Strategic Factors
(+ Positive, - Negative)
BedZED COMMUNITY 2 Make it easy to
choose local, low input
food choices (organic
deliveries)
Provide facilities to
grow food in the
community
(Allotments, Private
gardens)
+ Systems approach to design.
+ Appoint sustainability coach
Forres COMMUNITY
GARDEN
4 Provide facilities to
grow food in the
community (allotments)
+ Access to Funding
+ Continue development after
immediate implementation
- Strong partnership with local
Government
+ Variety of tactics to mobilize
participation
FARMERS’
MARKET
3 Bring local
producers into the
community (regular
farmers' market)
+ Mobilizing volunteer
workforce
- Strong partnership with local
Government
+ Using pilots and trials to find
what works best
LOCAL
FOOD GUIDE
0 Improve knowledge
of local food and where
to get it (local food
guide)
+ Access to Funding
- Monitoring & follow up are
needed for evaluation
CARBON
PLEDGE
2 Ask for personal
commitments to make
local, low input food
choices
+ Access to Funding
+ Hiring staff or consultants
+ Integrate projects with
education
+ Mobilizing volunteer
workforce

175
In BedZED gardening and food system interaction were in the most part
developed late in the construction by BioRegional with the exception of
integrated design balcony and rooftop gardens and the built in household bins for
food waste. BioRegional introduced the allotments, community composting,
organic food deliveries and a sustainability coach ("green lifestyle officer") whose
job it was to encourage use of these facilities, provide training and resources.
BioRegional obtained public funding to provide the coach but only for one year.
According to Plum the allotments and composting were not "very well managed"
(P. Plum, personal communication, January 8, 2011). There were good ideas that
BioRegional implemented but despite the effort put in to making it work over the
first year, a local food culture failed to take root.
Forres had not had allotments for more than 40 years or a farmers’ market
for a "very long time" (C. Mustard, personal communication, January 6, 2011) yet
within the space of 3 years it now has both and they are thriving. Three key
strategic factors that made this possible were the well organized management
structure and sharply focused three year plan, substantial funding from the
Scottish government's Climate Challenge Fund, and a very committed volunteer
workforce. As discussed in the results, the management structure, plan and
funding were all co-dependent. While the funding forced the transition team to
commit to a three year plan very early it also proved to be very effective at
keeping the transition on track, but to make this happen required strong
management. The ability to mobilize the volunteer workforce, especially for the
farmers’ market, is in part due to the strong cross community network that exists

176
in Forres but the risk of volunteer burnout is always there (M. Scarlett, personal
communication, January 5, 2011). Both the farmers' market and the community
garden required substantial dealings with a local government that was in most
respects unhelpful and obstructive (M. Scarlett, personal communication, January
5, 2011; C. Mustard, personal communication, January 6, 2011).
So the road to these two products was not easy. Perhaps a key observation
and difference in Forres from BedZED though, is how they have been managed
since the implementation was complete. There was no assumption that they would
simply succeed once they were created. The workgroups that initially developed
the garden and the market have continued to operationally manage them and more
importantly, continue to develop them and build a sub-community around them.
They take on a life of their own. The management of allotments in BedZED was
externally imposed to some extent, by BioRegional and the Green Lifestyle
Officer and the community never fully took up the mantle with the result that
when BioRegional faded out and the funding for the Green Lifestyle Officer
ended, so too did the allotments.
Transition Management Comparison
A comparison of case conformity to transition management principles is
shown in Figure 35. None of the cases strongly match transition management.
BedZED stands out as quite different from Forres and Ashton Hayes, which are
broadly similar. All cases featured strongly in the creation of innovative niches
(creating space for niches and focus of frontrunners), especially BedZED which
was a very strong innovation nucleus during development. They also all show

177
moderate conformance with selective participatory process where BedZED
carefully selected a core group of experts and professionals but was distinctly
lacking in community participation during and after construction, Forres have
strong community participation but lack business, government and higher
education participation, and Ashton Hayes have a well balance group.
Ashton Hayes and Forres both conform to the idea of radical change in
incremental steps where both cases are taking small steps towards their long-term,
radical goals and they both partially conform to guided variation and selection on
the strength of their diverse sets of projects. BedZED, on the other hand, has no
similarity in these criteria, reflecting that it was a single, large construction
project. BedZED also failed to score on empowering niches as the community
there now has very little power whereas Forres has gained some empowerment
and Ashton Hayes substantial empowerment. All cases scored poorly in the
reflexive aspects of transition management (learning-by-doing and doing-by-
learning and anticipation and adaptation). Ashton Hayes and Forres do not use a
systems based approach (multi-level approach, multi-domain approach),
something that BedZED did in the concept development and design.

178
0
1
2
creating space for niches
focus on forerunners
guided variation and selection
radical change in incremental steps …
learning-by-doing and doing-by-learning
multi-level approach, multi-domain …
anticipation and adaptation
empowering niches
Selective participatory process
Normative principles of sustainability
Ashton Hayes
0
1
2
creating space for niches
focus on forerunners
guided variation and selection
radical change in incremental steps …
learning-by-doing and doing-by-learning
multi-level approach, multi-domain …
anticipation and adaptation
empowering niches
Selective participatory process
Normative principles of sustainability
BedZED
0
1
2
creating space for niches
focus on forerunners
guided variation and selection
radical change in incremental steps …
learning-by-doing and doing-by-learning
multi-level approach, multi-domain …
anticipation and adaptation
empowering niches
Selective participatory process
Normative principles of sustainability
Forres

179
Figure 35: Mapping of cases to transition management principles. Conformance
with principle: 0 = none or weak; 1 = partial; 2 = strong.
Appraisal against transformative planning and governance steps is shown
in Table 56. It can be seen quite plainly that there is little conformity between the
cases and the method steps. All cases are highly active in the intervention step but
do little of the other steps.
Table 56.
Comparison of Transformative Planning and Governance Appraisals
AH BZ FO
Visioning 0 0 0
Current State Analysis 0 1 0
Intervention 2 2 2
Evaluation 1 0 0

180
DISCUSSION
Understanding Community Transitions
Has the research led to better understanding of community transitions? As
already stated, much of this thesis has been concerned with the question of how to
do research to better understand community transitions, which is of course, a pre-
requisite of arriving at a better understanding. The insight into community
transitions resulting from the research is therefore weaker than originally hoped
for. Of the three cases studied, BedZED was the odd one out and in many ways
incomparable to Ashton Hayes and Forres as it is a new community created from
scratch as opposed to an existing community trying to change itself. This has
made it more difficult to generalize and find patterns across all cases but on the
other hand it has provided stark contrasts in some areas that are interesting.
Overall Community Transition Results and Transition Theory
One of the research objectives was to be able to make comparative claims
of overall transition successfulness through sustainability appraisal, and use this
to test transition theory. The results at overall transition level however, are not
strong enough to make any claims in this area with confidence. All of the cases
studied have had some success in terms of sustainability gain and given the
differences in context and shortcomings of the sustainability appraisal it cannot be
clearly said that any one has been more successful than the others. Arguably
however, Ashton Hayes and Forres appear to be on a trend that if continued over
the longer term of the next five or ten years would put them ahead of BedZED.
BedZED's lack of a long term development plan meant that the transition stopped

181
in 2003. Tentatively then, the grass roots, community based approach, may be
more effective than top down, management. This suggestion can also be
connected to the transition management appraisal in which Ashton Hayes and
Forres both exhibit some degree of long term focus and taking incremental steps
(towards radical change) whereas BedZED was a short term, abrupt "forcing".
Thus the tentatively more successful transitions have stronger affinity to some
transition management principles, but BedZED is stronger in other principles, at
least during its development phase, such as creating an innovative niche and
rigorous application of sustainability principles. Perhaps some principles are more
important than others.
More generally with respect to overall successfulness and transition
methods, it can be said that none of the cases has strong affinity with theory. Does
this mean that the theory, transition management or transformative planning and
governance, is invalid? This conclusion cannot be made, even if the results
presented were much stronger, because it is not known if the positive transition
trends will continue or if stronger, more rapid, sustainability gain would result
from a theoretically disciplined transition approach. The conclusion that can be
made is that with further improvement to the research framework and method,
especially the sustainability appraisal, and with more cases to compare, there is
good potential for testing transition theory at the community level using this
approach.

182
Insights into Community Transitions
On the evidence of the three cases studied, some insights are now
described. These begin to identify what might be some of the causal variables
relevant to community transitions.
Community Participation and Support –Services or facilities unused
are futile, and tasks are not accomplished if no-one volunteers to do
them. Significant support, even if only passive, legitimizes the
transition's actions. A transition's purpose must be to convince its own
community members to join it. A majority of residents in Ashton
Hayes participate and in the larger community of Forres a significant
number participate, although a relatively small proportion of the
population. Both of these communities have very active transitions.
BedZED has a residents' association that would like to see more
sustainable development of the community but there is no support
from the community. (P. Plum, personal communication, January 13,
2011).
Continuous Mobilization – after completion of a task, it is a mistake to
assume the job is done. It is important to have an ongoing
development program to realize and maintain full potential or at best
the output will stagnate and at worst collapse. The contrasting cases of
BedZED and Forres's allotments and composting illustrate this.
Long Term Development – Somewhat related to continuous
mobilization but at the overall transition level, transition communities

183
need long term goals to guide them. Ashton Hayes and Forres both
have long term goals and are working continuously towards them.
BedZED on the other hand, had a short to medium term plan to
construct a new community but nothing after that. Consequently,
BedZED has not changed since 2003.
Governance – the degree of governance in a community, as opposed to
government or management (Kemp, Parto, & R. B. Gibson, 2005),
may be a factor in its propensity towards taking up the challenge of
transition. Ashton Hayes and BedZED represent two ends of a
governance spectrum in the cases studied here. In Ashton Hayes the
parish council is accessible to residents and public meetings and
ballots are not uncommon. BedZED is under traditional landlord
management.
Funding – is not strictly necessary but is likely to become so at some
point in a transition. Ashton Hayes demonstrates what can be
accomplished on a shoestring budget, mostly from local business
sponsorship. (Their second phase, which followed on from the outputs
included in this study, is substantially funded). Forres however, may
have had to pursue different goals if they had not received funding.
Government funding however, is to some extent a double edged sword
in that it both empowers and constrains.
Partnerships – BedZED and Ashton Hayes both formed strong
partnerships, achieving more together than they could alone.

184
Local Government Support – local governments are important actors
in community transitions because they exert control over so much of a
community's existence. It may also legitimize and lend creditability to
the transition if the local government is behind it. BedZED quite
probably would not have happened without the strong support they
received from Sutton Council. Ashton Hayes has been supported by
Cheshire Council although they could probably have continued
without them. That Forres have accomplished much despite difficulties
with Moray Council, goes to show that local government may be a
hindrance but perseverance can overcome.
Monitoring – it is important to measure the results of transition actions
to determine if they are having the desired effect and to provide
information back to participants. This can be time consuming and
difficult and is often not done. Forres for example, handed out 5,000
shopping bags and 3,000 local food guides but has no data on what the
effect of this has been. Monitoring of carbon footprints has been
important in Ashton Hayes's transition being fed back to residents and
in guiding future action.
Volunteer Workforce – volunteers are the lifeblood of some
community transitions. Maybe even, volunteer workers are a defining
characteristic of community transitions? Two of the three cases studied
depend heavily on volunteers, BedZED being the exception, where
volunteers have played no part.

185
Future Research Directions
This study has only scratched the surface of this research field. There is
much more to be learned from the cases presented here and the other three cases
for which data was collected but is not included in the current analysis. From the
somewhat disorganized insights presented here there is a need to move towards a
more structured model of community transitions identifying causal variables and
mechanisms that lead to successful outcomes. This research has some way to go
to approach this end. To move in this direction however there are some pointers
arising from the three cases looked at here:
One direction of future studies should concentrate on dispersed
transitions that grow through conversion of their host community, such
as Ashton Hayes and Forres. The vast majority of communities already
exist and need to be transitioned "in-situ". BedZED, as a newly
"constructed" community with (100%) concentration and no room for
growth is a special case and does not compare well in many respects
with the other two cases. Focusing on this narrower, but large, subset
will help to build a specific model which can then be generalized with
other types.
Once key causal variables start to be identified, cases can be re-
examined and new cases studied to test the validity of theory.
Follow the long-term progress of selected cases. Studies should not be
isolated snapshots but should be ongoing and revisited to accumulate
more data, to refine data, and to make and test predictions.

186
In conjunction with long-term tracking of cases, communities should
be engaged in the research as valuable sources of "socially robust"
knowledge and as citizen scientists (Gibbons, 1999; Kates et al., 2001)
Choose the starting point of the transition carefully. In the BedZED
case, if the starting point is set to when the residents took occupancy,
then the transition would look very different.
Research Design:
The research here is exploratory. There is a need now to build on it to
address weaknesses and improve its usefulness. Shortcomings of the research
method and likely areas for of improvement described below.
Shortcomings in the Research Method
Community Capacity Building – the research method is based upon
the tangible outputs that the transition directly produces. This excludes
less tangible, softer, outputs such as knowledge and individual and
social capacity that may be directly produced but are often more subtly
and even unwittingly produced by transition activities. These
"intangibles" may contribute to sustainability though in less direct
ways. This is seen for example in Ashton Hayes in particular where
community groups came together to work on the shop projects, or how
the core group of a few "normal" people have developed into national
and international community advisers, national government lobbyists,
City of London deal makers (R. Green, personal communication,
January 8, 2011; M. White, personal communication, January 7,

187
2011). As another example, Forres have held "skillshare" workshops
to increase individuals' capacity for self-sufficiency in areas such as
local food cooking, sewing, or bicycle maintenance. The difficulty is
in detecting the production of these qualities, measuring them and
discerning their effectiveness. (M. Scarlett, personal communication,
January 5, 2011).
Transition Path Dead Ends - Due to the reverse path reconstruction,
dead-ends are ignored. The method essentially dismisses such
activities as irrelevant because they did not directly lead to an output.
This may be true, but there could be important lessons in such dead-
ends.
Indirect Pathways – the production of some outputs may be in part due
to indirect actions. A common example may be Ashton Hayes and
Forres both participate in peer networking with other communities and
are active in visiting and helping other communities. This strengthens
the "movement" of community transitions nationwide and exerts
upward pressure on government and politicians who may respond with
policy incentives. The final closing of this loop is that the incentives
make it easier for transition communities to operate.
Data Collection and Preparation
Interview Questions – Data collection in the current work was
primarily from interviews and document analysis. Interview questions
were designed around transition management principles as this was the

188
research focus at the time the interview was designed. While relevant,
these need to be revised. What are the most suitable questions?
Alternative Data Collection Techniques - Other techniques in addition
to (or instead of) interview should be investigated for collecting the
data such as transition path reconstruction using interactive
storyboarding, perhaps in a group context. This was attempted in the
current research with one individual but proved to be too difficult and
was not repeated.
Analytical Method and Frameworks
Sustainability Indicators – the indicator set developed and used here is
very rough. The aim should be to develop a comprehensive
sustainability indicator set for small, place based communities. This
set should be integrated with the community analytical framework
(Wiek's (2010) Activity – Supply System framework), should take
account of the type of data that is available from these communities,
sufficiency and normative thresholds. Such an indicator set can then
start to allow better cross case comparison of transition
accomplishments and absolute position with regards to a sustainable
state.
Sustainability Appraisal - The appraisal process used here is subjective
and only loosely defined. A comprehensive indicator set integrally
linked to the community analytical framework will provide a stronger
framework within which to define a robust appraisal process. The

189
process needs to be more strongly linked to the descriptive analysis of
transition outputs.
Community Analysis of Transition Outputs – the current use of
community Activity – Supply System framework (Wiek, 2010)
decomposes outputs into activity domain, structural and behavioral
components with cross-cutting value systems (e.g. health,
environmental quality, governance) being packed into an added on
"cross-cutting" domain. It also does not cleanly differentiate supply
systems (e.g. energy, water). More work needs to be done on how to
use this framework more effectively. One concrete issue to be dealt
with is the current tagging of outputs by a separate classification
scheme (technical, regulative, behavioral etc.) that may be better done
using the Activity – Supply System framework.
Process Tracing – the methodology as used in other disciplines needs
to be researched more thoroughly with the objective of improving the
reliability of transition path tracing. The current method is weak in the
way it jumps from path data to important conjunctures and strategic
factors.
Transition Path Analytical Framework – the multiple levels of activity
types and actors used to map specific case chronicle entries to general
framework types needs to be refined. One problem, for example, is
how to deal with multiple tagging of entries. Strategic factors in the
current work lack consistency. A unified, consistent set of strategic

190
factors needs to be added to the framework. The distinction and
relationship between strategic factors and barriers needs to be clearly
defined.
Transition Path Charting – Evaluation of the usefulness of charts
produced is needed. Identification of patterns in charts such as
different forms of path (e.g. linear, radiating, braided etc.) may be a
useful feature to further develop if such patterns appear to have any
relationship to general process characteristics or outcomes.
Templates & Tools
Database Tool – A database tool to assist in chronicling and some
parts the analysis is needed to reduce researcher time. This would also
support sharing of data between researchers.
Process Charting – intermediate Gantt style charts were used to
construct time-based representations of transition paths using
Microsoft Excel. The use of standard project management software
should be explored for this task.
Method Templates – The case study process is repeated for each case.
A standard template for intermediate and final work products would
improve researcher productivity and cross researcher consistency.
Application of the Research
Ultimately, the aim of this research is to apply it in real community
transitions. Sustainability research should not stop at analyzing or theorizing but
should include operationalizing and applying: "scientific exploration, and

191
practical application must occur simultaneously. They tend to influence and
become entangled with each other" (Kates et al., 2001). The current research has
not advanced enough to produced recommendations of action for other
communities but Table 57 provides a tentative illustration of one form that this
might take.
The tentatively suggested actions in Table 57 relate to the transition
process, and how conditions that may be needed for successful transition can be
created. There is also a need however to identify transition substance: what
outputs should transitions produce? The current research has not formed
conclusions on this. Some questions that need to be answered to operationalize
findings are listed below.
What transition outputs should a community transition produce?
Should different outputs be produced at different stages of transition?
Which community characteristics influence the choice of output to be
produced?
What steps need to be taken to produce specific outputs?
How should outputs be monitored?

192
Table 57.
Illustrative Actions to Influence Transition Variables
Transition Variable Action to Influence Variable Examples from cases
Community
Participation and
Support
Awareness raising activities Forres shopping bags
Networking with other
community groups
Informal Educational events (e.g.
film nights, guest speakers)
Forres regular film nights
K-12 education programs,
integrated with action projects
Forres carbon challenge
program
Continuous
Mobilization
Appoint sustainability coaches BedZED green lifestyle
officer
Delegate ongoing responsibility
to community workgroups
Forres community garden
'sub-community'
Long Term
Development
Publicize long term goals Ashton Hayes 'Going
Carbon Neutral'
Create a strategic plan Forres three year plan has
long term strategy
Create a Vision
Governance Cooperate and work with
existing structure
Ashton Hayes with parish
council
Acquire community assets Forres community garden,
farmers' market
Funding Enlist the help of a community
grant writer
Network with other community
groups and other transition
communities for leads and advice
Approach businesses for
sponsorship (develop a proposal)
BedZED: BioRegional
proposal to find a developer.
Direct fundraising
Develop revenue raising
transition outputs

193
Transition Variable Action to Influence Variable Examples from cases
Resources Look for business sponsorship Ashton Hayes receive help
from various small
businesses
Draw on skills and resources of
community members
Ashton Hayes receive
regular help from marketing
consultants and film maker
Partnerships Develop early in the transition
around strategic plan
Ashton Hayes had
commitments from Chester
University and Cheshire
Council within first few
months
Network to look for good
partnering opportunities
BedZED, BioRegional
partnering with Sutton
Council and Peabody;
Creative 'social' entrepreneurship Ashton Hayes tree
plantations
Local Government
Support
Invite to be a part of the
organization (e.g. board member)
Forres now have a local
councilor on the board.
Invite to be a part of public
events
Ashton Hayes had Cheshire
Council present at launch.
Lobby local politicians for active
support
Ashton Hayes have support
of local councilor;
Monitoring Regular monitoring of key
system performance indicators
BedZED perform irregular
adhoc studies
Design follow up monitoring of
all outputs
Engage local university for help
offering them service learning
opportunities
Ashton Hayes partner with
University of Chester
Volunteer Workforce Develop a recruiting network
Good organization makes it
easier to accommodate new and
casual volunteers
Forres hub organization
Don't overwhelm new volunteers Forres tactics

194
CONCLUSION
This thesis advances the state of research into the phenomenon of small,
place based communities engaged in sustainable transition, focusing in particular
on understanding the process of transformation. It does this in two ways: (1) the
design of an analytical framework and method for investigating the process of
community transitions; and (2) use of the framework and method to investigate
three community transitions. The main contribution of the work is the provision
of a generalized approach by which future research can be standardized and
synthesized to create theoretical and practical knowledge of community
transitions.
The research design is based on a multiple case study methodology (Yin,
2003) where cases are selected, single case studies are conducted and analyzed,
cases are compared, and conclusions made. This work is new in the analysis of
the step where single case data is analyzed in two parallel tracks: (1) what outputs
did the community transition produce and what impact did they have on the
community and its sustainability; and (2) what was the process that the
community transition followed to produce the outputs. The tracks are recombined
to identify the most effective strategies and outputs. Analysis of outputs is based
on Wiek's (2010) community activity – supply system analytical framework and
appraisal of change in sustainability using Gibson's (2006) sustainability
assessment criteria. Analysis of output process is based on process tracing
(Bennett & George, 1997) and uses a newly created transition path analytical
framework.

195
The research method was iteratively developed while conducting and
analyzing real case studies. The cases, all in the U.K. are: (1) Ashton Hayes, a
rural village with a plan to go "carbon neutral"; (2) BedZED, a low ecological
footprint urban housing development; and (3) Forres, a small town and Transition
Town member. All three cases were found to have increased their sustainability in
a variety of ways through different approaches. Ashton Hayes and Forres, through
grass roots community participation, achieved sustainability gain through
behaviorally driven reductions in household carbon emissions and development of
community assets such as community shop, allotments and farmers' market. In
contrast, BedZED was a highly innovative, top-down, professionally managed
technical project performed by a coalition of private and non-profit organizations.
BedZED achieved sustainability gain through intrinsically low carbon emission
and water use building and site design and provision of social housing.
Following limited synthesis of case results some preliminary insights are
made into what are important aspects of community transitions. These include:
community participation and support; continued mobilization following
implementation of outputs; a focus on long term goals; the degree of community
governance; the need for funding; building strategic partnerships; local
government support; monitoring of impacts; and dependency on volunteer
workforce. Tentative suggestions on how communities might influence these
variables are suggested. Cases were found to have weak affinity with transition
management and transformative planning and governance theory but this cannot
be correlated with transition successfulness on the strength of current results

196
although such an approach looks to be very promising with more robust
sustainability appraisal and the analysis of more cases.
The research method presented here has potential for building robust
theories of community transition and developing specific guidelines for applying
created knowledge in the field. The ultimate goal to which this research leads is
widespread practices of evidence based transitions. The work is still at an early
stage. Numerous lines of further research are suggested.

197
REFERENCES
Alexander, R., Hope, M., & Degg, M. (2007). Mainstreaming Sustainable
Development-A Case Study: Ashton Hayes is going Carbon Neutral.
Local Economy, 22(1), 62-74. doi:10.1080/02690940701195123
Alexander, R., Hunt, T., Hall, A., Davey, C., Brain, J., Lepper, J., Jones, L., et al.
(2010). Ashton Hayes Going Carbon Neutral 2010 Survey. University of
Chester. Retrieved from http://www.goingcarbonneutral.co.uk/village-
footprint-survey-2010/
Anderson, R. (2007, June 2). My village is going carbon-neutral. The Guardian.
Retrieved from
http://www.guardian.co.uk/environment/2007/jun/02/ethicalliving.lifeandh
ealth
Arnstein, S. (1969). A Ladder Of Citizen Participation. Journal of the American
Planning Association, 35(4), 216-224. doi:10.1080/01944366908977225
Ashton Hayes Parish Plan 2009. (2009). . Ashton Hayes: Ashton Hayes Parish
Council. Retrieved from http://www.ashtonhayespc.co.uk/reports/parish-
plan-reports-2009/
Bailey, N. (2010). Building sustainable communities from the grass roots: How
community land trusts can create social sustainability. In T. Manzi, K.
Lucas, T. L. Jones, & J. Allen (Eds.), Social Sustainability in Urban
Areas: "Communities, Connectivity and the Urban Fabric" (pp. 49-64).
EarthScan.
Baty, A. (2010). The process of sustainability transformations in cities (Master’s
thesis). Arizona State University, Phoenix, Arizona.
BedZED. (n.d.). BioRegional: solutions for sustainability. Retrieved June 20,
2011, from http://www.bioregional.com/what-we-do/our-work/bedzed/
Bennett, A., & George, A. (1997). Process Tracing in Case Study Research.
working paper, MacArthur Foundation Workshop on Case Study Method.
Retrieved from
http://users.polisci.wisc.edu/kritzer/teaching/ps816/ProcessTracing.htm
Brangwyn, B., & Hopkins, R. (2009). Transition Initiatives Primer. Retrieved
from http://transitiontowns.
org/TransitionNetwork/TransitionCommunities, 27.
BRESCU. (2002). Bedington Zero Energy Development, Sutton ( No. 89).
General Information Report (p. 36). Building Research Energy
Conservation Support Unit. Retrieved from

198
http://www.bioregional.com/files/publications/BedZEDBestPracticeRepor
t_Mar02.pdf
Bryden, J., & Geisler, C. (2007). Community-based land reform: Lessons from
Scotland. Land Use Policy, 24(1), 24-34. doi:16/j.landusepol.2005.09.004
Carbon Cutting Challenge Report, October - December 2010. (2011). . Transition
Town Forres.
Chance, T. (2009). Towards sustainable residential communities; the Beddington
Zero Energy Development (BedZED) and beyond. Environment and
Urbanization, 21(2), 527-544. doi:10.1177/0956247809339007
Charnock, G. (2007). Grass Roots Village Action Inspires other Communities to
Take on the Challenge of Climate Change. Local Economy, 22(1), 75-79.
doi:10.1080/02690940601121294
Dawson, J. (2006). Ecovillages: New Frontiers for Sustainability. Schumacher
briefing. Totnes: Green Books.
Department for Transport. (2004). Making Car Sharing and Car Clubs Work:
Case Study Summaries (p. 140). U.K. Department for Transport. Retrieved
from
http://webarchive.nationalarchives.gov.uk/+/http://www.dft.gov.uk/pgr/su
stainable/cars/ingcarsharingandcarclubsw616.pdf
Desai, P. (2008). Creating Low Carbon Communities: One Planet Living
Solutions. Globalizations, 5(1), 67-71. doi:10.1080/14747730701587462
Edwards, G. J. (2007). Ashton Hayes Going Carbon Neutral: Motivators and
barriers to successful public participation in community-based carbon
reduction programmes. De Montfort University, Leicester.
Falleti, T. G. (2006). Theory-Guided Process-Tracing in Comparative Politics:
Something Old, Something New. Newsletter of the Organized Section in
Comparative Politics of the American Political Science Association, 17(1).
Retrieved from http://www.polisci.upenn.edu/~falleti/Falleti-CP-
APSANewsletter06-TGPT.pdf
Geels, F. W., & Schot, J. (2010). The dynamics of transitions. A scoio-technical
perspective. Transitions to Sustainable Development: New Directions in
the Study of Long Term Transformative Change (1st ed., pp. 9-101). New
York: Routledge.
Gibbons, M. (1999). Science’s new social contract with society. NATURE-
LONDON-, 81–85.
199
Gibson, R. (2006). Sustainability assessment. Impact Assessment and Project
Appraisal, 24(3), 170.
Grin, J., Rotmans, J., & Schot, J. (2010). Transitions to Sustainable Development:
New Directions in the Study of Long Term Transformative Change (1st
ed.). New York: Routledge.
Hodge, J., & Haltrecht, J. (2009). BedZED seven years on (p. 44). Wallington,
U.K.: BioRegional Development Group. Retrieved from
http://www.oneplanetcommunities.org/wp-
content/uploads/2010/03/BedZED-seven-years-on-low-res-final.pdf
Kates, R. W., Clark, W. C., Corell, R., Hall, J. M., Jaeger, C. C., Lowe, I.,
McCarthy, J. J., et al. (2001). Sustainability science. Science, 292(5517),
641.
Kemp, R., Parto, S., & Gibson, R. B. (2005). Governance for sustainable
development: moving from theory to practice. International Journal of
Sustainable Development, 8(1), 12–30.
Lazarus, N. (2003). BedZED: Toolkit Part II. A practical guide to producing
affordable carbon neutral developments (p. 52). Wallington, U.K.:
BioRegional Development Group. Retrieved from
http://www.bioregional.com/files/publications/BedZED_toolkit_part_2.pd
f
Loorbach, D. (2007). Transition Management: New Mode of Governance for
Sustainable Development. International Books.
Lovell, H. (2008). Discourse and innovation journeys: the case of low energy
housing in the UK. Technology Analysis & Strategic Management, 20(5),
613-632. doi:10.1080/09537320802292883
Macalister, T. (2011, March 18). UK government unveils plans to slash solar
feed-in tariffs | Environment | guardian.co.uk. The Guardian. Retrieved
from http://www.guardian.co.uk/environment/2011/mar/18/slash-feed-in-
tariffs
Machler, L. (2010). Sustainable Access Visioning in a Central Phoenix
Neighborhood (Master’s thesis). Arizona State University, Phoenix,
Arizona.
Mackenzie, F., MacAskill, J., Munro, G., & Seki, E. (2004). Contesting land,
creating community, in the Highlands and Islands, Scotland. Scottish
Geographical Journal, 120(3), 159–180.

200
McIntosh, A. (2008). Rekindling Community: Connecting People, Environment
and Spirituality (1st ed.). Green Books.
Middlemiss, L. (2008). Influencing individual sustainability: a review of the
evidence on the role of community-based organisations. International
Journal of Environment and Sustainable Development, 7(1), 78–93.
Miles, M. (2008). Urban Utopias: The Built and Social Architectures of
Alternative Settlements. London: Routledge.
Minton, A. (2001, September 19). Rising Sun. The Guardian. Retrieved from
http://www.guardian.co.uk/society/2001/sep/19/urbandesign.ethicalshoppi
ng
Piper, C., & Villani, F. (2009). Transition Town Forres Development Plan 2009 -
2012. Forres: Transition Town Forres. Retrieved from
http://www.ttforres.org/images/stories/pdf/DevPlan0907.pdf
Putnam, R. D. (2001). Bowling Alone: The Collapse and Revival of American
Community (1st ed.). New York: Simon & Schuster.
ROOF. (2007, March 1). Carbon Copy. ROOF. Trade Magazine, . Retrieved June
10, 2011, from http://www.roofmagazine.org.uk/features/carbon_copy/
Rotmans, J., & Loorbach, D. (2010). Towards a better understanding of
transitions and their governance. A systemic and reflexive approach.
Transitions to Sustainable Development: New Directions in the Study of
Long Term Transformative Change (1st ed., pp. 103-220). New York:
Routledge.
Schapiro, J. S. (1962). Movements of Social Dissent in Modern Europe. Princeton,
N.J: Van Nostrand.
van Schyndel Kasper, D. (2008). Redefining community in the Ecovillage.
Human Ecology Review, 15(1), 13.
Seyfang, G., & Smith, A. (2007). Grassroots innovations for sustainable
development: Towards a new research and policy agenda. Environmental
Politics, 16(4), 584-603. doi:10.1080/09644010701419121
Slavin, T. (2006, May 16). Living in a dream. The Guardian. Newspaper, .
Retrieved April 24, 2011, from
http://www.guardian.co.uk/environment/2006/may/17/energy.communitie
s
Theodori, G. L. (2005). Community and Community Development in Resource-
Based Areas: Operational Definitions Rooted in an Interactional

201
Perspective. Society & Natural Resources, 18(7), 661-669.
doi:10.1080/08941920590959640
Transition Town Forres Final CCF Report 2008-11. (2011). . Forres: Transition
Town Forres.
Warburton, D. (1998). A passionate dialogue: Community and sustainable
development. In D. Warburton (Ed.), Community and Sustainable
Development: Participation in the Future (pp. 1-39). London: Earthscan
Publications.
Weaver, M. (2002, June 19). Designs for living. The Guardian. Retrieved from
http://www.guardian.co.uk/society/2002/jun/19/urbandesign.architecture
Wiek, A. (2010). Transformative planning and governance for sustainability.
Working Paper. School of Sustainability, Arizona State University.
Wiek, A., Kay, B., Boone, C., & Ledlow, S. (2010). Community Focused
Sustainability Assessment and Visioning of Light Rail Corridor Segments
in Phoenix: Case Study Guide. Arizona State University, School of
Sustainability.
Wightman, A., & Perman, J. (2005). Common good land in Scotland: a review
and critique. Caledonia Centre for Social Development. Retrieved from
http://www.scottishcommons.org/docs/commongood_v3.pdf
Yin, R. K. (2003). Case Study Research: Design and Methods. Applied social
research methods series (3rd ed.). Thousand Oaks, Calif: Sage
Publications.

202
APPENDIX A
COMMUNITY BASED SUSTAINABILITY ORIENTED TRANSITION
GROUPS

203
Table 1.
Community Based Sustainability Oriented Transition Groups
Name Community Description Movement / Group Distribution /
Founded
Eco-
Village
(EV)
An intentional community
brought together by the
desire to live sustainably.
Communities hold in
common social-economic,
cultural-spiritual, and
ecological principles but may
emphasize them differently.
Global Eco-Village
Network (GEN). Aim is
to "support and encourage
the evolution of
sustainable settlements
across the world"
Global. 1995 from the
uniting of several
established ecological
communities.
517 total, many have
pop<10 or not
formed.
Trans-
ition
Town
(TT)
A community initiative to
transition existing settlements
to a more resilient, local
economy in response to the
threats of peak oil and
climate change.
Transition Network..
Guiding and coordinating
organization, develops the
transition model and
provides support and
resources to initiatives, as
well as national – global
leadership.
Global. 2005.
316 official, 53% in
UK, 40% in US, Aus,
Can, NZ
Comm-
unity
Land
Trus
(CLT)t
Land held in trust by a
democratically governed
non-profit organization for
the benefit of the local
community. The main
objective is usually
affordable housing but is
often accompanied by
economic and environmental
objectives.
National Community
Land Trust Network.
Provides support and
resources to CLT
initiatives. Coordinates
development of the CLT
model among interested
parties.
U.S., U.K. Modern
movement began in
1970s in U.S.
Network formed in
2006.
237 U.S. National
CLT members

204
Co-
housing
(CH)
A housing development
consisting of private dwelling
units and community owned
facilities, providing a balance
between privacy and
community. The emphasis is
on creation of a strong social
environment though greater
sustainability is often a
secondary consideration.
True cohousing should be
initiated and designed by the
future residents but this may
be taken on by a private
developer. Managed through
consensus decision making.
Cohousing Association
(U.S). Donor supported
organization that raises
awareness of cohousing,
coordinates nationwide
cohousing activities, and
provides support and
resources to individual
initiatives.
U.S. CoHo/US
formed 2003 from
The Cohousing
Network, formed
1997,
240 total, 100
comple-ted
Planned
Comm-
unity
(PC)
An architecturally designed
development aimed at
creating a strong sense of
community and lowered
environmental footprint. May
be integrated with
commercial and transport
aspects of urban planning.
e.g. New Urbanism or
Zero Energy Develop-
ment. Architectural
practices that set new
‘standards’ for socially
oriented urban design and
green building, now also
integrating agrarianism.
Zero
Foot-
"Villages Without Borders"
project – communities
connected worldwide by
internet, sharing cultures and
comparing carbon footprints.
Share experiences and
knowledge and how to adapt
to climate change.
VWB – Villages Without
Borders. Aiming for 5,000
villages
Global, initially
England + Canada

205
APPENDIX B
INTERVIEW QUESTIONS

206
1. How did the initiative begin?
2. How did you get involved?
3. Why is a transition needed?
4. Did you identify and agree on specific problems in the community and
their priority?
5. Was there a common, guiding vision developed
6. Did you identify specific goals that would help get you closer to the
vision?
7. Was there a core group of participants?
8. How were core group members selected and why?
9. What skills / knowledge / resources did they bring?
10. Did you identify ways of achieving goals, like specific objectives and
concrete actions?
11. What did you try that was new or different in the community?
12. Where did you get ideas for action from?
13. Did you run pilots of ideas? Did you deliberately try things out to find out
more?
14. What stages did the process go through?
15. Within each stage, what were the obectives, what were the main activities,
what were the main products, who were the main participants, what did
you achieve?
16. Within each stage, did it go as planned? If not why? Can you identify
specific problems and what you did about them? Can you identify
anything that was especially important in achieving your objectives?
17. Did you change the vision or goals as you went along? How did this
happen?
18. Did you regularly follow up on how actions were working?
19. Were goals pursued independently?
20. Who was responsible for pursuing goals? How much flexibilitiy did they
have?
21. What was the level of a) awareness, b) interest / support, c) involvement
(active support), d) participation, in the transition across the community?
22. What other groups did you form links with and what was the nature of the
links?
23. What groups were actively involved (e.g. church, schools, community
groups, businesses, colleges, local government) in the core group or
working groups?
24. Which individuals were especially important? What role did they play,
why was it so important?

207
25. How did you make decisions?
26. What resources did you use to help with the process or with
implementation and where did they come from? E.g. financial, material
goods, labor, skills & knowledge, networks, community, natural?
27. What contact with local government was there? Were they sympathetic /
supportive? What concrete support in the form of resources did they
provide?

208
APPENDIX C
SUSTAINABILITY INDICATOR DESCRIPTIONS

209
Access to basic services & amenities
Equitable access to basic services and amenities are fundamental to
sustainability. Aside from basic needs such as such as clean air, water, food and
shelter, this indicator is aimed at services and amenities such as daily groceries
and household needs, health service, education, green space and information.
Inter & Intra-generational equity –the provision of basic services and
amenities in the community at fair cost and equal terms improves well-
being and general welfare of all community members.
Biodiversity
This is a very broad indicator that essentially encompasses the quality of
the natural environment, directly related to its ability to support biodiversity and
other ecosystem services.
Socio-ecological Integrity – this is one of the few indicators that might
positively increase this criteria as opposed to reducing negative
impact.
Car Dependency
The degree to which community members' well-being and general welfare
depend upon having access to and using a car.
Inter & Intra-generational equity - Access to a wide range of
affordable transport options and proximity to common destinations
reduce the need to own a car and especially benefit low income
households.

210
Precaution & Adaptation - Access to a wide range of affordable
transport options and proximity to common destinations lower
vulnerability to fuel supply and price.
Community Assets
The meaning of asset here is not the usual strictly economic / legal term of
property of economic value, but is more generally, anything that is useful or of
value to the community.
Socio-ecological Civility & Democratic Governance – Community
control of assets increases the community’s possibilities to use
resources in ways that provide optimal benefits to the community. It
reduces dependence on centralized systems of governance and
production where interests are rarely well tuned to those of individual
communities.
Employment
This indicator refers to direct job creation in the community. This includes
employment created as a direct result of transition outputs such as a community
shop output creating jobs for a manager and a worked. It may also include
employment created as part of the transition process, as long as it is within the
community and under the direct management of the transition. So for example,
hiring a local administrative worker to help with project administration would
count, but hiring an outside contractor to install house insulation would not. The
latter however, might be judged to help the local economy. There is a grey area in
this distinction but it is necessary to draw a line somewhere.

211
Livelihood Sufficiency & Opportunity – Creates or supports jobs for
for community members.
Energy use & CO2 emissions
Socio-ecological Integrity – Fossil fuel extraction and combustion
have damaging upstream and downstream socio-environmental
impacts.
Resource Maintenance & Efficiency – Using less energy conserves
limited resources of energy.
Precaution & Adaptation - Lower dependencies on resource inputs
make households less vulnerable to supply interruption and price
increase.
Food Production
This indicator takes in both commercial in the bioregion and personal /
community food production in the community. For commercial local food
production this indicator is closely related to the Local Economy indicator that
takes in economic aspects of local food system, from production, processing,
distribution & retailing, plus services. It is assumed that local consumption is a
major component of a ‘strong’ local food system, i.e. the food is not primarily
produced for export. Food production by individuals or small groups for private
consumption. Production may take place on private land (e,g, their own
household) or communal areas (e.g. allotments). In addition to the criteria noted
below community gardens / allotments may also contribute to the Community
Asset Indicator.

212
Socio-ecological Integrity - Reduces upstream and downstream
impacts associated with ‘food miles’ fossil fuel use. However,
depending on the production methods used it may increase impacts in
other ways.
Inter & Intra-generational equity – Privately grown food provides
access to fresh, nutritious food at low cost.
Resource Maintenance & Efficiency – Low input production methods
conserve non-renewable raw material (hydrocarbons, phosphorous
etc.). Increased demand for local food may result in expansion of
farmland.
Precaution & Adaptation - Reduces local vulnerability to interruption
of food supplies due to resource shortage and price.
Livelihood Sufficiency & Opportunity – Creates jobs and opportunities
within the food sector of the local economy.
Health & Wellbeing
Intra-generational equity – Access to sports and recreational facilities,
to open space and natural environment, clean air, away from smells
and noise.
Local Economy
The local economy in most cases expands beyond the community and
benefits to the community are less direct than the Employment indicator that deals
with direct community job creation.

213
Inter & Intra-generational equity – Support for local business and
people in the form of physical and financial resources, skills training
and networks lowers the barriers to start and grow a business and
increases workforce capabilities.
Livelihood Sufficiency & Opportunity – A strong local economy
creates jobs and economic opportunities within the community.
Precaution & Adaptation – A strong local economy produces many of
the basic goods and services needed by the local population and
reduces vulnerability to interruptions to supply and dependency on
centralized systems of production.
Low Impact Consumerism
Consuming less and choosing ethically and environmentally responsible
produced goods. Disposable products such as bottled water and plastic shopping
bags are more than just waste production: they typify a culture that is not
sustainable. Demand for consumer products (e.g. clothes, electronics, furniture,
appliances) has huge global social and environmental impacts. This indicator is
related Waste Production, being more of the upstream behavioral driver than the
'end of pipe’ flow rate.
Socio-ecological Integrity – Reduces upstream impacts caused by
consumer goods manufacturing and distribution. Locally, disposable
products foul the landscape through littering and can be directly
damaging to wildlife.

214
Inter & Intra-generational equity – improves labor rights and
conditions for consumer goods workers.
Precaution & Adaptation - We don't know the long term impact of
plastic in the environment.
Socio-ecological civility & Democratic Governance – The throw-away
society is the very antithesis of how responsible, sustainable citizens
should behave in most perspectives on sustainability.
Participatory Governance
To what extent and to what level is the community engaged in its own
governance. Is there an organizational structure and process supporting
democratic, participation in governance? Do the people use it? Is it effective?
How much control does it provide? This indicator is closely related to Arnstein’s
(Arnstein, 1969) ladder of participation.
Socio-ecological civility & Democratic Governance – increases the
democratic governance part of this criterion but not necessarily the
socio-ecological civility. However, when communities have access to
participate in effective governance it is much more likely that issues
such as social and environmental responsibility become a part of the
community’s values.
Social Cohesion
How strong is the community? What is the degree of "solidarity, trust and
association" among the community, factors that when low are "likely to have

215
lower levels of well-being and general welfare" (Bryden & Geisler, 2007). Social
cohesion
Intra-Generational Equity - Social cohesion provides greater well-
being and general welfare in the community.
Socio-ecological civility & Democratic Governance – While social
cohesion may develop in a direction that increases sustainable values
and behavior it does not always do so. However, without it, the
likelihood of sustainable values and behavior is much lower.
Social Housing Provision
The degree to which the community provides for the housing needs of low
income and special needs members.
Inter & Intra-generational equity – Ensuring access to secure tenure,
high quality, affordable housing to lower income families meets a
basic need and a significant social problem in many communities,
urban and rural.
Sustainable Wood Fuel Resource
Communities may have possibilities for developing woodland as a
sustainable source of fuel, in addition to other ecosystem services benefits it can
provide. Ecological aspects of the resource (e.g. biodiversity) and social aspects
(e.g. as a leisure resource) are covered by other indicators.
Resource Maintenance & Efficiency - a local renewable fuel resource
increases the community's potential for energy self sufficiency.

216
Precaution & Adaptation - a local renewable fuel resource provides
resilience to future energy supply disruption.
Utility Bills
Not considered here is that money saved will more often than not be spent
on something else that will have an impact in other indicators that might exceed
the original impacts.
Inter & Intra-generational equity - Lower utility bills and other basic
household overhead expenses benefit everyone but are progressively
beneficial to lower income households.
Waste Production
In many ways this is the downstream counterpart of Low Impact
Consumerism indicator. It includes consideration of how much waste the
community send to landfill and how much is recycled and composted.
Socio-ecological Integrity - Reduces upstream impacts associated with
raw material production and downstream impacts of waste
management and land-filling.
Resource Maintenance & Efficiency - Reduced waste and increased
recycling conserves limited resources of raw materials and landfill.
Reduced waste and increased recycling increases resource efficiency
of primary industrial production processes.

217
Water Supply & Waste Water Treatment
Socio-ecological Integrity - Reduces upstream and downstream socio-
environmental impacts associated with water supply and waste water
treatment.
Resource Maintenance & Efficiency - Conserves limited resources of
water.
Precaution & Adaptation - Lower dependencies on resource inputs
make households less vulnerable to supply interruption and price
increase.

218
APPENDIX D
SUSTAINABILITYAPPRAISALS

219
Ashton Hayes
Table 2.
HOUSEHOLD ENERGY USE Sustainability Appraisal
Domain SE
I
LS
&O
INT
RA
-GE
RM
&E
SE
C&
DG
P&
A
TO
TA
L
Working • Energy use & CO2 emissions
2 2 4
Housing • Energy use & CO2 emissions
2 2 2 6
• Water use & waste water treatment
0 0 0
• Utility Bills
1 1
Mobility • Energy use & CO2 emissions
0
Eating 0
Educating 0
Recreating 0
Communicating • Social Cohesion 1 1 2
Shopping 0
Cross-Cutting • Participatory Governance 1 1
Total 4 0 2 4 2 2 14
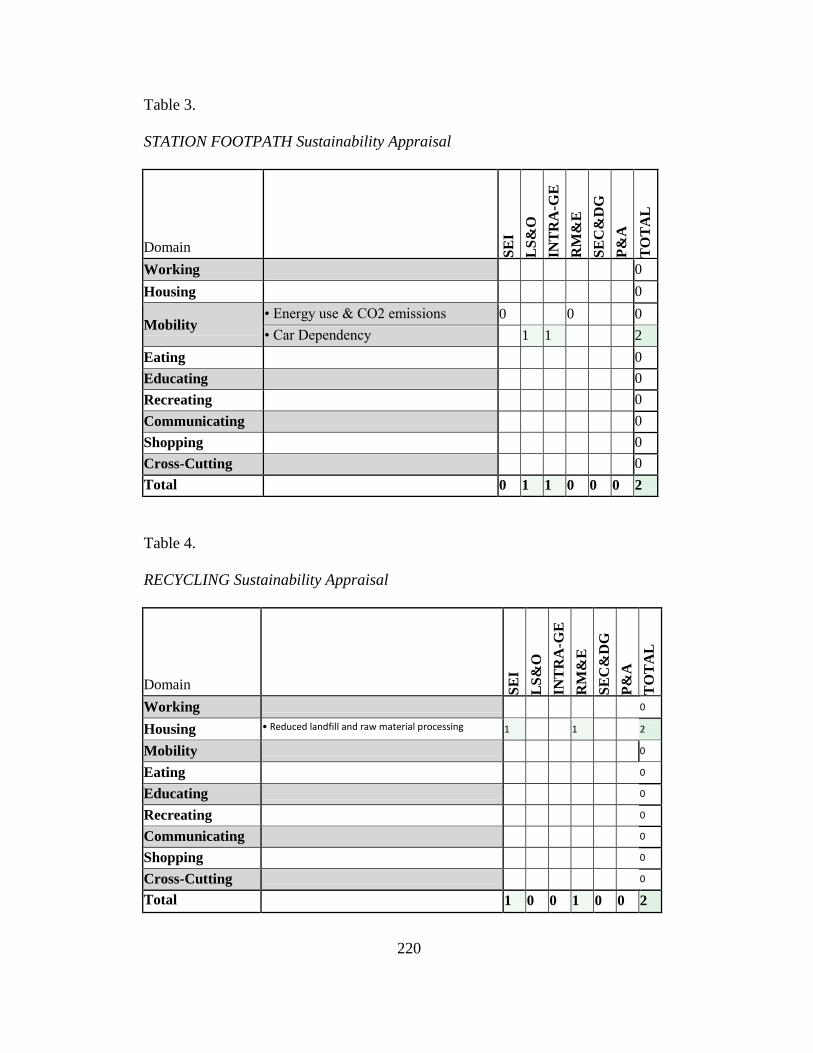
220
Table 3.
STATION FOOTPATH Sustainability Appraisal
Domain SE
I
LS
&O
INT
RA
-GE
RM
&E
SE
C&
DG
P&
A
TO
TA
L
Working 0
Housing 0
Mobility • Energy use & CO2 emissions 0 0 0
• Car Dependency 1 1 2
Eating 0
Educating 0
Recreating 0
Communicating 0
Shopping 0
Cross-Cutting 0
Total 0 1 1 0 0 0 2
Table 4.
RECYCLING Sustainability Appraisal
Domain SE
I
LS
&O
INT
RA
-GE
RM
&E
SE
C&
DG
P&
A
TO
TA
L
Working 0
Housing • Reduced landfill and raw material processing 1 1 2
Mobility 0
Eating 0
Educating 0
Recreating 0
Communicating 0
Shopping 0
Cross-Cutting 0
Total 1 0 0 1 0 0 2

221
Table 5.
TREE PLANTING Sustainability Appraisal
Domain SE
I
LS
&O
INT
RA
-GE
RM
&E
SE
C&
DG
P&
A
TO
TA
L
Working 0
Housing 0
Mobility 0
Eating 0
Educating 0
Recreating 0
Communicating 0
Shopping 0
• Local biodiversity 1 1
Cross-Cutting • Sustainable Wood Fuel Resource 1 1 2
Total 1 0 0 1 0 1 3

222
Table 6.
COMMUNITY SHOP Sustainability Appraisal
Domain SE
I
LS
&O
INT
RA
-GE
RM
&E
SE
C&
DG
P&
A
TO
TA
L
Working • Employment 1 1
• Local Economy 1 1
Housing 0
Mobility • Energy use & CO2 emissions 0 0 0 0
• Car Dependency 1 1
Eating 0
Educating 0
Recreating 0
Communicating • Social Cohesion 1 1
Shopping • Access to basic services & amenities 1 1
• Community Assets 1 1
Cross-Cutting 0
Total 0 2 2 0 2 0 6

223
BedZED
Table 7.
LOW ENERGY HOUSING Sustainability Appraisal
Domain SE
I
LS
&O
I&IG
E
RM
&E
SE
C&
DG
P&
A
TO
TA
L
Working • Energy use & CO2 emissions 1 1 1 3
Housing • Energy use & CO2 emissions 3 3 3 9
• Utility Bills 3 3
Mobility 0
Eating 0
Educating 0
Recreating 0
Communicating 0
Shopping 0
Cross-Cutting 0
Total 4 0 3 4 0 4 15
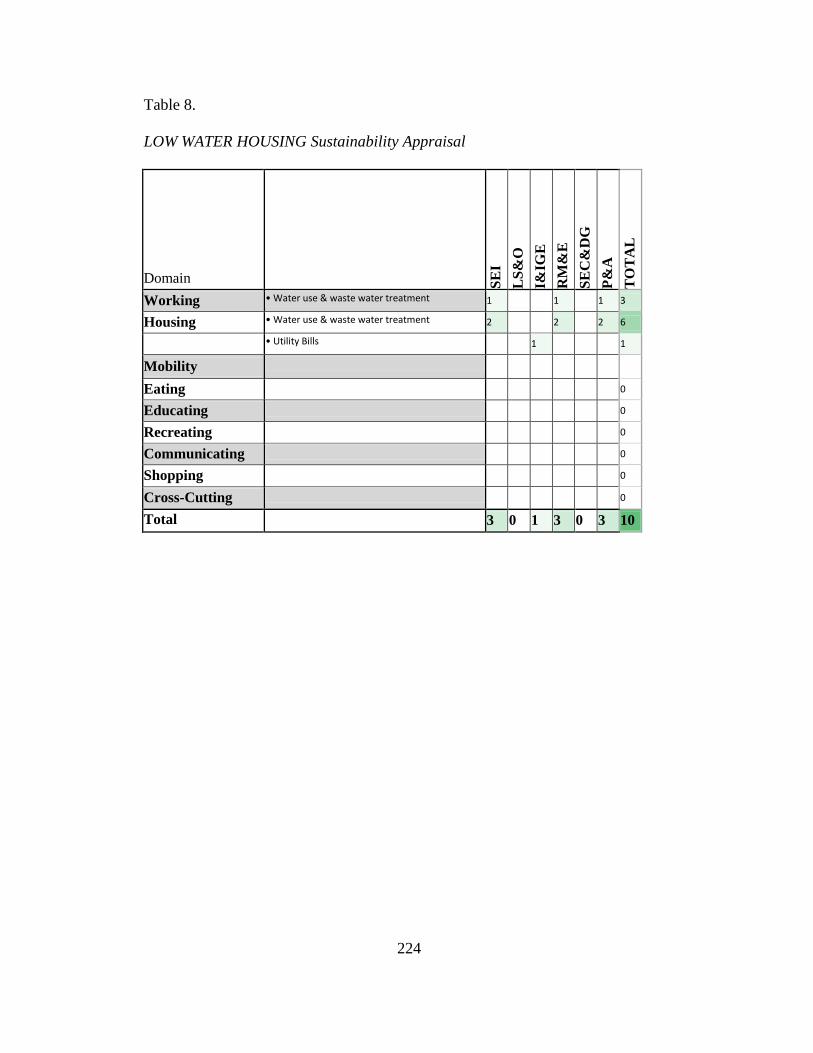
224
Table 8.
LOW WATER HOUSING Sustainability Appraisal
Domain SE
I
LS
&O
I&IG
E
RM
&E
SE
C&
DG
P&
A
TO
TA
L
Working • Water use & waste water treatment 1 1 1 3
Housing • Water use & waste water treatment 2 2 2 6
• Utility Bills 1 1
Mobility
Eating 0
Educating 0
Recreating 0
Communicating 0
Shopping 0
Cross-Cutting 0
Total 3 0 1 3 0 3 10

225
Table 9.
COMMUNITY Sustainability Appraisal
Domain SE
I
LS
&O
I&IG
E
RM
&E
SE
C&
DG
P&
A
TO
TA
L
Working • Employment 0 0
Housing • Waste Production 1 1 2
• Social Housing Provison 3 3
Mobility • Energy use & CO2 emissions 0 0 0
• Car Dependency 2 2 1 5
Eating • Food production 1 0 1 0 2
Educating 0
Recreating • Health & wellbeing 1 1
Communicating • Social cohesion 1 1
Shopping 0
Cross-Cutting 0
Total 2 2 7 2 0 1 14

226
Table 10.
GWTP Sustainability Appraisal
Domain SE
I
LS
&O
I&IG
E
RM
&E
SE
C&
DG
P&
A
TO
TA
L
Working 0
Housing • Water use & waste water treatment -1 -1 -1 -3
Mobility 0
Eating 0
Educating 0
Recreating 0
Communicating 0
Shopping 0
Cross-Cutting 0
Total -1 0 0 -1 0 -1 -3

227
Table 11.
CHP Sustainability Appraisal
Domain SE
I
LS
&O
I&IG
E
RM
&E
SE
C&
DG
P&
A
TO
TA
L
Working 0
Housing • Energy use & CO2 emissions -1 -1 -1 -3
Mobility 0
Eating 0
Educating 0
Recreating 0
Communicating 0
Shopping 0
Cross-Cutting 0
Total -1 0 0 -1 0 -1 -3

228
Table 12.
MBR-WTP Sustainability Appraisal
Domain SE
I
LS
&O
I&IG
E
RM
&E
SE
C&
DG
P&
A
TO
TA
L
Working 0
Housing • Water use & waste water treatment 1 1 1 3
Mobility 0
Eating 0
Educating 0
Recreating 0
Communicating 0
Shopping 0
Cross-Cutting 0
Total 1 0 0 1 0 1 3

229
Forres
Table 13.
PLASTIG BAGS Sustainability Appraisal
Domain SE
I
LS
&O
I&IG
E
RM
&E
SE
C&
DG
P&
A
TO
TA
L
Working 0
Housing • Waste Production 0 0 0 0
Mobility 0
Eating 0
Educating 0
Recreating 0
Communicating 0
Shopping • Low impact consumerism 0 1 0 1
Cross-Cutting 0
Total 0 0 0 0 1 0 1

230
Table 14.
COMMUNITY GARDEN Sustainability Appraisal
Domain SE
I
LS
&O
I&IG
E
RM
&E
SE
C&
DG
P&
A
TO
TA
L
Working 0
Housing 0
Mobility 0
Eating • Food production 1 1 1 1 4
• Social Cohesion 1 1
• Community Assets 1 1
Educating 0
Recreating 0
Communicating 0
Shopping 0
Cross-Cutting 0
Total 1 0 2 1 1 1 6

231
Table 15.
FARMERS’ MARKET Sustainability Appraisal
Domain SE
I
LS
&O
I&IG
E
RM
&E
SE
C&
DG
P&
A
TO
TA
L
Working • Local Economy 1 1
Housing 0
Mobility 0
Eating • Food production 1 1 1 3
Educating 0
Recreating 0
Communicating 0
Shopping • Social Cohesion 1 1
• Community Assets 1 1
Cross-Cutting 0
Total 1 1 1 1 1 1 6

232
Table 16.
LOCAL FOOD GUIDE Sustainability Appraisal
Domain SE
I
LS
&O
I&IG
E
RM
&E
SE
C&
DG
P&
A
TO
TA
L
Working 0
Housing 0
Mobility 0
Eating • Food Production / Local 0
Educating 0
Recreating 0
Communicating 0
Shopping 0
Cross-Cutting 0
Total 0 0 0 0 0 0 0

233
Table 17.
CARBON PLEDGES Sustainability Appraisal
Domain SE
I
LS
&O
I&IG
E
RM
&E
SE
C&
DG
P&
A
TO
TA
L
Working 0
Housing • Energy use & CO2 emissions 1 1 1 3
• Utility Bills 1 1
Mobility • Energy use & CO2 emissions 1 1 1 3
• Car Dependency 0 0 0
Eating • Food production 1 1 2
Educating 0
Recreating 0
Communicating 0
Shopping • Low impact consumerism 1 1 0 2
Cross-Cutting 0
Total 4 0 1 4 0 2 11

234
APPENDIX E
TRANSITION PATH CHART LEGEND

235
Figure 1: Transition Path Chart Legend, Entity and Types

236
Figure 2: Transition Path Chart Legend, Elements

237
APPENDIX F
SUMMARY DESCRIPTIONS OF PATH ACTIVITIES BY CASE

238
Ashton Hayes, Path Segment 1 - STARTUP
ORGANIZING, Form Core Group, Aug-05, CORE
GC takes his idea of a carbon neutral village to his friends in the pub . "He thought they would
think he’s a complete nutcase but to his surprise they all said well we're all quite worried about it
[climate change] too" (R. Green, personal communication, January 8, 2011).
PLANNING, Overall Strategy, Oct-05, CORE
The core group begin to form an informal strategy based around a some principles of democratic
support, institutional authority, stakeholder engagement, financial independence and adaptability,
and they recognized a need for administrative support. A short action plan was produced in Dec
2005 that was primarily about forming partnerships and obtaining the parish council's support
ORGANIZING, Form a Board, Nov-05, CORE
The core group made a request to the parish council (PC) to formally support the transition to gain
legitimacy. The project was accepted as a subcommittee of the parish council, the lowest tier of
government in England, on condition of a public meeting to demonstrate the community supported
the transition.
NETWORKING, Build Coalitions, Nov-05 to May-06, CORE, GOV, NGO, BUS, CG, UNI
The core group did a lot of networking over a period of a few months to build strategic numerous
partnerships. The most enduring, that lasts to this day, is between the core group, University of
Chester and EA Technology. Other important relationships established at this early stage were
with Cheshire Council, the Energy Saving Trust, numerous local businesses and landowners,
numerous community groups (e.g. the Women's Institute, the local primary school).
PUBLICIZING, Hold Public Event, Jan-06, CORE, GOV, NGO, BUS, CG, UNI, COM
The public launch in Jan 2006 was attended by 400 people (out of a population of 1000), local
businesses, universities, local government, local and national politicians, and media. The project
was presented as an invitation: "we are trying to see if this community can work together to
become carbon neutral, we don't know how to do it, nobody has ever done it before, would you
join with us on this journey? ". The 'invitation' to become carbon neutral was accepted positively.
No other initiative has ever attracted so much interest in the community.Press releases before the
event were widely distributed. There was a large media presence representing newspapers, radio,
television, local and national. Politicians were not allowed to use the event as a platform. Public
support was seen as critical to the success of the transition. It was also required as a condition of
acceptance by the parish council.
MOBILIZING, Motivate, Jan-06, COM
The public launch event had a significant motivational effect on the community.
MOBILIZING, Provide Information, Jan-06 onward, CORE, COM
The core group told the community what they wanted them to do at the launch event and followed
this up with email broadcasts, website and general word of mouth.
Ashton Hayes, Path Segment 2 – HOUSEHOLD ENERGY
(STARTUP), Feb-06, COM

239
Many community members responded to the challenge immediately following the launch. "we had
asked everybody not to do anything until after the survey but prior to the survey everybody started
doing things – it was amazing, it just sort of got people going".
NETWORKING, Mar-06 to May-06, COR, BUS, NGO, COM
The core group worked with the Energy Saving Trust and Cheshire Council to explore ideas for
community energy generation and making the village an energy test bed. In May they held a
renewable technology fair with EA Technology open to the public with displays to homeowners
and presentation of community plans for demonstration solar and wind turbine. Public opinion on
the plans was positive.
MONITORING, Monitoring, May-06, COM, UNI, COR
University of Chester following help from the University of East Anglia conducted the first annual
carbon footprint survey and analysis as a student performed service learning project. There was
high participation rate in the survey indicating high interest and motivation.
MOBILIZING, Provide Information, Jul-06, UNI, COR, COM
Results for the whole village were made public and individual results provided to each household
privately, highlighting where they could most easily make savings.
MOBILIZING, Share Experiences, Jul-06 onwards,
There were meetings / social events that were kept light and fun and people in the village started to
make energy use part o the village culture: "We didn't talk about our gas bills between one and
other but now we do"
MOBILIZING, Motivate, Jul-06 onwards, COM, COR
Media attention, guest speakers, visits from politicians and making a film all contributed to the
motivation of the community. This in turn attracted more attention.
ORGANIZING, Form Workgroups, Nov-06, COR, WG
Volunteers, now up to 25, were organized into workgroups including a carbon clinic and a carbon
sink group. The carbon clinic group provided practical advice and help to villagers. This increased
village mobilization.
MOBILIZING, Motivate, Jan-07, COR, COM, BUS, GOV, NGO, CG
300 villagers, plus invited guests and media, attend the 1st anniversary and premier of the movie
made by a (professional filmmaker) village resident.
MONITORING, Monitoring, May-07, COM, UNI, COR
University of Chester conducted the second annual carbon footprint survey and analysis as a
student performed service learning project. Again, there was high participation rate in the survey
indicating high interest and motivation.
MOBILIZING, Provide Information, Jul-07, UNI, COR, COM
Results showed a 20% decrease in carbon footprint since the baseline
240
The pattern of activity continued for another year or two with the 3rd carbon footprint
survey in 2008 indicating 23% below baseline but subsequent years have been flat
between 20% and 23%.
Ashton Hayes, Path Segment 3 – TREE PLANTING
NETWORKING Negotiate, Jan-06 to May-06, CORE, BUS, NGO, UNI
Negotiate a deal with local farmers and other landowners, local silvicultural business to plant trees
as a carbon sink. (There is no information on the nature of the deal). Also work with University of
Edinburgh on how many trees would be needed and with local environmental consultancy RMK
and the University of Chester about an aerial survey to assess the carbon sinks around the village.
Ashton Hayes, Path Segment 4 – STATION FOOTPATH
NETWORKING, Negotiate, Mar-06, CORE, GOV
Members of the core group met with Cheshire Council to talk about the village plans and request a
400m footpath be constructed from the village to the station. At the public launch the council had
announced they would do anything they could to help the village. This has been requested before
but without success. In Nov-06 the council announced that they had allocated funds for the
footpath.
Ashton Hayes, Path Segment 5 – RECYCLING
NETWORKING, Negotiate, Mar-06, CORE, GOV
Members of the core group met with Cheshire Council to talk about the village plans. It is not
known if it was this meeting or a later one that the core team asked teh council to modify the
recycling system by using the bags differently as they had identified this as a reason why recycling
was low. The council agreed and made the change
CHANGE EXTERNAL SYSTEM, Change external system, Aug-06,
Cheshire Council change the recycling system as requested.
MONITORING, Monitor, Aug-06, CORE, GOV
Cheshire council provide recycling data back to the core group and information on other villages.
MOBILIZING, Providing Information, Sep 2006 onwards, COR, COM
The core group provide recycling data back to the community as a total for the village and put out
the challenge to reduce it.
MOBILIZING, Motivating, Sep 2006 onwards, COR, COM
An inter-village recycling competition takes hold and motivates communities to do more.
Ashton Hayes, Path Segment 6 – COMMUNITY SHOP
NETWORKING, Build Coalitions, Jan-06 onwards, COR, CG
The core group worked closely with many local community groups providing mutual support
whenever it was needed.
NETWORKING, Build Coalitions, Feb-09, COR, CG

241
The core group build a partnership with a new community group formed to establish a community
shop as the existing shop is closing. AHGCN provide some cash support to the shop group and in
exchange get a display in one of the corners. The loss of the shop would reduce the social
amenities of the community but it was also realized it was more important than that, that it was
connected to energy use and other things - it was a sustainability issue. "I think there is a 4th phase
developing which is the influence on the sustainability of the entire community ... It's amazing
actually how it is causing cross fertilization between different groups..the community cohesion
phase is what I call it" was how Garry Charnock put it (R. Green, personal communication,
January 8, 2011).

242
BedZED, Path Segment 1 - STARTUP
ORGANIZING, Form Core Group, 1996, CORE
BDA & BR meet and form a core group around Bill Dunster's vision of creating a sustainable
urban community
PLANNING, Overall Strategy, 1996, CORE
Develop the sustainable community concept further and plan overall approach
PLANNING, Action Plans, 1996, CORE
Begin looking for strategic partners, especially a property developer and a local authority
NETWORKING, Build Coalitions, Jan-97, CORE,LG
BioRegional open discussions with Sutton Council about the possibility of of a sustainable
housing development. Sutton Council who are politically disposed to the concept and willing to
support it.
FUNDRAISING, Fundraising, Jun-97, CORE,NGO
BR use their existing contacts with WWF to obtain funding to develop a proposal, find a
developer and find a site.
NETWORKING, Build Coalitions, Mar-98, NGO
With the funding help from WWF, BR were able to find Peabody Housing Trust, a social housing
association (not for profit) with special interest in affordable housing for low income families,
who ageed to to become a partner in the scheme as the primary developer.
NETWORKING, Build Coalitions, 1998-1999, BUS
Other key development partners were Arup engineering consultants for building physics, Gardiner
& Theobold (constrution surveying and management) and Ellis & Moore (engineers) and other
more standard construction service providers.
NETWORKING, Negotiations, 1998, BUS, GOV
Negotiating the land purchase deal with Sutton Council required agreement to allow future
environmental benefits to be built in to the bid, allowing a lower price offer to be acepted.
NETWORKING, Consult, Jun-98, CG
Public consultation informed the Hackbrige community about the proposed development and let
them have input into the plan.
PLANNING, Action Plans, 1999, CORE,BUS
Detailed site design and construction plans were created based on input from BDA, BR and PB,
plus local community groups, local government and construction consultants.
NETWORKING, Negotiations, 1999, CORE,LG,BUS
Due to the irregular nature of the construction plans numerous detailed planning issues had to be
worked out with SC planning department. Privisional planning permission was granted in June 99
and final permission in Dec 99.

243
ORGANIZING, Form Workgroups, 1999, COR,LG,BUS
Specialist development teams were formed around the water recyling system (Albion Water), the
energy system (Exus) and the photovoltaics system (BP Solar).
FUNDRAISING, Fundraising, Jan-02, CORE,GOV
BR obtained funding from SEED to provide a green lifestyle officer for the first year.
ORGANIZING, Form Workgroups, Apr-02, CORE, WG, BUS
A green lifestyle officer was appointed for the first year to promote and suport green living in the
new community and to develop the car club by working with Smart Moves Ltd and residents.
ORGANIZING, Form Workgroups, Apr-02, COM
Residents formed a Residents' Association to collectively manage their common community
interests.
MOBILIZING, Provide Support, Apr-2002 to Mar 2003, WG,COM
The GLO would do things like provide coupons for the local bike store, getting plants for
residents' gardens, put on bike repair and gardening workshops. She also spent 1.5 days per week
developing the car club.
MOBILIZING, Motivating, Apr-2002 to Mar 2003, CORE,COM
BDA & BR (both are now located on-site) organized events like Friday night social gatherings
with a green / sustainability interest in the first year.
MOBILIZING, Motivating, Apr-2002 to Mar 2003, COM
Attracting residents to the new development was not a problem. Private residents (50%) seem to
have heard about it through word of mouth, local press or sheer chance - there did not appear to be
any big sales drive necessary.
MOBILIZING, Sharing Experiences, Apr-2002 to Mar 2003, COM
In the first year or two there was a strong pioneering spirit in the community and sharing
experiences was a part of that.
BedZED, Path Segment 2 - GWTP
MONITORING, Measure Performance, 2002-2005, NGO,BUS
The operation and maintenance of the GWTP system was contracted to Albion Water, the main
system designer. Over time it became apparent that the system performance was not ost effective:
it required much more maintenance than planned, produced more sludge than expected and used
more energy than conventional offsite treatment.
NETWORKING, Negotiating, 2003- 2005, NGO,BUS
Following negotiations between PB and Albion, the operation of the GWTP was discontinued in
June 2005 because it was not cost effective to operate.
BedZED, Path Segment 3 - CHP
MONITORING, Measure Performance, 2002 – 2005, NGO,BUS

244
The operation and maintenance of the CHP system was contracted to Exus Energy Ltd, the main
system designer. Due to technical issues, in part caused by regulative requirements, the system
performance was not cost effective: it required constant on-site maintenance and was frequently
down.
NETWORKING, Negotiations, 2003 -2005, NGO,BUS
Exus Energy ceased trading and therefore operation of the CHP plant could not continue after
March 2005.
BedZED, Path Segment 4 – MBR-WTP
NETWORKING, Build Coalitions, Jun-08, NGO,BUS
PB look for replacement on-site water treatment plants. Thames Water agree install and operate a
'membrane bio-reactor' on-site water treatment plant as a 3 year research project. Started in June
2008.

245
APPENDIX G
COPYRIGHTED WORK

246

247
APPENDIX H
INSTITUTIONAL REVIEW BOARD APPROVAL

248