Discounted Cashflow Valuation: Equity and Firm Models
91
Aswath Damodaran Discounted Cashflow Valuation: Equity and Firm Models Aswath Damodaran
-
Upload
demetrius-galloway -
Category
Documents
-
view
32 -
download
0
description
Discounted Cashflow Valuation: Equity and Firm Models. Aswath Damodaran. Summarizing the Inputs. In summary, at this stage in the process, we should have an estimate of the - PowerPoint PPT Presentation
Transcript of Discounted Cashflow Valuation: Equity and Firm Models
Aswath Damodaran 1
Discounted Cashflow Valuation:Equity and Firm Models
Aswath Damodaran
Aswath Damodaran 2
Summarizing the Inputs
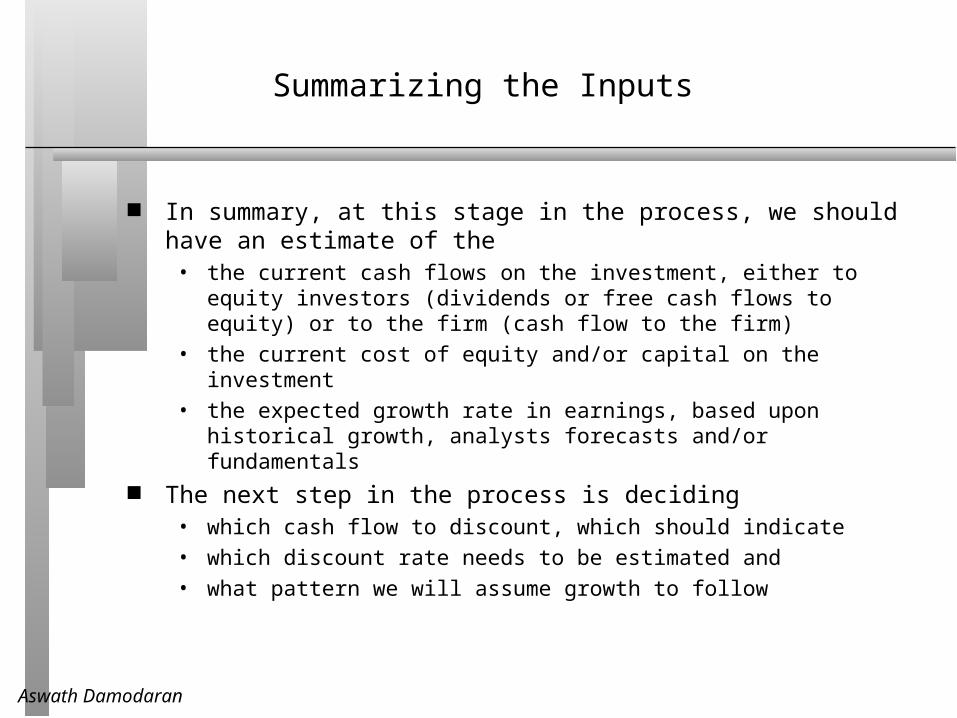
In summary, at this stage in the process, we should have an estimate of the • the current cash flows on the investment, either to equity investors (dividends or
free cash flows to equity) or to the firm (cash flow to the firm)
• the current cost of equity and/or capital on the investment
• the expected growth rate in earnings, based upon historical growth, analysts forecasts and/or fundamentals
The next step in the process is deciding• which cash flow to discount, which should indicate
• which discount rate needs to be estimated and
• what pattern we will assume growth to follow
Aswath Damodaran 3
Which cash flow should I discount?
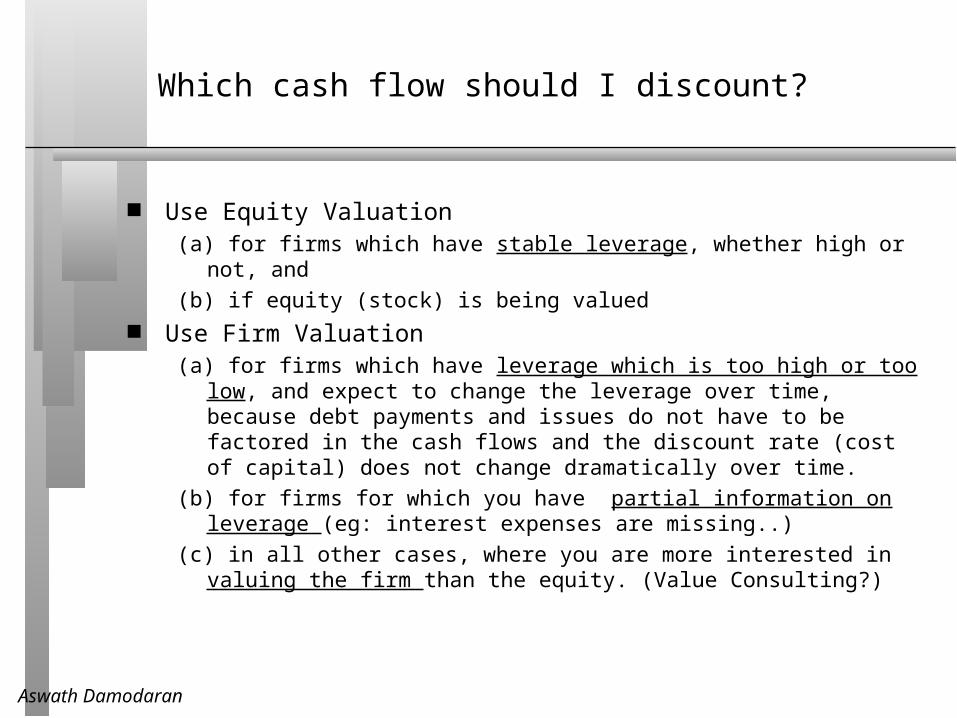
Use Equity Valuation (a) for firms which have stable leverage, whether high or not, and
(b) if equity (stock) is being valued Use Firm Valuation
(a) for firms which have leverage which is too high or too low, and expect to change the leverage over time, because debt payments and issues do not have to be factored in the cash flows and the discount rate (cost of capital) does not change dramatically over time.
(b) for firms for which you have partial information on leverage (eg: interest expenses are missing..)
(c) in all other cases, where you are more interested in valuing the firm than the equity. (Value Consulting?)
Aswath Damodaran 4
Given cash flows to equity, should I discount dividends or FCFE?
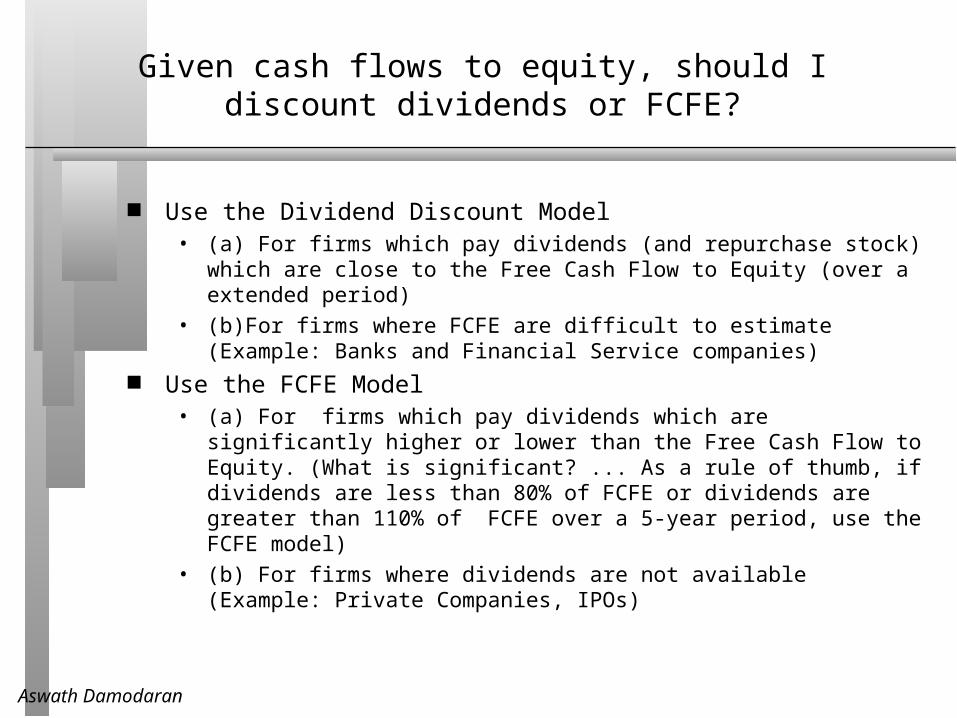
Use the Dividend Discount Model• (a) For firms which pay dividends (and repurchase stock) which are close to the
Free Cash Flow to Equity (over a extended period)
• (b)For firms where FCFE are difficult to estimate (Example: Banks and Financial Service companies)
Use the FCFE Model• (a) For firms which pay dividends which are significantly higher or lower than the
Free Cash Flow to Equity. (What is significant? ... As a rule of thumb, if dividends are less than 80% of FCFE or dividends are greater than 110% of FCFE over a 5-year period, use the FCFE model)
• (b) For firms where dividends are not available (Example: Private Companies, IPOs)
Aswath Damodaran 5
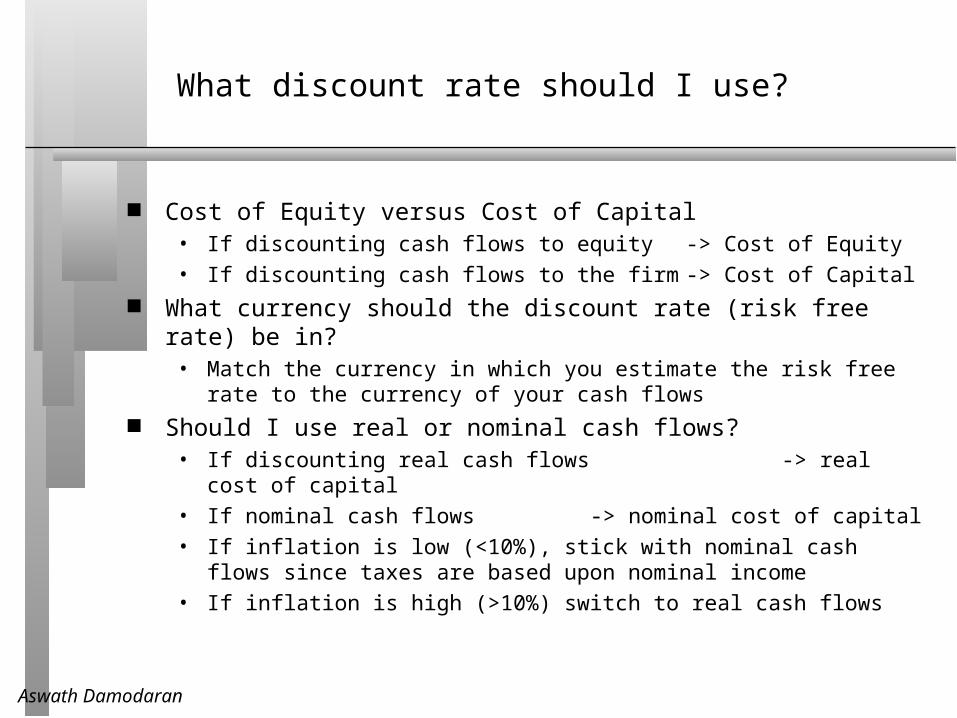
What discount rate should I use?
Cost of Equity versus Cost of Capital• If discounting cash flows to equity -> Cost of Equity
• If discounting cash flows to the firm -> Cost of Capital What currency should the discount rate (risk free rate) be in?
• Match the currency in which you estimate the risk free rate to the currency of your cash flows
Should I use real or nominal cash flows?• If discounting real cash flows -> real cost of capital
• If nominal cash flows -> nominal cost of capital
• If inflation is low (<10%), stick with nominal cash flows since taxes are based upon nominal income
• If inflation is high (>10%) switch to real cash flows
Aswath Damodaran 6
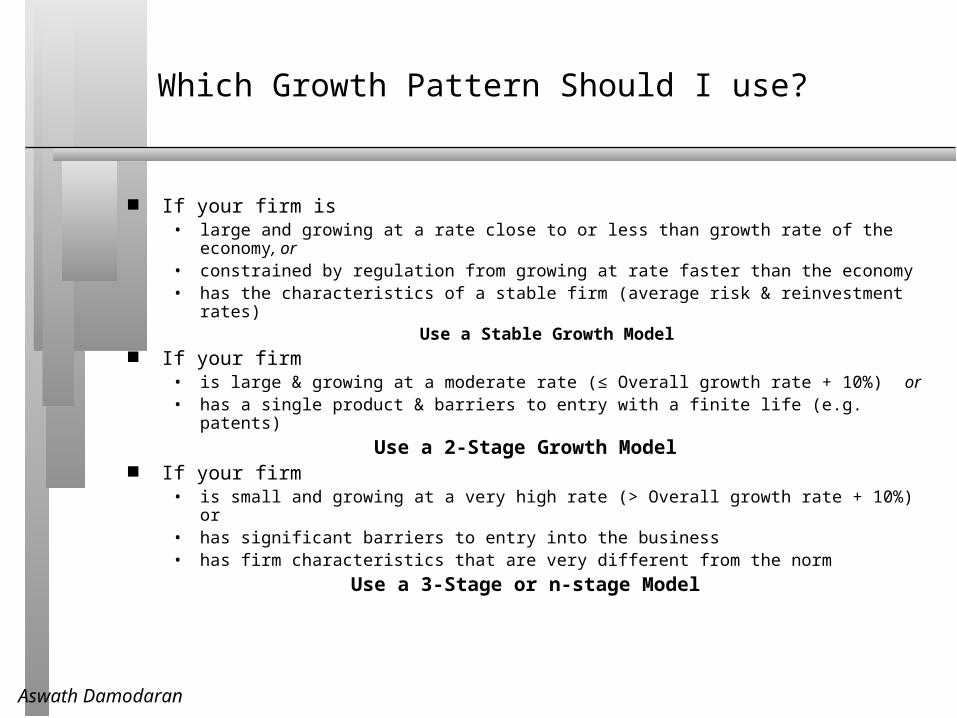
Which Growth Pattern Should I use?
If your firm is • large and growing at a rate close to or less than growth rate of the economy, or• constrained by regulation from growing at rate faster than the economy• has the characteristics of a stable firm (average risk & reinvestment rates)
Use a Stable Growth Model If your firm
• is large & growing at a moderate rate (≤ Overall growth rate + 10%) or• has a single product & barriers to entry with a finite life (e.g. patents)
Use a 2-Stage Growth Model If your firm
• is small and growing at a very high rate (> Overall growth rate + 10%) or• has significant barriers to entry into the business• has firm characteristics that are very different from the norm
Use a 3-Stage or n-stage Model
Aswath Damodaran 7
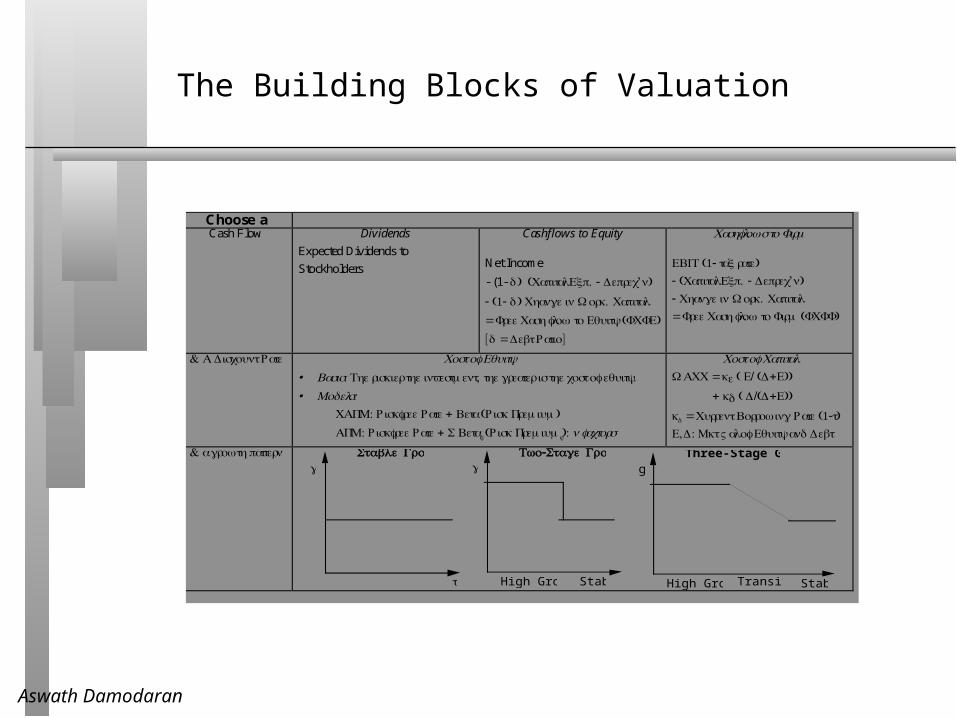
The Building Blocks of Valuation
Choose aCash Flow Dividends
Expected Dividends to
Stockholders
Cashflows to Equity
Net Income
- (1- δ) (Capital Exp. - Deprec’n)
- (1- δ) Change in Work. Capital
= Free Cash flow to Equity (FCFE)
[δ = Debt Ratio]
Cashflows to Firm
EBIT (1- tax rate)- (Capital Exp. - Deprec’n)- Change in Work. Capital
= Free Cash flow to Firm (FCFF)
& A Discount Rate Cost of Equity
• Basis: The riskier the investment, the greater is the cost of equity.
• Models:CAPM: Riskfree Rate + Beta (Risk Premium)
APM: Riskfree Rate + Σ Betaj (Risk Premiumj): n factors
Cost of CapitalWACC = ke ( E/ (D+E))
+ kd ( D/(D+E))
kd = Current Borrowing Rate (1-t)E,D: Mkt Val of Equity and Debt
& a growth pattern
t
g Stable Growth
g- Two Stage Growth
|High GrowthStable
gThree-Stage Growth
|High Growth StableTransition
Aswath Damodaran 8
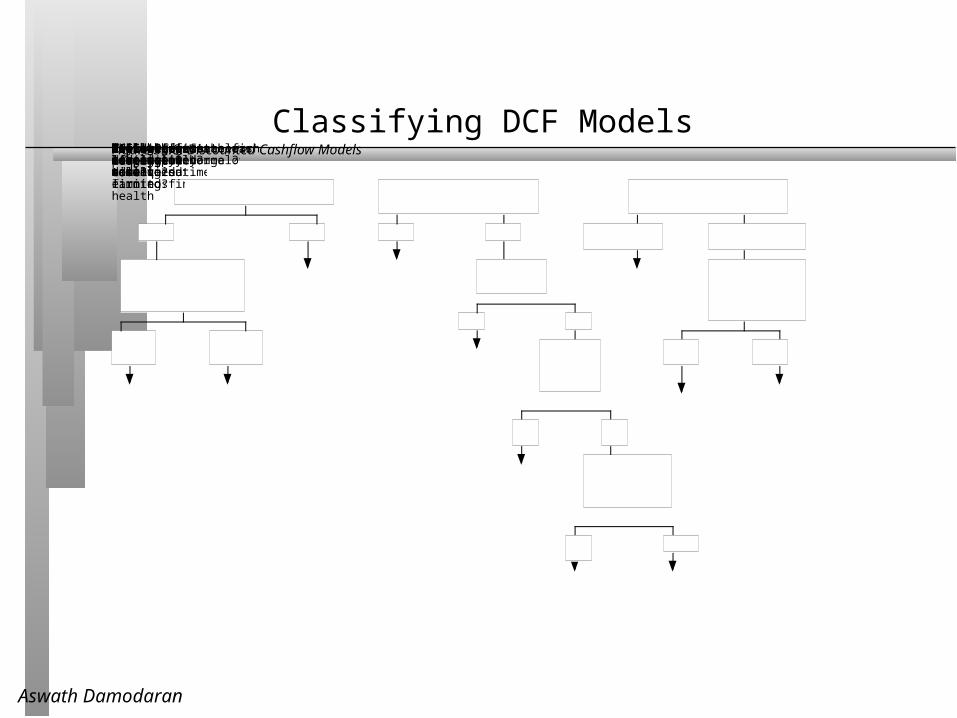
Classifying DCF ModelsFigure 35.8: Discounted Cashflow ModelsCan you estimate cash flows?YesNoUse dividend discount modelIs leverage stable or likely to change over time?
Stable leverageUnstable leverageAre the current earnings positive & normal?YesUse current earnings as base
NoIs the cause temporary?YesNoReplace current earnings with normalized earnings
Is the firm likely to survive?
YesNoAdjust margins over time to nurse firm to financial health
Does the firm have a lot of debt?
YesNoValue Equity as an option to liquidate
Estimate liquidation value
What rate is the firm growingat currently?< Growth rate of economyStable growthmodel> Growth rate of economyAre the firm’s competitive advantges time limited?
YesNo2-stage model3-stage orn-stagemodel
FCFEFCFF
Aswath Damodaran 9
Companies Valued
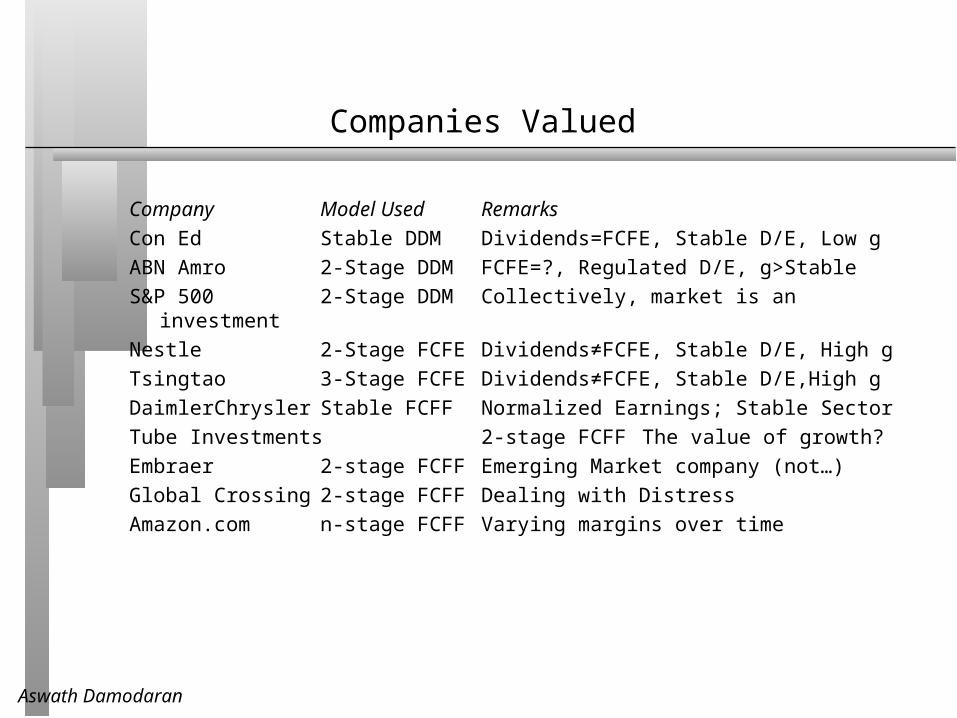
Company Model Used Remarks
Con Ed Stable DDM Dividends=FCFE, Stable D/E, Low g
ABN Amro 2-Stage DDM FCFE=?, Regulated D/E, g>Stable
S&P 500 2-Stage DDM Collectively, market is an investment
Nestle 2-Stage FCFE Dividends≠FCFE, Stable D/E, High g
Tsingtao 3-Stage FCFE Dividends≠FCFE, Stable D/E,High g
DaimlerChrysler Stable FCFF Normalized Earnings; Stable Sector
Tube Investments 2-stage FCFF The value of growth?
Embraer 2-stage FCFF Emerging Market company (not…)
Global Crossing 2-stage FCFF Dealing with Distress
Amazon.com n-stage FCFF Varying margins over time
Aswath Damodaran 10
General Information
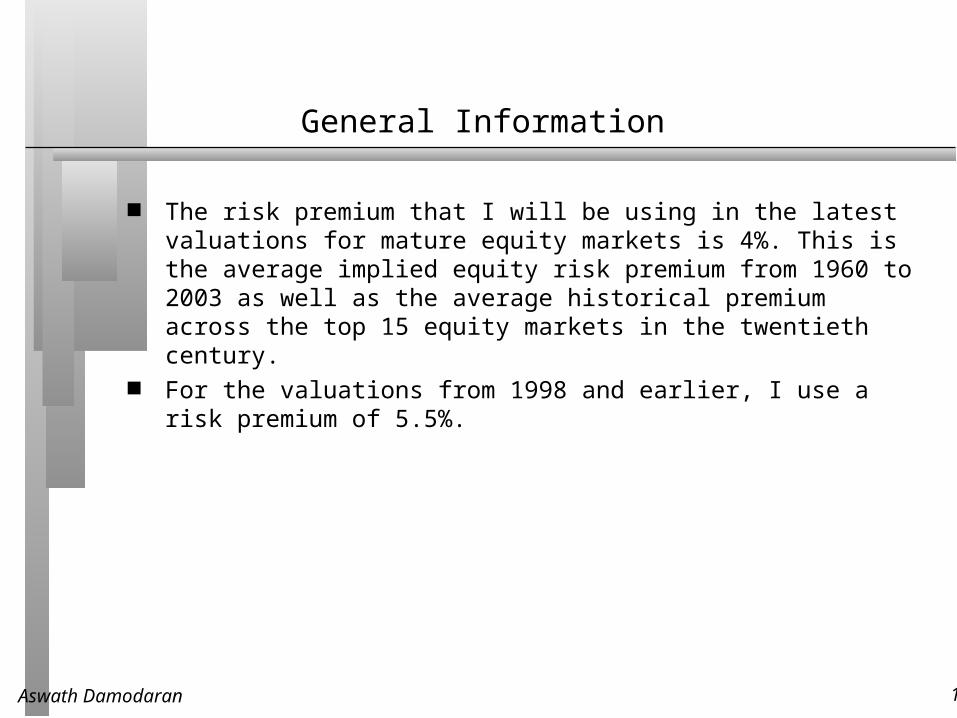
The risk premium that I will be using in the latest valuations for mature equity markets is 4%. This is the average implied equity risk premium from 1960 to 2003 as well as the average historical premium across the top 15 equity markets in the twentieth century.
For the valuations from 1998 and earlier, I use a risk premium of 5.5%.
Aswath Damodaran 11
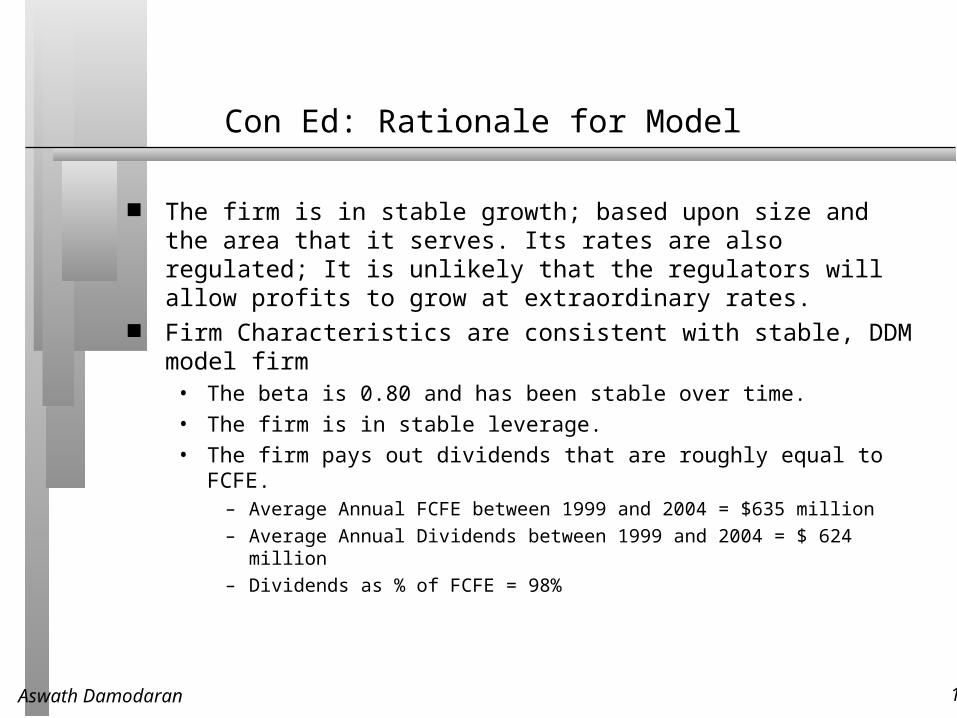
Con Ed: Rationale for Model
The firm is in stable growth; based upon size and the area that it serves. Its rates are also regulated; It is unlikely that the regulators will allow profits to grow at extraordinary rates.
Firm Characteristics are consistent with stable, DDM model firm• The beta is 0.80 and has been stable over time.
• The firm is in stable leverage.
• The firm pays out dividends that are roughly equal to FCFE.– Average Annual FCFE between 1999 and 2004 = $635 million
– Average Annual Dividends between 1999 and 2004 = $ 624 million
– Dividends as % of FCFE = 98%
Aswath Damodaran 12
Con Ed: A Stable Growth DDM: December 31, 2004
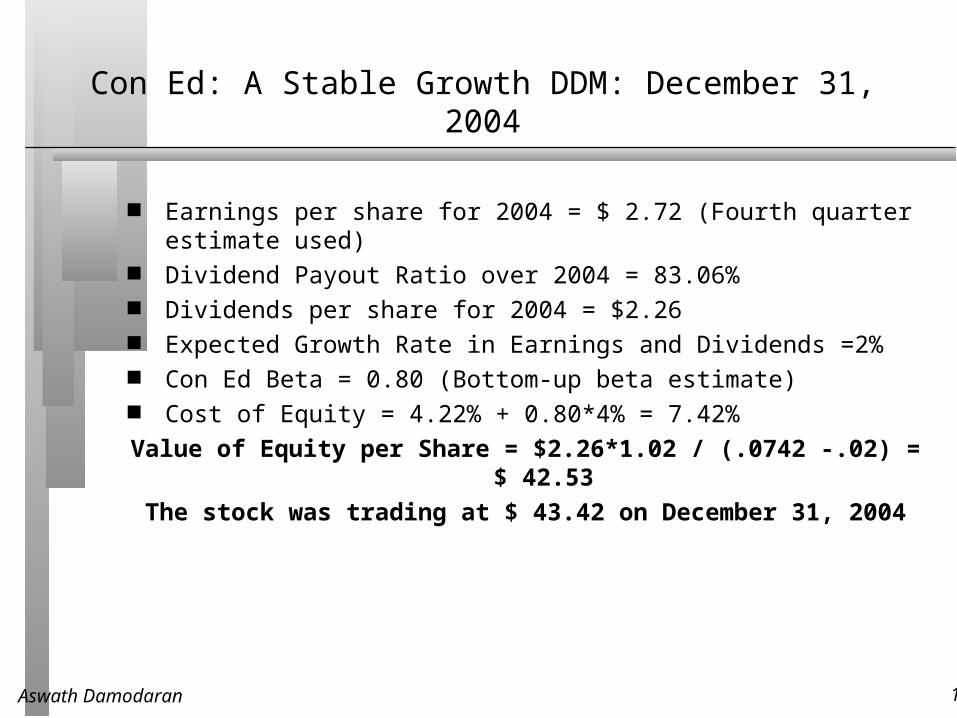
Earnings per share for 2004 = $ 2.72 (Fourth quarter estimate used) Dividend Payout Ratio over 2004 = 83.06% Dividends per share for 2004 = $2.26 Expected Growth Rate in Earnings and Dividends =2% Con Ed Beta = 0.80 (Bottom-up beta estimate) Cost of Equity = 4.22% + 0.80*4% = 7.42%
Value of Equity per Share = $2.26*1.02 / (.0742 -.02) = $ 42.53
The stock was trading at $ 43.42 on December 31, 2004
Aswath Damodaran 13
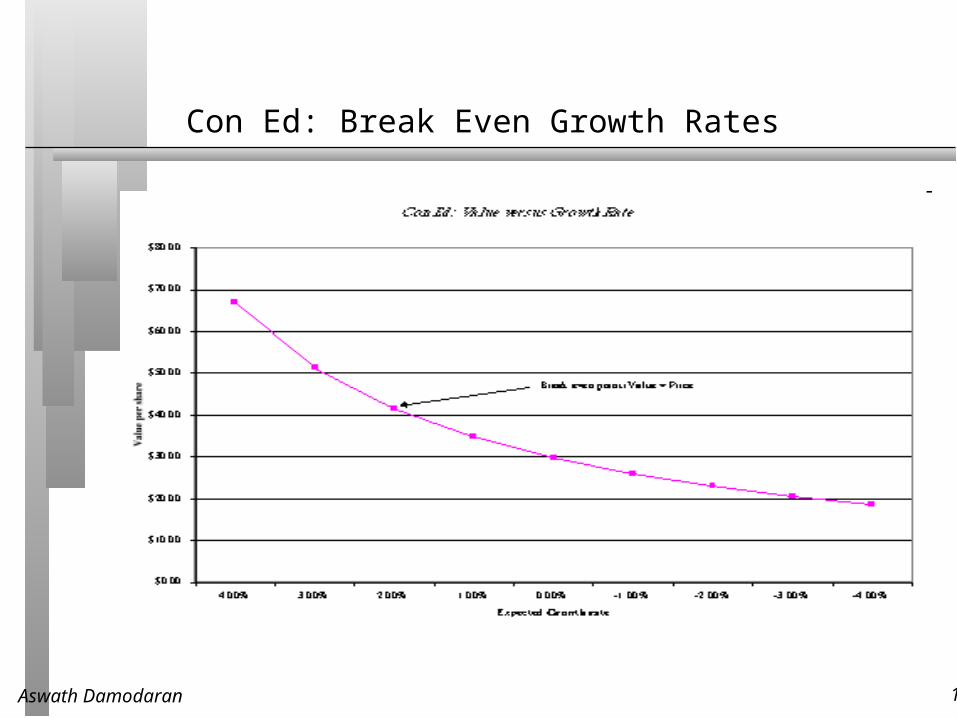
Con Ed: Break Even Growth Rates
Aswath Damodaran 14
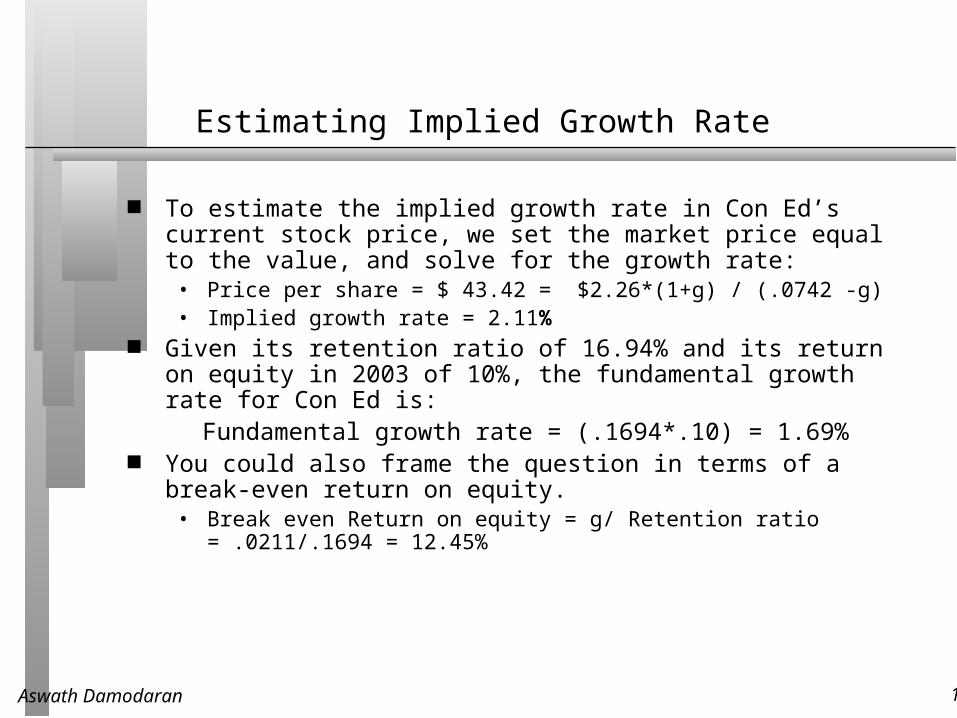
Estimating Implied Growth Rate
To estimate the implied growth rate in Con Ed’s current stock price, we set the market price equal to the value, and solve for the growth rate:
• Price per share = $ 43.42 = $2.26*(1+g) / (.0742 -g)• Implied growth rate = 2.11%
Given its retention ratio of 16.94% and its return on equity in 2003 of 10%, the fundamental growth rate for Con Ed is:
Fundamental growth rate = (.1694*.10) = 1.69% You could also frame the question in terms of a break-even return on equity.
• Break even Return on equity = g/ Retention ratio = .0211/.1694 = 12.45%
Aswath Damodaran 15
Implied Growth Rates and Valuation Judgments
When you do any valuation, there are three possibilities. The first is that you are right and the market is wrong. The second is that the market is right and that you are wrong. The third is that you are both wrong. In an efficient market, which is the most likely scenario?
Assume that you invest in a misvalued firm, and that you are right and the market is wrong. Will you definitely profit from your investment?
Yes No
Aswath Damodaran 16
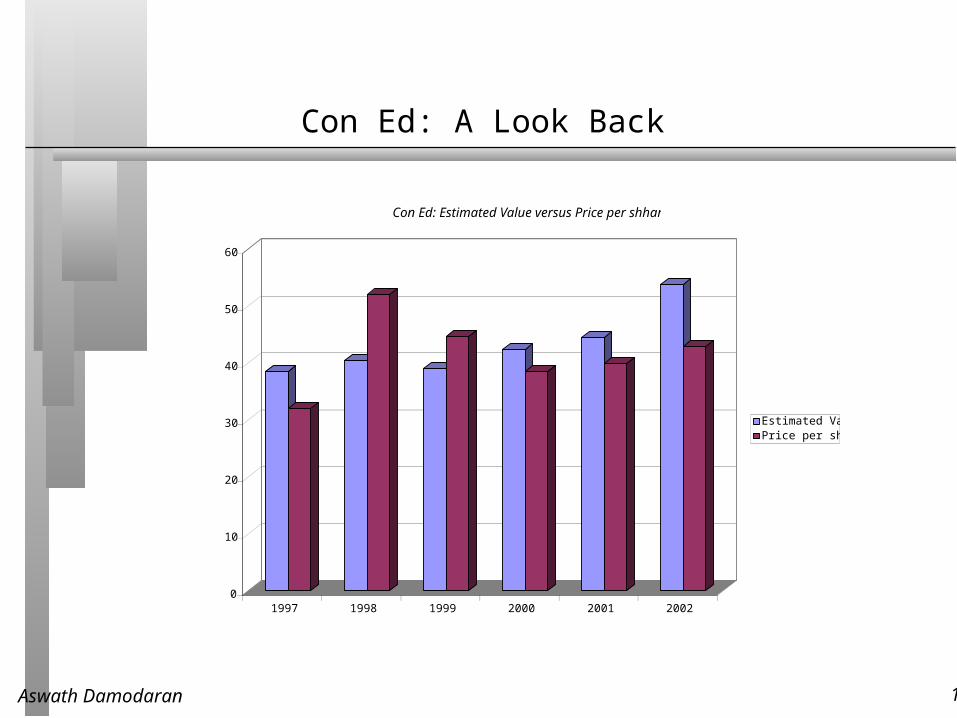
Con Ed: A Look Back
0
10
20
30
40
50
60
1997 1998 1999 2000 2001 2002
Con Ed: Estimated Value versus Price per shhare
Estimated ValuePrice per share
Aswath Damodaran 17
ABN Amro: Rationale for 2-Stage DDM in December 2003
As a financial service institution, estimating FCFE or FCFF is very difficult. The expected growth rate based upon the current return on equity of 16% and
a retention ratio of 51% is 8.2%. This is higher than what would be a stable growth rate (roughly 4% in Euros)
Aswath Damodaran 18
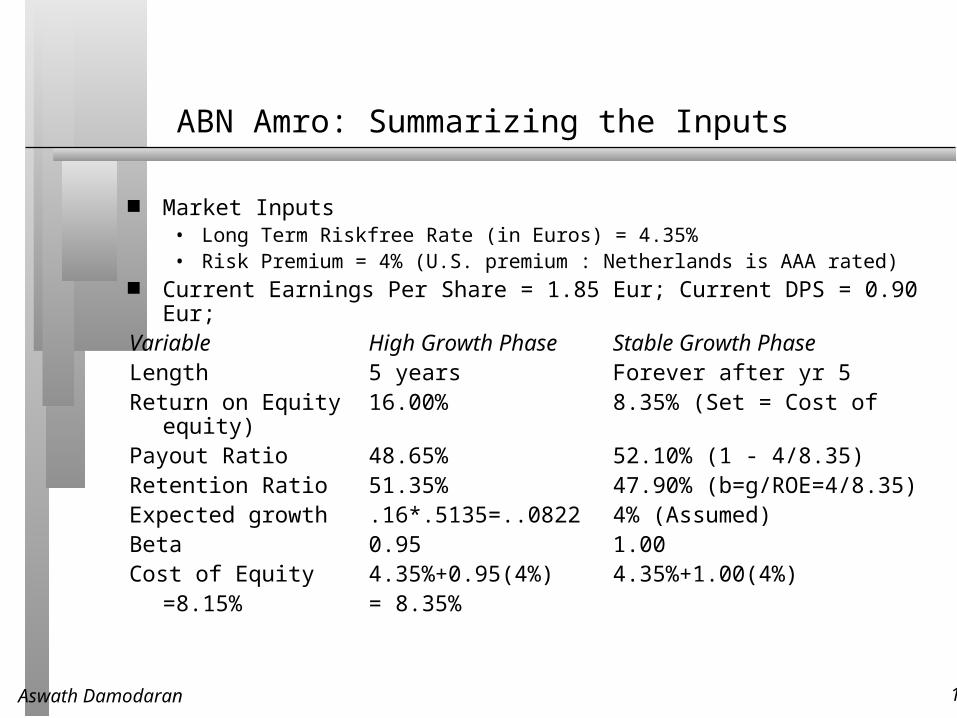
ABN Amro: Summarizing the Inputs
Market Inputs• Long Term Riskfree Rate (in Euros) = 4.35%• Risk Premium = 4% (U.S. premium : Netherlands is AAA rated)
Current Earnings Per Share = 1.85 Eur; Current DPS = 0.90 Eur;Variable High Growth Phase Stable Growth PhaseLength 5 years Forever after yr 5Return on Equity 16.00% 8.35% (Set = Cost of
equity)Payout Ratio 48.65% 52.10% (1 - 4/8.35)Retention Ratio 51.35% 47.90% (b=g/ROE=4/8.35)Expected growth .16*.5135=..0822 4% (Assumed)Beta 0.95 1.00Cost of Equity 4.35%+0.95(4%) 4.35%+1.00(4%)
=8.15% = 8.35%
Aswath Damodaran 19
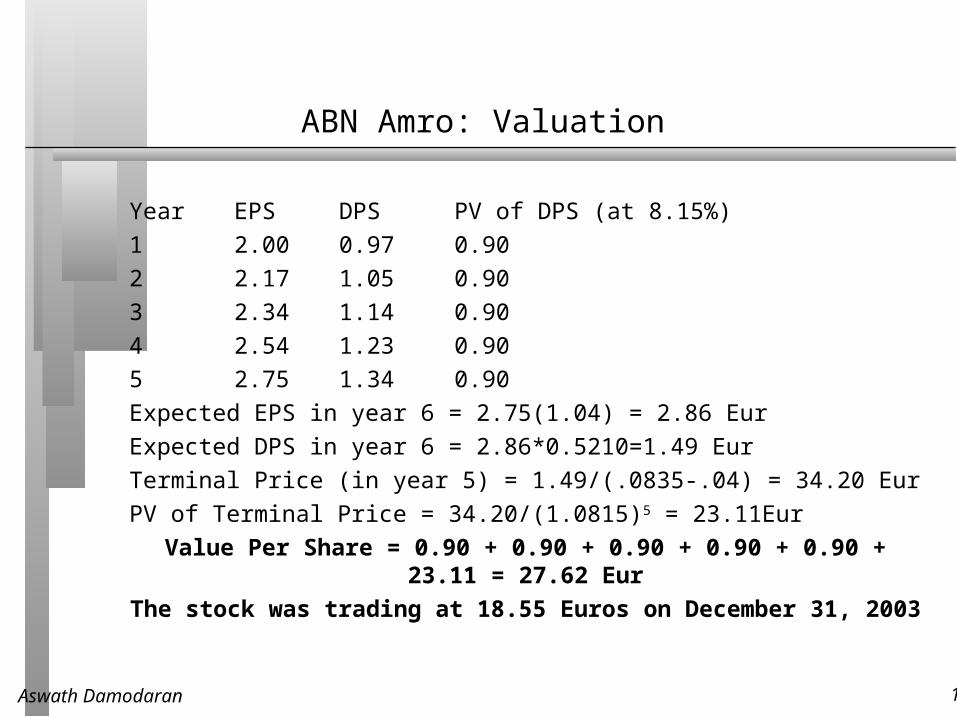
ABN Amro: Valuation
Year EPS DPS PV of DPS (at 8.15%)
1 2.00 0.97 0.90
2 2.17 1.05 0.90
3 2.34 1.14 0.90
4 2.54 1.23 0.90
5 2.75 1.34 0.90
Expected EPS in year 6 = 2.75(1.04) = 2.86 Eur
Expected DPS in year 6 = 2.86*0.5210=1.49 Eur
Terminal Price (in year 5) = 1.49/(.0835-.04) = 34.20 Eur
PV of Terminal Price = 34.20/(1.0815)5 = 23.11Eur
Value Per Share = 0.90 + 0.90 + 0.90 + 0.90 + 0.90 + 23.11 = 27.62 Eur
The stock was trading at 18.55 Euros on December 31, 2003
Aswath Damodaran 20
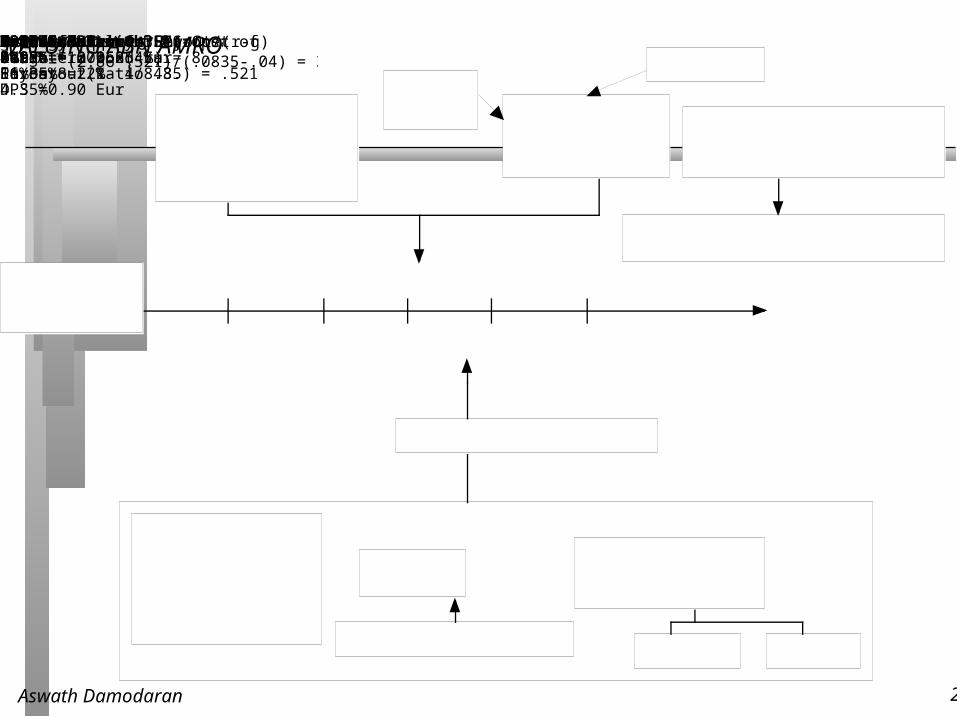
DividendsEPS = 1.85 Eur * Payout Ratio 48.65%DPS = 0.90 Eur
Expected Growth51.35% *16% = 8.22%
0.97 Eur1.05 Eur1.14 Eur1.23 Eur1.34 EurForeverg =4%: ROE = 8.35%(=Cost of equity)Beta = 1.00Payout = (1- 4/8.35) = .521
Terminal Value= EPS6*Payout/(r-g)= (2.86*.521)/(.0835-.04) = 34.20
.........Cost of Equity4.95% + 0.95 (4%) = 8.15%Discount at Cost of EquityValue of Equity per share = 27.62 EurRiskfree Rate:Long term bond rate in Euros4.35%
+Beta0.95XRisk Premium4%Average beta for European banks = 0.95Mature Market4%Country Risk0% VALUING ABN AMRORetention Ratio = 51.35%
ROE = 16%DPSEPS2.00 Eur2.17 Eur 2.34Eur2.54 Eur2.75 Eur
Aswath Damodaran 21
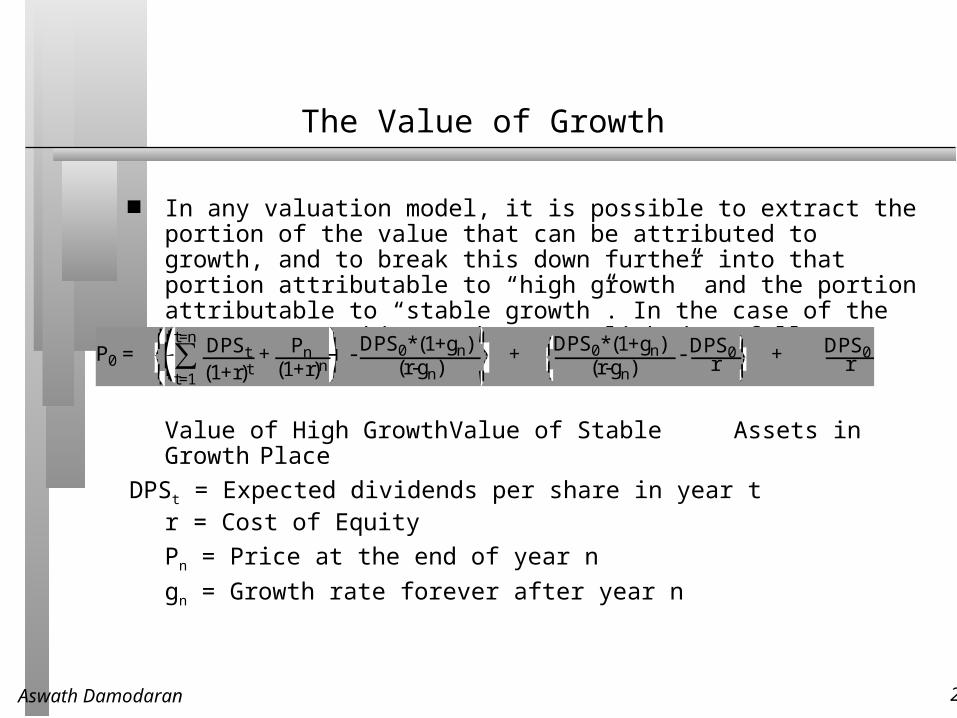
The Value of Growth
In any valuation model, it is possible to extract the portion of the value that can be attributed to growth, and to break this down further into that portion attributable to “high growth” and the portion attributable to “stable growth”. In the case of the 2-stage DDM, this can be accomplished as follows:
Value of High Growth Value of Stable Assets in Growth Place
DPSt = Expected dividends per share in year tr = Cost of Equity
Pn = Price at the end of year n
gn = Growth rate forever after year n
P0 = DPSt
(1+r)t∑t=1
t=n + Pn
(1+r)n - DPS0*(1+gn)
(r-gn) + DPS0*(1+gn)
(r-gn) - DPS0
r + DPS0r
Aswath Damodaran 22
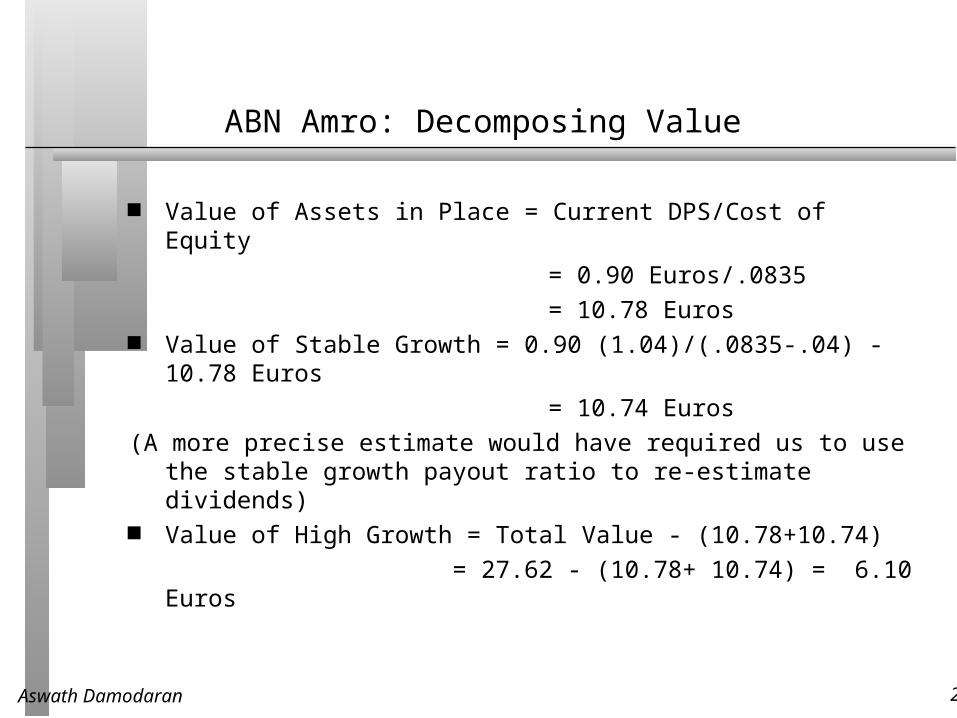
ABN Amro: Decomposing Value
Value of Assets in Place = Current DPS/Cost of Equity
= 0.90 Euros/.0835
= 10.78 Euros Value of Stable Growth = 0.90 (1.04)/(.0835-.04) - 10.78 Euros
= 10.74 Euros
(A more precise estimate would have required us to use the stable growth payout ratio to re-estimate dividends)
Value of High Growth = Total Value - (10.78+10.74)
= 27.62 - (10.78+ 10.74) = 6.10 Euros
Aswath Damodaran 23
S & P 500: Rationale for Use of Model
While markets overall generally do not grow faster than the economies in which they operate, there is reason to believe that the earnings at U.S. companies (which have outpaced nominal GNP growth over the last 5 years) will continue to do so in the next 5 years. The consensus estimate of growth in earnings (from Zacks) is roughly 8% (with top-down estimates)
Though it is possible to estimate FCFE for many of the firms in the S&P 500, it is not feasible for several (financial service firms). The dividends during the year should provide a reasonable (albeit conservative) estimate of the cash flows to equity investors from buying the index.
Aswath Damodaran 24
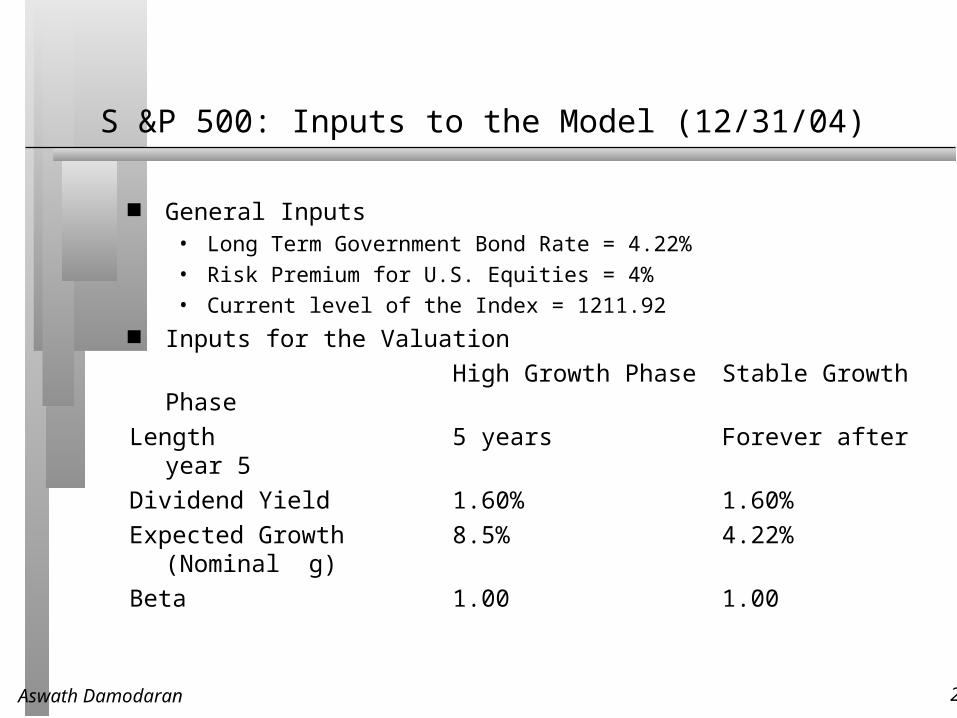
S &P 500: Inputs to the Model (12/31/04)
General Inputs• Long Term Government Bond Rate = 4.22%
• Risk Premium for U.S. Equities = 4%
• Current level of the Index = 1211.92 Inputs for the Valuation
High Growth Phase Stable Growth Phase
Length 5 years Forever after year 5
Dividend Yield 1.60% 1.60%
Expected Growth 8.5% 4.22% (Nominal g)
Beta 1.00 1.00
Aswath Damodaran 25
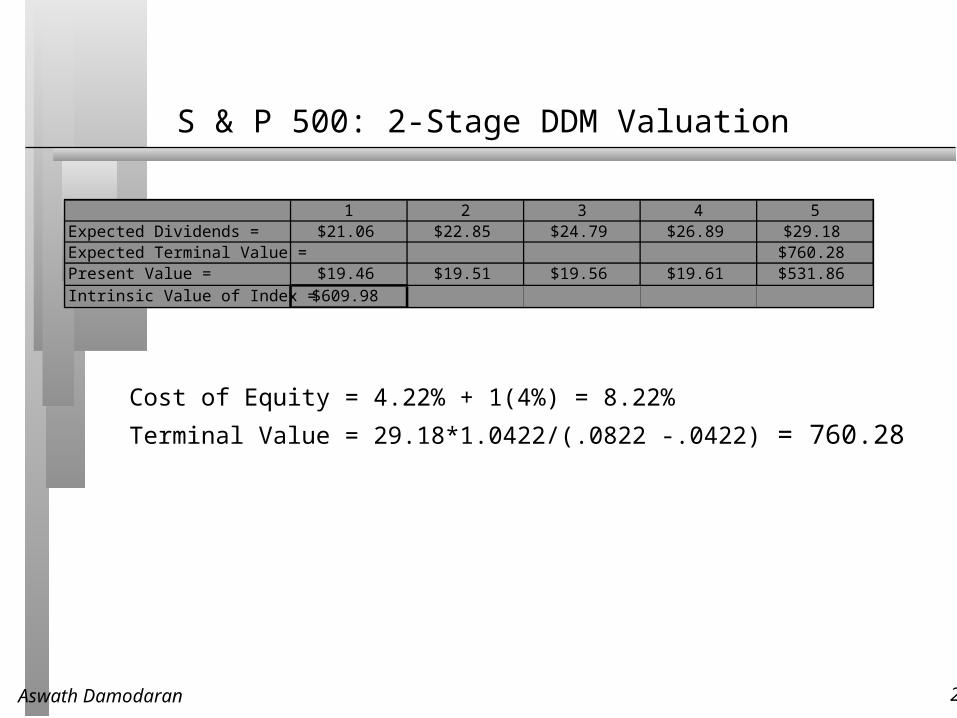
S & P 500: 2-Stage DDM Valuation
Cost of Equity = 4.22% + 1(4%) = 8.22%
Terminal Value = 29.18*1.0422/(.0822 -.0422) = 760.28
1 2 3 4 5Expected Dividends = $21.06 $22.85 $24.79 $26.89 $29.18Expected Terminal Value = $760.28Present Value = $19.46 $19.51 $19.56 $19.61 $531.86Intrinsic Value of Index = $609.98
Aswath Damodaran 26
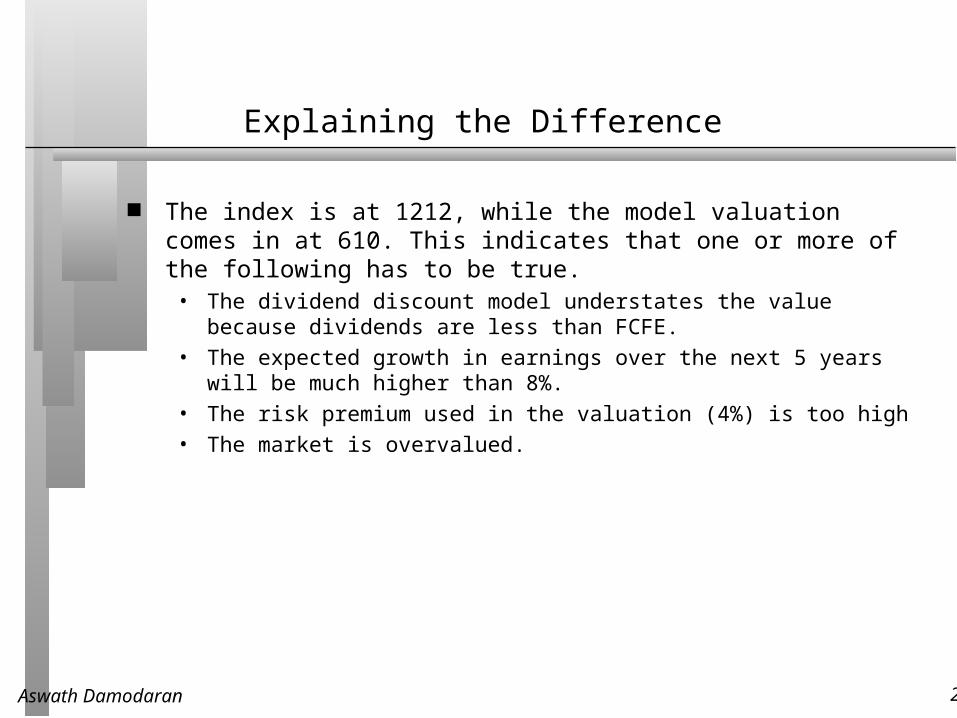
Explaining the Difference
The index is at 1212, while the model valuation comes in at 610. This indicates that one or more of the following has to be true.
• The dividend discount model understates the value because dividends are less than FCFE.
• The expected growth in earnings over the next 5 years will be much higher than 8%.
• The risk premium used in the valuation (4%) is too high
• The market is overvalued.
Aswath Damodaran 27
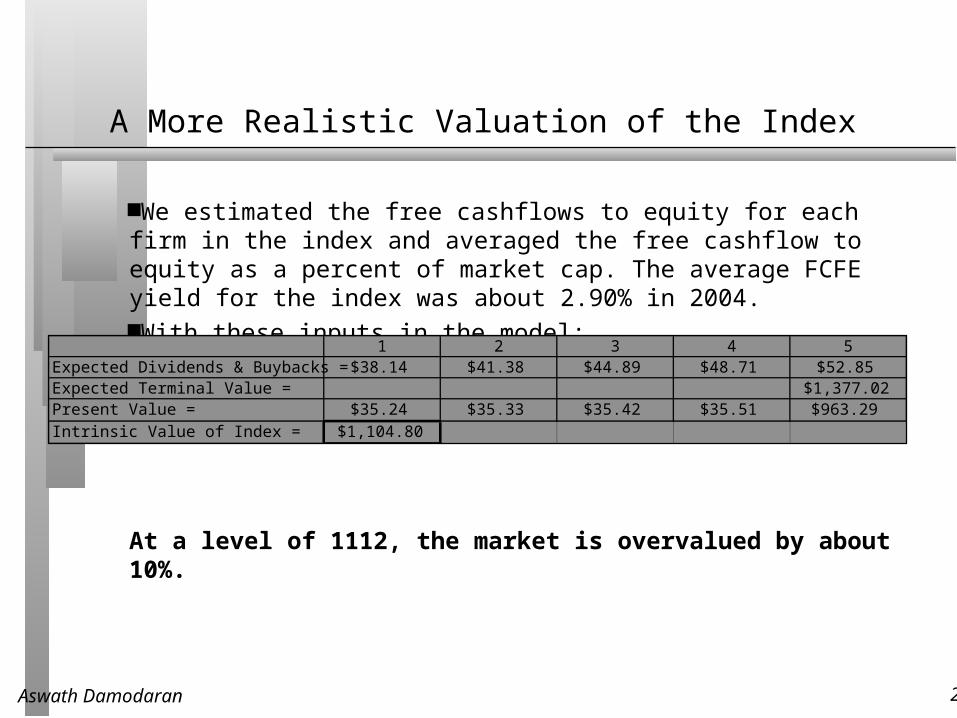
A More Realistic Valuation of the Index
We estimated the free cashflows to equity for each firm in the index and averaged the free cashflow to equity as a percent of market cap. The average FCFE yield for the index was about 2.90% in 2004.With these inputs in the model:
At a level of 1112, the market is overvalued by about 10%.
1 2 3 4 5Expected Dividends & Buybacks = $38.14 $41.38 $44.89 $48.71 $52.85Expected Terminal Value = $1,377.02Present Value = $35.24 $35.33 $35.42 $35.51 $963.29Intrinsic Value of Index = $1,104.80
Aswath Damodaran 28
Nestle: Rationale for Using Model - January 2001
Earnings per share at the firm has grown about 5% a year for the last 5 years, but the fundamentals at the firm suggest growth in EPS of about 11%. (Analysts are also forecasting a growth rate of 12% a year for the next 5 years)
Nestle has a debt to capital ratio of about 37.6% and is unlikely to change that leverage materially. (How do I know? I do not. I am just making an assumption.)
Like many large European firms, Nestle has paid less in dividends than it has available in FCFE.
Aswath Damodaran 29
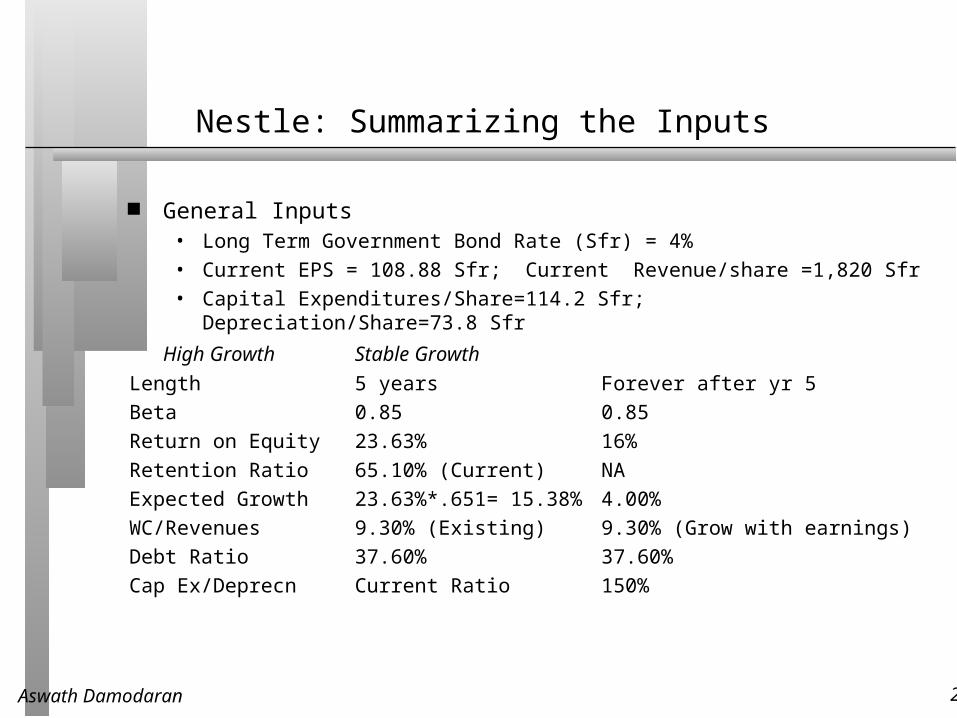
Nestle: Summarizing the Inputs
General Inputs• Long Term Government Bond Rate (Sfr) = 4%
• Current EPS = 108.88 Sfr; Current Revenue/share =1,820 Sfr
• Capital Expenditures/Share=114.2 Sfr; Depreciation/Share=73.8 Sfr
High Growth Stable Growth
Length 5 years Forever after yr 5
Beta 0.85 0.85
Return on Equity 23.63% 16%
Retention Ratio 65.10% (Current) NA
Expected Growth 23.63%*.651= 15.38% 4.00%
WC/Revenues 9.30% (Existing) 9.30% (Grow with earnings)
Debt Ratio 37.60% 37.60%
Cap Ex/Deprecn Current Ratio 150%
Aswath Damodaran 30
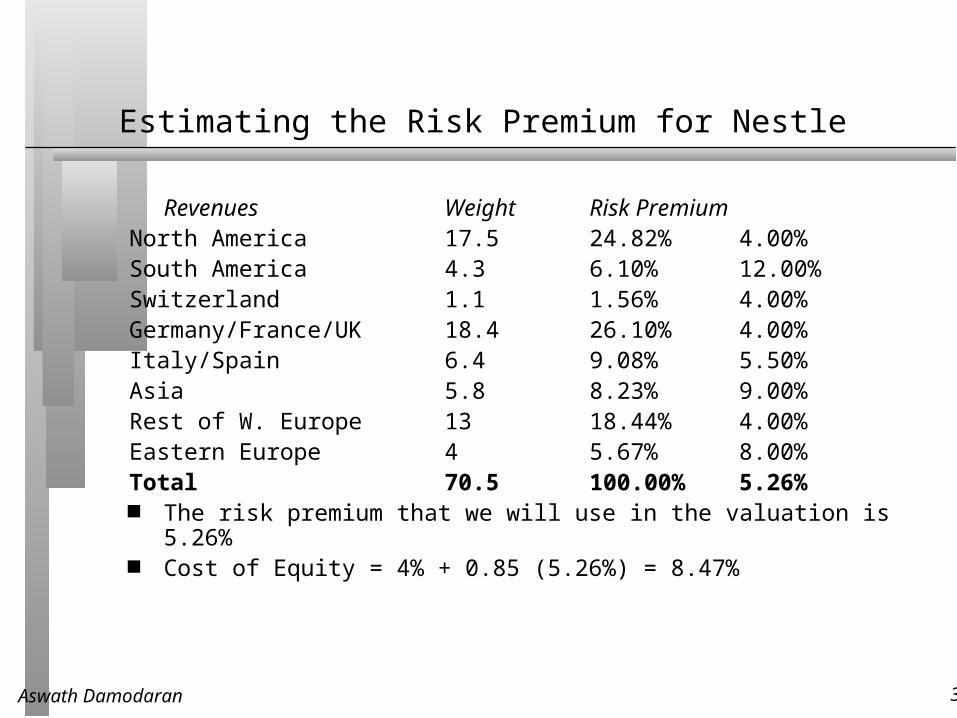
Estimating the Risk Premium for Nestle
Revenues Weight Risk PremiumNorth America 17.5 24.82% 4.00%South America 4.3 6.10% 12.00%Switzerland 1.1 1.56% 4.00%Germany/France/UK 18.4 26.10% 4.00%Italy/Spain 6.4 9.08% 5.50%Asia 5.8 8.23% 9.00%Rest of W. Europe 13 18.44% 4.00%Eastern Europe 4 5.67% 8.00%Total 70.5 100.00% 5.26% The risk premium that we will use in the valuation is 5.26% Cost of Equity = 4% + 0.85 (5.26%) = 8.47%
Aswath Damodaran 31
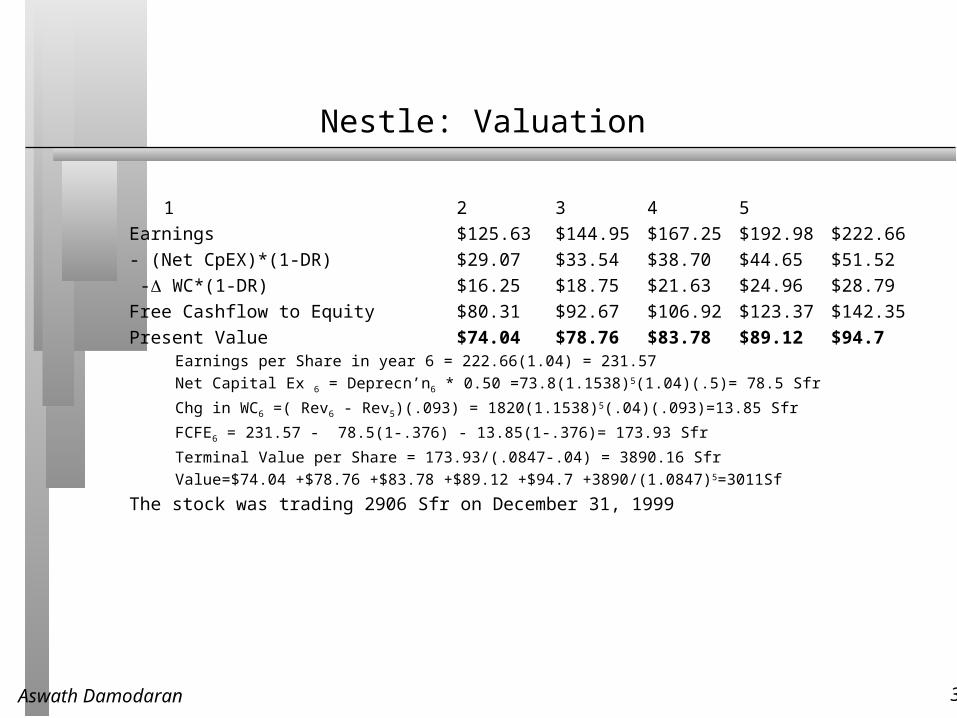
Nestle: Valuation
1 2 3 4 5
Earnings $125.63 $144.95 $167.25 $192.98 $222.66
- (Net CpEX)*(1-DR) $29.07 $33.54 $38.70 $44.65 $51.52
- WC*(1-DR) $16.25 $18.75 $21.63 $24.96 $28.79
Free Cashflow to Equity $80.31 $92.67 $106.92 $123.37 $142.35
Present Value $74.04 $78.76 $83.78 $89.12 $94.7
Earnings per Share in year 6 = 222.66(1.04) = 231.57
Net Capital Ex 6 = Deprecn’n6 * 0.50 =73.8(1.1538)5(1.04)(.5)= 78.5 Sfr
Chg in WC6 =( Rev6 - Rev5)(.093) = 1820(1.1538)5(.04)(.093)=13.85 Sfr
FCFE6 = 231.57 - 78.5(1-.376) - 13.85(1-.376)= 173.93 Sfr
Terminal Value per Share = 173.93/(.0847-.04) = 3890.16 Sfr
Value=$74.04 +$78.76 +$83.78 +$89.12 +$94.7 +3890/(1.0847)5=3011Sf
The stock was trading 2906 Sfr on December 31, 1999
Aswath Damodaran 32
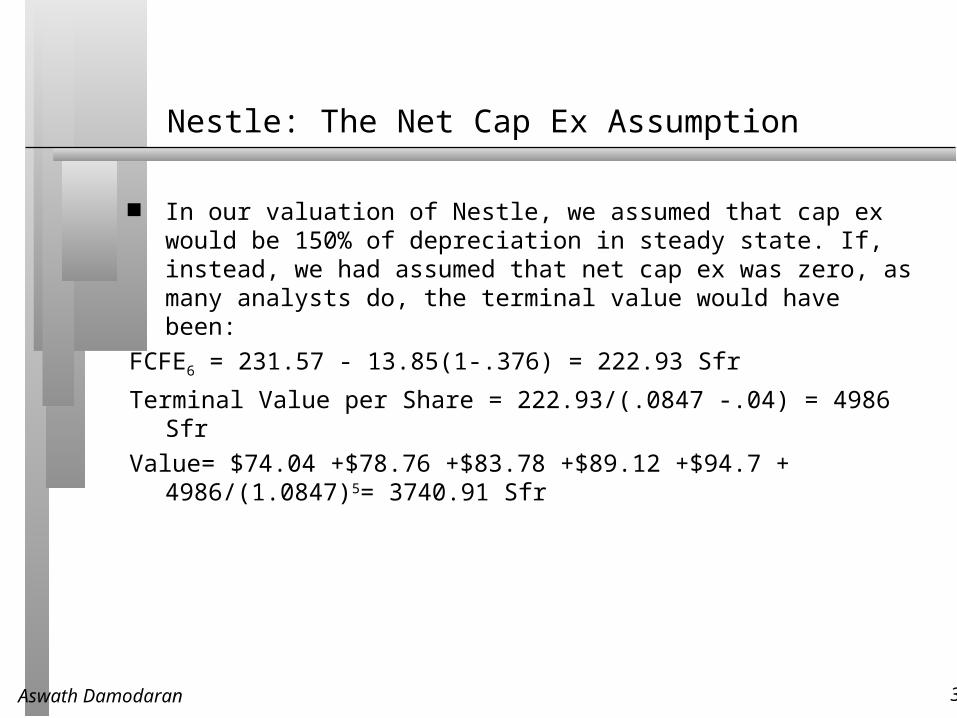
Nestle: The Net Cap Ex Assumption
In our valuation of Nestle, we assumed that cap ex would be 150% of depreciation in steady state. If, instead, we had assumed that net cap ex was zero, as many analysts do, the terminal value would have been:
FCFE6 = 231.57 - 13.85(1-.376) = 222.93 Sfr
Terminal Value per Share = 222.93/(.0847 -.04) = 4986 Sfr
Value= $74.04 +$78.76 +$83.78 +$89.12 +$94.7 + 4986/(1.0847)5= 3740.91 Sfr

Aswath Damodaran 33
Terminal Value= 173.93/(.0847-.04) = 3890
Cashflow to EquityNet Income 108.88- (Cap Ex - Depr) (1- DR) 25.19- Change in WC (!-DR) 4.41= FCFE 79.28
Expected GrowthRetention Ratio *Return on Equity=.651*.2363=15.38%
80.31 Sfr92.67 Sfr106.92 Sfr 123.37 Sfr142.35 SfrForeverFirm is in stable growth:g=4%; Beta=0.85;Cap Ex/Deprec=150%Debt ratio stays 37.6%
.........Cost of Equity4%+0.85(5.26%)=8.47%
Financing WeightsDebt Ratio = 37.6%Discount at Cost of EquityValue of Equity per Share = 3011 Sfr
Riskfree Rate :
Swiss franc rate = 4%
+Beta0.85XRisk Premium4% + 1.26%Bottom-up beta for food= 0.79Market D/E=11%Base EquityPremium: 4%Country RiskPremium:1.26%A VALUATION OF NESTLE (PER SHARE)
Aswath Damodaran 34
The Effects of New Information on Value
No valuation is timeless. Each of the inputs to the model are susceptible to change as new information comes out about the firm, its competitors and the overall economy.
• Market Wide Information– Interest Rates
– Risk Premiums
– Economic Growth
• Industry Wide Information– Changes in laws and regulations
– Changes in technology
• Firm Specific Information– New Earnings Reports
– Changes in the Fundamentals (Risk and Return characteristics)
Aswath Damodaran 35
Nestle: Effects of an Earnings Announcement
Assume that Nestle makes an earnings announcement which includes two pieces of news:
• The earnings per share come in lower than expected. The base year earnings per share will be 105.5 Sfr instead of 108.8 Sfr.
• Increased competition in its markets is putting downward pressure on the net profit margin. The after-tax margin, which was 5.98% in the previous analysis, is expected to shrink to 5.79%.
There are two effects on value:• The drop in earnings will make the projected earnings and cash flows lower, even if
the growth rate remains the same
• The drop in net margin will make the return on equity lower (assuming turnover ratios remain unchanged). This will reduce expected growth.
Aswath Damodaran 36
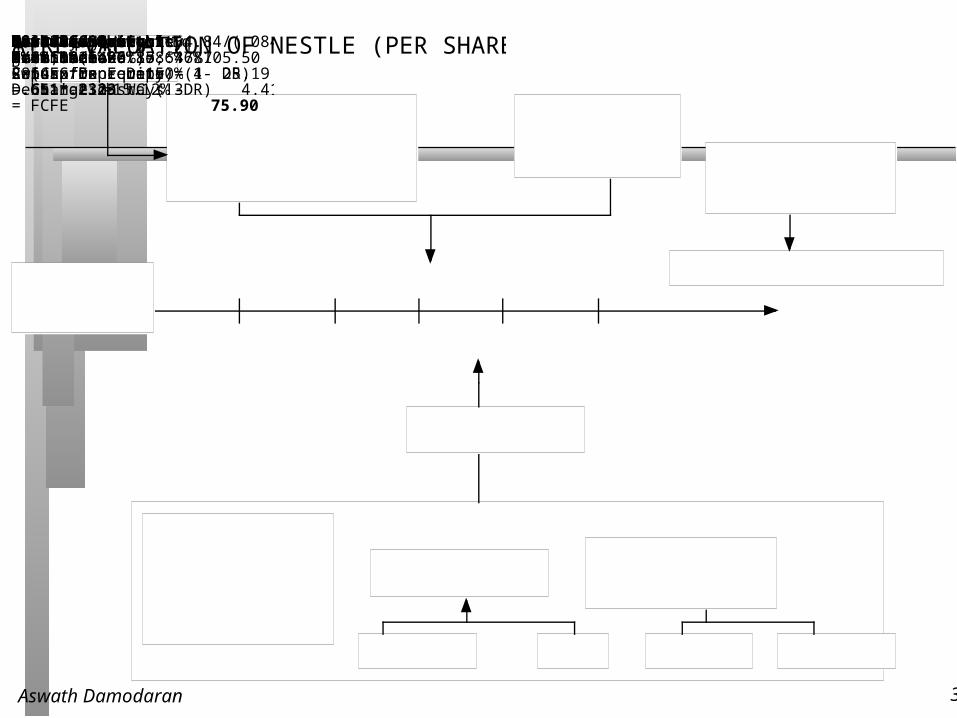
Terminal Value= 164.84/(.0847-.04) = 3687
Cashflow to EquityNet Income 105.50- (Cap Ex - Depr) (1- DR) 25.19- Change in WC (!-DR) 4.41= FCFE 75.90
Expected GrowthRetention Ratio *Return on Equity=.651*.2323 =15.12%
76.48 Sfr88.04 Sfr101.35 Sfr 116.68 Sfr134.32 SfrForeverFirm is in stable growth:g=4%; Beta=0.85;Cap Ex/Deprec=150%Debt ratio stays 37.6%
.........Cost of Equity4%+0.85(5.26%)=8.47%Financing WeightsDebt Ratio = 37.6%Discount at Cost of EquityValue of Equity per Share = 2854 Sfr
Riskfree Rate :
Swiss franc rate = 4%
+Beta0.85XRisk Premium4% + 1.26%Bottom-up beta for food= 0.79Market D/E=11%Base EquityPremium: 4%Country RiskPremium:1.26%A RE-VALUATION OF NESTLE (PER SHARE)
Aswath Damodaran 37
Tsingtao Breweries: Rationale for Using Model: June 2001
Why three stage? Tsingtao is a small firm serving a huge and growing market – China, in particular, and the rest of Asia, in general. The firm’s current return on equity is low, and we anticipate that it will improve over the next 5 years. As it increases, earnings growth will be pushed up.
Why FCFE? Corporate governance in China tends to be weak and dividends are unlikely to reflect free cash flow to equity. In addition, the firm consistently funds a portion of its reinvestment needs with new debt issues.
Aswath Damodaran 38
Background Information
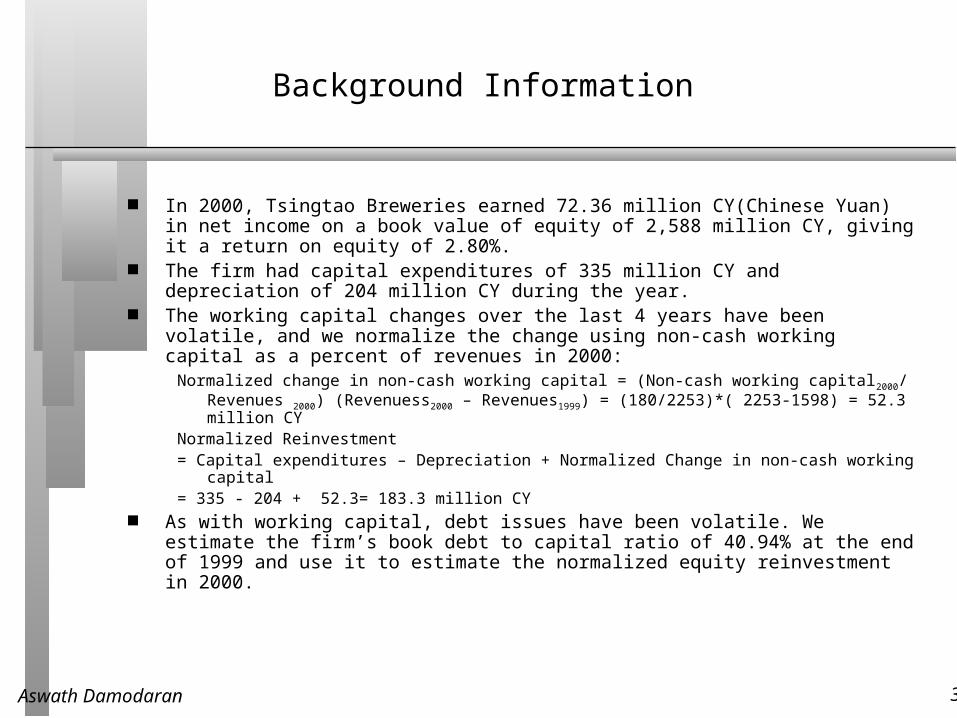
In 2000, Tsingtao Breweries earned 72.36 million CY(Chinese Yuan) in net income on a book value of equity of 2,588 million CY, giving it a return on equity of 2.80%.
The firm had capital expenditures of 335 million CY and depreciation of 204 million CY during the year.
The working capital changes over the last 4 years have been volatile, and we normalize the change using non-cash working capital as a percent of revenues in 2000:
Normalized change in non-cash working capital = (Non-cash working capital2000/ Revenues 2000) (Revenuess2000 – Revenues1999) = (180/2253)*( 2253-1598) = 52.3 million CY
Normalized Reinvestment = Capital expenditures – Depreciation + Normalized Change in non-cash working capital = 335 - 204 + 52.3= 183.3 million CY
As with working capital, debt issues have been volatile. We estimate the firm’s book debt to capital ratio of 40.94% at the end of 1999 and use it to estimate the normalized equity reinvestment in 2000.
Aswath Damodaran 39
Inputs for the 3 Stages
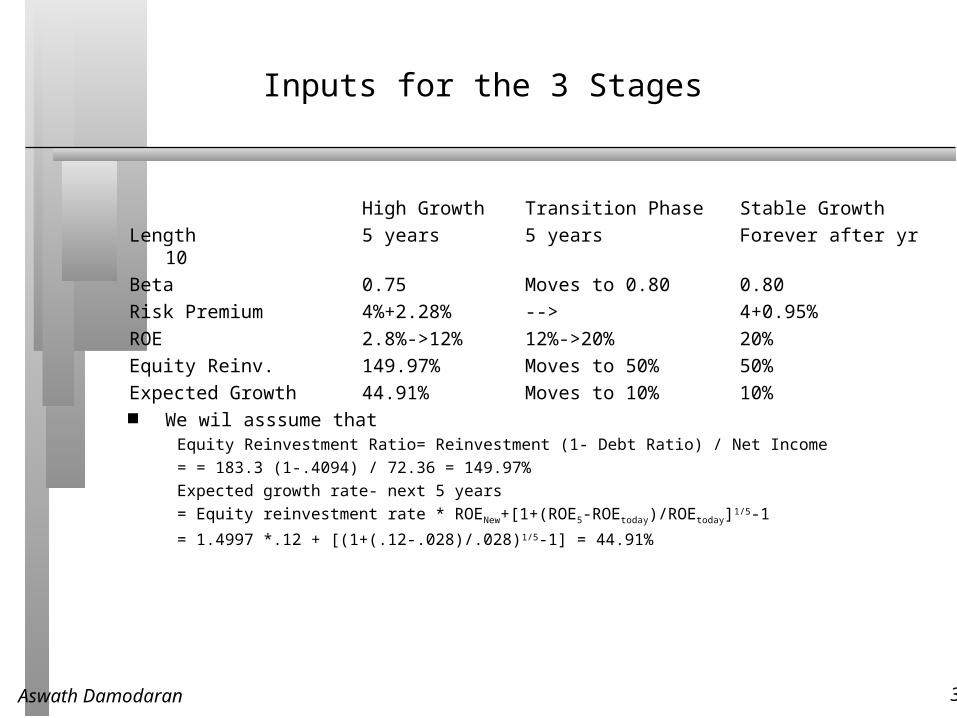
High Growth Transition Phase Stable Growth
Length 5 years 5 years Forever after yr 10
Beta0.75 Moves to 0.80 0.80
Risk Premium 4%+2.28% --> 4+0.95%
ROE 2.8%->12% 12%->20% 20%
Equity Reinv. 149.97% Moves to 50% 50%
Expected Growth 44.91% Moves to 10% 10% We wil asssume that
Equity Reinvestment Ratio= Reinvestment (1- Debt Ratio) / Net Income
= = 183.3 (1-.4094) / 72.36 = 149.97%
Expected growth rate- next 5 years
= Equity reinvestment rate * ROENew+[1+(ROE5-ROEtoday)/ROEtoday]1/5-1
= 1.4997 *.12 + [(1+(.12-.028)/.028)1/5-1] = 44.91%
Aswath Damodaran 40
Tsingtao: Projected Cash Flows
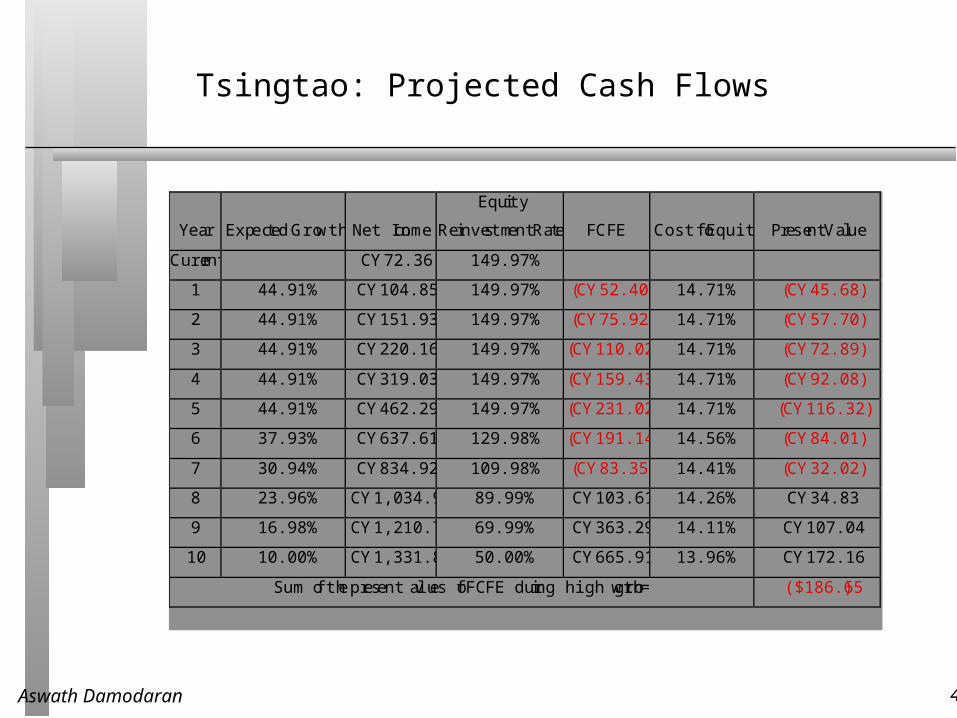
Year Expected Growth Net Income
Equity
Reinvestment Rate FCFE Cost of Equity Present Value
Current CY72.36 149.97%
1 44.91% CY104.85 149.97% (CY52.40) 14.71% (CY45.68)
2 44.91% CY151.93 149.97% (CY75.92) 14.71% (CY57.70)
3 44.91% CY220.16 149.97% (CY110.02) 14.71% (CY72.89)
4 44.91% CY319.03 149.97% (CY159.43) 14.71% (CY92.08)
5 44.91% CY462.29 149.97% (CY231.02) 14.71% (CY116.32)
6 37.93% CY637.61 129.98% (CY191.14) 14.56% (CY84.01)
7 30.94% CY834.92 109.98% (CY83.35) 14.41% (CY32.02)
8 23.96% CY1,034.98 89.99% CY103.61 14.26% CY34.83
9 16.98% CY1,210.74 69.99% CY363.29 14.11% CY107.04
10 10.00% CY1,331.81 50.00% CY665.91 13.96% CY172.16
Sum of the present values of FCFE during high growth = ($186.65)
Aswath Damodaran 41
Tsingtao: Terminal Value
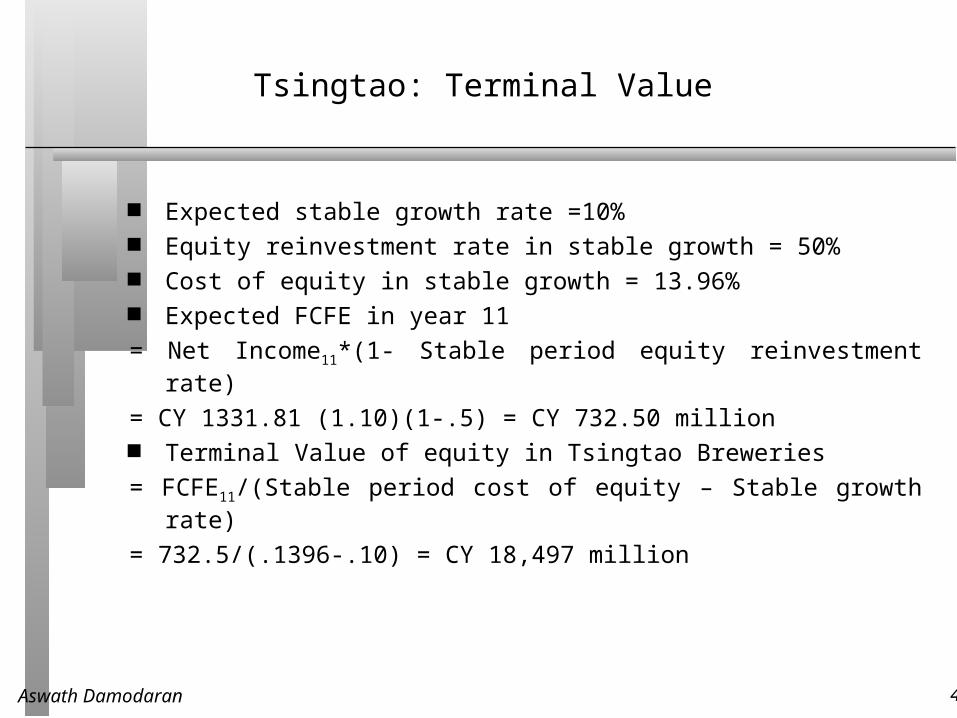
Expected stable growth rate =10% Equity reinvestment rate in stable growth = 50% Cost of equity in stable growth = 13.96% Expected FCFE in year 11
= Net Income11*(1- Stable period equity reinvestment rate)
= CY 1331.81 (1.10)(1-.5) = CY 732.50 million Terminal Value of equity in Tsingtao Breweries
= FCFE11/(Stable period cost of equity – Stable growth rate)
= 732.5/(.1396-.10) = CY 18,497 million
Aswath Damodaran 42
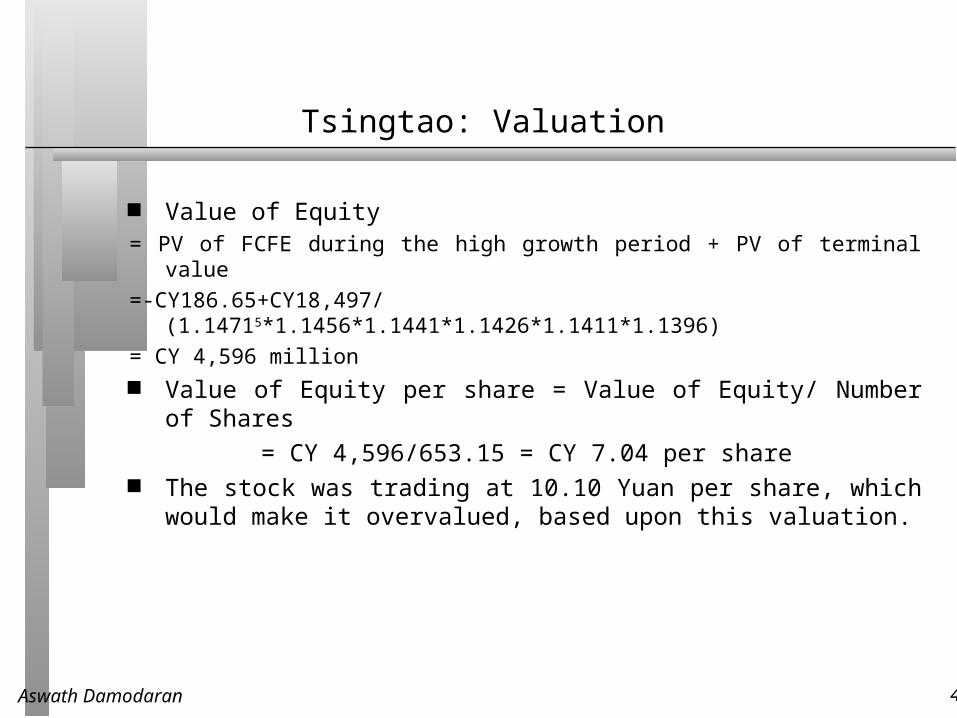
Tsingtao: Valuation
Value of Equity = PV of FCFE during the high growth period + PV of terminal value
=-CY186.65+CY18,497/(1.14715*1.1456*1.1441*1.1426*1.1411*1.1396)
= CY 4,596 million Value of Equity per share = Value of Equity/ Number of Shares
= CY 4,596/653.15 = CY 7.04 per share The stock was trading at 10.10 Yuan per share, which would make it
overvalued, based upon this valuation.
Aswath Damodaran 43
DaimlerChrysler: Rationale for Model June 2000
DaimlerChrysler is a mature firm in a mature industry. We will therefore assume that the firm is in stable growth.
Since this is a relatively new organization, with two different cultures on the use of debt (Daimler has traditionally been more conservative and bank-oriented in its use of debt than Chrysler), the debt ratio will probably change over time. Hence, we will use the FCFF model.
Aswath Damodaran 44
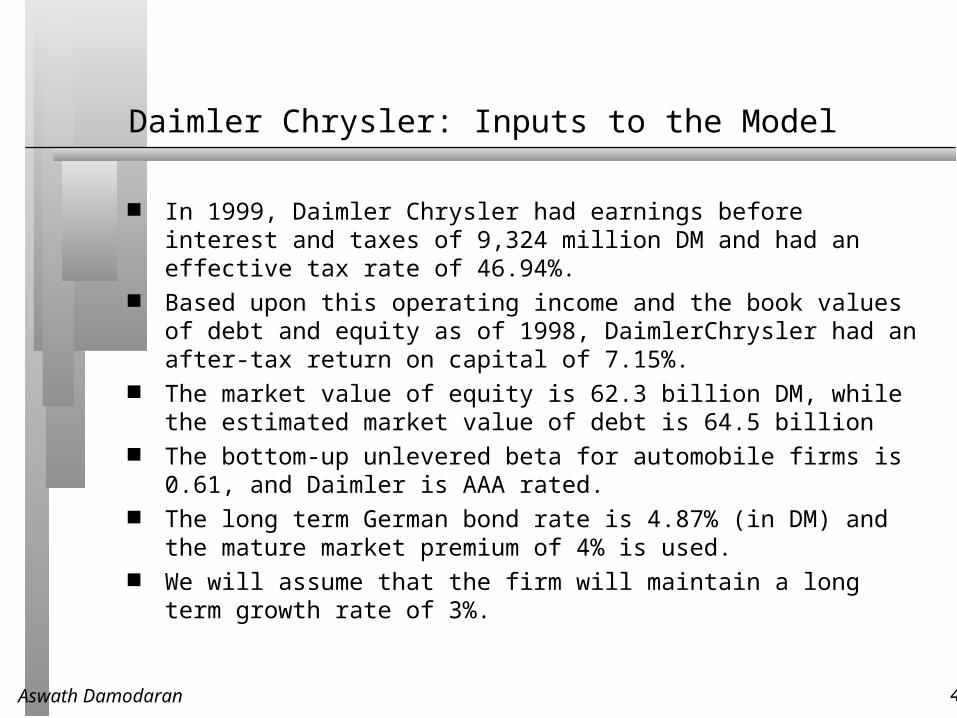
Daimler Chrysler: Inputs to the Model
In 1999, Daimler Chrysler had earnings before interest and taxes of 9,324 million DM and had an effective tax rate of 46.94%.
Based upon this operating income and the book values of debt and equity as of 1998, DaimlerChrysler had an after-tax return on capital of 7.15%.
The market value of equity is 62.3 billion DM, while the estimated market value of debt is 64.5 billion
The bottom-up unlevered beta for automobile firms is 0.61, and Daimler is AAA rated.
The long term German bond rate is 4.87% (in DM) and the mature market premium of 4% is used.
We will assume that the firm will maintain a long term growth rate of 3%.
Aswath Damodaran 45
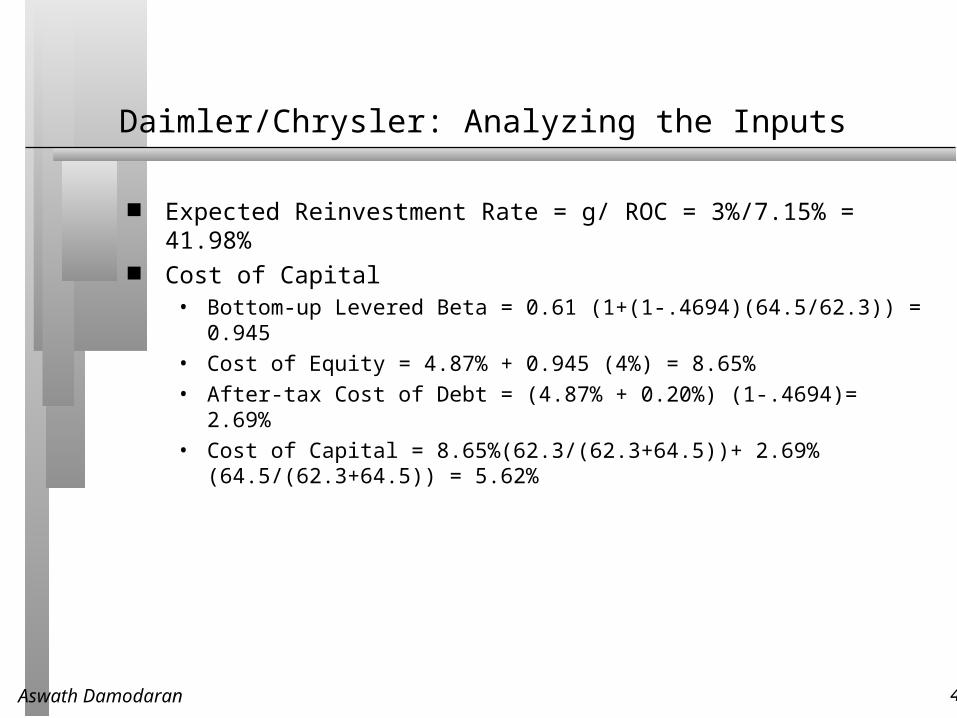
Daimler/Chrysler: Analyzing the Inputs
Expected Reinvestment Rate = g/ ROC = 3%/7.15% = 41.98% Cost of Capital
• Bottom-up Levered Beta = 0.61 (1+(1-.4694)(64.5/62.3)) = 0.945
• Cost of Equity = 4.87% + 0.945 (4%) = 8.65%
• After-tax Cost of Debt = (4.87% + 0.20%) (1-.4694)= 2.69%
• Cost of Capital = 8.65%(62.3/(62.3+64.5))+ 2.69% (64.5/(62.3+64.5)) = 5.62%
Aswath Damodaran 46
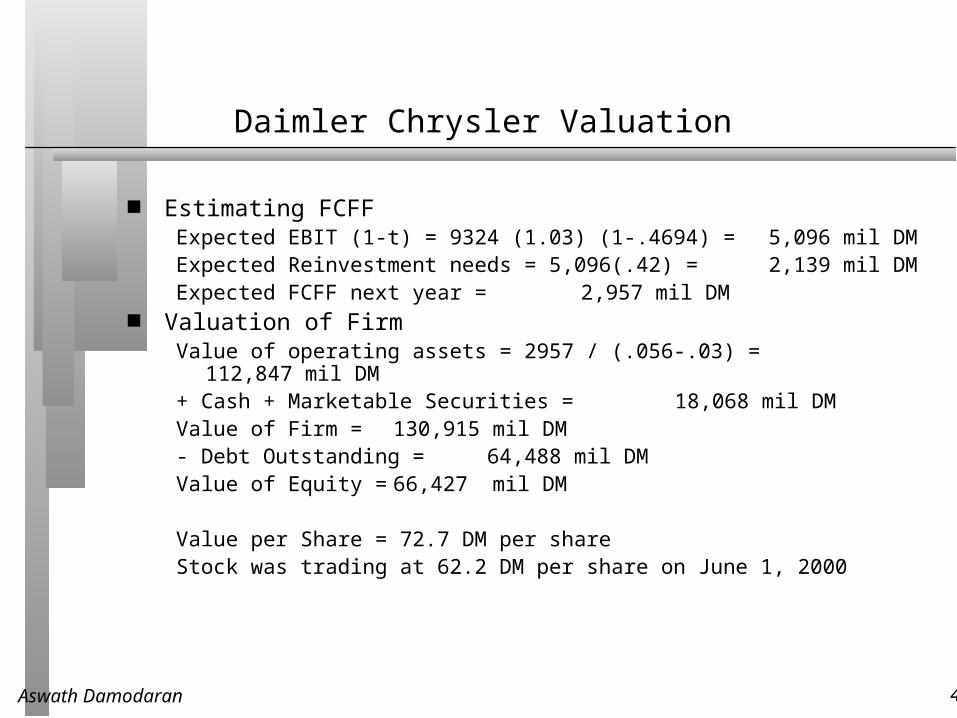
Daimler Chrysler Valuation
Estimating FCFFExpected EBIT (1-t) = 9324 (1.03) (1-.4694) = 5,096 mil DMExpected Reinvestment needs = 5,096(.42) = 2,139 mil DMExpected FCFF next year = 2,957 mil DM
Valuation of FirmValue of operating assets = 2957 / (.056-.03) = 112,847 mil DM+ Cash + Marketable Securities = 18,068 mil DMValue of Firm = 130,915 mil DM- Debt Outstanding = 64,488 mil DMValue of Equity = 66,427 mil DM
Value per Share = 72.7 DM per shareStock was trading at 62.2 DM per share on June 1, 2000
Aswath Damodaran 47
Circular Reasoning in FCFF Valuation
In discounting FCFF, we use the cost of capital, which is calculated using the market values of equity and debt. We then use the present value of the FCFF as our value for the firm and derive an estimated value for equity. Is there circular reasoning here?
Yes No If there is, can you think of a way around this problem?
Aswath Damodaran 48
Tube Investment: Rationale for Using 2-Stage FCFF Model - June 2000
Tube Investments is a diversified manufacturing firm in India. While its growth rate has been anemic, there is potential for high growth over the next 5 years.
The firm’s financing policy is also in a state of flux as the family running the firm reassesses its policy of funding the firm.
Aswath Damodaran 49
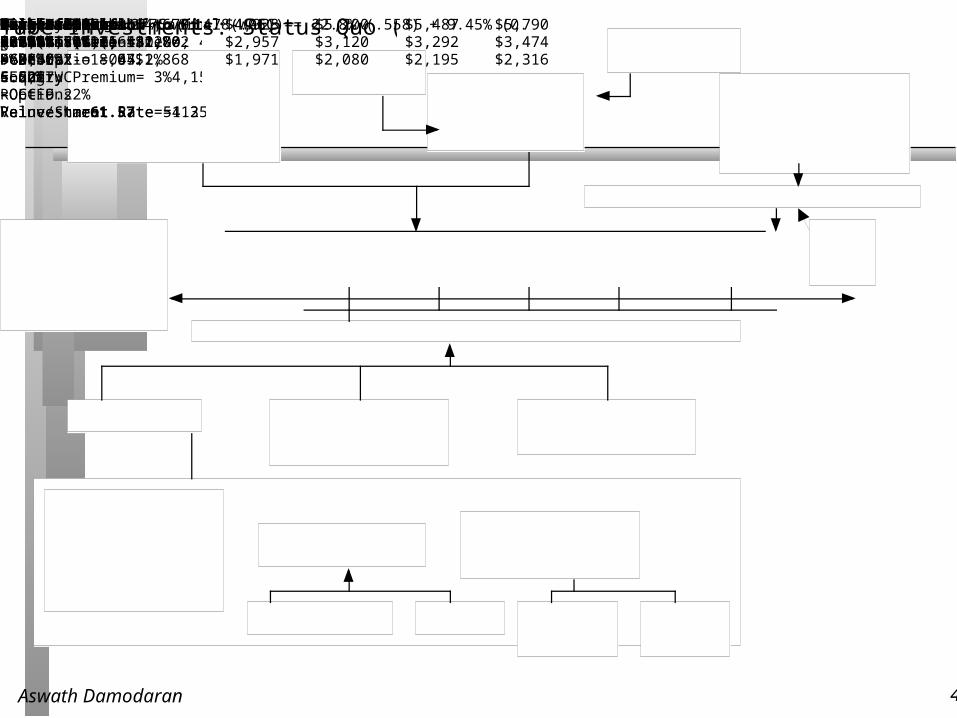
Current Cashflow to FirmEBIT(1-t) : 4,425- Nt CpX 843- Chg WC 4,150= FCFF - 568Reinvestment Rate =112.82%
Expected Growth in EBIT (1-t).60*.092-= .05525.52 %
Stable Growthg = 5%; Beta = 1.00;Debt ratio = 44.2%Country Premium= 3% ROC= 9.22%Reinvestment Rate=54.35%
Terminal Value 5= 2775/(.1478-.05) = 28,378Cost of Equity22.80%Cost of Debt(12%+1.50%)(1-.30)= 9.45%
WeightsE = 55.8% D = 44.2%Discount at Cost of Capital (WACC) = 22.8% (.558) + 9.45% (0.442) = 16.90%Firm Value: 19,578+ Cash: 13,653- Debt: 18,073=Equity 15,158-Options 0Value/Share 61.57
Riskfree Rate :Real riskfree rate = 12%+Beta 1.17XRisk Premium9.23%Unlevered Beta for Sectors: 0.75Firm’s D/ERatio: 79%Mature riskpremium4%
Country RiskPremium5.23%
Tube Investments: Status Quo (in Rs) Reinvestment Rate60%Return on Capital9.20%Term Yr 6,079 3,304 2,775
EBIT(1-t) $4,670 $4,928 $5,200 $5,487 $5,790 - Reinvestment $2,802 $2,957 $3,120 $3,292 $3,474 FCFF $1,868 $1,971 $2,080 $2,195 $2,316
Aswath Damodaran 50
Stable Growth Rate and Value
In estimating terminal value for Tube Investments, I used a stable growth rate of 5%. If I used a 7% stable growth rate instead, what would my terminal value be? (Assume that the cost of capital and return on capital remain unchanged.)
Aswath Damodaran 51
The Effects of Return Improvements on Value
The firm is considering changes in the way in which it invests, which management believes will increase the return on capital to 12.20% on just new investments (and not on existing investments) over the next 5 years.
The value of the firm will be higher, because of higher expected growth.
Aswath Damodaran 52
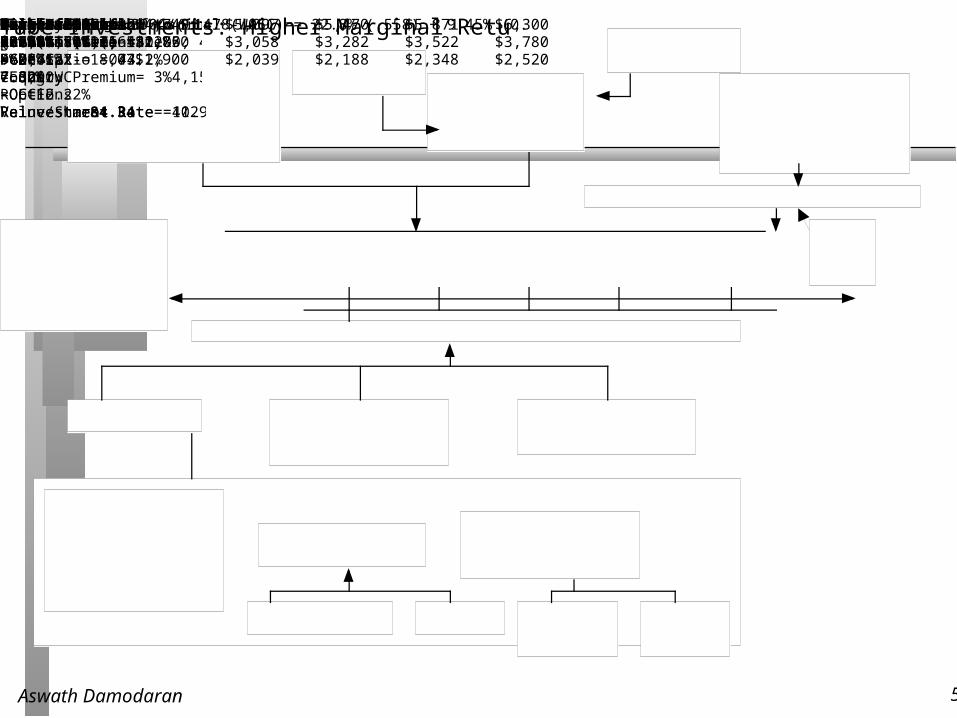
Current Cashflow to FirmEBIT(1-t) : 4,425- Nt CpX 843- Chg WC 4,150= FCFF - 568Reinvestment Rate =112.82%
Expected Growth in EBIT (1-t).60*.122-= .07327.32 %
Stable Growthg = 5%; Beta = 1.00;Debt ratio = 44.2%Country Premium= 3% ROC=12.22%Reinvestment Rate= 40.98%
Terminal Value 5= 3904/(.1478-.05) = 39.921Cost of Equity22.80%Cost of Debt(12%+1.50%)(1-.30)= 9.45%
WeightsE = 55.8% D = 44.2%Discount at Cost of Capital (WACC) = 22.8% (.558) + 9.45% (0.442) = 16.90%Firm Value: 25,185+ Cash: 13,653- Debt: 18,073=Equity 20,765-Options 0Value/Share 84.34
Riskfree Rate :Real riskfree rate = 12%+Beta 1.17XRisk Premium9.23%Unlevered Beta for Sectors: 0.75Firm’s D/ERatio: 79%Mature riskpremium4%
Country RiskPremium5.23%
Tube Investments: Higher Marginal Return(in Rs) Reinvestment Rate60%Return on Capital12.20%Term Yr 6,615 2,711 3,904
EBIT(1-t) $4,749 $5,097 $5,470 $5,871 $6,300 - Reinvestment $2,850 $3,058 $3,282 $3,522 $3,780 FCFF $1,900 $2,039 $2,188 $2,348 $2,520
Aswath Damodaran 53
Return Improvements on Existing Assets
If Tube Investments is also able to increase the return on capital on existing assets to 12.20% from 9.20%, its value will increase even more.
The expected growth rate over the next 5 years will then have a second component arising from improving returns on existing assets:
Expected Growth Rate = .122*.60 +{ (1+(.122-.092)/.092)1/5-1}
=.1313 or 13.13%
Aswath Damodaran 54
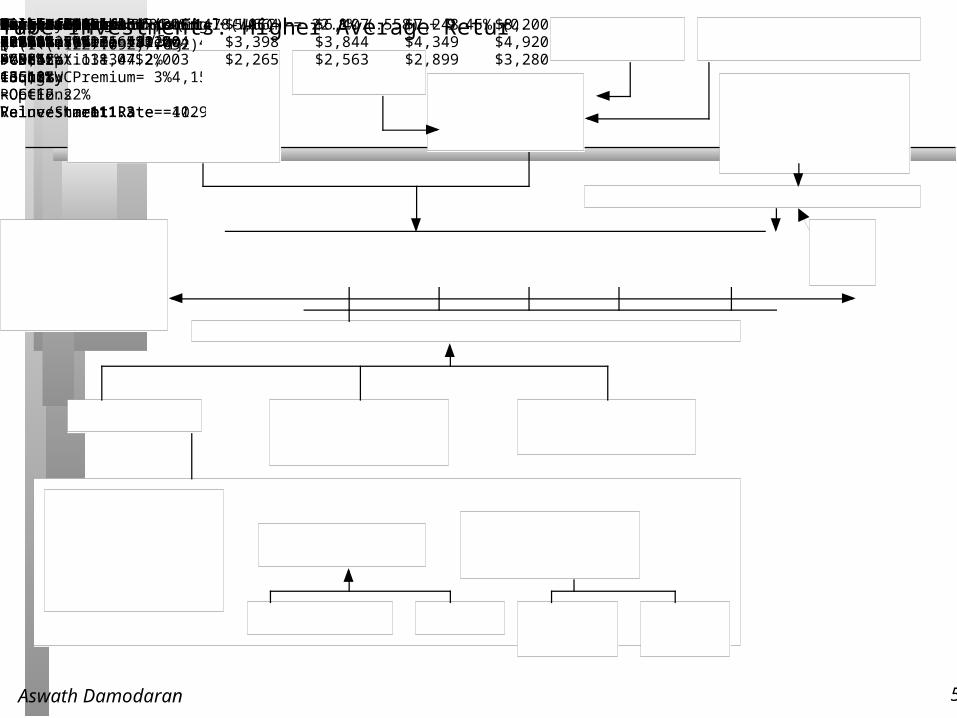
Current Cashflow to FirmEBIT(1-t) : 4,425- Nt CpX 843- Chg WC 4,150= FCFF - 568Reinvestment Rate =112.82%
Expected Growth 60*.122 + .0581 = .131313.13 %
Stable Growthg = 5%; Beta = 1.00;Debt ratio = 44.2%Country Premium= 3% ROC=12.22%Reinvestment Rate= 40.98%
Terminal Value 5= 5081/(.1478-.05) = 51,956Cost of Equity22.80%Cost of Debt(12%+1.50%)(1-.30)= 9.45%
WeightsE = 55.8% D = 44.2%Discount at Cost of Capital (WACC) = 22.8% (.558) + 9.45% (0.442) = 16.90%Firm Value: 31,829+ Cash: 13,653- Debt: 18,073=Equity 27,409-Options 0Value/Share 111.3
Riskfree Rate :Real riskfree rate = 12%+Beta 1.17XRisk Premium9.23%Unlevered Beta for Sectors: 0.75Firm’s D/ERatio: 79%Mature riskpremium4%
Country RiskPremium5.23%
Tube Investments: Higher Average Return(in Rs) Reinvestment Rate60%Return on Capital12.20%Term Yr 8,610 3,529 5,081
EBIT(1-t) $5,006 $5,664 $6,407 $7,248 $8,200 - Reinvestment $3,004 $3,398 $3,844 $4,349 $4,920 FCFF $2,003 $2,265 $2,563 $2,899 $3,280
Improvement on existing assets{ (1+(.122-.092)/.092) 1/5-1}
Aswath Damodaran 55
Tube Investments and Tsingtao: Should there be a corporate governance discount?
Stockholders in Asian, Latin American and many European companies have little or no power over the managers of the firm. In many cases, insiders own voting shares and control the firm and the potential for conflict of interests is huge. Would you discount the value that you estimated to allow for this absence of stockholder power?
Yes No.

Aswath Damodaran 56
Embraer: An Emerging Market Company? A Valuation in October 2003
We will use a 2-stage FCFF model to value Embraer to allow for maximum flexibility.
High Growth Stable GrowthBeta 1.07 1.00
Lambda 0.27 0.27
Counry risk premium 7.67% 5.00%
Debt Ratio 15.93% 15.93%
Return on Capital 21.85% 8.76%
Cost of Capital 9.81% 8.76%
Expected Growth Rate 5.48% 4.17%
Reinvestment Rate 25.04% 4.17%/8.76% = 47.62%
Aswath Damodaran 57
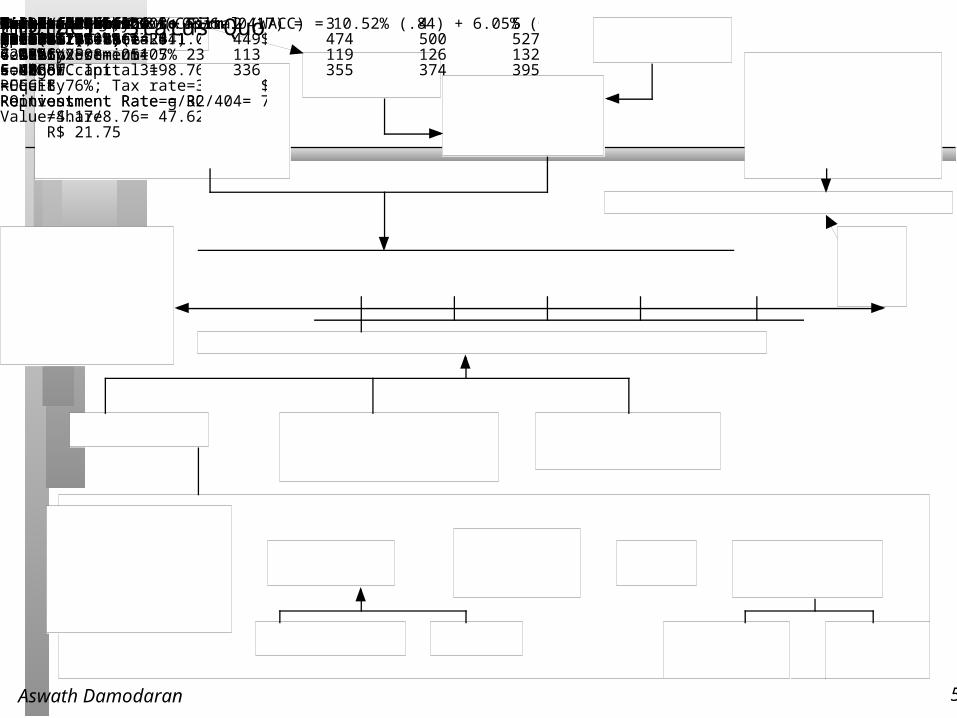
Current Cashflow to FirmEBIT(1-t) : $ 404- Nt CpX 23 - Chg WC 9= FCFF $ 372Reinvestment Rate = 32/404= 7.9%
Expected Growth in EBIT (1-t).2185*.2508=.05485.48%
Stable Growthg = 4.17%; Beta = 1.00;Country Premium= 5%Cost of capital = 8.76% ROC= 8.76%; Tax rate=34%Reinvestment Rate=g/ROC
=4.17/8.76= 47.62%
Terminal Value5= 288/(.0876-.0417) = 6272Cost of Equity10.52 %Cost of Debt(4.17%+1%+4%)(1-.34)= 6.05%
WeightsE = 84% D = 16%Discount at $ Cost of Capital (WACC) = 10.52% (.84) + 6.05% (0.16) = 9.81%Op. Assets $ 5,272+ Cash: 795- Debt 717- Minor. Int. 12=Equity 5,349-Options 28Value/Share $7.47
R$ 21.75
Riskfree Rate :$ Riskfree Rate= 4.17%+Beta 1.07XMature market premium 4 %
Unlevered Beta for Sectors: 0.95Firm’s D/ERatio: 19%Embraer: Status Quo ($) Reinvestment Rate 25.08%Return on Capital21.85%Term Yr 549 - 261= 288
Avg Reinvestment rate = 25.08%Year 1 2 3 4 5EBIT(1-t) 426 449 474 500 527 - Reinvestment 107 113 119 126 132 = FCFF 319 336 355 374 395
+ Lambda0.27XCountry Equity RiskPremium7.67%
Country Default Spread6.01%
XRel Equity Mkt Vol1.28On October 6, 2003Embraer Price = R$15.51$ Cashflows
Aswath Damodaran 58
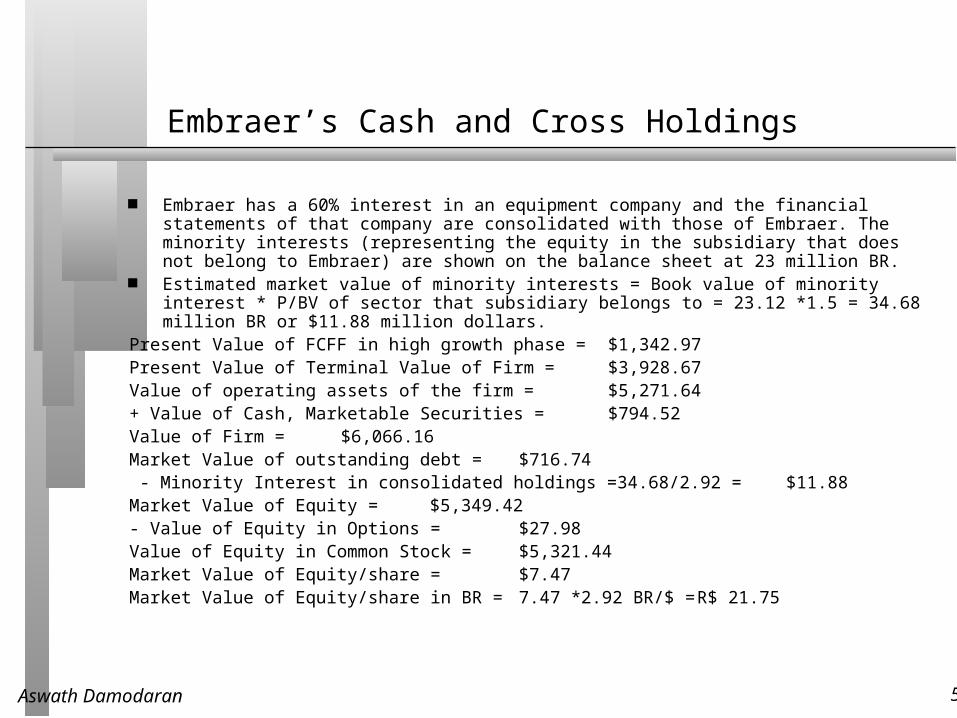
Embraer’s Cash and Cross Holdings
Embraer has a 60% interest in an equipment company and the financial statements of that company are consolidated with those of Embraer. The minority interests (representing the equity in the subsidiary that does not belong to Embraer) are shown on the balance sheet at 23 million BR.
Estimated market value of minority interests = Book value of minority interest * P/BV of sector that subsidiary belongs to = 23.12 *1.5 = 34.68 million BR or $11.88 million dollars.
Present Value of FCFF in high growth phase = $1,342.97 Present Value of Terminal Value of Firm = $3,928.67 Value of operating assets of the firm = $5,271.64 + Value of Cash, Marketable Securities = $794.52 Value of Firm = $6,066.16 Market Value of outstanding debt = $716.74 - Minority Interest in consolidated holdings =34.68/2.92 = $11.88 Market Value of Equity = $5,349.42 - Value of Equity in Options = $27.98 Value of Equity in Common Stock = $5,321.44 Market Value of Equity/share = $7.47 Market Value of Equity/share in BR = 7.47 *2.92 BR/$ = R$ 21.75
Aswath Damodaran 59
Dealing with Distress
A DCF valuation values a firm as a going concern. If there is a significant likelihood of the firm failing before it reaches stable growth and if the assets will then be sold for a value less than the present value of the expected cashflows (a distress sale value), DCF valuations will understate the value of the firm.
Value of Equity= DCF value of equity (1 - Probability of distress) + Distress sale value of equity (Probability of distress)
There are three ways in which we can estimate the probability of distress:• Use the bond rating to estimate the cumulative probability of distress over 10 years
• Estimate the probability of distress with a probit
• Estimate the probability of distress by looking at market value of bonds..
The distress sale value of equity is usually best estimated as a percent of book value (and this value will be lower if the economy is doing badly and there are other firms in the same business also in distress).
Aswath Damodaran 60
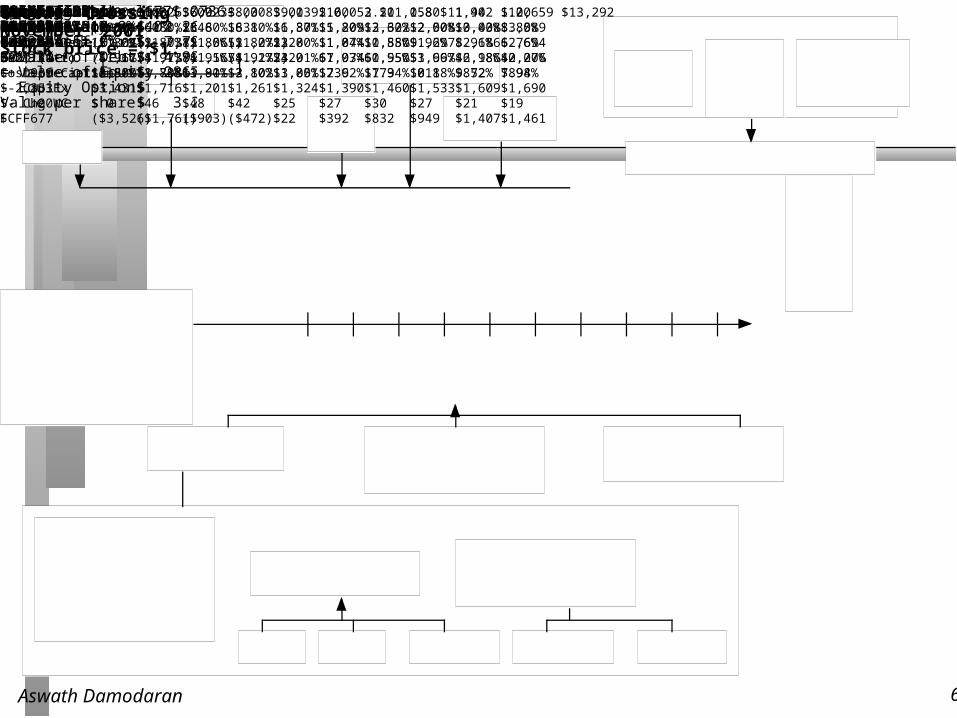
ForeverTerminal Value= 677(.0736-.05)=$ 28,683Cost of Equity16.80%Cost of Debt4.8%+8.0%=12.8%Tax rate = 0% -> 35%
WeightsDebt= 74.91% -> 40%Value of Op Assets $ 5,530+ Cash & Non-op $ 2,260= Value of Firm $ 7,790- Value of Debt $ 4,923= Value of Equity $ 2867- Equity Options $ 14Value per share $ 3.22
Riskfree Rate :T. Bond rate = 4.8%+Beta3.00> 1.10XRisk Premium4%Internet/RetailOperating LeverageCurrent D/E: 441%Base EquityPremiumCountry RiskPremiumCurrentRevenue$ 3,804
CurrentMargin:-49.82%
Revenue Growth:13.33%
EBITDA/Sales -> 30%Stable GrowthStableRevenueGrowth: 5%
StableEBITDA/Sales 30%
Stable ROC=7.36%Reinvest 67.93%
EBIT-1895mNOL:2,076m$13,902$ 4,187$ 3,248$ 2,111$ 939$ 2,353$ 20$ 677
Term. Year24315689107Global CrossingNovember 2001Stock price = $1.86
Cap ex growth slows and net cap ex decreases
Beta 3.00 3.00 3.00 3.00 3.00 2.60 2.20 1.80 1.40 1.00Cost of Equity 16.80% 16.80% 16.80% 16.80% 16.80% 15.20% 13.60% 12.00% 10.40% 8.80%Cost of Debt 12.80% 12.80% 12.80% 12.80% 12.80% 11.84% 10.88% 9.92% 8.96% 6.76%Debt Ratio 74.91% 74.91% 74.91% 74.91% 74.91% 67.93% 60.95% 53.96% 46.98% 40.00%Cost of Capital 13.80% 13.80% 13.80% 13.80% 13.80% 12.92% 11.94% 10.88% 9.72% 7.98%
Revenues $3,804 $5,326 $6,923 $8,308 $9,139 $10,053 $11,058 $11,942 $12,659 $13,292 EBITDA ($95) $ 0 $346 $831 $1,371 $1,809 $2,322 $2,508 $3,038 $3,589 EBIT ($1,675) ($1,738) ($1,565) ($1,272) $320 $1,074 $1,550 $1,697 $2,186 $2,694 EBIT (1-t) ($1,675) ($1,738) ($1,565) ($1,272) $320 $1,074 $1,550 $1,697 $2,186 $2,276 + Depreciation $1,580 $1,738 $1,911 $2,102 $1,051 $736 $773 $811 $852 $894 - Cap Ex $3,431 $1,716 $1,201 $1,261 $1,324 $1,390 $1,460 $1,533 $1,609 $1,690 - Chg WC $ 0 $46 $48 $42 $25 $27 $30 $27 $21 $19 FCFF ($3,526) ($1,761) ($903) ($472) $22 $392 $832 $949 $1,407 $1,461
Aswath Damodaran 61
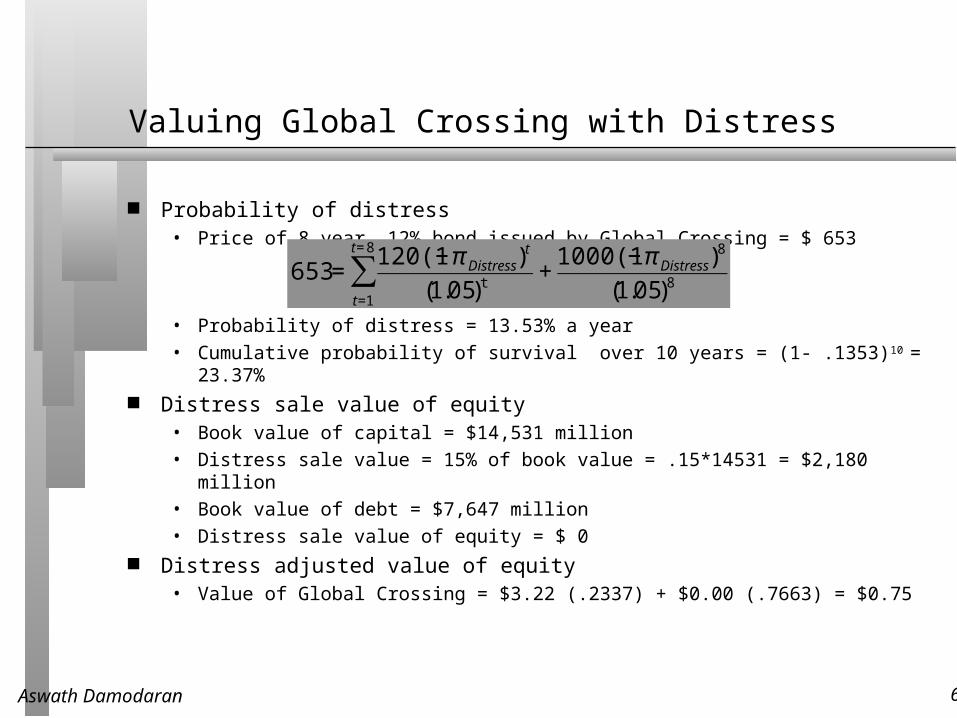
Valuing Global Crossing with Distress
Probability of distress• Price of 8 year, 12% bond issued by Global Crossing = $ 653
• Probability of distress = 13.53% a year
• Cumulative probability of survival over 10 years = (1- .1353)10 = 23.37% Distress sale value of equity
• Book value of capital = $14,531 million
• Distress sale value = 15% of book value = .15*14531 = $2,180 million
• Book value of debt = $7,647 million
• Distress sale value of equity = $ 0 Distress adjusted value of equity
• Value of Global Crossing = $3.22 (.2337) + $0.00 (.7663) = $0.75
€
653 =120(1− π Distress)
t
(1.05)tt=1
t= 8
∑ +1000(1− π Distress)
8
(1.05)8
Aswath Damodaran 62
More than one way to skin a cat…
In the conventional approach to firm valuation, we discount the cash flows back at a risk adjusted discount rate to arrive at value.
There are frequent claims from both academics and practitioners of better ways of doing discounted cash flow valuation. In particular, there are two alternatives offered to the classic discounted cash flow model
• The adjusted present value model, where we value the firm as if it were all equity funded and then add on the effects of debt (good and bad) to this value
• The excess return model, where we compute the present value of expected excess returns that the firm will earn and add it to the capital invested in the firm
Aswath Damodaran 63
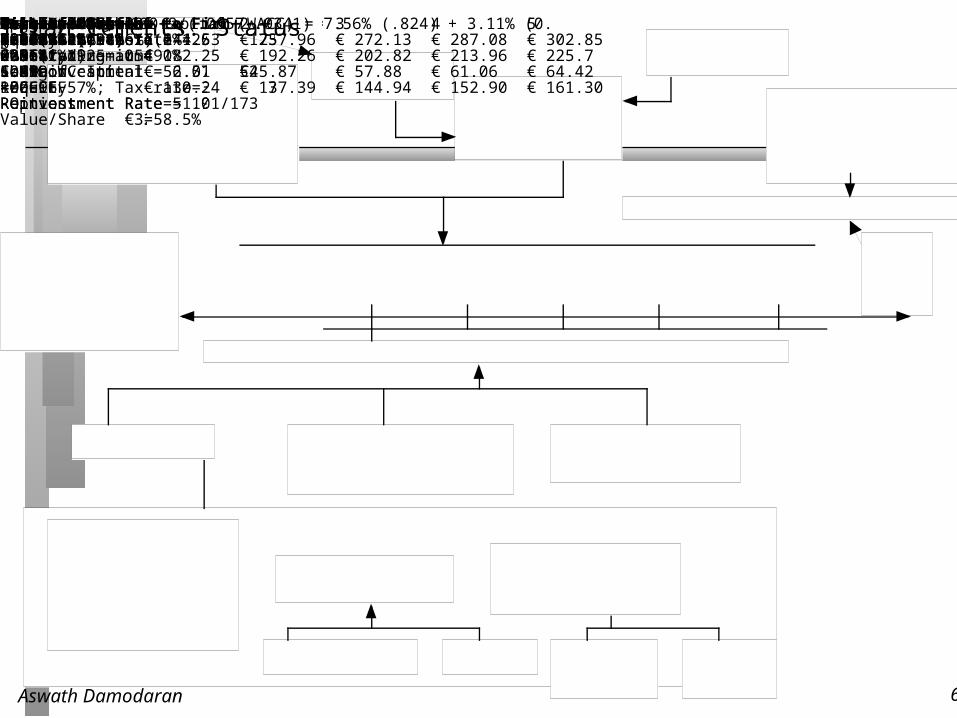
Current Cashflow to FirmEBIT(1-t) : 173- Nt CpX 49 - Chg WC 52= FCFF 72Reinvestment Rate = 101/173
=58.5%
Expected Growth in EBIT (1-t).2854*.1925=.05495.49%
Stable Growthg = 3.41%; Beta = 1.00;Country Premium= 0%Cost of capital = 6.57% ROC= 6.57%; Tax rate=33%Reinvestment Rate=51.93%
Terminal Value5= 100.9/(.0657-.0341) = 3195Cost of Equity7.56%Cost of Debt(3.41%+.5%+.26%)(1-.2547)= 3.11%
WeightsE = 82.4% D = 17.6%Discount at Cost of Capital (WACC) = 7.56% (.824) + 3.11% (0.176) = 6.78%Op. Assets 2,897+ Cash: 77- Debt 414- Minor. Int. 46=Equity 2,514-Options 0Value/Share €32.84
Riskfree Rate :Euro riskfree rate = 3.41%+Beta 0.93XRisk Premium4.46%Unlevered Beta for Sectors: 0.80Firm’s D/ERatio: 21.35%Mature riskpremium4%
Country Equity Prem0.46%
Titan Cements: Status Quo Reinvestment Rate 28.54%Return on Capital19.25%Term Yr313.2209.8108.9100.9
Avg Reinvestment rate = 28.54%Year 1 2 3 4 5EBIT € 244.53 € 257.96 € 272.13 € 287.08 € 302.85EBIT(1-t) € 182.25 € 192.26 € 202.82 € 213.96 € 225.7 - Reinvestment € 52.01 €45.87 € 57.88 € 61.06 € 64.42 = FCFF € 130.24 € 137.39 € 144.94 € 152.90 € 161.30
On April 27, 2005Titan Cement stockwas trading at € 25 a share
Aswath Damodaran 64
Adjusted Present Value Model
In the adjusted present value approach, the value of the firm is written as the sum of the value of the firm without debt (the unlevered firm) and the effect of debt on firm value
Firm Value = Unlevered Firm Value + (Tax Benefits of Debt - Expected Bankruptcy Cost from the Debt)
• The unlevered firm value can be estimated by discounting the free cashflows to the firm at the unlevered cost of equity
• The tax benefit of debt reflects the present value of the expected tax benefits. In its simplest form,
Tax Benefit = Tax rate * Debt• The expected bankruptcy cost is a function of the probability of bankruptcy and the
cost of bankruptcy (direct as well as indirect) as a percent of firm value.
Aswath Damodaran 65
An APV Valuation of Titan CementStep 1: Unlevered firm value
In the conventional approach, we valued Titan using the levered beta for the company of 0.93 and the debt to capital ratio of 17.6% to estimate a cost of capital for discounting the free cash flows to the firm.
the APV approach, we use the unlevered beta of 0.80 to estimate the unlevered cost of equity, For the first 5 years, with a riskfree rate of 3.41% and a risk premium of 4.46%, this yields a cost of equity of 6.98%.
• Unlevered cost of equity = 3.41% + 0.80(4.46%) = 6.98% Beyond year 5, we will use an unlevered beta of 0.875 to correspond with the
levered beta of 1 used in illustration 6.2. With the market risk premium reduced to 4%, this yields a cost of equity of 6.91%.
• The levered beta used in illustration 6.2 was 1, the debt to equity ratio assumed for the stable growth period was 21.36% and the tax rate was 33%.Unlevered beta = 1.00/ (1+(1-.33)(.2136)) = 0.875
• Unlevered stable period cost of equity = 3.41%+0.875 (4%) = 6.91%
Aswath Damodaran 66
The Unlevered Firm Value
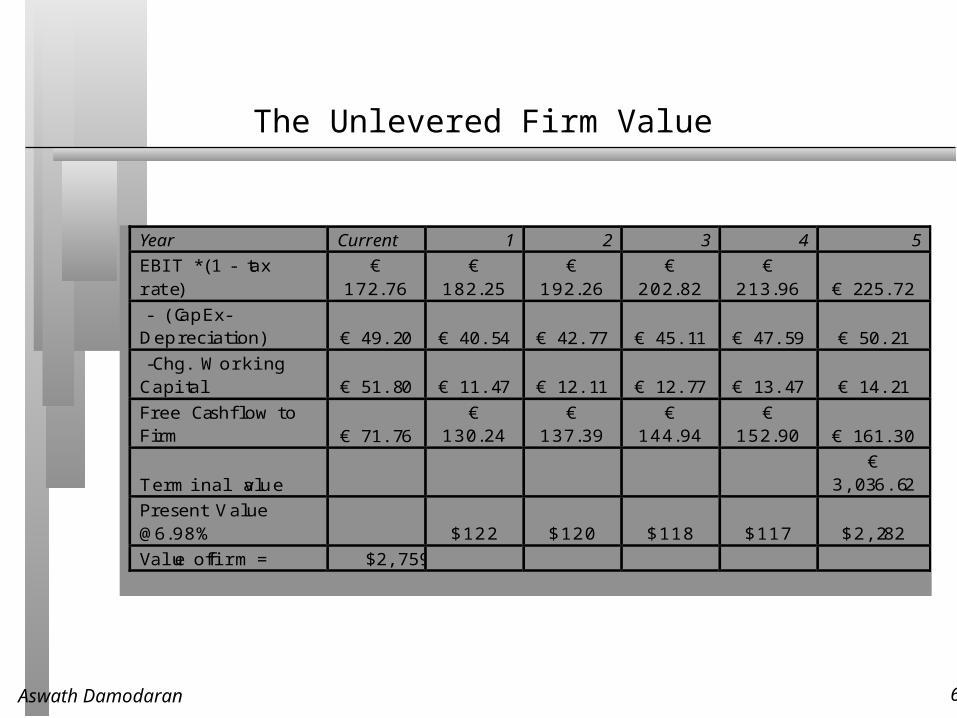
Year Current 1 2 3 4 5
EBIT * (1 - tax rate)
€ 172.76
€ 182.25
€ 192.26
€ 202.82
€ 213.96 € 2 25.72
- (CapEx-Depreciation) € 4 9.20 € 4 0.54 € 4 2.77 € 4 5.11 € 4 7.59 € 5 0.21
-Chg. Working Capital € 5 1.80 € 1 1.47 € 1 2.11 € 1 2.77 € 1 3.47 € 1 4.21
Free Cashflow to Fi rm € 7 1.76
€ 130.24
€ 137.39
€ 144.94
€ 152.90 € 1 61.30
Terminal v alue €
3,036.62
Present Value @6.98% $122 $120 $118 $117 $2,282
Value of firm = $2,759
Aswath Damodaran 67
The Tax Benefits of Debt
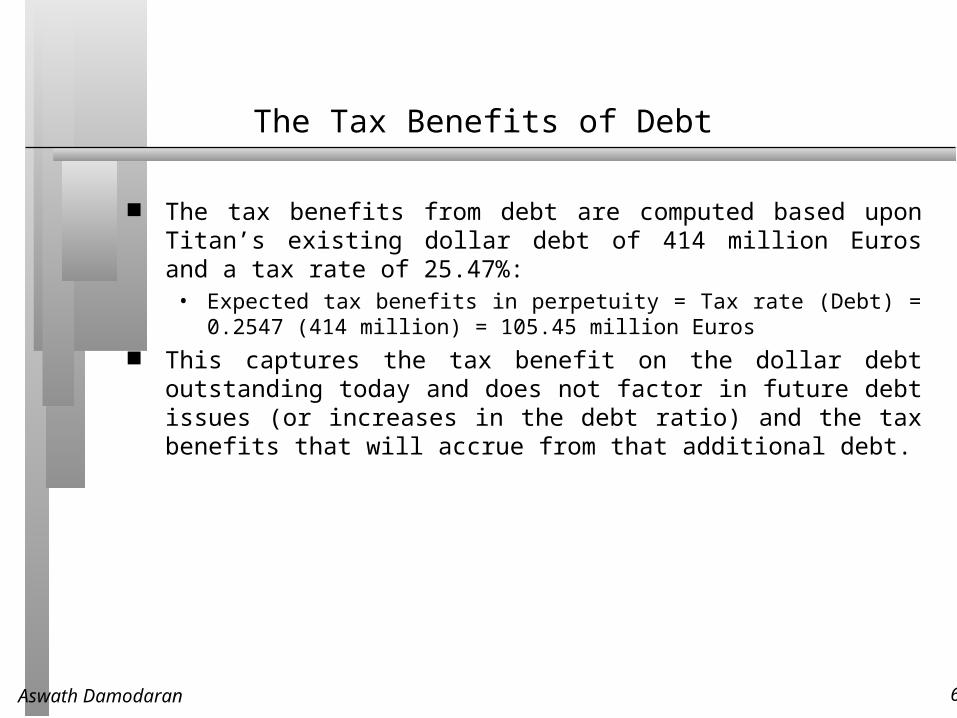
The tax benefits from debt are computed based upon Titan’s existing dollar debt of 414 million Euros and a tax rate of 25.47%:
• Expected tax benefits in perpetuity = Tax rate (Debt) = 0.2547 (414 million) = 105.45 million Euros
This captures the tax benefit on the dollar debt outstanding today and does not factor in future debt issues (or increases in the debt ratio) and the tax benefits that will accrue from that additional debt.
Aswath Damodaran 68
The Expected Bankruptcy Costs
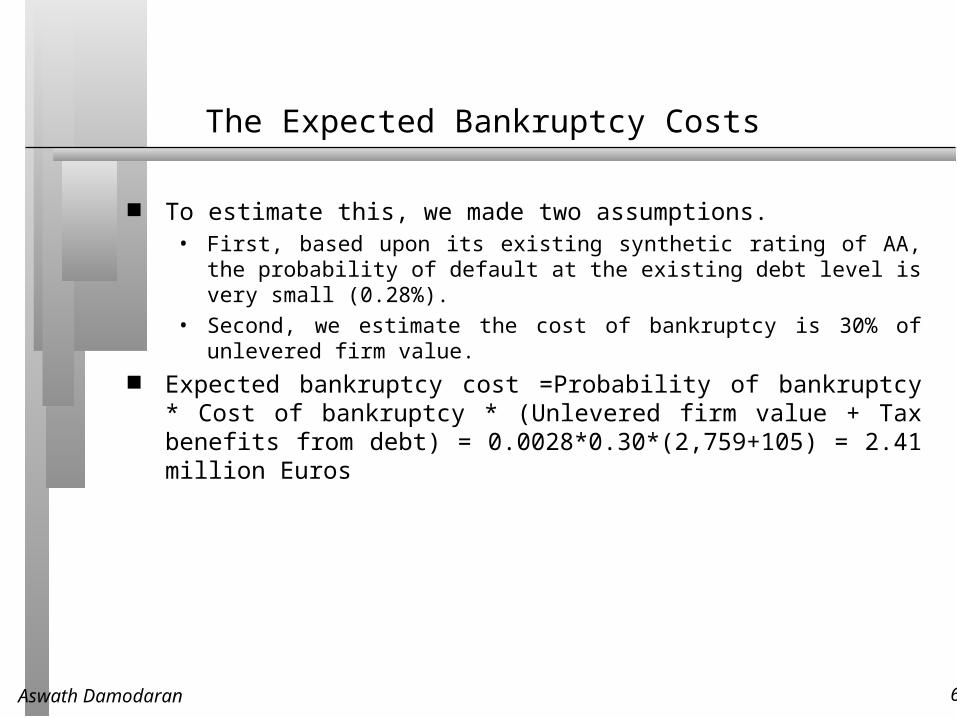
To estimate this, we made two assumptions. • First, based upon its existing synthetic rating of AA, the probability of default at the
existing debt level is very small (0.28%).
• Second, we estimate the cost of bankruptcy is 30% of unlevered firm value. Expected bankruptcy cost =Probability of bankruptcy * Cost of bankruptcy *
(Unlevered firm value + Tax benefits from debt) = 0.0028*0.30*(2,759+105) = 2.41 million Euros
Aswath Damodaran 69
The APV Value of Titan Cements
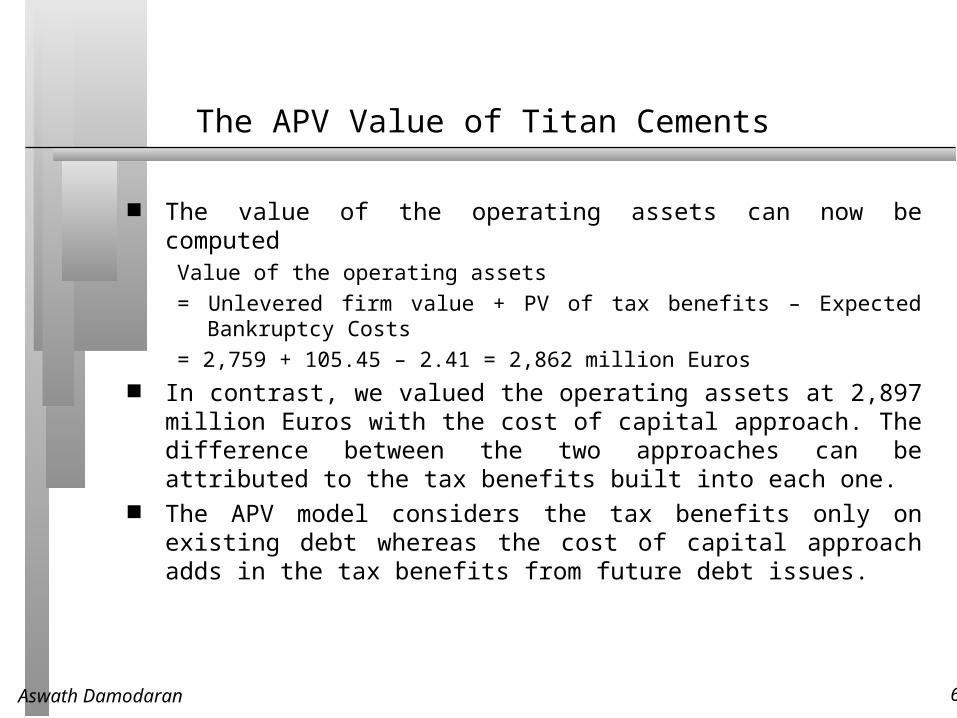
The value of the operating assets can now be computedValue of the operating assets
= Unlevered firm value + PV of tax benefits – Expected Bankruptcy Costs
= 2,759 + 105.45 – 2.41 = 2,862 million Euros In contrast, we valued the operating assets at 2,897 million Euros with the cost
of capital approach. The difference between the two approaches can be attributed to the tax benefits built into each one.
The APV model considers the tax benefits only on existing debt whereas the cost of capital approach adds in the tax benefits from future debt issues.
Aswath Damodaran 70
Excess Return Models
You can present any discounted cashflow model in terms of excess returns, with the value being written as:
• Value = Capital Invested + Present value of excess returns on current investments + Present value of excess returns on future investments
This model can be stated in terms of firm value (EVA) or equity value.
Aswath Damodaran 71
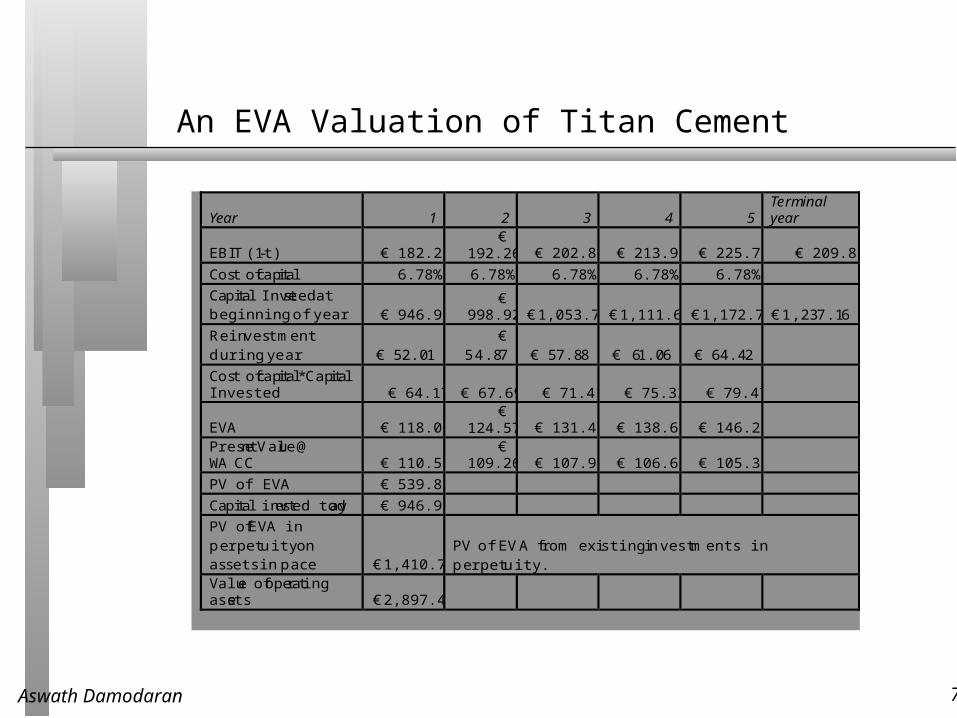
An EVA Valuation of Titan Cement
Year 1 2 3 4 5 Terminal year
EBIT (1-t) € 182.25 €
192.26 € 202.82 € 213.96 € 225.72 € 209.83
Cost of capital 6.78% 6.78% 6.78% 6.78% 6.78%
Capital Invested at beginning of year € 946.90
€ 998.92 €1,053.79 €1,111.67 €1,172.74 €1,237.16
Reinvestment during year € 5 2.01
€ 54.87 € 5 7.88 € 61.06 € 6 4.42
Cost of capital*Capital Invested € 64.17 € 67.69 € 71.41 € 75.33 € 79.47
EVA € 118.08 €
124.57 € 131.41 € 138.63 € 146.25 Present Value @ WACC € 110.59
€ 109.26 € 107.95 € 106.65 € 105.37
PV of EVA € 539.81
Capital invested today € 946.90
PV of EVA in perp etuity on assets in pace €1,410.71
PV of EVA f rom existing investments in perp etuity.
Value of operating assets €2,897.42
Aswath Damodaran 72
The Dark Side of Valuation
Aswath Damodaran
http://www.stern.nyu.edu/~adamodar
Aswath Damodaran 73
To make our estimates, we draw our information from..
The firm’s current financial statement• How much did the firm sell?
• How much did it earn? The firm’s financial history, usually summarized in its financial statements.
• How fast have the firm’s revenues and earnings grown over time? What can we learn about cost structure and profitability from these trends?
• Susceptibility to macro-economic factors (recessions and cyclical firms) The industry and comparable firm data
• What happens to firms as they mature? (Margins.. Revenue growth… Reinvestment needs… Risk)
We often substitute one type of information for another; for instance, in valuing Ford, we have 70 years+ of historical data, but not too many comparable firms; in valuing a software firm, we might not have too much historical data but we have lots of comparable firms.
Aswath Damodaran 74
The Dark Side...
Valuation is most difficult when a company• Has negative earnings and low revenues in its current financial statements
• No history
• No comparables ( or even if they exist, they are all at the same stage of the life cycle as the firm being valued)
Aswath Damodaran 75
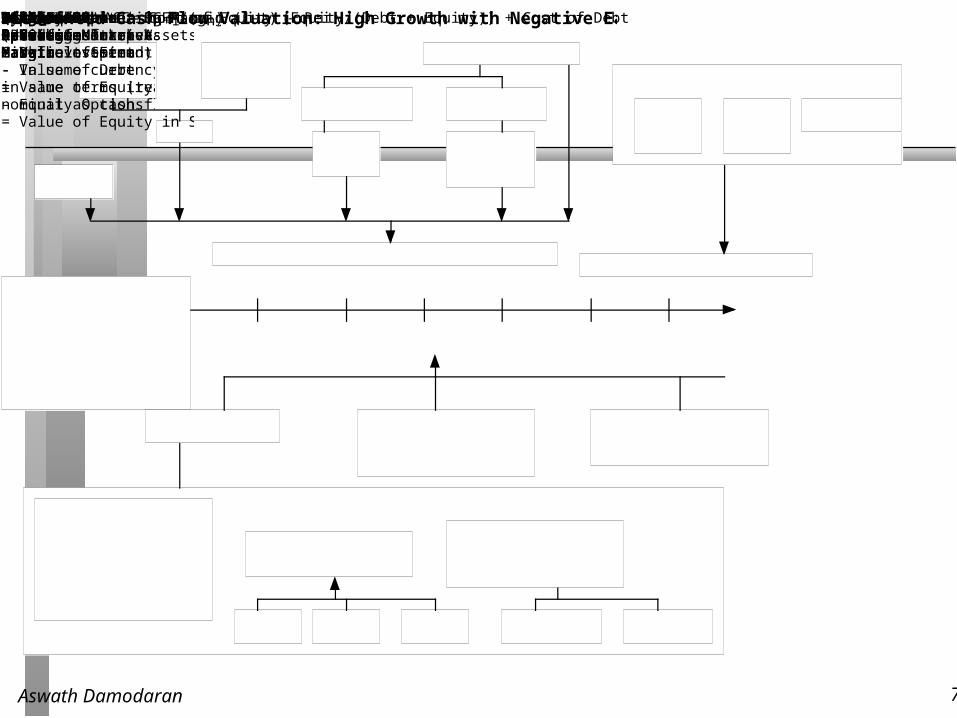
FCFF1FCFF2FCFF3FCFF4FCFF5ForeverTerminal Value= FCFF n+1/(r-gn)FCFFn.........Cost of EquityCost of Debt(Riskfree Rate+ Default Spread) (1-t)
WeightsBased on Market ValueDiscount at WACC= Cost of Equity (Equity/(Debt + Equity)) + Cost of Debt (Debt/(Debt+ Equity))Value of Operating Assets+ Cash & Non-op Assets= Value of Firm- Value of Debt= Value of Equity- Equity Options= Value of Equity in Stock
Riskfree Rate :- No default risk- No reinvestment risk- In same currency andin same terms (real or nominal as cash flows
+Beta- Measures market riskXRisk Premium- Premium for averagerisk investment
Type of BusinessOperating LeverageFinancialLeverageBase EquityPremiumCountry RiskPremiumCurrentRevenueCurrentOperatingMargin
ReinvestmentSales TurnoverRatioCompetitiveAdvantagesRevenue GrowthExpected Operating Margin
Stable GrowthStableRevenueGrowth
StableOperatingMargin
StableReinvestmentDiscounted Cash Flow Valuation: High Growth with Negative EarningsEBITTax Rate- NOLsFCFF = Revenue* Op Margin (1-t) - Reinvestment
Aswath Damodaran 76
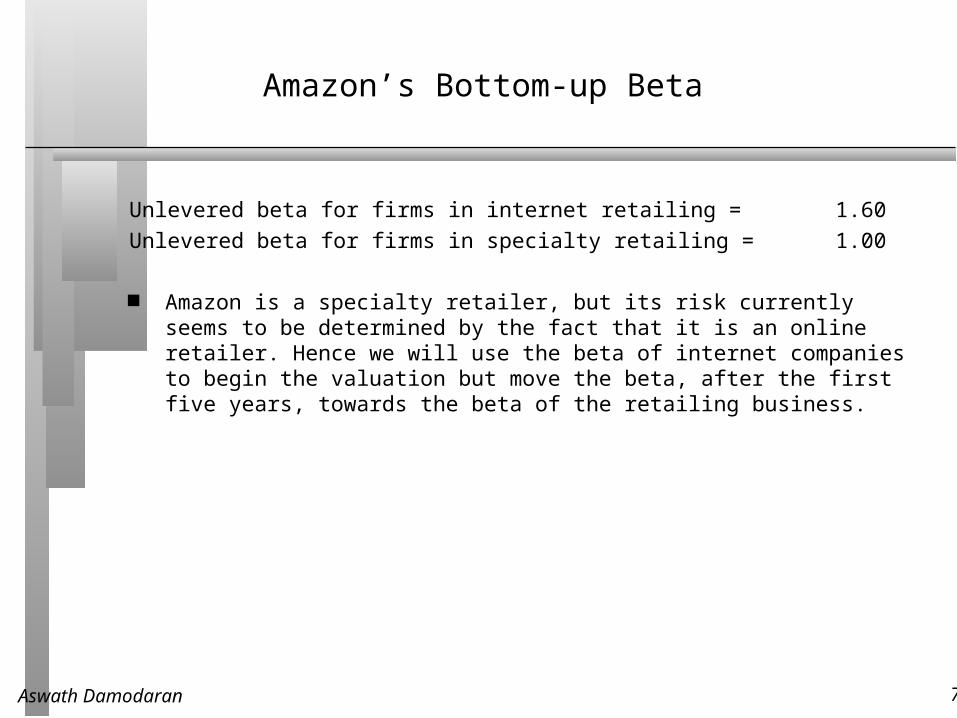
Amazon’s Bottom-up Beta
Unlevered beta for firms in internet retailing = 1.60
Unlevered beta for firms in specialty retailing = 1.00
Amazon is a specialty retailer, but its risk currently seems to be determined by the fact that it is an online retailer. Hence we will use the beta of internet companies to begin the valuation but move the beta, after the first five years, towards the beta of the retailing business.
Aswath Damodaran 77
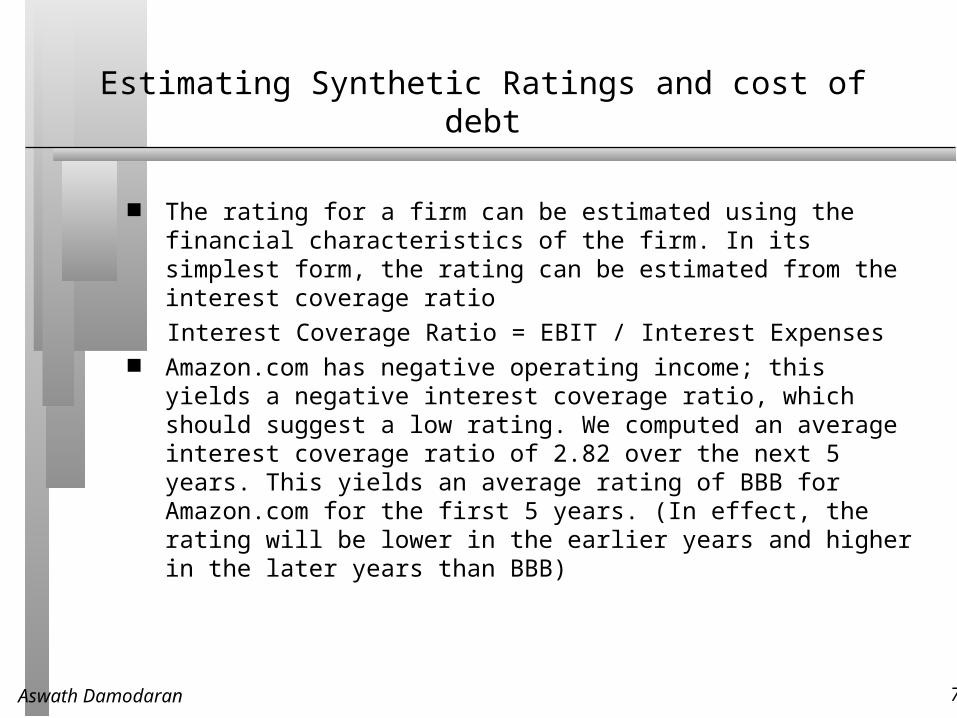
Estimating Synthetic Ratings and cost of debt
The rating for a firm can be estimated using the financial characteristics of the firm. In its simplest form, the rating can be estimated from the interest coverage ratio
Interest Coverage Ratio = EBIT / Interest Expenses Amazon.com has negative operating income; this yields a negative interest
coverage ratio, which should suggest a low rating. We computed an average interest coverage ratio of 2.82 over the next 5 years. This yields an average rating of BBB for Amazon.com for the first 5 years. (In effect, the rating will be lower in the earlier years and higher in the later years than BBB)
Aswath Damodaran 78
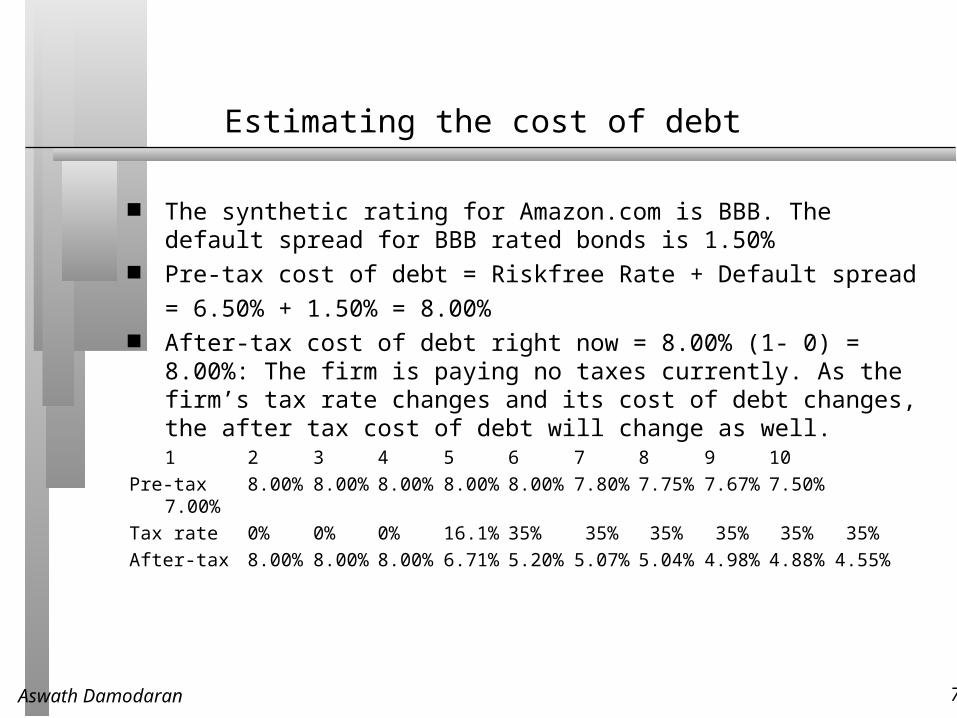
Estimating the cost of debt
The synthetic rating for Amazon.com is BBB. The default spread for BBB rated bonds is 1.50%
Pre-tax cost of debt = Riskfree Rate + Default spread
= 6.50% + 1.50% = 8.00% After-tax cost of debt right now = 8.00% (1- 0) = 8.00%: The firm is paying
no taxes currently. As the firm’s tax rate changes and its cost of debt changes, the after tax cost of debt will change as well.
1 2 3 4 5 6 7 8 9 10
Pre-tax 8.00% 8.00% 8.00% 8.00% 8.00% 7.80% 7.75% 7.67% 7.50% 7.00%
Tax rate 0% 0% 0% 16.1% 35% 35% 35% 35% 35% 35%
After-tax 8.00% 8.00% 8.00% 6.71% 5.20% 5.07% 5.04% 4.98% 4.88% 4.55%
Aswath Damodaran 79
Estimating Cost of Capital: Amazon.com
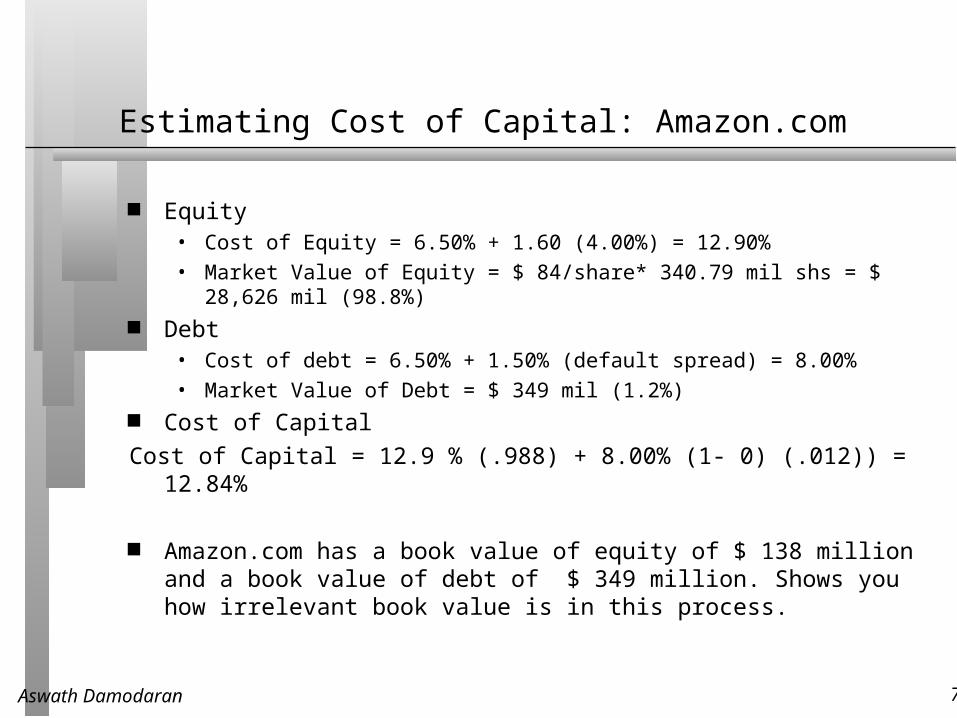
Equity• Cost of Equity = 6.50% + 1.60 (4.00%) = 12.90%
• Market Value of Equity = $ 84/share* 340.79 mil shs = $ 28,626 mil (98.8%) Debt
• Cost of debt = 6.50% + 1.50% (default spread) = 8.00%
• Market Value of Debt = $ 349 mil (1.2%) Cost of Capital
Cost of Capital = 12.9 % (.988) + 8.00% (1- 0) (.012)) = 12.84%
Amazon.com has a book value of equity of $ 138 million and a book value of debt of $ 349 million. Shows you how irrelevant book value is in this process.
Aswath Damodaran 80
Calendar Years, Financial Years and Updated Information
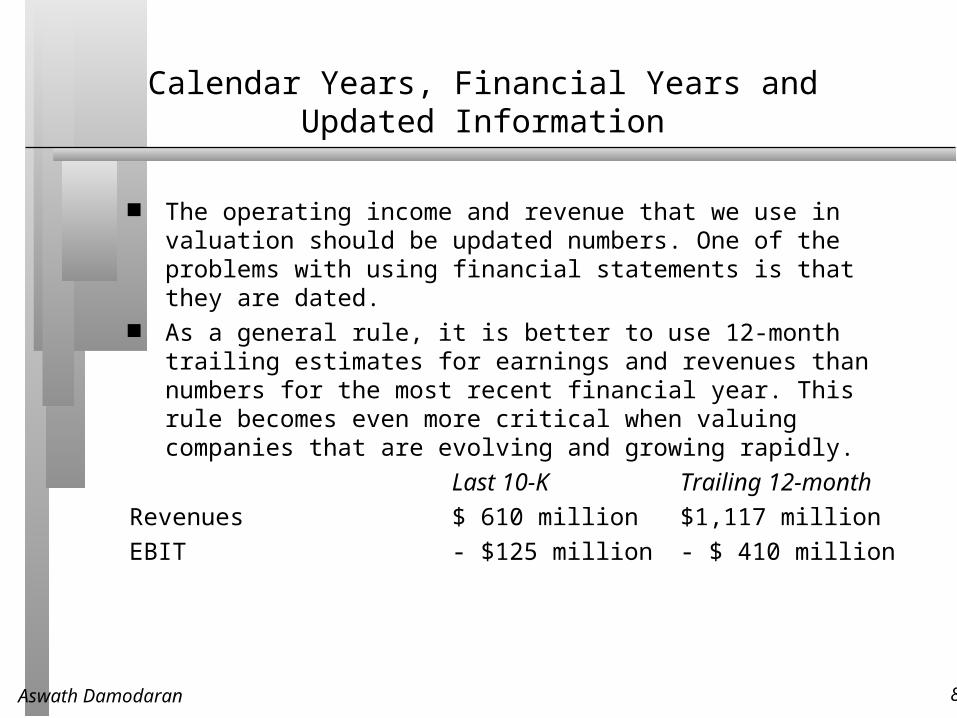
The operating income and revenue that we use in valuation should be updated numbers. One of the problems with using financial statements is that they are dated.
As a general rule, it is better to use 12-month trailing estimates for earnings and revenues than numbers for the most recent financial year. This rule becomes even more critical when valuing companies that are evolving and growing rapidly.
Last 10-K Trailing 12-month
Revenues $ 610 million $1,117 million
EBIT - $125 million - $ 410 million
Aswath Damodaran 81
Are S, G & A expenses capital expenditures?
Many internet companies are arguing that selling and G&A expenses are the equivalent of R&D expenses for a high-technology firms and should be treated as capital expenditures.
If we adopt this rationale, we should be computing earnings before these expenses, which will make many of these firms profitable. It will also mean that they are reinvesting far more than we think they are. It will, however, make not their cash flows less negative.
Should Amazon.com’s selling expenses be treated as cap ex?
Aswath Damodaran 82
Amazon.com’s Tax Rate
Year 1 2 3 4 5
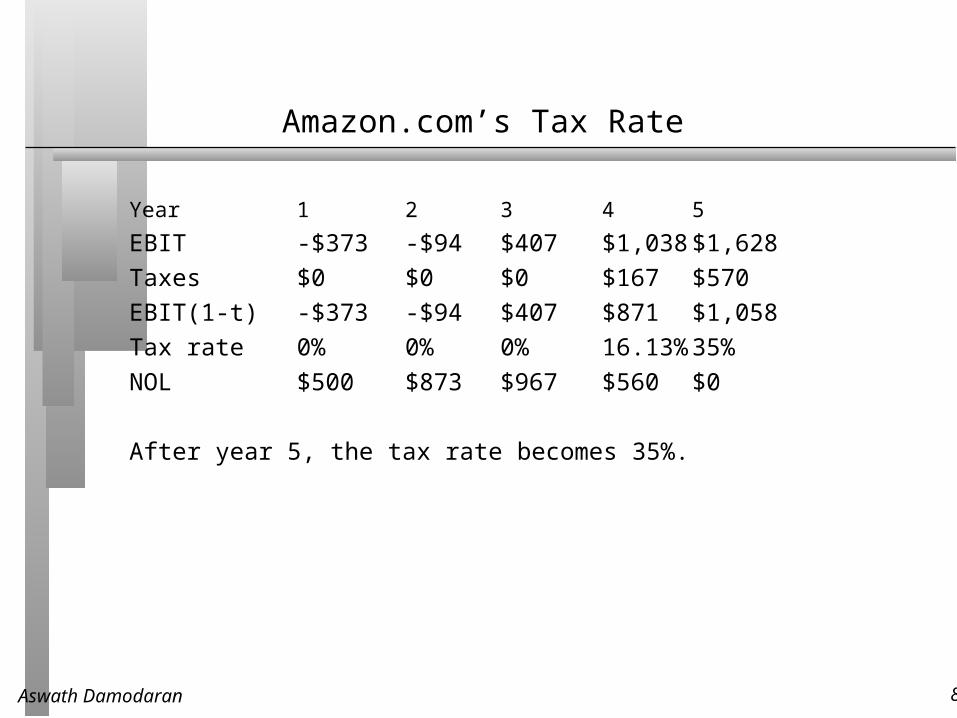
EBIT -$373 -$94 $407 $1,038 $1,628
Taxes $0 $0 $0 $167 $570
EBIT(1-t) -$373 -$94 $407 $871 $1,058
Tax rate 0% 0% 0% 16.13% 35%
NOL $500 $873 $967 $560 $0
After year 5, the tax rate becomes 35%.
Aswath Damodaran 83
Estimating FCFF: Amazon.com
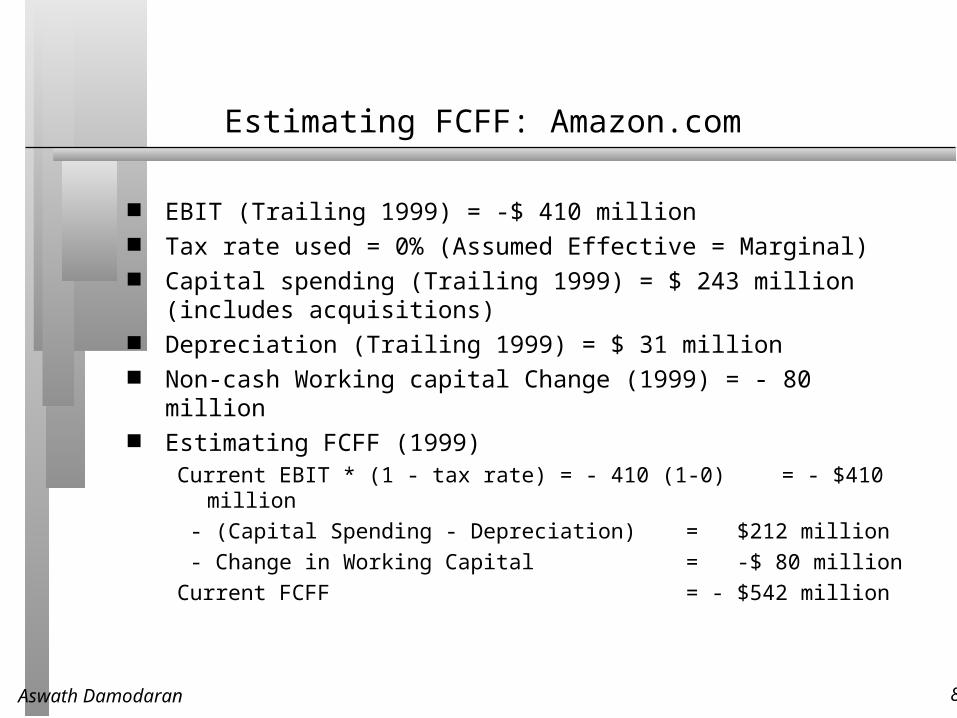
EBIT (Trailing 1999) = -$ 410 million Tax rate used = 0% (Assumed Effective = Marginal) Capital spending (Trailing 1999) = $ 243 million (includes acquisitions) Depreciation (Trailing 1999) = $ 31 million Non-cash Working capital Change (1999) = - 80 million Estimating FCFF (1999)
Current EBIT * (1 - tax rate) = - 410 (1-0) = - $410 million
- (Capital Spending - Depreciation) = $212 million
- Change in Working Capital = -$ 80 million
Current FCFF = - $542 million
Aswath Damodaran 84
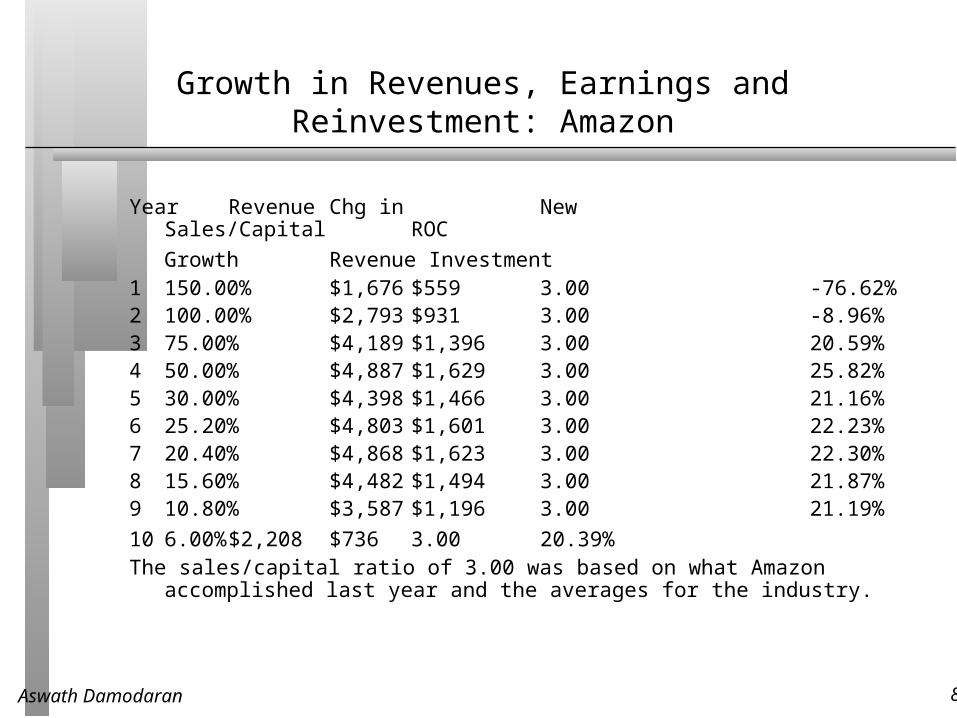
Growth in Revenues, Earnings and Reinvestment: Amazon
Year Revenue Chg in New Sales/Capital ROC
Growth Revenue Investment1 150.00% $1,676 $559 3.00 -76.62%2 100.00% $2,793 $931 3.00 -8.96%3 75.00% $4,189 $1,396 3.00 20.59%4 50.00% $4,887 $1,629 3.00 25.82%5 30.00% $4,398 $1,466 3.00 21.16%6 25.20% $4,803 $1,601 3.00 22.23%7 20.40% $4,868 $1,623 3.00 22.30%8 15.60% $4,482 $1,494 3.00 21.87%9 10.80% $3,587 $1,196 3.00 21.19%
10 6.00% $2,208 $736 3.00 20.39%The sales/capital ratio of 3.00 was based on what Amazon accomplished last year and the
averages for the industry.
Aswath Damodaran 85
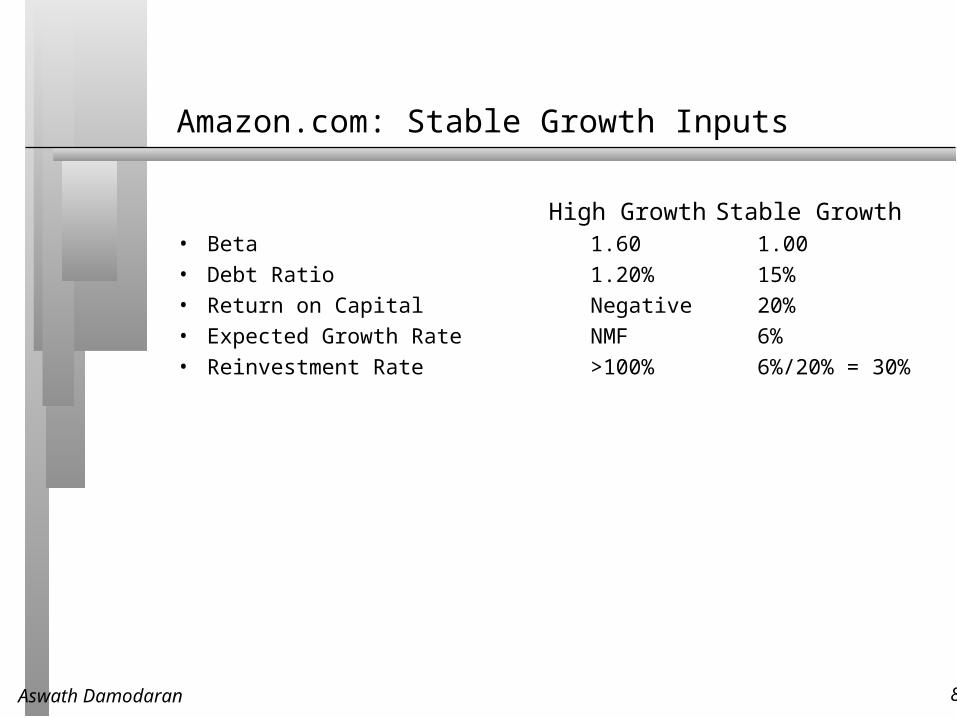
Amazon.com: Stable Growth Inputs
High Growth Stable Growth• Beta 1.60 1.00
• Debt Ratio 1.20% 15%
• Return on Capital Negative 20%
• Expected Growth Rate NMF 6%
• Reinvestment Rate >100% 6%/20% = 30%
Aswath Damodaran 86
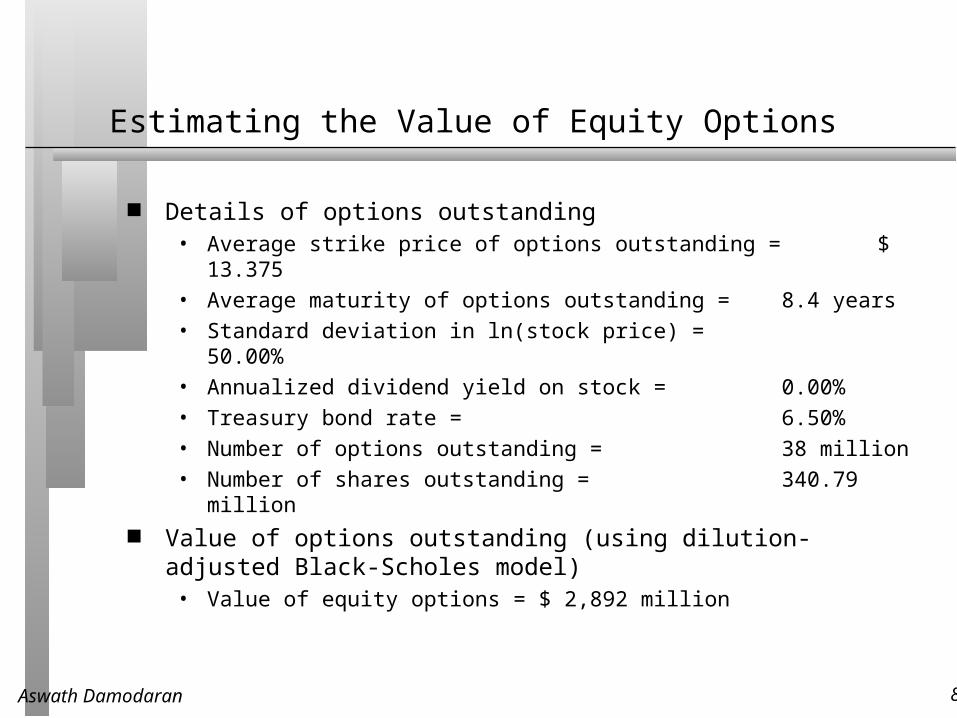
Estimating the Value of Equity Options
Details of options outstanding• Average strike price of options outstanding = $ 13.375
• Average maturity of options outstanding = 8.4 years
• Standard deviation in ln(stock price) = 50.00%
• Annualized dividend yield on stock = 0.00%
• Treasury bond rate = 6.50%
• Number of options outstanding = 38 million
• Number of shares outstanding = 340.79 million Value of options outstanding (using dilution-adjusted Black-Scholes model)
• Value of equity options = $ 2,892 million

Aswath Damodaran 87
ForeverTerminal Value= 1881/(.0961-.06)=52,148Cost of Equity12.90%Cost of Debt6.5%+1.5%=8.0%Tax rate = 0% -> 35%
WeightsDebt= 1.2% -> 15%Value of Op Assets $ 14,910+ Cash $ 26= Value of Firm $14,936- Value of Debt $ 349= Value of Equity $14,587- Equity Options $ 2,892Value per share $ 34.32
Riskfree Rate :T. Bond rate = 6.5%+Beta1.60 -> 1.00XRisk Premium4%Internet/RetailOperating LeverageCurrent D/E: 1.21%Base EquityPremiumCountry RiskPremiumCurrentRevenue$ 1,117
CurrentMargin:-36.71%
Reinvestment:Cap ex includes acquisitionsWorking capital is 3% of revenues
Sales TurnoverRatio: 3.00CompetitiveAdvantagesRevenue Growth:42%
Expected Margin: -> 10.00%
Stable GrowthStableRevenueGrowth: 6%
StableOperatingMargin: 10.00%
Stable ROC=20%Reinvest 30% of EBIT(1-t)
EBIT-410mNOL:500 m$41,346 10.00% 35.00%$2,688 $ 807 $1,881
Term. Year24315689107Cost of Equity 12.90% 12.90% 12.90% 12.90% 12.90% 12.42% 12.30% 12.10% 11.70% 10.50%Cost of Debt 8.00% 8.00% 8.00% 8.00% 8.00% 7.80% 7.75% 7.67% 7.50% 7.00%AT cost of debt 8.00% 8.00% 8.00% 6.71% 5.20% 5.07% 5.04% 4.98% 4.88% 4.55%Cost of Capital 12.84% 12.84% 12.84% 12.83% 12.81% 12.13% 11.96% 11.69% 11.15% 9.61%
Revenues $2,793 5,585 9,774 14,661 19,059 23,862 28,729 33,211 36,798 39,006 EBIT -$373 -$94 $407 $1,038 $1,628 $2,212 $2,768 $3,261 $3,646 $3,883EBIT (1-t) -$373 -$94 $407 $871 $1,058 $1,438 $1,799 $2,119 $2,370 $2,524 - Reinvestment $559 $931 $1,396 $1,629 $1,466 $1,601 $1,623 $1,494 $1,196 $736FCFF -$931 -$1,024 -$989 -$758 -$408 -$163 $177 $625 $1,174 $1,788
Amazon.comJanuary 2000Stock Price = $ 84
Aswath Damodaran 88
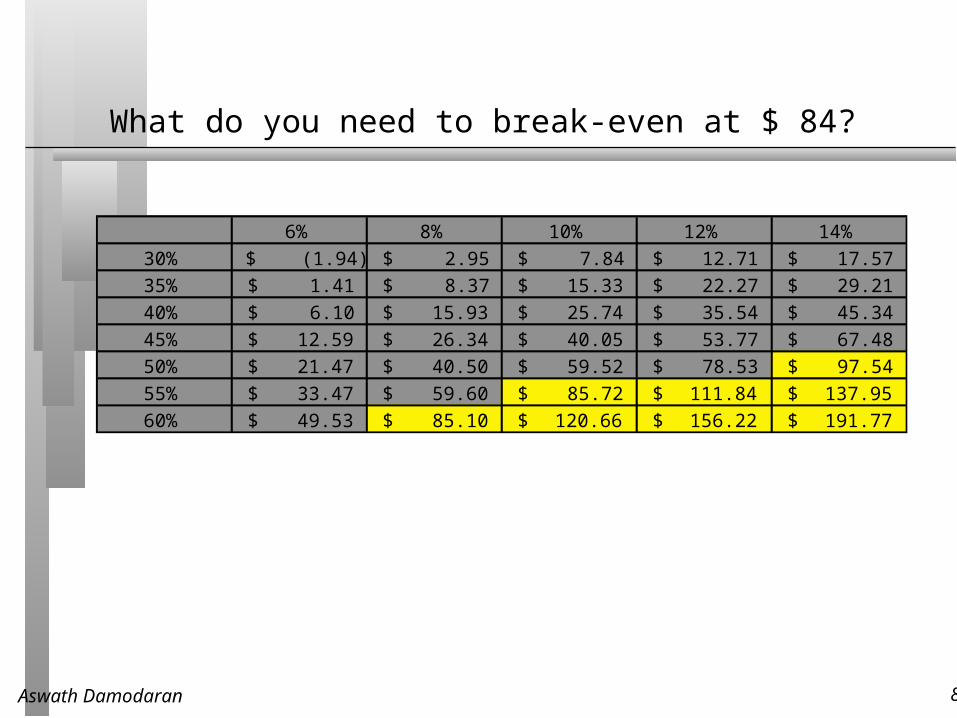
What do you need to break-even at $ 84?
6% 8% 10% 12% 14%30% (1.94)$ 2.95$ 7.84$ 12.71$ 17.57$ 35% 1.41$ 8.37$ 15.33$ 22.27$ 29.21$ 40% 6.10$ 15.93$ 25.74$ 35.54$ 45.34$ 45% 12.59$ 26.34$ 40.05$ 53.77$ 67.48$ 50% 21.47$ 40.50$ 59.52$ 78.53$ 97.54$ 55% 33.47$ 59.60$ 85.72$ 111.84$ 137.95$ 60% 49.53$ 85.10$ 120.66$ 156.22$ 191.77$
Aswath Damodaran 89
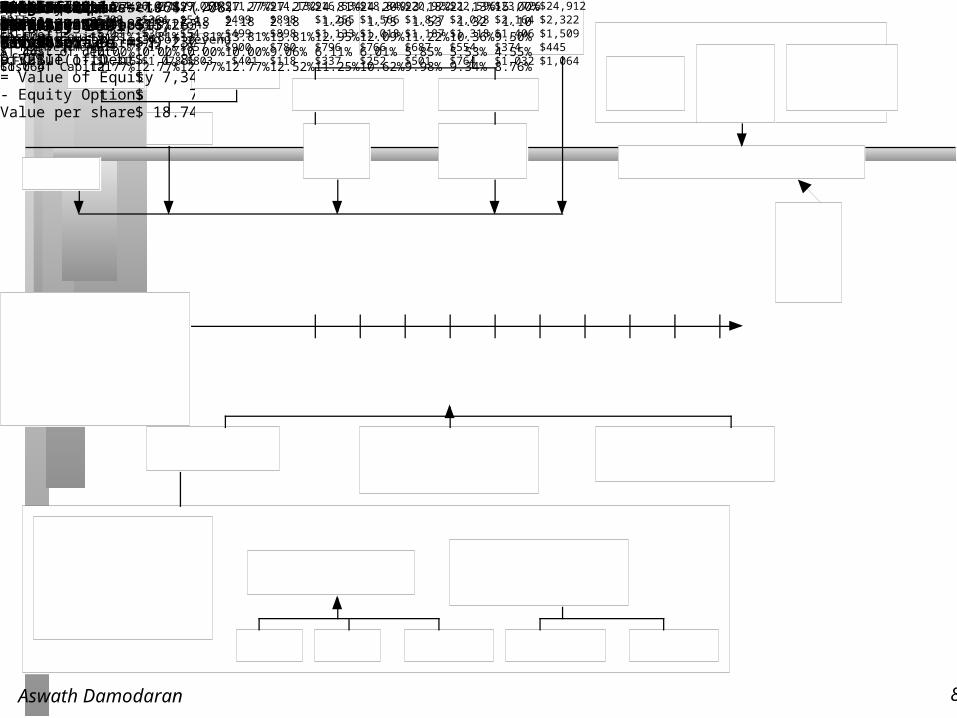
ForeverTerminal Value= 1064/(.0876-.05)=$ 28,310Cost of Equity13.81%Cost of Debt5.1%+4.75%= 9.85%Tax rate = 0% -> 35%
WeightsDebt= 27.38% -> 15%Value of Op Assets $ 7,967+ Cash & Non-op $ 1,263= Value of Firm $ 9,230- Value of Debt $ 1,890= Value of Equity $ 7,340- Equity Options $ 748Value per share $ 18.74
Riskfree Rate :T. Bond rate = 5.1%+Beta2.18-> 1.10XRisk Premium4%Internet/RetailOperating LeverageCurrent D/E: 37.5%Base EquityPremiumCountry RiskPremiumCurrentRevenue$ 2,465
CurrentMargin:-34.60%
Reinvestment:Cap ex includes acquisitionsWorking capital is 3% of revenues
Sales TurnoverRatio: 3.02CompetitiveAdvantagesRevenue Growth:25.41%
Expected Margin: -> 9.32%
Stable GrowthStableRevenueGrowth: 5%
StableOperatingMargin: 9.32%
Stable ROC=16.94%Reinvest 29.5% of EBIT(1-t)
EBIT-853mNOL:1,289 m$24,912$2,322$1,509$ 445$1,064
Term. Year24315689107Debt Ratio 27.27% 27.27% 27.27% 27.27% 27.27% 24.81% 24.20% 23.18% 21.13% 15.00%Beta 2.18 2.18 2.18 2.18 2.18 1.96 1.75 1.53 1.32 1.10 Cost of Equity 13.81% 13.81% 13.81% 13.81% 13.81% 12.95% 12.09% 11.22% 10.36% 9.50%AT cost of debt 10.00% 10.00% 10.00% 10.00% 9.06% 6.11% 6.01% 5.85% 5.53% 4.55%Cost of Capital 12.77% 12.77% 12.77% 12.77% 12.52% 11.25% 10.62% 9.98% 9.34% 8.76%
Amazon.comJanuary 2001Stock price = $14
Revenues $4,314 $6,471 $9,059 $11,777 $14,132 $16,534 $18,849 $20,922 $22,596 $23,726 $24,912EBIT -$703 -$364 $54 $499 $898 $1,255 $1,566 $1,827 $2,028 $2,164 $2,322EBIT(1-t) -$703 -$364 $54 $499 $898 $1,133 $1,018 $1,187 $1,318 $1,406 $1,509 - Reinvestment $612 $714 $857 $900 $780 $796 $766 $687 $554 $374 $445FCFF -$1,315 -$1,078 -$803 -$401 $118 $337 $252 $501 $764 $1,032 $1,064
Aswath Damodaran 90
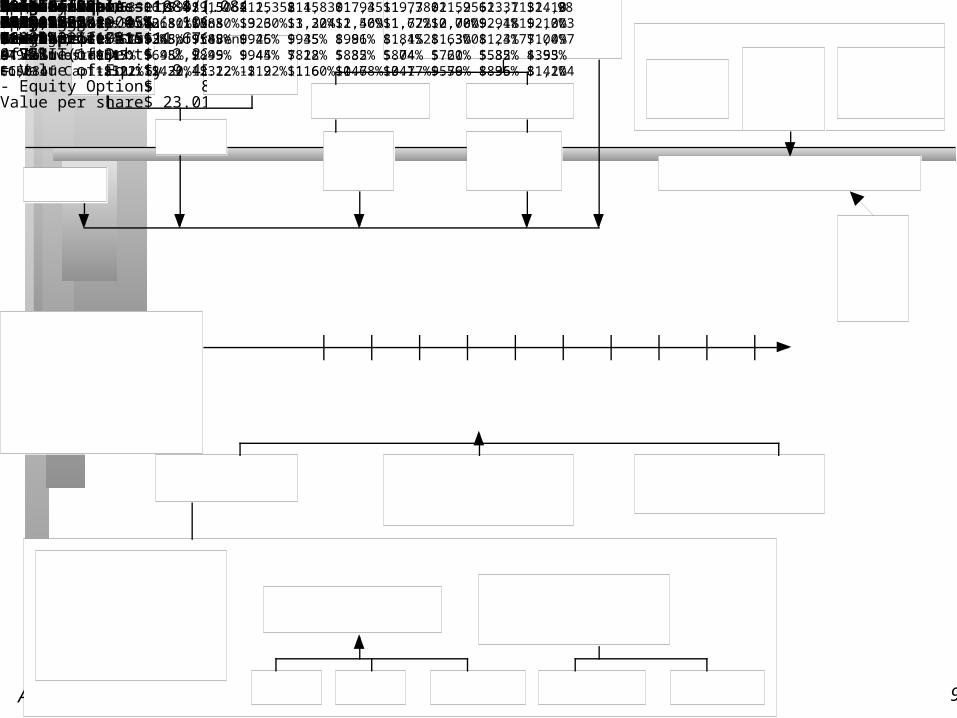
ForeverTerminal Value= 1084/(.0842-.045)= 29,170Cost of Equity13.30%Cost of Debt4.7%+4.75%=9.45%Tax rate = 0% -> 35%
WeightsDebt= 28% -> 15%Value of Op Assets $ 10,669+ Cash $ 1007= Value of Firm $11,676- Value of Debt $ 2,220= Value of Equity $ 9,456- Equity Options $ 827Value per share $ 23.01
Riskfree Rate :T. Bond rate = 4.70%+Beta2.15 -> 1.00XRisk Premium4%Internet/RetailOperating LeverageCurrent D/E: 33.5%Base EquityPremiumCountry RiskPremiumCurrentRevenue$ 3,122
CurrentMargin:-6.48%
Reinvestment:Cap ex includes acquisitionsWorking capital is 3% of revenues
Sales TurnoverRatio: 3.02CompetitiveAdvantagesRevenue Growth:23.08%
Expected Margin: -> 9.32%
Stable GrowthStableRevenueGrowth: 4.7%
StableOperatingMargin: 9.32%
Stable ROC=15%Reinvest 31.33% of EBIT(1-t)
EBIT-202mNOL:2183 m$26,069$2,430$1,579$495$1,084
Term. Year24315689107AmazonJuly 2002Stock price =15.50
Revenues $4,683 $6,790 $9,506 $12,358 $14,830 $17,351 $19,780 $21,956 $23,713 $24,898EBIT $5 $268 $588 $926 $1,224 $1,509 $1,772 $2,000 $2,181 $2,303EBIT(1-t) $5 $268 $588 $926 $935 $981 $1,152 $1,300 $1,417 $1,497 - Reinvestment $517 $698 $899 $944 $818 $835 $804 $720 $582 $393FCFF -$512 -$430 -$312 -$19 $116 $146 $347 $579 $836 $1,104
Beta 2.15 2.15 2.15 2.15 2.15 1.94 1.73 1.52 1.31 1.10 Cost of Equity 13.30% 13.30% 13.30% 13.30% 13.30% 12.46% 11.62% 10.78% 9.94% 9.10%Cost of Debt 9.45% 9.45% 9.45% 9.45% 9.45% 8.96% 8.84% 8.63% 8.23% 7.00%AT cost of debt 9.45% 9.45% 9.45% 9.45% 7.22% 5.82% 5.74% 5.61% 5.35% 4.55%Cost of Capital 12.22% 12.22% 12.22% 12.22% 11.60% 10.78% 10.17% 9.56% 8.95% 8.42%
Aswath Damodaran 91
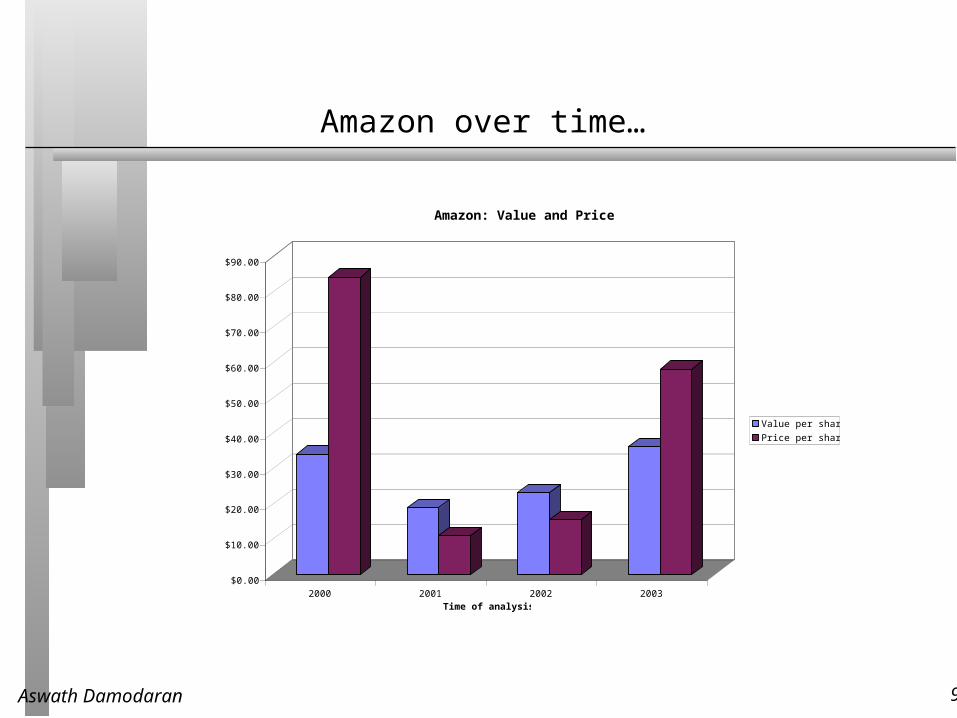
Amazon over time…
$0.00
$10.00
$20.00
$30.00
$40.00
$50.00
$60.00
$70.00
$80.00
$90.00
2000 2001 2002 2003Time of analysis
Amazon: Value and Price
Value per share
Price per share