Disclosure Supplement to Noteholders Alliance …...Luxco 1 S.à r.l. (“Alize Luxco”): Alize...
47
Disclosure Supplement to Noteholders Alliance Automotive Finance plc October 5, 2016
Transcript of Disclosure Supplement to Noteholders Alliance …...Luxco 1 S.à r.l. (“Alize Luxco”): Alize...
Disclosure Supplement to Noteholders
Alliance Automotive Finance plc
October 5, 2016

TABLE OF CONTENTS
Page
Recent Developments…………………………………………………………………………………… 2
Certain Financial Data…………………………………………………………………………………… 4
Unaudited Pro Forma Condensed Combined Financial Data……………………………………………. 12
Financial Statements of Alize Luxco as of and for the six months ended June 30, 2016………………... Annex F

2
RECENT DEVELOPMENTS
Acquisition of the FPS Target Group
On August 9, 2016, we entered into an agreement for the acquisition of FPS Distribution Limited (“FPS Holdings”) with, among others, Lookers PLC, as parent, and Lookers Motor Holdings Limited, as seller (the “Acquisition Agreement”), pursuant to which we agreed to acquire the FPS Holdings and its subsidiaries (the “FPS Target Group”) for a purchase price of approximately £120 million on a cash free and debt free basis, subject to theFPS Target Group retaining a sufficient level of working capital as agreed between the parties. The FPS Target Groupconsists of the parts division of Lookers PLC, comprising a holding company, FPS Holdings, and its subsidiaryoperating companies, including Ferraris Piston Service Limited (“Ferraris Piston”), Apec Limited (“Apec”) andBTN Turbo Charger Service Limited (“BTN”), each based in the United Kingdom.
Ferraris Piston operates an integrated national distribution center in Sheffield and a network of 20 regionaldistribution centers spread throughout the UK which offer same-day delivery of light vehicle parts to aftermarketdistributors and retail stores. It carries over 120,000 product lines and partners with over 410 brands and suppliers.We believe that our acquisition of Ferraris Piston will enable us to scale up our national distribution center offeringand more efficiently utilize the same-day regional network to enhance the rapid availability of slow moving partsthereby improving customer order fill rates. This structure emulates the national and regional logisticsinfrastructure which we have developed in France. Apec sources and supplies a complete range of braking pads,discs and calipers while BTN imports and distributes turbo chargers. The acquisition of the FPS Target Group willsignificantly increase our presence in the UK, thus strengthening and solidifying our leading market position.
The transaction is subject to customary closing conditions, including antitrust approval. If the conditions toclosing of the acquisition of the FPS Target Group have not been satisfied or waived by midday on December 31,2016, the Acquisition Agreement may be terminated with immediate effect by either us or Lookers Motor HoldingsLimited.
Acquisitions completed since June 30, 2016
In France, on July 29, 2016, we acquired Société de Distribution de Peinture – Sodip (“SODIP”) and onSeptember 20, 2016, we acquired Genève Occasion, both distributors of LV spare parts, for a total purchase price of approximately €9 million. In the UK, on July 15, 2016, we acquired Multitruck Components Limited(“Multitrack”), a distributor of CV spare parts and, on September 6, 2016, we acquired Unifactor AutopartsLimited, a distributor of LV spare parts for a total purchase price of approximately £2.5 million. In Germany, onJuly 1, 2016, we acquired Busch, a distributor of LV spare parts for a purchase price of €9 million. Each of theseacquisitions was financed with cash on our balance sheet.
Current trading
We estimate our net revenue for the two months ended August 31, 2016 to be approximately 10% higherthan our net revenue for the comparable period in 2015, being in the range of €220.0 million to €224.0 million.This increase was primarily due to (i) the impact of acquisitions consummated during the second half of 2015 andthe first half of 2016 (primarily, the impact of Coler) and (ii) a satisfactory performance, at our historical perimeter, inFrance and the UK, despite the weakening of the pounds sterling against the euro during this period. We alsoestimate our EBITDA for the two months ended August 31, 2016 to be approximately 13% higher than ourEBITDA for the comparable period in 2015, being in the range of €15.5 million to €16.0 million. Our EBITDAincreased at a slightly faster rate than our net revenues for the two months ended August 31, 2016, reflecting ourcontrol over our operating expenses combined with continued improvement in our procurement terms withsuppliers.
Additionally, we estimate that our net debt as of August 31, 2016 was €13.5 million higher than our net debt as of June 30, 2016. Our net debt increased during the two months ended August 31, 2016 due to (i) the three acquisitions we closed during this period (SODIP in France, Multitruck in the UK and Busch in Germany,) for a total cash consideration of €13.5 million, (ii) the dividend we paid to our minority shareholders in the

3
amount of €2.1 million and (iii) positive cash flow generated by our operations during this period in the amount of €2.1 million.
This information is based solely on preliminary internal information used by management. Our actualconsolidated financial results for the two months ended August 31, 2016 may differ from our preliminary estimatedresults and remain subject to our normal end of period closing procedures and review process, including theadjustments required to present this accounting information in accordance with Luxembourg GAAP. Thoseprocedures have not been completed. Accordingly, these results may change and those changes may be material.We caution that the foregoing information has not been audited or reviewed by our independent auditors andshould not be regarded as an indication, forecast or representation by us or any other person regarding our financialperformance for the two months ended August 31, 2016.
Notes offering
Contemporaneously with the release of this disclosure supplement, Alliance Automotive Finance plc has announced an offering of senior secured notes in an aggregate principal amount of €180 million, which will be issued as additional notes under the indenture governing its existing 6.25% Senior Secured Notes due 2021 (the “Notes”). If completed, the proceeds from the offering of the Notes will be used to finance the Acquisition, to pay fees and expenses in connection with the offering of the Notes and the Acquisition, and to fund cash on balance sheet. In the unlikely event that the acquisition of the FPS Target Group is not consummated, we intend to use thenet proceeds from the offering of the Notes to redeem, in whole, Alliance Automotive Finance plc’s €100,000,000 aggregated principal amount of Floating Rate Senior Secured Notes due 2021 issued on November 19, 2014 (the “Floating Rate Notes”), to repay certain of our third-party indebtedness and bank overdrafts and to fund cash onour balance sheet.

4
CERTAIN FINANCIAL DATA
We present EBITDA and Pro Forma Adjusted EBITDA as further supplemental measures of our performance.“EBITDA” represents our operating result before goodwill amortization and non recurring items plus operatingdepreciation charges on fixed. “Pro Forma Adjusted EBITDA” is defined as EBITDA adjusted for estimated run-rate EBITDA contribution and effect of synergies in connection with the acquisition of the FPS Target Group,estimated run-rate EBITDA contribution and effect of synergies in connection with certain other acquisitions notincluded in our historical results, French business tax (Cotisation sur la Valeur Ajoutée des Entreprises, or “CVAE”),and the loss of one of our affiliated distributors on March 31, 2016. We believe that EBITDA and Pro FormaAdjusted EBITDA are useful performance measures. However, neither EBITDA nor Pro Forma Adjusted EBITDAis a measure under Luxembourg GAAP or French GAAP or any other internationally accepted accountingprinciples. Therefore, EBITDA and Pro Forma Adjusted EBITDA should be viewed as supplemental to, but not asa substitute for, operating profit, net profit, cash flow from operations or for any other income statement or cashflow statement data determined in accordance with Luxembourg GAAP or French GAAP. Because not allcompanies define this measure in the same way, EBITDA and Pro Forma Adjusted EBITDA, as shown in thisdisclosure supplement, may not be comparable to similarly-titled measures used by other companies. In addition,we are likely to incur expenses similar to the adjustments in this presentation in the future and certain of these itemscould be considered recurring in nature. Our presentation of EBITDA and Pro Forma Adjusted EBITDA should notbe construed as an inference that our future results will be unaffected by unusual or non-recurring items.
In the unlikely event that the acquisition of the FPS Target Group is not consummated, we intend to use the net proceeds from the offering of the Notes to repay certain of our indebtedness. In such a case, we would not benefit from the EBITDA of the FPS Target Group or from synergies that may result from its acquisition.
The reconciliation of operating result before goodwill amortization and non recurring items to EBITDA,and the reconciliation of EBITDA to Pro Forma Adjusted EBITDA, for the periods indicated is as follows for Alize Luxco 1 S.à r.l. (“Alize Luxco”):
Alize Luxco HistoricalTwelve months ended June 30, Six months ended June 30,
Year ended December 31,
2016 2016 2015 2015(€ in thousands)
Operating result before goodwill amortization and non recurring items ........................... 84,271 47,878 32,923 69,316 of which, goodwill amortization................ 19,616 10,411 8,095 17,300 of which, exceptional result....................... 552 1,181 629 —
Depreciation charges on fixed assets........... 15,024 7,864 6,010 13,170Other(a). . . . . . . . . . . . . . . . . . . . . . . . . . . . . 961 505 399 856Adjustments—Alize Luxco to the Parent(b) ……. 98 29 32 101Adjustments—AAG to the Parent(c). . . . . . . . . . .. — — — —
EBITDA ..................................................... 100,354 56,276(d) 39,364(d) 83,443
Estimated run-rate EBITDA contribution and effect of synergies in connection with the acquisition of the FPS Target Group(e) ........ 21,232Estimated run-rate EBITDA contribution and effect of synergies in connection with other acquisitions not included in our historical results(f) ....................................................... 10,111CVAE tax considered as corporate income tax(g)
.................................................................... 3,266Termination of a distribution contract with an affiliated distributor (h) ................................ (1,047)
Pro Forma Adjusted EBITDA(i) ............... 133,916
(a) Reflects the impact of certain advisory fees invoiced by our shareholders.

5
(b) Represents administrative costs borne by Alize Luxco which are not reinvoiced to Alliance Automotive Holding Limited (the “Parent”) or its subsidiaries.
(c) Reflects the impact of certain fees and costs that were accounted for at Alliance Automotive Group S.A.S. (“AAG”) until November 30, 2014, prior to its acquisition by Alliance Automotive Investment, that were thereafter accounted for at the Parent.
(d) Our EBITDA increased by €16.9 million, to €56.3 million for the six months ended June 30, 2016 from €39.4 million for the six months ended June 30, 2015, due to an increase of €7.7 million at the historical perimeter and an increase of €9.7 million due to the net impact of the acquisitions that we completed during the twelve months ended June 30, 2016, partially offset by a decrease of €0.5 million due to the negative impact of foreign exchange on our UK operations.
(e) Reflects the estimated run-rate EBITDA contribution and effect of synergies related to our acquisition of the FPS Target Group, assuming that this acquisition had occurred on January 1, 2015. We have calculated run-rate EBITDA for the FPS Target Group by adding its unaudited combined EBITDA for the year ended December 31, 2015 to its unaudited combined EBITDA for the six months ended June 30, 2016 and subtracting its unaudited combined EBITDA for the six months ended June 30, 2015. The synergies we have estimated in this add back consist primarily of (i) the run-rate effect of certain adjustments agreed under the acquisition agreement with the seller of the FPS Target Group, including adjustments relating to rent payments and compensation for senior management and (ii) purchasing synergies that, based on our review of the FPS Target Group’s existing arrangements with its suppliers, and our experience with acquiring businesses of similar size and scale, we expect to realize by way of additional rebates and reduction in the price of goods sold once the pricing terms available to our Group are fully extended to the FPS Target Group’s purchase requirements.
The reconciliation of operating result to EBITDA for the FPS Target Group for the six months ended June 30, 2016 and for the year ended December 31, 2015, is as follows:
FPS Target Group HistoricalSix months ended
June 30,Year ended December 31,
2016 2015(£ in millions)
Operating result ............................................. 7.5 12.6
Depreciation charges on fixed assets .............. 0.8 2.0
EBITDA ......................................................... 8.3 14.6
(f) Reflects, for the portion of the twelve months ended June 30, 2016 during which the financial results of the entities listed below were not consolidated within our financial results, the estimated aggregate EBITDA contribution and the run-rate effect of synergies, assuming that the acquisitions of (i) Chambon, which occurred on July 20, 2015, (ii) Gallays, which occurred on November 12, 2015, (iii) AOI, which occurred on February 1, 2016, (iv) TBS, which occurred on March 1, 2016, (v) B2C, which occurred on April 7, 2016, (vi) Couloir, which occurred on June 1, 2016, (vii) EDS, which occurred on June 22, 2016), (viii) Paban, which occurred on June 30, 2016), (ix) Fenland, which occurred on November 30, 2015, (x) Frenco, which occurred on August 12, 2015, (xi) HKF Group, which occurred on February 11, 2016, (xii) Manchester Motor, which occurred on February 29, 2016, (xiii) Braymarc, which occurred on April 5, 2016, (xiv) Paynes, which occurred on April 8, 2016, (xv) Luton, which occurred on March 18, 2016, (xvi) FPG Limited, which occurred on April 29, 2016, (xvii) Dunmow, which occurred on June 10, 2016 and (xviii) Coler, which occurred on December 9, 2015, had each of these acquisitions occurred on July 1, 2015.
In the case of our newly acquired businesses, it generally takes a few months for their EBITDA to mature and reflect the full impact of synergies. For this reason, when estimating run-rate EBITDA for our newly acquired businesses, we evaluate the EBITDA contribution of each business on an individual basis. In certain instances, where the results of the applicable business have been consolidated within our Group results for a significant period of time, we have calculated run-rate EBITDA by annualizing the aggregate EBITDA generated by such business following its acquisition. In other instances, in calculating run-rate EBITDA, we have taken into account the actual EBITDA contribution of such business prior to its acquisition. In the case of
6
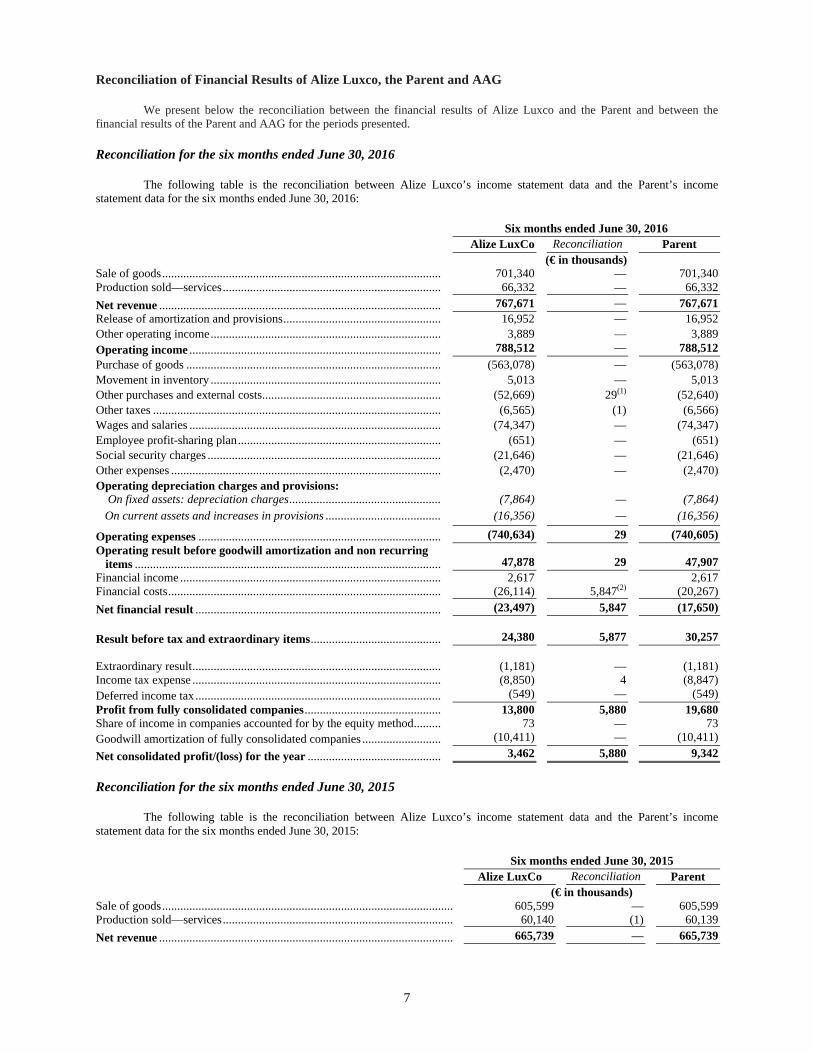
certain businesses, we have only taken into account the run-rate effect of synergies we expect to realize in respect of these companies.
The synergies that we have estimated in this add back consist primarily of (i) purchasing synergies that, based on our review of the existing arrangements of these businesses with their suppliers, and our experience with acquiring businesses of similar size and scale, we expect to realize by way of additional rebates and reduction in the price of goods sold once the pricing terms available to our Group are fully extended to these newly acquired businesses, (ii) incremental management fees that we expect to receive from our suppliers due to the higher volumes of business that we expect to conduct with them through our trading groups as a result of our acquisition of several affiliated independent distributors in the year 2015 and (iii) personnel synergies thatwe expect to realize through the reorganization of employment structures in the various companies we have acquired. Affiliated independent distributors that we acquire use our trading group to source a greater proportion of their purchasing requirements through us than they did prior to becoming our subsidiaries.
(g) CVAE (Cotisation sur la valeur ajoutée des entreprises) is a French business tax (based on sales less direct costs), which is accounted for as an operating expense under Luxembourg GAAP and French GAAP, but is economically similar to income tax, and we have consequently added back for the purposes of this presentation.
(h) Reflects the EBITDA and run-rate effect of the loss related to the termination of the distribution contract with one of our affiliated distributors for the nine months to March 31, 2016, when this contract was terminated.
(i) In the unlikely event that the acquisition of the FPS Target Group is not consummated, we estimate that our Pro Forma Adjusted EBITDA will be approximately €112.7 million, assuming no changes to our results of operations between June 30, 2016 and the date of termination of the Acquisition Agreement.
7
Reconciliation of Financial Results of Alize Luxco, the Parent and AAG
We present below the reconciliation between the financial results of Alize Luxco and the Parent and between the financial results of the Parent and AAG for the periods presented.
Reconciliation for the six months ended June 30, 2016
The following table is the reconciliation between Alize Luxco’s income statement data and the Parent’s income statement data for the six months ended June 30, 2016:
Six months ended June 30, 2016
Alize LuxCo Reconciliation Parent
(€ in thousands)Sale of goods............................................................................................ 701,340 — 701,340Production sold—services........................................................................ 66,332 — 66,332
Net revenue ............................................................................................. 767,671 — 767,671
Release of amortization and provisions.................................................... 16,952 — 16,952
Other operating income............................................................................ 3,889 — 3,889
Operating income ................................................................................... 788,512 — 788,512
Purchase of goods .................................................................................... (563,078) — (563,078)
Movement in inventory ............................................................................ 5,013 — 5,013
Other purchases and external costs........................................................... (52,669) 29(1) (52,640)
Other taxes ............................................................................................... (6,565) (1) (6,566)
Wages and salaries ................................................................................... (74,347) — (74,347)
Employee profit-sharing plan................................................................... (651) — (651)
Social security charges ............................................................................. (21,646) — (21,646)
Other expenses ......................................................................................... (2,470) — (2,470)
Operating depreciation charges and provisions: On fixed assets: depreciation charges.................................................. (7,864) — (7,864)
On current assets and increases in provisions ...................................... (16,356) — (16,356)
Operating expenses ................................................................................ (740,634) 29 (740,605)
Operating result before goodwill amortization and non recurring items ..................................................................................................... 47,878 29 47,907
Financial income ...................................................................................... 2,617 2,617Financial costs.......................................................................................... (26,114) 5,847(2) (20,267)
Net financial result ................................................................................. (23,497) 5,847 (17,650)
Result before tax and extraordinary items........................................... 24,380 5,877 30,257
Extraordinary result.................................................................................. (1,181) — (1,181)Income tax expense .................................................................................. (8,850) 4 (8,847)
Deferred income tax ................................................................................. (549) — (549)
Profit from fully consolidated companies............................................. 13,800 5,880 19,680Share of income in companies accounted for by the equity method......... 73 — 73
Goodwill amortization of fully consolidated companies .......................... (10,411) — (10,411)
Net consolidated profit/(loss) for the year ............................................ 3,462 5,880 9,342
Reconciliation for the six months ended June 30, 2015
The following table is the reconciliation between Alize Luxco’s income statement data and the Parent’s income statement data for the six months ended June 30, 2015:
Six months ended June 30, 2015
Alize LuxCo Reconciliation Parent
(€ in thousands)Sale of goods................................................................................................ 605,599 — 605,599Production sold—services............................................................................ 60,140 (1) 60,139
Net revenue ................................................................................................. 665,739 — 665,739

8
Six months ended June 30, 2015
Alize LuxCo Reconciliation Parent
(€ in thousands)Release of amortization and provisions........................................................ 6,430 — 6,430
Other operating income................................................................................ 3,893 — 3,893
Operating income ....................................................................................... 676,062 — 676,062
Purchase of goods ........................................................................................ (499,534) — (499,534)
Movement in inventory ................................................................................ (360) — (360)
Other purchases and external costs............................................................... (45,112) 32(1) (45,080)
Other taxes ................................................................................................... (6,503) — (6,503)
Wages and salaries ....................................................................................... (57,360) — (57,360)
Employee profit-sharing plan....................................................................... (632) — (632)
Social security charges ................................................................................. (17,912) — (17,912)
Other expenses ............................................................................................. (1,871) — (1,871)
Operating depreciation charges and provisions: On fixed assets: depreciation charges....................................................... (6,010) — (6,010)
On current assets and increases in provisions .......................................... (7,845) — (7,845)
Operating expenses .................................................................................... (643,139) 32 (643,107)
Operating result before goodwill amortization and non recurring items ......................................................................................................... 32,923 32 32,955
Financial income .......................................................................................... 791 — 791Financial costs.............................................................................................. (18,342) 5,368(2) (12,974)
Net financial result ..................................................................................... (17,551) 5,368 (12,183)
Result before tax and extraordinary items............................................... 15,372 5,400 20,772
Extraordinary result...................................................................................... (629) — (629)Income tax expense ...................................................................................... (6,887) 208 (6,679)Deferred income tax ..................................................................................... (325) — (325)
Profit from fully consolidated companies................................................. 7,532 5,607 13,139
Share of income in companies accounted for by the equity method............. — — —
Goodwill amortization of fully consolidated companies .............................. (8,095) — (8,095)
Net consolidated profit/(loss) for the year ................................................ (564) 5,608 5,044
Reconciliation for the year ended December 31, 2015
The following table is the reconciliation among Alize Luxco’s income statement data, the Parent’s income statement data and AAG’s income statement data for the year ended December 31, 2015:
Year ended December 31, 2015
Alize LuxCo Reconciliation Parent Reconciliation AAG
(€ in thousands)Sale of goods ............................................................................... 1,204,621 — 1,204,621 — 1,204,621Production sold—services ........................................................... 120,441 — 120,441 — 120,441
Net revenue ................................................................................ 1,325,062 — 1,325,062 — 1,325,062
Release of amortization and provisions ................................ 16,715 — 16,715 — 16,715
Other operating income ............................................................... 5,918 — 5,918 1,285(8) 7,203
Operating income ................................................................ 1,347,695 — 1,347,695 1,285 1,348,980
Purchase of goods........................................................................(1,004,061) — (1,004,061) — (1,004,061)
Movement in inventory ............................................................... 9,087 — 9,087 — 9,087
Other purchases and external costs .............................................. (84,694) 101(1) (84,593) (310)(3) (84,903)
Other taxes................................................................................... (12,393) — (12,393) (8) (12,401)
Wages and salaries ................................................................ (115,004) — (115,004) 640(4) (114,364)
Employee profit-sharing plan ...................................................... (1,215) — (1,215) — (1,215)
Social security charges ................................................................ (35,521) — (35,521) 37(4) (35,484)
Other expenses ............................................................................ (3,391) — (3,931) (998)(3)(5) (4,389)
Operating depreciation charges and provisions:On fixed assets: depreciation charges ......................................... (13,170) — (13,170) 1,965(6) (11,205)
On current assets and increases in provisions............................. (18,017) — (18,017) — (18,017)

9
Year ended December 31, 2015
Alize LuxCo Reconciliation Parent Reconciliation AAG
(€ in thousands)
Operating expenses................................................................ (1,278,379) 101 (1,278,278) 1,326 (1,276,952)
Operating result before goodwill amortization and non recurring items................................................................ 69,317 100 69,417 2,611 72,028
Financial income ......................................................................... 1,995 (1) 1,994 (158)(7) 1,836Financial costs ............................................................................. (39,370) 10,828(2) (28,542) 94(7) (28,448)
Net financial result................................................................ (37,375) 10,827 (26,548) (64) (26,612)
Result before tax and extraordinary items .............................. 31,942 10,927 42,869 2,547 45,416
Extraordinary result ................................................................ (2,647) (2) (2,649) (53) (2,702)Income tax expense ................................................................ (9,573) (2,179) (11,752) (293) (12,045)
Deferred income tax ................................................................ (1,009) (3) (1,012) 3 (1,009)
Profit from fully consolidated companies ................................ 18,713 8,743 27,456 2,204 29,660
Share of income in companies accounted for by the equity method .......................................................................... — — 88 — 88
Goodwill amortization of fully consolidated companies ................................................................................ (17,300) — (17,300) (489)(8) (17,789)
Net consolidated profit/(loss) for the year................................ 1,501 8,743 10,244 1,715 11,959
(1) Represents administrative costs borne by Alize Luxco which is not reinvoiced to the Parent or its subsidiaries.
(2) Represents PECs bearing capitalized interest at 8%, initially invested by our shareholders to fund Alize Luxco. The proceeds of these PECs were reinvested as equity into the Parent.
(3) Represents primarily the impact of advisory fees invoiced by our shareholders.
(4) Represents remuneration of management employed by the Parent, which costs are reinvoiced to AAG.
(5) Represents management costs reinvoiced from the Parent to AAG.
(6) Represents depreciation on capitalized costs in connection with the refinancing we implemented on December 1, 2014 at the Parent level in connection with the acquisition of AAG by Alliance Automotive Investment.
(7) Represents the difference between the amortization and interest schedule of the funding loans made by the Parent to AAG,and the interest schedule of the €225,000,000 aggregate principal amount of 6.25% Senior Secured Notes due 2021 and the Floating Rate Notes (together, the “Original Notes”) and the further €65,000,000 aggregate principal amount of 6.25% Senior Secured Notes due 2021 issued on May 13, 2015 and the further €70,000,000 6.25% Senior Secured Notes due 2021 issued on February 9, 2016 (together, the “Additional Fixed Rate Notes”) at the level of the Parent. The Parent is primarily financed by the Original Notes and the Additional Fixed Rate Notes whereas AAG is primarily financed by funding loans from the Parent.
(8) Represents the impact on goodwill amortization of AAG’s acquisition by Alliance Automotive Investment.
Reconciliation as of June 30, 2016
The following table is the reconciliation between Alize Luxco’s balance sheet data and the Parent’s balance sheet data as of June
30, 2016:
Six months ended June 30, 2016
Alize LuxCo Reconciliation Parent
(€ in thousands)
Intangible assets ......................................................................... 360,030 (300) 359,730Tangible asset............................................................................. 41,682 — 41,682
Financial assets........................................................................... 14,012 300 14,312
Non-current Assets ................................................................... 415,724 — 415,724Inventories and work in progress ............................................... 189,594 — 189,594Accounts receivable ................................................................... 271,999 — 271,999
Other assets ................................................................................ 151,300 (2,460)(1) 148,840
Current Assets .......................................................................... 612,893 (2,460) 610,433Cash and short term deposits...................................................... 120,066 (158)(2) 119,908
Total assets ................................................................................ 1,148,683 (2,618) 1,146,065
Equity—group share .................................................................... 9,520 153,620(3)(4) 163,140Non-controlling interests ............................................... 8,728 (416)(4) 8,312

10
Provisions for liabilities and charges ...................................... 16,314 — 16,314Financial liabilities ..................................................................... 679,893 (155,691)(3) 524,202Trade payable ............................................................................. 325,010 (61) 324,949Other liabilities........................................................................... 100,658 (70) 100,588Deferred income......................................................................... 8,560 — 8,560
Total liabilities ........................................................................... 1,148,683 (2,618) 1,146,065
Total equity and liabilities ....................................................... 1,148,683 (2,618) 1,146,065
Reconciliation as of June 30, 2015
The following table is the reconciliation between Alize Luxco’s balance sheet data and the Parent’s balance sheet data as of June
30, 2015:
Six months ended June 30, 2015
Alize LuxCo Reconciliation Parent
(€ in thousands)
Intangible assets ......................................................................... 314,330 — 314,330Tangible asset ............................................................................. 35,600 — 35,600
Financial assets........................................................................... 11,734 — 11,734
Non-current Assets ................................................................... 361,664 — 361,664
Inventories and work in progress ............................................... 141,917 — 141,917Accounts receivable ................................................................... 248,253 — 248,253
Other assets ................................................................................ 114,226 (219)(1) 114,007
Current Assets .......................................................................... 504,396 (219) 504,177Cash and short term deposits...................................................... 92,721 (53)(2) 92,668
Total assets ................................................................................ 958,781 (272) 958,509
Equity—group share .................................................................... (13,871) 144,238(3)(4) 130,367Non-controlling interests ............................................... 7,848 — 7,848Provisions for liabilities and charges ...................................... 12,845 — 12,845Financial liabilities ..................................................................... 574,062 (144,460)(3) 429,602Trade payable ............................................................................. 276,199 (49) 276,150Other liabilities........................................................................... 97,617 (1) 97,616Deferred income......................................................................... 4,081 — 4,081
Total liabilities .......................................................................... 958,781 (272) 958,509
Total equity and liabilities ....................................................... 958,781 (272) 958,509
Reconciliation as of December 31, 2015
The following table is the reconciliation among Alize Luxco’s balance sheet data, the Parent’s balance sheet data and AAG’s balance sheet data as of December 31, 2015:
Year months ended December 31, 2015
Alize LuxCo Reconciliation Parent Reconciliation AAG
(€ in thousands)
Intangible assets .....................................................343,667 — 343,667 (136,680)(5)(6) 206,987Tangible asset .........................................................42,914 — 42,914 (6,426)(5) 36,488Financial assets.......................................................8,077 — 8,077 (2,041)(5) 6,036
Non-current Assets ................................394,658 — 394,658 (145,147) 249,511
Inventories and work in progress ...........................177,433 — 177,433 (27,600)(5) 149,833Accounts receivable ................................ 251,341 — 251,341 (9,006)(5) 242,335Other assets ............................................................125,359 (2,426)(1) 121,933 (25,464)(5) 96,469
Current Assets ......................................................553,133 (2,426) 550,707 (62,070) 488,637Cash and short term deposits................................95,668 (13)(2) 95,655 (15,867)(5) 79,788Total assets ............................................................1,043,459 (2,439) 1,041,020 (223,084) 817,936

11
Equity—group share ................................ 11,285 147,523(3)(4) 158,808 (153,820) 4,988Non-controlling interests ...............................9,668 — 9,668 5,211(6) 14,879Provisions for liabilities andcharges ................................................................16,011 — 16,011 (2,554)(5) 13,457Financial liabilities ................................ 614,183 (149,851)(3) 464,332 (55,010)(5)(7) 409,322Trade payable .........................................................277,004 (73) 276,931 (4,917)(5) 272,014Other liabilities.......................................................108,685 (38) 108,647 (10,497)(5) 98,150Deferred income.....................................................6,623 — 6,623 (1,497)(5) 5,126Total liabilities ......................................................1,043,459 (2,439) 1,041,020 (223,084) 817,936
Total equity and liabilities ................................1,043,459 (2,439) 1,041,020 (223,084) 817,936
(1) Represents a tax credit recognized at the level of Alize Topco Ltd, the head of the UK tax group.
(2) Represents cash at Alize Luxco.
(3) Represents PECs bearing capitalized interest at 8%, initially invested by shareholders to fund Alize Luxco. The proceeds of these PECs were reinvested as equity into the Parent.
(4) Represents the difference in net income between the Parent and Alize Luxco.
(5) Represents the impact of the consolidation of AA Germany, which includes the financial results of Coler. AA Germany is a direct subsidiary of the Parent and is not consolidated into the financial results of AAG.
(6) Represents the impact on goodwill amortization of AAG’s acquisition by Alliance Automotive Investment.
(7) Represents primarily the difference between the amortization and interest schedule of the funding loans made by the Parent to AAG, and the interest schedule of the Original Notes and the Additional Fixed Rate Notes at the level of the Parent. The Parent is primarily financed by the Original Notes and the Additional Fixed Rate Notes whereas AAG is primarily financed by funding loans from the Parent.

12
UNAUDITED PRO FORMA CONDENSED COMBINED FINANCIAL DATA
Basis of preparation
We present below the unaudited pro forma condensed combined income statement data for the yearended December 31, 2015 and the unaudited pro forma condensed combined balance sheet data as of December 31,2015 of Alize Luxco (together, the “2015 unaudited pro forma condensed combined financial data”). The2015 unaudited pro forma condensed combined financial data are intended to give effect to the acquisition of theFPS Target Group as if it had occurred on January 1, 2015, in the case of the pro forma income statement, and asof December 31, 2015, in the case of the pro forma balance sheet. The FPS Target Group consists of the UK-basedparts division of Lookers PLC comprising a holding company, FPS Holdings, and three operating companies,including Ferraris Piston, Apec and BTN. The 2015 unaudited pro forma condensed combined financial data doesnot give effect to any acquisitions completed in 2015 or 2016, or during any other period.
In the unlikely event that the acquisition of the FPS Target Group is not consummated, we intend to usethe net proceeds from the offering of the Notes to repay certain of our indebtedness. In such a case, we would notbenefit from the financial results of the FPS Target Group (including the effect of any related synergies), and wewould have a different financial profile than if we were to acquire the FPS Target Group.
The pro forma adjustments to the 2015 unaudited pro forma condensed combined financial data have beenmade based on preliminary assumptions and estimates, including assumptions relating to allocation of the purchaseprice to the assets acquired and liabilities assumed from the companies that comprise the FPS Target Group basedon our preliminary estimates of fair value. In accordance with Luxembourg GAAP, purchase price allocation maybe adjusted during the period ending with the close of the first financial year beginning after the acquisition of theFPS Target Group (i.e., the year ending December 31, 2017) and may, therefore, differ from the adjustmentsreflected in the 2015 unaudited pro forma condensed combined financial data presented below.
The unaudited pro forma adjustments to the 2015 unaudited pro forma condensed combined financial data arebased upon available information and assumptions which we believe are reasonable in the circumstances. Wedescribe the assumptions underlying the pro forma adjustments in the notes accompanying the applicablestatements below, which should be read in conjunction with the relevant unaudited pro forma condensed combinedfinancial data. Pro forma adjustments reflect only those adjustments which are factually determinable and do notinclude the impact of contingencies which will not be known until resolution of any such contingency. Thepro forma financial data presented in this disclosure supplement, other than in the case of Pro Forma AdjustedEBITDA, does not reflect any cost savings or other synergies which may result from the acquisition of the FPSTarget Group and does not reflect any non-recurring or one-off items such as integration costs which may beincurred in the future as a result of the relevant acquisition. The unaudited pro forma condensed combined incomestatement data and balance sheet data should not be considered indicative of actual results that would have beenachieved had the acquisition of the FPS Target Group been consummated on the date or for the periods indicatedand do not purport to indicate results of operations as of any future date or for any future period.
The 2015 unaudited pro forma condensed combined financial data presented below have not been preparedin accordance with the requirements of Regulation S-X of the U.S. Securities Act, the Prospectus Directive, or anygenerally accepted accounting standards including Luxembourg GAAP or French GAAP.

13
Unaudited pro forma condensed combined income statement data for the year ended December 31, 2015
Alize Luxco(1)
FPS Target Group
(Combined)(2) Pro Forma Adjustments(3)
Pro FormaCondensed Combined
Intercompany eliminations and
other reclassification (a)
Other consolidation adjustments(b)
Financing adjustments (c)
(€ in millions)
Net revenue ............................................. 1,325.1 301.4 (75.2) — — 1,551.3Other operating income ............................ 4.6 — — — — 4.6Cost of sales(1) ........................................... (995.0) (250.9) 75.2 40.3 — (1,130.4)Other external charges .............................. (97.1) (29.4) — 0.8 — (125.7)Staff costs(1)............................................... (151.7) — — (41.2) — (192.9)Value adjustments in respect of
formation expenses and of tangible and intangible fixed assets: (30.5) (3.4) 17.3 — (0.6) (17.2)
Goodwill amortization of fully consolidated entities.............................. (17.3) — 17.3 — — —
Other value adjustment included in above caption ........................................ (13.2) (3.4) — — (0.6) (17.2)
Other operating charges............................ (3.3) — — — — (3.3)
Operating results .................................... 52.0 17.8 17.3 — (0.6) 86.5Net Financial result ................................ (37.4) — — — (11.3) (48.6)Tax on profit or loss on ordinary
activities ............................................... (10.6) (3.6) — — 2.3 (11.9)Extraordinary profit or loss................... (2.6) — — — — (2.6)Share of profit of an associate................ 0.1 — — — — 0.1
Goodwill amortization............................ (17.3) (2.8) — (20.1)
Profit or loss for the financial year........ 1.5 14.2 — (2.8) (9.6) 3.3
(1) The income statement data presented above for Alize Luxco and its consolidated subsidiaries has been derived from the audited consolidated financial statements of Alize Luxco and its consolidated subsidiaries as of and for the year ended December 31, 2015.
This is a condensed presentation of our income statement where we have, in certain instances, combined under one line item the data that we would traditionally present under various separate line items in the income statement for Alize Luxco. For example, in the table above, under “Cost of sales” we present the sum of the data we would traditionally present under the following two line items: “Raw materials and consumables” and “Value adjustments in respect of current assets, to the extent that they exceed the amount of value adjustments which are normal in the undertaking concerned.” In addition, under “Staff costs” we present the sum of the data we would traditionally present under the following line items: “Wages and salaries” and “Social security charges, with a separate indication of those relating to pensions”.
(2) The unaudited combined income statement data presented above for the FPS Target Group has been calculated by adding the income statement data for each of the companies comprising the FPS Target Group derived, in each case, from the standalone audited financial statements of the applicable company as of and for the year ended December 31, 2015, and translated into euro using an exchange rate of £1.00 = €1.38, which corresponds to the average rate of exchange between the pounds sterling and the euro that we had applied in respect of Alize Luxco’s income statement data for the year ended December 31, 2015. The audited financial statements of the companies comprising the FPS Target Group are prepared in accordance with UK GAAP. In deriving the combined income statement data of the FPS Target Group we have made no adjustments for differences between UK GAAP and Luxembourg GAAP as we believe no material differences exist between these accounting standards. The table below presents the unaudited condensed combined income statement of the FPS Target Group for the year ended December 31, 2015.

14
FPS Holdings Ferraris Piston Apec BTN
Accounting Principles and
certainPro Forma
Adjustments(a)
FPS Target Group
(Combined)
(€ in millions)
Net revenue ............................. — 227.4 45.7 28.3 — 301.4Other income ............................ — — — — — —Cost of sales ............................. — (193.1) (36.7) (21.1) — (250.9)Other external charges .............. — (19.5) (6.1) (4.8) 1.1 (29.4)Staff costs ................................. — — — — — —Value adjustments in
respect of formation expenses and of tangible and intangible fixed assets: ................................... — (2.2) (0.4) (0.2) (0.6) (3.4)
Goodwill amortization of fully consolidated entities...... — — — — — —
Other value adjustment included in above caption ..... — (2.2) (0.4) (0.2) (0.6) (3.4)
Other operating charges............ — — — — — —
Operating results .................... — 12.6 2.5 2.2 0.5 17.8Net Financial result ................ 6.6 0.1 — (0.1) (6.6) —Tax on profit or loss on
ordinary activities ............... — (2.6) (0.5) (0.4) (3.5)Extraordinary profit or
loss........................................ — — — — — —Share of profit of an
associate ............................... — — — — — —
Profit or loss for the financial year ....................... 6.6 10.1 2.0 1.6 (6.1) 14.2
(a) Represents the elimination of the dividends received by FPS Holdings from its subsidiaries and recognized under the line item “Net financial result” in FPS Holdings’ audited income statement.
In addition, represents the impact of real estate assets acquired by the FPS Target Group from Lookers PLC pursuant to the Acquisition Agreement. If these properties had been acquired on January 1, 2015, the impact on the FPS Target Group’s combined income statement for the year ended December 31, 2015 would have been (i) a decrease of £0.8 million (€1.1 million) under “Other external charges” representing the amount of rental payment made by the FPS Target Group to Lookers PLC in respect of these properties for the year ended December 31, 2015 and (ii) an increase of €0.6 million under “Value adjustments in respect of formation expenses and of tangible and intangible fixed assets” representing the amount of depreciation expense, calculated using the straight-line method of depreciation based on an assumed useful life of 20 years for these real estate assets in line with Alize Luxco’s accounting policies. For this calculation, we have used an exchange rate of £1.00 = €1.20 to convert from pounds sterling to euro.
(3) The following pro forma adjustments have been applied to give effect to the acquisition of the FPS Target Group as if it had occurred on January 1, 2015:
(a) Intercompany eliminations and other reclassification
• A decrease in net revenue to eliminate sales made by the FPS Target Group to Alize Luxco during the year ended December 31, 2015 in the amount of £75.2 million and a corresponding decrease in raw materials and consumables representing the purchases made by Alize Luxco from the FPS Target Group.
• The reclassification of goodwill amortization in the amount of €17.3 million, recorded under the line item “Value adjustments in respect of formation expenses and of tangible and intangible fixed assets—Goodwill amortization of fully consolidated entities” in Alize Luxco’s audited income statement included under “Operating result before goodwill amortization and non recurring items” to the line
15
item “Goodwill amortization” under operating profit in the pro forma condensed combined income statement data presented above.
(b) Other consolidation adjustments include
• The reclassification of transportation costs in the amount of £9.4 million (€13.0 million), recorded under the line item “Cost of sales” in the FPS Target Group’s audited financial statements to the line item “Other external charges” in the pro forma condensed combined income statement data presented above, consistent with how these charges are traditionally recorded in Alize Luxco’s financial statements.
• The reclassification of rebates collected from suppliers in the amount of £19.8 million (€27.3 million), recorded as a reduction of external costs in the FPS Target Group’s audited financial statements to the line item “Cost of sales” in the pro forma condensed combined income statement data presented above, consistent with how these charges are traditionally recorded in Alize Luxco’s financial statements.
• The reclassification of staff costs in the amount of £29.9 million (€41.2 million), recorded under “Selling and distribution costs” and “Administrative costs” in the FPS Target Group’s audited financial statements, and under “Other external cost” in the column entitled “FPS Target Group (Combined)” above, to the line item “Staff costs” in the pro forma condensed combined income statement data presented above, consistent with how these charges are traditionally recorded in Alize Luxco’s financial statements.
• The impact of the application of the acquisition method of accounting under Luxembourg GAAP. Upon the completion of the acquisition of the FPS Target Group, we expect to record an increase in the fair value of our intangible assets as part of purchase price allocation under Luxembourg GAAP. Based on a preliminary assessment, we estimate an increase in our amortization in the amount of €2.8 million. This adjustment represents the increase in amortization that would have been realized had the purchase accounting adjustments, based on the useful life defined as of the date of acquisition, been made on December 31, 2015.
(c) Financing adjustments
• The adjustment to operating expenses of €0.6 million represents the straight-line amortization of the debt issuance costs relating to the Notes offered hereby (estimated at €4.0 million) over the life of the Notes offered hereby.
• The adjustment to net financial result represents the interest expense of €11.3 million that we expect to incur in connection with the Notes offered hereby.
• The adjustment to “Tax on profit or loss on ordinary activities” represents the corporate tax impact, based on a tax rate of 20% applicable in the United Kingdom, calculated on the €11.3 million of interest expense that we expect to incur in connection with the Notes offered hereby.
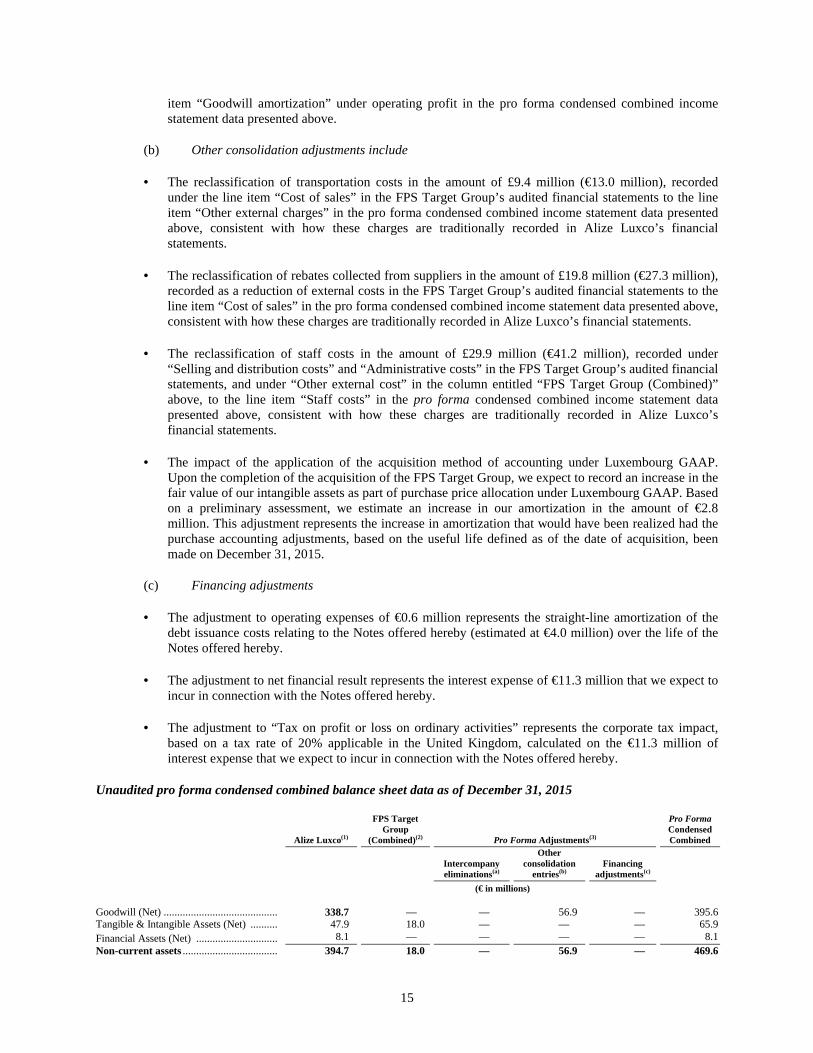
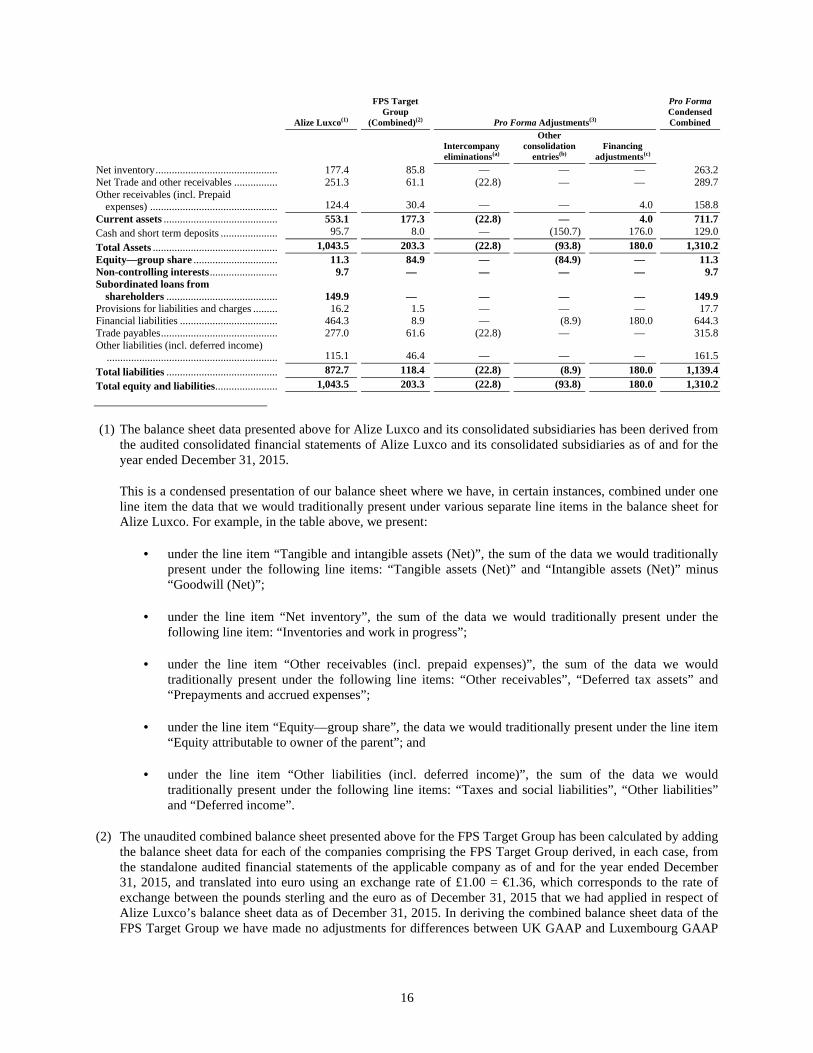
Unaudited pro forma condensed combined balance sheet data as of December 31, 2015
Alize Luxco(1)
FPS Target Group
(Combined)(2) Pro Forma Adjustments(3)
Pro FormaCondensedCombined
Intercompany eliminations(a)
Otherconsolidation
entries(b)Financing
adjustments(c)
(€ in millions)
Goodwill (Net) .......................................... 338.7 — — 56.9 — 395.6Tangible & Intangible Assets (Net) .......... 47.9 18.0 — — — 65.9
Financial Assets (Net) .............................. 8.1 — — — — 8.1
Non-current assets ................................... 394.7 18.0 — 56.9 — 469.6
16
Alize Luxco(1)
FPS Target Group
(Combined)(2) Pro Forma Adjustments(3)
Pro FormaCondensedCombined
Intercompany eliminations(a)
Otherconsolidation
entries(b)Financing
adjustments(c)
Net inventory............................................. 177.4 85.8 — — — 263.2Net Trade and other receivables ................ 251.3 61.1 (22.8) — — 289.7Other receivables (incl. Prepaid
expenses) ............................................... 124.4 30.4 — — 4.0 158.8
Current assets .......................................... 553.1 177.3 (22.8) — 4.0 711.7
Cash and short term deposits ..................... 95.7 8.0 — (150.7) 176.0 129.0
Total Assets .............................................. 1,043.5 203.3 (22.8) (93.8) 180.0 1,310.2
Equity—group share ............................... 11.3 84.9 — (84.9) — 11.3Non-controlling interests......................... 9.7 — — — — 9.7Subordinated loans from
shareholders ......................................... 149.9 — — — — 149.9Provisions for liabilities and charges ......... 16.2 1.5 — — — 17.7Financial liabilities .................................... 464.3 8.9 — (8.9) 180.0 644.3Trade payables........................................... 277.0 61.6 (22.8) — — 315.8Other liabilities (incl. deferred income)
............................................................... 115.1 46.4 — — — 161.5
Total liabilities ......................................... 872.7 118.4 (22.8) (8.9) 180.0 1,139.4
Total equity and liabilities....................... 1,043.5 203.3 (22.8) (93.8) 180.0 1,310.2
(1) The balance sheet data presented above for Alize Luxco and its consolidated subsidiaries has been derived from the audited consolidated financial statements of Alize Luxco and its consolidated subsidiaries as of and for the year ended December 31, 2015.
This is a condensed presentation of our balance sheet where we have, in certain instances, combined under one line item the data that we would traditionally present under various separate line items in the balance sheet for Alize Luxco. For example, in the table above, we present:
• under the line item “Tangible and intangible assets (Net)”, the sum of the data we would traditionally present under the following line items: “Tangible assets (Net)” and “Intangible assets (Net)” minus “Goodwill (Net)”;
• under the line item “Net inventory”, the sum of the data we would traditionally present under the following line item: “Inventories and work in progress”;
• under the line item “Other receivables (incl. prepaid expenses)”, the sum of the data we would traditionally present under the following line items: “Other receivables”, “Deferred tax assets” and “Prepayments and accrued expenses”;
• under the line item “Equity—group share”, the data we would traditionally present under the line item “Equity attributable to owner of the parent”; and
• under the line item “Other liabilities (incl. deferred income)”, the sum of the data we would traditionally present under the following line items: “Taxes and social liabilities”, “Other liabilities” and “Deferred income”.
(2) The unaudited combined balance sheet presented above for the FPS Target Group has been calculated by adding the balance sheet data for each of the companies comprising the FPS Target Group derived, in each case, from the standalone audited financial statements of the applicable company as of and for the year ended December 31, 2015, and translated into euro using an exchange rate of £1.00 = €1.36, which corresponds to the rate of exchange between the pounds sterling and the euro as of December 31, 2015 that we had applied in respect of Alize Luxco’s balance sheet data as of December 31, 2015. In deriving the combined balance sheet data of the FPS Target Group we have made no adjustments for differences between UK GAAP and Luxembourg GAAP

17
as we believe no material differences exist between these accounting standards. The table below presents the unaudited condensed combined balance sheet of the FPS Target Group as of December 31, 2015.
FPS HoldingsFerraris Piston Apec BTN
Accounting Principles and
certain Pro Forma
Adjustments
FPS Target Group
(Combined)
(€ in millions)
Goodwill (Net) ......................................... — — — — — —Tangible and Intangible Assets (Net) ....... — 6.1 0.6 0.4 10.9 18.0
Financial Assets (Net) ............................. 18.2 — — — (18.2) —
Non-current assets .................................. 18.2 6.1 0.6 0.4 (7.3) 18.0Net inventory............................................ — 63.0 11.3 11.5 — 85.8Net Trade and other receivables ............... — 45.0 12.9 3.2 — 61.1Other receivables (incl. Prepaid
expenses) .............................................. 0.7 20.3 9.0 0.4 — 30.4
Current assets ......................................... 0.7 128.3 33.2 15.1 — 177.3
Cash and short term deposits .................... — 6.9 1.5 1.6 (2.0) 8.0
Total Assets ............................................. 18.9 141.3 35.3 17.1 (9.3) 203.3
Equity—group share .............................. 1.0 71.5 20.1 10.5 (18.2) 84.9Non-controlling interests........................ — — — — — —Subordinated loans from
shareholders ........................................ — — — — — —Provisions for liabilities and charges ........ — 1.1 — 0.4 — 1.5Financial liabilities ................................... — — — — 8.9 8.9Trade payable ........................................... — 51.7 6.5 3.4 — 61.6Other liabilities (incl. Deferred
income) ................................................ 17.9 17.1 8.7 2.7 — 46.4
Total liabilities ........................................ 17.9 69.8 15.2 6.6 8.9 118.4
Total equity and liabilities...................... 18.9 141.3 35.3 17.1 (9.3) 203.3
(a) Represents the elimination of shareholders’ equity of Ferraris Piston, Apec and BTN in the aggregate amount of £13.4 million (€18.2 million) recorded under “Financial assets” in the balance sheet of FPS Holdings, with a corresponding decrease under “Equity—group share” in the table above.
In addition, represents the impact of real estate assets acquired by the FPS Target Group from Lookers PLC pursuant to the Acquisition Agreement. If these properties had been acquired on December 31, 2015, the impact on the FPS Target Group’s combined balance sheet as of December 31, 2015 would have been (i) an increase of €10.9 million under “Tangible and intangible assets (Net)” equal to the purchase price of £9.1 million (€10.9 million) for these real estate assets, (ii) a decrease of €2.0 million under “Cash and short term deposits” and an increase of €8.9 million under “Financial liabilities” representing the cash consideration of €10.9 million for these real estate assets. For this calculation, we have used an exchange rate of £1.00 = €1.20 to convert from pounds sterling to euro.
(3) The following pro forma adjustments have been applied to give effect to the acquisition of the FPS Target Group as if it had occurred on December 31, 2015:
(a) Intercompany eliminations
• A decrease in “Trade receivables” to eliminate “Net trade and other receivables” owed by Alize Luxco to the FPS Target Group in connection with sales made to it by the FPS Target Group during the year ended December 31, 2015, and a corresponding decrease in “Trade payables”.
(b) Other consolidation adjustments include
• A decrease of €150.7 million in “Cash and short term deposits” representing the purchase price and certain fees that we expect to pay in connection with the acquisition of the FPS Target Group (€125.6

18
million). For this calculation, we have used an exchange rate of £1.00 = €1.20 to convert from pounds sterling to euro.
• The impact of purchase price allocation under Luxembourg GAAP: Upon the completion of the acquisition of the FPS Target Group, we expect to record an increase in the fair value of our intangible assets as part of purchase price allocation under Luxembourg GAAP. Based on a preliminary assessment, we estimate an increase in “Goodwill” of €56.9 million, based on useful life defined as of the date of acquisition, had the acquisition been completed on December 31, 2015. This adjustment relating to purchase price allocation reflects the reimbursement of the shareholder loan owed by FPS Holdings to Lookers PLC in the amount of €8.9 million as recorded under the line item “financial liabilities”.
(c) Financing adjustments
• The additional indebtedness represented by the principal amount of the Notes offered hereby recorded under “Financial liabilities” in the amount of €180 million and the amount of cash proceeds, net of issuance costs, expected from the offering of the Notes recorded under “Cash and short term deposits” in the amount of €176.0 million.
• The debt issuance costs estimated in relation to the offering of the Notes recorded as prepaid expenses under “Other receivables” in the amount of €4.0 million.

19
ANNEX F
15698
Text Box

ALIZE LUXCO 1 CONSOLIDATED FINANCIAL STATEMENTS
FOR THE HALF YEAR ENDED JUNE 30th, 2016
SUMMARY
SUMMARY ..................................................................................................................................................... F-4
1. CONSOLIDATED BALANCE SHEET AS AT JUNE 30th, 2016 ......................................................... F-5
2. CONSOLIDATED PROFIT AND LOSS ACCOUNT FOR THE PERIOD ENDED ON
JUNE 30TH, 2016 ..................…………………………………………………………………………... F-7
3. NOTES TO THE CONSOLIDATED FINANCIAL STATEMENTS ..................................................... F-8
A. Significant events during the period........................................................................................................ F-8
B. Scope of consolidation............................................................................................................................. F-8
C. Accounting policies ................................................................................................................................. F-9
D. Details of major items in the Balance Sheet and Profit and Loss Account ............................................ F-13
F-4

1. CONSOLIDATED BALANCE SHEET AS AT JUNE 30th, 2016
ASSETS
In thousands of euros Notes 06/30/2016 12/31/2015
Non current assets 415,724 394,658Fixed assets 415,724 394,658Intangible assets 360,030 343,667
Costs of development I.a 16 16
Concessions, patents, licences, trade marks and similar rights
and assets, if they were 5,167
a) acquired for valuable consideration and need not be shownunder C.13 I.a 5,167 4,974
b) created by the undertaking I.a 0 4,974
Goodwill, to the extent that it was acquired for valuable consideration II 354,847 338,677
Payments on account and intangible assets under development — —
Tangible assets I.b 41,682 42,914
Land and buildings 11,016 11,467
Plant and machinery 13,177 13,975
Other fixtures and fittings, tools and equipment 16,607 16,465
Payments on account and tangible assets in the course of construction 882 1,007
Financial assets I.c 14,012 8,077
Investments in associate 1,324 1,339
Participating interests 7,070 1,490
Loans to undertakings with which the undertaking is linked by
virtue of participating interests 1,008 1,029
Investments held as fixed assets 127 128
Other loans 4,483 4,091
Current assets 582,737 524,583Stocks III 189,594 177,433
Raw materials and consumables 430 324
Work in progress 1,778 1,774
Finished goods and goods for resale 187,386 175,335
Payments on account — —
Debtors 393,143 347,150
Trade debtors IV 271,999
a) becoming due and payable within one year 271,999 251,341
b) becoming due and payable after more than one year 0 251,341
Amounts owed by affiliated undertakings — —
Amounts owed by undertakings with which the undertaking is linked
by virtue of participating interests — —
Deferred interests 18,084 17,970
Other debtors IV 103,060
a) becoming due and payable within one year 103,060 77,839
b) becoming due and payable after more than one year 0 77,839
Cash at bank and in hand 120,066 95,668
Prepayments V 30,156 28,552Prepaid expenses 12,546 10,862
Loans and bonds redemption premium 6,383 6,972
Deferred charges 11,227 10,717
TOTAL (ASSETS) 1,148,683 1,043,461
The underlying notes form an integral part of these consolidated half year accounts.
F-5

CAPITAL, RESERVES AND LIABILITIES
In thousands of euros Notes 06/30/2016 12/31/2015
Capital and reserves VI 18,248 20,954Subscribed capital 361 361
Share premium account 36,708 36,708
Consolidated reserves (25,345) (22,540)
Other reserves, including the fair value reserve
a) other available reserves (25,345) (22,540)
b) other non available reserves (25,345) (22,540)
Currency translation differences (3,070) (201)
Profit or loss for the financial period 866 (3,042)
Equity attributable to owners of the parent 9,520 11,286Non controlling interests 6,132 5,125
Non controlling interest share of profit for the period 2,596 4,543
Non controlling interests 8,728 9,668Preferred Equity Certificates 155,691 149,851
Subordinated loans from shareholders IX 155,691 149,851Provisions VII 16,844 16,183Provisions for pensions and similar obligations 10,055 8,754
Deferred tax liabilities 531 172
Other provisions 6,258 7,257
Creditors 949,340 849,849Debenture loans VIII 462,589 392,024
a) Convertible loans — —
b) Non convertible loans 462,589 392,024
i) becoming due and payable within one year 2,389 2,024
ii) becoming due and payable after more than one year 460,200 390,000
Amounts owed to credit institutions VIII 61,613 72,307
a) becoming due and payable within one year 56,008 44,708
b) becoming due and payable after more than one year 5,605 27,599
Payments received on account of orders in so far as they are shown
separately as deductions from stocks
a) becoming due and payable within one year 38 28
b) becoming due and payable after more than one year 38 28
Trade creditors X
a) becoming due and payable within one year 325,010 277,004
b) becoming due and payable after more than one year 325,010 277,004
Amounts owed to undertakings with which the undertaking is linked by
virtue of participating interests X 3,079 185
a) becoming due and payable within one year 3,079 185
b) becoming due and payable after more than one year — —
Other creditors X
a) Tax authorities 97,011 108,301
b) Social security authorities 33,596 29,943
c) Other creditors 12,576 13,084
i) becoming due and payable within one year 38,107 54,182
ii) becoming due and payable after more than one year 38,107 54,182
d) Social liabilities 12,732 11,092
Deferred income X 8,560 6,624
TOTAL (CAPITAL, RESERVES AND LIABILITIES) 1,148,683 1,043,461
The underlying notes form an integral part of these consolidated half year accounts.
F-6

2. CONSOLIDATED PROFIT AND LOSS ACCOUNT FOR THE PERIOD ENDED
ON JUNE 30TH, 2016
CONSOLIDATED PROFIT AND LOSS ACCOUNT
In thousands of euros Notes 06/30/2016 06/30/2015
NET TURNOVER XI 767,671 665,739
Other operating income 3,455 3,662
(a) Raw materials and consumables (558,065) (499,894)
(b) Other external charges (59,234) (51,615)
Staff costs:
(a) wages and salaries (74,999) (57,992)
(b) social security costs, with a separate indication of those
relating to pensions (21,646) (17,912)
(a) Value adjustments in respect of formation expenses and of
tangible and intangible fixed assets (18,275) (14,105)
Goodwill amortization of fully consolidated entities (10,411) (8,095)
Other value adjustment included in above caption (7,864) (6,010)
(b) Value adjustments in respect of current assets, to the extent that
they exceed the amount of value adjustments which are normal in
the undertaking concerned 1,029 (1,183)
Other operating charges (2,470) (1,871)
Other non recurring items (1,181) (629)
OPERATING RESULT 36,285 24,200
Income from participating interests 46 59
Other interest receivable and similar income 2,571 732
Value adjustments in respect of financial assets and of investments held
as current assets (591) (589)
Interest payable and similar charges, with a separate indication of those
concerning affiliated undertakings (25,523) (17,753)
Interest payable on Prefered Equity Certificates (5,840) (5,368)
Other interest payable and similar charges (19,683) (12,385)
NET FINANCIAL RESULT XII (23,497) (17,551)
Income tax expense (8,850) (6,887)
Deferred income tax (549) (325)
TAX ON PROFIT OR LOSS ON ORDINARY ACTIVITIES XIII (9,399) (7,212)
Share of profit of an associate 73 —
PROFIT OR LOSS FOR THE FINANCIAL PERIOD 3,462 (564)
Attributable to non-controlling interests 2,596 2,407
Attributable to the owners of the parent 866 (2,971)
Earnings per share
Earnings per share attributable to the owners of the parent 0.000024 (0.000082)
The underlying notes form an integral part of these consolidated half year accounts.
F-7
3. NOTES TO THE CONSOLIDATED FINANCIAL STATEMENTS
Figures presented in the tables and related notes are expressed in thousands of euros.
A. Significant events during the period
A tax audit is being performed in AAG companies by French authorities.
I. FINANCING OF THE GROUP
Period ending June 30th, 2016:
The main changes on the financing of the Group during these 6 months are the following:
• issuing of a new senior secured notes of €70.0 million on February 2, 2016 by AA Finance Plc. Part of the funds
generated from the issuance of this loan notes has been used to finance the acquisitions of companies made by
the group, notably 19M€ used by Alliance Automotive France; 9M€ used by Alliance Automotive Germany and
30.2M€ used by Alliance Automotive UK.
• new facilities from new German banks at Coler level for a total of €26.0 million issued by Coler on June 30th,
2016, offset by the repayment of €18.6 million to former pool of banks at Coler level.
II. CORPORATE REORGANIZATION
Period ending June 30th, 2016:
The group through its subsidiary Alliance Automotive France has acquired the 3G shareholding held by AUTO
OMNIA GROUP. Following this acquisition the Group interest in 3G increased from 77.15% to 80.91%.
B. Scope of consolidation
I. CONSOLIDATION CRITERIA
The subsidiaries, joint ventures and the affiliated companies placed under direct control or indirect control of the
ultimate parent company, or placed under companies in which the ultimate parent company has control, joint
control or has a significant influence are included within the scope of the consolidation.
Control is deemed to exist when the Group has the power to determine, either directly or indirectly, the financial
and operating policies of the company such as to benefit from the said company’s operations. Control is assessed
on the basis of actual and potential voting rights.
The companies in which the Group has joint control with a limited number of partners as a result of a contractual
agreement are consolidated using the proportional integration method.
The companies in which the Group has significant influence are consolidated using the equity method.
All significant companies of the Group have been consolidated.
The Group’s activity shows no significant seasonal nature.
II. POST BALANCE SHEET EVENTS
In line with the ongoing development of the group and on the same terms as the loan issued on February 2nd, 2016,
part of the funds from this additional issuance has enabled Alliance Automotive France and Alliance Automotive
UK to make the following acquisitions:
• SODIP, a distribution business in France, acquired in July 2016;
• MULTITRUCK, a distribution business in the UK, acquired in July 2016;
• UNIFACTOR a distribution business, acquired in the UK in September 2016;
• BUSCH AG a distribution business, acquired in Germany in July 2016.
III. COMPANIES INCLUDED WITHIN THE CONSOLIDATION SCOPE
The list of consolidated companies is presented on page F-23.
F-8
B. Scope of consolidation (Continued)
During the 2016 financial half year, the Group (Alize Luxco 1) made the following acquisitions:
• Alliance Automotive France acquired the group AUTO OMNIA on February 1st, 2016;
• Alliance Automotive France acquired through Comptoirs du Frein B2C on April 7th, 2016;
• Alliance Automotive France acquired 100 % of TBS shares on March 1st, 2016;
• Alliance Automotive U.K. acquired 100% of the companies H Kimber Group Limited on February 11th, 2016,
Manchester Motor Factors Limited on February 29th, 2016; Luton Motor Factors Limited on March 18th, 2016;
Braymarc Commercial Components on April 5th, 2016; HS Atec on April 29th 2016 and Paynes Motors Spares;
• SOCALPPA owned by Alliance Automotive France (100%) sold all of its business activity on April 1st, 2016.
The following entities acquired by Alliance Automotive France and Alliance Automotive UK in June 2016 and
which do not have a material contribution in June 2016 consolidated accounts are not included in the half year
consolidation scope:
• PABAN, a distribution business, owned by Alliance Automotive France (100%);
• EDS, a distribution business, owned by Alliance Automotive France (100%);
• COULOIR, a distribution business; owned by Alliance Automotive France (100%);
• Dunmow Motor Factors Limited, a distribution business in the UK, owned by Alliance Automotive UK (100%).
C. Accounting policies
I. BASIS FOR PREPARATION
The consolidated financial statements are established in accordance with Luxembourg Law December 19th, 2002,
as amended by the Law of the December 18th, 2015. The presentation of the balance sheet and profit and loss
account used should be in accordance with the layout provided in the Annex I and III of the Grand - Ducal
regulation of December 18th, 2015. These articles have been complemented by the captions specific to consolidated
financial statements.
II. CHANGES IN ACCOUNTING POLICY & DISCLOSURES
The Law December 18th, 2015 implementing the two European Directive 2014/59/EU and 2014/49/EU is applied
for the accounting periods beginning January 1st, 2016. The Group took into account this new law in its accounting
policies.
The company used the exception granted by the article 26 (5) of the Luxembourg Law December 19th, 2002 as
amended by the Law of December 18th, 2015 in order to allow the comparability of the historical financial
statements. The current presentation of the balance sheet shows the Preferred Equity Certificates issued by the
Company under a separate caption named “Subordinated loans from shareholders”.
The comparative figures for the year ended December 31st, 2015 and the period end June 30th, 2015 have been
reclassified to make them comparable with the figures for the period ended June 30th, 2016 to reflect the layout
provided in the Annex I and III of the Grand-Ducal regulation of 18th December 2015.
The figures as of and for the period ended June 30th, 2015; presented as comparatives; have not been subjected to
an audit or a review.
III. VALUATION METHODS
a. Intangible Assets
Patents, licenses and other intangible assets have been valued at their acquisition cost. These items are amortized
over their estimated useful life, being from 1 to 3 years.
b. Goodwill
When the Group acquires other companies, the difference between the acquisition cost of the shareholding and the
total valuation of assets and liabilities identified at the acquisition date represents the Goodwill.
F-9

C. Accounting policies (Continued)
The acquisition cost of the shareholding is equal to the purchase price increased by the costs attributable to the
acquisition for their after-tax amount in case the tax economy relative to it, is considered as being recoverable by
the group.
At the very least, the value of the acquired net assets at the acquisition date is:
• Reduced for any amounts of goodwill or unidentified intangible assets, included in the net acquired assets,
• Reduced by the recognition of a provision for retirement indemnities, which value is determined in compliance
with the Group actuary’s rules.
In addition, “cash-generating units” have been defined. They represent the different activities (trading groups and
distribution activities) and the three geographical locations in which the Group operates (distribution in France,
distribution in England, distribution in Germany, trading group in France and trading group in England).
The goodwill is amortized on its estimated useful life. As part of the preparation of the interim consolidated
accounts, the recoverable amount of goodwill is estimated when an indicator of impairment is deemed to exist.
Once an indication of impairment is identified, management estimates the future cash flows which it expects to be
generated from the assets, or the cash generating units of the entity, and then applies an adequate discount rate to
determine the present value of these future cash flows.
At June 30th, 2016, no indicator of impairment was identified.
c. Tangible fixed assets
Tangible assets are valued at their acquisition cost. The method and rates of annual depreciation applied by the
Group are as follows:
—Fixtures and fittings 5 to 10 years linear
—Installations and facilities 5 years ”
—Machinery, equipment and tooling 3 to 10 years ”
—Transport equipment 4 years ”
—Office equipment 4 to 10 years ”
—Furniture 5 to 10 years ”
d. Financial assets
Non-consolidated shareholdings correspond to investments, which, if included within the scope of consolidation,
would have no significant impact. They are valued at their acquisition cost.
Shareholdings are depreciated when their market value is lower than their book value.
e. Valuation of Inventories
Materials and goods have been valued at their acquisition cost using the weighted average purchase cost method.
Storage costs are not included in the valuation of inventory.
The gross book value of goods and supplies includes shipping costs and is presented net of year-end rebates.
Provisions for depreciation of inventories are determined by examining the date of the last sale for each referenced
article included within inventory.
f. Receivables and debts
All receivables and debts have been valued at their nominal value. When necessary, receivables are depreciated to
reflect any loss in value due to anticipated difficulties in recovering the receivable.
Discounted bills are posted in trade receivables in the balance sheet and are not considered as off balance sheet
commitments.
All receivables and debts are due within less than one year except financial debts and receivables related to the
competitiveness-employment income tax credit (“Crédit d’Impôt pour la Compétitivité et l’Emploi – CICE”).
F-10

C. Accounting policies (Continued)
The group has recognized the income tax credit from the C.I.C.E (corresponding to 6% of those gross salary costs
less than 2.5 times the 2016 minimum wage) as a reduction of employee costs.
The dates of maturity of financial debt are disclosed on page F-17.
g. Marketable securities
Marketable securities have been valued at their acquisition cost excluding incidental expenses incurred by their
acquisition.
The need for a provision is determined by comparing the acquisition cost value to the probable realizable value of
the marketable securities.
h. Provisions for risks and charges
Provisions for risks and charges include mainly the provision for retirement indemnities (10.1M€). This provision
is calculated by an actuary for all Group employees except for those covered by an endowment fund to which their
respective group company contributes. This provision includes also retirement indemnities of the German group
Coler.
For group companies, which depend on the car services sector employees’ collective agreement, no commitment
has been provided for given that the totality of the retirement indemnities are covered by the healthcare
organization IRP AUTO “prévoyance-santé”.
In the absence of defined methodology in LUXGAAP, the provision was calculated in accordance with French
GAAP applying recommendation n° 2013-02.
The following assumptions have been made as of June 30th, 2016, to determine the provision for retirement
indemnities:
Nature Hypothesis
Discount rate 1.30%
Long-term inflation rate expectat 2.00%
Mortality table INSEE 2009-2011
Salary escalation rate
Managers 2.80%
Employees 2%
Exit rates
Managers 6.40%
Employees 8.40%
Retirement conditions
Managers
Employees
Modalities of employee retirement
At the initiative of the employee 100%
At the initiative of the employer 0%
Social charges
Managers 48%
Employees 40%
Provisions for risk recorded in the balance sheet result of litigation with third parties (customers, suppliers,
employees).
i. Deferred tax
Deferred tax is calculated on an annual basis using the liability method. The deferred tax has been established using
a 34.43% tax rate for French entities, a 20% tax rate for English entities and a 30% tax rate for German entities.
Deferred tax assets are only recognized if their recoverability is determined.
63 years old for employees born before 01/01/1956,
64 years old for employees born after 01/01/1956
62 years old for employees born before 01/01/1956,
63 years old for employees born after 01/01/1956
F-11
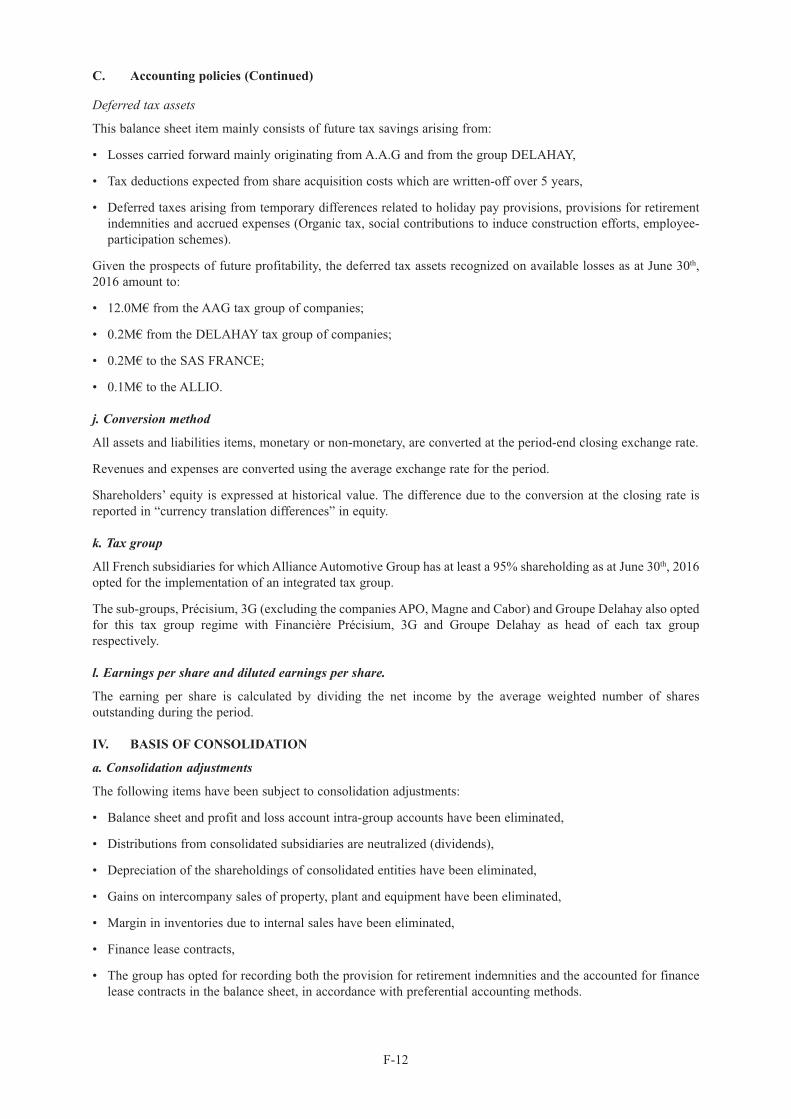
C. Accounting policies (Continued)
Deferred tax assets
This balance sheet item mainly consists of future tax savings arising from:
• Losses carried forward mainly originating from A.A.G and from the group DELAHAY,
• Tax deductions expected from share acquisition costs which are written-off over 5 years,
• Deferred taxes arising from temporary differences related to holiday pay provisions, provisions for retirement
indemnities and accrued expenses (Organic tax, social contributions to induce construction efforts, employee-
participation schemes).
Given the prospects of future profitability, the deferred tax assets recognized on available losses as at June 30th,
2016 amount to:
• 12.0M€ from the AAG tax group of companies;
• 0.2M€ from the DELAHAY tax group of companies;
• 0.2M€ to the SAS FRANCE;
• 0.1M€ to the ALLIO.
j. Conversion method
All assets and liabilities items, monetary or non-monetary, are converted at the period-end closing exchange rate.
Revenues and expenses are converted using the average exchange rate for the period.
Shareholders’ equity is expressed at historical value. The difference due to the conversion at the closing rate is
reported in “currency translation differences” in equity.
k. Tax group
All French subsidiaries for which Alliance Automotive Group has at least a 95% shareholding as at June 30th, 2016
opted for the implementation of an integrated tax group.
The sub-groups, Précisium, 3G (excluding the companies APO, Magne and Cabor) and Groupe Delahay also opted
for this tax group regime with Financière Précisium, 3G and Groupe Delahay as head of each tax group
respectively.
l. Earnings per share and diluted earnings per share.
The earning per share is calculated by dividing the net income by the average weighted number of shares
outstanding during the period.
IV. BASIS OF CONSOLIDATION
a. Consolidation adjustments
The following items have been subject to consolidation adjustments:
• Balance sheet and profit and loss account intra-group accounts have been eliminated,
• Distributions from consolidated subsidiaries are neutralized (dividends),
• Depreciation of the shareholdings of consolidated entities have been eliminated,
• Gains on intercompany sales of property, plant and equipment have been eliminated,
• Margin in inventories due to internal sales have been eliminated,
• Finance lease contracts,
• The group has opted for recording both the provision for retirement indemnities and the accounted for finance
lease contracts in the balance sheet, in accordance with preferential accounting methods.
F-12

D. Details of major items in the Balance Sheet and Profit and Loss Account
I. FIXED ASSETS
a. Intangible assets excluding goodwill
Licences,
patents
and Clientele, Other
Development similar leasehold intangible
In thousands of euros costs rights right fixed assets Total
Opening gross value 76 14,092 149 2,452 16,769
Reclassification — 414 90 — 504
Acquisitions — 829 0 169 998
Disposals — (0) (90) — (90)
First time consolidation — 79 (14) 23 87
Exchange differences — — (6) — (6)
Closing gross value 76 15,413 128 2,644 18,261
Opening accumulated amortization 60 10,001 42 1,676 11,779
Reclassification — — — — —
Amortization — 1,059 1 162 1,222
Disposals — — — — —
First-time consolidation — 76 — — 76
Others — 7 0 0 7
Exchange differences — — (7) — (7)
Closing accumulated amortization 60 11,144 36 1,838 13,078
Opening net value of intangibles
assets excluding Goodwill 16 4,091 107 776 4,990
Closing net value of intangibles
assets excluding Goodwill 16 4,269 92 806 5,183
b. Tangible assets Plants, Furniture, Other
Building, machinery, computer and tangible Fixed
fixtures and equipment and Motor office fixed asset in Payments on
In thousands of euros Land fittings tooling vehicles equipment assets progress account Total
Opening gross value 3,584 24,971 47,924 11,581 18,660 26,023 608 400 133,749
Reclassification — 315 (32) (14) 70 46 (399) (400) (413)
Acquisitions 30 282 1,581 314 753 598 648 161 4,367
Disposals (3) (101) (791) (657) (70) (300) (136) — (2,057)
First time consolidation 211 84 2,199 623 1,592 842 — — 5,551
Others (0) 1 3 1 2 (0) (0) 0 6
Exchange differences (222) — (152) (587) (1,128) — — — (2,089)
Closing gross value 3,601 25,552 50,733 11,262 19,879 27,207 721 161 139,115
Opening accumulated
depreciation 357 16,730 33,950 7,883 15,237 16,677 90,835
Reclassification — (407) 407 (0) 0 0 — — 1
Increase 11 659 2,365 586 712 759 — — 5,092
Disposals (2) (78) (899) (502) (38) (103) — — (1,620)
First-time consolidation — 1,089 1,755 370 651 565 — — 4,429
Others (0) (0) (23) 2 30 (0) — — 9
Exchange differences — (222) — (269) (822) — (1,313)
Closing accumulated
depreciation 366 17,770 37,555 8,071 15,771 17,899 — — 97,433
Opening net value of
tangibles assets 3,227 8,241 13,975 3,697 3,423 9,345 608 400 42,914
Closing net value of
tangibles assets 3,235 7,782 13,177 3,190 4,108 9,308 721 161 41,682
F-13
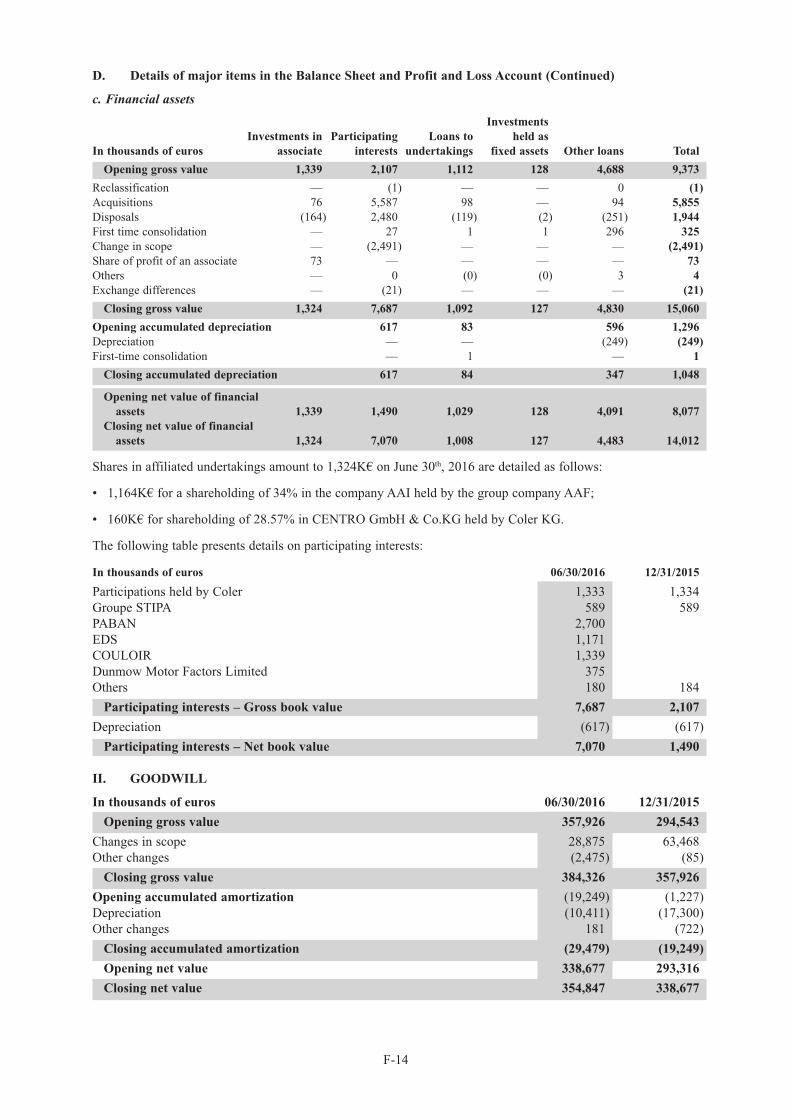
D. Details of major items in the Balance Sheet and Profit and Loss Account (Continued)
c. Financial assets
Investments
Investments in Participating Loans to held as
In thousands of euros associate interests undertakings fixed assets Other loans Total
Opening gross value 1,339 2,107 1,112 128 4,688 9,373
Reclassification — (1) — — 0 (1)
Acquisitions 76 5,587 98 — 94 5,855
Disposals (164) 2,480 (119) (2) (251) 1,944
First time consolidation — 27 1 1 296 325
Change in scope — (2,491) — — — (2,491)
Share of profit of an associate 73 — — — — 73
Others — 0 (0) (0) 3 4
Exchange differences — (21) — — — (21)
Closing gross value 1,324 7,687 1,092 127 4,830 15,060
Opening accumulated depreciation 617 83 596 1,296
Depreciation — — (249) (249)
First-time consolidation — 1 — 1
Closing accumulated depreciation 617 84 347 1,048
Opening net value of financial
assets 1,339 1,490 1,029 128 4,091 8,077
Closing net value of financial
assets 1,324 7,070 1,008 127 4,483 14,012
Shares in affiliated undertakings amount to 1,324K€ on June 30th, 2016 are detailed as follows:
• 1,164K€ for a shareholding of 34% in the company AAI held by the group company AAF;
• 160K€ for shareholding of 28.57% in CENTRO GmbH & Co.KG held by Coler KG.
The following table presents details on participating interests:
In thousands of euros 06/30/2016 12/31/2015
Participations held by Coler 1,333 1,334
Groupe STIPA 589 589
PABAN 2,700
EDS 1,171
COULOIR 1,339
Dunmow Motor Factors Limited 375
Others 180 184
Participating interests – Gross book value 7,687 2,107
Depreciation (617) (617)
Participating interests – Net book value 7,070 1,490
II. GOODWILL
In thousands of euros 06/30/2016 12/31/2015
Opening gross value 357,926 294,543
Changes in scope 28,875 63,468
Other changes (2,475) (85)
Closing gross value 384,326 357,926
Opening accumulated amortization (19,249) (1,227)
Depreciation (10,411) (17,300)
Other changes 181 (722)
Closing accumulated amortization (29,479) (19,249)
Opening net value 338,677 293,316
Closing net value 354,847 338,677
F-14
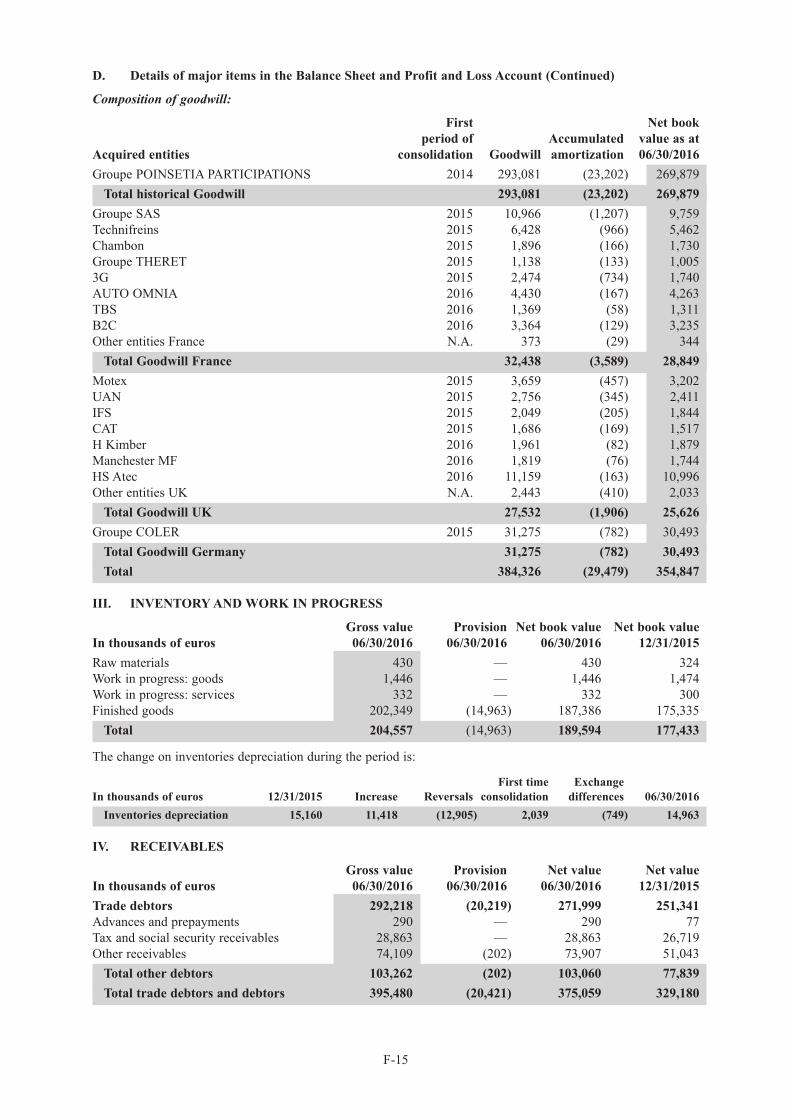
D. Details of major items in the Balance Sheet and Profit and Loss Account (Continued)
Composition of goodwill:
First Net book
period of Accumulated value as at
Acquired entities consolidation Goodwill amortization 06/30/2016
Groupe POINSETIA PARTICIPATIONS 2014 293,081 (23,202) 269,879
Total historical Goodwill 293,081 (23,202) 269,879
Groupe SAS 2015 10,966 (1,207) 9,759
Technifreins 2015 6,428 (966) 5,462
Chambon 2015 1,896 (166) 1,730
Groupe THERET 2015 1,138 (133) 1,005
3G 2015 2,474 (734) 1,740
AUTO OMNIA 2016 4,430 (167) 4,263
TBS 2016 1,369 (58) 1,311
B2C 2016 3,364 (129) 3,235
Other entities France N.A. 373 (29) 344
Total Goodwill France 32,438 (3,589) 28,849
Motex 2015 3,659 (457) 3,202
UAN 2015 2,756 (345) 2,411
IFS 2015 2,049 (205) 1,844
CAT 2015 1,686 (169) 1,517
H Kimber 2016 1,961 (82) 1,879
Manchester MF 2016 1,819 (76) 1,744
HS Atec 2016 11,159 (163) 10,996
Other entities UK N.A. 2,443 (410) 2,033
Total Goodwill UK 27,532 (1,906) 25,626
Groupe COLER 2015 31,275 (782) 30,493
Total Goodwill Germany 31,275 (782) 30,493
Total 384,326 (29,479) 354,847
III. INVENTORY AND WORK IN PROGRESS
Gross value Provision Net book value Net book value
In thousands of euros 06/30/2016 06/30/2016 06/30/2016 12/31/2015
Raw materials 430 — 430 324
Work in progress: goods 1,446 — 1,446 1,474
Work in progress: services 332 — 332 300
Finished goods 202,349 (14,963) 187,386 175,335
Total 204,557 (14,963) 189,594 177,433
The change on inventories depreciation during the period is:
First time Exchange
In thousands of euros 12/31/2015 Increase Reversals consolidation differences 06/30/2016
Inventories depreciation 15,160 11,418 (12,905) 2,039 (749) 14,963
IV. RECEIVABLES
Gross value Provision Net value Net value
In thousands of euros 06/30/2016 06/30/2016 06/30/2016 12/31/2015
Trade debtors 292,218 (20,219) 271,999 251,341
Advances and prepayments 290 — 290 77
Tax and social security receivables 28,863 — 28,863 26,719
Other receivables 74,109 (202) 73,907 51,043
Total other debtors 103,262 (202) 103,060 77,839
Total trade debtors and debtors 395,480 (20,421) 375,059 329,180
F-15

D. Details of major items in the Balance Sheet and Profit and Loss Account (Continued)
V. PREPAYMENTS AND ACCRUED EXPENSES
Bond redemption premiums relating to project bond are detailed on page F-8. They initially amounted to 8,249K€,
they are subject to linear amortization over 7 years from December 1st, 2014.
The debt issuance costs, initially amounting to 12,813K€, are also the subject of a linear amortization over 7 years
and 6 years from December 1st, 2014.
VI. SHAREHOLDERS EQUITY
Shareholders’
equity
attributable Total non
Capital Consolidated Result of Exchange to owners controlling
In thousands of euros Capital Premium reserves the period differences of the group interest
As at December 31st, 2014 121 11,948 13 (24,059) — (11,977) 8,329
Payment of dividends — — (2,916)
Appropriation of the result (24,059) 24,059 —
Result of the period (2,971) (2,971) 2,407
Translation reserve 1,919 1,919 52
Other variations (842) (842) (25)
As at June 30th, 2015 121 11,948 (24,888) (2,971) 1,919 (13,871) 7,847
Payment of dividends — — (207)
Capital Increase/Decrease 240 24,760 25,000
Result of the period (71) (71) 2,136
Changes in scope — 280
Translation reserve (2,120) (2,120)
Other variations 2,348 2,348 (388)
As at December 31st, 2015 361 36,708 (22,540) (3,042) (201) 11,286 9,668
Payment of dividends — — (2,566)
Appropriation of the result (3,042) 3,042 —
Result of the period 866 866 2,596
Changes in scope — (810)
Translation reserve (2,869) (2,869) (98)
Other variations 237 237 (62)
As at June 30th, 2016 361 36,708 (25,345) 866 (3,070) 9,520 8,728
The share capital amounts to 360,899.85 €, divided into 36,089,985 shares of 0.01 €.
VII. PROVISIONS
Re- First time Exchange
In thousands of euros 12/31/2015 Increase Reversals classification consolidation Movement differences 06/30/2016
Provisions for pensions and
similar obligations 8,754 402 (40) — 939 — — 10,055
Other provisions for risks 6,177 1,162 (1,144) (619) 53 — (6) 5,623
Other provisions for charges 1,080 305 (132) (608) 0 — (10) 635
Deferred tax liabilities 172 — — 0 — 359 — 531
Provisions for risks
and charges 16,183 1,869 (1,316) (1,227) 992 359 (16) 16,844
F-16

D. Details of major items in the Balance Sheet and Profit and Loss Account (Continued)
VIII. BORROWINGS, FINANCIAL LIABILITIES AND CASH EQUIVALENTS
Changes in Exchange
In thousands of euros 12/31/2015 Reclassification Increase Decrease scope differences 06/30/2016
Senior Secured Notes (a) 390,000 — 70,000 — 200 — 460,200
Senior Secured Notes -
Accrued interests (a) 2,024 (0) 2,165 (1,800) — — 2,389
S/Total - Senior Secured
Notes 392,024 (0) 72,165 (1,800) 200 — 462,589
Bank borrowings (b) 21,622 (32) 26,000 (17,322) 399 (16) 30,651
Finance leases 5,977 32 850 (1,256) 75 (165) 5,513
Other loans and financial debts 1,133 (26) 188 (213) (988) 7 101
Amounts owed to credit
institutions excluding bank
overdraft 28,732 (26) 27,038 (18,791) (514) (174) 36,265
Marketable securities 734 27 2 — 763
Cash at bank 94,934 0 32,161 (3,560) (4,232) 119,303
Bank overdraft (43,575) 0 19,635 (1,551) 142 (25,348)
Total cash & cash equivalents 52,093 0 32,161 19,662 (5,109) (4,090) 94,718
Net Debt 368,663 (26) 67,042 (40,253) 4,795 (3,916) 404,136
(a) The “Senior Secured Notes” item results from the senior secured loans below (cf. page F-8) and their capitalized interests:
• A first loan of 225M€ issued on December 1st, 2014, maturing on December 1st, 2021 and bearing interest at 6.25 %;
• A second loan of 100M€ issued on December 1st, 2014, maturing on December 1st, 2021 and bearing a floating rate of interest witha margin of 550 basis points;
• A third loan notes for an amount of 65M€ issued on May 6th, 2015 maturing on December 1st, 2021 and bearing interest at 6.25 %;
• An additional loan notes for an amount of 70M€ issued on February 2, 2016 maturing on December 1st, 2021 and bearing interestat 6.25 %.
(b) The movements on “Bank borrowings” principally correspond to the new facilities from new German banks at Coler level for a total of26M€ issued by Coler on June 30th, 2016, offset by the repayment of 18.6M€ to former pool of banks.
Loans maturity:
Within
In thousands of euros 1 year 1 to 5 years + 5 years Total
Senior Secured Notes (a) 460,200 460,200
Senior Secured Notes – Accrued interests (a) 2,389 2,389
Bank borrowings (b) 28,243 1,908 500 30,651
Finance leases 2,316 3,187 10 5,513
Other loans and financial debts 101 101
Bank overdraft 25,348 25,348
Total 58,397 5,095 460,710 524,202
IX. SUBORDINATED LOANS FROM SHAREHOLDERS
In thousands of euros 12/31/2015 Increase Decrease 06/30/2016
Preferred equity certificates 149,851 — — 149,851
Accrued interests on preferred
equity certificates 5,840 — 5,840
Total preferred equity certificates 149,851 5,840 — 155,691
The initial amount of the PEC is 138.2 million euros and the capitalized interests are 11.7 million euros.
F-17

D. Details of major items in the Balance Sheet and Profit and Loss Account (Continued)
X. NON FINANCIAL LIABILITIES
In thousands of euros 06/30/2016 12/31/2015
Trade creditors 325,010 277,004
Amounts owed to undertakings with which the undertaking
is linked by virtue of participating interests 3,079 185
Tax and social security 58,904 54,119
Payables on purchase of fixed assets 1,790 3,866
Other payables 36,317 50,316
Other creditors 97,011 108,301
Deferred income 8,560 6,623
Deferred income 8,560 6,623
Total trade creditors, other creditors and deferred income 433,660 392,113
XI. NET TURNOVER BY GEOGRAPHICAL LOCATION
The geographical location of the group’s consolidated net turnover can be split as follows:
06/30/2016 06/30/2015
In thousands of euros Net turnover Net turnover
France 495,071 495,065
UK 189,938 170,674
Germany 82,662
Total 767,671 665,739
Coler Group (Germany) was acquired at the end of the year 2015. Coler group entities don’t contribute to the
consolidated net turnover of Alize Luxco1 for the year 2015.
XII. FINANCIAL RESULT
In thousands of euros 06/30/2016 06/30/2015
Interest and related income 2,617 791
Interest on senior secured loans (14,064) (10,982)
Interest on preferred equity certificates (5,840) (5,368)
Discounts granted (1,850) (751)
Interest paid on other bond loans (3,769) (652)
Depreciation of financial provisions (591) (589)
Financial result (23,497) (17,551)
F-18
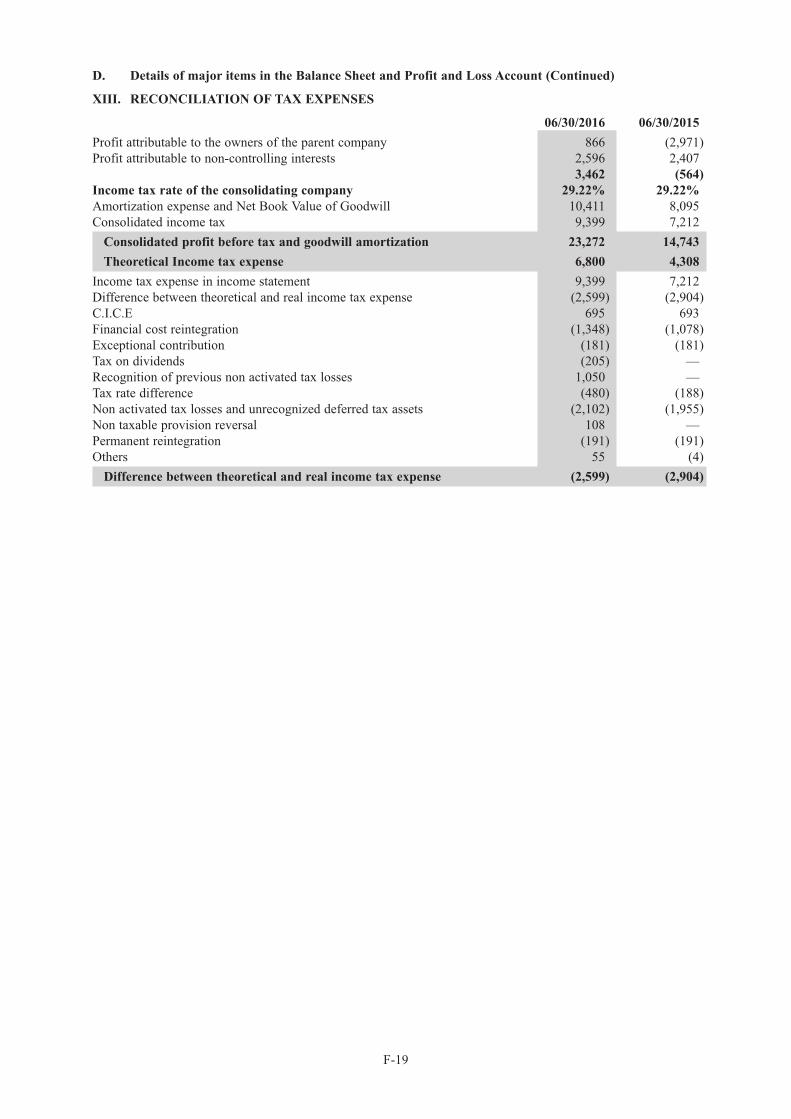
D. Details of major items in the Balance Sheet and Profit and Loss Account (Continued)
XIII. RECONCILIATION OF TAX EXPENSES
06/30/2016 06/30/2015
Profit attributable to the owners of the parent company 866 (2,971)
Profit attributable to non-controlling interests 2,596 2,407
3,462 (564)
Income tax rate of the consolidating company 29.22% 29.22%
Amortization expense and Net Book Value of Goodwill 10,411 8,095
Consolidated income tax 9,399 7,212
Consolidated profit before tax and goodwill amortization 23,272 14,743
Theoretical Income tax expense 6,800 4,308
Income tax expense in income statement 9,399 7,212
Difference between theoretical and real income tax expense (2,599) (2,904)
C.I.C.E 695 693
Financial cost reintegration (1,348) (1,078)
Exceptional contribution (181) (181)
Tax on dividends (205) —
Recognition of previous non activated tax losses 1,050 —
Tax rate difference (480) (188)
Non activated tax losses and unrecognized deferred tax assets (2,102) (1,955)
Non taxable provision reversal 108 —
Permanent reintegration (191) (191)
Others 55 (4)
Difference between theoretical and real income tax expense (2,599) (2,904)
F-19

D. Details of major items in the Balance Sheet and Profit and Loss Account (Continued)
XIV. CONSOLIDATED STATEMENT OF CASHFLOWS
In thousands of euros 06/30/2016 06/30/2015
Net income from consolidated companies 3,462 (564)
Elimination of income and expenditure with no cash impact or not related
to normal operating activities:
—Amortizations and depreciations 17,982 13,663
—Change in deferred taxes 549 325
—Debenture loan interest 6,245 5,119
—Loan interest — —
—Gains on disposals, net of tax (752) 24
Gross cash flow from consolidated companies 27,486 18,568
Change in operating working capital requirement (14,356) (15,536)
Net cash flows from (used in) operating activities 13,130 3,032
Purchase of tangible and intangible assets (4,561) (5,886)
Tangible and intangible asset disposals, net of tax 1,071 237
Impact of changes in consolidation scope (31,598) (28,689)
Acquisition of shares in non-consolidated entities (6,873) (7,315)
Net cash flows from (used in) investing activities (41,961) (41,653)
Dividends paid to shareholder of parent company — —
Dividends paid to non-controlling interests (298) (314)
Share capital increase/(decrease)
Acquisition related debt of consolidated companies (2,030) (500)
Loans issuance 96,946 67,979
Financial debt issues (500) (826)
Loans repayments (18,578) (2,961)
Net cash flows from (used in) financing activities 75,540 63,378
Impact of exchange rate fluctuations (4,084) 2,736
Net cash flow 42,625 27,493
Cash and cash equivalents as at 1st January 52,093 38,732
Cash and cash equivalents as at 30th June 94,718 66,225
Movement in cash & cash equivalents 42,625 27,493
XV. OFF BALANCE SHEET COMMITMENTS
As a result of the group refinancing completed on December 1st, 2014, the group parent company and certain of
its direct and indirect subsidiaries have given the following guarantees to the banks which provided the group
financing:
• The group parent company issued a pledge upon its shareholdings in the subsidiary companies Alliance
Automotive France and Alliance Automotive UK, as well as upon its bank accounts and the inter-company
receivables due by Alliance Automotive France.
• Alliance Automotive France issued a pledge upon its shares held in TPA and Financière Précisium, as well as
upon its bank accounts and the inter-company receivables due from Plateforme Préférence Grand Est (ex CAR
Distribution), TPA and Alliance Automotive UK.
• TPA issued a pledge upon its shares held in Plateforme Préférence Grand Est (ex CAR Distribution), as well as
upon its bank accounts.
• Plateforme Préférence Grand Est (ex CAR Distribution) issued a pledge upon its bank accounts.
Furthermore, as “Obligor” and “Guarantor” within the financing agreements, each of the following entities
provided individual guarantees:
• Alliance Automotive Group S.A.S;
• Alliance Automotive France S.A.S;
F-20
D. Details of major items in the Balance Sheet and Profit and Loss Account (Continued)
• Plateforme Préférence Grand Est;
• TPA S.A.S;
• Poinsetia Participations S.A;
• Alliance Automotive Participations S.A;
• Prime Motor Factors Ltd;
• Group Auto Union UK and Ireland Limited;
• Alliance Automotive UK Limited;
• Alliance Automotive UK CV Limited;
• Alliance Automotive UK LV Limited.
Coler GmbH signed a syndicated loan agreement of a maximum amount of 40.8 M€ that is subject to covenants
set by the lenders. In the event of a failure to meet certain obligations, or if there is a covenant breach, the principal
amounts due and any interest accrued are repayable on demand. Alliance Automotive Germany GmbH and its
subsidiaries complied with its covenants as of June 30th, 2016. The covenants are calculated on a quarterly basis.
XVI. RELATED PARTY TRANSACTIONS
06/30/2016
Profit and loss account (K€) Related party Costs Revenues
Monitoring fee Alliance Industrie BV Sarl 105
Q services Alliance Industrie BV Sarl 76
Monitoring fee Blackstone Management Partners LLC 341
Expenses Blackstone Management Partners LLC 28
Interests on PEC Alliance Industrie BV Sarl 1,752
Interests on PEC Blackstone Management Partners LLC 4,088
XVII. AVERAGE NUMBER OF EMPLOYEES
06/30/2016 12/31/2015
Distribution France 2,405 2,395
Précisium Groupe 168 173
Groupauto 363 326
SAS 57 53
UK 1,061 882
Coler 674
Total 4,728 3,829
The Coler Group was acquired end of 2015. The Coler subgroup entities do not contribute to the consolidated
average staff of Alize Luxco1 group for the year ending 2015.
For information purposes, Group Coler presents an average staff of 656 people for the year – end 2015.
F-21

D. Details of major items in the Balance Sheet and Profit and Loss Account (Continued)
XVIII. MANAGEMENT PROFIT AND LOSS ACCOUNT
The consolidated profit and loss account presented as it is used by the management is the following:
In thousands of euros 06/30/2016 06/30/2015
Sales of goods 701,340 605,599
Services 66,331 60,140
NET REVENUES 767,671 665,739
Reversal of value adjustment on current asset 16,952 6,430
On liabilities and charges: Release of amortization and provisions 434 232
Transfer of operating income 2,076 2,788
Other income 1,379 874
Other operating income 3,889 3,893
OPERATING INCOME 788,511 676,063
Purchase of goods 563,078 499,534
Inventory change (5,013) 360
Other purchases and external costs 52,669 45,112
Other taxes 6,565 6,503
Wages and salaries 74,347 57,360
Employee profit-sharing plan 651 632
Social security charges 21,646 17,912
OPERATING DEPRECIATION CHARGES AND PROVISIONSOn fixed assets: depreciation charges 7,864 6,010
On current assets 15,510 7,425
On provisions 847 420
Other expenses 2,470 1,871
OPERATING EXPENSES 740,634 643,139
OPERATING RESULT excluding Goodwill amortization and
non recurring items 47,877 32,923
FINANCIAL INCOMEFinancial income from equity interests 46 59
Other interest and similar income 707 453
Discounts received 1,168 85
Release of provisions 696 194
FINANCIAL INCOME 2,617 791
Interests payable and similar charges on Preferred Equity Certificates 5,840 5,368
Depreciation amortization and charges 591 589
Interests payable and similar charges 17,833 11,634
Discounts allowed 1,850 751
FINANCIAL EXPENSES 26,114 18,342
NET FINANCIAL RESULT (23,497) (17,551)
RESULT BEFORE TAX AND EXTRAORDINARY ITEMS 24,380 15,372
F-22

D. Details of major items in the Balance Sheet and Profit and Loss Account (Continued)
In thousands of euros 06/30/2016 06/30/2015
Extraordinary income—on operating activities 843 44
Extraordinary income—on equity transactions 1,071 124
Reversal of provisions and charges transferred 725 115
EXTRAORDINARY INCOME 2,639 284
Extraordinary expenses—on operating activities 2,935 684
Extraordinary expenses—on equity transactions 319 148
Extraordinary expenses—depreciation and increases in provisions 566 80
EXTRAORDINARY EXPENSES 3,820 913
EXTRAORDINARY RESULTS (1,181) (629)
Income tax expense 8,850 6,887
Deferred income tax 549 325
PROFIT FROM FULLY CONSOLIDATED COMPANIES 13,800 7,532
Share of results of an associate 73
GROUP PROFIT (before goodwill amortization) 13,873 7,532
—Attributable to non-controlling interests 2,596 2,407
—Attributable to the owners of the parent 11,277 5,124
Goodwill amortization of fully consolidated companies 10,411 8,095
NET CONSOLIDATED PROFIT/(LOSS) 3,462 (563)
Attributable to non controlling interests 2,596 2,407
Attributable to the owners of the parent 866 (2,971)
XIX. LIST OF CONSOLIDATED COMPANIES AS AT JUNE 30th, 2016
06/30/2016 12/31/2015 Consolidation
Entity Shareholding Shareholding method Country
ALIZE LUXCO 1 100% 100% Parent Company Luxembourg
ALIZE TOPCO 100% 100% Full Integration U.K
ALIZE LOWER TOPCO 100% 100% Full Integration U.K
AAH (MIDCO) 100% 100% Full Integration U.K
AAInv (BIDCO) 100% 100% Full Integration U.K
AA Finance (FINCO) 100% 100% Full Integration U.K
POINSETIA PARTICIPATIONS 100% 100% Full Integration Luxembourg
AA PARTICIPATIONS 100% 100% Full Integration Luxembourg
ISATH 100% 100% Non Integrated Luxembourg
ROLLE 100% 100% Non Integrated Luxembourg
ALLIANCE AUTOMOTIVE
Germany 100% 100% Full Integration Germany
COLER KG 100% 100% Full Integration Germany
COLER BETEILIGUNGEN 100% 100% Full Integration Germany
COLER VERWALTUNGS 100% 100% Full Integration Germany
COLER ORIGINALTEILE 100% 100% Full Integration Germany
CENTRO GMBH & Co. KG 29% 29% Equity Germany
ALLIANCE AUTOMOTIVE
GROUP 100% 100% Full Integration France
ALLIANCE AUTOMOTIVE France 100% 100% Full Integration France
SOCALPPA 100% 100% Full Integration France
GROUPE AIM 100% 100% Full Integration France
BESNARD ET GERARD 100% 100% Full Integration France
TOUL GAZ SCI 100% 100% Full Integration France
GROUPE HIOT 100% 100% Full Integration France
COLLET 100% 100% Full Integration France
LE HELLO 100% 100% Full Integration France
LAPAUZE 100% 100% Full Integration France
MESNIL ACCESSOIRES 100% 100% Full Integration France
F-23

D. Details of major items in the Balance Sheet and Profit and Loss Account (Continued)
06/30/2016 12/31/2015 Consolidation
Entity Shareholding Shareholding method Country
PILAYROU 100% 100% Full Integration France
RISSO 100% 100% Full Integration France
ROUSSEL 100% 100% Full Integration France
STEIMA PLSN 100% 100% Full Integration France
GROUPE VIDALAUTO 100% 100% Full Integration France
GROUPE STIPA 100% 100% Full Integration France
GROUPE COMPTOIR DU FREIN 100% 100% Full Integration France
GROUPE LE FLOCH 100% 100% Full Integration France
STEREC SCI 100% 100% Full Integration France
ELECTRO DIESEL 100% 100% Full Integration France
ADF 100% 100% Full Integration France
AEDS 100% 100% Full Integration France
DPA 100% 100% Full Integration France
APLS 100% 100% Full Integration France
GROUPE HIOT 100% 100% Full Integration France
MAIMONE 100% 100% Full Integration France
GROUPE SARA 100% 100% Full Integration France
GROUPE PENE 100% 100% Full Integration France
GROUPE DELAHAY 81% 76% Full Integration France
AFQ EURL 100% 100% Full Integration France
FADR 100% 100% Full Integration France
ALLIANCE AUTOMOTIVE ESPANA 38% 38% Proportional Integration Spain
ALLIANCE AUTOMOTIVE
INDUSTRIE 34% 34% Equity France
GROUPE VDB 100% 100% Full Integration France
NORMANDIE ACCESSOIRES 100% 100% Full Integration France
ALLIO 100% 100% Full Integration France
TPA 100% 100% Full Integration France
GROUPE THERET 100% 100% Full Integration France
GROUPE TECHNIFREINS 100% 100% Full Integration France
CHAMBON 100% 100% Full Integration France
GROUPE SAS 100% 100% Full Integration France
GROUPE AOI 100% Full Integration France
TBS France 100% Full Integration France
TBS NICE 50% Full Integration France
GROUPE B2C 100% Full Integration France
F-24

D. Details of major items in the Balance Sheet and Profit and Loss Account (Continued)
06/30/2016 12/31/2015 Consolidation
Entity Shareholding Shareholding method Country
3GSA 81% 77% Intégration globale Full Integration France
3GEA 81% 77% Intégration globale Full Integration France
STAR G 81% 77% Intégration globale Full Integration France
AA PROCUREMENT 89% 88% Intégration globale Full Integration France
SMEA GEP 81% 77% Intégration globale Full Integration France
CAL 81% 77% Intégration globale Full Integration France
GAU INTERNATIONAL 24% 24% Intégration Proportional
proportionnelle Integration France
APO 81% 77% Intégration globale Full Integration France
MAGNE 81% 77% Intégration globale Full Integration France
G STORE FORFAIT 81% 77% Intégration globale Full Integration France
CABOR NEGOCE 81% 77% Intégration globale Full Integration France
GROUPE GALLAYS 81% 77% Intégration globale Full Integration France
PLATE FORME PREFERENCE
GRAND OUEST 100% 100% Intégration globale Full Integration France
PLATE FORME PREFERENCE
GRAND EST 100% 100% Intégration globale Full Integration France
FINANCIERE PRECISIUM 87% 87% Intégration globale Full Integration France
PRECISIUM GROUP 87% 87% Intégration globale Full Integration France
GEFA 87% 87% Intégration globale Full Integration France
DFA 85% 85% Intégration globale Full Integration France
AS 87% 87% Intégration globale Full Integration France
STARIS 61% 61% Intégration globale Full Integration France
ALLIANCE AUTOMOTIVE UK 100% 100% Intégration globale Full Integration U.K
DORSET 53% 53% Intégration globale Full Integration U.K
F-25
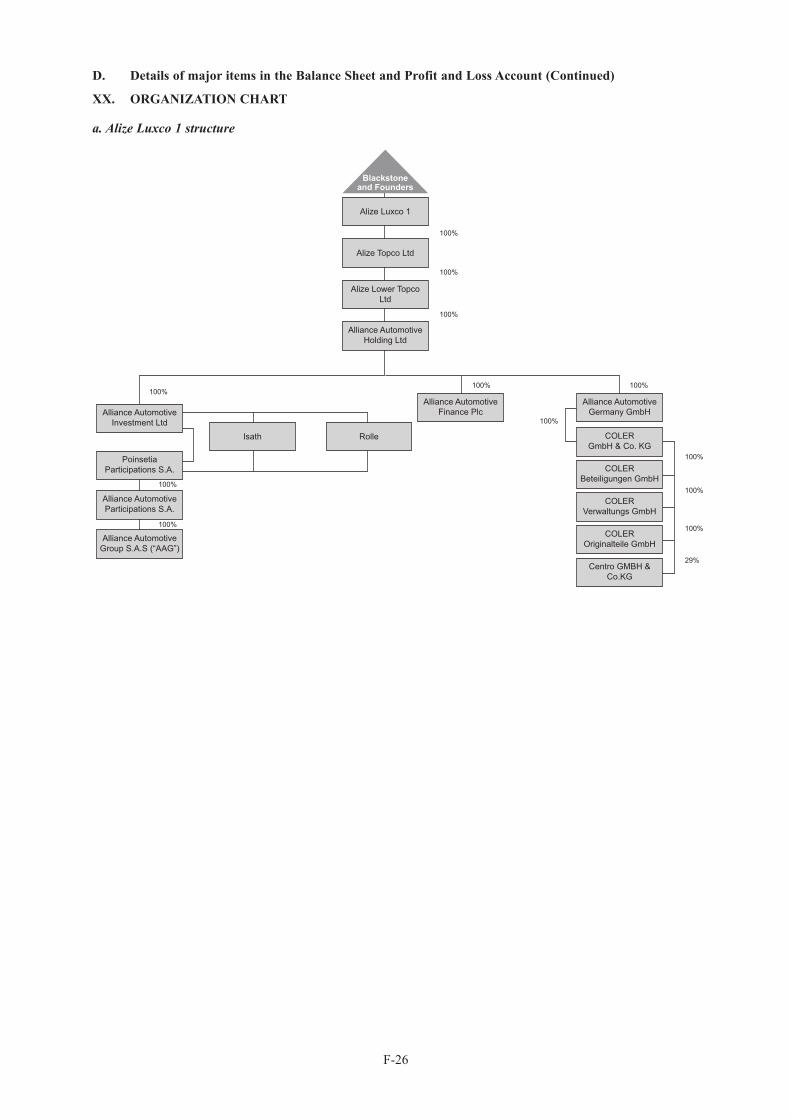
D. Details of major items in the Balance Sheet and Profit and Loss Account (Continued)
XX. ORGANIZATION CHART
a. Alize Luxco 1 structure
Alize Luxco 1
Blackstoneand Founders
Alize Topco Ltd
Alize Lower TopcoLtd
Alliance AutomotiveHolding Ltd
Isath Rolle
PoinsetiaParticipations S.A.
Alliance AutomotiveParticipations S.A.
Alliance AutomotiveInvestment Ltd
Alliance AutomotiveFinance Plc
Alliance AutomotiveGermany GmbH
COLERGmbH & Co. KG
COLERBeteiligungen GmbH
COLERVerwaltungs GmbH
COLEROriginalteile GmbH
Centro GMBH &Co.KG
Alliance AutomotiveGroup S.A.S (“AAG”)
100%
100%
100%
100%
100% 100%
100%
100%
100%
29%
100%
100%
100%
F-26

D. Details of major items in the Balance Sheet and Profit and Loss Account (Continued)
b. AAG Corporate structure
c. Groupauto Division
86.86% 80.91%
100% 100%
100%
100%
100%
25% 25%
27.25%25%
100% 100%
GroupautoInternational
AA Procurement
UnionAftermarket
Network
Groupauto UnionUK
Distribution UKSubsidiaries
Alliance Automotive Group
Alliance AutomotiveFrance
Distribution FranceSubsidiaries
FinancièrePrecisium
Precisium Groupe
Partner’s Star-G
3G
Alliance AutomotiveUK25%
100% 100%
100%
100%
100%100%
100%25% 100%
99.99% 33.33%
80.91%
100% 100% 100%
SMEA GEP Star-G GROUPE DELAHAY
Alliance Automotive France
3G Groupauto Union UK
AA Procurement 3G EA
FINANCIERE PRECISIUM
SEMPM
Etablissements Gallays
G Store
APO SCI L Champs
33.33%
CAL
Magne
Cabor
F-27
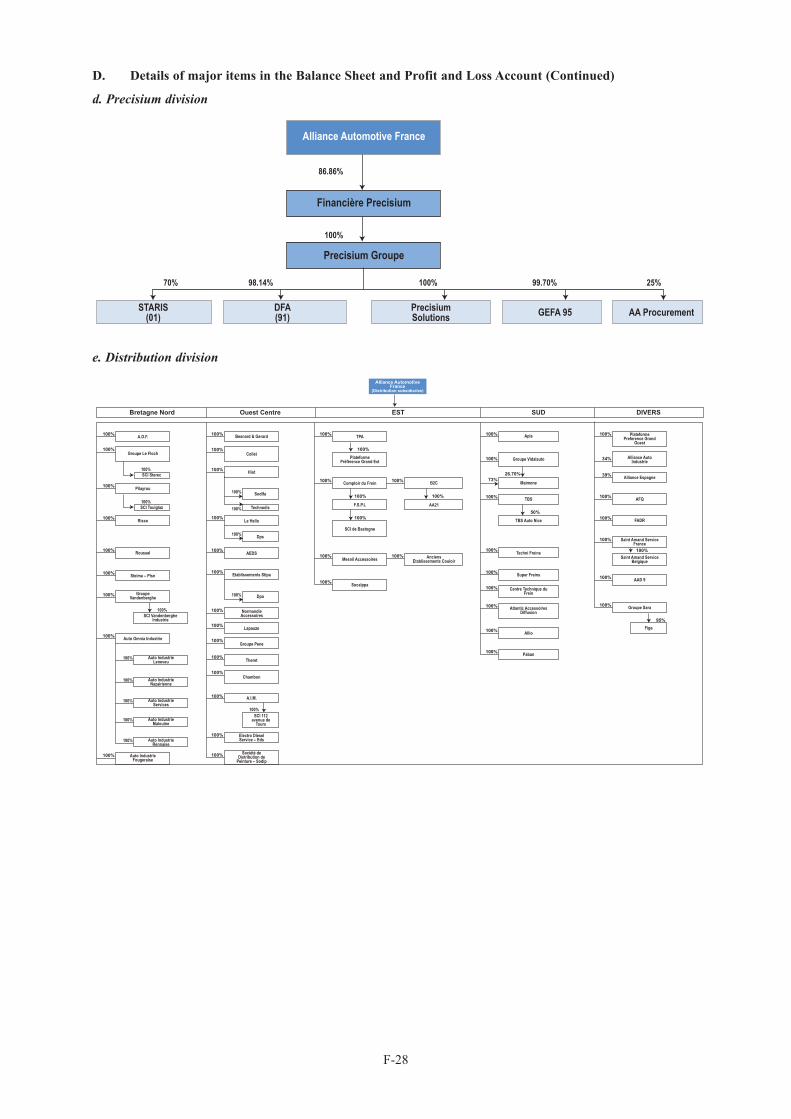
D. Details of major items in the Balance Sheet and Profit and Loss Account (Continued)
d. Precisium division
e. Distribution division
Alliance Automotive France
Financière Precisium
Precisium Groupe
STARIS(01)
DFA(91)
PrecisiumSolutions GEFA 95 AA Procurement
86.86%
100%
70% 98.14% 100% 99.70% 25%
Groupe Le Floch
A.D.F.100% Besnard & Gerard100% TPA100% Apls100% PlateformePreference Grand
Ouest
100%
Alliance AutoIndustrie34%
Alliance Espagne39%
AFQ100%
FADR100%
AAD 9
Figa
100%
Groupe Sara100%
Saint Amand ServiceFrance
100%
Saint Amand ServiceBelgique
100%
95%
Maimone73%26.70%
Techni Freins100%
Super Freins100%
Centre Technique duFrein
100%
Atlantic AccessoiresDiffusion
100%
Allio100%
Paban100%
TBS100%
TBS Auto Nice
50%
Groupe Vidalauto100%
Comptoir du Frein100% B2C
F.S.P.L AA21
SCI de Bastogne
Mesnil Accessoires AnciensEtablissements Couloir
100%
100%
100%
100%
100%
Socalppa100%
100%
PlateformePréférence Grand Est
100%Collet
100%
Hiot100%
Le Hello100%
AEDS100%
Etablissements Stipa100%
NormandieAccessoires
100%
Lapauze100%
Groupe Pene100%
Theret100%
A.I.M.100%
Electro DieselService – Eds
100%
Société deDistribution de
Peinture – Sodip100%
Chambon100%
Pilayrou100%
Risso100%
Roussel100%
Auto Omnia Industrie100%
Auto IndustrieFougeraise
100%
Auto IndustrieRennaise
100%
Auto IndustrieServices
100%
Auto IndustrieNazairienne
100%
Auto IndustrieLeneveu
SCI VandenbergheIndustrie
100%
Auto IndustrieMalouine
100%
Steima – Plsn100%
GroupeVandenberghe100%
100%
SCI Toulglaz100%
SCI Sterec100%
Technodis100%
Sodifa100%
Dps100%
Dpa100%
SCI 112avenue de
Tours
100%
100%
DIVERSSUDESTOuest CentreBretagne Nord
Alliance AutomotiveFrance
(Distribution subsidiaries)
F-28
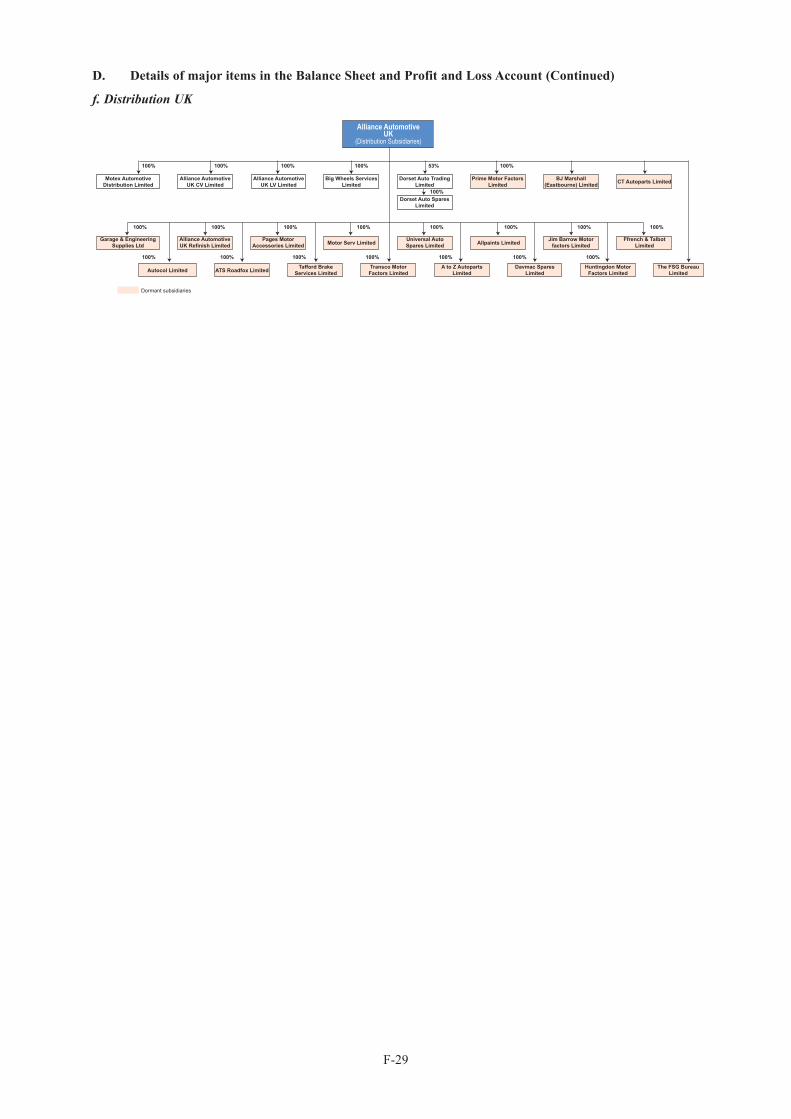
D. Details of major items in the Balance Sheet and Profit and Loss Account (Continued)
f. Distribution UK
Motex AutomotiveDistribution Limited
Alliance AutomotiveUK CV Limited
Alliance AutomotiveUK LV Limited
Big Wheels ServicesLimited
Dorset Auto TradingLimited
Dorset Auto SparesLimited
Prime Motor FactorsLimited
BJ Marshall(Eastbourne) Limited CT Autoparts Limited
Garage & EngineeringSupplies Ltd
Alliance AutomotiveUK Refinish Limited
Pages MotorAccessories Limited Motor Serv Limited Universal Auto
Spares Limited Allpaints Limited Jim Barrow Motorfactors Limited
Ffrench & TalbotLimited
Autocol Limited ATS Roadfox Limited Tafford BrakeServices Limited
Transco MotorFactors Limited
A to Z AutopartsLimited
Davmac SparesLimited
Huntingdon MotorFactors Limited
The FSG BureauLimited
100%
Dormant subsidiaries
100%
100%
100%
100%
100%
100%
100%
100%
100%
100%
100% 100%
100%
100%
100%
100% 100% 100% 53% 100%
100%
Alliance AutomotiveUK
(Distribution Subsidiaries)
F-29