DISCLOSURE OF FINANCIAL RATIOS IN THE ANNUAL …ir.uitm.edu.my/11521/1/AJ_MARIAM BINTI RAHMAT JAS...
15
Jurnal Akademik UiTM Sarawak Vol. 2, No. 1, Disember 2001 DISCLOSURE OF FINANCIAL RATIOS IN THE ANNUAL REPORTS By: Mariam binti Rahmat Abstract The usefulness of financial ratios has been recognized by many researchers. It has increasingly become an important area of accounting research and practice as it can be used for all kind of purposes. Even though the utilities of financial ratios have received much attention in the literature, until now, there has been no mandatory requirement to publicly disclose financial ratios except for earnings per share. However, evidence shows that many companies within Australia and elsewhere elect to voluntarily disclose financial ratios in their annual reports. This paper investigates financial ratio voluntarily disclosed in the annual reports of the top 60 public companies listed in the Australian Stock Exchange for 1996. Findings indicate that many ratios were disclosed in the financial summaries and financial highlights while dividend per share was the most popular ratios being disclosed. The findings also indicate that many different formulae were used in calculating those ratios. INTRODUCTION Financial ratio analysis is very important for the users of financial statements in decision making processes. Since the late 1800s, ratio analysis has been the major tool used in the interpretation and evaluation of financial statements for investment decision-making ( Lev, 1974). It can be an effective tool in evaluating a company's liquidity, debt position and also profitability (Gibson, 1982). The growing demand for additional financial information by the users has inspired more companies to voluntarily disclose financial ratios in the annual reports. Even though users strongly prefer greater disclosure of accounting information, the common attitude of reporting companies appears to be that disclosure should be kept to a minimum as long as it conforms to the mandatory requirements. Besides that, the absence of standardization allows companies to present ratios most favourable to their own position. Some companies present comprehensive ratio statistics; others do not. Those who do not are able to manipulate ratios in order to create good company image or "window dressing'. This will also limit the comparability factor desired in financial statement analysis. ( Gibson & Boyer, 1980). 15
Transcript of DISCLOSURE OF FINANCIAL RATIOS IN THE ANNUAL …ir.uitm.edu.my/11521/1/AJ_MARIAM BINTI RAHMAT JAS...

Jurnal Akademik UiTM Sarawak Vol. 2, No. 1, Disember 2001
DISCLOSURE OF FINANCIAL RATIOS IN THE ANNUAL REPORTSBy: Mariam binti Rahmat
Abstract
The usefulness of financial ratios has been recognized by many researchers. Ithas increasingly become an important area of accounting research andpractice as it can be used for all kind of purposes. Even though the utilities offinancial ratios have received much attention in the literature, until now, therehas been no mandatory requirement to publicly disclose financial ratiosexcept for earnings per share. However, evidence shows that many companieswithin Australia and elsewhere elect to voluntarily disclose financial ratios intheir annual reports. This paper investigates financial ratio voluntarilydisclosed in the annual reports of the top 60 public companies listed in theAustralian Stock Exchange for 1996. Findings indicate that many ratios weredisclosed in the financial summaries and financial highlights while dividendper share was the most popular ratios being disclosed. The findings alsoindicate that many different formulae were used in calculating those ratios.
INTRODUCTION
Financial ratio analysis is very important for the users of financialstatements in decision making processes. Since the late 1800s, ratio analysishas been the major tool used in the interpretation and evaluation of financialstatements for investment decision-making ( Lev, 1974). It can be an effectivetool in evaluating a company's liquidity, debt position and also profitability(Gibson, 1982). The growing demand for additional financial information bythe users has inspired more companies to voluntarily disclose financial ratios inthe annual reports.
Even though users strongly prefer greater disclosure of accountinginformation, the common attitude of reporting companies appears to be thatdisclosure should be kept to a minimum as long as it conforms to themandatory requirements. Besides that, the absence of standardization allowscompanies to present ratios most favourable to their own position. Somecompanies present comprehensive ratio statistics; others do not. Those who donot are able to manipulate ratios in order to create good company image or"window dressing'. This will also limit the comparability factor desired infinancial statement analysis. ( Gibson & Boyer, 1980).
15

Jurnal Akademik UiTM Sarawak Vol. 2, No. 1, Disember 2001
It is hoped that this study will serve to convince those who preparefinancial statements to use standard computations to determine financial ratiosin their reports so as to meet the growing demand of users of financialstatement. Such a practice will have the desired effect of allowing for greatercomparability between firms.
Objectives of the Study
The main objective of this study is to investigate the disclosure offinancial ratios in the annual reports of 60 Australian companies for the year1996 and on the basis of the evidence obtained to discuss the strengths andweakness of common practice in the computation and disclosure of financialratios.
The specific objectives are:to determine where the ratios were disclosed in the annual reports.to determine the financial ratios most frequently reported in annual reports.to identify the computation methods used to compute these ratios
LITERATURE REVIEW
Definition of terms
Elam, R. (1975 p.25) defined financial ratios as 'transformations offinancial statement data allegedly made by statement users to aid decisionmaking'. Gibson (1991) defined "ratios' as a fraction with a numerator (top) anda denominator ( bottom) . Hogget and Edwards (1996) stated that' afinancial ratio' was calculated by dividing the dollar amount of one itemreported in the financial statements by the dollar amount of another item reported.
Disclosure of Financial Ratios
Courtis (1996) investigated voluntary disclosure of financial ratioswithin annual reports for 101 public listed companies in Hong Kong between1988 and 1992 in order to determine the extent to which underlying ratiocomponents vary within and between companies, within industries and overtime. It focused on the issue of consistency of numerator and denominatorcomponents in the calculation of financial ratios in annual reports. The resultsindicated that there was numerator-denominator inconsistency betweencompanies and industries at a point in time, but also that there was a generalconsistency within companies across time.
16

Jurnal Akademik UiTM Sarawak Vol. 2, No. 1, Disember 2001
Hasseldine, Walsh and McNickle (1991), examine the financial ratiosof the top 50 companies which were reported in four morning papers in NewZealand. The studies sought to highlight the inconsistency of financial ratioreporting in New Zealand print media, to summarise the legal implications forthe users and publishers of financial ratios, and to raise issues that might beconsidered for the improvement of the quality of financial ratio reporting.When comparing ratios between different data sources, the key issue to beborne in mind was whether the results have been computed using the sameformulae. The researchers concluded that the degree of variability in thereporting of key financial ratios in the print media appears substantial but thegeneral quality of financial reporting was poor.
A study was undertaken by Williamson (1984) whereby the annualreports of 141 Fortune 500 Industrial Companies were reviewed to determinewhich financial ratios were reported. The results revealed that three ( return onequity, current ratio, and return on sales ) of the eleven selected ratios whichwere computed using a standardized computational rule were significantlymore favourable for reporting firm's as compared to non-reporting firm. Hesuggested that firms may selectively report these ratios and that the companysize appears to be independent of the reporting of the ratio and size of the ratio.
Gibson (1982) conducted a study on the annual reports of one hundredfirms in the Fortune 500 Industrial Companies in 1979 to determine howeffectively firms were using ratios to report financial data. The results showedthat the most popular ratios being disclosed were profitability ratios and ratiosrelated to investing. He reported that the following ratios were mostfrequently cited:
Return on equityProfit marginCurrent ratioDebt to capitalReturn on capitalDebt to equity
62 times58 times47 times23 times21 times19 times
Ratios were also most frequently located in order of use, in financial summary,financial highlights, financial reviews, president's letters and managementdiscussions. The study also indicated that there were wide differences ofopinion on how some of the ratios should be computed. He reportedconsistency in the way companies computed the current ratio and alsoinconsistency in the other ratios.
17

JurnalAkademik UiTM Sarawak Vol. 2, No. 1, Disember 2001
Laurent (1979) examined sixty three public companies in Hong Kongwith the main objective of identifying a small set of ten financial ratios ( i.e.return on investment, gearing, working capital management, fixed assetmanagement, long term solvency, short term solvency, inventory management,long standing charges cover, income retention policy and credit policy). Hesuggested that identifying a small critical set of independent financial ratioswould make general analysis more efficient. It would also be valuable for theresearcher to determine the nature of relationship between the companyfinancial position and some possible outcome such as bankruptcy.
Bird and McHugh ( 1977) empirically examined and tested for thenormality of the distribution of five financial ratios for listed Australians'companies in the food, electrical and accommodation industries for the years1967,1969 and 1971 and found that financial leverage and efficiency ratioswere normally distributed, quick assets and working capital ratios werenormally distributed, with no conclusive result in the case of profitability ratio.Within each industry, firms tended to maintain their relative rankings in eachtype of ratio and ratios were stable for at least a five year period. They alsofound that accounting terminology and reports were still far from beingstandardized even within an industry.
Deakin (1976) investigated the normality of the distributions of elevencommonly used financial ratios. The financial ratios were computed for eachof the 19 fiscal years, beginning with annual reports for fiscal years ending in1955 and continuing through fiscal years ending in 1973 for all manufacturingcompanies. From the analysis it was shown that ten of the eleven financialaccounting ratios for the year 1973 were not normally distributed. Findingsalso showed that assumption of normality for financial ratios would not betenable except for total debt over total assets ratio but financial ratios might bemore normally distributed within specific industry group.
Cooke (1989) in his study on disclosure of accounting ratios in annualreports in Sweden found that liquidity ratios were reported in relatively fewcases whereas a large number of companies disclosed return on capitalemployed and return on shareholders' equity. Generally, the larger thecompany the greater the disclosure of accounting ratios.
The need for uniform financial ratio disclosures
Gibson (1980) and Courtis (1996) stated that financial ratio disclosuresshould include uniform financial ratios because:
18

Jurnal Akademik UiTM Sarawak Vol. 2, No. 1, Disember 2001
1. a lack of standard disclosure leads to a wide variety in choice of ratiosfor presentation and in computational methodology which arefavourable to their company.
2. a lack of standard computation ratios limits the comparability desiredin financial statement analysis.
3. a financial ratio which is based on a different composition of financialstatement line items from one reporting period to another causesambiguity for users.
RESEARCH METHODOLOGY
This study is designed primarily to investigate randomly the annualreports of 60 Australian public listed companies for the year 1996 which areavailable in the CD ROM of Australian Stock Exchange Annual Reports Top150.The following are the steps used in the analysis of the 60 Australian corporateannual reports.1. Select randomly the annual report and scan through the pages which
disclose the financial ratio.
2. For each selected company, determine where the ratios are beingdisclosed in the annual reports.
3. Determine the exact formulae for the ratio being used. If theformulae are not disclosed, the exact component reconstruction isundertaken for each ratio disclosed by working with variouscombinations of financial statement line item in both the numerator anddenominator on a trial and error basis until specific componentswhich reconciled with the reported ratio value are identified. Thisprocedure is followed for each of the 60 companies in the annualreport for 1996.
DATA ANALYSIS AND DISCUSSION OF RESULTS
The discussion of the results below are based on frequency ofdisclosures and the computation methods of financial ratios used in the annualreports.
19

Jurnal Akademik UiTM Sarawak Vol. 2, No. 1, Disember 2001
Frequency Of Disclosures
Table 1 shows the ratios included in the annual reports which wereexamined and the section of the annual reports where each ratio was located.The ratios were found in the following sections of annual reports; financialsummary, financial highlights, statistical summary, financial statistical analysis,financial review and other (i.e. including pro-forma balance Sheet, profit andLoss account, financial performance, chairman's report, and financialcommentary). In many cases, the same ratios were located in several sections.
TABLE 1Financial Ratios Disclosed in Annual Reports
12
3456789101112131415161718192021
ratio
s
Average working capital to salesAverage days to maturity of totalborowingBad and doubtful ratioBonus issue ratioCapital adequacy ratioCash dividend per shareCombined operating ratioCost / income ratioCurrent ratioDebt to tangible net worthDividend coverDividend payoutDividend per shareDividend peroudinary shareEBIT return on average total assetsGearing ratioInssurance profit to net earned premiumImpaired assets as % of loan assetsInterest coverLiabilities to total assetsMarket price per share
Fina
ncia
lsu
mm
ary
1
2121
43168
216118
3112
Fina
ncia
lhi
ghlig
hts
1
1
12
221451101
511
Stat
istic
alsu
mm
ary
4
4142
3
31
Fina
ncia
lst
atis
tical
anal
ysis
1
1
1
1
1
Fina
ncia
lre
view
1
1
11
Oth
ers
2422
1
1
20

Jurnal Akademik UiTM Sarawak Vol. 2, No. 1, Disember 2001
22232425262728293031
323334353637383940414243444546474849
505152
Number of days stockNet asset per shareNet asset backing per shareNet asset backing per ordinary shareNet tangible asset backing per shareNet tangible asset per ordinary shareNet losses as % of loan assetsNet interest marginNet non-accrual loans / riskNon-accruing & restructured loans togross loansOperating cash flow to shareOperating expenses to average total assetsProprietorship ratioRatio of net write-off to average loansReturn on average risk weighted assetsReturn on salesReturn on total assetsReturn on total incomeReturn o average total assetsReturn on funds employedRisk adjusted capital ratioReturn on shareholders' equityReturn on average s/h equityReturn on s/h fundReturn on average s/h fundReturn on average ordinary s/h equityReturn per employeeShareholders funds to total liabilitiesSolvency ratioSolvency ratioTotal liabilties (less cash) to s/h equity fundTax free / deferred portionTotal
12432112
1
223
19
15327353
3
21
160
21
22
11
1
2
22
3
14
1
11
74
1
21
1
1
11111
121
1
1
39
1
11111
21
1
11
12
1
1
9
1
2
31
19
Table 1 indicates the sections where ratios were frequently located:Financial summary 160 timesFinancial highlights 74 timesStatistical summary 39 timesFinancial statistical analysis 11 timesFinancial review 9 timesOthers 19 times
21
Jurnal Akademik UiTM Sarawak Vol. 2, No. 1, Disember 2001
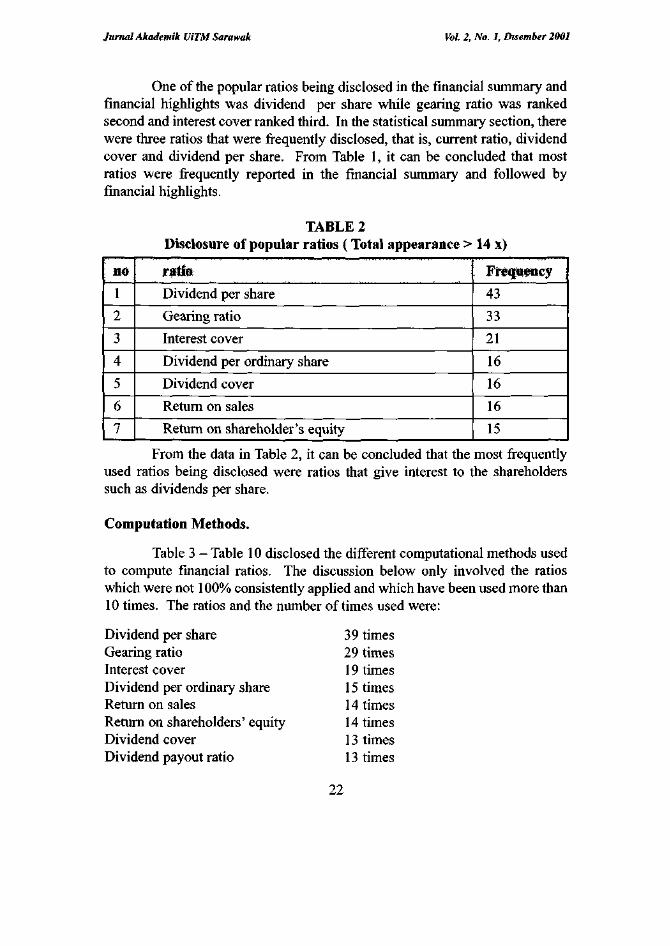
One of the popular ratios being disclosed in the financial summary andfinancial highlights was dividend per share while gearing ratio was rankedsecond and interest cover ranked third. In the statistical summary section, therewere three ratios that were frequently disclosed, that is, current ratio, dividendcover and dividend per share. From Table 1, it can be concluded that mostratios were frequently reported in the financial summary and followed byfinancial highlights.
TABLE 2Disclosure of popular ratios ( Total appearance > 14 x)
l
2
3
4
5
6
7
jrsrtfe :Dividend per share
Gearing ratio
Interest cover
Dividend per ordinary share
Dividend cover
Return on sales
Return on shareholder's equity
43
33
21
16
16
16
15
From the data in Table 2, it can be concluded that the most frequentlyused ratios being disclosed were ratios that give interest to the shareholderssuch as dividends per share.
Computation Methods.
Table 3 - Table 10 disclosed the different computational methods usedto compute financial ratios. The discussion below only involved the ratioswhich were not 100% consistently applied and which have been used more than10 times. The ratios and the number of times used were:
Dividend per share 39 timesGearing ratio 29 timesInterest cover 19 timesDividend per ordinary share 15 timesReturn on sales 14 timesReturn on shareholders' equity 14 timesDividend cover 13 timesDividend payout ratio 13 times
22

Jurnal Akademik UiTM Sarawak Vol. 2, No. 1, Disember 2001
TABLE 3Dividend Cover (times)
N©«£
tisea4
2
2
2
11
1
13
Net operating profit / dividend
Operating profit / (loss) after tax and abnormal & extraordinary item /dividend
Profit after income tax & outside equity interest and abnormal items /dividend
Profit after tax, before abnormal item / dividend
Profit after tax and abnormal items / dividendEarnings from operations after tax and before abnormal items andextraordinary items / dividendOperating profit after income tax attributable to members / dividend
Total
Table 3 presents seven different formulae used to compute thedividend cover in the 13 disclosures. The number of times that each formulaewas used is also indicated. In making the computations for dividend cover,all companies used total dividend as denominator. However, financialexecutives may have different opinions on how a firms' profit should bedetermined from the profit and loss account. This is evident from the manydifferent formulae that were used for determining the numerator for this ratio.
TABLE 4Dividend Payout Ratio ( % )
No offtimes
4
3
2
2
1
1
13
F-oiMttiae • -" " ,- *" •
Dividend / operating profit before abnormal items and after income tax
Dividend per share / EPS
Dividend / profit after tax and abnormal items
Dividend / consolidated profit after tax attributable to members
Dividend / operating profit after interest, abnormal and income tax
Dividend / operating profit after tax and outside equity interest
Total
23

Jurnal Akademik UiTM Sarawak Vol. 2, No. 1, Disember 2001
Table 4 highlights six different formulae used to compute dividendpayout ratio in the 13 disclosures and the number of times that each formulaewas used. The majority of the companies used dividend over operating profitbefore abnormal items and after income tax to compute dividend payout ratio.Only three companies used dividend per share divided by EPS
TABLE 5Dividend per Share ( $)
Roof• times-•used35
4
39
pQimulae
Dividend / number of shares on issue
Dividend / weighted average number of shares
Total
Table 5 shows two different formulae used to compute dividend pershare in the 39 disclosures. The number of times that each formulae was usedis also indicated. In making the computations for dividend per share, only fourcompanies used weighted average number of shares, while 35 companies usednumber of shares in issue.
TABLE 6Dividend per Ordinary Share ( $)
fines;used14
1
15
FofOTJtoe
Dividend / number of ordinary shares
Dividend / number of ordinary average capital
Total
Table 6 presents two different formulae used to compute the dividendper ordinary share in the 15 disclosures. It seems that most companies useddividend divided by number of ordinary shares instead of averages figures.Only one company used the average ordinary shares to calculate this ratio.
24

Jurnal Akademik UiTM Sarawak Vol. 2, No. 1, Disember 2001
TABLE 7Gearing ratio (%) or Debt to equity Ratio
Nuoftimesased
125221111
1
1129
Formulae ' \
Net debt / shareholders' equityNet interest bearing debt / total shareholders' equityNet borrowings / shareholders' fundNet interest bearing debt / shareholders' equity + net interest bearing debtNet borrowings / equityGross borrowing / shareholders' fundNet debt / net debt + shareholders' equityNet debt (bank loans & other loans, bank overdraft & short termborrowings less cash and deposit at call) / shareholders' equityLong term + short term + non-course finance / shareholders' equityplus total borrowings 1 Net borrowing / total capital + reservesBorrowings net of cash / shareholders equityNet debt / shareholders' equity and convertible notesTotal
The gearing ratios were computed in many different ways. Table 7highlights 12 different formulae used to compute gearing ratios in the 29disclosures. The number of times that each formulae was used is alsoindicated. To compute the gearing ratios, 12 companies used net debt/shareholders' equity and this the most popular computational method beingused. From the above table it also can be concluded that seven companies usednet interest bearing debt as its numerator while five companies used netborrowing as its numerator. Fifteen companies used net debt as its numeratorand it has become the most frequently used numerator.
TABLE 8Interest Cover (times )
No of:timesused
17
1
1
19
Formulae
Operating profit before interest and tax and abnormal items / net interest
Operating profit including abnormal items before interest expense and incometax expense and income tax expense / total interest paid or payable
Operating profit before interest, abnormal and income tax / gross interest expense
Total
25

Jurnal Akademik UiTM Sarawak Vol. 2, No. 1, Disember 2001
Table 8 shows three formulae in the 19 disclosures and the number oftimes that each was used. Of 19 disclosures that used the formulae forinterest cover, only one company included abnormal items. The majority of theformulae that were used (17 times ) had net interest in the denominator whilethe remaining ones used total interest or gross interest expense.
TABLE 9Return on Sales ( % )
Profit before interest, tax and abnormal items (EBIT) / sales revenueOperating profit after tax before abnormal items / sales revenueProfit before tax / salesProfit after tax / sales revenueProfit before interest and tax / salesPre-tax profit / turnoverEBIT / trading revenueEBIT / revenueOperating profit after interest, abnormal and tax / sales
14 Total
Table 9 indicates a variety of formulae for return on sales ratio, but onlythe first four formulae appeared more than once. The remaining formulae weresubstantially less frequently than the first four. This ratio was computed usingnine different formulae in the 14 disclosures. Table 9 also lists formulae andthe number of times each was used.
TABLE 10Return on Shareholders Equity ( % )
No oftimes_used_
432211
114
Formulae
Profit after tax, abnormal item and outside equity interest / shareholders' equityOperating profit after tax and abnormal item / shareholders' equityOperating profit before tax and abnormal item / shareholders' equityOperating profit after tax before abnormal item / shareholders' equityEarnings after tax / shareholders equityProfit after tax before extraordinary item and outside equity interest /total shareholders' equityOperating profit after extraordinary item / shareholders' equityTotal
26

Jurnal Akademik UiTM Sarawak Vol. 2, No. 1, Disember 2001
Table 10 presents seven different formulae used to compute the returnon equity in the 14 disclosures. Table 10 also lists the formulae and thenumber of times each was used. A problem with determining formulae fromthe methods used in the annual reports is that the companies often did not facesimilar situations. For example, not all had an extraordinary item or outsideequity interest. Thus, it cannot be definitely determined which formulae wouldbe used if confronted with an extraordinary item or outside equity interest.
CONCLUSIONS
This study has identified the most frequently used computationalmethods of financial ratios which were disclosed in the Australian companies'annual reports. Many of the financial ratios reported were found in thefollowing sections of annual reports: financial summary, financial highlights,statistical summary, financial statistical analysis, financial review, and others.The most frequently used ratios being disclosed were ratios that give interest tothe shareholders such as dividends per share. It can be therefore concluded thatthe disclosures of financial ratios have significant effect on the preparers andalso the users of annual reports.
The computation method for the ratios reported also varied greatly.This was particularly true for some ratios such as gearing ratio, return on sales,return on shareholders' equity, dividend cover and dividend payout ratio. Forexample, gearing ratios had 12 different formulae in the 29 disclosures. Thedifferent computations for the same ratios introduce a confusing factor to thedisclosure of financial ratios. Accountants may have conflict of opinionsregarding the terminology and classification used in accounting reports.
Without a uniform standard, companies may compute and discloseratios in a manner that is most favourable to their own position. For example,preparers of annual reports may control the data by manipulating theclassification of accounts and / or the choice of ratio components or altering thenumber and type of components from time-to-time to enhance the company'simage such as the profitability, growth and liquidity. So, the ratios that weredisclosed are not validly comparable with ratios disclosed by other companiesand industry averages and may not be useful for decision making purposes.
Some of the ratios disclosed in the annual report were accompanied bydefinition of terms, charts and figures in order to assist the user inunderstanding the financial statements. However, since there is no uniformityin the definition of terms and ratios, there is a danger that the user will make
27

Jurnal Akademik UiTM Sarawak Vol. 2, No. 1, Disember 2001
comparisons between companies using data that are not consistent. Thedisclosure of financial ratios based on inconsistent formulae may distort theusers' assessments about the companies. For example, by using differentcomponent compositions by different companies at a point in time, users findthemselves unable to compare ratios across companies reliably. To overcomethis problem, every company should define clearly the components ofnumerators and denominators used consistently year-by-year and disclose anychanges that may arise.
Lastly, in order for the financial ratios to be a useful tool in financialstatements analysis, the computation and interpretation of financial ratiosshould be included in the reports. This objective can be achieved throughuniformity in both the contents of statistical ratios and also their format ofpresentation.
BIBLIOGRAPHY
Barnes, P., (1987) The Analysis and Use of Financial ratios: A Review Article',Journal of Business Finance and Accounting, Winter, pp. 449-461.
Bird, R.G. and McHugh A.J., (1977)" Financial ratios - An Empirical Study',Journal of Business Finance & Accounting, April, Volume 1, pp. 29-45.
Cooke, T.E., ( 1989), ^An Empirical Study of Financial Disclosure by SwedishCompanies', Thesis (Phd), University of Exeter.
Courtis, J.K., (1996), "Annual Report Financial Ratio ComponentConsistency', Asian Review of Accounting , Vol 4:1, pp.146-158.
Deakin, E.B., (1976), 'Distribution of Financial Accounting Ratios: SomeEmpirical Evidence', The Accounting Review, January, pp. 90-96.
Elam, R., (1975)/The Effect of Lease Data on the Predictive Ability ofFinancial Ratios', The Accounting Review, January, pp. 25-42.
Foster,G., (1986), ^Financial Statement Analysis', 2nd Edition, Prentice Hall,New Jersey.
Giacomino, D.E. and Mielke, D.E., (1993)"Cash Flows: Another Approach toRatio Analysis', Journal of Accountancy, March, pp. 55-58
28

Jurnal Akademik UiTM Sarawak Vol. 2, No. 1, Disember 2001
Gibson, C.H., (1980),The Need for Uniform Financial Ratios', Journal ofAccountancy, May, pp. 78-86.
Gibson C.H., (1982),"Financial Ratios in Annual Report', CPA Journal,September, pp. 18-29.
Gibson, C.H. (1983),' Financial Ratios as Perceived by Commercial LoanOfficers,' Akron Business and Economic Review " Summer, pp. 23-27'.
Gibson C.H., (1991),' Financial Statement Analysis : Using FinancialInformation' 5th. Ed. South-Western Publishing Co. Ohio.
Hasseldine D.J., Walsh, J.P. and McNikle, D. (1991) " Financial RatioReporting by the Print Media : A Note', Accounting Forum, June, pp. 61-79.
Horrigan, J.O., (1965),'Some Empirical Bases of Financial Ratio Analysis',The Accounting Review, July, pp. 558-568.
Houghton, K.A., and Woodliff D.R., (1987),' Financial Ratios : The Predictionof Corporate ' Success and Failure', Journal of Business Finance andAccounting, Winter, pp. 537-554.
Hogget,J.R., and Edwards, L., (1996), 'Analysis and Interpretation of FinancialStatements', in Financial Accounting in Australia, John Wiley & Sons,Singapore, pp. 1078-11133.
Holmes, G, and Sudgen, A ., ( 1994), 'Interpreting Company Reports andaccounts', 5th. Edition, Prentice Hall, London.
Lev, B., (1974), "Financial Statement Analysis. A New Approach', PrenticeHall, new Jersey.
Lev, B. and Sunder S., (1979), 'Methodological Issues in the Use of FinancialRatios', Journal of Accounting and economic, December, pp. 187-210.
Meigs, R.F., and Meigs, M.A, and Bettner, M and Whittington, R., (1996),"Accounting: The Basic for Business for Business Decision', The MacGrawHill Companies.
William R.W., 91984), "Evidence on the elective reporting of Financial Ratios',The Accounting Review, April, Vol LIX, No 2, pp. 296-298.
29