
Jumpstart Our Business Startups (“JOBS”) Act · PDF fileJumpstart Our Business Startups (“JOBS”) Act

Disclosure and the JOBS Act: Information
Asymmetry, SEC Letters, and Post-IPO Liquidity∗
Sudip Gupta and Ryan D. Israelsen†
First draft: March 15, 2014
This draft: November 29, 2014
Abstract
This paper evaluates the impact of the recently passed JOBS Act on IPO outcomes. A significantnumber of IPO firms use provisions of this act. For firms taking advantage of the JOBS Act,we find that, relative to a matched set of peer firms, (1) IPO underpricing increases, (2) postIPO liquidity decreases and (3) disclosure affects the probability of informed trading (PIN).These three results suggest that there is an increased degree of asymmetry of information amonginvestors in JOBS Act firms. The easing of disclosure requirements in the JOBS Act thereforeadversely impacts these firms by increasing the asymmetric information induced cost. Using anovel textual analysis technique to extract a set of disclosed risk factors from the prospectus,we examine which disclosures are associated with these costs. The Securities and ExchangeCommission (SEC) provides a complementary information production role via its commentsduring the filing process. A one standard deviation increase in a proxy for the winner’s cursefrom the SEC’s public signal increases underpricing by about 5.3%. The SEC’s comments alsoact as valuable inputs for post IPO information production as measured by PIN.
Keywords: Disclosure, Information Asymmetry, IPO, JOBS Act, Liquidity, Probability ofInformed Trading, Underpricing, Textual Analysis, Topic Models
∗We thank Viral Acharya, Reena Agarwal, Azi Ben-Rephael, Matt Billett, Sudheer Chava, Gerard Hoberg, CraigHolden, NR Prabhala, Rangarajan Sundaram, and Suresh Sundaresan for detailed comments and suggestions andparticipants at the Indiana University finance brown bag for helpful comments. We thank Jun Wu for excellentresearch assistance.†The authors are at Kelley School of Business, Indiana University. Gupta: [email protected], Israelsen:

1 Introduction
The Jumpstart Our Business Startups (JOBS) Act became law in April 2012 with the goal of
reducing the costs and delays of the IPO filing process. The JOBS Act coined a new term for small
firms with revenues of less than $1 billion: emerging growth companies (EGCs).1 The act aimed
to reduce the cost of raising new equity by easing regulatory restrictions for EGCs and to thus
“jumpstart” growth. The IPO process – “going public” – is particularly costly for small firms. In
this paper, we test whether there are indirect costs associated with the JOBS Act in terms of IPO
underpricing, informed trading, and post-IPO, secondary market illiquidity.
Over time, the disclosure and filing requirements of IPOs had become increasingly stringent for
firms wanting to access equity markets. In addition to the standard fees charged by underwriters,
going public also involves paying various auditor and legal fees in order to certify and maintain the
standard, stringent disclosure requirements. The IPO process also involves significant uncertainty
about the amount of money to be raised and the fair offer price for the equity. The impact of these
costs and uncertainties is larger and has a significantly more discouraging effect on small firms
who want to raise equity to enhance their future prospects than on large firms. Small firms have
relatively weak bargaining positions with respect to alternative private funding sources such as
bank loans and venture capital financing. This, in turn, increases the cost of capital and makes new
projects unattractive which impacts the growth of the economy.
With the backdrop of the great recession and the associated “drying up” of the IPO market, the
JOBS Act was enacted to reduce the regulatory burden and make it less costly for small firms to go
public. The main provisions of the JOBS act were designed to reduce the costs mentioned above.
For example, with a “testing the waters” clause, EGC firms may solicit interest from qualified
institutional buyers (QIB) about a contemplated offering. These firms may also “confidentially”
file the registration with the Securities and Exchange Commission (SEC). These provisions were
intended to reduce the uncertainty of the potential offer price and issue size and to receive feedback
from the market, thus enhancing EGC firms’ IPO prospects. EGC firms may also take advantage of
certain “scaled financial disclosure provisions” and are exempt from “internal controls audits”, both
1Throughout this paper, we will refer to EGC firms using JOBS Act provisions to go public as JOBS Act IPOs orEGC IPOs.
1

of which should reduce the cost of auditor fees and the time taken to go public. EGC firms are also
exempted from various other costly disclosures which should further ease the process of going public.
However, reducing disclosure requirements has a negative side effect: it may increase other
indirect costs of going public. There may be significant information asymmetry among investors
about the future prospect of an IPO firm. Uninformed investors may require compensation to bear
the adverse selection risk which may lead to underpricing of the issue. IPO underpricing – defined as
the first day return relative to the offer price – is like an indirect cost to the firm as it leaves money
on the table to satisfy enough investors in order to attract enough investors. Some of the provisions
of the JOBS Act may indirectly increase the degree of information asymmetry. For example retail
and uninformed investors may worry about the true quality of the firm if lower disclosure norms or
lower accounting standards are used. This aggravates the adverse selection problem and investors
may demand even more compensation to bear the adverse selection risk. This in turn should further
increase the underpricing of EGCs.
In addition to the the direct impact on underpricing, the higher degree of asymmetric information
may impact trading and liquidity in the secondary market. This should be most pronounced in the
days and weeks immediately following the IPO. This asymmetric information induced liquidity risk
may force all investors to demand more compensation in anticipation of bearing the risk and hence
the IPO may be further underpriced.
In this paper, we examine the performance of firms that went public as EGCs relative to a
matched sample of their peer firms before the JOBS Act. To the best of our knowledge this is
the first paper which analyzes the IPO firms which went public via the JOBS Act and examines
how changes in disclosures of both soft and hard information affect the associated indirect costs.2
Specifically, we find evidence that the JOBS Act affects underpricing, asymmetric information, and
post-IPO, secondary market liquidity. EGC firms leave substantially more money on the table
in terms of the first day return, relative to their peers. On average, EGC firms, post JOBS Act,
have about 7% more underpricing relative to the similar sized (less than $1 billion in revenues)
firms which went public just before the JOBS Act. Interestingly, small firms which went public
2In a recent paper, Dambra, Field and Gustafson (2014) provide evidence that the JOBS Act led to an increase inIPO Volume. In contrast, Chaplinsky, Hanley and Moon (2014) find no reduction in the direct costs of IPOs underthe JOBS act and no impact on IPO Volume.
2

after the JOBS Act, but did not use the provisions of the JOBS Act, have significantly less (about
13%) underpricing relative to other small firms (less than $1 billion in revenues) who use JOBS Act
provisions and list themselves as EGC firms. Among the set of EGCs, we find that underpricing is
about 8% higher for firms that choose to confidentially submit their draft registration statement
to the SEC. These firms are more likely to be uncertain about their valuation and prospects. The
underpricing may be compensation for this uncertainty.
Motivated by the result that the disclosure provisions of the JOBS Act affect underpricing, we
examine whether general risk disclosures can explain underpricing. We use a novel textual analysis
technique – topic modeling – to analyze the variation in IPO firms’ disclosed risk factors and to
link them to underpricing and asymmetric information. Topic models are used to uncover a set of
“topics” in a body of documents by finding latent relationships between groups of words that tend
to appear together. Using a topic model, we categorize IPO firms’ risk disclosures from the risk
factors section of their prospectus into a set of “Disclosed Risk Factors.”3 We then test whether
variations in the frequency of disclosed risk can explain the differences in underpricing between EGC
firms and a matched sample of their counterparts. We find that firms disclosing relatively more
risks associated with litigation, with uncertainty surrounding the development of new products,
with corporate control/ownership, with systems failure, with fluctuations in demand for products
and services, and with disclosure tend to have more first-day IPO underpricing. These last two
risk factors are especially relevant for EGC IPOs given both the impact of the great recession on
demand, and the reduced disclosure environment of the JOBS Act.
It is the context of the words that matters, not just the words themselves. For example, the
words “product” “drug”, “market”, and “candidate” are very commonly used words in risk factor
disclosures associated with the research and development of new pharmaceutical products. However,
when the words “clinical”, trial”, “approval”, and “FDA” also appear with these words, they tend
to be associated with risks of the product approval process. The word “product” is commonly
found in a few other risk factors. Thus, simply counting the number of times the word “product”
appears will not capture this distinction. Topic models are designed to capture these differences in
an objective way that is not captured by word counts, or even manual classifications.
3For a list of extracted topics and the words that make up each topic, please refer to the appendix and Section 4.B
3

We summarize the variation in disclosed risks using the first and second principal components
and find that both significantly affect underpricing. A one-standard-deviation increase in the first
principal component is associated with 8% more underpricing. Differences in risk factor disclosures
can explain much (but not all) of the differences in underpricing between EGC firms and their coun-
terparts. The fit of the model doubles with the inclusion of the principal components. Importantly,
the impact of risk disclosures holds after controlling for the use of JOBS Act accommodations.
Several other papers examine the impact of the text of the prospectus on underpricing and
uncertainty.4 For example, Beatty and Welch (1996) provide evidence that the number of risk
factors disclosed in a firm’s prospectus is positively related to IPO underpricing. In terms of the
informational role of the prospectus, our paper is perhaps closest to Hanley and Hoberg (2010).
While they do not identify specific risk categories, they examine four sections of the prospectus
(including the “Risk Factors” section) and find that offers with more informative content (i.e., words
that deviate from those used in other IPOs in the same industry and from recent IPOs) have more
accurate initial offer prices and less underpricing. In a related paper, Hanley and Hoberg (2012)
examine the impact of revisions to the prospectus on price revisions during the issue process itself.
The tone of the language in the prospectus is also related to underpricing. Using a six sentiment
word lists created for financial documents, Loughran and McDonald (2013) find that the frequency
of uncertain, weak modal, and negative words in the prospectus are significantly related to IPO
underpricing. In contrast to the techniques used in the above papers which examine the number
of risks factors or the novelty or tone of the language, we examine the types of risks disclosed by
IPO firms and their individual impacts on underpricing and asymmetric information. Hence, our
approach is more consistent with the proposal by Ljungqvist (2007), in his review article, that a
“promising approach might be to identify specific . . . risk factors that, if present, indicate higher
uncertainty.”
Next, we examine the impact of the JOBS Act and its disclosure provisions on asymmetric
information and liquidity in the secondary market immediately following the IPO. Within the subset
of EGCs, we find evidence that informed trading increases with firms that take advantage of the
4A sample of papers examining the textual content of disclosures to the SEC after the IPO include Li (2008), Youand Zhang (2009), Hoberg and Phillips (2010), Loughran and McDonald (2011), Jegadeesh and Wu (2013), Lawrence(2013), and Loughran and McDonald (2014).
4

reduced disclosure provisions of the JOBS Act. In particular, there tends to be higher probabilities
of informed trading (PIN, Easley, Kiefer, O’Hara & Paperman (1996)) for firms disclosing fewer
years of selected financial data (about 1.7% higher per year of data) and omitting a discussion of
executive compensation (about 2% to 4% higher). When examining risk disclosures of EGCs and
a matched sample of their counterparts before the JOBS Act, we find that disclosed risk factors
explain a significant portion of the variation in informed trading after an IPO. A one-standard
deviation increase in the second principal component is associated with a reduction in PIN of more
than 3%. Moreover, the impact of risk disclosures on PIN changes after the JOBS Act. Additionally,
the number of words in the risk factor section is positively related to the probability of informed
trading after the IPO. Increased informed trading activity suggests that the secondary market plays
an important role in producing information in the environment of reduced disclosure following an
EGC’s IPO.
Next, we examine whether post-IPO liquidity changes as a result of the JOBS Act. We match a
sample of EGC firms with similar, pre-JOBS Act counterparts, and examine several measures of
spread for the first and second day following the IPO. Both unconditionally and controlling for firm
characteristics, we find that spreads are indeed generally larger after the JOBS Act. This, together
with the PIN and underpricing results described above, highlights the indirect costs of the JOBS
Act.
Finally, we examine the complementary role played by the Securities and Exchange Commission
following the enactment of the JOBS Act. Given the reduction in the amount of information
disclosed by most JOBS Act firms, public signals by the SEC about the IPO may affect investor
behavior. In particular, we examine the language used in the SEC’s comment letters to EGCs
following the submission of their draft registration statement. We find that when the SEC expresses
more uncertainty in their comments and uses more weak modal words relative to strong modal
words, underpricing tends to increase. This is consistent with “winner’s curse” from the standpoint
of an uninformed IPO investor. When there is more uncertainty, investors require a discount in the
IPO price. Thus, the SEC plays a complementary role to IPO firms in providing public information
to the market.
5

In addition to being the first paper to document the impact of changes in disclosure of hard and
soft information on the indirect costs of the JOBS Act, our paper relates to three broad strands
of literature: IPO underpricing, asymmetric information, and liquidity. Asymmetric information
is shown to affect both liquidity and IPO underpricing. If the JOBS Act increases information
asymmetry, it should impact both IPO underpricing, PIN, and post-IPO liquidity.
The impact of asymmetric information in the IPO process has been a topic of research for
decades (see Ljungqvist, 2007, for a survey). The issuing firm elicits information from informed
investors during the book-building process via the investment bank (Benveniste and Spindt,1989)
and IPO underpricing is a fair rent for producing information. The information asymmetry problem
among potential investors – both informed and uninformed – generates the winner’s curse problem
(Rock, 1986). The type of IPO mechanism use is shown to have a strong impact on information
revelation. Busaba and Chang (2002) showed that the use of a bookbuilding process elicits more
information during the IPO process than does a fixed price offering. Our paper examines the
impact of the JOBS Act and the role of information production during the IPO process on post-IPO
outcomes for EGCs.
Easley and O’Hara (2004) show that the differences in the composition of public and private
information can create asymmetric information induced systematic risk. In their model, uninformed
investors perceive different risk and return due to their information disadvantage and as a result
hold too many bad stocks in their portfolios. Anticipating this, these investors require compensation
for holding stocks with more asymmetric information. This risk is the greatest in stocks with less
public information. Thus, if the JOBS Act increased information asymmetry by reducing publicly
available information, this should lead to greater IPO underpricing. Consistent with this theory, we
find that compared to a matched sample, EGC IPO underpricing is almost 7% higher.
Easley and O’Hara also show that if more information about an asset is private, the difference
between the average holdings of informed versus uninformed investors will increase. Therefore, if
the JOBS Act increases private information, more informed investors should acquire shares during
the IPO process which will increase the dispersion of shareholdings.
6

Amihud and Mendelson (1986) model and test the relationship between liquidity and required
return for seasoned securities. Numerous follow-up papers (Acharya and Pedersen, 2002, among
others) show that investors demand compensation for bearing the systematic liquidity risk. A greater
degree of asymmetric information should reduce a stock’s liquidity as investors stop supplying
liquidity in order to avoid the asymmetric information induced winner’s curse. This should in turn
increase the expected return for stocks with more asymmetric information. In Vayanos and Wang
(2012), asymmetric information increases the expected return of a risky asset. They show that the
empirical relationship between illiquidity, as measured by lambda, and expected returns is positive
under asymmetric information.
Ellul and Pagano (2006) show that IPO underpricing may be related to the expected after-market
liquidity and that underpricing of the issue is required as compensation for investors bearing the
post-IPO liquidity risk. In their model, there are two types of private information about an IPO
firm. One is revealed during the IPO process and the other is revealed via trading in the post-IPO,
secondary market. If the second type of asymmetric information is higher that should lead to an
increase in the bid-ask spread, post-IPO, and a reduction in liquidity. The “flippers” who buy
during the IPO and sell immediately afterwards require compensation for the increased trading
costs induced by asymmetric information. The amount of information that remains undisclosed
after the IPO therefore depends on how much private information is revealed during the IPO stage.
We find evidence that JOBS Act IPO firms with more underpricing tend to have a lower probability
of informed trading after the IPO. This suggests that in an environment with lower disclosure
standards, these two types of information act as substitutes.
If the JOBS Act increases the degree of asymmetric information, there should be an increase in
the winner’s curse and hence a reduction the post-IPO liquidity. Expecting the increased illiquidity
induced by the increase in asymmetric information, investors will demand a larger return to bear
this secondary market illiquidity risk. Thus, IPO underpricing should increase. The above discussion
provides us the following formal hypotheses to be tested with respect to the JOBS Act:
H1: The IPO underpricing (as measured by the first day return relative to IPO offer price)
should be higher for a set of firms post-JOBS Act relative to a similar set of pre-JOBS Act firms.
7

H2: Probability of informed trading in the post-IPO period should be higher for small (EGC)
firms, post JOBS Act, relative to their similar sized peer group, pre-JOBS Act.
H3: Post-IPO, secondary market liquidity should be lower for small (EGC) firms, post JOBS
Act, relative to their similar sized peer group, pre-JOBS Act.
We find strong evidence in support of our hypotheses. Our paper makes several contributions to
the literature. First, we are the first to document the effect of the JOBS Act on IPO underpricing,
informed trading, and post-IPO liquidity. Second, we document the extent to which EGCs take
advantage of scaled disclosure requirements and other provisions of the JOBS Act in the IPO
process and examine their effects on underpricing, informed trading, and liquidity. Finally, using a
novel textual analysis technique we examine the effects of disclosed risk factors on underpricing and
informed trading.
To date, there has been little research on the impact of the JOBS Act. Dambra, Field, and
Gustafson (2014) also analyze the impact of the JOBS Act on the IPO decision and provide evidence
that the increase in the number of JOBS Act IPO relates to a reduction in the direct costs of
disclosures. On the other hand, Chaplinsky, Hanley and Moon (2014) find no reduction in the direct
costs of IPOs under the JOBS act and no impact on IPO Volume. By contrast, our paper focuses
on the indirect costs of the JOBS Act for EGC IPOs in terms of on underpricing, and post-IPO
PIN and liquidity. As described above we also use a novel textual analysis technique to link these
costs to various disclosed risk factors.
While this paper highlights negative impacts of the JOBS Act, these results do not imply that
the JOBS Act failed to help EGCs. As mentioned, there are undoubtedly significant benefits of the
JOBS Act on small firms. Whether the benefits outweigh the costs is an empirical question left for
future research.
The remainder of the paper is laid out as follows. In the following section, we describe the
provisions of the JOBS Act. In section 3, we describe our data. In section 4, we describe our
empirical methodology and our results. We conclude in section 5.
8

2 JOBS Act
The Jumpstart Our Business Startups (JOBS) Act became law on April 5, 2012 with the stated goal
“to increase American job creation and economic growth by improving access to the public capital
markets for emerging growth companies” (EGCs).5 Title I of the JOBS Act defines an EGC as a
company with revenues of no more than $1 billion in its most recent fiscal year. It also delineates
certain criteria by which such a company may lose its EGC status.6 Title I also lists a menu of
special provisions for the EGCs to chose from. The EGCs may choose all, some, or none of the
special provisions when going public. The main provisions are:
• Confidential SEC review: EGCs may make a confidential submission provided that the initial
confidential submission and all amendments are publicly filed with SEC no later than 21 days
before the commencement of the road show.
• Testing the waters: The EGC (or its underwriter) can engage in oral or written communications
with institutional investors, either before or after filing the first registration statement.
• Reduced financial disclosure: EGCs may disclose only two years of audited financial statements
instead of the three years norm. They may also disclose two years instead of five years of
selected financial data.
• Exemption from internal controls audit: The EGCs are exempt from an internal control audit
as stipulated by the Sarbanes-Oxley Act (2002).
• Reduced disclosure of executive compensation: EGCs are exempt from shareholders advisory
votes on executive compensation required by the Dodd-Frank act of 2010. Moreover, EGCs
5See H.R. 3606 “Jumpstart Our Business Startups Act” http://www.gpo.gov/fdsys/pkg/BILLS-112hr3606enr/
pdf/BILLS-112hr3606enr.pdf6Sections 101 (a) and (b) of the JOBS Act state that after the initial determination of EGC status, a company will
remain an EGC until the earliest of:
• the last day of any fiscal year in which company earns $1billion revenue or more
• the last date of the fiscal year following the fifth anniversary of IPO date
• the date of issuance, in a three year period of $1 billion or more of non-convertible debt
• the date on which the issuer is a ”large accelerated filer” with at least $ 700 million in public equity float
9

may omit a written discussion of executive compensation from its prospectus and may disclose
the compensation of as few as 3 executives instead of the 5 previously required.
• Extended phase-in for new GAAP: EGCs may continue to use private accounting phase-in
periods for new GAAP standards for a period after the IPO.
• Exemption from Public Company Accounting Oversight Board (PCAOB) rules
These provisions are intended to provide the EGC distinct advantages when going public. First,
they improve the ability of firms and underwriters to gather information about the costs/benefits of
going public without committing to an IPO or sending negative signals to the market. For example,
confidentially submitting a draft registration statement to the SEC for comments allows a company
to decide on the optimal timing of an IPO while significantly reducing the glare of publicity and
hiding its intentions from competitors. Similarly, the testing the waters clause enables the issuer
and its underwriter to gauge market sentiment – especially in industries where valuations are highly
uncertain.
Second, many of these provisions reduce the costs of the IPO process. For example, because a
confidential draft registration statement is not considered a filing, no filing fee needs to be paid.
Similarly, providing two years instead of three of audited financial statements may also save the EGC
auditor fees especially if they have recently changed auditors. Moreover, confidential submission
shields the issuer from the Sarbanes-Oxley Act until the registration is publicly filed. The EGCs
may also use private company phase-in period for accounting standards after the IPO.
In addition to the above provisions, the JOBS Act also relaxes standard norms for analyst
research reports of an EGC. Specifically, the JOBS Act suspended the existing FINRA rule of 40 day
of research quiet period immediately following the EGC IPO. It also includes provisions regarding
with pre-deal research communications.
There are minimal additional disclosure requirements for EGCs. For example, if the EGC does
not opt out of the private accounting standard then SEC requires them to mention that as an
additional risk factor in the prospectus to differentiate it from other public companies. EGC are
also required to disclose their EGC status in the prospectus as well as a summary of the exemptions
10

available to the EGC. Finally, if the EGC decides to opt out of the transitional accounting standards,
it must also mention that it is irrevocable.
In the following section, we examine the frequency with which EGCs take advantage of each of
the provisions of the JOBS Act and describe the data used in the analysis.
3 Data
We have three major sources of data in this paper. The IPO prospectus filed with the SEC provided
the stock price and other filling details of the firm as well as the pre-IPO accounting data and which
(if any) of the JOBS Act provisions are used by the firm. We hand collect information from the
EDGAR website about whether firm filed confidentially before the IPO. Additionally, we gather
SEC comment letters from EDGAR. Post-IPO share prices and trading information are collected
from Compustat, CRSP, and TAQ. Finally the IPO prospectuses are the sources of the textual risk
factor analysis.
A EGC Usage of JOBS Act Provisions
Before proceeding to the main analysis, we examine the frequency with which EGCs choose to
take advantage of the each of the JOBS Act provisions. To gather this information, we read the
prospectus of the EGCs in our sample to determine whether or not they took advantage of the
provisions of private accounting standards, omitted a discussion of executive compensation, provided
two years instead of three of audited financial statements, provided fewer than five years of selected
financial data, and provided compensation data on fewer than five executives. Panel A of Table 1
presents the frequency with which 220 IPO firms from 2012 and 2013 claiming EGC status take
advantage of each of these provisions and correlations between use of these provisions.
The use of various provisions of the JOBS Act is quite variable. The least used provision – the
choice to continue to use private accounting standards for a period after the IPO – is only used
by 20% of firms. The vast majority choose to opt out, perhaps as a signal of willingness to adopt
11

better corporate governance practice. 59% choose to file a confidential draft registration statement
with the SEC. Note that we can only observe those who chose to go public after a confidential filing,
so the true number is certainly higher.
Almost half of the firms omit a written discussion of their executive compensation from the
prospectus, and 80% report the amount of compensation for less than 5 executives. Surprisingly,
there is no correlation between the use of these two accommodations.
A significant majority (151 out of 220) chose to report fewer than five years of selected financial
data although almost half of the firms in our sample chose to provide at least three years of audited
financial statements. Interestingly, firms who disclose fewer than three years of audited statements
are more likely to provide fewer than five years of selected financial data as can be seen from the
correlations in Panel A. Panel B shows that about 86% of firms (68 of 79) providing fewer than five
years of selected financial data also provide fewer than three years of audited financial statements.
We find that 77% (34 out of 44) of those who chose to continue to use private accounting standards
also chose to disclose fewer than five years of selected financial data. Therefore, although there is a
considerable variation in the choice of the JOBS Act provisions, there are significant correlations
and disclosure patterns among EGCs.
B Summary Statistics
Table 2 presents summary statistics for the variables used in this study for four types of IPO firms.
The main group of interest is the 234 firms claiming EGC status under the JOBS Act between
April 2012 and December 2013. To qualify, a firm must have had revenues of less than $1 billion
in its most recent fiscal year. We use three types of IPO firms as controls. First, we match firms
on size, revenues and industry to create a matched sample of 186 firms with revenues less than $1
billion that had IPOs from the beginning of 2010 until just before the JOBS Act became law.7 For
the sake of simplicity we denote these firms as SMALL, though they are classified by revenues, not
assets. The next group we use as a control is firms that qualified as EGCs under the JOBS Act,
but chose not to claim EGC status in their filing. There are only 17 such firms. Finally, we use all
7In untabulated results, we also match on the additional variables number of employees, offer and offer amount,and results look very similar.
12

other IPO firms in the JOBS Act era as a control. We call these firms with more than $1 billion in
revenues LARGE. There are 45 such firms in out sample.
Panel A presents means, standard deviations, and standard errors for IPO-level variables for all
four groups of IPO firms. Variables include the IPO offer price, the size of the offering, the fees,
and the 1- and 3-day IPO returns for the four types of IPO firms. The first variable of interest is
the IPO offer price. The mean IPO offer price for EGC firms is statistically smaller than those of
the three other groups (as indicated by the asterisks in the table). The average size of the offerings
are $154 million for both the EGC companies and those from before the JOBS Act that would have
qualified as EGC. Not surprisingly, the set of firms ineligible for the JOBS Act due to high revenues
tend to have larger offerings and lower fees than EGC firms.
The next two variables are the 1-day IPO return - defined as the return based on the IPO offer
price and the closing price on the first day trading on the exchange - and the 3-day IPO return -
defines using the closing price on the third day. The average 1-day and 3-day IPO returns for the
EGCs are 18 and 21 percent, respectively. Strikingly, EGC companies, on average, have larger 1-day
and 3-day IPO returns than the three control groups, suggesting that their IPOs are underpriced
relatively more. Underpricing is 5% to 15% higher, on average. Additionally, Panel A presents 22-,
44-, and 66-day PIN for EGCs and their matched peers from before the JOBS Act as well as the
total number of words in the risk factors section of the prospectus. 66-day PIN is higher, on average,
for EGCs. In the next section, we test whether these differences can be explained by differences in
firm characteristics and risks.
Panel B provides the same metrics as Panel A for a set of accounting variables gathered from
each IPO firm’s prospectus including assets, liabilities, revenues, research & development expense,
and investment in property, plant & equipment. These variables will be used as controls when
examining underpricing and liquidity. As before, asterisks indicate that the mean is statistically
different from the mean of the EGC group.
EGCs have an average of $454 million in assets, and $319 million in liabilities. These averages
are not statistically different from the other post-JOBS Act firms with revenues less than $1 million,
but are slightly larger than their pre-JOBS Act peers. They do tend to have less debt than the
13

“LARGE” firms, and by definition, lower revenues – $244 million compared to $4.3 billion. The 17
firms that opted not to claim EGC status tend to have larger revenues – $244 million on average.
There are no statistically significant differences in R&D expense between the EGC firms and the
three other groups. However, they do invest less in PP&E than the larger firms and those opting
out of the JOBS Act.
4 Empirical Methodology and Results
To examine the indirect costs of the JOBS Act, we perform several tests. First, we explore the
determinants of the relatively larger underpricing for EGCs identified in the previous section. Next,
we examine the impact of the JOBS Act on the probability of informed trading. Finally, we test
whether liquidity in the secondary market is higher for EGCs than their counterparts. For part of
the analysis, we use a set of disclosed risk factors extracted from IPO firms’ filings.
A JOBS Act Provisions and IPO Underpricing
We begin by examining which – if any – of the disclosure accommodations under the JOBS Act are
associated with more underpricing by examining the subset of EGC firms. Given that unconditional
average underpricing is 5% lower for these firms than their matched counterparts before the JOBS
Act, it is of interest to know whether variation in the use of provisions plays a role. For 215
firms qualifying as EGCs under the JOBS Act, we regress the first-day underpricing on each of
six accommodations, individually and jointly, along with age, lagged revenues, and lagged assets.
Additionally, we include a dummy variable indicating that the IPO firm had venture capital backing
(from SDC Platinum), a dummy variable indicating that the IPO had a star lead underwriter (defined
as a lead underwriter with the highest rating on Jay Ritter’s website, using the methodology in
Ritter and Loughran, 2004), a dummy variable indicating the firm is in a technology industry (Tech:
defined as the Fama French industries Computers, Software, Electronic Equipment, Healthcare,
Medical Equipment, and Drugs).8 Table 3 presents the results.
8Results (available upon request) are very similar using the 12 Fama French industries. However, there are veryfew IPOs in some of the 12 industries.
14

Generally, smaller firms with a star lead underwriter and venture capital backing tend to
have more underpricing. Interestingly, when the accommodations are tested individually, the only
accommodation that is associated with underpricing is the number of years of selected financial data.
Moreover, the impact seems to be in the wrong direction. However, once the other 5 accommodations
are accounted for, the coefficient is no longer significant. As seen in column (7), firms who submit
a confidential registration statement tend to have more underpricing – 8% more than those who
don’t. These EGCs are more likely to be more uncertain about their potential valuation and higher
underpricing may reflect higher degree of asymmetric information. These may be firms that would
otherwise not have gone public, or it might be interepreted by the market as a sign of uncertainty.
By the time of the IPO, it is known whether firms took advantage of this provision.
B Topic Models and Risk Factors
Motivated by the result that the disclosure provisions of the JOBS Act affect underpricing, we
next examine whether the specific types of risk that firms disclose can explain underpricing and
asymmetric information. In order to classify risk disclosures into a set of categories, we use a novel
textual analysis technique which avoids subjectivity problems associated with manual classification.
Topic Models are probabilistic generative models used to describe a set of latent “topics” that
occur in a given collection of documents. Documents are modeled as mixtures of a smaller number
of topics and topics as probability distributions over words. In generating a document, words are
assumed to have been randomly chosen from the topics given the specific document’s distribution
over topics, θ(d), and the word distribution for the drawn topics, φ. Based on these models, Bayesian
statistics can be used to “uncover” the latent document-topic and topic-word distributions. These
models are particularly useful when corpora are large and when there are many topics. One benefit
of using a topic model is the classification technique is standardized and objective. The results of a
manual classifications may depend on the individual performing the classification and also may not
be internally consistent. Topic models allow the data to determine the classifications, which may
include latent connections that a researcher might otherwise miss.
15

One of the most commonly used topic models in machine learning and computational linguistics
is Latent Dirichlet Allocation (LDA) (Blei, 2003).9 LDA is a hierarchical model which chooses the
latent topics as well as probability distributions in order to maximize the likelihood of observing a
given set of D documents. In particular, if we have K topics, we can write the probability of the ith
word in the dth document as
P (wdi) =K∑k=1
P (wdi|zd = k)P (zd = k). (1)
Here zd is a latent variable indicating the topic from which the ith word in document d was
potentially drawn and P (wdi|zd = k) is the probability of the word wi under the kth topic. P (zi = k)
gives the probability of drawing a word from topic j in the current document, which will vary across
documents.
The K topics are defined as categorical distributions10 over W words with parameter vector
φ, such that P (w|z = k) = φ(k)w , and the the dth document is defined as multinomial distributions
over the K topics with parameter vector θd, such that P (z) = θd. LDA augments the model with
the addition of Dirichlet priors on both θ and φ Specifically, θ ∼ Dirichlet(α) and φ ∼ Dirichlet(β)
where α and β are hyperparameters. Dirichlet priors are assumed. These priors are conjugate to the
categorical distributions which means posterior distributions are Dirichlet. The inferential problem
that needs to be solved is to analyze the posterior distribution
P (z, θ, φ|w,α, η). (2)
With the introduction of the Dirichlet priors, estimation is a matter of maximizing the total
probability of the model
P (W,Z, θ, φ;α, β) =K∏i=1
P (φi;β)M∏j=1
P (θj ;α)
Nj∏t=1
P (Zj,t|θj)P (Wj,t|φZj,t) (3)
9See Chang, et al. (2009) who provide evidence from experiments that both humans and topic models arrive atsimilar topics.
10The categorical distribution is equivalent to the multinomial distribution with one trial.
16

by choosing the set of parameter vectors θ and φ. These two sets of estimates provide the
document’s probability distribution across topics, and the topic’s probability distribution across
words, respectively.
The Securities and Exchange Commission Regulation S-K instructs filers to provide “provide
under the caption ‘Risk Factors’ a discussion of the most significant factors that make the offering
speculative or risky.” Regulation S-K initially applies to a firm when it files Form S-1 - the
“Registration Statement Under the Securities Act of 1933”, but since 2005 it has also applied to
the 10-K. Using the “Risk Factors” section from 10-Ks and S-1s from 1995–2012, Israelsen (2014)
extracts 30 risk factor “topics” using LDA and examines how they relate to firm-level risk and
systematic risk. We use the same model trained on the data to fit, out of sample, the set of risk
factors disclosed in the IPO filings of our set of firms. The Appendix contains a discussion of all 30
risk factors.
Panel C of Table 2 provides the average fraction of the “Risk Factor” section of firms’ prospectuses
dedicated to each of the 30 risk factors for all four groups of IPO firms. As before, asterisks indicate
statistically significant differences with respect to the EGC group of firms. Compared to their
counterparts from before the JOBS Act was in effect, EGC firms make more disclosures of risk
associated with accounting, with financial markets, with health care, with insurance, with the
regulatory approval of products, and with regulation. On the other hand, they spend less time
discussing risks associated with product market competition, demand, human capital, international
markets, the development of new (non pharmaceutical/biotech) products, and the supply chain.
They differ much more from other Post-JOBS Act, non EGC companies in terms of disclosed risk
factors.
C Disclosed Risk Factors and Underpricing
To examine whether differences in disclosure of these risks may explain some of difference in
underpricing shown in Panel A of Table 2, we examine both the EGC firms and their matched
counterparts from before the enactment of the JOBS Act. In particular, we regress the first-day
17

IPO return, ret1 on the set of disclosed risk factor frequencies as well as lagged revenues, assets, and
a dummy variable indicating that the firm is an EGC. Table 4 presents the results of this regression.
Most of the coefficients on the risk factor variables are not statistically significant. However, firms
disclosing relatively more risks associated with changes in demand, with the problems associated
with disclosure, with litigation, with the development of new products or technologies (especially
pharmaceutical or biotech), with ownership/governance, and with systems failure are more likely to
have larger first-day IPO underpricing. The dummy variable EGC, which indicates that the firm
has claimed EGC status under the JOBS Act is now only marginally significant. Thus, differences
in disclosed risk factors can explain much of the statistical difference in underpricing between EGC
and non-EGC firms.
In addition to examining the effect of individual risk factors on underpricing, we also examine
the impact of their first and second principal components, which together explain almost one-third
of the variation in disclosed risk. Table 5 presents the standardized coefficients of both. The first
principal component – which explains 16% of the variation in the disclosed risk factors – has positive
coefficients on risk factors associated with intellectual property, the development of new products,
the need to grow, systems failure, competition, human capital, and the internet, and negative
coefficients on risks associated with the ability to pay dividends, environmental regulation, access to
credit, and the price of oil. These may be considered to be new economy (or high tech) versus old
economy (or low tech) risks. The second principal component – which explains 14% of the variation
– has positive coefficients on risks asociated with variable demand, systems failure, competition, and
growth and negative coefficients on risks associated with R&D, product approval, health care and
intellectual property. These latter risks tend to be disclosed by technology firms, particularly biotech
or pharmaceutical firms. We regress the first first-day IPO underpricing on these two principal
components, “riskfactor1” and “riskfactor2” as well as the EGC dummy, lagged revenues and assets.
Additionally, we include interaction terms between EGC and the two principal components and the
number of words in the risk factor section, and dummy variables indicating that the firm is in a
technology industry, has a star lead underwriter, and had venture capital backing. Table 6 presents
the results.
18

As was the case when examining JOBS Act accommodations and underpricing in the subset
of EGC firms in Table 3, small firms with star lead underwriters and VC backing tend to have
more underpricing in the larger sample of IPO firms. As shown in column 2, EGC firms have
underpricing of about 6% before controlling for their risk disclosures. In the column 3, we see that
both riskfactor1 and riskfactor2 are associated with more IPO underpricing, but the length of the
risk factor section is not, suggesting that the the type of risk disclosed – not the quantity – is what
matters. Controlling for the type of industry, a one-percent-increase in the first (second) principal
component is associated with an increase in underpricing of about 8% (5%). Though the types of
disclosed risks can explain a significant amount of underpricing, EGCs still an average first-day IPO
return of about 7%, controlling for the other variables.
Given that the type of risk disclosed in the prospectus is related to underpricing, we return
to the subset of EGC firms and examine whether there is an interaction between the JOBS Act
accommodations and disclosed risk factors. The first two columns in Table 9 provide results of
regressing 1st day underpricing on the JOBS Act Accommodations and the various control variables
both with and without the first two principal components of the disclosed risk factors and the
number of words in the risk factors section. There is very little change from Table 3. Moreover, the
adjusted R squared increases from 0.14 to 0.18.
D Probability of Informed Trading
Now, we turn our attention to the impact of the JOBS Act, its disclosure provisions, and disclosed
risk factors on asymmetric information and liquidity in the secondary market immediately following
the IPO. While we focus on 66-day PIN, because it is likely to be more precisely estimated, we also
examine the impact on 22- and 44-day PIN.
Reducing the amount of information disclosed in the prospectus limits the information available
to the market and potentially increases opacity. As a result, following the IPO, there may be
more informed trading while new information production takes place. In Table 7, we find results
consistent with this story. For the subsample of EGCs, we regress each of our three our three PIN
measures (22-, 44-, and 66-day) on each of the disclosure provisions as well as age of the firm, lagged
19
revenues, lagged total assets, the star underwriter dummy, the venture capital dummy and the tech
industry dummy. Additionally, to control for changes in the general level of informed trading in the
market, we also include a measure of market pin (MKT-PIN-22, MKT-PIN-44, and MKT-PIN-66)
using data from the SPY ETF during the same window as the dependent variable is measured.
Firms who choose to disclose more years of selected financial data tend to have lower probabilities
of informed trading during the three months following the IPO. For each additional year, PIN
drops by between -0.015 and -0.017. This is statistically significant at the 1% level over the first
month, at the 5% level using over two months, and at the 10% level over a three-month window.
This is consistent with an asymmetric information story in which the reduction in information
initially allows informed investors to take advantage. Similarly, EGCs that choose to include a
detailed discussion of executive compensation in their prospectus tend to have less informed trading.
However, this result is only statistically significant over a three-month window.
Motivated by the underpricing results, we examine the effect of disclosed risk factors on the
probability of informed trading for both EGC firms and their matched counterparts from before the
enactment of the JOBS Act. Table 8 provides the results of these regressions for the 22-, 44-, and
66-day PIN for 353 firms. Additionally, to examine whether information revealed in by the amount
of underpricing affects PIN after the JOBS Act, we interact EGC with first day underpricing. This
test is motivated by Ellul and Pagano who examine two types of private information about IPO
firms – one revealed during the IPO process and the other revealed via trading in the post-IPO,
secondary market. The independent variables are the same as those in Table 6 with the addition of
a 22-, 44-, or 66-day market PIN.
The first three columns present results for the 66-day PIN. There tends to be less informed
trading for firms with a star lead underwriter. This is consistent with the story that the underwriter
is skilled at providing information to the market. As seen in the third column, this remains even
after controlling for variation in risk factors. There is no impact of the first principal component of
the disclosed risk factors on the 66-day PIN. However, the second principal component (riskfactor2)
is negatively related. Firms disclosing more risks associated with product development and approval
and intellectual property tend to have more informed trading. Recall that firms with a higher
riskfactor2 measure had more underpricing – consistent with more uncertainty. Here, a negative
20

coefficient means a lower probability of informed trading, and thus, less informational asymmetry.
However, the interaction term shows that this effect is actually reduced after the JOBS Act. Thus,
the market interprets the disclosures differently under the new disclosure environment. In contrast
with the underpricing regressions, controlling for the other variables and interaction terms, there
is no direct treatment effect. Finally, the number of words in the disclosed risk factor section is
positively related to the probability of informed trading.
Interestingly, as shown by the interaction term between Underpricing and EGC, the information
revealed by the level of underpricing actually reduces the probability of informed trading, suggesting
that information revealed during the IPO process may substitute for information revealed via trading
in the post-IPO, secondary market. However, accounting for the interactions, and evaluating at
their means, PIN is significantly higher for EGCs than their peers, suggesting a higher degree of
information, post JOBS Act.
The final two columns provide results for 44- and 22-day pin. Results are generally similar,
though PIN is likely to be estimated with less precision. Interestingly, in the month following the
IPO, firms that had VC backing have less informed trading, though this difference disappears by
the second month. Similarly, firms with smaller revenues have more informed trading in the first
month or two of trading.
Next, we return to the subset of EGCs and examine the interaction between JOBS Act accom-
modations, disclosed risk factors, and PIN. The final two columns of Table 9 provide regressions
with and without the principal components of the risk factors. When the two principal components
and the number of words in the risk factor section are added, the adjusted R squared doubles, from
0.11 to 0.22. Moreover, the results are similar to what was found using the larger sample of IPO
firms. Namely, the second principal component has a negative coefficient, and the number of words
in the risk factor section is positively related to PIN-66. As was the case in Table 7, firms omitting a
discussion of executive compensation in their prospectus, and firms disclosing fewer years of selected
financial data tend to have more informed trading. Thus, both the JOBS Act accommodations and
the content of the risk factors section – both the type of risk factors, and the quantity of disclosure –
have an impact on the probability of informed trading immediately following the IPO.
21

E Liquidity
We have established that IPOs of EGCs are underpriced relative to their peers – some of which
is driven by differences in disclosed risk factors. Moreover, the probability of informed trading
is affected by risk disclosures and this relation changes after the JOBS Act. To the extent that
these differences are associated with an increased degree of asymmetry of information among IPO
investors, these results may show up in the secondary market in the form of larger spreads and
other information costs. To test this, we estimate measures of liquidity using TAQ data for the first
several days of trading following the IPO. We test whether there are differences in these measures
for EGC and non-EGC firms and examine the determinants.
We use TAQ data to estimate a large set of liquidity measures including effective spreads and
realized spreads. We use two weighting methods: dollar weighted (denoted with a subscript DW),
and share weighted (denoted with a subscript SW). To calculate spreads, we use three different
methods of classifying the midpoint: Lee and Ready (1991), which we denote with a subscript LR,
Ellis, Michaely and O’Hara (2000), which we denote with the subscript EMO, and Chakrabarty,
Li, Nguyen and Van Ness (2006), which we denote with the subscript CLNV.11 Table 10 presents
differences in summary statistics between EGC and non-EGC IPO firms for the first day of trading
(Panel A) and the second day (Panel B).
From Panel A, we see that on the first day of trading, spreads are generally larger for EGCs than
for their peers. By the second day, these differences are all statistically significant. Thus, on average,
there tends to be less liquidity for EGC firms, suggesting that the JOBS Act accommodations may
unintentionally play a role.
To test whether these differences in liquidity are driven by the lower disclosure standards from
the JOBS Act or other differences in EGC and non-EGC firms, we form a matched sample of firms
based on size, age, and industry and regress a subset of the liquidity measures from the first day
post-IPO on on lagged revenues, lagged R&D Expense, lagged total assets, and a dummy variable
indicating that the firm is claiming EGC status. Table 11 presents the regression results. Controlling
for these variables, there is still a significant difference in spreads in newly traded IPO firms. In
11See the appendix for a detailed description of the methodology.
22

particular, the spread is higher for EGC firms, consistent with the idea that lower IPO standards
mean higher asymmetry of information.
F Impact of SEC Comment Letters on JOBS Act IPOs
In this section, we analyze the information production role of the Securities and Exchange Commission
(SEC) during the IPO process. Specifically, we examine the impact of the information from the
SEC’s comment letters during the IPO process on firms’ underpricing and probability of informed
trading, given the interaction of the disclosure levels of hard and soft information of the IPO firm.
Draft registration statements are subject to review by the SEC in order to monitor compliance with
applicable disclosure requirements. The SEC reviews and suggests revisions of the prospectus with
the objective of increasing the overall quality of disclosure in the market. SEC comment letters and
the revised prospectus are available to investors via EDGAR before the IPO date. These comment
letters can therefore be thought of as “soft” information production by a regulator from the investors’
perspective. The role of SEC comment letters is particularly important for post JOBS Act IPOs
given the relaxed disclosure requirements of certain types of “hard” information in the prospectus.
The regulator (SEC) with its vast experience and informational advantage should therefore amend
its behavior in its review comments consistent with its objective of improving disclosure.
Thus, the soft information contained in the SEC’s comment letters should affect the firm’s
underpricing and the post-IPO probability of informed trading (PIN). We use a textual analysis
techniques in order to quantify this soft information and analyze its impact on IPO underpricing
and PIN, post JOBS Act. In particular, focusing on the first comment letter from the SEC to each
JOBS Act IPO firm in our sample, we count the number of pages, the number of numbers, the
number of words, and the number of itemized suggestions/comments from the SEC to the firm.
Additionally, using the Loughran and McDonald (2011) wordlists from Bill McDonald’s website, we
count the number of words in the comment letter that are classified as positive, negative, uncertainty,
weak modal and strong modal words. Using these categories, we form three textual measures: the
number of uncertainty words divided by total words, the number of weak modal words divided by
strong modal words, and the number of negative words divided by the number of positive words.
We hypothesize that if the SEC letters contain relatively more uncertainty words then it signifies
23

the uncertainty on the part of the regulator and hence increases the potential winner’s curse with
respect to the quality of the issue. As a result, investors should demand a premium to hold such
issue and hence higher underpricing. Similarly, more weak words relative to strong words and
negative words relative to positive words should signal an inferior quality and hence demand higher
underpricing. Post IPO information production should also depend on the nature of this public
information production.
In Table B we regress our measures of underpricing and PIN on the SEC soft information
variables as well as the firm-level measures of hard and soft information and control variables. We
find strong support for our hypotheses. The negative public signal about the quality of the issue
as proxied by weak over strong modal words has a strong positive impact on underpricing. The
coefficient is also economically meaningful: a one standard deviation increase of weak to strong
modal words increases underpricing by about 5.3%. Similarly, the frequency of uncertainty words
– our proxy for winner’s curse – also has a significant, positive impact. A one standard deviation
increase in uncertainty words over total words increases the required underpricing by about 4.7%.
The post IPO information production is also significantly increased by the amount of public
information produced by SEC letters as proxied by number of pages in the SEC comment letters.
During the first month after the IPO, the market assimilates the amount of public information
produced by SEC letters and produces additional information as measured by PIN. A one standard
deviation increase in number of pages in the SEC letter leads to a 7% increase in the probability of
informed trading (PIN) during the first month post IPO. This suggests the complementary nature of
the public information as an input to private information production by various market participants
immediately following the IPO.
5 Conclusion
The Jumpstart Our Business Startups Act was enacted to reduce the cost of going public for small
firms and encourage job creation. In this paper we evaluate the performance of the firms going
public via the JOBS Act and document their use of the act’s provisions. We find that underpricing
and post-IPO illiquidity are significantly higher for claiming firms claiming EGC status under the
24

JOBS Act relative to a set of matched peers going public before the act. Additionally, we identify
the disclosure provisions and risk factors associated with the underpricing, illiquidity, and probability
of informed trading in IPO firms. The SEC’s public signals about JOBS Act firms tend to affect
underpricing and PIN. The results point to higher degree of asymmetric information for JOBS Act
firms.
While this paper highlights negative impacts of the JOBS Act, these results do not imply that
the JOBS Act failed to help EGCs. As mentioned, there are undoubtedly significant benefits of the
JOBS Act on small firms. Whether the benefits outweigh the costs is an empirical question left for
future research.
25

References
[1] Acharya V. and L. Pedersen 2004. Asset Pricing with Liquidity Risk. Journal of Financial
Economics 77 (2005) 375–410.
[2] Amihud, Y., and H. Mendelson, 1986, ‘‘Asset Pricing and the Bid-Ask Spread,’’ Journal of
Financial Economics, 17(2), 223–249.
[3] Arosio, R., G. Giudici, and S. Paleari, 2001, “Why Do (or Did?) Internet-stock IPOs Leave So
Much Money on the Table?” Politecnico di Milano (Italy) Working Paper
[4] Balakrishnan, K., M.B. Billings, B. Kelly, and A. Ljungqvist, 2013, Shaping liquidity: On the
causal effects of voluntary disclosure. Journal of Finance, forthcoming.
[5] Baron, D., 1982, “A Model of the Demand of Investment Banking Advising and Distribution
Services for New Issues,” Journal of Finance 37, 955-976.
[6] Benveniste, L. M., and P. Spindt, 1989, ‘‘How Investment Bankers Determine the Offer Price
and Allocation of New Issues,’’ Journal of Financial Economics, 24(2), 343–361.
[7] Beatty, R.P., and I. Welch, 1996, “Issuer Expenses and Legal Liability in Initial Public Offerings,”
Journal of Law and Economics 39, 545-602.
[8] Blei, D., Ng, A., Jordan, M., 2003. Latent dirichlet allocation. the Journal of Machine Learning
Research 3, 9931022.
[9] Bradley, D.J. and B. Jordan, 2002, “Partial Adjustment to Public Information and IPO
Underpricing,” Journal of Financial and Quantitative Analysis 37, 595-616
[10] Busaba, W. Y., and C. Chang, 2002, ‘‘Bookbuilding vs. Fixed Price Revisited: The Effect of
Aftermarket Trading,’’ Working Paper, University of Minnesota, Moorhead.
[11] Carter, R.B., F.H. Dark, and A.K. Singh, 1998, “Underwriter Reputation, Initial Returns, and
the Long-run Performance of IPO Stocks,” Journal of Finance 53, 285-311.
[12] Chakrabarty, B., Li, B., Nguyen, V., Van Ness, R. A. (2007). Trade classification algorithms for
electronic communications network trades. Journal of Banking & Finance, 31(12), 3806-3821.
26

[13] Chang, J., Gerrish, S., Wang, C., Boyd-Graber, J. L., Blei, D. M., 2009. Reading tea leaves:
How humans interpret topic models. In: Advances in neural information processing systems.
pp. 288296.
[14] Chaplinsky, Susan, Kathleen Weiss Hanley, and S. Katie Moon. The JOBS Act and the Costs
of Going Public. Working paper.
[15] Dambra, M., Field, L. C., Gustafson, M. (2014). The Jobs Act and IPO Volume: Evidence
that Disclosure Costs Affect the IPO Decision. Journal of Financial Economics, forthcoming.
[16] Easley, D., O’Hara, M., 2004. Information and the cost of capital. Journal of Finance 59,
1553–1583
[17] Easley, D., Kiefer, N.M., O’Hara, M., Paperman, J.B., 1996. Liquidity, information, and
infrequently traded stocks. Journal of Finance 51, 1405–1436.
[18] Easley, D., Kiefer, N.M., O’Hara, M., 1997. One day in the life of a very common stock. Review
of Financial Studies 10, 805–835.
[19] Easley, D., O’Hara, M., Paperman, J.B., 1998. Financial analysts and information based trade.
Journal of Financial Markets 1, 175–201.
[20] Easley, D., Hvidkjaer, S., O’Hara, M., 2002. Is information risk a determinant of asset returns?
Journal of Finance 57, 2185–2221.
[21] Eleswarapu, V.R., Thompson, R., Venkataraman, K., 2004. The impact of Regulation Fair
Disclosure: trading costs and information asymmetry. Journal of Financial and Quantitative
Analysis 39, 209–225.
[22] Ellis, K., Michaely, R., O’Hara, M. (2000). The accuracy of trade classification rules: evidence
from Nasdaq. Journal of Financial and Quantitative Analysis, 35(04), 529-551.
[23] Ellul,A and M Pagano 2006. IPO Underpricing and After-Market Liquidity, Review of Financial
Studies
[24] Fama, E.F., French, K.R., 1993. Common risk factors in the returns on stocks and bonds.
Journal of Financial Economics 33, 3–56.
27

[25] Fama, E.F., MacBeth, J.D., 1973. Risk, return and equilibrium: empirical tests. Journal of
Political Economy 81, 607–636.
[26] Gintschel, A., Markov, S., 2004. The effectiveness of Regulation FD. Journal of Accounting
and Economics 37, 293–314.
[27] Gomes, A., Gorton, G., Madureira, L., 2008. SEC Regulation Fair Disclosure, information, and
the cost of capital. Journal of Corporate Finance
[28] Habib, M. and A. Ljungqvist, 2001, “Underpricing and Entrepreneurial Wealth Losses: Theory
and Evidence,” Review of Financial Studies 14, 433-458.
[29] Hanley, K. W., Hoberg, G. (2010). The information content of IPO prospectuses. Review of
Financial Studies, 23(7), 2821-2864.
[30] Hanley, K. W., Hoberg, G. (2012). Litigation risk, strategic disclosure and the underpricing of
initial public offerings. Journal of Financial Economics, 103(2), 235-254.
[31] Heflin, F., Subramanyam, K.R., Zhang, Y., 2003. Regulation FD and the financial information
environment: early evidence. Accounting Review 78, 1–37.
[32] Hoberg, G., Phillips, G. (2010). Product market synergies and competition in mergers and
acquisitions: A text-based analysis. Review of Financial Studies, 23(10), 3773-3811.
[33] Holden, C. W., Jacobsen, S. (2014). Liquidity measurement problems in fast, competitive
markets: expensive and cheap solutions. The Journal of Finance
[34] Israelsen, R., 2014. Tell it like it is: Disclosed risks and factor portfolios. Working Paper,
Indiana University.
[35] Jegadeesh, N., Wu, D. (2013). Word power: A new approach for content analysis. Journal of
Financial Economics, 110(3), 712-729.
[36] Jorion, P., Liu, Z., Shi, C., 2005. Informational effects of Regulation FD: evidence from rating
agencies. Journal of Financial Economics 76, 309–330.
[37] Lawrence, A. (2013). Individual investors and financial disclosure. Journal of Accounting and
Economics, 56(1), 130-147.
28

[38] Lee, C.M.C., Ready, M.J., 1991. Inferring trade direction from intraday data. Journal of Finance
46, 733–746.
[39] Li, F. (2008). Annual report readability, current earnings, and earnings persistence. Journal of
Accounting and economics, 45(2), 221-247.
[40] Litzenberger, R.H., Ramaswamy, K., 1979. The effect of personal taxes on dividends and capital
asset prices. Journal of Financial Economics 7, 163–195.
[41] Ljungqvist Alexander 2007. IPO Underpricing: A Survey. Handbook in Corporate Finance:
Empirical Corporate Finance. B. Espen Eckbo, ed.
[42] Loughran, T., McDonald, B. (2011). When is a liability not a liability? Textual analysis,
dictionaries, and 10-Ks. The Journal of Finance, 66(1), 35-65.
[43] Loughran, T., McDonald, B. (2013). IPO first-day returns, offer price revisions, volatility, and
form S-1 language. Journal of Financial Economics, 109(2), 307-326.
[44] Loughran, T., McDonald, B. (2014). Measuring readability in financial disclosures. The Journal
of Finance.
[45] Loughran, T., Ritter, J. R. (2004). Why has IPO underpricing changed over time?. Financial
management, 33(3).
[46] Merton, R., 1987. Presidential address: a simple model of capital market equilibrium with
incomplete information. Journal of Finance 42, 483–510.
[47] Ritter, J.R., 1984, “The ‘Hot Issue’ Market of 1980,” Journal of Business 57, 215-240.
[48] Ritter, J.R. and I. Welch, 2002, “A Review of IPO Activity, Pricing, and Allocations,” Journal
of Finance 57, 1795-1828.
[49] Sidhu, B., Smith, T., Whaley, R.E., 2006. Regulation fair disclosure and the cost of adverse
selection. Unpublished working paper. Vanderbilt University, Nashville, TN.
[50] Straser, V., 2002. Regulation Fair Disclosure and information asymmetry. Unpublished working
paper. University of Notre Dame, Notre Dame, IN.
29

[51] US Securities and Exchange Commission, 2012 Jumpstart Our Business ACT :
http://www.sec.gov/spotlight/jobs-act.shtml
[52] Vega, C., 2006. Stock price reaction to public and private information. Journal of Financial
Economics 82, 103–133.
[53] Vayanos D. and Wang 2012 Liquidity and Asset Returns under Asymmetric Information and
Imperfect Competition.Review of Financial Studies.
[54] You, Haifeng, and Xiao-jun Zhang, 2009, Financial reporting complexity and investor underre-
action to 10-K information, Review of Accounting Studies 14, 559586.
30

A Appendix
In this section, we include a slightly modified discussion of the 30 disclosed risk factorsextracted by Israelsen (2014) using Latent Dirichlet Allocation (Blei et al., 2003) on the riskfactor section of firms’ 10-K filings from 2006-2012. These are the same factors that are extracted(out-of-sample) from each firm’s prospectus and used in this paper.
A Disclosed Risk Factors (adapted from Israelsen, 2014)
Table A lists the 20 most common words for each of the 30 extracted risk factor topics. Foreach of the 30 extracted risk factors, a name is chosen based on the words and industries mostclosely associated with these factors and based on reading through a sample of disclosuresassigned to each topic. However, it is the words that define the topics, not the title. In thissubsection, we briefly examine each of the 30 disclosed risk factors. The discussion is based onthe word distributions from Table A, on the distribution of disclosures (in the 10-Ks) acrossindustries. The extracted risk factors are listed in alphabetical order.
Accounting contains words like reporting, accounting, result, statement, material andrequire and deals generally with the risk that statements may be incorrect. It is most likely tobe disclosed in the 10-K in industries such as “measuring and control equipment” (LabEq),“Recreation” (Toys), and “Business Services” (BusSv) as well as firms that are not easilyclassified into an industry (Other). Industries that are unlikely to disclose this risk in their10-K are “Agriculture” (Agric), “Coal” (Coal), and “Utilities” (Util).
Competition contains words associated with competition or product market competitionlike company, competition, compete, market, product and services. It is most commonly disclosedin industries where product market competition is most likely, such as “Textiles” (Txtls),“Candy & Soda” (Soda), “Beer & Liquor” (Beer), and “Food Products” (Food). Industriesthat are least likely to disclose competition risk in their 10-Ks are industries in which thereare larger barriers to entry such as “Petroleum and Natural Gas” (Oil), “Utilities” (Util),“Non-Metallic and Industrial Metal Mining” (Mines), “Precious Metals” (Gold), Coal, and“Pharmaceutical Products” (Drugs).
Contractual contains words associated with contract risk such as agreement, contract,terminate, terminate, obligation, and renew. This risk is commonly disclosed in firms 10-Ksin industries that rely on government contracts such as “Defense” (Guns), “Restaurants,Hotels, Motels” (Meals), Coal, and the “Aircraft” (Aero). At the other extreme are industrieslike “Banking” (Bank), “Medical Equipment” (MedEq), “Measuring and Control Equipment”(LabEq) and Gold.
Costs contains words associated with the risk that input prices may change such as costs,increase, labor, equipment, adversely, and affect. This risk is commonly disclosed in 10-Ks inindustries such as “Transportation” (Trans), “Shipbuilding, Railroad Equipment” (Ships),Aero, “Construction” (Cnstr), and Guns . At the other extreme are industries like “Banking”(Bank), “Medical Equipment” (MedEq), “Measuring and Control Equipment” (LabEq) andGold.
Credit contains words associated with credit or the ability to raise capital such as credit,debt, ability, capital, additional, and require. This risk is the most prevalent in industries like
31

Fun, FabPr, Txtls, and Coal. The industries least likely to disclose Credit risk are Comps,MedEq, Insur, Banks, and Drugs.
Demand contains words associated with changes in demand or the economic environmentsuch as economic, conditions, affect, result, customer, and demand. This is most commonlydisclosed in the 10-K in industries with seasonal or fluctuating demand such as Smoke. Meals,Clths, Rtail, Beer. Industries with inelastic demand such as Oil, MedEq, Hlth, and Drugsare less likely to disclose this risk. Gold is the industry least likely to disclose Demand risk.
Disclosure contains words such as risk, statement, forward, looking, uncertainty. Thisrisk is most commonly included in the 10-K as a disclaimer about relying on forward-lookingstatements. Industries most likely to emphasize this risk are Smoke, Soda, FabPr, Rubbr, andBooks. At the other extreme lie Telcm, Trans, MedEq, Drugs, and Coal.
Dividends contains words such as dividend, pay, distribution, capital, subsidiary. Theindustries Insur, Smoke, Banks, RlEst, and Fin are the industries most likely to discloseDividend risk in the 10-K while MedEq, Soda, Clths, LabEq, Guns are the industries leastlikely to disclose this risk.
EnviroReg contains words associated with environmental regulation or impact such asenvironmental, regulation, state, federal, permit, emission. The firms most likely to emphasizethis risk in the 10-K are those operating in industries subject to environmental regulationsuch as Coal, Gold, Util, and Mines. At the other extreme lie Clths, Smoke, Comps, Banks,Insur.
Financing contains words dealing with the need to acquire additional capital such asacquisition, acquire, additional, capital, operations, and need. Firms in RlEst, Boxes, Aero,and Mines are especially likely to disclose this risk in the 10-K, while firms in Rtail, Meals,Clths, Insur, Smoke are less likely.
FinMarket contains words associated with aggregate financial market risk such as such asinvestment, financial, market, rates, credit, affect. Firm in industries such as Banks, Fin, Insur,Util, and RlEst are the most likely to disclose FinMarket risk in the 10-K. Industries whichplace less emphasis on this risk are FabPr, Toys, MedEq, Drugs, and Guns. FinMarket riskis the second most likely risk to be discussed, representing 5.3% of the Risk Factor section, onaverage.
Growth contains words associated with growth or expansion such as growth, new, business,ability, and expand. Firms in industries like Rtail, Meals, Clths, Hshld, and Whlsl are mostassociated with this risk disclosure in the 10-K, while those in Aero, Boxes, Coal, Gold, Oilare the least likely to disclose.
HealthCare contains words associated with healthcare and healthcare programs suchas healthcare, program, reimbursement, medical, state. Not surprisingly, the industries mostassociated with these disclosures in the 10-K are Hlth, MedEq, Drugs, Insur, and PerSv. Atthe other extreme are the industries Fun, Txtls, Oil, Clths, and Gold.
HumanCapital contains words associated with the risk of hiring and retaining key em-ployees such as retain, key, personnel, ability, attract, depend. It is most commonly disclosedin the 10-Ks of human-capital intensive industries like BusSv, Fin, Hlth, PerSv, and LabEqand least commonly disclosed in Chems, Beer, Boxes, Smoke, Util.
Insurance contains words dealing with risk associated with insurance such as insurance,claim, liability, coverage, losses. Firms in the industry Insur are those most likely to disclosethis risk. Other industries associated with this risk are Ships, FabPr, Guns, and Cnstr. The
32

industries whose firms are least likely to disclose this risk in the 10-K are Comps, Books, Clths,Banks, and Telcm.
IntellProp contains words about the risks associated with intellectual property and patentsas patent, intellectual, property, infringement, application, and license. Reassuringly, the firmsmost likely to discuss IntellProp risk in their 10-Ks are those in the industries Drugs, MedEq,LabEq, Comps, and Chips. Industries whose firms make very little mention of this risk areTrans, Insur, Util, and Banks.
International contains words dealing with risks associated with foreign exchange risk andinternational markets such as foreign, currency, exchange, political, tax, and china. The firmsmost likely to make these disclosures in their 10-Ks are found in industries like Boxes, Mach,Txtls, Rubbr, and Clths, where international markets are more likely to play significant roles.At the other extreme lie firms in more localized or service industries such as Meals, Util,Banks, and Hlth.
Internet contains words such as internet, advertising, sales, content, increase, and revenue.Internet risk is the disclosure least likely to be made. The median firm only dedicates 0.2%of the words in its risk factors disclosures to this topic. The industries with 10-K disclosuresmost closely associated with this risk are Books, PerSv, Telcm, Fun, and BusSv. Industriessuch as Oil, Ships, Boxes, FabPr, and Steel are those least likely to make disclosures aboutinternet risk.
Legal contains words about litigation and legal risk such as court, action, federal, lawsuit,claim, and law. The industries whose firms are most likely to discuss this risk in their 10-Ksare Smoke, Hlth, Guns, Gold, and Insur. This is the 4th least likely risk to be discussed.Many of these firms and industries are heavily regulated and have been subjects of lawsuitsand legal action. Firms least likely to disclose Legal risk tend to lie in the industries LabEq,Toys, Txtls, Soda, and Clths.
Oil contains words associated with energy prices and production such as oil, natural, gas,price, production, and reserves. Not surprisingly, firms making these 10-K risk disclosures aremore likely to be in industries that either produce energy or extract precious metals such asOil, Gold, Mines, Util, and Coal. Firms in the industries Banks, MedEq, Hlth, Comps, andDrugs are the least likely to disclose Oil risk.
ProdApproval contains words associated with the product approval process such as product,approval, clinical, trial, fda, and regulatory. Not surprisingly this risk is most commonly disclosedin the 10-K of firms in regulated industries such as Drugs, MedEq, Smoke, Agric, Hlth. Firmsin service industries such as Fin and Banks and less innovative industries such as Steel, Books,and Ships are much less likely to make this disclosure.
ProductDev1 contains words about the development of new products, technologies, andservices such as product, new, technology, market, development, ability and introduce. Firms inhigh tech industries such as Comps, Chips, and LabEq are the most likely to disclose this riskin their 10-Ks. Firms in the BusSv are also likely to disclose this risk. At the other extreme liefirms in industries associated with older technologies such as Trans, Mines, Util, Coal, andGold.
Like the previous risk, ProductDev2 contains words associated with the development ofnew products such as product, development, candidate, market, commercialization. However,these disclosures tend to be made in the 10-Ks of research and development-intensive industriessuch as Drugs, MedEq, LabEq, Agric, and ElcEq. As was the case with the previous risk
33

factor, firms in “old economy” industries such as Insur, Trans, Coal, Txtls, Banks are thoseleast likely to disclose this risk. This is much less commonly disclosed in the 10-K than the riskProdDev1.
RealEstate contains words associated with real estate and mortgages such as loan, real,estate, losses, property, and mortgage. This risk the most likely to be disclosed in 10-Ks inindustries that rely heavily on real estate such as RlEst, Util, Coal, Gold or in industries thatare affected by securitized claims on real estate such as Banks. Manufacturing industries suchas Clths, Rubbr, Comps, MedEq, and Drugs are the least likely to discuss RealEstate risk.
Regulation contains words such as regulation, state, federal, subject, change, and compliance.Firms in highly regulated the highly regulated industries such as Beer, Insur, Hlth, Banks,and Guns tend to focus more attention on this risk in their 10-K filings. Firms in the less-regulated manufacturing industries Chips, Paper, Rubbr, Steel, and Boxes, are less likely toemphasize this risk.
Revenue contains words associated with items on the income statement such as revenue,tax, net, future, income, and estimate. The firms emphasizing Revenue risk in their 10-Ks tendto cluster in the industries Cnstr, Aero, Insur, and BusSv, while those in MedEq, Rubbr,Drugs, Soda, and Meals are the least likely to emphasize this risk.
Stakeholder contains words associated with corporate control and ownership such as stock,share, board, right, control. Firms in the industries Fun, Fin, Gold, Telcm, and Rubbr arethose most commonly discussing this risk in their 10-Ks. At the other extreme are the industriesHshld, Aero, FabPr, Util, and Boxes.
StockPrice contains words associated with stock market or stock price risk such as stock,price, market, decline, fluctuation, and affect. Firms in “high beta” industries, such as Mines,Comps, Drugs, and Gold, or those directly impacted by stock markets as is the case with theindustry Fin, are the most likely to emphasize this risk in their 10-Ks. Firms in the industriesInsur, Soda, Guns, Util, and Aero, are less likely to disclose StockPrice risk.
SupplyChain contains words associated with the risk associated with supply chains suchas product, customer, supplier, manufacturing, material, component, and delay. Firms disclosingthis risk in their 10-Ks tend to fall in the manufacturing industries Chips, Steel, Agric, Clths,and Soda. These industries generally rely on suppliers when manufacturing goods. Disclosingfirms may be suppliers, themselves. Firms that are less likely to emphasize SupplyChain riskcluster in the industries Gold, Fun, RlEst, Insur, and Banks.
The final disclosed risk factor, Systems, contains words associated with the risk of systemsinterruption or data failure such as system, information, failure, data, disruption, and security.Firms in data intensive industries such as BusSv, Fin, Rtail, Comps, and Telcm are thosemost commonly discussing Systems risk in their 10-Ks. Firms in manufacturing and commodityindustries like Autos, Coal, Mines, Gold, and Smoke, are much less likely to emphasize thisrisk.
B Liquidity Measures
Realized and effective spreads are estimated as follows. The bid and ask price is calculatedusing National Best Bid and Offer (NBBO) quotes, following Holden and Jacobsen (2014). Allspreads have two versions (share-weighted (SW) and dollar-weighted (DW)). For example, thedollar-weighted percent effective spread for security i on a given day (variable “effectiveDW ” ismeasured as follows:
34

Percent Effective SpreadDW =∑k∈i
wk × Percent Effective Spreadk (4)
where
wk =Dollar volume for trade k∑k∈i Dollar volume for trade k
(5)
and Dollar volume for trade k = (Number of shares in trade k)× (Price of trade k).When using share-weighted (SW) measures, the weight factor is:
wk =Number of shares for trade k∑t∈i Number of shares for trade k
(6)
We assign trade directions in three different ways for the realized spreads.
• Lee and Ready (1991) (denoted LR): the trade is a buy if the price (Pk) is greater thanthe midpoint (Mk), a sell if Pk < Mk, and a tick test is used when Pk = Mk.
• Ellis, Michaely and O’Hara (2000) (EMO): buy if Pk = Ak (the ask), sell when Pk = Bk
(the bid), and tick test is used otherwise.
• Chakrabarty, Li, Nguyen and Van Ness (2006) (CLNV): buy when Pk ∈ {0.3Bk +0.7Ak, Ak}, sell when Pk ∈ {0.3Ak + 0.7Bk, Bk}, and use a tick test otherwise.
For the effective spreads, only LR is used. We calculate four basic measures of liquidity forevery stock in the 22 trading days following the IPO. The spread is measures at each trade as:
Dollar Effective Spreadk = 2DkPk −Mk (7)
Percent Effective Spreadk = (2DkPk −Mk)/Mk (8)
Dollar Realized Spreadk = 2DkPk −Mk+5 (9)
Percent Realized Spreadk = (2DkPk −Mk+5)/Mk (10)
where Dk is the indicator variable that equals +1 if the kth trade is a buy and −1 if the kth
trade is a sell. Pk is the price of the kth trade. Mk+5 is the midpoint five minutes after the kth
trade. These individual spreads are aggregated over the 22 days using equations (4)-(6).
35

Table A:
Word-Topic Distributions
The table shows the 20 most likely words across the 30 extracted risk factor topics, along with the word-topic probabilities, p. Topics are extractedusing Latent Dirichlet Allocation on the risk factor section of firms’ 10-K filings from 2006-2012.
Accounting Competition Contractual Costs Credit Demand Disclosure Dividends
rank word p word p word p word p word p word p word p word p
1 financial 4.2 company 7.7 agreement 5.9 costs 3.8 credit 3.4 result 3.7 risk 6.5 dividend 4.6
2 control 3.5 customer 2.9 contract 4.9 increase 2.9 debt 3.3 economic 2.4 statement 4.6 subsidiary 4.0
3 internal 2.5 competitor 2.6 terms 1.6 cost 2.1 facility 2.3 affect 2.4 result 3.4 pay 3.6
4 reporting 2.3 market 2.3 terminate 1.5 project 2.0 cash 2.0 conditions 2.1 forward 2.8 company 3.3
5 accounting 2.2 competition 2.2 lease 1.3 result 1.9 note 1.9 business 2.1 factor 2.6 payment 2.0
6 result 1.8 services 2.1 plan 1.3 labor 1.7 indebtedness 1.9 customer 2.0 looking 2.5 distribution 1.8
7 report 1.7 compete 2.0 provide 1.2 equipment 1.4 ability 1.8 sales 1.8 financial 2.4 holding 1.6
8 require 1.7 competitive 1.7 obligation 1.1 operations 1.3 capital 1.8 demand 1.4 business 2.4 cash 1.6
9 company 1.5 business 1.6 certain 1.1 employee 1.2 financial 1.4 impact 1.4 operations 1.9 capital 1.3
10 impairment 1.5 financial 1.4 enter 1.1 affect 1.1 covenant 1.3 adversely 1.4 uncertainty 1.9 venture 1.2
11 assets 1.2 product 1.3 term 1.0 work 1.1 senior 1.2 market 1.4 include 1.6 trust 1.1
12 goodwill 1.2 industry 1.2 termination 1.0 operate 1.0 additional 1.1 operations 1.4 information 1.6 future 1.1
13 management 1.2 result 1.1 arrangement 0.9 construction 1.0 obligation 1.1 product 1.4 condition 1.6 ability 1.1
14 material 1.2 greater 1.1 require 0.8 facility 0.9 flow 1.1 operate 1.3 future 1.4 joint 1.0
15 public 0.9 service 0.9 renew 0.8 adversely 0.9 require 1.0 financial 1.2 materially 1.4 receive 0.9
16 statement 0.9 resource 0.9 purchase 0.8 delay 0.9 financing 1.0 change 1.2 report 1.2 obligation 0.8
17 standard 0.9 price 0.9 franchise 0.8 company 0.9 agreement 1.0 industry 1.2 prospectus 1.2 investment 0.8
18 intangible 0.8 increase 0.8 party 0.7 contract 0.8 business 1.0 factor 1.1 actual 1.1 make 0.8
19 independent 0.8 operate 0.7 restaurant 0.7 vessel 0.8 default 1.0 revenue 1.1 following 1.1 funds 0.8
20 procedure 0.8 offer 0.7 pension 0.6 material 0.8 operations 0.9 consumer 1.1 affect 1.1 bank 0.7
EnviroReg Financing FinMarket Growth HealthCare HumanCapital Insurance IntellProp
rank word p word p word p word p word p word p word p word p
1 environmental 3.2 acquisition 5.1 investment 2.7 growth 3.4 health 2.6 personnel 4.9 insurance 5.1 patent 5.2
2 regulation 2.6 business 4.9 financial 2.6 business 2.5 care 2.2 key 3.8 claim 4.2 right 3.8
3 laws 2.0 acquire 2.7 market 2.5 new 2.3 healthcare 2.1 retain 3.6 liability 3.1 property 3.4
4 operations 1.6 additional 2.4 rates 2.0 manage 2.2 program 2.1 employee 3.5 result 2.4 intellectual 3.1
5 costs 1.4 capital 2.4 credit 1.7 operations 1.8 reimbursement 2.1 management 2.8 business 1.7 license 2.8
6 material 1.4 operations 1.9 security 1.5 sales 1.7 product 2.0 business 2.7 product 1.7 technology 2.0
7 subject 1.2 company 1.8 loan 1.5 expand 1.7 government 1.6 attract 2.3 coverage 1.6 party 2.0
8 facility 1.2 financing 1.6 rate 1.4 ability 1.7 medical 1.4 officer 2.3 risk 1.6 proprietary 1.8
9 require 1.1 future 1.5 affect 1.4 increase 1.5 medicare 1.3 executive 2.1 financial 1.3 product 1.8
10 state 1.1 result 1.3 bank 1.3 management 1.4 patient 1.2 qualify 2.0 operations 1.1 protect 1.6
11 hazardous 1.1 terms 1.1 increase 1.3 continue 1.4 physician 1.2 ability 1.8 adverse 1.1 claim 1.6
12 use 0.9 need 1.0 institution 1.2 strategy 1.3 services 1.1 company 1.5 material 1.1 litigation 1.2
13 result 0.9 equity 0.9 deposit 1.2 financial 1.3 state 1.1 depend 1.3 litigation 1.0 use 1.1
14 permit 0.9 raise 0.9 result 1.1 operate 1.2 party 1.0 loss 1.3 subject 0.9 protection 1.0
15 emission 0.9 require 0.9 company 1.1 market 1.1 hospital 0.9 services 1.3 condition 0.9 infringement 1.0
16 safety 0.8 available 0.9 risk 1.1 system 1.1 payors 0.9 success 1.2 losses 0.9 infringe 1.0
17 federal 0.8 include 0.9 value 1.0 result 1.1 payment 0.8 senior 1.1 liabilities 0.9 application 1.0
18 include 0.8 able 0.9 change 1.0 effectively 1.1 drug 0.8 chief 1.1 company 0.9 result 1.0
19 waste 0.8 obtain 0.8 assets 1.0 maintain 1.0 medicaid 0.8 continue 1.0 reinsurance 0.8 trademark 0.9
20 water 0.8 risk 0.8 rating 1.0 expansion 1.0 provider 0.8 hire 0.9 costs 0.8 obtain 0.9
Table A continues on the next page.
36

Table A continued from the previous page.
International Internet Legal Oil ProdApproval ProductDev1 ProductDev2
rank word p word p word p word p word p word p word p
1 foreign 4.4 internet 3.2 action 1.5 gas 5.1 product 4.4 product 9.5 product 7.1
2 currency 3.0 services 2.3 state 1.5 oil 4.0 approval 3.6 new 4.5 development 4.4
3 international 2.6 advertising 1.6 court 1.3 natural 3.7 clinical 3.5 technology 4.1 candidate 2.3
4 operations 2.4 brand 1.5 company 1.1 price 3.3 trial 2.9 market 2.9 research 2.1
5 tax 2.2 program 1.3 prc 0.9 production 2.3 fda 2.7 develop 1.8 develop 1.7
6 country 2.0 online 1.3 law 0.9 reserves 1.8 regulatory 2.6 change 1.7 marketing 1.4
7 exchange 2.0 content 1.3 federal 0.9 drilling 1.4 drug 1.5 customer 1.5 partner 1.3
8 unite 2.0 business 1.2 file 0.8 property 1.2 obtain 1.4 services 1.4 sales 1.2
9 risk 1.8 user 1.1 claim 0.8 fuel 1.2 candidate 1.4 development 1.4 party 1.0
10 dollar 1.5 use 1.0 laws 0.8 result 1.1 require 1.1 software 1.2 commercialize 1.0
11 state 1.4 service 1.0 investigation 0.7 operations 1.0 result 1.1 technological 1.1 commercialization 1.0
12 china 1.3 consumer 1.0 certain 0.7 future 0.9 delay 1.0 industry 1.1 collaboration 0.9
13 result 1.3 increase 0.9 information 0.7 produce 0.9 study 0.9 acceptance 1.0 market 0.9
14 fluctuation 1.2 revenue 0.9 security 0.7 costs 0.9 market 0.9 ability 0.9 commercial 0.9
15 political 1.1 web 0.9 legal 0.7 affect 0.9 approve 0.8 exist 0.9 license 0.9
16 sales 1.0 medium 0.8 lawsuit 0.6 exploration 0.9 use 0.8 competitor 0.9 drug 0.9
17 business 1.0 site 0.8 include 0.6 energy 0.9 include 0.8 competitive 0.8 effort 0.8
18 rates 0.9 network 0.8 unite 0.6 commodity 0.8 patient 0.7 introduce 0.8 revenue 0.8
19 subject 0.9 provide 0.7 act 0.6 estimate 0.8 process 0.7 standard 0.8 collaborator 0.8
20 change 0.9 website 0.7 relate 0.6 activity 0.8 safety 0.6 solution 0.8 technology 0.8
RealEstate Regulation Revenue Stakeholder StockPrice SupplyChain Systems
rank word p word p word p word p word p word p word p
1 loan 7.0 regulation 5.9 revenue 3.8 stock 5.2 stock 9.0 product 6.2 system 4.6
2 real 2.6 laws 3.5 tax 2.5 share 4.5 price 7.1 customer 2.5 business 2.8
3 estate 2.4 state 3.0 net 2.4 common 3.5 common 6.5 supplier 2.4 information 2.1
4 losses 1.7 business 2.4 result 2.2 stockholder 2.7 market 6.3 manufacturing 2.2 customer 2.1
5 increase 1.4 subject 2.2 future 1.8 director 2.4 security 2.2 supply 1.9 result 2.0
6 power 1.3 regulatory 2.0 income 1.7 board 1.4 trading 2.1 material 1.9 failure 1.8
7 energy 1.3 change 1.9 year 1.6 control 1.3 share 1.8 manufacturer 1.6 operations 1.7
8 property 1.2 federal 1.8 expense 1.6 right 1.2 company 1.7 component 1.5 security 1.4
9 commercial 1.2 requirement 1.5 operate 1.6 company 1.2 result 1.5 result 1.4 services 1.3
10 risk 1.1 government 1.4 losses 1.5 offering 1.2 public 1.2 increase 1.3 client 1.3
11 portfolio 1.1 operations 1.2 period 1.5 provisions 1.1 decline 1.2 manufacture 1.2 data 1.3
12 market 1.1 comply 1.2 estimate 1.3 outstanding 1.1 offering 1.1 production 1.2 party 1.1
13 allowance 1.0 affect 1.2 end 1.3 shareholder 1.0 fluctuation 1.1 price 1.1 service 1.0
14 coal 1.0 compliance 1.1 december 1.2 prefer 1.0 operate 1.0 delay 1.0 interruption 1.0
15 mortgage 0.9 include 1.0 approximately 1.2 price 0.9 future 1.0 purchase 0.9 damage 0.9
16 home 0.9 result 1.0 base 1.1 issue 0.9 factor 1.0 order 0.9 disruption 0.9
17 result 0.8 require 0.9 significant 1.1 option 0.8 investor 0.9 raw 0.9 loss 0.9
18 borrower 0.8 act 0.9 fiscal 1.0 holder 0.8 affect 0.9 source 0.9 financial 0.9
19 construction 0.8 new 0.8 change 1.0 change 0.8 analyst 0.8 costs 0.9 cause 0.8
20 residential 0.8 applicable 0.8 incur 1.0 exercise 0.8 sales 0.8 inventory 0.8 reputation 0.8
37

Table 1:
Usage of JOBS Act Provisions by EGCs
The table provides the frequency with which 220 IPO firms claiming EGC status make use of five JOBS ACTprovisions as well as correlation coefficients and cross tabulations between usage of the provisions. The JOBS Actprovisions are: (1) “Confidential Filing” (abbreviated “Confid. Filing”): An EGC may confidentially submit itsdraft registration statement to the SEC, (2) “No Discussion of Exec. Comp” (abbreviated “ExecComp Discuss”):An EGC may omit a discussion of executive compensation, (3) “Private Accounting Standard” (abbreviated“Private Acctg”): EGCs may take advantage of an extended transition period using private accounting standards,(4) “<3 Yrs of Audited Statements” (abbreviated “<3 yrs Audited”): An EGC can disclose as few as 2 years ofaudited financial statements in its registration statement, 5) “<5 Yrs of Selected Fin. Data” (abbreviated “<5 yrsFin Data”): An EGC can disclose as few as 2 years of selected financial data in its registration statement, and (6)“<5 Executives’ Comp.”(abbreviated “<5 Exec”): An EGC can disclose the compensation of as few as 3 executives.Panel A provides frequencies and correlation coefficients. Panel B provides cross tabulations for selected pairs ofaccommodations. Correlation coefficients greater (in absolute value) than 0.11, 0.13, and 0.17 are significant at the10%, 5%, and 1% level of significance, respectively.
Panel A: Summary Statistics and Correlations
Use of Provision Correlation of Provisions Used
Confid. ExecComp Private <3 yrs <5 yrsJOBS Act Provision Number Pct Filing Discuss Acctg Audited Fin Data
Confidential Filing 129 59%No Discussion of Exec. Comp. 103 47% -0.08Private Accounting Standard 44 20% 0.05 0.05<3 Yrs of Audited Statements 107 49% 0.27 -0.02 0.01<5 Yrs of Selected Fin. Data 151 69% 0.29 0.03 0.09 0.45<5 Executives’ Comp. 176 80% 0.18 0.00 0.00 0.14 0.20
Panel B: Selected Cross Tabulations
<3 Yrs of Audited Statements<5 Yrs of Selected Fin. Data No Yes TotalNo 68 11 79Yes 45 96 141Total 113 107 220
<3 Yrs of Audited StatementsPrivate Accounting Standard No Yes TotalNo 90 85 175Yes 22 22 44Total 112 107 219
<5 Yrs of Selected Fin. DataPrivate Accounting Standard No Yes TotalNo 59 116 175Yes 10 34 44Total 69 150 219
38

Table 2:
Summary Statistics
The table provides summary statistics for IPO-level variables (Panel A), firm-level variables (Panel B), andprospectus-level risk factor variables (Panel C) for 482 firms with IPOs between 2010 and 2013. IPO-level variablesinclude the IPO Offer price, the size of the offering, the gross spread as percentage of the offering, as well asthe 1-day and 3-day IPO return, 22-, 44-, and 66-day probability of informed trading (PIN), and the numberof words in the risk factors section of the prospectus. Firm-level variables from the last fiscal year prior to theIPO include total assets, Total Liabilities, revenues, R&D Expense and Investment in PP&E. means are listed aswell as standard deviations (in parentheses), and standard errors of the mean (in square brackets). *, **, and ***denote that the mean is statistically different from the mean of the EGC group at the 10%, 5%, and 1% level ofsignificance, respectively. See the Appendix for a description of the individual risk factors in Panel C.
Panel A: IPO-level variables
Pre JOBS Act JOBS ACT
Variable SMALL EGC SMALL LARGE
IPO Offer Price 13.76*** 6.10 16.19*** 19.32***(5.36) (4.00) (9.41) (5.68)[0.39] [0.26] [2.28] [0.85]
Size (Millions) 154 154 464* 618***(152) (186) (707) (578)
[11] [12] [171] [86]
Fees (% Gross Spread) 6.8 6.7 6.4 5.6***(0.8) (0.6) (1.0) (1.0)[0.1] [0.0] [0.2] [0.1]
1-day IPO ret 13.7* 18.4 5.2*** 10.2**(23.7) (27.6) (8.0) (20.6)
[1.7] [1.8] [1.9] [3.1]
3-day IPO ret 14.2** 20.7 5.7*** 12.1**(23.8) (30.8) (8.5) (21.9)
[1.7] [2.0] [2.1] [3.3]
PIN-22 0.202 0.206(0.079) (0.087) — —[0.006] [0.006]
PIN-44 0.196 0.203(0.072) (0.093) — —[0.005] [0.007]
PIN-66 0.195* 0.207(0.065) (0.077) — —[0.005] [0.006]
Number of Words in 7472*** 9062Risk Factors Section (2618) (2632) — —
[183] [177]
N 186 234 17 45
Table 2 continues on the next page.
39

Table 2 continued from the previous page.
Panel B: Firm-Level Variables
Pre JOBS Act JOBS ACT
Variable SMALL EGC SMALL LARGE
Total Assets ($M) 303* 454 9,091 16,481(626) (1,181) (17,117) (76,495)
[46] [77] [4,152] [11,403]
Total Liabilities ($M) 182* 319 5,187 4,350***(386) (998) (12,347) (6,037)
[28] [65] [2,995] [900]
Revenues ($M) 151 140 244*** 4,369***(183) (201) (345) (5,860)
[13] [13] [84] [874]
R&D Expense ($M) 21 18 2 12(23) (79) (5) (50)
[2] [5] [1] [7]
Investment in PPE ($M) 17 14 24** 275**(52) (102) (65) (697)
[4] [7] [16] [104]
Table 2 continues on the next page.
40

Table 2 continued from the previous page.
Panel C: Disclosed Risk Factors
Pre JOBS Act JOBS ACT
Risk Factor SMALL EGC SMALL LARGE
Accounting 4.4*** 5.3 3.1 4.9***
Competition 2.7*** 2.1 1.6** 2.1***
Contractual 2.6 2.6 4.2 2.6***
Costs 1.4 1.4 1.7* 2.7***
Credit 3.1 2.9 7.3*** 7.7***
Demand 3.9** 3.2 4.2*** 5.7***
Disclosure 2.8 3.1 2.9*** 4.0***
Dividends 3.7 3.8 7.0 5.0***
EnviroReg 1.6 1.7 2.3*** 3.2***
Financing 3.1 3.0 4.7** 3.0
FinMarket 1.2*** 2.3 5.9 2.0
Growth 4.2 3.8 1.8*** 2.1***
HealthCare 1.3** 1.8 0.3** 0.8***
HumanCapital 2.5** 2.2 2.0*** 1.6***
Insurance 2.1** 2.4 3.1** 3.3***
IntellProp 5.2 5.2 1.3*** 2.1***
International 3.2*** 2.4 4.0 2.8***
Internet 3.3** 2.1 0.8*** 0.8***
Legal 3.2 3.4 3.2 2.8***
Oil 3.0 2.2 0.6 3.6***
ProdApproval 3.2** 5.1 0.1*** 0.6***
ProductDev1 4.0** 3.2 0.8*** 1.0***
ProductDev2 2.6* 3.5 0.2*** 0.4***
RealEstate 0.9* 1.5 5.3 1.1**
Regulation 4.5** 5.1 4.8 5.1***
Revenue 4.1 4.3 5.7 4.6***
Stakeholder 9.2 8.9 11.2*** 12.0***
StockPrice 4.9 4.8 5.5 4.9***
SupplyChain 3.2** 2.3 1.3 3.5***
Systems 4.1 3.6 2.1** 3.0***
41

Table 3:
Scaled Disclosure and Underpricing
The table presents results from regressing first-day IPO returns on a set dummy variables indicating that the IPO firm has taken advantage of variousaccommodations of the JOBS Act along with age, lagged revenues, and assets, a dummy variable, StarUnderwriter, that is equal to 1 if the leadunderwriter has the highest rating on Jay Ritter’s website (using the methodology in Ritter and Loughran, 2004), a dummy variable indicating theIPO was backed by venture capital investors, a dummy variable indicating the firm is in a technology industry (Tech: defined as the Fama Frenchindustries Computers, Software, Electronic Equipment, Healthcare, Medical Equipment, and Drugs), and an intercept. There are 215 observationsfrom 2012 and 2013. First day IPO returns are measured as the change in price form the IPO offer price to the closing price on the first day of tradingon the exchange. *, **, and *** indicate statistical significance at the 10%, 5%, and 1% levels, repsectively. t-statistics are in parentheses.
Variable: (1) (2) (3) (4) (5) (6) (7)
Num Executives’ Compensation Reported 0.003 -0.004(0.38) (0.45)
Discussion of Executive Compensation 0.021 0.028(0.56) (0.81)
Private Accounting Standards -0.038 -0.037(0.85) (0.82)
< 3 Yrs of Audited Statements -0.050 -0.038(1.31) (0.83)
Num Yrs of Selected Fin Statements 0.034 0.034(2.08)** (1.58)
Confidential Filing 0.047 0.080(1.34) (2.13)**
LaggedRevenues (thousands) 0.000 0.000 0.000 0.000 0.000 0.000 0.000(1.34) (1.29) (1.31) (1.05) (1.41) (1.50) (1.26)
LaggedTotalAssets (thousands) 0.000 0.000 0.000 0.000 0.000 0.000 0.000(2.03)** (1.82)* (1.72)* (2.16)** (2.52)** (1.68)* (1.56)
StarUnderwriter 0.086 0.084 0.094 0.087 0.086 0.082 0.086(2.00)** (1.95)* (2.21)** (2.02)** (2.01)** (1.92)* (2.03)**
VCbacked 0.165 0.160 0.172 0.15487 0.152 0.162 0.138(2.97)*** (2.92)*** (3.15)*** (2.81)*** (2.83)*** (2.99)*** (2.58)**
Tech -0.046 -0.046 -0.047 -0.042 -0.040 -0.044 -0.038(0.86) (0.87) (0.89) (0.80) (0.77) (0.84) (0.75)
Age 0.000 0.000 0.000 0.000 0.000 0.000 0.000(0.04) (0.03) (0.03) (0.17) (0.15) (0.19) (0.12)
N 215 215 215 215 215 215 215Adj R Sq 0.10 0.10 0.11 0.10 0.11 0.10 0.14
42

Table 4:
Disclosed Risk Factors and Underpricing
The table presents results from regressing first-day IPO returns on a set of disclosed risk factor variables, laggedrevenues, assets, and a dummy variable indicating whether the firm is an Emerging Growth Company for thepurposes of the JOBS Act. There are 431 observations of firms with less than $1 Billion in revenues from 2010–2013.The matched sample is drawn from the set of firms before the enactment of the JOBS Act and is matched on totalassets, age, and industry. The disclosed risk factors are estimated using Latent Dirichlet Allocation on a trainingset of risk factor sections from 10-Ks and registration statements from 2006–2012 and are fit out-of-sample.
Variable Coefficient Standard Error
Accounting 0.72 (0.69)
Competition -0.89 (0.94)
Contractual 1.57* (0.82)
Costs -0.09 (0.63)
Credit 0.03 (0.65)
Demand 1.56** (0.67)
Disclosure 1.69*** (0.65)
Dividends 0.85 (0.53)
EnviroReg 0.56 (0.81)
Financing -0.29 (0.89)
Growth 3.77 (0.77)
HealthCare 0.26 (0.73)
HumanCapital 1.25 (1.35)
Insurance 1.11 (0.91)
IntellProp 0.99 (0.67)
International 0.34 (0.67)
Internet 0.80* (0.47)
Legal 1.57** (0.65)
Oil 0.81 (0.52)
ProdApproval 0.31 (0.49)
ProductDev1 0.92 (0.62)
ProductDev2 1.52** (0.61)
RealEstate 1.22 (0.80)
Regulation 1.56* (0.87)
Revenue -0.52 (0.85)
Stakeholder 1.00** (0.49)
StockPrice -0.52 (0.74)
SupplyChain 0.72 (0.59)
Systems 1.48** (0.71)
lagged revenues 0.00 (0.00)
assets 0.00 (0.00)
EGC 0.05* (0.02)
Intercept -0.72* (0.41)
N 431
Adj R-Sq 0.2051
43
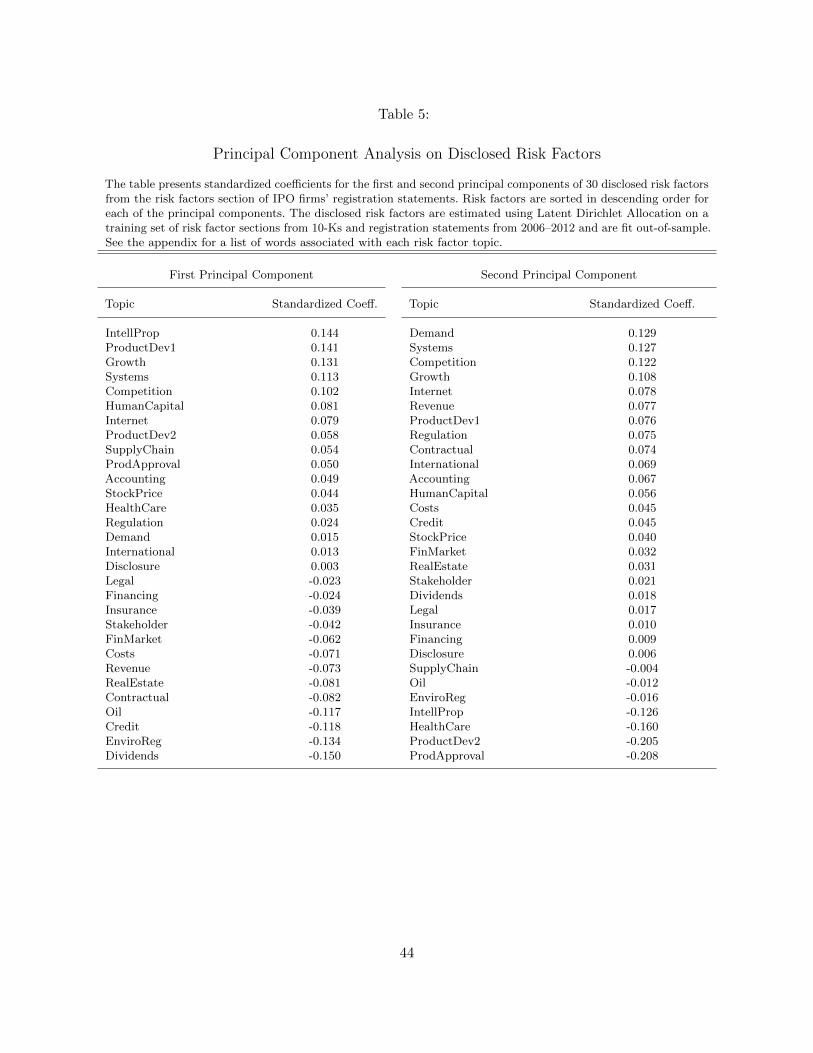
Table 5:
Principal Component Analysis on Disclosed Risk Factors
The table presents standardized coefficients for the first and second principal components of 30 disclosed risk factorsfrom the risk factors section of IPO firms’ registration statements. Risk factors are sorted in descending order foreach of the principal components. The disclosed risk factors are estimated using Latent Dirichlet Allocation on atraining set of risk factor sections from 10-Ks and registration statements from 2006–2012 and are fit out-of-sample.See the appendix for a list of words associated with each risk factor topic.
First Principal Component Second Principal Component
Topic Standardized Coeff. Topic Standardized Coeff.
IntellProp 0.144 Demand 0.129ProductDev1 0.141 Systems 0.127Growth 0.131 Competition 0.122Systems 0.113 Growth 0.108Competition 0.102 Internet 0.078HumanCapital 0.081 Revenue 0.077Internet 0.079 ProductDev1 0.076ProductDev2 0.058 Regulation 0.075SupplyChain 0.054 Contractual 0.074ProdApproval 0.050 International 0.069Accounting 0.049 Accounting 0.067StockPrice 0.044 HumanCapital 0.056HealthCare 0.035 Costs 0.045Regulation 0.024 Credit 0.045Demand 0.015 StockPrice 0.040International 0.013 FinMarket 0.032Disclosure 0.003 RealEstate 0.031Legal -0.023 Stakeholder 0.021Financing -0.024 Dividends 0.018Insurance -0.039 Legal 0.017Stakeholder -0.042 Insurance 0.010FinMarket -0.062 Financing 0.009Costs -0.071 Disclosure 0.006Revenue -0.073 SupplyChain -0.004RealEstate -0.081 Oil -0.012Contractual -0.082 EnviroReg -0.016Oil -0.117 IntellProp -0.126Credit -0.118 HealthCare -0.160EnviroReg -0.134 ProductDev2 -0.205Dividends -0.150 ProdApproval -0.208
44

Table 6:
Risk Disclosure and IPO Underpricing
The table presents results from regressing first-day IPO returns on the first (riskfactor1) and second (riskfactor2)principal components from the set of 30 disclosed risk factors in the risk factor section of the IPO firm’s prospectus.These variables are also interacted with a dummy variable indicating the firm is an Emerging Growth Company(EGC) under the JOBS Act as well as lagged revenues, and assets and the number of words in the risk factorssection. Additionally, we include a dummy variable, StarUnderwriter, that is equal to 1 if the lead underwriterhas the highest rating on Jay Ritter’s website (using the methodology in Ritter and Loughran (2004)), a dummyvariable indicating the IPO was backed by venture capital investors, and a dummy variable indicating the firm is ina technology industry (Tech: defined as the Fama French industries Computers, Software, Electronic Equipment,Healthcare, Medical Equipment, and Drugs). The matched sample is drawn from the set of firms before theenactment of the JOBS Act and is matched on revenues, age and industry.There are 402 observations from 2010and 2013, 220 of which are EGCs. The matched sample is drawn from the set of firms before the enactment of theJOBS Act and is matched on total assets, age, and industry. First day IPO returns are measured as the changein price form the IPO offer price to the closing price on the first day of trading on the exchange. *, **, and ***indicate statistical significance at the 10%, 5%, and 1% levels, repsectively. t-statistics are in parentheses.
Variable: (1) (2) (3)
LaggedRevenues (thousands) 0.0000 0.0000 0.0000(1.30) (1.16) (1.13)
LaggedTotalAssets (thousands) 0.0000 0.0000 0.0000(2.20)** (2.45)** (2.10)**
StarUnderwriter 0.0716 0.0798 0.0740(2.59)*** (2.91)*** (2.83)***
VCbacked 0.10037 0.1018 0.0450(3.02)*** (3.07)*** (1.29)
Tech -0.0150 -0.0184 -0.0750(0.46) (0.58) (1.77)*
EGC 0.0593 0.0687(2.38)** (2.87)***
riskfactor1 0.0808(4.07)***
riskfactor2 0.0483(3.68)***
riskfactor1×EGC -0.0288(1.47)
riskfactor2×EGC 0.0051(0.27)
number of words in risk factor section 0.0000(0.34)
Constant 0.0965 0.0639 0.0867(4.83)*** (2.59)*** (2.11)**
N 402 402 402Adj R Sq 0.07 0.08 0.17
45
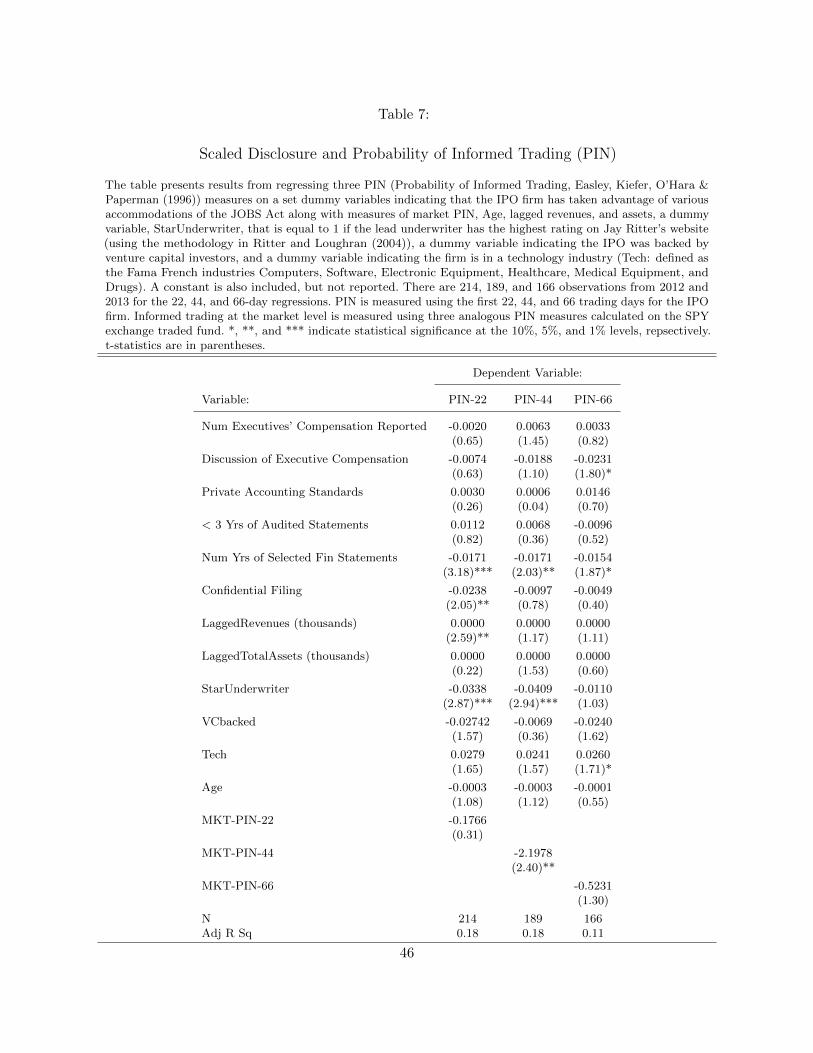
Table 7:
Scaled Disclosure and Probability of Informed Trading (PIN)
The table presents results from regressing three PIN (Probability of Informed Trading, Easley, Kiefer, O’Hara &Paperman (1996)) measures on a set dummy variables indicating that the IPO firm has taken advantage of variousaccommodations of the JOBS Act along with measures of market PIN, Age, lagged revenues, and assets, a dummyvariable, StarUnderwriter, that is equal to 1 if the lead underwriter has the highest rating on Jay Ritter’s website(using the methodology in Ritter and Loughran (2004)), a dummy variable indicating the IPO was backed byventure capital investors, and a dummy variable indicating the firm is in a technology industry (Tech: defined asthe Fama French industries Computers, Software, Electronic Equipment, Healthcare, Medical Equipment, andDrugs). A constant is also included, but not reported. There are 214, 189, and 166 observations from 2012 and2013 for the 22, 44, and 66-day regressions. PIN is measured using the first 22, 44, and 66 trading days for the IPOfirm. Informed trading at the market level is measured using three analogous PIN measures calculated on the SPYexchange traded fund. *, **, and *** indicate statistical significance at the 10%, 5%, and 1% levels, repsectively.t-statistics are in parentheses.
Dependent Variable:
Variable: PIN-22 PIN-44 PIN-66
Num Executives’ Compensation Reported -0.0020 0.0063 0.0033(0.65) (1.45) (0.82)
Discussion of Executive Compensation -0.0074 -0.0188 -0.0231(0.63) (1.10) (1.80)*
Private Accounting Standards 0.0030 0.0006 0.0146(0.26) (0.04) (0.70)
< 3 Yrs of Audited Statements 0.0112 0.0068 -0.0096(0.82) (0.36) (0.52)
Num Yrs of Selected Fin Statements -0.0171 -0.0171 -0.0154(3.18)*** (2.03)** (1.87)*
Confidential Filing -0.0238 -0.0097 -0.0049(2.05)** (0.78) (0.40)
LaggedRevenues (thousands) 0.0000 0.0000 0.0000(2.59)** (1.17) (1.11)
LaggedTotalAssets (thousands) 0.0000 0.0000 0.0000(0.22) (1.53) (0.60)
StarUnderwriter -0.0338 -0.0409 -0.0110(2.87)*** (2.94)*** (1.03)
VCbacked -0.02742 -0.0069 -0.0240(1.57) (0.36) (1.62)
Tech 0.0279 0.0241 0.0260(1.65) (1.57) (1.71)*
Age -0.0003 -0.0003 -0.0001(1.08) (1.12) (0.55)
MKT-PIN-22 -0.1766(0.31)
MKT-PIN-44 -2.1978(2.40)**
MKT-PIN-66 -0.5231(1.30)
N 214 189 166Adj R Sq 0.18 0.18 0.11
46

Table 8:
Risk Disclosure and Probability of Informed Trading (PIN)
The table presents results from regressing 66-, 44-, and 22-day PIN (Probability of Informed Trading, Easley,Kiefer, O’Hara & Paperman (1996)) on the first (riskfactor1) and second (riskfactor2) principal components fromthe set of 30 disclosed risk factors in the risk factor section of the IPO firm’s prospectus. These variables are alsointeracted with a dummy variable indicating the firm is an Emerging Growth Company (EGC) under the JOBSAct as well as lagged revenues, and assets and the number of words in the risk factors section. Additionally, weinteract EGC with the firm’s 1st day IPO underpricing. There are 353 observations between 2010 and 2013 of IPOfirms for which 66-day PIN can be calculated, 377 for PIN-44 and 402 for PIN-22. PIN is measured using the first66, 44, or 22 trading days after the IPO. We control for a measure of informed trading at the market level usingan analogous PIN measure calculated on the SPY exchange traded fund during the same period as the IPO firm.Additionally, we include a dummy variable, StarUnderwriter, that is equal to 1 if the lead underwriter has thehighest rating on Jay Ritter’s website (using the methodology in Ritter and Loughran (2004)), a dummy variableindicating the IPO was backed by venture capital investors, and a dummy variable indicating the firm is in atechnology industry (Tech: defined as the Fama French industries Computers, Software, Electronic Equipment,Healthcare, Medical Equipment, and Drugs). The matched sample is drawn from the set of firms before theenactment of the JOBS Act and is matched on revenues, age and industry. *, **, and *** indicate statisticalsignificance at the 10%, 5%, and 1% levels, repsectively. t-statistics are in parentheses.
PIN-66 PIN-44 PIN-22
MKT-PIN-(66/44/22) -0.2666 -0.1722 -0.2416 0.3460 -0.6737(0.99) (0.61) (0.88) (1.18) (1.70)*
LaggedRevenues (thousands) 0.0000 0.0000 0.0000 0.0000 0.0000(1.59) (1.61) (1.36) (1.85)* (1.50)
LaggedTotalAssets (thousands) 0.0000 0.0000 0.0000 0.0000 0.0000(0.67) (1.09) (0.41) (0.31) (1.17)
StarUnderwriter -0.0246 -0.0222 -0.0200 -0.0297 -0.0319(3.51)*** (3.26)*** (2.95)*** (4.07)*** (4.18)***
VCbacked -0.01015 -0.0069 -0.0035 -0.0143 -0.0046(1.19) (0.79) (0.40) (1.45) (0.45)
Tech 0.0133 0.0140 0.0041 0.0078 0.0112(1.54) (1.60) (0.42) (0.66) (1.03)
EGC 0.0179 0.0184 0.0144 0.0165(2.07)** (2.07)** (1.47) (1.56)
Underpricing x EGC -0.0618 -0.0555 -0.0804 -0.0850(2.72)*** (2.56)** (4.60)*** (4.03)***
factor1 0.0021 -0.0048 -0.0096(0.38) (0.69) (1.51)
factor2 -0.0244 -0.0158 -0.0170(5.79)*** (2.66)*** (3.59)***
factor1×EGC -0.0045 0.0113 0.0104(0.72) (1.57) (1.53)
factor2×EGC 0.0112 0.0011 0.0056(1.92)* (0.16) (0.78)
number of words in risk factor section 0.0000 0.0000 0.0000(2.86)*** (2.56)** (2.00)**
N 353 353 353 402 377Adj R Sq 0.050 0.070 0.160 0.180 0.170
47

Table 9:
Risk Disclosures or JOBS Act Accommodations? Underpricing and PIN
The table presents results from regressing either first-day IPO returns or 66-day PIN (Probability of InformedTrading, Easley, Kiefer, O’Hara & Paperman (1996)) on the first (riskfactor1) and second (riskfactor2) principalcomponents from the set of 30 disclosed risk factors in the risk factor section of the IPO firm’s prospectus. Thesevariables are also interacted with a dummy variable indicating the firm is an Emerging Growth Company (EGC)under the JOBS Act as well as lagged revenues, and assets and the number of words in the risk factors section.There are 353 observations between 2010 and 2013 of IPO firms for which 66-day PIN can be calculated. PIN ismeasured using the first 66 trading days after the IPO. We control for a measure of informed trading at the marketlevel (MKT-PIN-66) using an analogous PIN measure calculated on the SPY exchange traded fund during thesame 66-day period as the IPO firm. Additionally, we include a dummy variable, StarUnderwriter, that is equalto 1 if the lead underwriter has the highest rating on Jay Ritter’s website (using the methodology in Ritter andLoughran (2004)), a dummy variable indicating the IPO was backed by venture capital investors, and a dummyvariable indicating the firm is in a technology industry (Tech: defined as the Fama French industries Computers,Software, Electronic Equipment, Healthcare, Medical Equipment, and Drugs). The matched sample is drawn fromthe set of firms before the enactment of the JOBS Act and is matched on revenues, age and industry. *, **, and*** indicate statistical significance at the 10%, 5%, and 1% levels, repsectively. t-statistics are in parentheses.
Underpricing PIN-66
Num Executives’ Compensation Reported -0.004 -0.006 0.003 0.005(0.45) (0.70) (0.82) (1.23)
Discussion of Executive Compensation 0.028 0.027 -0.023 -0.037(0.81) (0.77) (1.80)* (2.71)***
Private Accounting Standards -0.037 -0.032 0.015 0.010(0.82) (0.75) (0.70) (0.52)
< 3 years of Audited Statements -0.038 -0.025 -0.010 -0.021(0.83) (0.53) (0.52) (1.15)
Num. yrs of Selected Fin. Statements 0.034 0.019 -0.015 -0.015(1.58) (0.91) (1.87)* (1.74)*
Confidential Filing 0.080 0.068 -0.005 0.002(2.13)** (1.83)* (0.40) (0.13)
StarUnderwriter 0.086 0.092 -0.011 -0.009(2.03)** (2.18)** (1.03) (0.87)
VCbacked 0.138 0.107 -0.024 -0.011(2.58)** (1.90)* (1.62) (0.78)
Tech -0.038 -0.102 0.026 0.015(0.75) (1.52) (1.71)* (0.86)
number of words in risk factor section 0.000 0.000(0.51) (3.30)***
factor1 0.069 -0.005(2.61)*** (0.55)
factor2 0.014 -0.017(0.65) (3.00)***
MKT-PIN-66 -0.523 -0.528(1.30) (1.36)
Lagged Revenues, Lagged Total Assets, Age Y Y Y Y
N 215 215 166 166Adj R Sq 0.14 0.18 0.11 0.22
48

Table 10:
Liquidity
The table provides differences in summary statistics for liquidity measures between a set of 132 EGC firms and asimilar set of 202 IPO firms before the JOBS Act was enacted. Liquidity measures are estimated for the first dayof the IPO (Panel A) and the second day (Panel B). The liquidity measures include effective spreads and realizedspreads. We use two weighting methods: dollar-weighted (denoted with a subscript DW) and share weighted(denoted with a subscript-SW). The classification of the midpoint in the calculation of effective spread follows Leeand Ready (1991). The classification of midpoint in the calculation of realized spread and price impact is doneusing various methods: Lee and Ready (1991) (denoted with a subscript LR), Ellis, Michaely and O’Hara (2000)(denoted with a subscript EMO) and Chakrabarty, Li, Nguyen and Van Ness 2006 (denoted with a subscriptCLNV). More details are found in the appendix. Data are from TAQ.
Panel A: Day 1
Liquidity Measures Mean Standard Dev. Median Skewness Kurtosis t-test for diff in means
sumdollar 47 165 6.3 3 22.47 1.98
sumsize 2.74 7.77 0.46 5 44.32 2.85
Dollar Spreads:
realizedLR,SW -0.045 -0.015 -0.010 -2.656 5.010 -2.21
realizedLR,DW -0.044 -0.019 -0.010 -2.882 1.925 -2.21
realizedEMO,SW -0.036 -0.021 0.003 -5.304 1.994 -2.00
realizedEMO,DW -0.035 -0.020 0.003 -5.018 -1.261 -1.95
realizedCLNV,SW -0.043 -0.023 -0.002 -4.445 2.668 -2.27
realizedCLNV,DW -0.042 -0.022 -0.002 -4.218 0.015 -2.23
effectiveDW -0.168 -1.706 -0.001 -0.521 5.400 -1.04
effectiveSW -0.164 -1.659 -0.001 -0.597 5.058 -1.05
Percentage Spreads:
realizedLR,SW -0.003 -0.004 -0.001 -4.226 -10.687 -2.20
realizedLR,DW -0.003 -0.003 -0.001 -4.453 -9.924 -2.14
realizedEMO,SW -0.002 -0.003 0.000 -4.472 -7.176 -1.53
realizedEMO,DW -0.002 -0.002 0.000 -4.676 -6.568 -1.48
realizedCLNV,SW -0.002 -0.003 0.000 -4.106 -7.408 -1.94
realizedCLNV,DW -0.002 -0.003 0.000 -4.323 -6.804 -1.88
effectiveDW -0.002 -0.010 0.000 -2.969 -24.757 -1.94
effectiveSW -0.002 -0.010 0.000 -2.867 -23.478 -1.97
Table 10 continues on the next page.
49

Table 10 continued from the previous page.
Panel B: Day 2
Liquidity Measures Mean Standard Dev. Median Skewness Kurtosis t-test for diff in means
sumdollar 16.8 66.3 2.32 2 19.160 2.66
sumsize 0.79 2.49 0.20 3 25.29 3.50
Dollar Spreads:
realizedLR,SW -0.015 -0.011 -0.013 -0.705 0.890 -2.60
realizedLR,DW -0.015 -0.010 -0.013 -0.815 0.986 -2.63
realizedEMO,SW -0.010 -0.006 -0.009 0.464 4.028 -2.05
realizedEMO,DW -0.010 -0.006 -0.009 0.395 4.232 -2.08
realizedCLNV,SW -0.016 -0.007 -0.013 -1.225 1.421 -2.94
realizedCLNV,DW -0.016 -0.007 -0.013 -1.341 1.478 -2.97
effectiveDW -0.016 -0.010 -0.015 0.759 5.918 -2.68
effectiveSW -0.016 -0.009 -0.014 0.738 5.500 -2.69
Percentage Spreads:
realizedLR,SW -0.002 -0.002 -0.001 -0.261 2.839 -3.08
realizedLR,DW -0.002 -0.002 -0.001 -0.287 2.871 -3.09
realizedEMO,SW -0.001 -0.001 -0.001 1.375 8.675 -2.05
realizedEMO,DW -0.001 -0.001 -0.001 1.398 8.657 -2.06
realizedCLNV,SW -0.001 -0.001 -0.001 0.280 7.639 -3.15
realizedCLNV,DW -0.001 -0.001 -0.001 0.243 7.621 -3.17
effectiveDW -0.001 -0.001 -0.001 1.734 13.682 -2.41
effectiveSW -0.001 -0.001 -0.001 1.676 12.922 -2.41
50

Table 11:
Determinants of Liquidity
The table provides regression results from the regression of various liquidity measures from the first day of amatched sample of IPO firms. The treatment group is the set of EGC firms for which sufficient TAQ data areavailable to estimate liquidity. The matched sample is drawn from the set of firms before the enactment of theJOBS Act and is matched on total assets, age, and industry. Liquidity is regressed on lagged revenues, laggedR&D Expense, lagged total assets, and a dummy variable indicating that the firm is claiming EGC status. Dataare from TAQ. *, **, and *** indicate statistical significance at the 10%, 5%, and 1% levels, repsectively. Thereare 224 observations drawn from IPOs between 2010 and 2013. t-statistics are in parentheses.
Dollar Spreads: Percentage Spreads:
Dependent variable: RealizedLR,SW RealizedLR,DW RealizedLR,SW RealizedLR,DW
EGC 0.066 0.065 0.004 0.004
(2.26)** (2.24)** (2.30)** (2.32)**
lagged revenues (thousands) 0.000 0.000 0.000 0.000
(-0.510) (-0.480) (-0.360) (-0.360)
lagged r&d expense (thousands) 0.000 0.000 0.000 0.000
(-1.54) (1.67)* (-1.43) (-1.58)
lagged total assets (thousands) 0.000 0.000 0.000 0.000
(2.31)** (2.29)** (2.33)** (2.30)**
Constant 0.013 0.011 0.001 0.001
(-0.49) (-0.42) (-0.81) (-0.64)
N 224 224 224 224
Adj R-Sq 0.030 0.030 0.030 0.030
51

Table 12:
SEC Letters, Underpricing, and PIN for JOBS Act Firms
The table presents results from regressing first-day IPO returns, 22-day, 44-day, and 66-day PIN (Probabilityof Informed Trading, Easley, Kiefer, O’Hara and Paperman (1996)) on the first (factor1) and second(factor2) principal components of 30 disclosed risk factors from the risk factors section of IPO firms’registration statements, textual measures from SEC letters to the firm during the IPO process, six JOBSAct accommodations, the offer size, a dummy variable indicating that the lead underwriter has the highestrating on Jay Ritter’s website (StarUnderwriter, using the methodology in Ritter and Loughran, 2004), adummy variable indicating the IPO firm had venture capital backing (VCbacked), the return of the CRSPvalue weighted market portfolio in excess of the risk free rate (Mkt-RF), and a set of 12 industry fixedeffects (the 12 industry portfolios from Ken French’s website). Results are presented for 150 JOBS ActEGCs from 2012 and 2013 for underpricing, and 149, 133, and 116 of these firms for which sufficient dataare available to estimate 22-, 44-, and 66-day PIN, respectively. The SEC letters textual measures arefrom the first letter from the SEC to the IPO firm. The measures are numbers (the number of numbersappearing in the letter), uncertainty (the number of uncertainty words in the letter divided by the totalnumber of words), weak/strong (the number of weak modal words divided by the number of strong modalwords in the letter), negative/positive (the number of negative words divided by the number of positivewords in the letter), item (the number of itemized points discussed by the SEC in the letter), and pages(the number of pages in the letter). Uncertainty, weak modal, strong modal, negative and positive wordsare those in the Loughran and McDonald (2011) word lists on Bill McDonald’s website. SEC letters aredownloaded from the Securities and Exchange Commission Edgar website. The disclosed risk factorsused in the first and second principal components are estimated using Latent Dirichlet Allocation on atraining set of risk factor sections from 10-Ks and registration statements from 2006–2012 and are fitout-of-sample. factor1 and factor2 are defined in Table 5. The JOBS Act provisions are: (1) “ConfidentialFiling” (abbreviated “Confid. Filing”): An EGC may confidentially submit its draft registration statementto the SEC, (2) “No Discussion of Exec. Comp” (abbreviated “ExecComp Discuss”): An EGC mayomit a discussion of executive compensation, (3) “Private Accounting Standard” (abbreviated “PrivateAcctg”): EGCs may take advantage of an extended transition period using private accounting standards,(4) “<3 Yrs of Audited Statements” (abbreviated “<3 yrs Audited”): An EGC can disclose as few as2 years of audited financial statements in its registration statement, 5) “<5 Yrs of Selected Fin. Data”(abbreviated “<5 yrs Fin Data”): An EGC can disclose as few as 2 years of selected financial data in itsregistration statement, and (6) “<5 Executives’ Comp.”(abbreviated “<5 Exec”): An EGC can disclosethe compensation of as few as 3 executives.
52
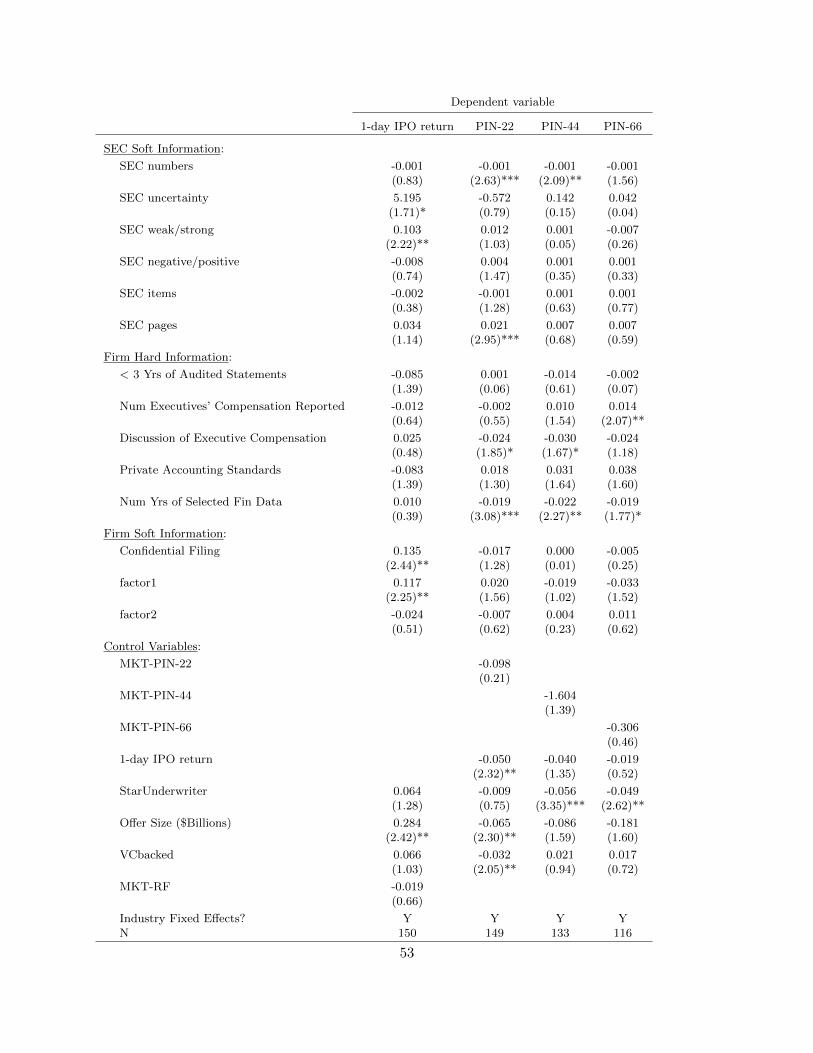
Dependent variable
1-day IPO return PIN-22 PIN-44 PIN-66
SEC Soft Information:
SEC numbers -0.001 -0.001 -0.001 -0.001(0.83) (2.63)*** (2.09)** (1.56)
SEC uncertainty 5.195 -0.572 0.142 0.042(1.71)* (0.79) (0.15) (0.04)
SEC weak/strong 0.103 0.012 0.001 -0.007(2.22)** (1.03) (0.05) (0.26)
SEC negative/positive -0.008 0.004 0.001 0.001(0.74) (1.47) (0.35) (0.33)
SEC items -0.002 -0.001 0.001 0.001(0.38) (1.28) (0.63) (0.77)
SEC pages 0.034 0.021 0.007 0.007(1.14) (2.95)*** (0.68) (0.59)
Firm Hard Information:
< 3 Yrs of Audited Statements -0.085 0.001 -0.014 -0.002(1.39) (0.06) (0.61) (0.07)
Num Executives’ Compensation Reported -0.012 -0.002 0.010 0.014(0.64) (0.55) (1.54) (2.07)**
Discussion of Executive Compensation 0.025 -0.024 -0.030 -0.024(0.48) (1.85)* (1.67)* (1.18)
Private Accounting Standards -0.083 0.018 0.031 0.038(1.39) (1.30) (1.64) (1.60)
Num Yrs of Selected Fin Data 0.010 -0.019 -0.022 -0.019(0.39) (3.08)*** (2.27)** (1.77)*
Firm Soft Information:
Confidential Filing 0.135 -0.017 0.000 -0.005(2.44)** (1.28) (0.01) (0.25)
factor1 0.117 0.020 -0.019 -0.033(2.25)** (1.56) (1.02) (1.52)
factor2 -0.024 -0.007 0.004 0.011(0.51) (0.62) (0.23) (0.62)
Control Variables:
MKT-PIN-22 -0.098(0.21)
MKT-PIN-44 -1.604(1.39)
MKT-PIN-66 -0.306(0.46)
1-day IPO return -0.050 -0.040 -0.019(2.32)** (1.35) (0.52)
StarUnderwriter 0.064 -0.009 -0.056 -0.049(1.28) (0.75) (3.35)*** (2.62)**
Offer Size ($Billions) 0.284 -0.065 -0.086 -0.181(2.42)** (2.30)** (1.59) (1.60)
VCbacked 0.066 -0.032 0.021 0.017(1.03) (2.05)** (0.94) (0.72)
MKT-RF -0.019(0.66)
Industry Fixed Effects? Y Y Y YN 150 149 133 116
53