DISCLAIMER: Stock, forex, futures, and options trading is...
29
Transcript of DISCLAIMER: Stock, forex, futures, and options trading is...
DISCLAIMER: Stock, forex, futures, and options trading is not appropriate for everyone. There is a substantial risk of loss associated with trading these markets. Losses can and will occur. No system or methodology has ever been developed that can guarantee profits or ensure freedom from losses. No representation or implication is being made that using the information in this special report will generate profits or ensure freedom from losses. Risks also include, but are not limited to, the potential for changing political and/or economic conditions that may substantially affect the price and/or liquidity of a market. The impact of seasonal and geopolitical events is already factored into market prices. Under certain conditions you may find it impossible to liquidate a position. This can occur, for example, when a market becomes illiquid. The placement of contingent orders by you, such as “stop-loss” or “stop-limit” orders will not necessarily limit or prevent losses because market conditions may make it impossible to execute such orders. In no event should the content of this correspondence be construed as an express or implied promise or guarantee that you will profit or that losses can or will be limited in any manner whatsoever. Past results are no indication of future performance. Information contained in this correspondence is intended for informational purposes only and was obtained from sources believed to be reliable. Information is in no way guaranteed. No guarantee of any kind is implied or possible where projections of future conditions are attempted.
Copyright © by Profits Run, Inc.
All rights reserved. No part of this publication may be reproduced or transmitted in any form or by any means, electronic, or mechanical, including photocopying, recording, or by any
information storage and retrieval system.
Published by: Profits Run, Inc.
28339 Beck Rd Unit F1 Wixom, MI 48393
www.profitsrun.com
Copyright © Profits Run, Inc. Page 2 of 23
Introduction Trading first and foremost is about managing risk, and one of the key secrets to successful trading is knowing when and what not to trade. As successful traders know, you have the advantage over the markets if you pick your points and if you’re patient -‐ if you wait for your trading method to setup for those stocks that give you the best chance of success where the opportunity for profit is high and the risk of loss is lower. These are the key entry points that occur over and over again in the markets, but you only want to take those trades in markets that are trading deliberately, in a deliberate fashion, day in and day out where there is some level of predictability. Now, if a market is not exhibiting that kind of behavior, then you just don’t want to trade that stock. It’s far too risky! You might ask, “What do you mean by deliberate trading?” Well, I am going to define that for you by showing you 5 different cases where a market is either not trading deliberately or is at high risk of not doing so. Where it will become clear to you that if any one of those cases occurs, or more than one at the same time, you should stand aside and not trade that market. There is simply no reason to do so when there are so many good opportunities out there. Also, if you have a good trading method, that method will help you screen out the stocks that are inappropriate for trading, and zero in on those few that are the very best for swing trading.
Copyright © Profits Run, Inc. Page 3 of 23
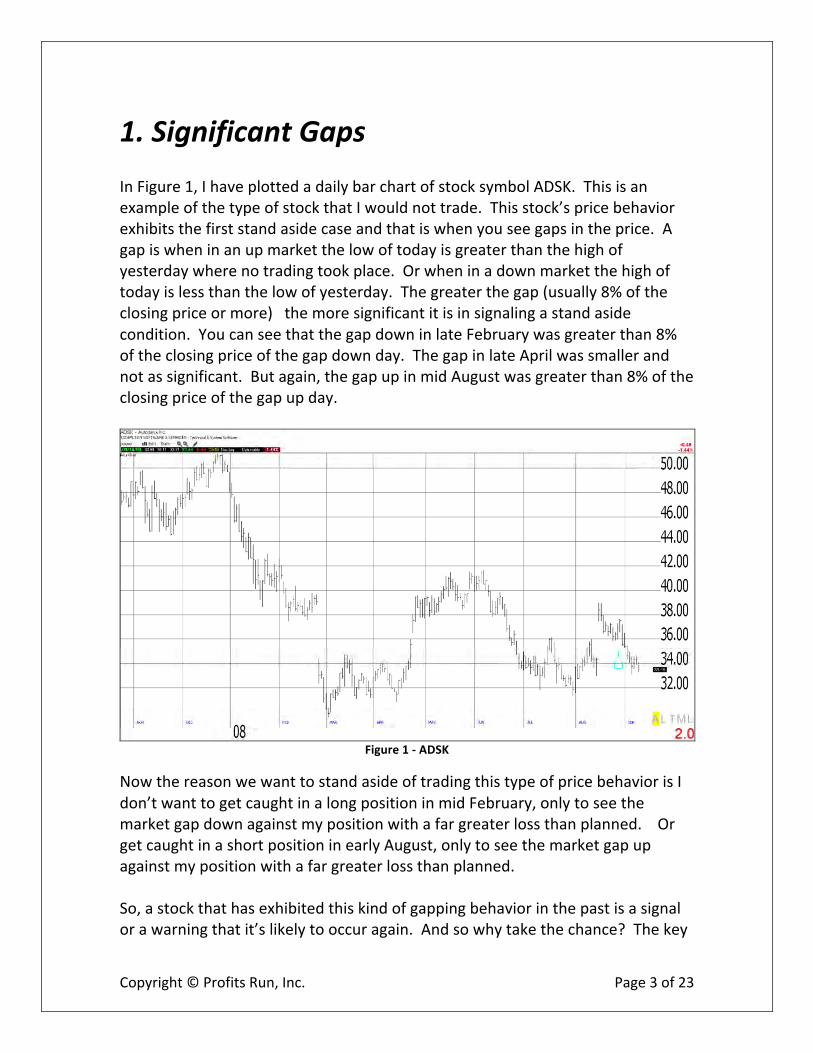
1. Significant Gaps In Figure 1, I have plotted a daily bar chart of stock symbol ADSK. This is an example of the type of stock that I would not trade. This stock’s price behavior exhibits the first stand aside case and that is when you see gaps in the price. A gap is when in an up market the low of today is greater than the high of yesterday where no trading took place. Or when in a down market the high of today is less than the low of yesterday. The greater the gap (usually 8% of the closing price or more) the more significant it is in signaling a stand aside condition. You can see that the gap down in late February was greater than 8% of the closing price of the gap down day. The gap in late April was smaller and not as significant. But again, the gap up in mid August was greater than 8% of the closing price of the gap up day.
Figure 1 -‐ ADSK
Now the reason we want to stand aside of trading this type of price behavior is I don’t want to get caught in a long position in mid February, only to see the market gap down against my position with a far greater loss than planned. Or get caught in a short position in early August, only to see the market gap up against my position with a far greater loss than planned. So, a stock that has exhibited this kind of gapping behavior in the past is a signal or a warning that it’s likely to occur again. And so why take the chance? The key

Copyright © Profits Run, Inc. Page 4 of 23
is look back at least three months on the price chart or even six months, but at least three months and if you see that the price has been gapping then stand aside and go on to the next stock trading opportunity. In Figure 2, I have plotted a daily bar chart of stock symbol ABK. This is another example of the kind of price gapping behavior that signals the need to stand aside. In fact on this one another reason to stand aside can be seen. When a market gaps down sharply like this one did in October and then again in January, that usually is followed by a prolonged sideways movement in the market for several weeks and even months as occurred here. Another reason to stand aside as who wants to have their trading capital locked up in a trade that is going nowhere?
Figure 2 -‐ ABK
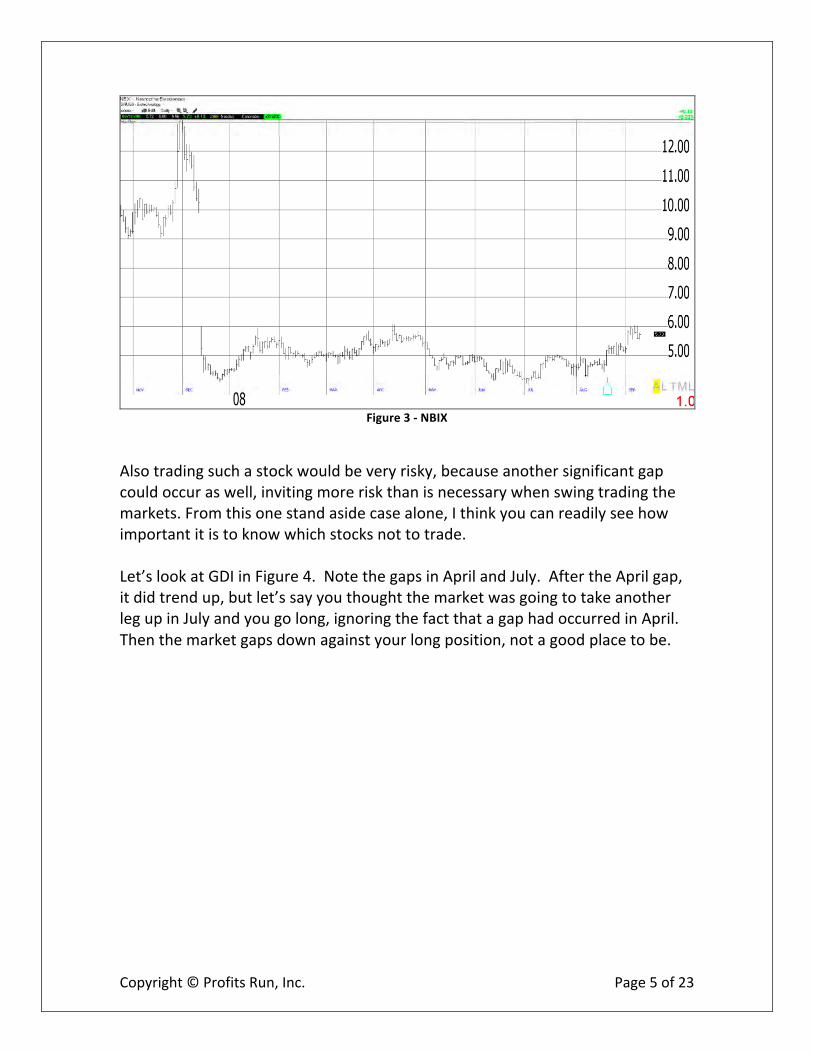
In Figure 3, I have plotted a daily bar chart of NBIX. Here is another example of this sideways price behavior phenomenon. Look at the huge gap down in December. That was followed by 8 months of sideways price behavior. A trade in that stock after the gap down would have just locked up precious trading capital in a trade that is going nowhere.
Copyright © Profits Run, Inc. Page 5 of 23
Figure 3 -‐ NBIX
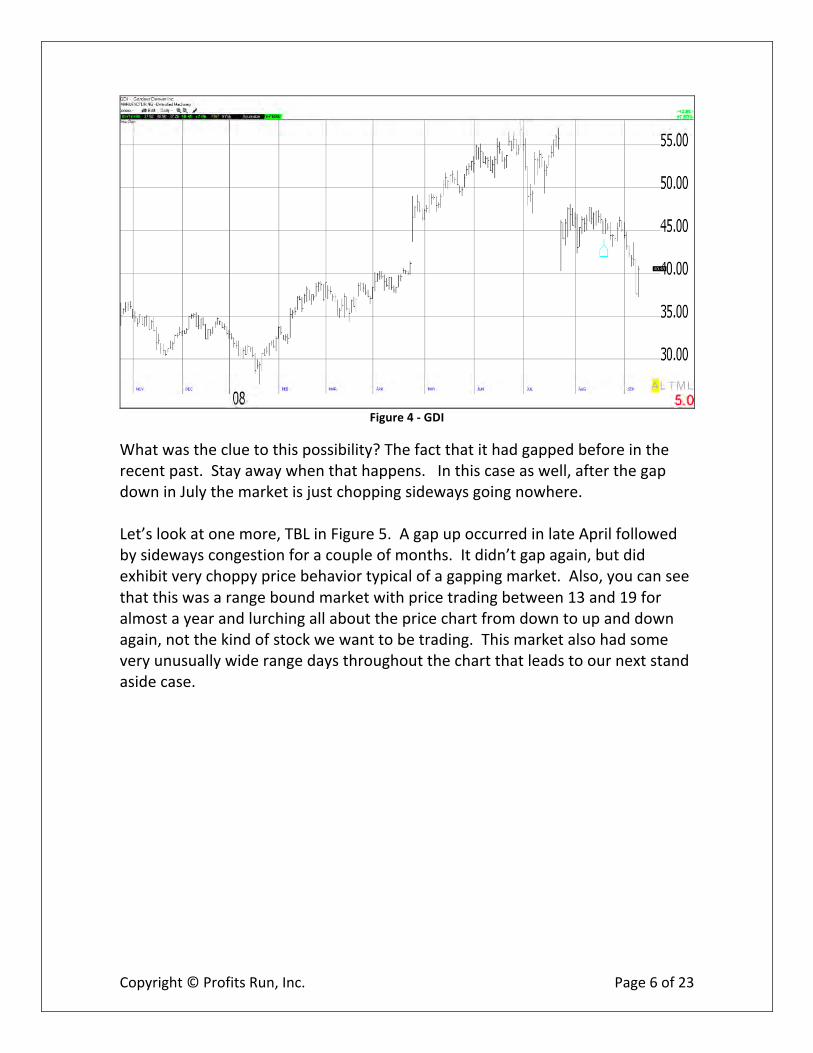
Also trading such a stock would be very risky, because another significant gap could occur as well, inviting more risk than is necessary when swing trading the markets. From this one stand aside case alone, I think you can readily see how important it is to know which stocks not to trade. Let’s look at GDI in Figure 4. Note the gaps in April and July. After the April gap, it did trend up, but let’s say you thought the market was going to take another leg up in July and you go long, ignoring the fact that a gap had occurred in April. Then the market gaps down against your long position, not a good place to be.
Copyright © Profits Run, Inc. Page 6 of 23
Figure 4 -‐ GDI
What was the clue to this possibility? The fact that it had gapped before in the recent past. Stay away when that happens. In this case as well, after the gap down in July the market is just chopping sideways going nowhere. Let’s look at one more, TBL in Figure 5. A gap up occurred in late April followed by sideways congestion for a couple of months. It didn’t gap again, but did exhibit very choppy price behavior typical of a gapping market. Also, you can see that this was a range bound market with price trading between 13 and 19 for almost a year and lurching all about the price chart from down to up and down again, not the kind of stock we want to be trading. This market also had some very unusually wide range days throughout the chart that leads to our next stand aside case.

Copyright © Profits Run, Inc. Page 7 of 23
Figure 5 -‐ TBL
Copyright © Profits Run, Inc. Page 8 of 23
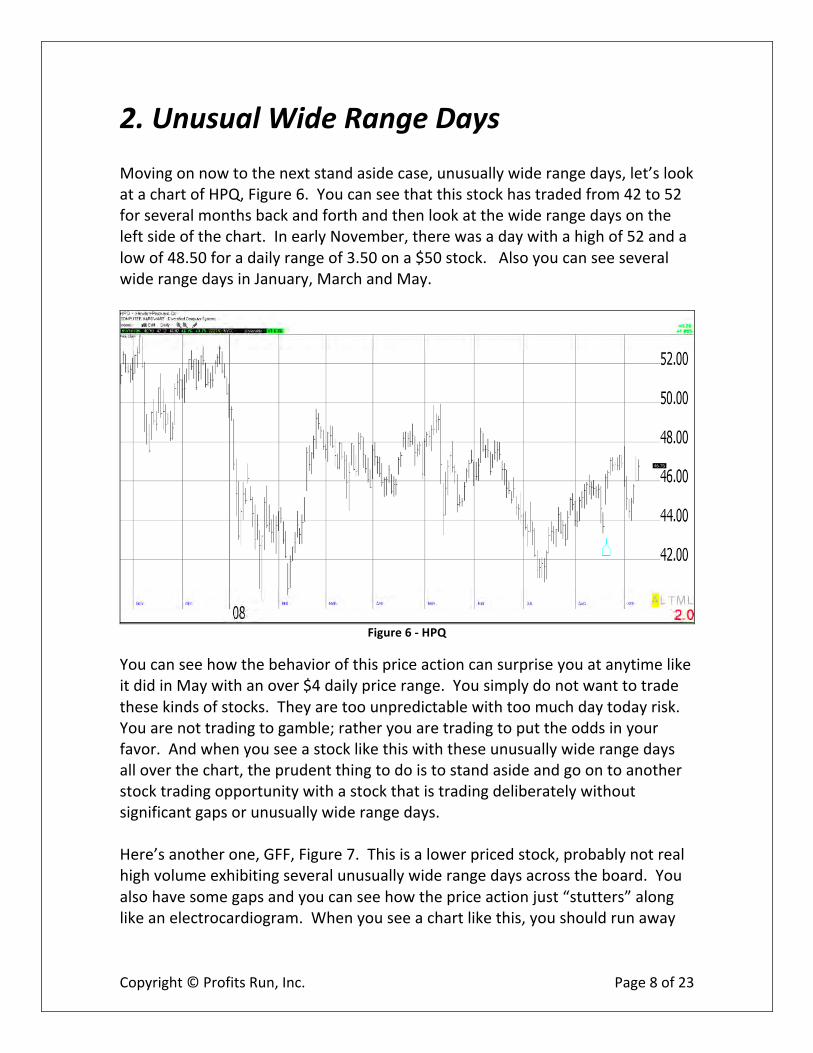
2. Unusual Wide Range Days Moving on now to the next stand aside case, unusually wide range days, let’s look at a chart of HPQ, Figure 6. You can see that this stock has traded from 42 to 52 for several months back and forth and then look at the wide range days on the left side of the chart. In early November, there was a day with a high of 52 and a low of 48.50 for a daily range of 3.50 on a $50 stock. Also you can see several wide range days in January, March and May.
Figure 6 -‐ HPQ
You can see how the behavior of this price action can surprise you at anytime like it did in May with an over $4 daily price range. You simply do not want to trade these kinds of stocks. They are too unpredictable with too much day today risk. You are not trading to gamble; rather you are trading to put the odds in your favor. And when you see a stock like this with these unusually wide range days all over the chart, the prudent thing to do is to stand aside and go on to another stock trading opportunity with a stock that is trading deliberately without significant gaps or unusually wide range days. Here’s another one, GFF, Figure 7. This is a lower priced stock, probably not real high volume exhibiting several unusually wide range days across the board. You also have some gaps and you can see how the price action just “stutters” along like an electrocardiogram. When you see a chart like this, you should run away

Copyright © Profits Run, Inc. Page 9 of 23
from it. Don’t trade this; it’s too unpredictable, lurching about with the risk/reward out of kilter.
Figure 7 -‐ GFF
Let’s look at ACIW, Figure 8. On this chart we see gaps and wide range days, including a $6 range in one day in August. Who wants to trade a stock with that kind of volatility?
Figure 8 -‐ ACIW
Copyright © Profits Run, Inc. Page 10 of 23
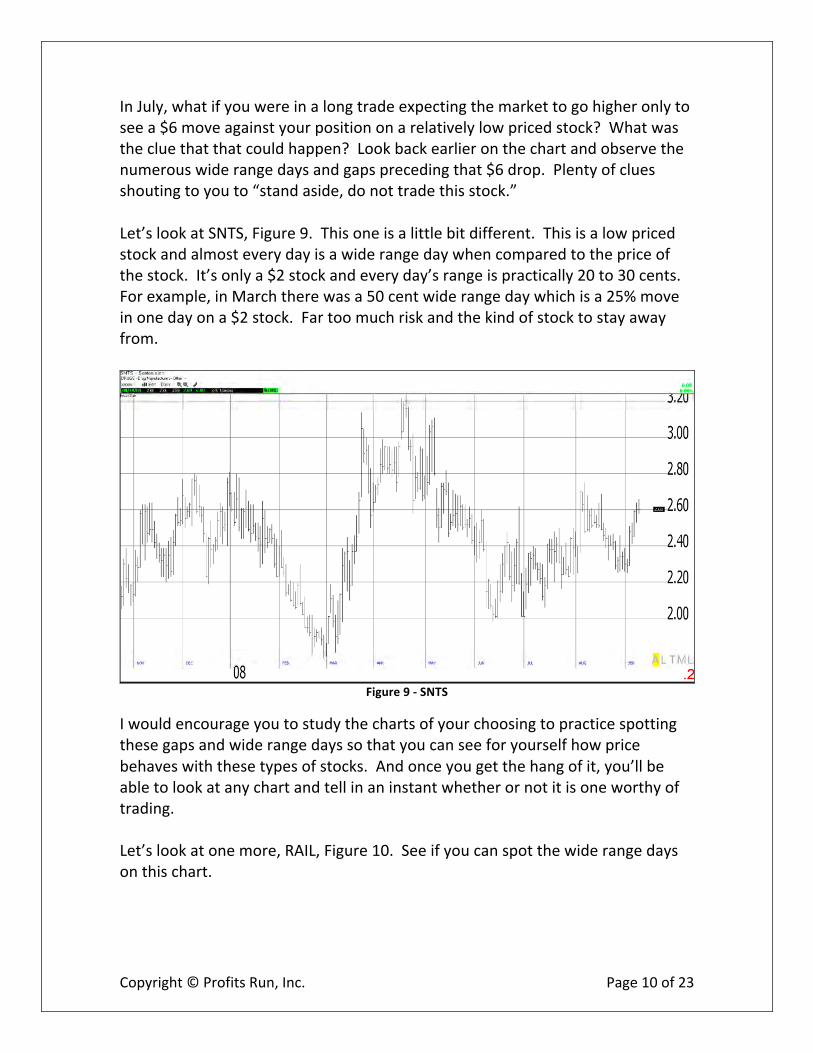
In July, what if you were in a long trade expecting the market to go higher only to see a $6 move against your position on a relatively low priced stock? What was the clue that that could happen? Look back earlier on the chart and observe the numerous wide range days and gaps preceding that $6 drop. Plenty of clues shouting to you to “stand aside, do not trade this stock.” Let’s look at SNTS, Figure 9. This one is a little bit different. This is a low priced stock and almost every day is a wide range day when compared to the price of the stock. It’s only a $2 stock and every day’s range is practically 20 to 30 cents. For example, in March there was a 50 cent wide range day which is a 25% move in one day on a $2 stock. Far too much risk and the kind of stock to stay away from.
Figure 9 -‐ SNTS
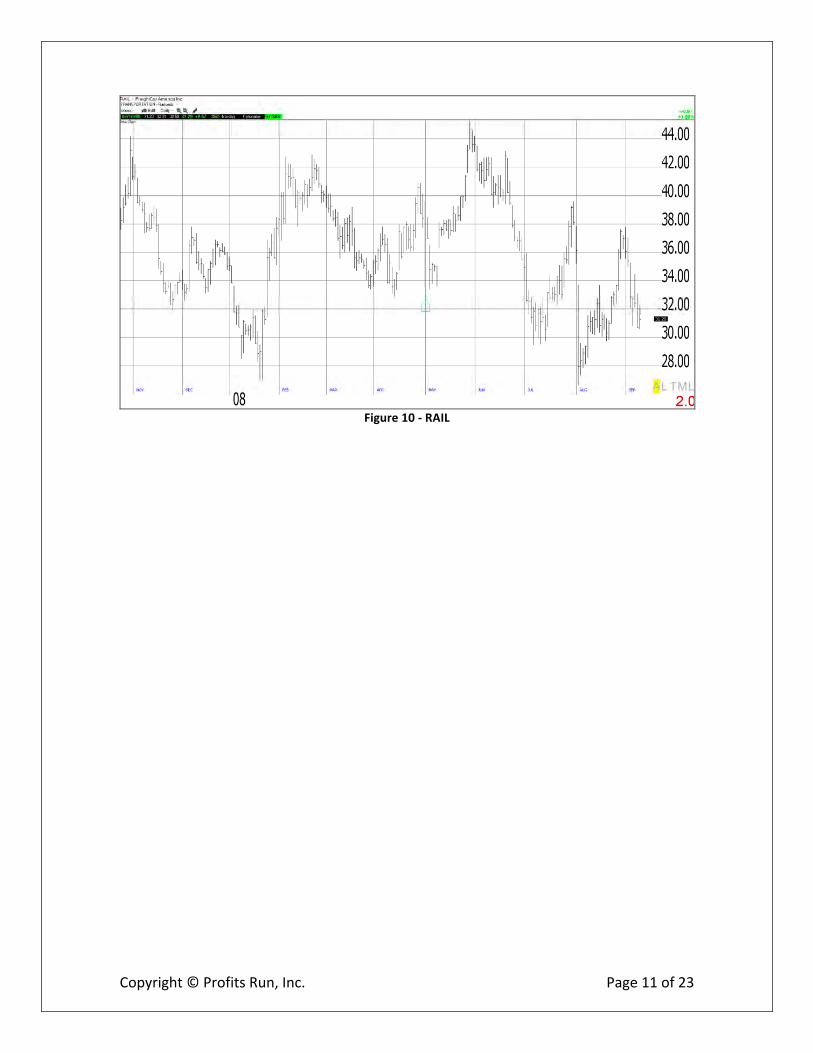
I would encourage you to study the charts of your choosing to practice spotting these gaps and wide range days so that you can see for yourself how price behaves with these types of stocks. And once you get the hang of it, you’ll be able to look at any chart and tell in an instant whether or not it is one worthy of trading. Let’s look at one more, RAIL, Figure 10. See if you can spot the wide range days on this chart.
Copyright © Profits Run, Inc. Page 11 of 23
Figure 10 -‐ RAIL
Copyright © Profits Run, Inc. Page 12 of 23
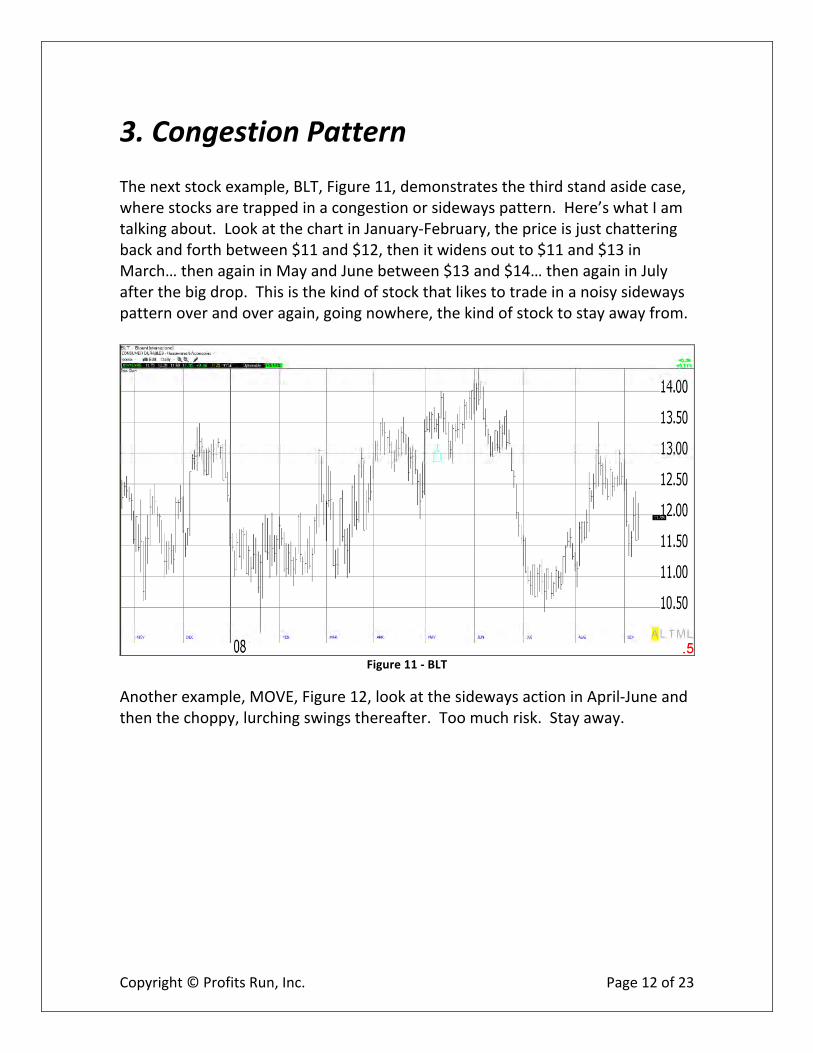
3. Congestion Pattern The next stock example, BLT, Figure 11, demonstrates the third stand aside case, where stocks are trapped in a congestion or sideways pattern. Here’s what I am talking about. Look at the chart in January-‐February, the price is just chattering back and forth between $11 and $12, then it widens out to $11 and $13 in March… then again in May and June between $13 and $14… then again in July after the big drop. This is the kind of stock that likes to trade in a noisy sideways pattern over and over again, going nowhere, the kind of stock to stay away from.
Figure 11 -‐ BLT
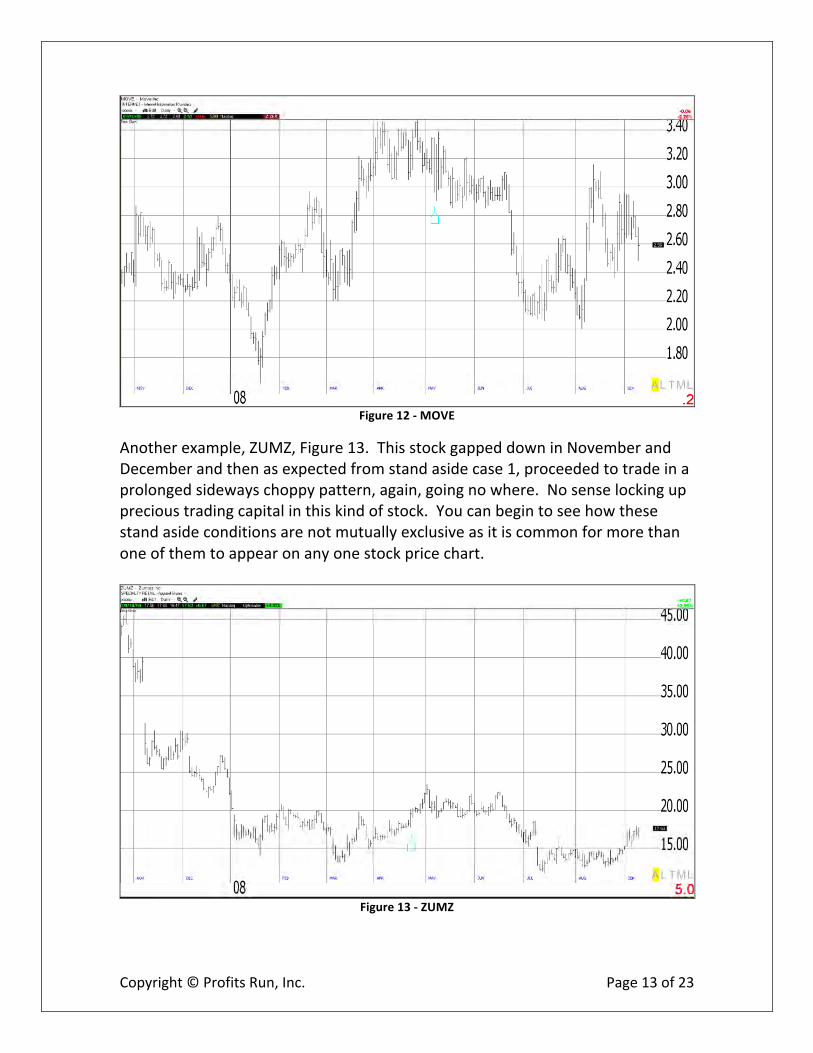
Another example, MOVE, Figure 12, look at the sideways action in April-‐June and then the choppy, lurching swings thereafter. Too much risk. Stay away.
Copyright © Profits Run, Inc. Page 13 of 23
Figure 12 -‐ MOVE
Another example, ZUMZ, Figure 13. This stock gapped down in November and December and then as expected from stand aside case 1, proceeded to trade in a prolonged sideways choppy pattern, again, going no where. No sense locking up precious trading capital in this kind of stock. You can begin to see how these stand aside conditions are not mutually exclusive as it is common for more than one of them to appear on any one stock price chart.
Figure 13 -‐ ZUMZ
Copyright © Profits Run, Inc. Page 14 of 23
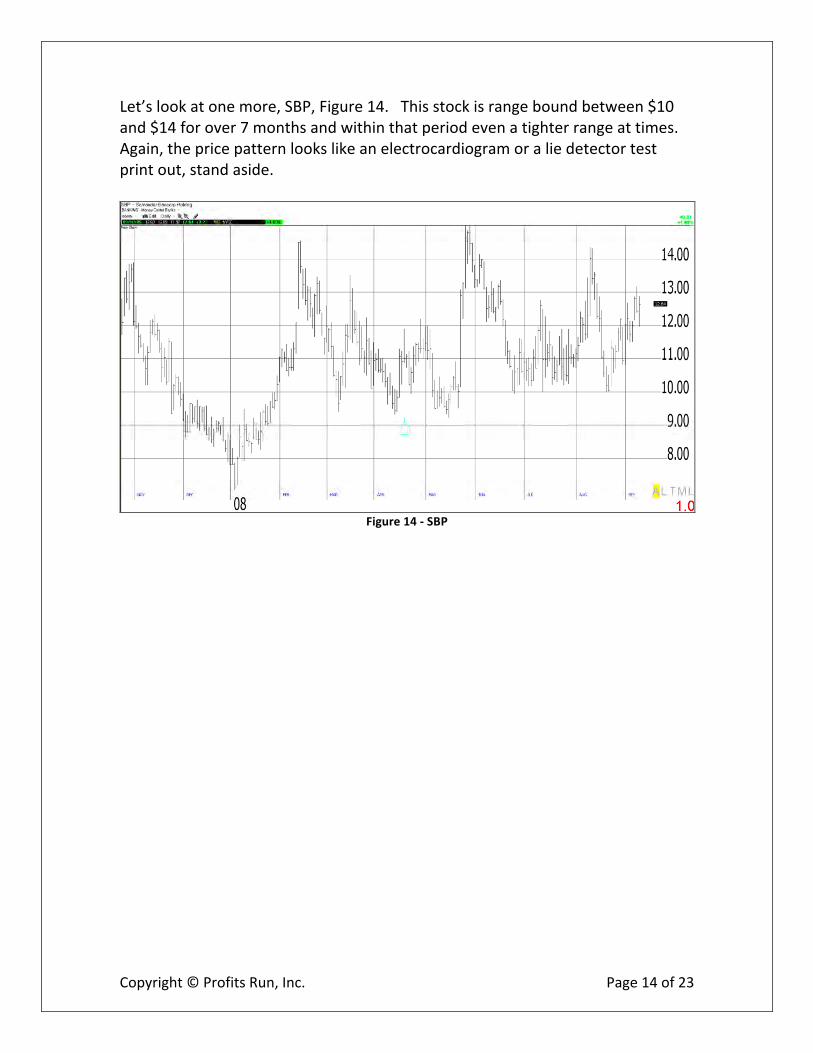
Let’s look at one more, SBP, Figure 14. This stock is range bound between $10 and $14 for over 7 months and within that period even a tighter range at times. Again, the price pattern looks like an electrocardiogram or a lie detector test print out, stand aside.
Figure 14 -‐ SBP
Copyright © Profits Run, Inc. Page 15 of 23
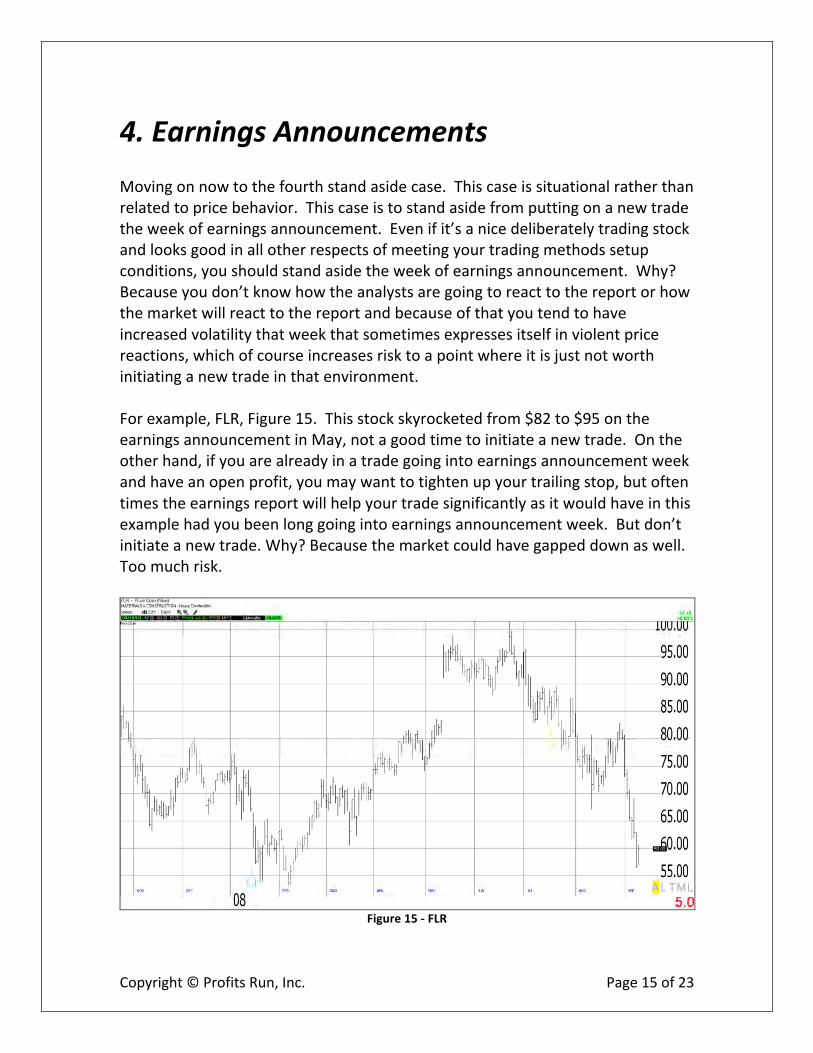
4. Earnings Announcements Moving on now to the fourth stand aside case. This case is situational rather than related to price behavior. This case is to stand aside from putting on a new trade the week of earnings announcement. Even if it’s a nice deliberately trading stock and looks good in all other respects of meeting your trading methods setup conditions, you should stand aside the week of earnings announcement. Why? Because you don’t know how the analysts are going to react to the report or how the market will react to the report and because of that you tend to have increased volatility that week that sometimes expresses itself in violent price reactions, which of course increases risk to a point where it is just not worth initiating a new trade in that environment. For example, FLR, Figure 15. This stock skyrocketed from $82 to $95 on the earnings announcement in May, not a good time to initiate a new trade. On the other hand, if you are already in a trade going into earnings announcement week and have an open profit, you may want to tighten up your trailing stop, but often times the earnings report will help your trade significantly as it would have in this example had you been long going into earnings announcement week. But don’t initiate a new trade. Why? Because the market could have gapped down as well. Too much risk.
Figure 15 -‐ FLR
Copyright © Profits Run, Inc. Page 16 of 23
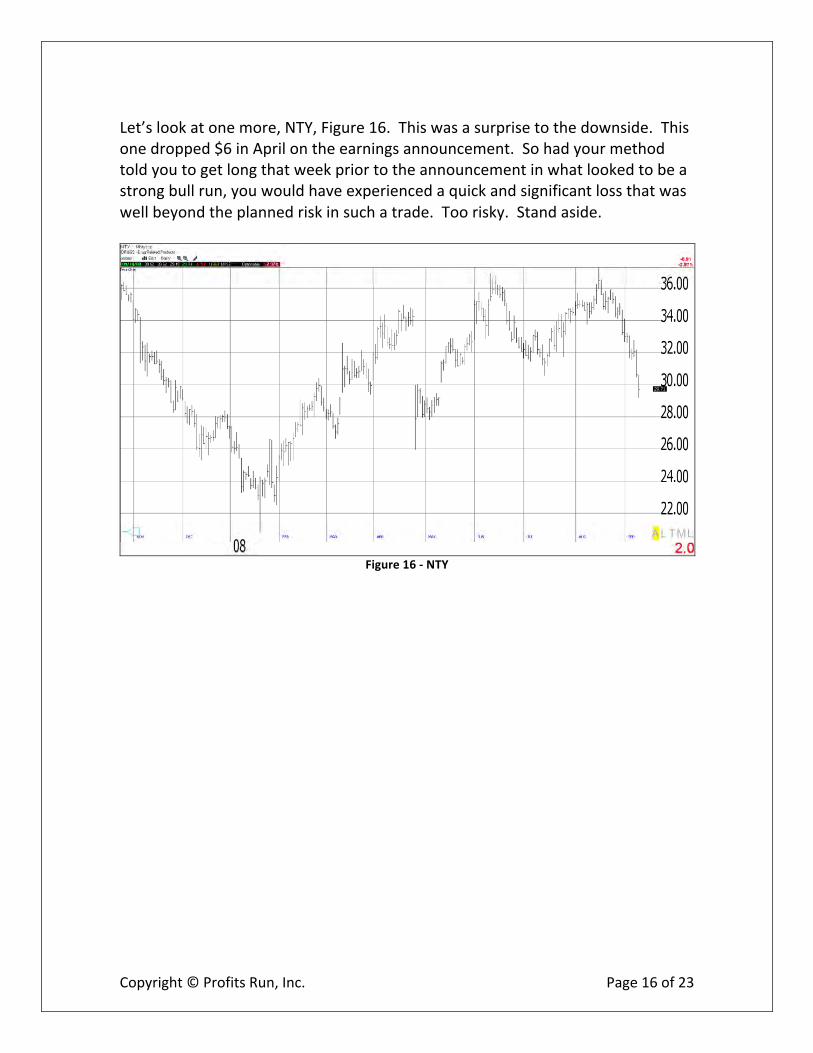
Let’s look at one more, NTY, Figure 16. This was a surprise to the downside. This one dropped $6 in April on the earnings announcement. So had your method told you to get long that week prior to the announcement in what looked to be a strong bull run, you would have experienced a quick and significant loss that was well beyond the planned risk in such a trade. Too risky. Stand aside.
Figure 16 -‐ NTY
Copyright © Profits Run, Inc. Page 17 of 23
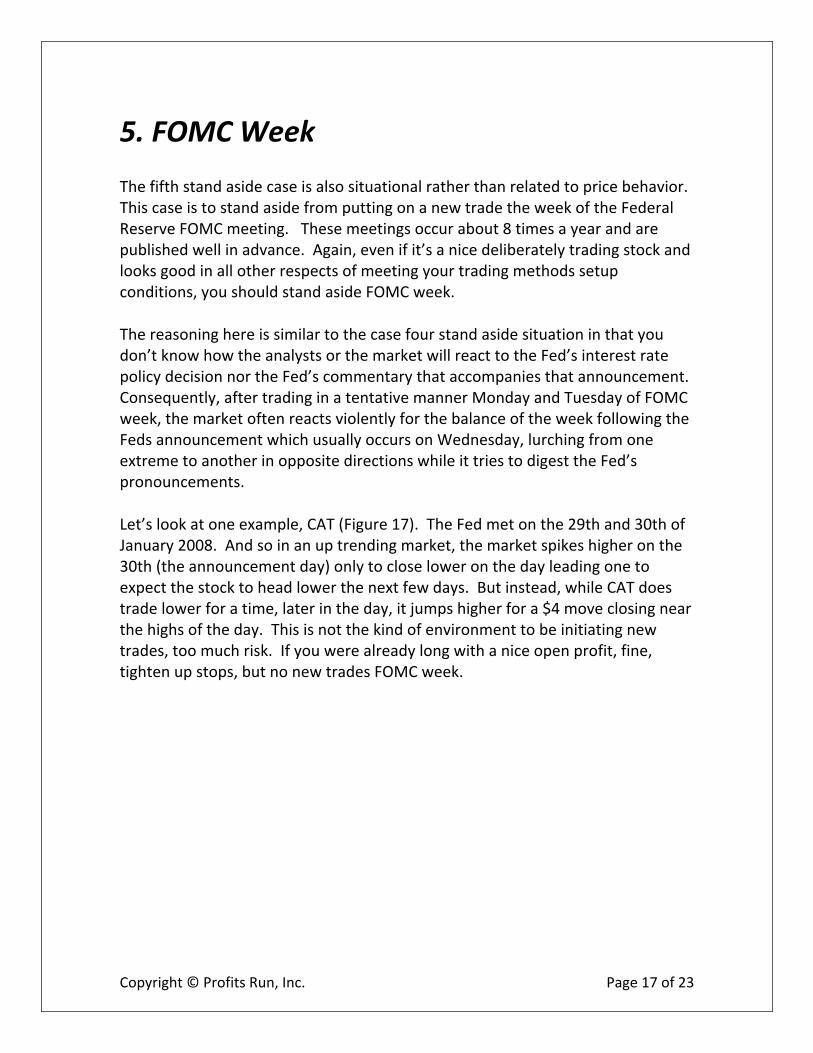
5. FOMC Week The fifth stand aside case is also situational rather than related to price behavior. This case is to stand aside from putting on a new trade the week of the Federal Reserve FOMC meeting. These meetings occur about 8 times a year and are published well in advance. Again, even if it’s a nice deliberately trading stock and looks good in all other respects of meeting your trading methods setup conditions, you should stand aside FOMC week. The reasoning here is similar to the case four stand aside situation in that you don’t know how the analysts or the market will react to the Fed’s interest rate policy decision nor the Fed’s commentary that accompanies that announcement. Consequently, after trading in a tentative manner Monday and Tuesday of FOMC week, the market often reacts violently for the balance of the week following the Feds announcement which usually occurs on Wednesday, lurching from one extreme to another in opposite directions while it tries to digest the Fed’s pronouncements. Let’s look at one example, CAT (Figure 17). The Fed met on the 29th and 30th of January 2008. And so in an up trending market, the market spikes higher on the 30th (the announcement day) only to close lower on the day leading one to expect the stock to head lower the next few days. But instead, while CAT does trade lower for a time, later in the day, it jumps higher for a $4 move closing near the highs of the day. This is not the kind of environment to be initiating new trades, too much risk. If you were already long with a nice open profit, fine, tighten up stops, but no new trades FOMC week.
Copyright © Profits Run, Inc. Page 18 of 23
Figure 17 -‐ CAT
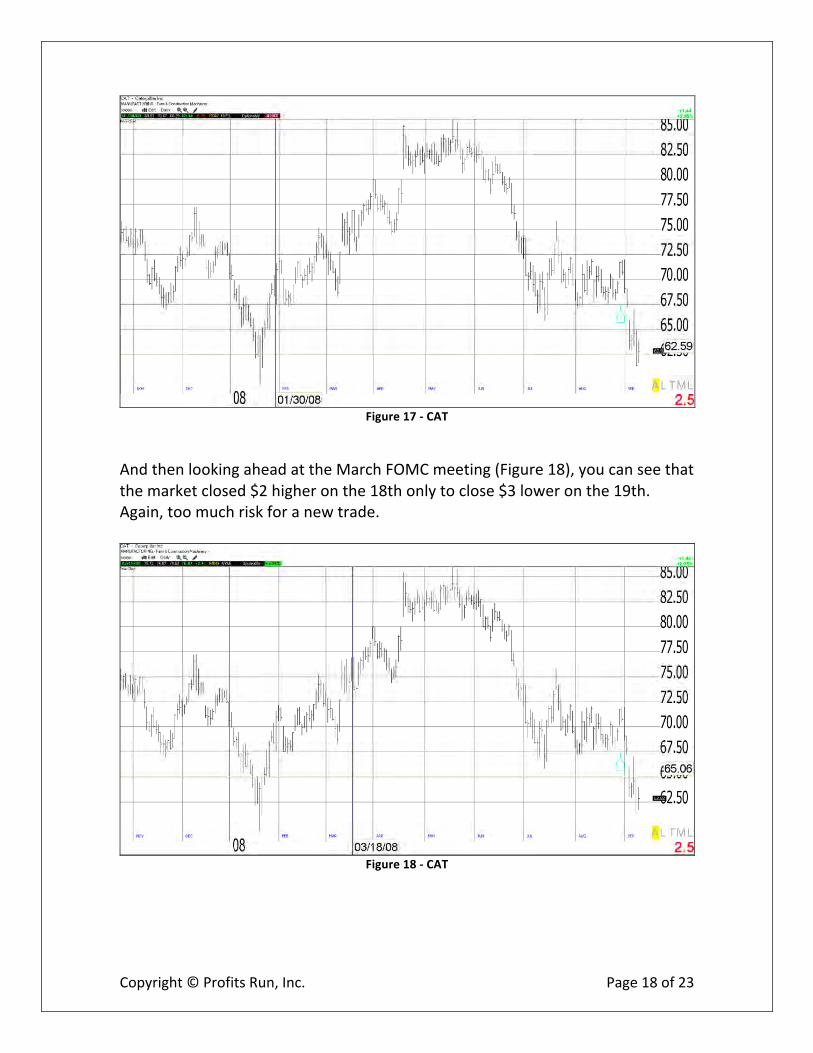
And then looking ahead at the March FOMC meeting (Figure 18), you can see that the market closed $2 higher on the 18th only to close $3 lower on the 19th. Again, too much risk for a new trade.
Figure 18 -‐ CAT
Copyright © Profits Run, Inc. Page 19 of 23
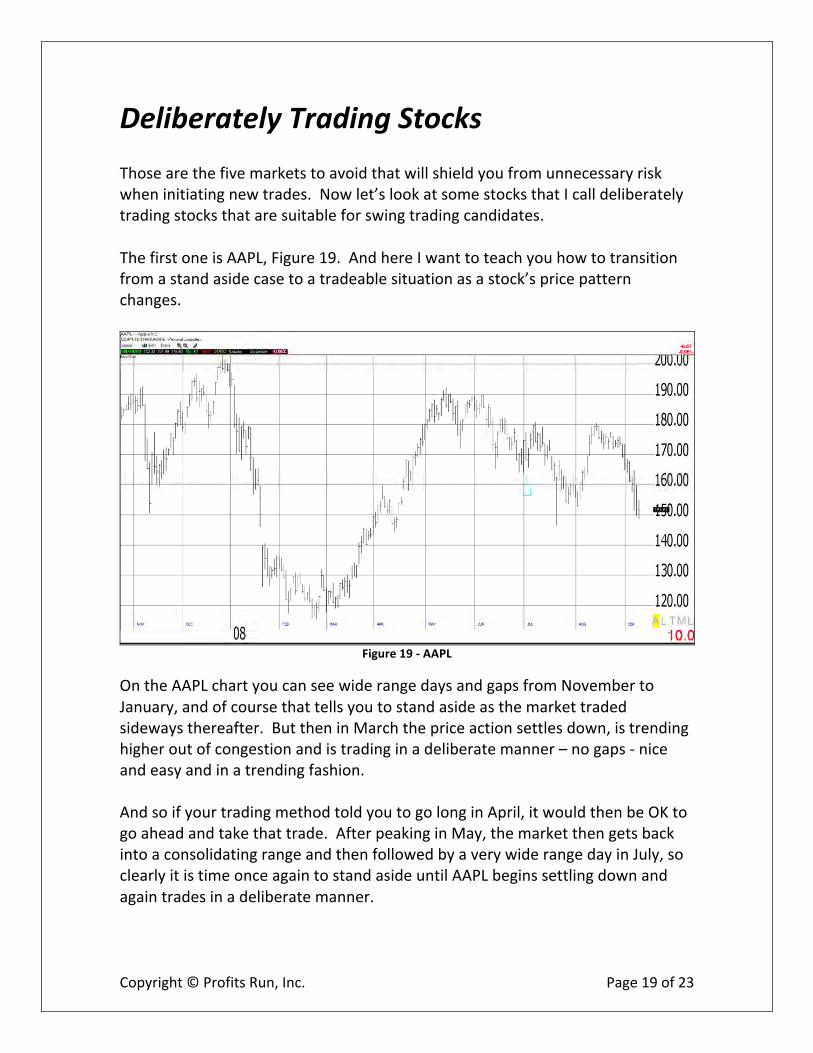
Deliberately Trading Stocks Those are the five markets to avoid that will shield you from unnecessary risk when initiating new trades. Now let’s look at some stocks that I call deliberately trading stocks that are suitable for swing trading candidates. The first one is AAPL, Figure 19. And here I want to teach you how to transition from a stand aside case to a tradeable situation as a stock’s price pattern changes.
Figure 19 -‐ AAPL
On the AAPL chart you can see wide range days and gaps from November to January, and of course that tells you to stand aside as the market traded sideways thereafter. But then in March the price action settles down, is trending higher out of congestion and is trading in a deliberate manner – no gaps -‐ nice and easy and in a trending fashion. And so if your trading method told you to go long in April, it would then be OK to go ahead and take that trade. After peaking in May, the market then gets back into a consolidating range and then followed by a very wide range day in July, so clearly it is time once again to stand aside until AAPL begins settling down and again trades in a deliberate manner.
Copyright © Profits Run, Inc. Page 20 of 23
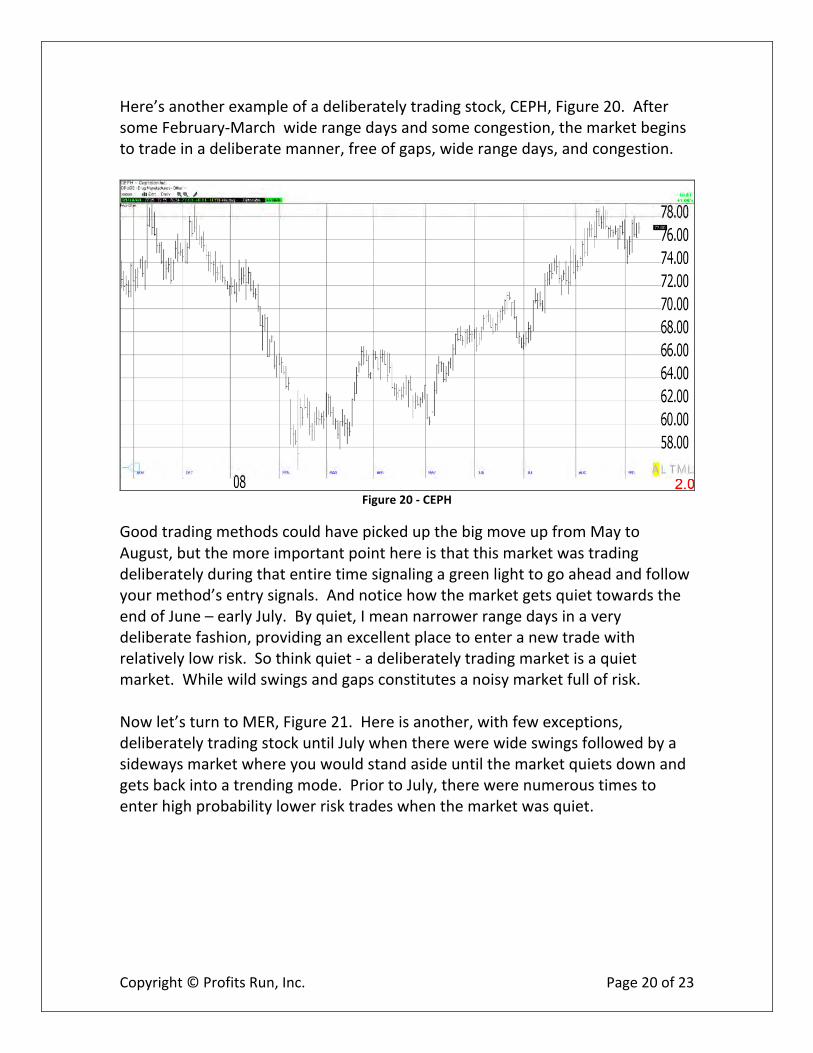
Here’s another example of a deliberately trading stock, CEPH, Figure 20. After some February-‐March wide range days and some congestion, the market begins to trade in a deliberate manner, free of gaps, wide range days, and congestion.
Figure 20 -‐ CEPH
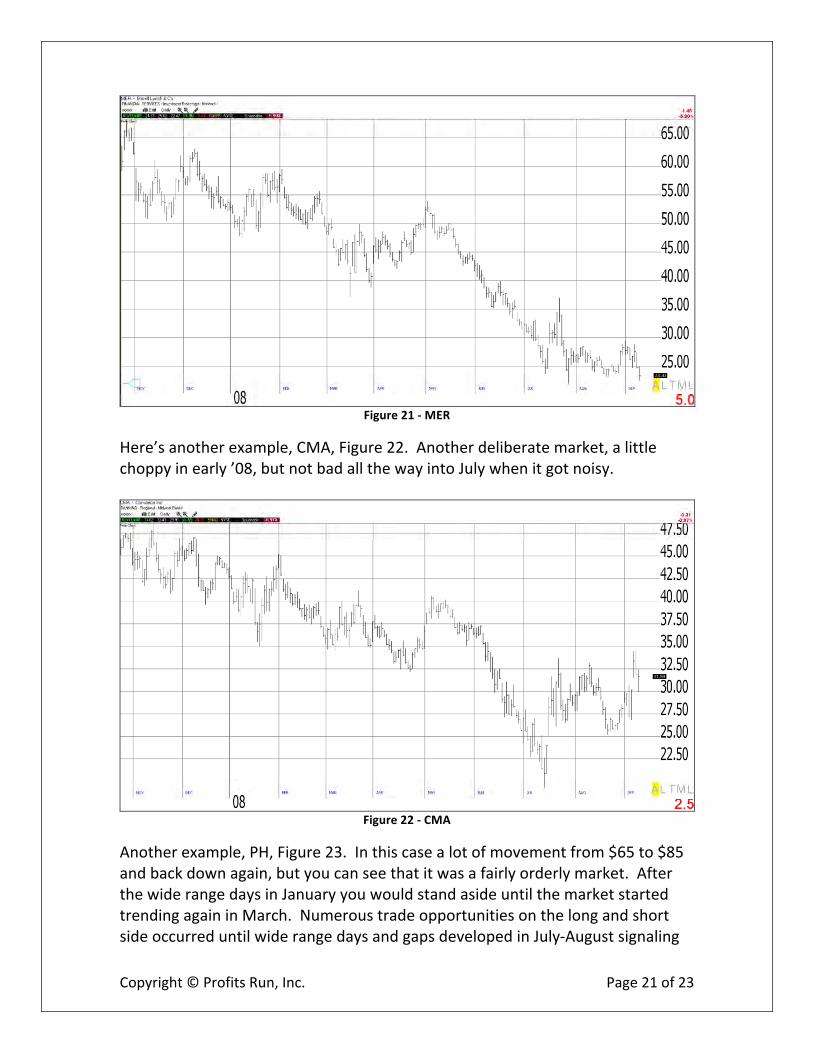
Good trading methods could have picked up the big move up from May to August, but the more important point here is that this market was trading deliberately during that entire time signaling a green light to go ahead and follow your method’s entry signals. And notice how the market gets quiet towards the end of June – early July. By quiet, I mean narrower range days in a very deliberate fashion, providing an excellent place to enter a new trade with relatively low risk. So think quiet -‐ a deliberately trading market is a quiet market. While wild swings and gaps constitutes a noisy market full of risk. Now let’s turn to MER, Figure 21. Here is another, with few exceptions, deliberately trading stock until July when there were wide swings followed by a sideways market where you would stand aside until the market quiets down and gets back into a trending mode. Prior to July, there were numerous times to enter high probability lower risk trades when the market was quiet.
Copyright © Profits Run, Inc. Page 21 of 23
Figure 21 -‐ MER
Here’s another example, CMA, Figure 22. Another deliberate market, a little choppy in early ’08, but not bad all the way into July when it got noisy.
Figure 22 -‐ CMA
Another example, PH, Figure 23. In this case a lot of movement from $65 to $85 and back down again, but you can see that it was a fairly orderly market. After the wide range days in January you would stand aside until the market started trending again in March. Numerous trade opportunities on the long and short side occurred until wide range days and gaps developed in July-‐August signaling

Copyright © Profits Run, Inc. Page 22 of 23
that it was time to stand aside. I hope you are getting the ebb and flow of the markets from noisy to quiet and back to noisy and therefore when it’s OK to trade and when it is better not to trade.
Figure 23 -‐ PH
Look at TSO, Figure 24 -‐ almost a perfect deliberately trading market for months on end providing numerous great shorting opportunities.
Figure 24 -‐ TSO

Copyright © Profits Run, Inc. Page 23 of 23
So, in summary, you can think of the five markets to avoid covered in this report as your own personal trading Risk Shield. This Risk Shield should minimize your exposure to higher risk markets and consequently should put the odds in your favor from what they would otherwise be. And with that Risk Shield, you’ll be able to identify those markets that are appropriate, that are trading deliberately, that set up high-‐probability, lower-‐risk entry points when the markets are quiet and greatly enhance the opportunity for trading success. The Risk Shield will help you in your trading regardless of what trading methods you use. Good Trading,
Bill Poulos

About The Author
Bill Poulos was born and raised in Detroit, Michigan to
a lower middle class family, who were first generation
Greek immigrants, and he had to work pretty hard to
get where he's at today.
His parents taught him good old-fashioned Midwest
sensibilities and instilled a strong work ethic in him at a
young age. In fact, in 1960, he became the youngest
Eagle Scout in the Detroit area at the time.
He went on to get an engineering degree from General
Motors Institute and that's where he ended up working
for 36 years before retiring 12 years early in 2001 at age 53. While at General Motors, Bill
started out on the assembly line and worked his way up the corporate ladder over his long and
successful career, having traveled and lived all over the world, including Japan, Germany,
England, Brazil, and other countries.
His hobby, though, was always trading the markets,
which he began to seriously study in 1974. Because he
was trained as an engineer, he found the challenge of
trading a lot of fun and he still does, even today.
Long before home computers, Bill had subscriptions to
printed market data that would be delivered daily to his
home. After returning home from a long day of work,
Bill would eat dinner with his family, tuck his kids into
bed, and then disappear into his tiny den in the corner
of the house. With a pot of black coffee, a straight

edge, a magnifying glass, and a calculator, Bill spent hours analyzing price action and market
data. These late-night sessions were the seeds of the core trading principles that became the basis
for his trading programs that he later developed.
Bill also ended up getting his
master's degree from the
University of Michigan with a
focus in finance. While it helped
with his career at General
Motors, it also helped him as a
trader because he's always
thought about trading as a
business.
The same year that he retired,
Bill started his financial
education company with his son, Greg. They named it Profits Run after the saying, "cut your
losses and let your profits run", which most traders know well.
They literally started it from the kitchen table. One
night in the year 2000, Greg was visiting his parents for
dinner. The company he was working for was about to
close their Michigan office, and Bill was less than a
year from retiring, so they would both soon be without
jobs. Greg had watched his father master the art and
science of trading over the years and had always
wanted to start a small business of his own. That's
when he asked Bill, "Why don't we start a business to
help others learn what took you years to figure out?" A
year later, Profits Run was born.
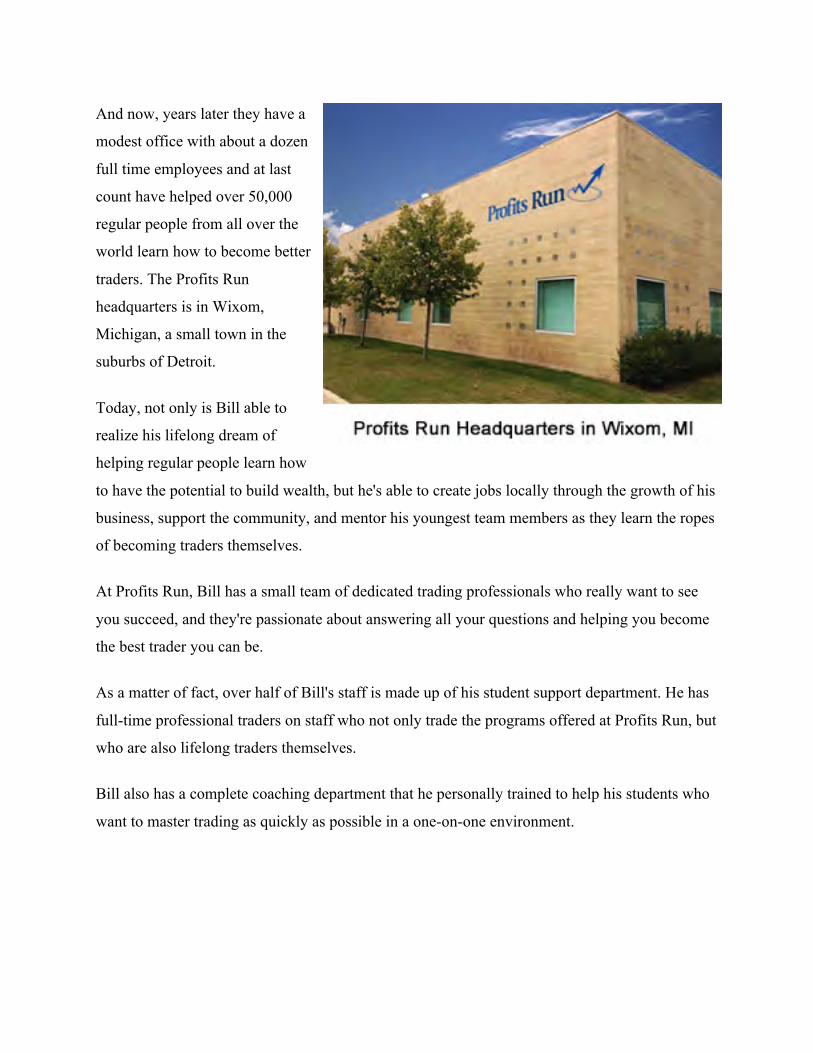
And now, years later they have a
modest office with about a dozen
full time employees and at last
count have helped over 50,000
regular people from all over the
world learn how to become better
traders. The Profits Run
headquarters is in Wixom,
Michigan, a small town in the
suburbs of Detroit.
Today, not only is Bill able to
realize his lifelong dream of
helping regular people learn how
to have the potential to build wealth, but he's able to create jobs locally through the growth of his
business, support the community, and mentor his youngest team members as they learn the ropes
of becoming traders themselves.
At Profits Run, Bill has a small team of dedicated trading professionals who really want to see
you succeed, and they're passionate about answering all your questions and helping you become
the best trader you can be.
As a matter of fact, over half of Bill's staff is made up of his student support department. He has
full-time professional traders on staff who not only trade the programs offered at Profits Run, but
who are also lifelong traders themselves.
Bill also has a complete coaching department that he personally trained to help his students who
want to master trading as quickly as possible in a one-on-one environment.
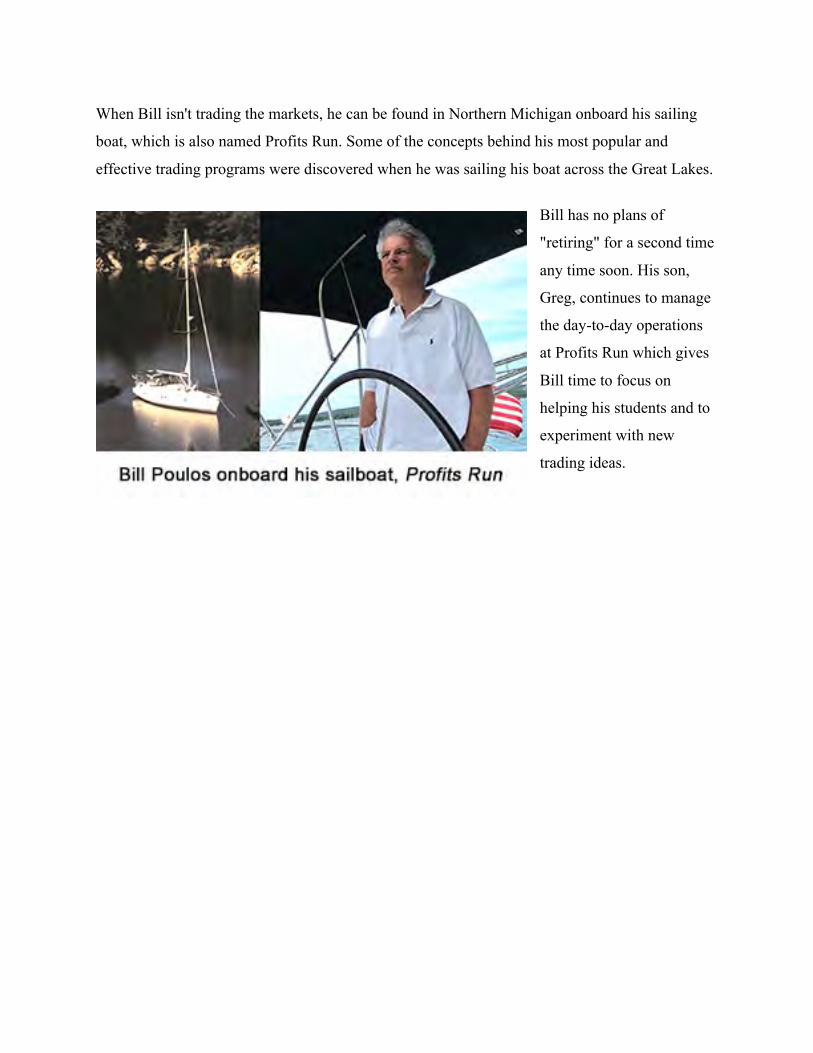
When Bill isn't trading the markets, he can be found in Northern Michigan onboard his sailing
boat, which is also named Profits Run. Some of the concepts behind his most popular and
effective trading programs were discovered when he was sailing his boat across the Great Lakes.
Bill has no plans of
"retiring" for a second time
any time soon. His son,
Greg, continues to manage
the day-to-day operations
at Profits Run which gives
Bill time to focus on
helping his students and to
experiment with new
trading ideas.

Copyright © by Profits Run, Inc.
All rights reserved. No part of this publication may be reproduced or transmitted in any form or by any means, electronic, or mechanical, including photocopying, recording, or by any
information storage and retrieval system.
Published by: Profits Run, Inc.
28339 Beck Rd Unit F1 Wixom, MI 48393
www.profitsrun.com