Disclaimer: Forward Looking Statements - Kerry Group · other things, the ompany’s strategy,...
50
Transcript of Disclaimer: Forward Looking Statements - Kerry Group · other things, the ompany’s strategy,...

Disclaimer: Forward Looking Statements
This presentation/announcement may contain forward looking statements with projections regarding, among other things, the Company’s strategy, revenues, earnings, trading profit, trading margin, finance costs, tax rate, capital expenditure, dividends, cash flow, net debt or other financial measures, the impact of foreign exchange fluctuations, the impact of raw material fluctuations and other competitive pressures. These and other forward looking statements reflect management expectations based on currently available data.
However actual results will be influenced by, among other things, macro-economic conditions, food industry supply and demand issues, foreign exchange fluctuations, raw material and commodity fluctuations, the successful acquisition and integration of new businesses, the successful execution of business transformation programmes and other, as of today, unknown factors and therefore actual results may differ materially from these projections.
These forward looking statements speak only as of the date they were made and the Company undertakes no obligation to publicly update any forward looking statement, whether as a result of new information, future events or otherwise.
2

2015 Preliminary Statement of Results
Stan McCarthyCEO Kerry Group
Review of Business
Brian MehiganCFO Kerry Group
Financial Review
1
2
Outlook & Future Prospects
3
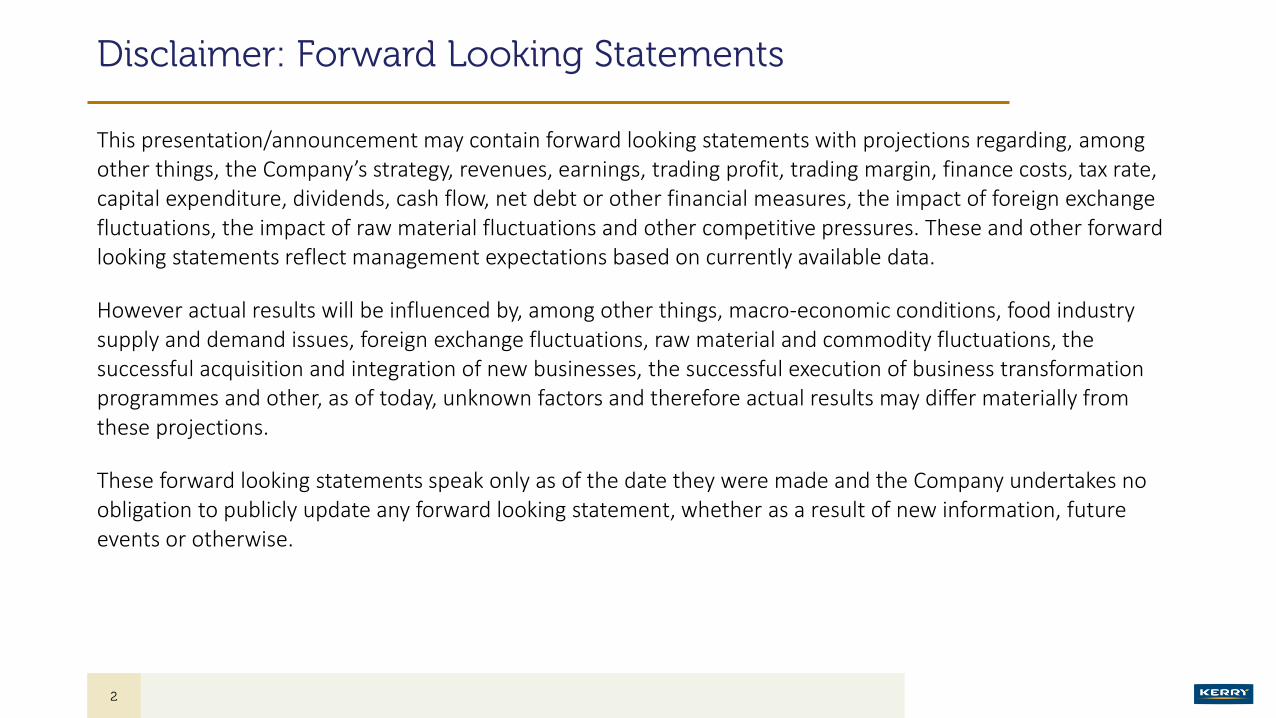
2015 Full Year Highlights
Adjusted EPS*
+8.2%Volume
+3.8%Group Trading
Margin
+40bpsROACE*
13.6%Free Cash
Flow
€453mTotal Dividend
+11.1%
Consolidating Kerry’s global infrastructure and expanding our technology and market footprint
Group Model & Strategy Delivers
3.8% Volume Growth
Trading Margin +40bps to 11.5%
Outperforming Market Growth Rates
ROACE 13.6%
Free Cash Flow €453m
Strong Financial Performance
Adjusted EPS* up 8.2% to 301.9 cent
Variable economic growth
Significant commodity and currency volatility
Record year of business development in tough trading environment
4 Note: * before brand related intangible asset amortisation and non-trading items (net of related tax)
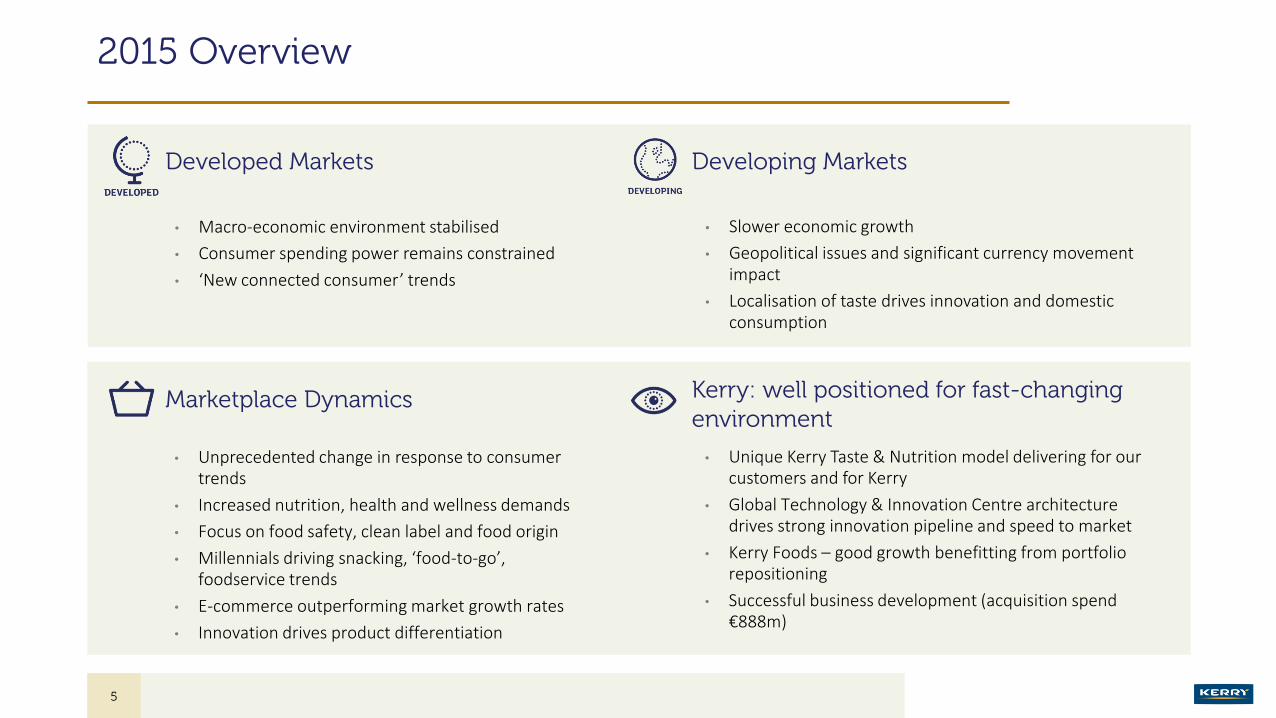
2015 Overview
Developed Markets
Marketplace Dynamics
Developing Markets
Kerry: well positioned for fast-changing environment
• Macro-economic environment stabilised
• Consumer spending power remains constrained
• ‘New connected consumer’ trends
• Unprecedented change in response to consumer trends
• Increased nutrition, health and wellness demands
• Focus on food safety, clean label and food origin
• Millennials driving snacking, ‘food-to-go’, foodservice trends
• E-commerce outperforming market growth rates
• Innovation drives product differentiation
• Slower economic growth
• Geopolitical issues and significant currency movement impact
• Localisation of taste drives innovation and domestic consumption
• Unique Kerry Taste & Nutrition model delivering for our customers and for Kerry
• Global Technology & Innovation Centre architecture drives strong innovation pipeline and speed to market
• Kerry Foods – good growth benefitting from portfolio repositioning
• Successful business development (acquisition spend €888m)
5
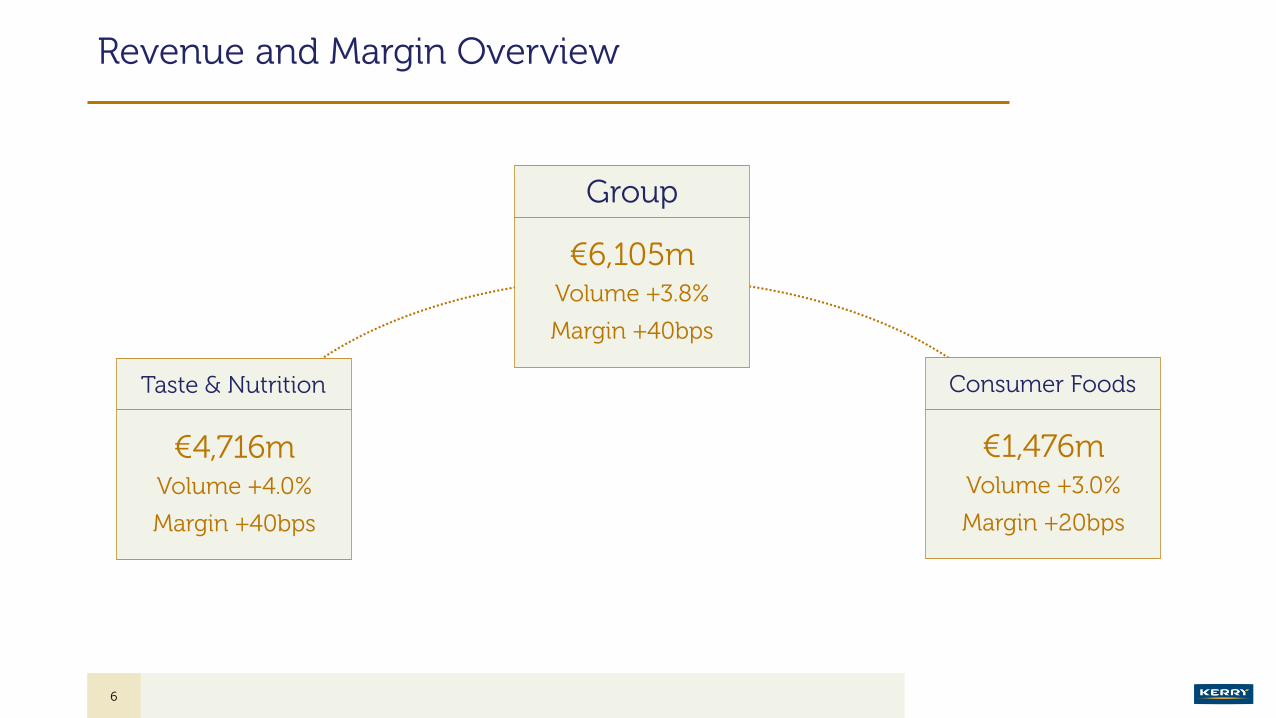
Revenue and Margin Overview
€6,105mVolume +3.8%
Margin +40bps
Group
€4,716mVolume +4.0%
Margin +40bps
Taste & Nutrition
€1,476mVolume +3.0%
Margin +20bps
Consumer Foods
6
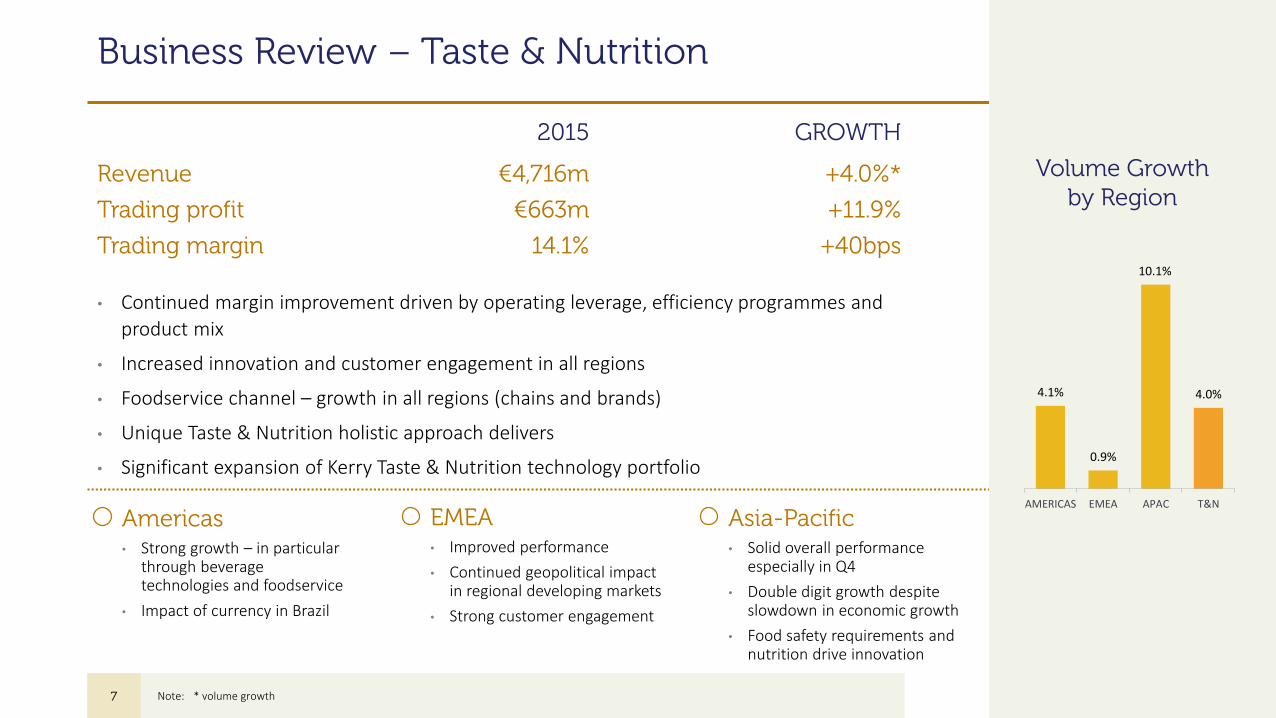
Business Review – Taste & Nutrition
• Continued margin improvement driven by operating leverage, efficiency programmes and
product mix
• Increased innovation and customer engagement in all regions
• Foodservice channel – growth in all regions (chains and brands)
• Unique Taste & Nutrition holistic approach delivers
• Significant expansion of Kerry Taste & Nutrition technology portfolio
2015 GROWTH
Revenue €4,716m +4.0%*
Trading profit €663m +11.9%
Trading margin 14.1% +40bps
Americas EMEA Asia-Pacific
4.1%
0.9%
10.1%
4.0%
AMERICAS EMEA APAC T&N
Volume Growth by Region
7
• Strong growth – in particular through beverage technologies and foodservice
• Impact of currency in Brazil
• Improved performance
• Continued geopolitical impact in regional developing markets
• Strong customer engagement
• Solid overall performance especially in Q4
• Double digit growth despite slowdown in economic growth
• Food safety requirements and nutrition drive innovation
Note: * volume growth

Our Taste & Nutrition Business Today
8
+3.4%Savoury & Dairy
Systems & Flavours
+8.6%Beverage Systems
& Flavours
(1.4%)Cereal & Sweet
Systems & Flavours
+8.5%Pharma/Functional
Ingredients
Regional Ingredients
24% Beverage
18% Meats
9% Dairy
9% Bakery
6% Cereal & Bars
6% Soups, Sauces & Dressings
5% Ice-cream & Desserts
5% Prepared Meals & Side
Dishes
5% Savoury Snacks
5% Pharma
4% Confectionery
2% Appetisers
2% Others
End Use MarketTechnology
Year On Year Volume Growth Revenue By End Use Market
Developed 74%
Developing 26%
50% 33% 17%
Americas EMEA Asia-Pacific
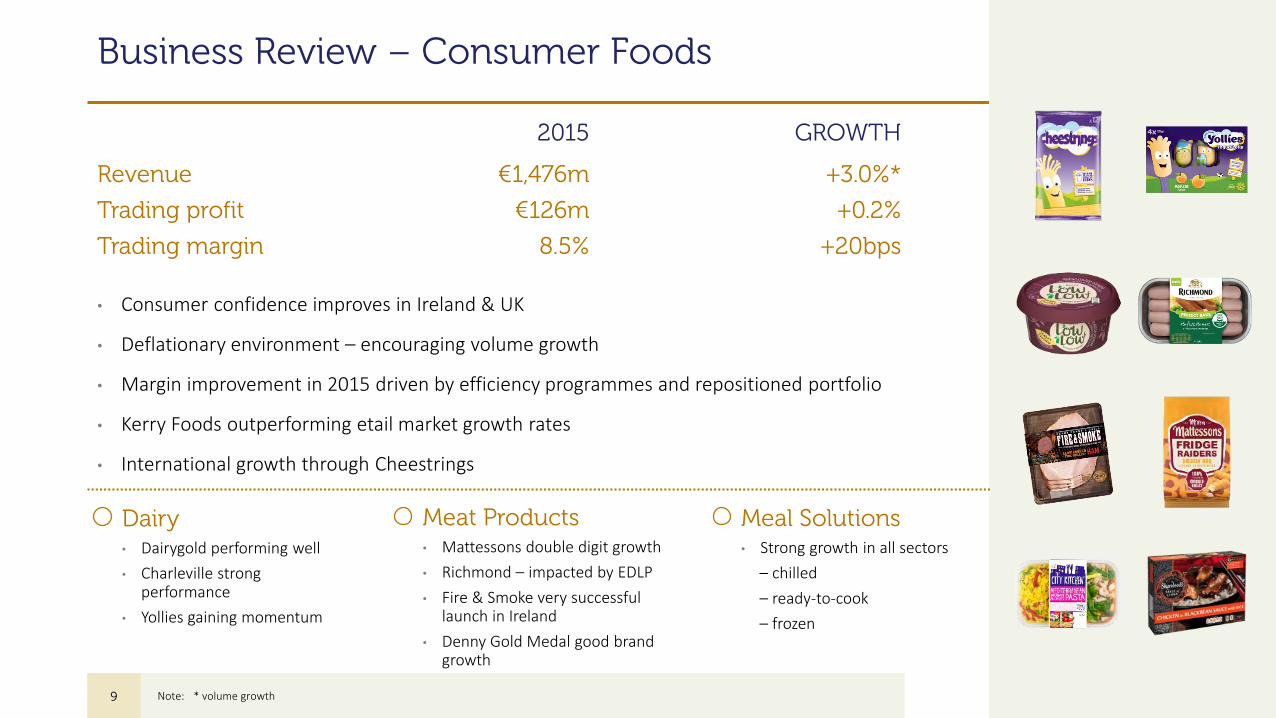
Business Review – Consumer Foods
• Consumer confidence improves in Ireland & UK
• Deflationary environment – encouraging volume growth
• Margin improvement in 2015 driven by efficiency programmes and repositioned portfolio
• Kerry Foods outperforming etail market growth rates
• International growth through Cheestrings
2015 GROWTH
Revenue €1,476m +3.0%*
Trading profit €126m +0.2%
Trading margin 8.5% +20bps
9
Dairy• Dairygold performing well
• Charleville strong performance
• Yollies gaining momentum
Meat Products• Mattessons double digit growth
• Richmond – impacted by EDLP
• Fire & Smoke very successful launch in Ireland
• Denny Gold Medal good brand growth
Meal Solutions• Strong growth in all sectors
– chilled
– ready-to-cook
– frozen
Note: * volume growth
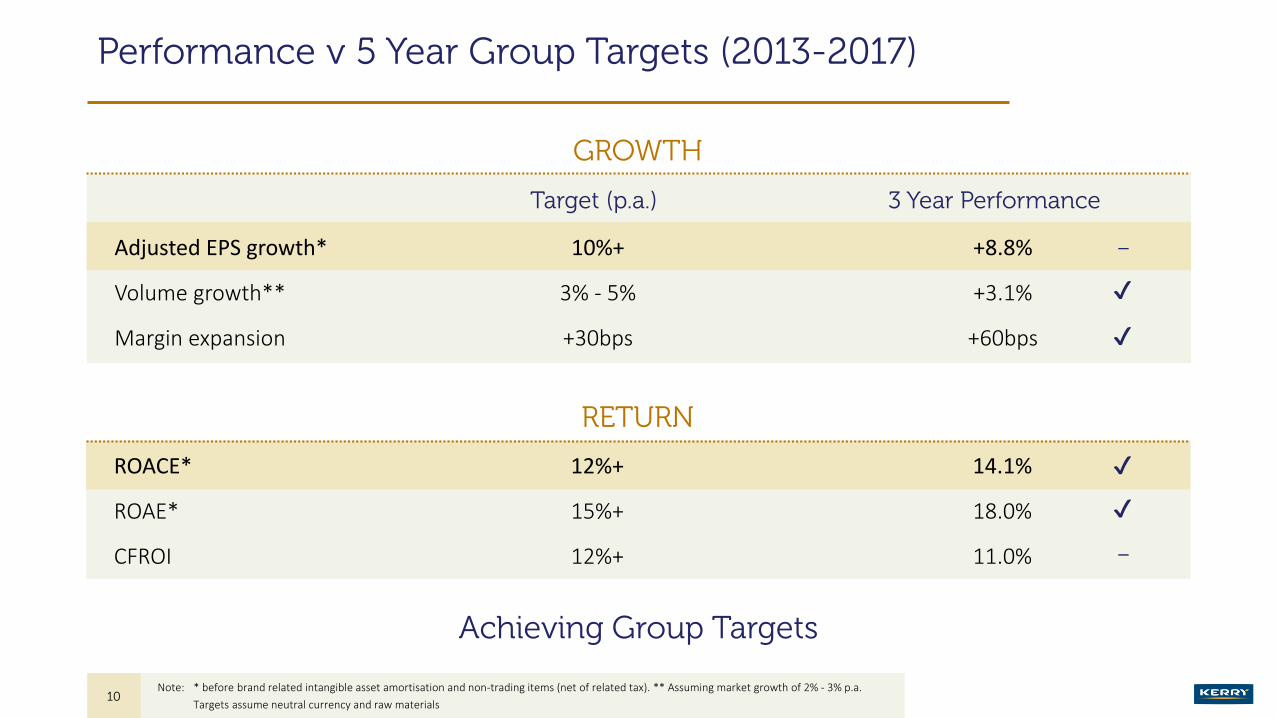
Performance v 5 Year Group Targets (2013-2017)
Target (p.a.) 3 Year Performance
Adjusted EPS growth* 10%+ +8.8%
Volume growth** 3% - 5% +3.1%
Margin expansion +30bps +60bps
RETURN
ROACE* 12%+ 14.1%
ROAE* 15%+ 18.0%
CFROI 12%+ 11.0%
Achieving Group Targets
✔
✔
✔
–
✔
10
GROWTH
Note: * before brand related intangible asset amortisation and non-trading items (net of related tax). ** Assuming market growth of 2% - 3% p.a.
Targets assume neutral currency and raw materials
–
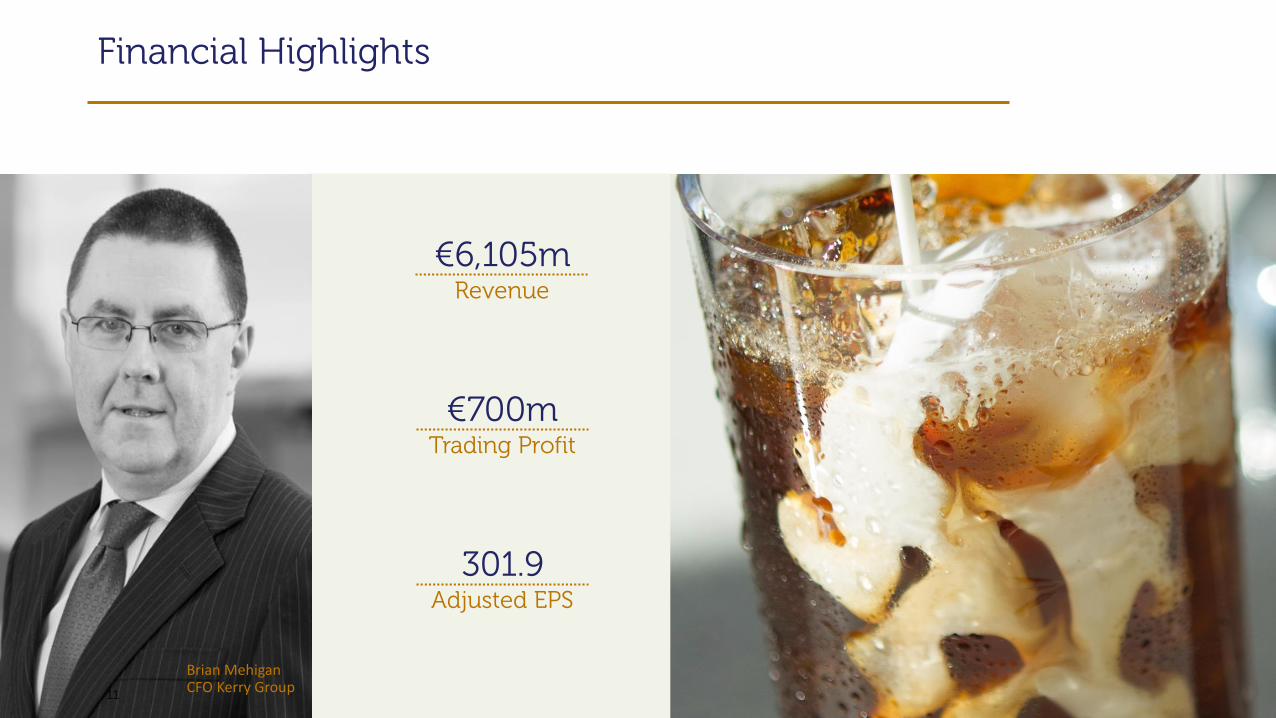
Financial Highlights
Revenue
€6,105m
Trading Profit
€700m
Adjusted EPS
301.9
Brian MehiganCFO Kerry Group
11
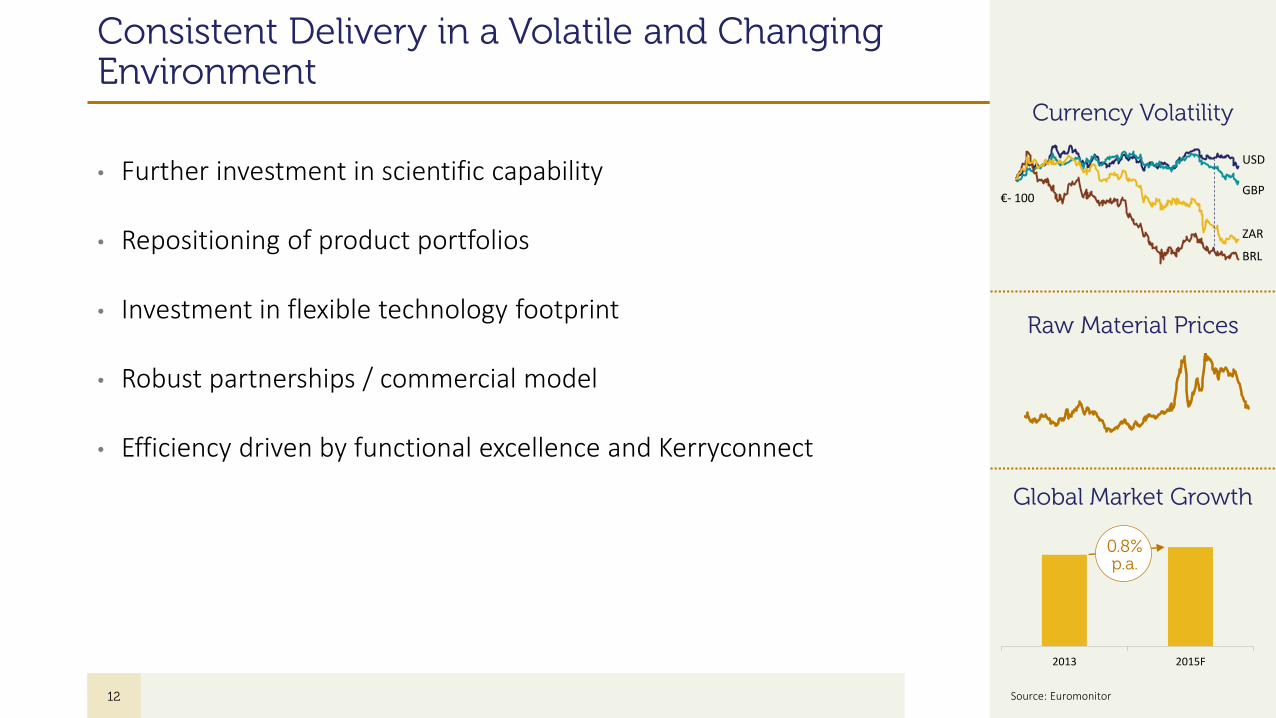
Consistent Delivery in a Volatile and Changing Environment
• Further investment in scientific capability
• Repositioning of product portfolios
• Investment in flexible technology footprint
• Robust partnerships / commercial model
• Efficiency driven by functional excellence and Kerryconnect
12
Currency Volatility
Raw Material Prices
Global Market Growth
€- 100
USD
GBP
ZAR
BRL
2013 2015F
0.8%p.a.
Source: Euromonitor
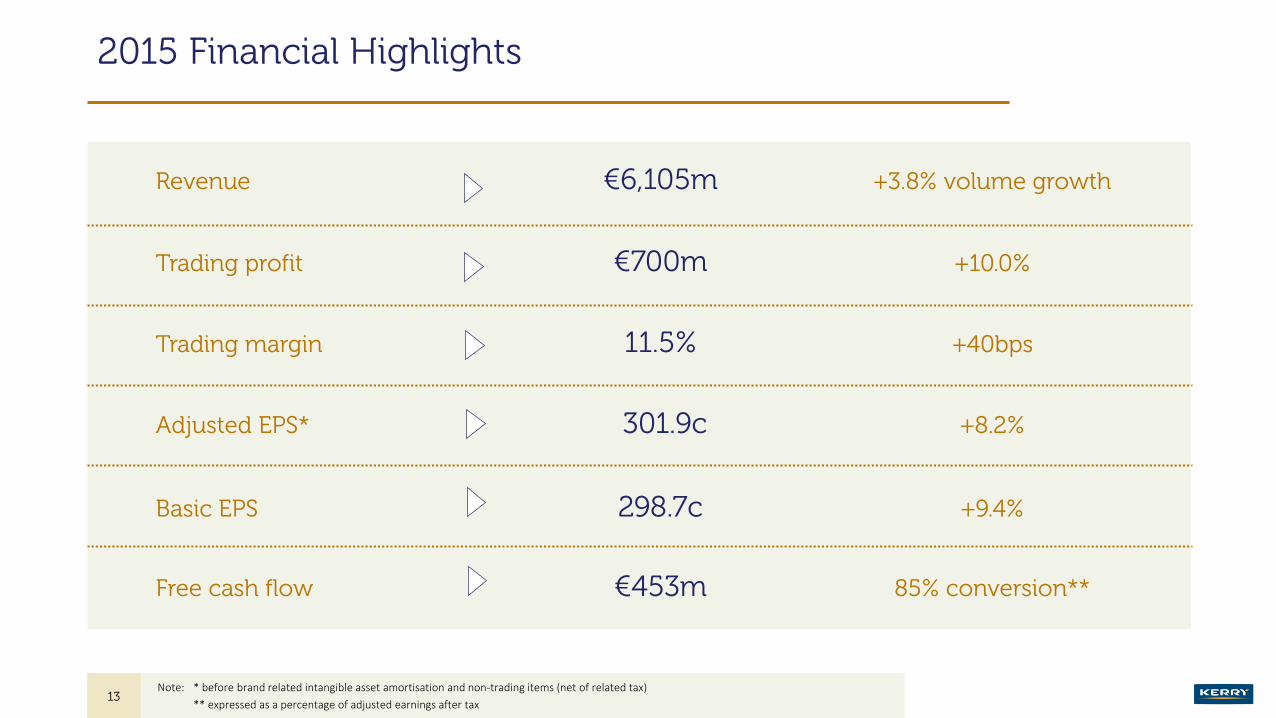
2015 Financial Highlights
+3.8% volume growth €6,105mRevenue
+10.0%€700mTrading profit
+40bps11.5%Trading margin
+8.2%301.9cAdjusted EPS*
+9.4%298.7cBasic EPS
85% conversion**€453mFree cash flow
13Note: * before brand related intangible asset amortisation and non-trading items (net of related tax)
** expressed as a percentage of adjusted earnings after tax
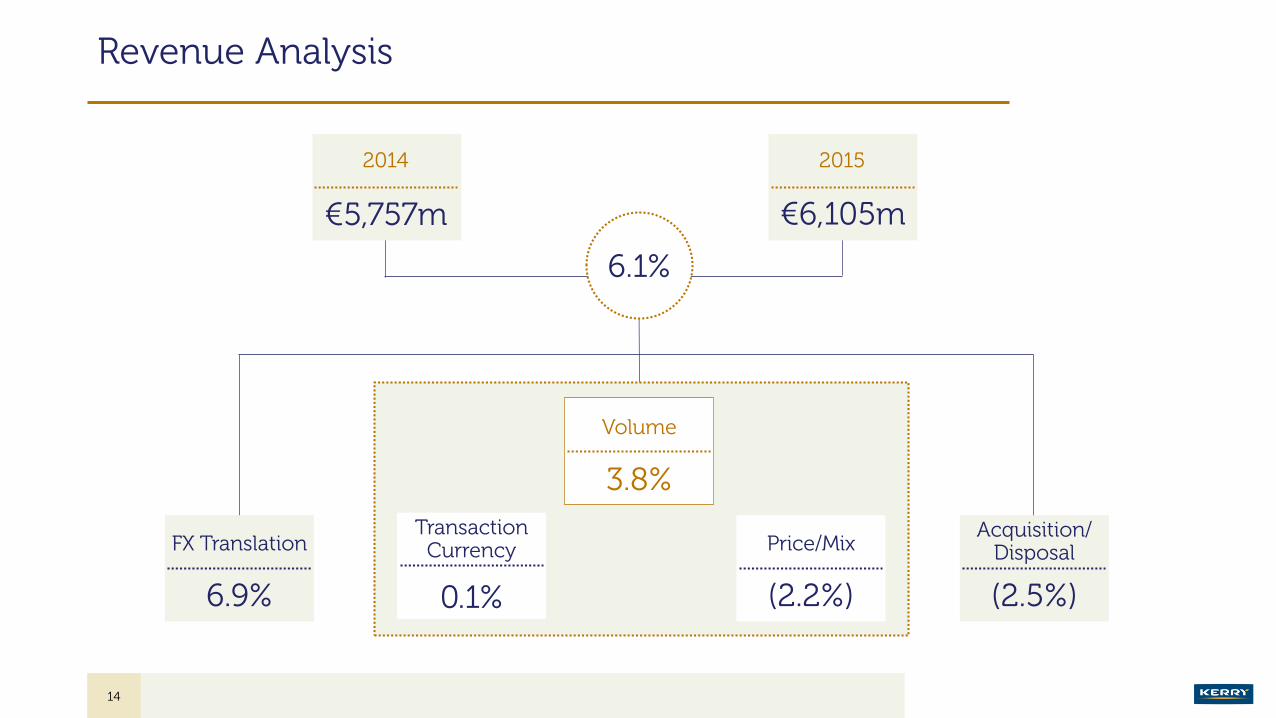
Revenue Analysis
€5,757m
2014
€6,105m
2015
6.1%
6.9%
FX Translation
0.1%
Transaction Currency
3.8%
Volume
(2.2%)
Price/Mix
(2.5%)
Acquisition/Disposal
14
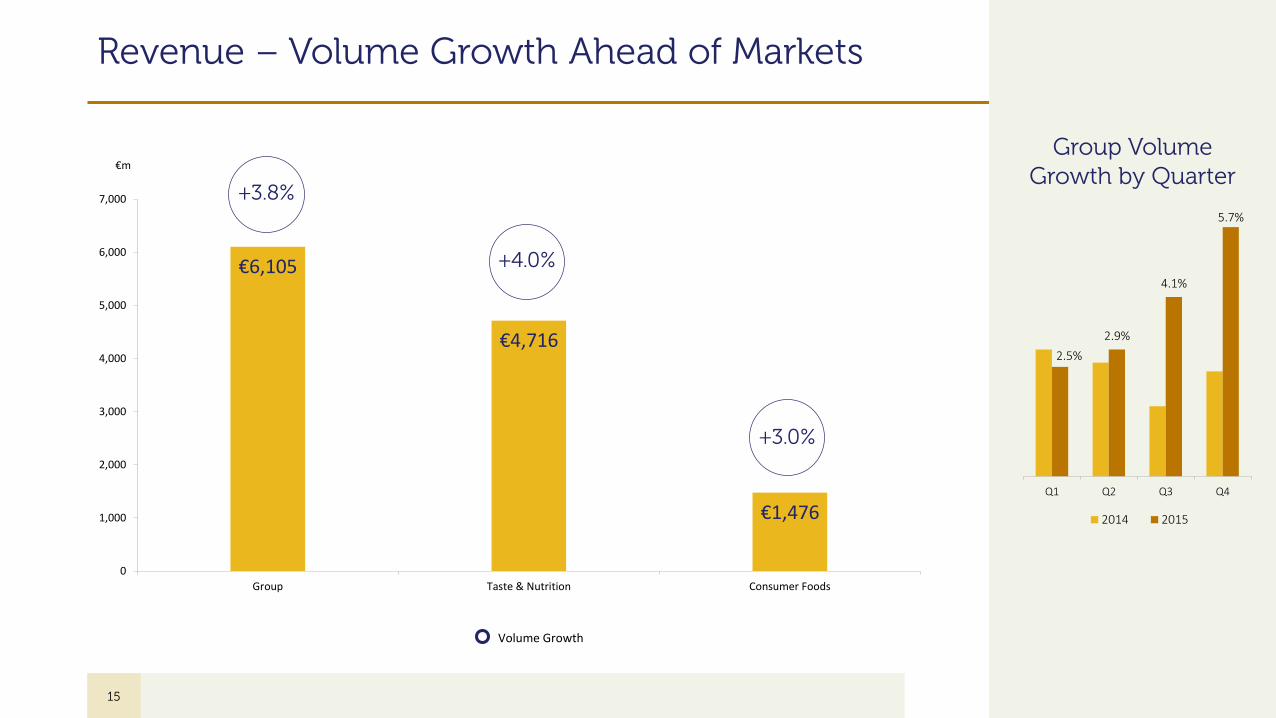
Revenue – Volume Growth Ahead of Markets
€6,105
€4,716
€1,476
0
1,000
2,000
3,000
4,000
5,000
6,000
7,000
Group Taste & Nutrition Consumer Foods
€m
+3.8%
+4.0%
+3.0%
Volume Growth
15
Group Volume Growth by Quarter
2.5%
2.9%
4.1%
5.7%
Q1 Q2 Q3 Q4
2014 2015
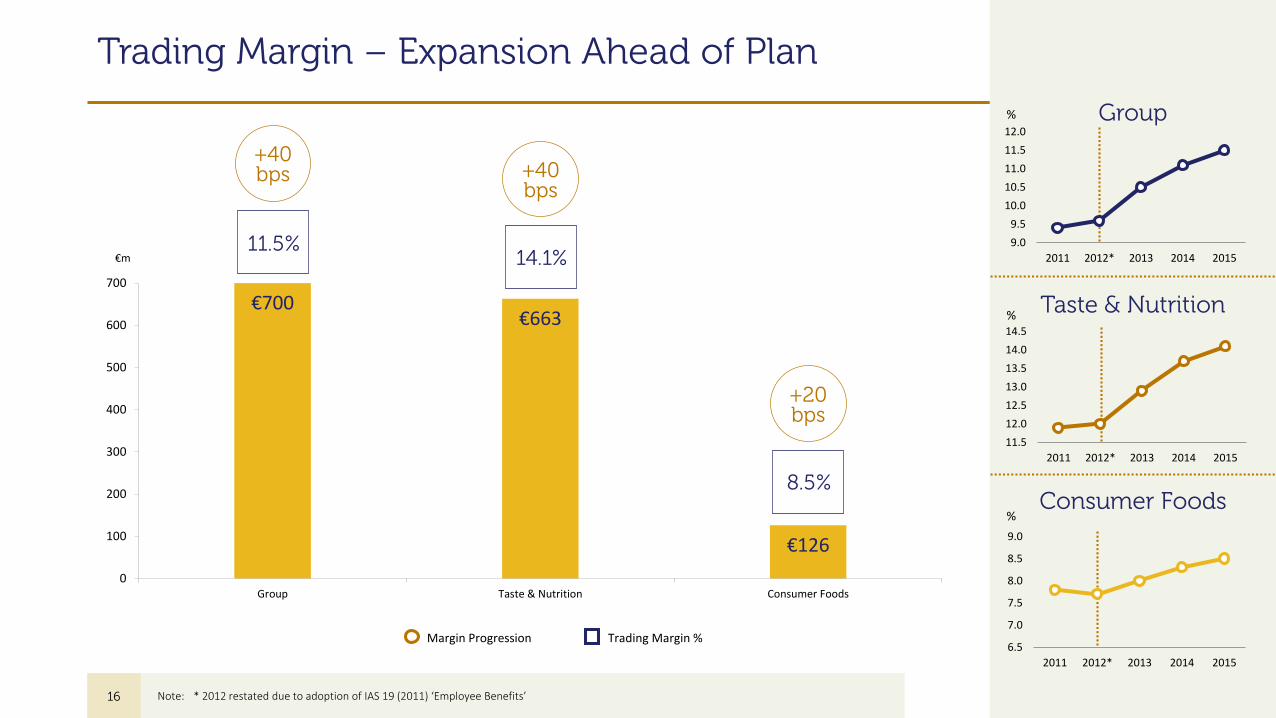
Trading Margin – Expansion Ahead of Plan
€700€663
€126
0
100
200
300
400
500
600
700
Group Taste & Nutrition Consumer Foods
€m11.5%
+40bps
14.1%
+40bps
Margin Progression Trading Margin %
16
Group
Taste & Nutrition
Consumer Foods8.5%
+20bps
9.0
9.5
10.0
10.5
11.0
11.5
12.0
2011 2012* 2013 2014 2015
6.5
7.0
7.5
8.0
8.5
9.0
2011 2012* 2013 2014 2015
11.5
12.0
12.5
13.0
13.5
14.0
14.5
2011 2012* 2013 2014 2015
%
%
%
Note: * 2012 restated due to adoption of IAS 19 (2011) ‘Employee Benefits’
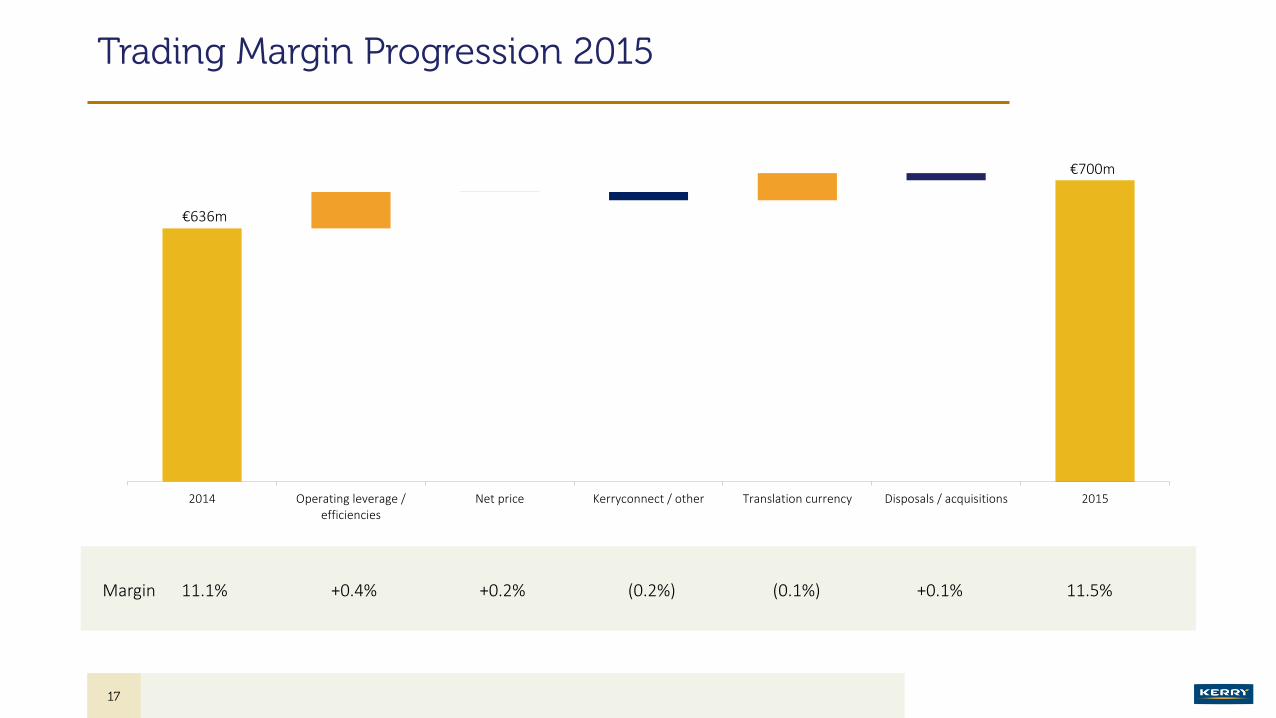
Trading Margin Progression 2015
Margin 11.1% +0.4% +0.2% (0.2%) (0.1%) +0.1% 11.5%
17
2014 Operating leverage /efficiencies
Net price Kerryconnect / other Translation currency Disposals / acquisitions 2015
€636m
€700m
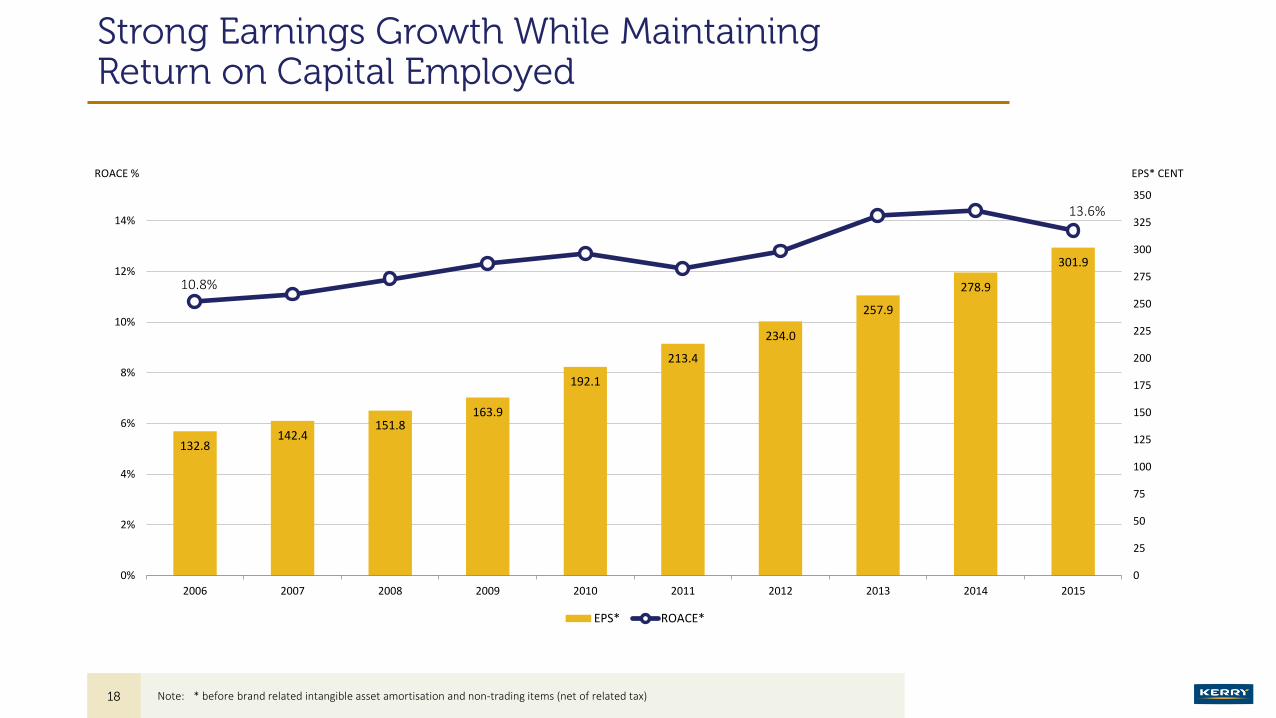
Strong Earnings Growth While Maintaining Return on Capital Employed
132.8142.4
151.8163.9
192.1
213.4
234.0
257.9
278.9
301.9
0
25
50
75
100
125
150
175
200
225
250
275
300
325
350
0%
2%
4%
6%
8%
10%
12%
14%
2006 2007 2008 2009 2010 2011 2012 2013 2014 2015
EPS* ROACE*
ROACE % EPS* CENT
18 Note: * before brand related intangible asset amortisation and non-trading items (net of related tax)
13.6%
10.8%
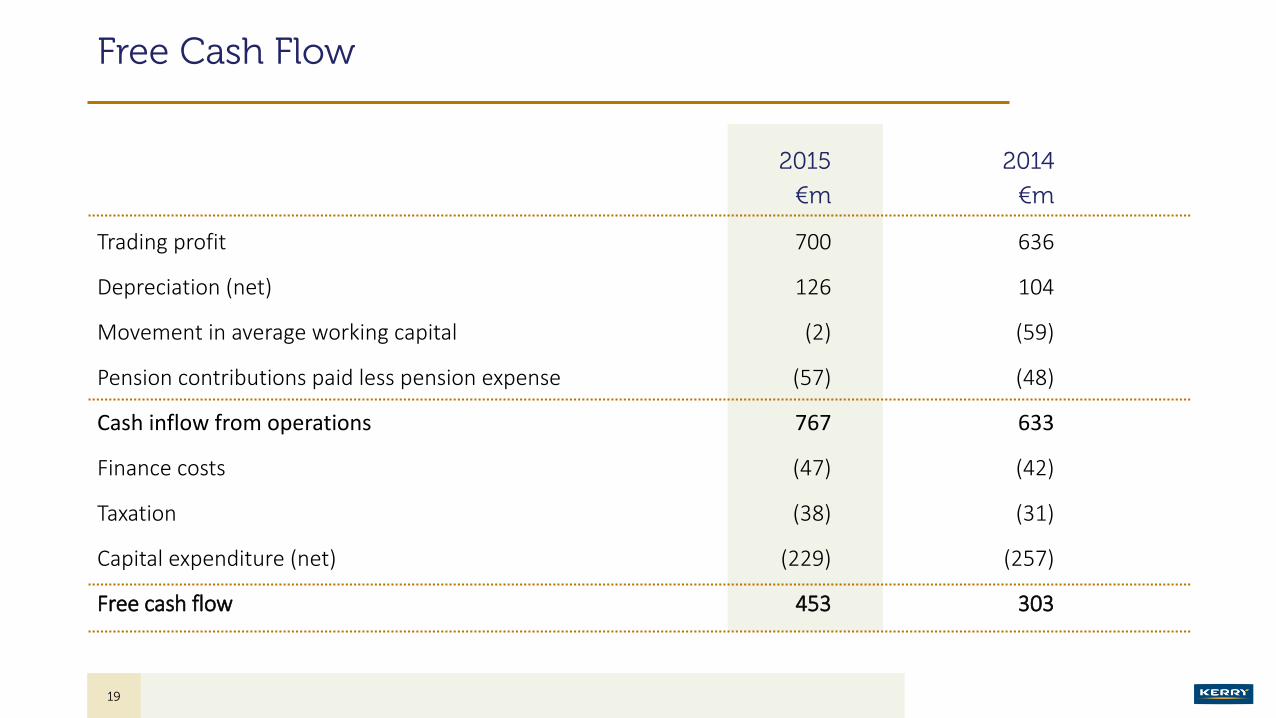
Free Cash Flow
2015 2014
€m €m
Trading profit 700 636
Depreciation (net) 126 104
Movement in average working capital (2) (59)
Pension contributions paid less pension expense (57) (48)
Cash inflow from operations 767 633
Finance costs (47) (42)
Taxation (38) (31)
Capital expenditure (net) (229) (257)
Free cash flow 453 303
19

Financial Ratios
Banking Ratios 2015 2014
Net debt: EBITDA* 1.9x 1.6x
EBITDA: net interest* 17.3x 17.2x
Return Ratios
ROACE** 13.6% 14.4%
ROAE** 17.5% 18.6%
CFROI 11.3% 9.1%
20Note: * calculated in accordance with lender covenants
** before brand related intangible asset amortisation and non-trading items (net of related tax)
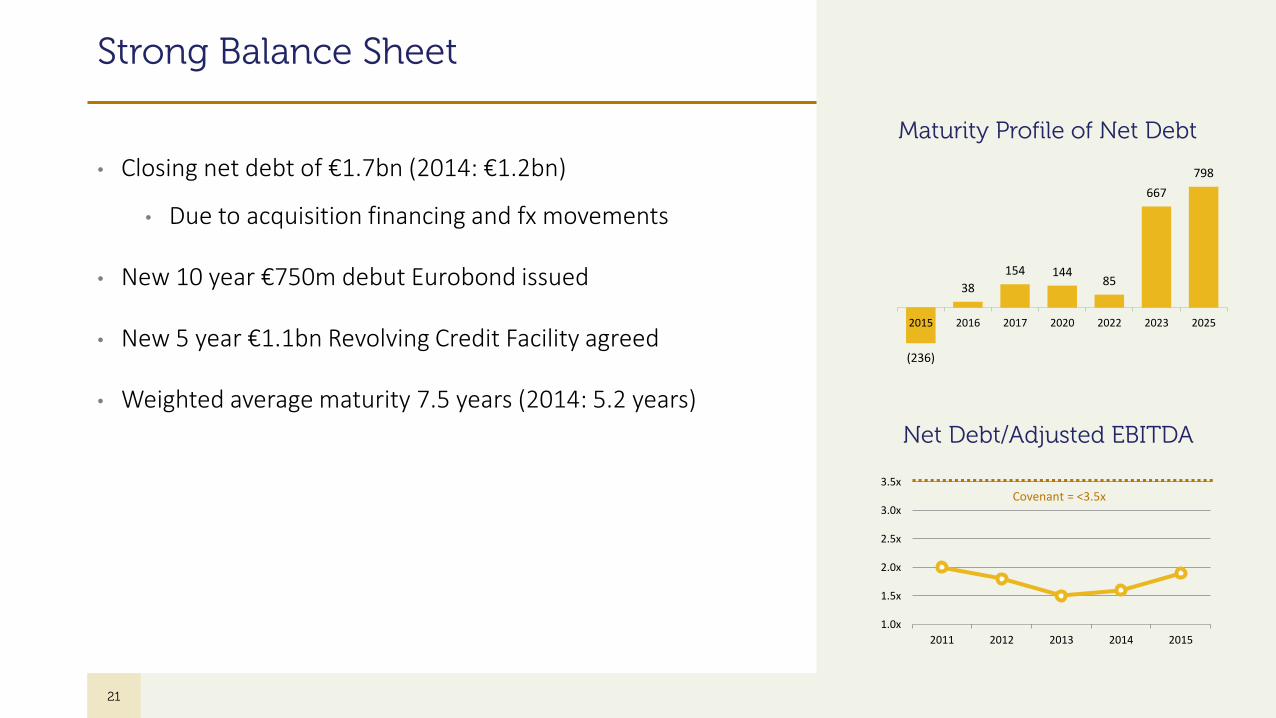
Strong Balance Sheet
• Closing net debt of €1.7bn (2014: €1.2bn)
• Due to acquisition financing and fx movements
• New 10 year €750m debut Eurobond issued
• New 5 year €1.1bn Revolving Credit Facility agreed
• Weighted average maturity 7.5 years (2014: 5.2 years)
21
Maturity Profile of Net Debt
Net Debt/Adjusted EBITDA
(236)
38
154 14485
667
798
2015 2016 2017 2020 2022 2023 2025
1.0x
1.5x
2.0x
2.5x
3.0x
3.5x
2011 2012 2013 2014 2015
Covenant = <3.5x
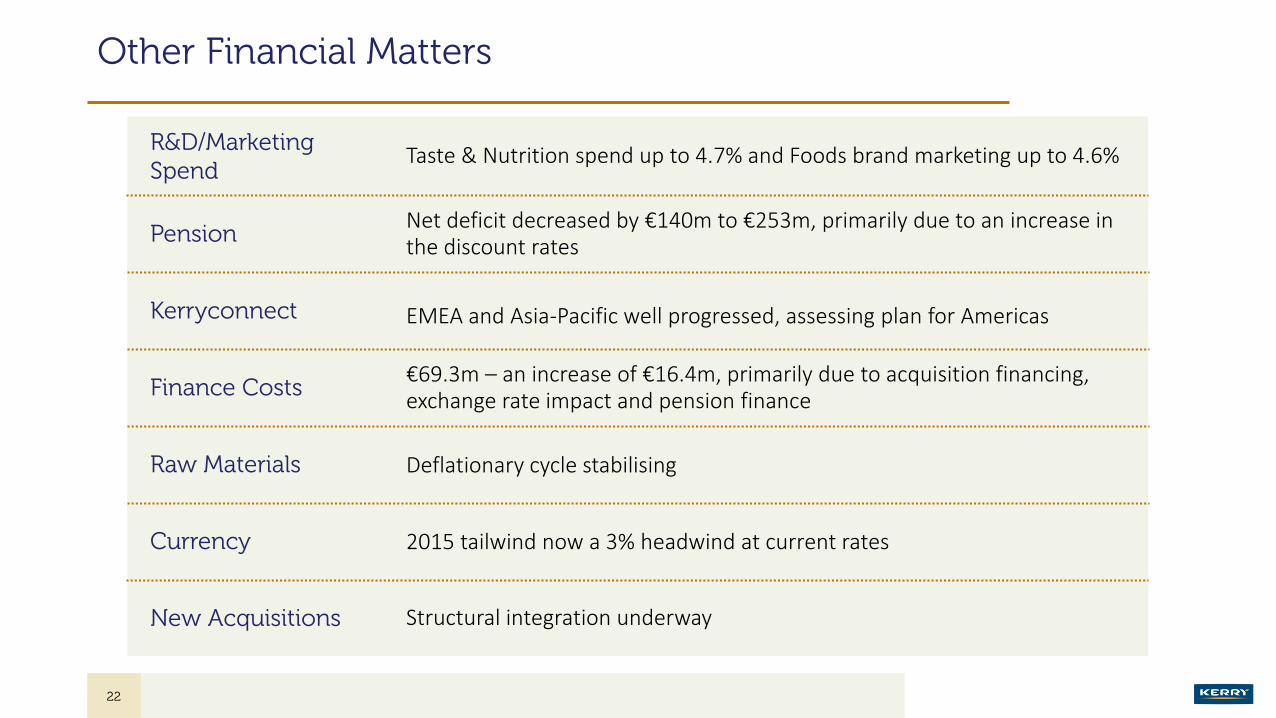
Other Financial Matters
22
R&D/Marketing Spend
Taste & Nutrition spend up to 4.7% and Foods brand marketing up to 4.6%
2015 tailwind now a 3% headwind at current rates
Net deficit decreased by €140m to €253m, primarily due to an increase in the discount rates
EMEA and Asia-Pacific well progressed, assessing plan for Americas
Deflationary cycle stabilising
Structural integration underway
€69.3m – an increase of €16.4m, primarily due to acquisition financing, exchange rate impact and pension finance
Pension
Kerryconnect
Finance Costs
Raw Materials
Currency
New Acquisitions
Outlook & Future Prospects
Stan McCarthyCEO Kerry Group
23
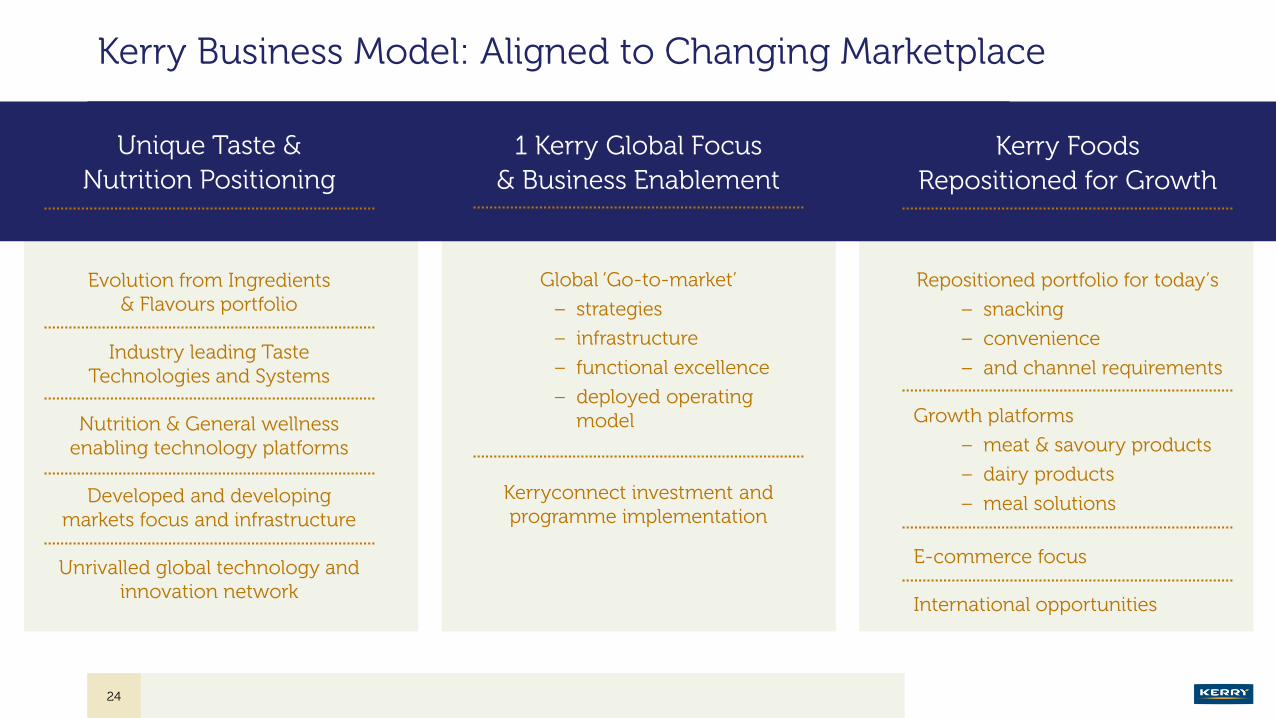
Kerry Business Model: Aligned to Changing Marketplace
Unique Taste &
Nutrition Positioning
Evolution from Ingredients & Flavours portfolio
Industry leading Taste Technologies and Systems
Nutrition & General wellness enabling technology platforms
Developed and developing markets focus and infrastructure
Unrivalled global technology and innovation network
24
1 Kerry Global Focus
& Business Enablement
Kerry Foods
Repositioned for Growth
Global ‘Go-to-market’
– strategies
– infrastructure
– functional excellence
– deployed operating model
Kerryconnect investment and programme implementation
Repositioned portfolio for today’s
– snacking
– convenience
– and channel requirements
Growth platforms
– meat & savoury products
– dairy products
– meal solutions
E-commerce focus
International opportunities
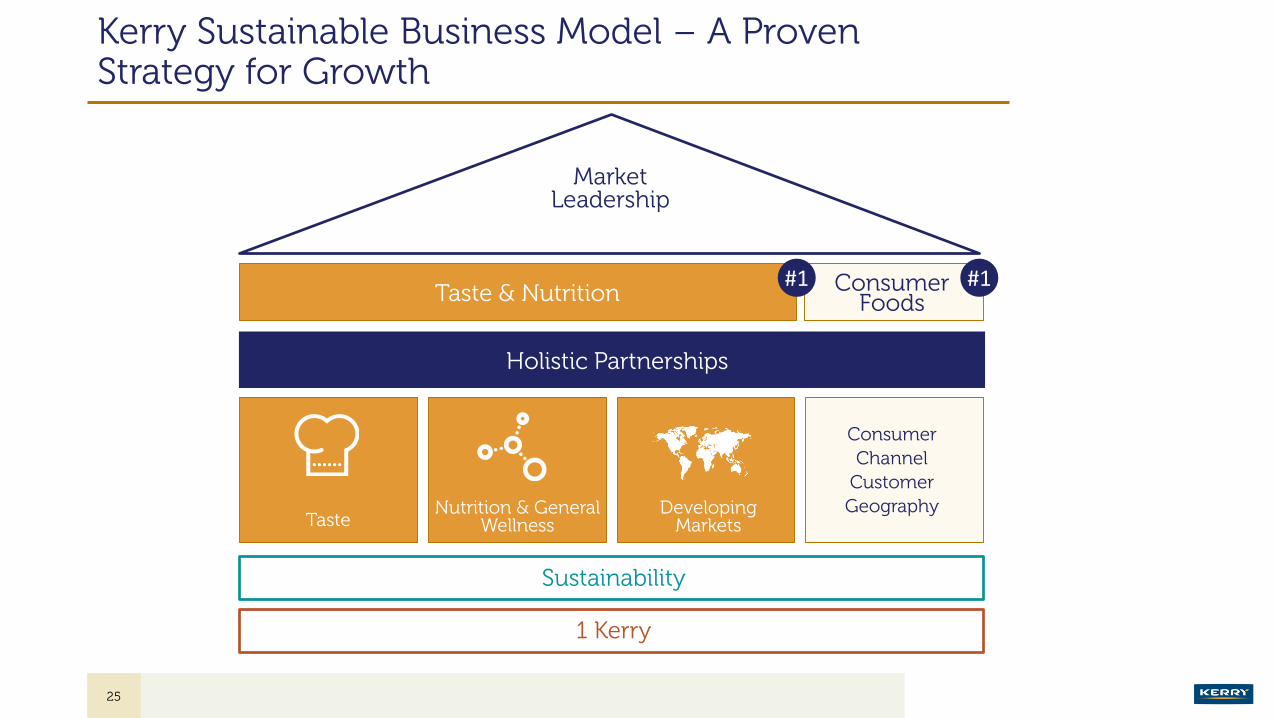
Kerry Sustainable Business Model – A Proven Strategy for Growth
25
Market Leadership
Taste & Nutrition Consumer Foods
Holistic Partnerships
Sustainability
1 Kerry
TasteNutrition & General
WellnessDeveloping
Markets
Consumer
Channel
Customer
Geography
#1 #1

Taste Technologies & Systems: Strategic Growth Pillars
26
Underpinned By: Understanding the fundamental science of Taste
Flavour Texture Mouthfeel Appearance Aroma Sensory
Delivered By: A leading Taste Portfolio
Consumer Expectations
Market Needs(examples)
For self-accountable consumers we create taste products that are safe, trusted and real
• Clean label • Trusted/traceable
ingredients• No artifical ingredients • ‘Free-from’
Pure & Simple
For consumers who want comfort, nostalgia and familiarity, we provide taste that delivers wholesomeness and provenance
• Cooking style tastes • Authentic food
experiences• The taste of time• Ethnic/local cuisine tastes
Authentic & Familiar
• Taste without compromise• Fresh• Healthy Halo• Natural Mood
Fresh & Invigorating
For consumers seeking products with a feel good factor we deliver invigorating, revitalising, refreshing taste
• New taste experiences• The fine-dining experience• The patisserie experience• The coffee-house
experience
Pleasure & Indulgence
For consumers who crave premium and/or indulgent experiences we deliver trending, emerging taste that excites and inspires
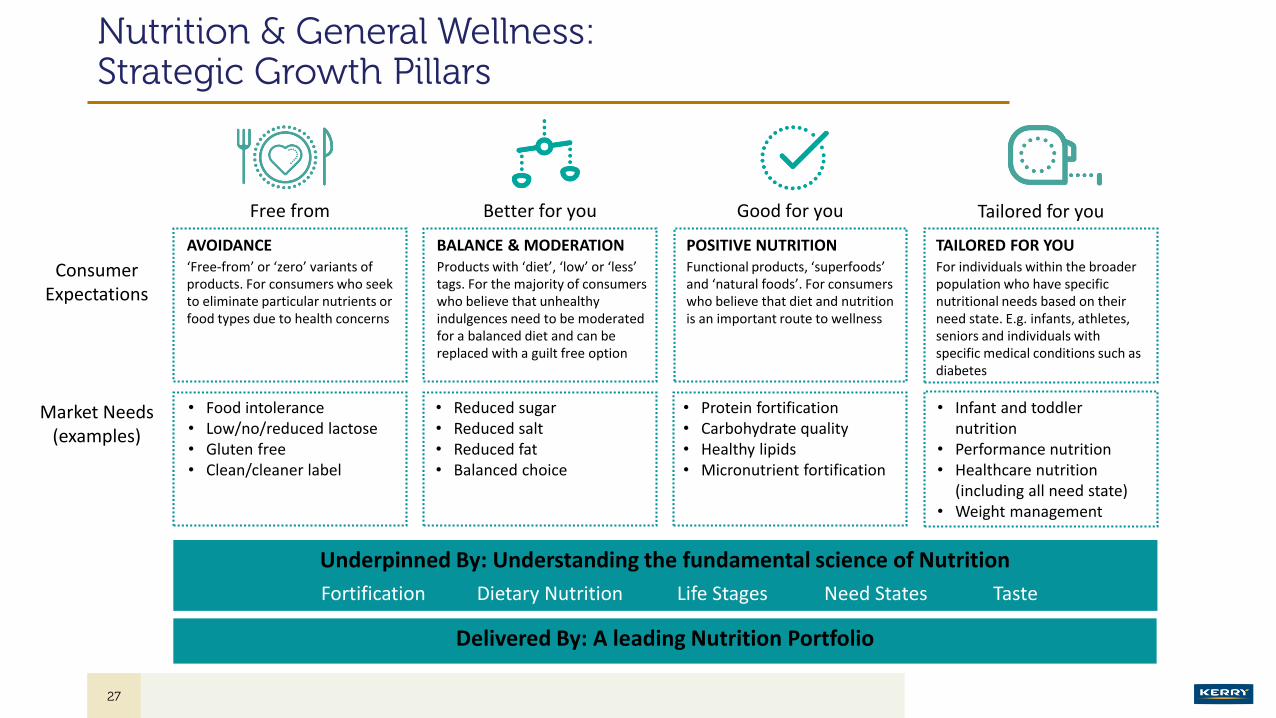
Nutrition & General Wellness: Strategic Growth Pillars
27
Underpinned By: Understanding the fundamental science of Nutrition
Fortification Dietary Nutrition Life Stages Need States Taste
Delivered By: A leading Nutrition Portfolio
AVOIDANCE‘Free-from’ or ‘zero’ variants of products. For consumers who seek to eliminate particular nutrients or food types due to health concerns
• Food intolerance• Low/no/reduced lactose• Gluten free• Clean/cleaner label
Free from
BALANCE & MODERATIONProducts with ‘diet’, ‘low’ or ‘less’ tags. For the majority of consumers who believe that unhealthy indulgences need to be moderated for a balanced diet and can be replaced with a guilt free option
• Reduced sugar• Reduced salt• Reduced fat• Balanced choice
Better for you
• Protein fortification• Carbohydrate quality• Healthy lipids• Micronutrient fortification
Good for you
• Infant and toddler nutrition
• Performance nutrition• Healthcare nutrition
(including all need state)• Weight management
Tailored for you
POSITIVE NUTRITIONFunctional products, ‘superfoods’ and ‘natural foods’. For consumers who believe that diet and nutrition is an important route to wellness
TAILORED FOR YOUFor individuals within the broader population who have specific nutritional needs based on their need state. E.g. infants, athletes, seniors and individuals with specific medical conditions such as diabetes
Consumer Expectations
Market Needs(examples)
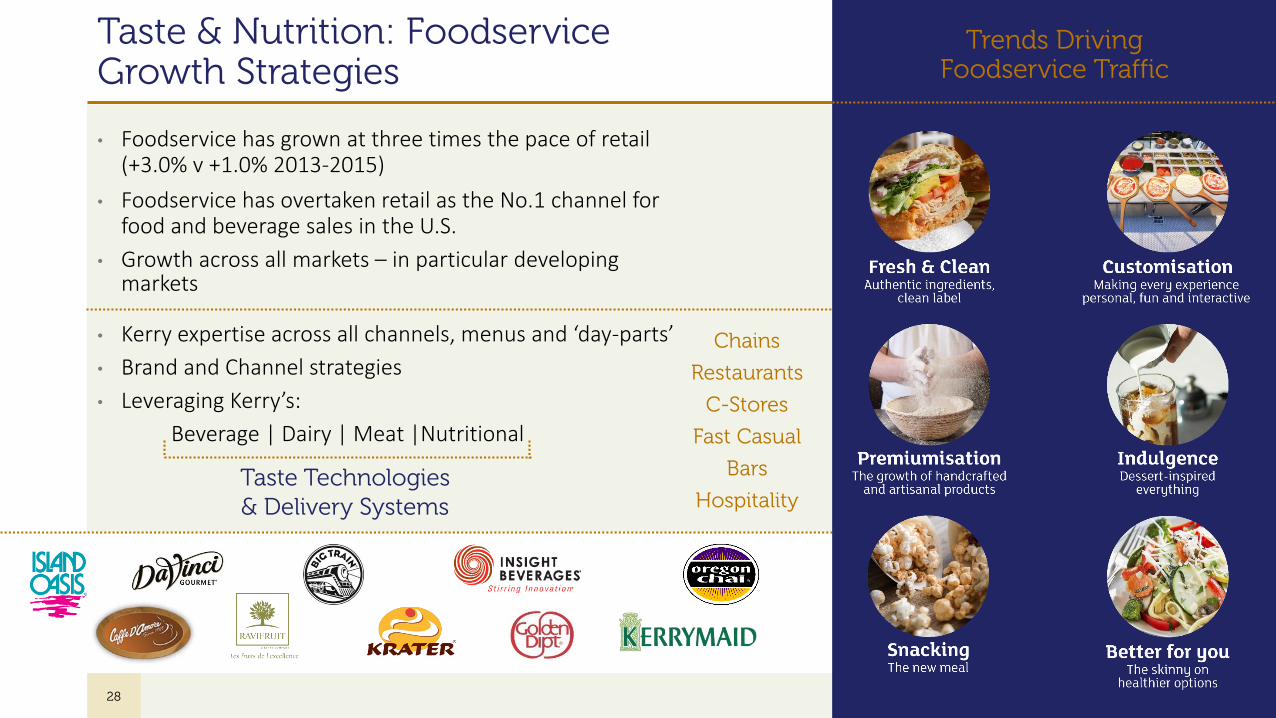
Taste & Nutrition: Foodservice Growth Strategies
28
Trends Driving Foodservice Traffic
• Foodservice has grown at three times the pace of retail (+3.0% v +1.0% 2013-2015)
• Foodservice has overtaken retail as the No.1 channel for food and beverage sales in the U.S.
• Growth across all markets – in particular developing markets
• Kerry expertise across all channels, menus and ‘day-parts’
• Brand and Channel strategies
• Leveraging Kerry’s:
Beverage | Dairy | Meat |Nutritional
Chains
Restaurants
C-Stores
Fast Casual
Bars
HospitalityTaste Technologies & Delivery Systems
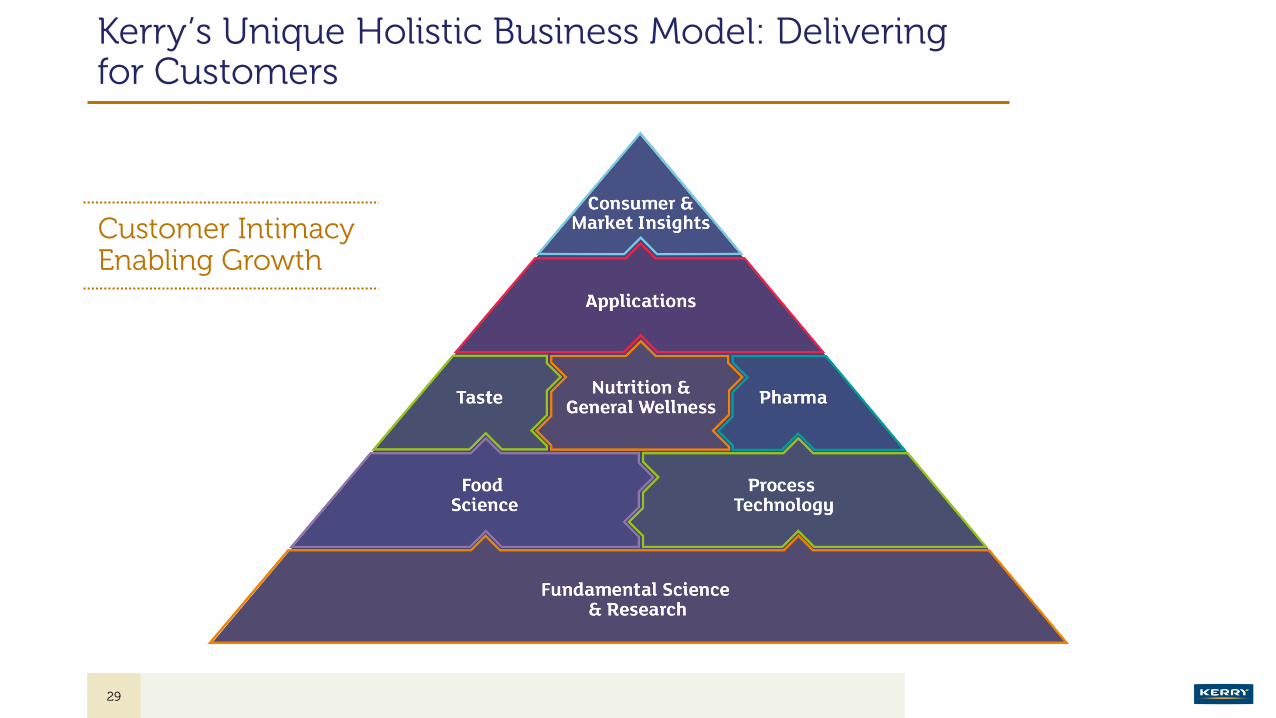
Kerry’s Unique Holistic Business Model: Delivering for Customers
29
Customer Intimacy Enabling Growth
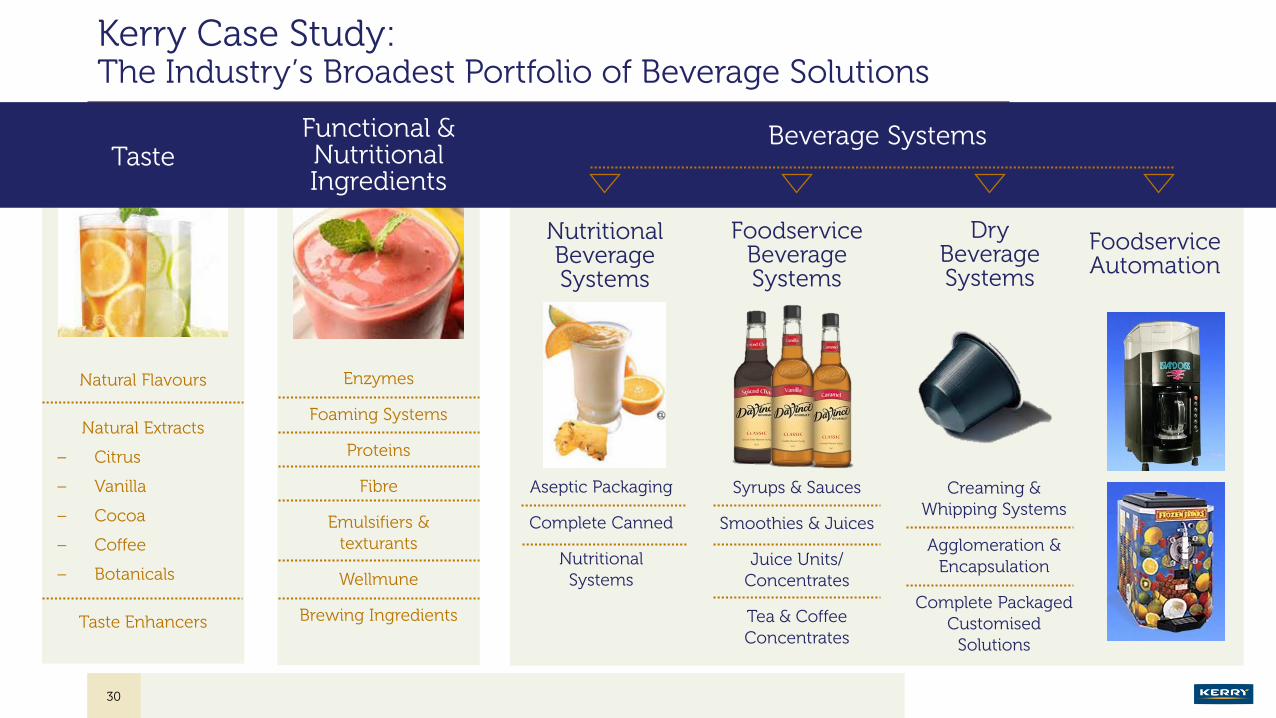
Kerry Case Study:The Industry’s Broadest Portfolio of Beverage Solutions
30
Taste
Natural Flavours
Natural Extracts
– Citrus
– Vanilla
– Cocoa
– Coffee
– Botanicals
Taste Enhancers
Functional & Nutritional Ingredients
Enzymes
Foaming Systems
Proteins
Fibre
Emulsifiers & texturants
Wellmune
Brewing Ingredients
Beverage Systems
Nutritional Beverage Systems
Foodservice Beverage Systems
Dry Beverage Systems
Foodservice Automation
Aseptic Packaging
Complete Canned
Nutritional Systems
Syrups & Sauces
Smoothies & Juices
Juice Units/ Concentrates
Tea & Coffee Concentrates
Creaming & Whipping Systems
Agglomeration & Encapsulation
Complete Packaged Customised
Solutions
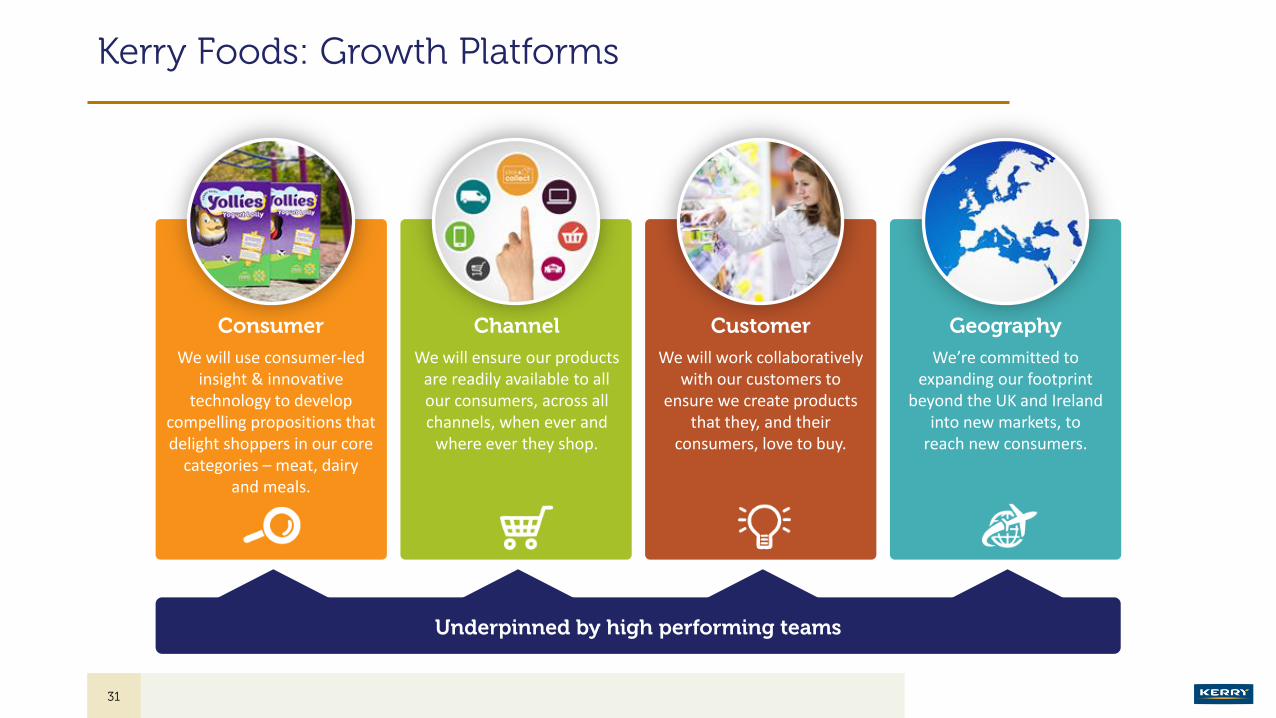
Kerry Foods: Growth Platforms
31
Consumer
We will use consumer-led insight & innovative
technology to develop compelling propositions that delight shoppers in our core
categories – meat, dairy and meals.
Channel
We will ensure our products are readily available to all our consumers, across all channels, when ever and
where ever they shop.
Customer
We will work collaboratively with our customers to
ensure we create products that they, and their
consumers, love to buy.
Geography
We’re committed to expanding our footprint
beyond the UK and Ireland into new markets, to
reach new consumers.
Underpinned by high performing teams
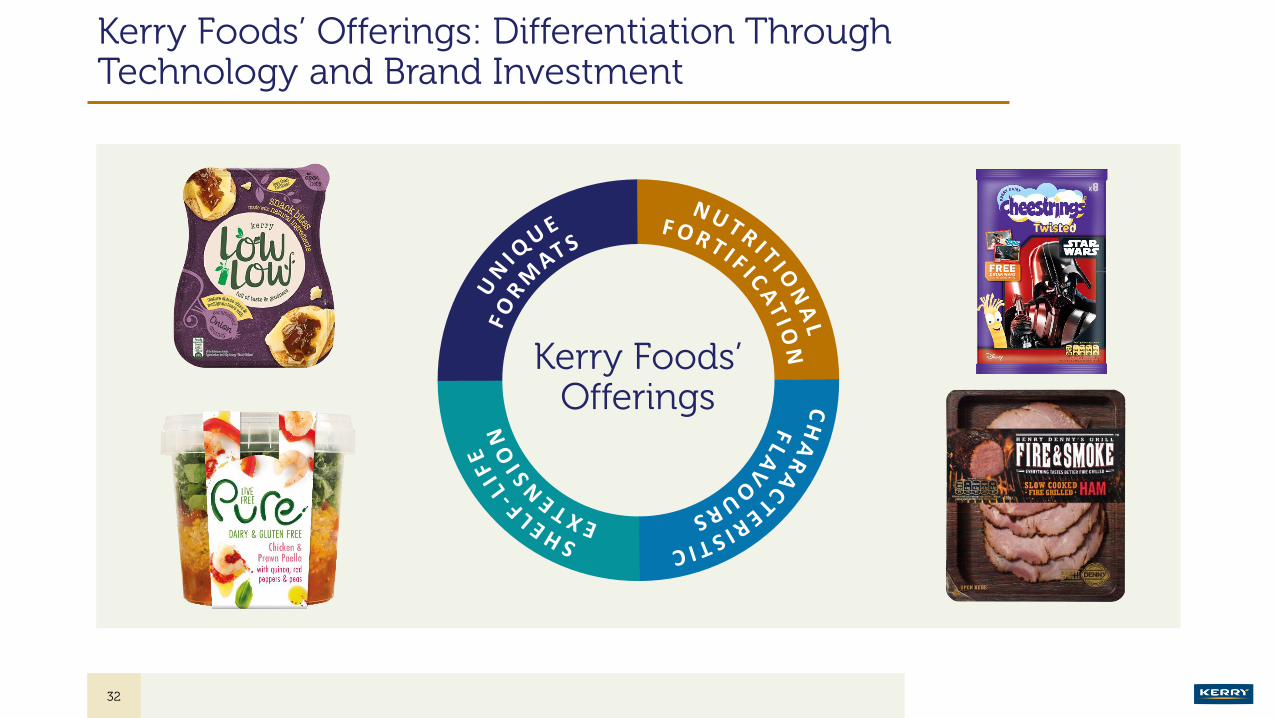
Kerry Foods’ Offerings: Differentiation Through Technology and Brand Investment
32
Kerry Foods’ Offerings
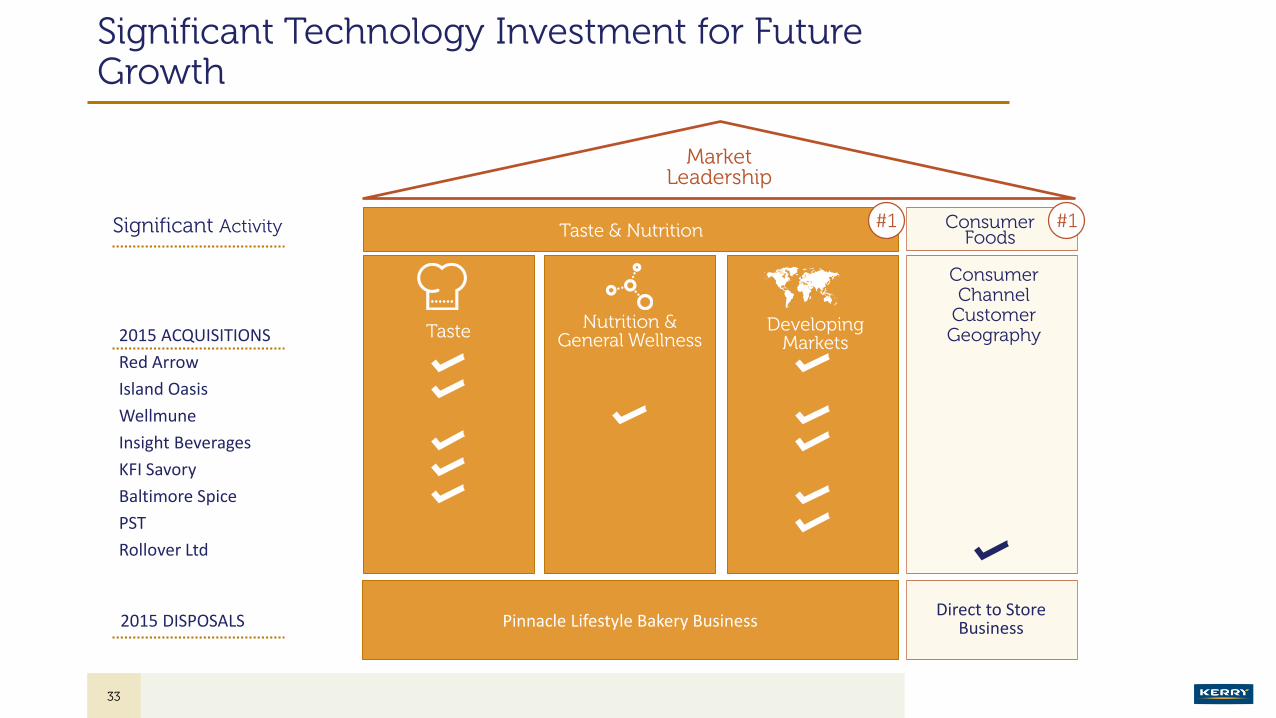
Significant Technology Investment for Future Growth
2015 ACQUISITIONS
Red Arrow
Island Oasis
Wellmune
Insight Beverages
KFI Savory
Baltimore Spice
PST
Rollover Ltd
Market Leadership
Taste & Nutrition Consumer Foods
TasteNutrition &
General WellnessDeveloping
Markets
ConsumerChannel
CustomerGeography
Significant Activity
Pinnacle Lifestyle Bakery Business2015 DISPOSALSDirect to Store
Business
#1 #1
33

Future Prospects
• Strong underlying business development momentum – benefiting from changing marketplace
• solid innovation pipeline driven by our Taste & Nutrition and General Wellness technology platforms
• Kerry Foods performing well and delivering for today’s consumer requirements
• Group will continue to invest in extending and broadening newly acquired technologies into wider Taste &
Nutrition markets
• and in organic development of Kerry’s technology and manufacturing facilities in developing markets
• supporting customer initiatives in advancing continued food safety improvements
• Group will continue to pursue strategic acquisition opportunities
We expect to achieve 6% to 10% growth in adjusted EPS* to a range of 320 to 332 cent per share in
2016 (2015: 301.9 cent) taking into account a 3% currency headwind at current exchange rates
34 Note: * before brand related intangible asset amortisation and non-trading items (net of related tax)

Appendix

Business Review: Taste & Nutrition – Americas
• Volume +4.1%, pricing (1.9%)
• Increased innovation in wellness, nutrition and snacking categories
• Taste technologies drive innovation as customers focus on evolving consumer requirements
• Good growth in foodservice channel
• Continued progress through ‘clean label’ technologies in meat and bakery sectors
• Beverage sector continued to provide good growth opportunities for Kerry solutions and brands
• LATAM impacted by significant currency devaluation – but Kerry records good growth in Mexico and Central America
• Acquisition of KFI Savory, Red Arrow, Baltimore Spice, Insight Beverages and Island Oasis – performing in line with expectations
• Solid growth through cell nutrition and excipient pharma solutions
• Acquisition of Biothera Inc’s ‘Wellmune’ business – global opportunity
2015 GROWTH
Revenue €2,308m +4.1%*
37 Note: * volume growth
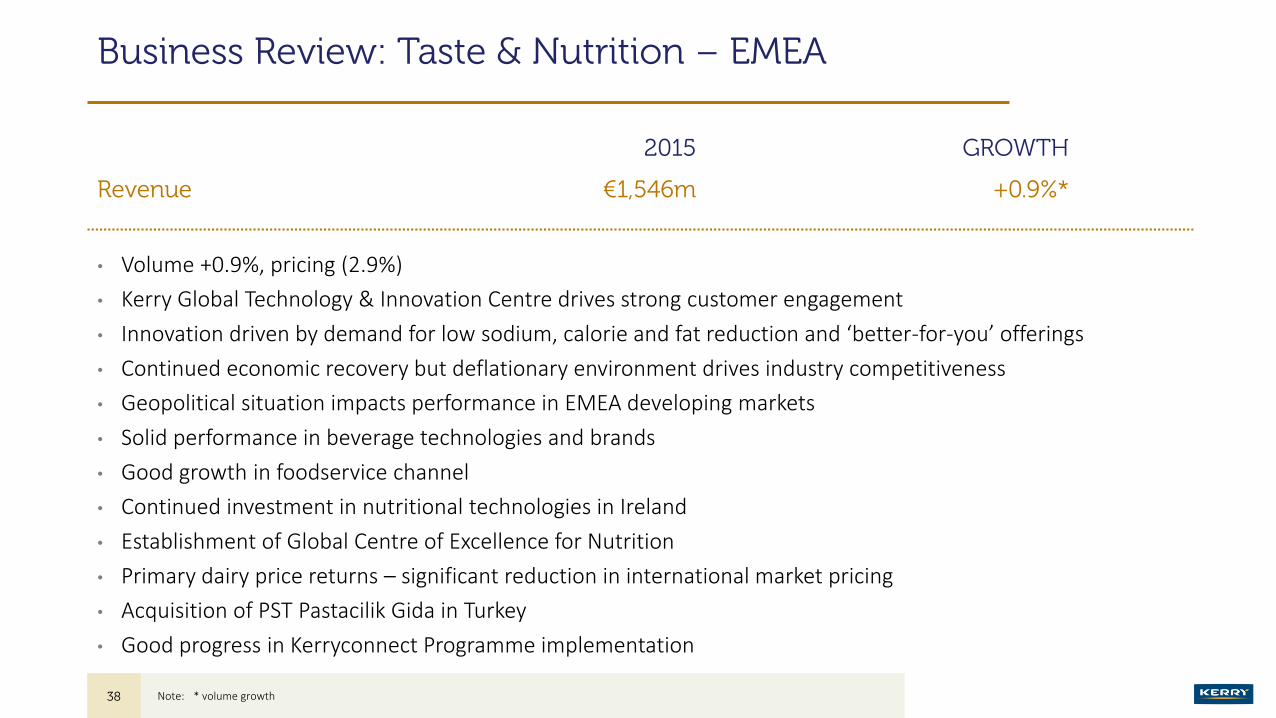
Business Review: Taste & Nutrition – EMEA
• Volume +0.9%, pricing (2.9%)
• Kerry Global Technology & Innovation Centre drives strong customer engagement
• Innovation driven by demand for low sodium, calorie and fat reduction and ‘better-for-you’ offerings
• Continued economic recovery but deflationary environment drives industry competitiveness
• Geopolitical situation impacts performance in EMEA developing markets
• Solid performance in beverage technologies and brands
• Good growth in foodservice channel
• Continued investment in nutritional technologies in Ireland
• Establishment of Global Centre of Excellence for Nutrition
• Primary dairy price returns – significant reduction in international market pricing
• Acquisition of PST Pastacilik Gida in Turkey
• Good progress in Kerryconnect Programme implementation
2015 GROWTH
Revenue €1,546m +0.9%*
38 Note: * volume growth
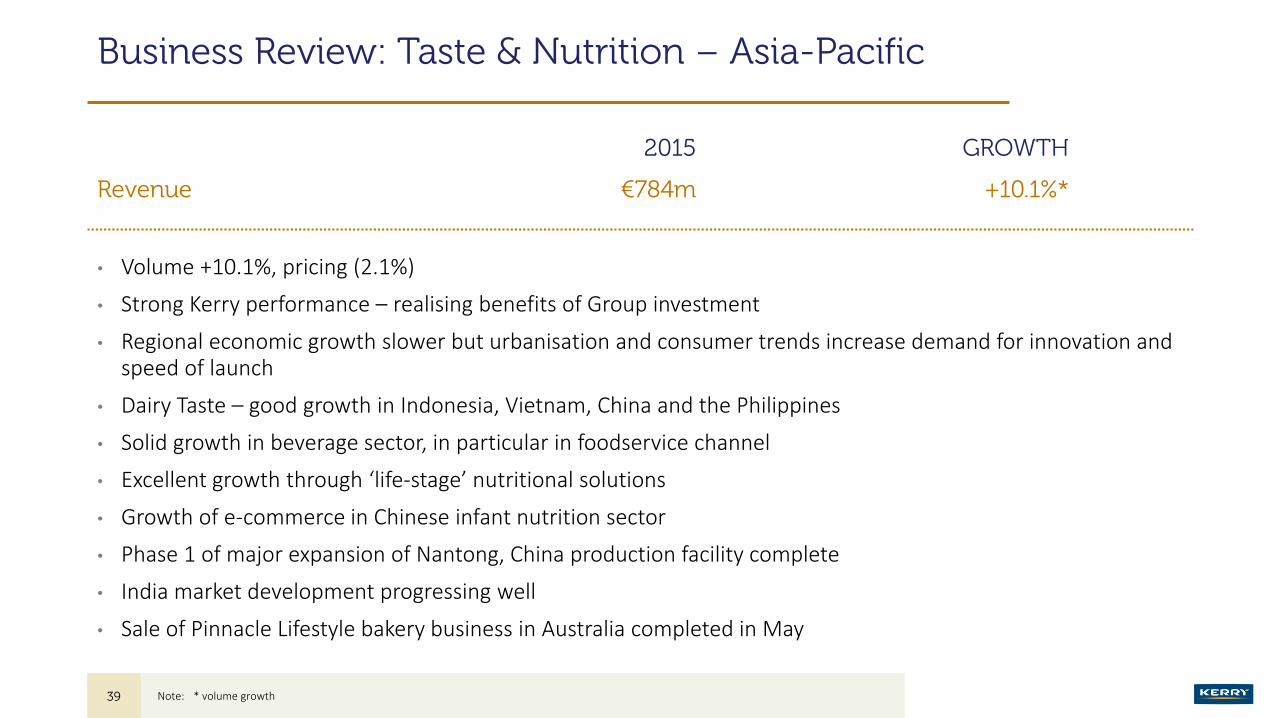
Business Review: Taste & Nutrition – Asia-Pacific
• Volume +10.1%, pricing (2.1%)
• Strong Kerry performance – realising benefits of Group investment
• Regional economic growth slower but urbanisation and consumer trends increase demand for innovation and speed of launch
• Dairy Taste – good growth in Indonesia, Vietnam, China and the Philippines
• Solid growth in beverage sector, in particular in foodservice channel
• Excellent growth through ‘life-stage’ nutritional solutions
• Growth of e-commerce in Chinese infant nutrition sector
• Phase 1 of major expansion of Nantong, China production facility complete
• India market development progressing well
• Sale of Pinnacle Lifestyle bakery business in Australia completed in May
2015 GROWTH
Revenue €784m +10.1%*
39 Note: * volume growth

Revenue Growth Components FY 2015
Trading Reporting Disposals/ TotalVolumes Price Currency Currency Acquisitions
Taste & Nutrition 4.0% (2.3%) 0.0% 6.9% 0.1% 8.7%
Consumer Foods 3.0% (1.9%) 0.4% 6.6% (10.3%) (2.2%)
Group 3.8% (2.2%) 0.1% 6.9% (2.5%) 6.1%
40

Trading Margin by Business
2015 2014Revenue Trading Profit Revenue Trading Profit
€m €m % €m €m %
Taste & Nutrition 4,716 663 14.1% 4,337 593 13.7%
Consumer Foods 1,476 126 8.5% 1,509 125 8.3%
Eliminations/unallocated (87) (89) – (89) (82) –
Group 6,105 700 11.5% 5,757 636 11.1%
41
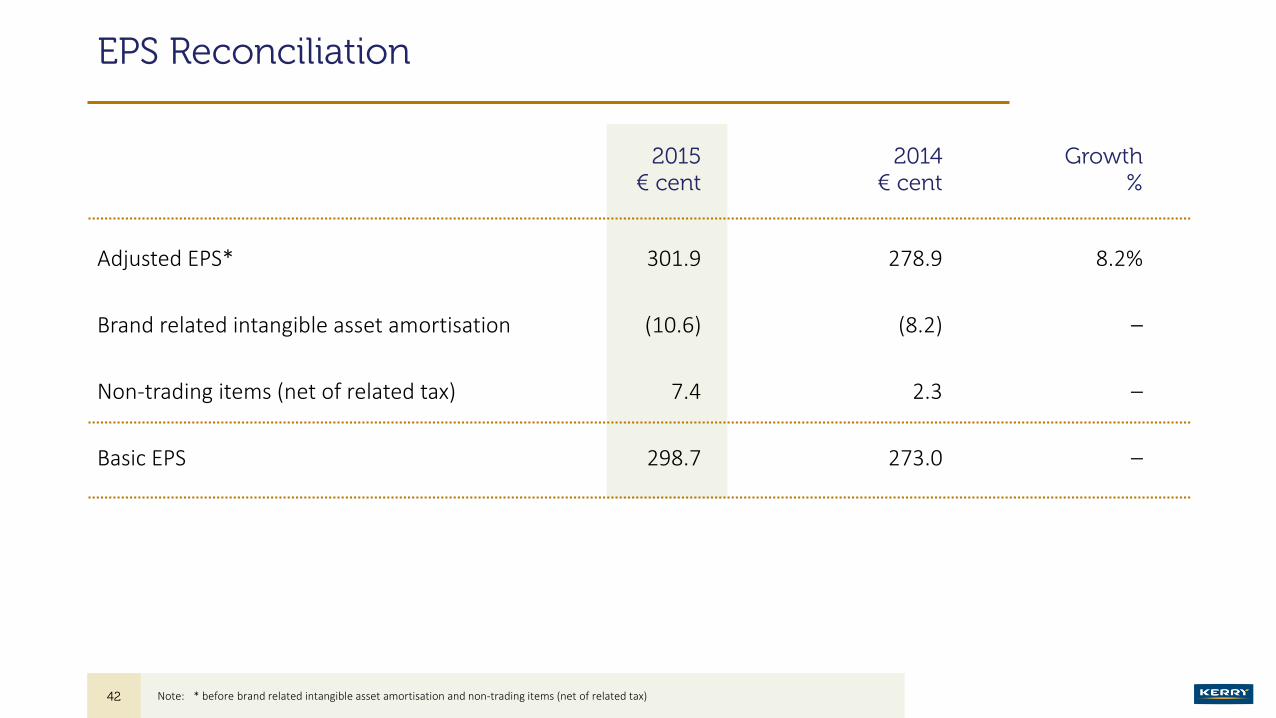
EPS Reconciliation
2015 2014 Growth€ cent € cent %
Adjusted EPS* 301.9 278.9 8.2%
Brand related intangible asset amortisation (10.6) (8.2) –
Non-trading items (net of related tax) 7.4 2.3 –
Basic EPS 298.7 273.0 –
42 Note: * before brand related intangible asset amortisation and non-trading items (net of related tax)

Free Cash Flow (€m)
Earnings conversion 74% 84% 91% 62% 85%
43
5 year free cash flow of €1.8bn
€279m
€344m
€412m
€303m
€453m
0
50
100
150
200
250
300
350
400
450
500
2011 2012 2013 2014 2015
Note: * free cash flow as a % of adjusted earnings after tax
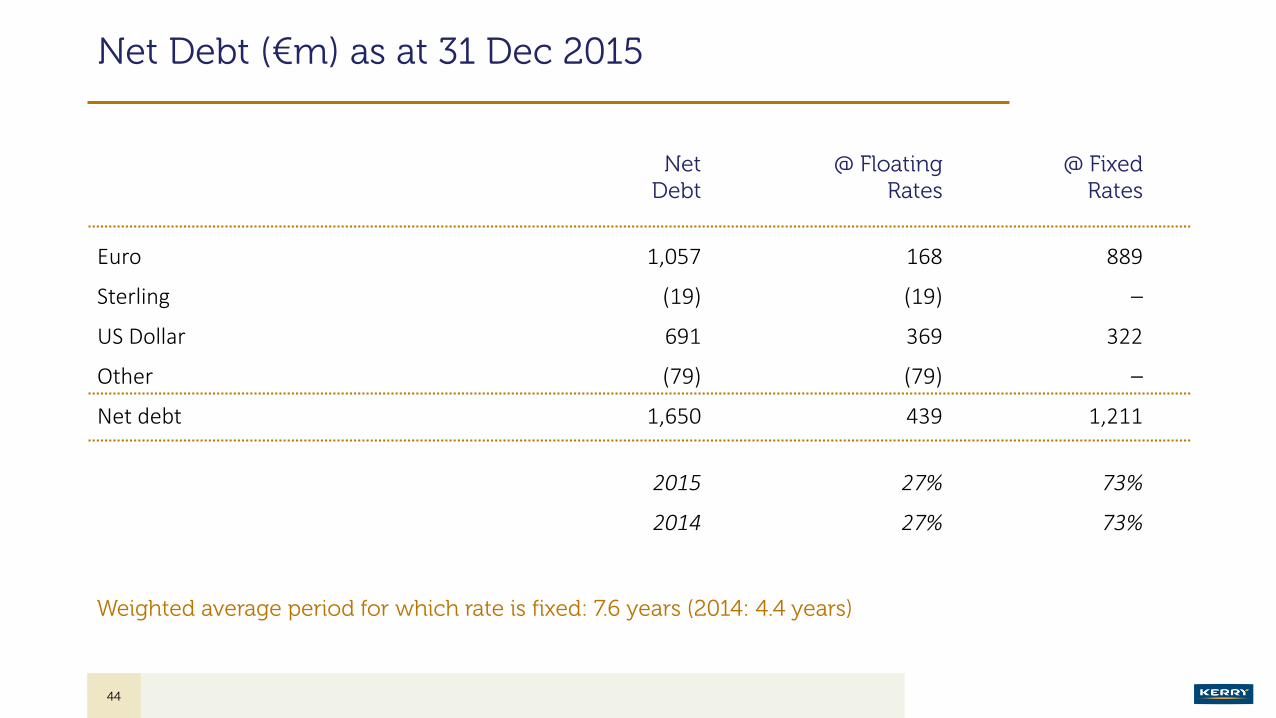
Net Debt (€m) as at 31 Dec 2015
Net @ Floating @ FixedDebt Rates Rates
Euro 1,057 168 889
Sterling (19) (19) –
US Dollar 691 369 322
Other (79) (79) –
Net debt 1,650 439 1,211
2015 27% 73%
2014 27% 73%
44
Weighted average period for which rate is fixed: 7.6 years (2014: 4.4 years)

16%
10%
0%
-18%
1% 0%4% 3%
-34%
USD GBP MXN BRL MYR AUD CAD ZAR RUB
1%
-6%
-16%
-21%
-9%-7% -8%
-23%-25%
USD GBP MXN BRL MYR AUD CAD ZAR RUB
Exchange Rate Movements
Latest Exchange Rates – 2016* v Average 2015
Average 2015 v 2014
45 Note: * source – ECB foreign exchange rates as of 19 February 2016

Group Long Term Targets (5 Years 2013-2017)
46Note: * before brand related intangible asset amortisation and non-trading items (net of related tax)
Targets assume neutral currency and raw materials
Growth
VOLUME GROWTH
Taste & Nutrition 4% to 6% p.a.
Consumer Foods 2% to 3% p.a.
Group 3% to 5% p.a.**
(** assumes market growth rate of 2% to 3% p.a.)
MARGIN EXPANSION
Taste & Nutrition 50bps p.a.
Consumer Foods 20bps p.a.
Group 30bps p.a.
(plus an additional 100bps from Kerryconnect project)
Adjusted EPS* 10%+ p.a. by:
CFROI 12%+ ROAE* 15%+
ROACE* 12%+
Return

Revenues and Profitability
Taste & Nutrition Trading Profit
Group Trading Profit (€m)
Consumer Foods Trading Profit
Group Revenues (€m)
47 Note: * 2012 restated due to adoption of IAS 19 (2011) ‘Employee Benefits’
5,302
5,848 5,837 5,757
6,105
2011 2012 2013 2014 2015
5 year CAGR 4.2% 5 year CAGR 8.3%
501559
611636
700
2011 2012* 2013 2014 2015
7.8% 7.7%8.0%
8.3% 8.5%
3.5%
5.5%
7.5%
0
20
40
60
80
100
120
140
160
180
2011 2012* 2013 2014 2015Trading profit Trading profit margin
11.9% 12.0%
12.9%
13.7% 14.1%
7.0%
8.0%
9.0%
10.0%
11.0%
12.0%
13.0%
14.0%
100
200
300
400
500
600
700
800
2011 2012* 2013 2014 2015
Trading profit Trading profit margin
2011 2012 2013 2014 2015
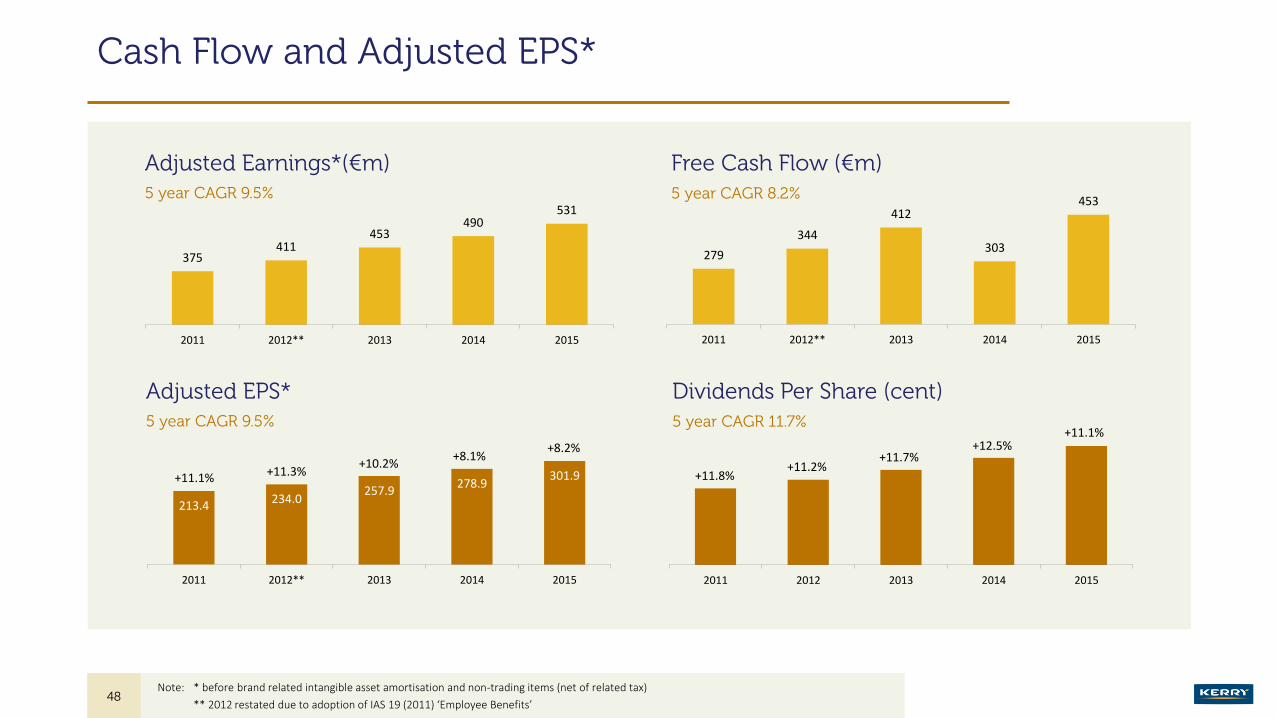
279
344
412
303
453
2011 2012** 2013 2014 2015
375411
453490
531
2011 2012** 2013 2014 2015
Dividends Per Share (cent)Adjusted EPS*5 year CAGR 9.5% 5 year CAGR 11.7%
Cash Flow and Adjusted EPS*
48Note: * before brand related intangible asset amortisation and non-trading items (net of related tax)
** 2012 restated due to adoption of IAS 19 (2011) ‘Employee Benefits’
Free Cash Flow (€m)Adjusted Earnings*(€m)5 year CAGR 9.5% 5 year CAGR 8.2%
213.4234.0
257.9278.9
301.9
2011 2012** 2013 2014 2015
+11.1% +11.3%+10.2%
+8.1%+8.2%
+11.8%+11.2%
+11.7%+12.5%
+11.1%
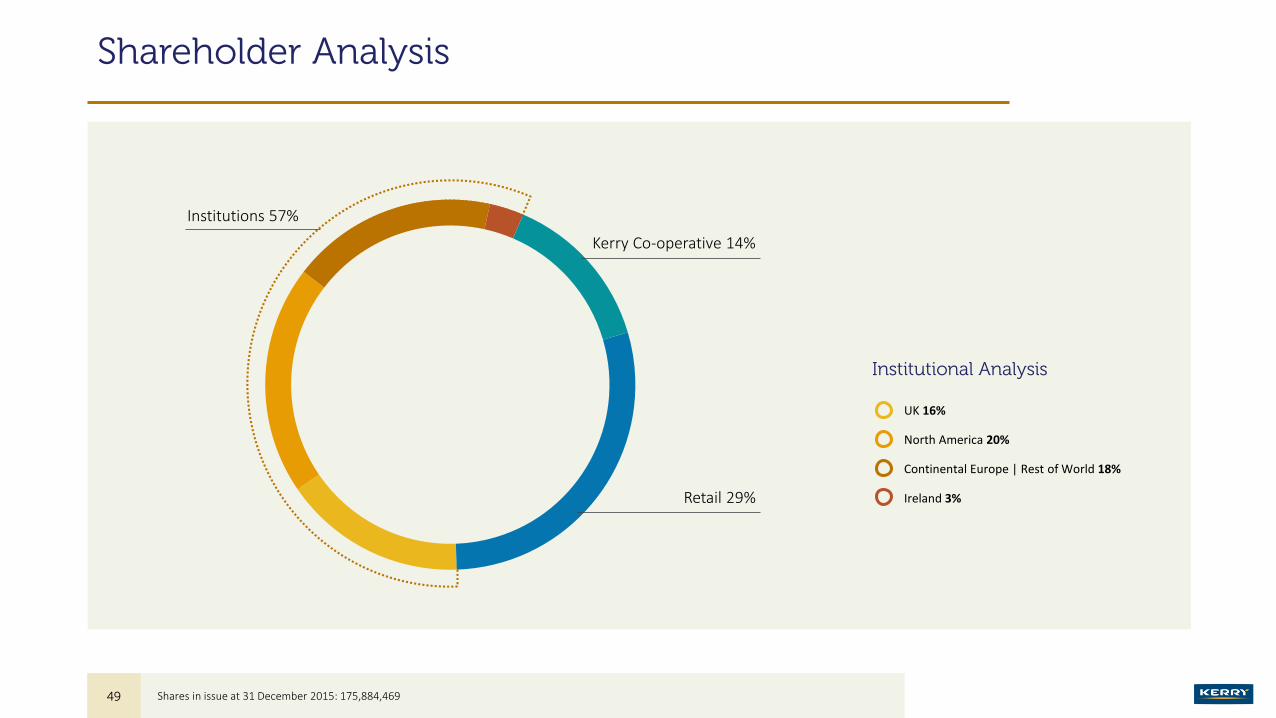
Shareholder Analysis
49 Shares in issue at 31 December 2015: 175,884,469
UK 16%
North America 20%
Continental Europe | Rest of World 18%
Ireland 3%Retail 29%
Kerry Co-operative 14%
Institutions 57%
Institutional Analysis