
Discipline, Crime, and Violence Annual Report 2016 … · Web viewDiscipline, Crime, and Violence...
27
Virginia Department of Education Discipline, Crime, and Violence Annual Report School Year 2016-2017
Transcript of Discipline, Crime, and Violence Annual Report 2016 … · Web viewDiscipline, Crime, and Violence...
Virginia Department of Education
Discipline, Crime, and Violence Annual Report
School Year2016-2017
August 2018

Virginia Department of EducationP. O. Box 2120Richmond, Virginia 23218-2120
Dr. Steven R. Staples Superintendent of Public Instruction
Mr. John EisenbergAssistant Superintendent of Special Education and Student Services
Mr. Bobby KeenerDirector, Office of Information Technology
Ms. Joanne BurkholderDirector, Office of Student Services
Ms. Tara McDanielManager, Special Education Data and Reporting
Please direct any questions about this report to Angela Phenicie at: [email protected] or (804) 371-7582.
EXECUTIVE SUMMARY
Introduction
The Code of Virginia (§ 22.1-279.3:1) requires school divisions statewide to submit data to the Virginia Department of Education (VDOE) on incidents of discipline, crime, and violence (DCV). School divisions began reporting such data in 1991. This annual report focuses primarily on DCV data submitted for school year 2016-2017, with selected comparisons to prior years. The DCV data is also used to complete federal reports required by the Gun-Free Schools Act of 1994 (GFSA, Sec. 14061) and the Individuals with Disabilities Education Act (IDEA). Virginia uses incident-based reporting consistent with federal standards. The reporting process is consistent with those recommended by the National Center for Education Statistics and the National Forum on Education Statistics. Incidents range in seriousness from minor acts of misbehavior to criminal acts that result in law enforcement action. A single incident may involve more than one offender, more than one offense, and multiple disciplinary actions. An incident may also involve multiple students and result in multiple disciplinary actions. The DCV data reporting process is a self-reporting system. School division Superintendents are required to verify the accuracy of the data submitted to VDOE.
Understanding Incidents, Offenses, and Disciplinary Outcomes
The DCV data is an incident-based reporting system. Incidents may involve one or more offenses, may involve one or more students, and may result in multiple disciplinary outcomes. The following are key terms used in this report:
An incident is an event that may involve one or more offenses. An incident also may involve one or more students and may result in one or more disciplinary outcomes. An incident count is not equivalent to a student count, as one student could be involved in multiple incidents throughout the school year.
An offense is the problem behavior exhibited by the student(s). Nearly 140 offense codes are available to report different behaviors. Each offense has a unique code and a specific definition.
A disciplinary outcome is the sanction imposed on a student for his/her misconduct. Types of outcomes reported are short-term suspension, long-term suspension, expulsion, modified expulsion, other sanctions, and special education interim placements. Disciplinary counts are numbers of sanctions determined by offense.
Suspensions and Expulsions
Virginia law prescribes minimum due process procedures for the suspension and expulsion of students. Definitions based on Virginia law are as follows:
1

Suspension is a temporary denial of a student’s attendance at school. The duration of a short-term suspension is ten days or less. A long-term suspension is defined as more than ten days but less than 365 calendar days (§ 22.1-277.01, Code of Virginia).
Expulsion is the permanent denial of a student’s attendance at school. A student who is expelled by a school board is ineligible for readmission for 365 calendar days after the date of the expulsion (§ 22.1-277.01, Code of Virginia).
Although there are uniform requirements and procedures governing the suspension and expulsion of students. Local student conduct policies vary, these differences may affect the way offenses and disciplinary actions are applied. The Student Conduct Policy Guidelines, adopted by the Virginia Board of Education are available from VDOE website from “STUDENT CONDUCT & DISCIPLINE” webpage.
Safe Schools Information Resource
The Safe Schools Information Resource (SSIR) website is to provide user-friendly access to the discipline, crime, and violence (DCV) data that is collected yearly from all Virginia school divisions, all regional centers and programs. This website makes DCV data available for the most recent five years. Reports may be generated in various categories according to the user’s selections.
The SSIR reports are designed to provide an overview and trends over time of the information available. Each report area provides a “Big Picture” view and allows “Drilling” down in the data. There are six areas of information available via SSIR:
Information about Incident Frequency in schools Information about Offense Frequency in schools Information about Student Offenders Information about Repeat Offenders Information about Non-Student Offenders Information about the Disciplinary Outcomes that result from the student offenses
Offense and Incident types reported in the SSIR are coded and grouped into offense categories. These offense categories are aligned according to severity of offense. There are nine categories:
Weapons Related Offenses Offenses Against Students Offenses Against Staff Offenses Against Persons Alcohol, Tobacco, and Other Drugs Property Offenses Disorderly Disruptive Behavior Technology Offenses Other Offenses
2

Use of DCV Data to Identify Persistently Dangerous Schools
In Virginia, a “persistently dangerous school” is one that exceeds a threshold of offense incidents over a three-year period as established by the Virginia Board of Education’s Persistently Dangerous Schools Identification Process and Criteria is located in “Superintendent’s and Principals’ memos” in year 2004, as adm051 memo.
A school that exceeds its established threshold for three consecutive years is designated as a “persistently dangerous school.” In year one, the school is in “caution” status and in year two the school is “on probation.” Schools must develop corrective action plans and are subject to graduated interventions.
Each state receiving funds under the federal Every Student Succeeds Act 2015 is required to establish and implement a statewide policy requiring a student attending a persistently dangerous school be allowed to attend a safe school. In May 2002, the Virginia Board of Education’s “Unsafe School Choice Option” policy was adopted. Virginia’s “Unsafe School Choice Option” policy can be accessed on the Virginia Department of Education Criteria is located in “Superintendent’s and Principals’ memos” in year 2003, as inf086 memo.
OVERVIEW OF ALL INCIDENTS
This report focuses on the DCV data reported for the 2016-2017 school year and includes information submitted to the VDOE by all school divisions. In the school year 2016-2017, there were 147,155 incidents reported. The incidents of defiance, classroom/campus disruption, disruptive demonstrations, obscene language/gestures, minor physical altercations, and disrespect combined accounted for 61.15 percent of all incidents in 2016-2017.
The most frequently reported incidents were defiance 20,576, classroom/campus disruption 17,746, disruptive demonstrations 16,025, minor physical altercation 14,327, using obscene inappropriate language/gestures 11,119, and disrespect/walking away 10,198.
Due to the personally identifiable nature of the information represented in this report, numbers ten (10) and less are suppressed with the use of an asterisk (*). This includes all data including student counts, outcome counts, and incident count.
3

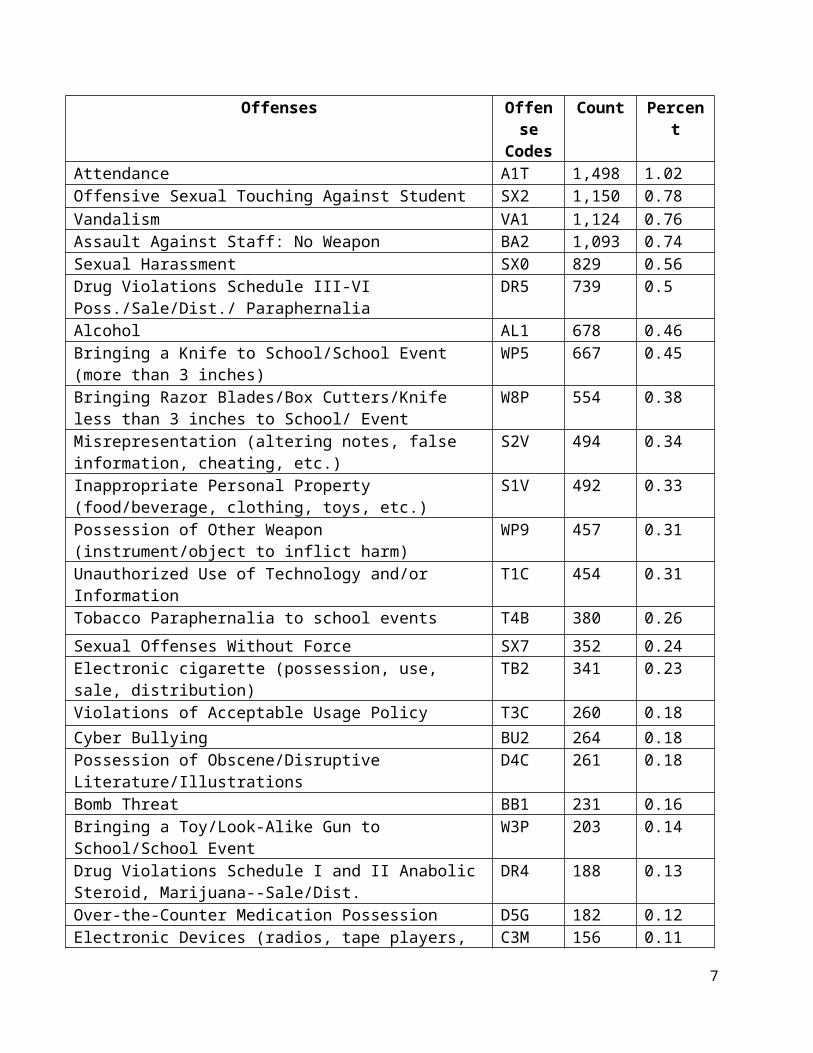
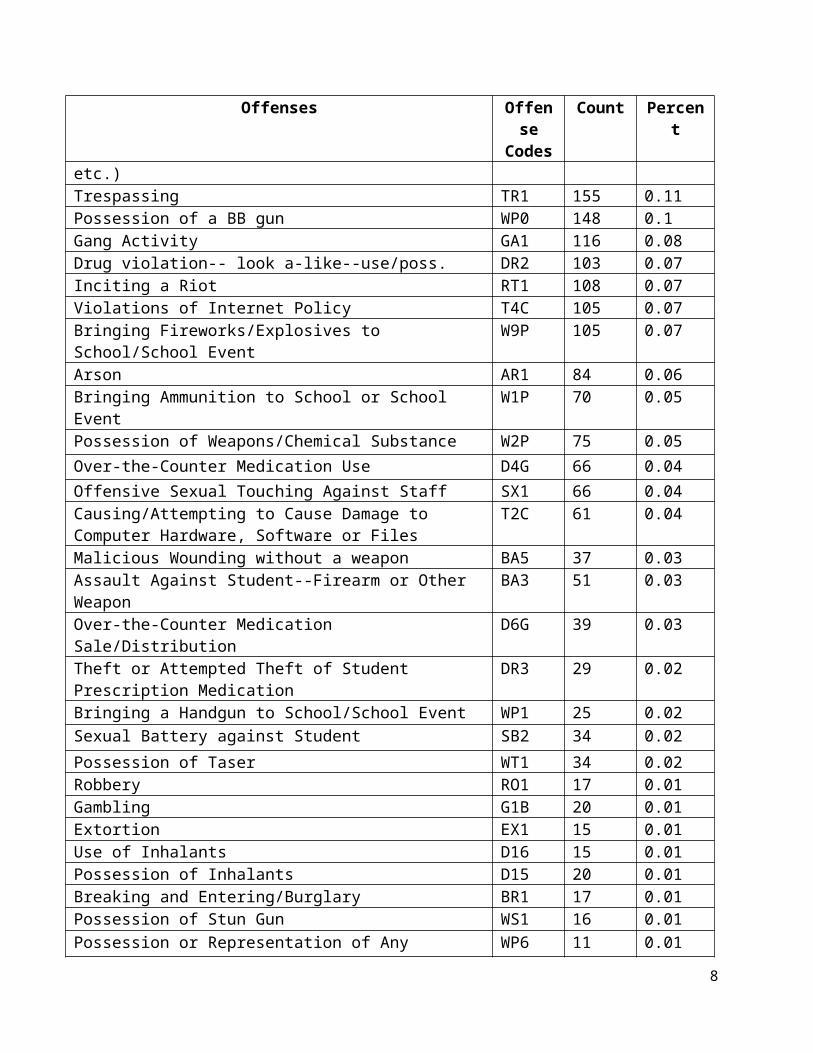
Table 1. All incidents of Discipline, Crime, and Violence 2016-2017 Statewide totals of all incident counts broken out by offense.
Offenses Offense Codes
Count Percent
Defiance of Authority/Insubordination D2C 20,576 13.98Classroom or Campus Disruption D5C 17,746 12.06Disruptive Demonstrations D3C 16,025 10.89Minor Physical Altercation F1T 14,327 9.74Using Obscene/Inappropriate Language/Gestures D6C 11,119 7.56
Disrespect/Walking Away D1C 10,198 6.93Fighting: Mutual Contact--No/Minor Injuries, No Med Attn. FA2 7,356 5.00
Minor Insubordination D8C 4,490 3.05Threatening Student (physical or verbal threat or intimidation) TI2 4,421 3.00
Other School Code of Conduct Violation Not Covered in These Codes
S3V 4,105 2.79
Harassment HR1 3,983 2.71Assault Against Student/No Weapon BA4 2,834 1.93Tobacco TB1 2,616 1.78Bullying BU1 2,540 1.73Assault/Battery against student without injury BA6 2,255 1.53
Cellular Telephones C2M 2,129 1.45Theft Offenses (except motor vehicles) TH1 2,040 1.39
Threatening Staff Member (physical/verbal thread) TI1 1,829 1.24
Drug Possession/Use of Schedule I and II drugs DR1 1,819 1.24Attendance A1T 1,498 1.02Offensive Sexual Touching Against Student SX2 1,150 0.78Vandalism VA1 1,124 0.76Assault Against Staff: No Weapon BA2 1,093 0.74Sexual Harassment SX0 829 0.56Drug Violations Schedule III-VI Poss./Sale/Dist./ Paraphernalia DR5 739 0.5Alcohol AL1 678 0.46Bringing a Knife to School/School Event (more than 3 inches) WP5 667 0.45Bringing Razor Blades/Box Cutters/Knife less than 3 inches to School/ Event
W8P 554 0.38
Misrepresentation (altering notes, false information, cheating, etc.)
S2V 494 0.34
Inappropriate Personal Property (food/beverage, clothing, toys, etc.)
S1V 492 0.33
Possession of Other Weapon (instrument/object to inflict harm) WP9 457 0.31
4

Offenses Offense Codes
Count Percent
Unauthorized Use of Technology and/or Information T1C 454 0.31Tobacco Paraphernalia to school events T4B 380 0.26
Sexual Offenses Without Force SX7 352 0.24Electronic cigarette (possession, use, sale, distribution) TB2 341 0.23Violations of Acceptable Usage Policy T3C 260 0.18Cyber Bullying BU2 264 0.18Possession of Obscene/Disruptive Literature/Illustrations D4C 261 0.18Bomb Threat BB1 231 0.16Bringing a Toy/Look-Alike Gun to School/School Event W3P 203 0.14Drug Violations Schedule I and II Anabolic Steroid, Marijuana--Sale/Dist.
DR4 188 0.13
Over-the-Counter Medication Possession D5G 182 0.12Electronic Devices (radios, tape players, etc.) C3M 156 0.11Trespassing TR1 155 0.11Possession of a BB gun WP0 148 0.1Gang Activity GA1 116 0.08Drug violation-- look a-like--use/poss. DR2 103 0.07Inciting a Riot RT1 108 0.07Violations of Internet Policy T4C 105 0.07Bringing Fireworks/Explosives to School/School Event W9P 105 0.07Arson AR1 84 0.06Bringing Ammunition to School or School Event W1P 70 0.05Possession of Weapons/Chemical Substance W2P 75 0.05Over-the-Counter Medication Use D4G 66 0.04Offensive Sexual Touching Against Staff SX1 66 0.04Causing/Attempting to Cause Damage to Computer Hardware, Software or Files
T2C 61 0.04
Malicious Wounding without a weapon BA5 37 0.03Assault Against Student--Firearm or Other Weapon BA3 51 0.03Over-the-Counter Medication Sale/Distribution D6G 39 0.03Theft or Attempted Theft of Student Prescription Medication DR3 29 0.02Bringing a Handgun to School/School Event WP1 25 0.02Sexual Battery against Student SB2 34 0.02
Possession of Taser WT1 34 0.02Robbery RO1 17 0.01Gambling G1B 20 0.01Extortion EX1 15 0.01Use of Inhalants D16 15 0.01
5

Offenses Offense Codes
Count Percent
Possession of Inhalants D15 20 0.01Breaking and Entering/Burglary BR1 17 0.01Possession of Stun Gun WS1 16 0.01Possession or Representation of Any Destructive Bomb Device WP6 11 0.01
Bringing Other Weapon, Designed/May Be Converted to Expel WP4 13 0.01
Chart 1. The top fifteen offense codes represent 85 percent of all incidents that occurred for 2016-2017
D2C
D5C
D3C
F1T
D6C
D1C
FA2
D8C
TI2
S3V
HR1
BA4
TB1
BU1
BA6
Other
6
Table 2. Comparison of Incidents in 2016-2017 with 2015-2016. Comparison of the most frequently reported incidents reported in 2016-2017 with incidents reported in 2015-2016.
Offenses Offense Codes
2015-2016
Count
2015-2016
Percent of all
Incidents
2016-2017
Count
2016-2017 Percent of
all Incidents
Defiance of Authority/Insubordination
D2C 21,838 14.59 20,576 13.98
Classroom or Campus Disruption
D5C 17,153 11.46 17,746 12.06
Disruptive Demonstrations D3C 17,081 11.41 16,025 10.89
Minor Physical Altercation F1T 13,854 9.25 14,327 9.74Using Obscene/Inappropriate Language/Gestures
D6C 11,644 7.78 11,119 7.56
Disrespect/Walking Away D1C 10,627 7.1 10,198 6.93Fighting: Mutual Contact--No/Minor Injuries, No Med Attn.
FA2 7,082 4.73 7,356 5.00
Minor Insubordination D8C 4,870 3.25 4,490 3.05Threatening Student (physical or verbal threat or intimidation)
TI2 4,220 2.82 4,421 3.00
Other School Code of Conduct Violation Not Covered in These Codes
S3V 4,133 2.76 4,105 2.79
Harassment HR1 3,695 2.47 3,983 2.71Assault Against Student/No Weapon
BA4 2,897 1.94 2,834 1.93
Tobacco TB1 3,146 2.1 2,616 1.78Bullying BU1 2,694 1.8 2,540 1.73Assault/Battery against student without injury
BA6 1,153 0.77 2,255 1.53
Cellular Telephones C2M 2,780 1.86 2,129 1.45Theft Offenses (except motor vehicles)
TH1 2,357 1.57 2,040 1.39
Threatening Staff Member (physical/verbal thread)
TI1 1,782 1.19 1,829 1.24
Drug Possession/Use of Schedule I and II drugs
DR1 1,860 1.24 1,819 1.24
Attendance A1T 1,714 1.14 1,498 1.02Offensive Sexual Touching Against Student
SX2 1,008 0.67 1,150 0.78
7

Offenses Offense Codes
2015-2016
Count
2015-2016
Percent of all
Incidents
2016-2017
Count
2016-2017 Percent of
all Incidents
Vandalism VA1 950 0.63 1,124 0.76Assault Against Staff: No Weapon
BA2 1063 0.71 1,093 0.74
Sexual Harassment SX0 773 0.52 829 0.56Drug Violations Schedule III-VI Poss./Sale/Dist./ Paraphernalia
DR5 740 0.49 739 0.5
Alcohol AL1 740 0.49 678 0.46Bringing a Knife to School/School Event (more than 3 inches)
WP5 684 0.46 667 0.45
Bringing Razor Blades/Box Cutters/Knife less than 3 inches to School/ Event
W8P 479 0.32 554 0.38
Misrepresentation (altering notes, false information, cheating, etc.)
S2V 655 0.44 494 0.34
Inappropriate Personal Property (food/beverage, clothing, toys, etc.)
S1V 639 0.43 492 0.33
Possession of Other Weapon (instrument/object to inflict harm)
WP9 385 0.26 457 0.31
Unauthorized Use of Technology and/or Information
T1C 326 0.22 454 0.31
Tobacco Paraphernalia to school events
T4B 506 0.34 380 0.26
Sexual Offenses Without Force
SX7 285 0.19 352 0.24
Electronic cigarette (possession, use, sale, distribution)
TB2 352 0.24 341 0.23
Cyber Bullying BU2 199 0.13 264 0.18Possession of Obscene/Disruptive Literature/Illustrations
D4C 265 0.18 261 0.18
8
Offenses Offense Codes
2015-2016
Count
2015-2016
Percent of all
Incidents
2016-2017
Count
2016-2017 Percent of
all Incidents
Violations of Acceptable Usage Policy
T3C 242 0.16 260 0.18
Bomb Threat BB1 205 0.14 231 0.16Bringing a Toy/Look-Alike Gun to School/School Event
W3P 201 0.13 203 0.14
Drug Violations Schedule I and II Anabolic Steroid, Marijuana--Sale/Dist.
DR4 219 0.15 188 0.13
Over-the-Counter Medication Possession
D5G 171 0.11 182 0.12
Electronic Devices (radios, tape players, etc.)
C3M 187 0.12 156 0.11
Trespassing TR1 173 0.12 155 0.11Possession of a BB gun WP0 120 0.08 148 0.1Gang Activity GA1 115 0.08 116 0.08Inciting a Riot RT1 346 0.23 108 0.07Bringing Fireworks/Explosives to School/School Event
W9P 105 0.07 105 0.07
Violations of Internet Policy T4C 86 0.06 105 0.07
Drug violation-- look a-like--use/poss.
DR2 110 0.07 103 0.07
Arson AR1 73 0.05 84 0.06Possession of Weapons/Chemical Substance
W2P 38 0.03 75 0.05
Bringing Ammunition to School or School Event
W1P 64 0.04 70 0.05
Over-the-Counter Medication Use
D4G 72 0.05 66 0.04
Offensive Sexual Touching Against Staff
SX1 53 0.04 66 0.04
Causing/Attempting to Cause Damage to Computer Hardware, Software or Files
T2C 45 0.03 61 0.04
Assault Against Student--Firearm or Other Weapon
BA3 48 0.03 51 0.03
9
Offenses Offense Codes
2015-2016
Count
2015-2016
Percent of all
Incidents
2016-2017
Count
2016-2017 Percent of
all Incidents
Over-the-Counter Medication Sale/Distribution
D6G 58 0.04 39 0.03
Malicious Wounding without a weapon
BA5 53 0.04 37 0.03
Possession of Taser WT1 40 0.03 34 0.02Sexual Battery against Student
SB2 34 0.02 34 0.02
Theft or Attempted Theft of Student Prescription Medication
DR3 26 0.02 29 0.02
Bringing a Handgun to School/School Event
WP1 18 0.01 25 0.02
Gambling G1B 30 0.02 20 0.01Possession of Inhalants D15 23 0.02 20 0.01Robbery RO1 13 0.01 17 0.01Possession of Stun Gun WS1 11 0.01 16 0.01Extortion EX1 14 0.01 15 0.01Use of Inhalants D16 13 0.01 15 0.01Chart 2. Top fifteen offenses codes, percent comparison from 2015-2016 to 2016-2017.
D2C D5C D3C F1T D6C D1C FA2 D8C TI2 S3V HR1 BA4 TB1 BU1 BA60
2
4
6
8
10
12
14
16
2015-20162016-2017
10

11

Table 3. Disciplinary Outcome and Comparison between 2015-2016 and 2016-2017 Type 2015-2016
Count2015-2016 Percentage
2016-2017 Count
2016-2017 Percentage
Short-term suspension (out of school) 151876 89.91 148678 89.23
None 9450 5.59 7456 4.47
In-school suspension 1269 0.75 4449 2.67
Long-term suspension (out-of-school) 4389 2.6 4187 2.51
Modified expulsion to suspension 1521 0.9 1532 0.92
Expulsion 381 0.23 302 0.18Special education interim placement-lea 29 0.02 23 0.01
Total 168,915 100.00 166,627 99.99
Overall Discipline OutcomesDisciplinary outcomes reported for all incidents in 2016-2017 totaled 166,627 a decrease of 2,288 compared with the 168,915 reported in 2015-2016. The majority of disciplinary actions involved short-term suspensions 148,678 (89.23%).
Most of the 148,678 short-term suspensions in 2016-2017 resulted from the twelve most frequently reported offenses. A majority of the offenses involved behavioral disruptions. The most frequently reported offenses resulting in short-term suspensions are in Table 4. The fifteen most frequently reported offenses that resulted in long-term suspensions are shown in Table 5 and the nineteen most frequently reported offenses that resulted in expulsions are shown in Table 6.
Chart 3. Percent of discipline outcome comparisons
Chart Title Short-term suspension (out of school)
None
In-school suspension
Long-term suspension (out-of-school)
Modified expulsion to suspension
Expulsion
Special education interim placement-lea
12

Table 4. Most Frequently Reported Offenses Resulting in Short-Term Suspensions, 2016-2017
Offenses Offense Codes
Counts Percent of all 148,678 Short-
Term SuspensionsDefiance of Authority/Insubordination D2C 21153 14.23
Classroom or Campus Disruption D5C 18806 12.65Minor Physical Altercation F1T 17158 11.54Disruptive Demonstrations D3C 16591 11.16Fighting: Mutual Contact--No/Minor Injuries, No Med Attention
FA2 13029 8.76
Using Obscene/Inappropriate Language/Gestures
D6C 11540 7.76
Disrespect/Walking Away D1C 10360 6.97Minor Insubordination D8C 4780 3.22Other School Code of Conduct Violation Not Covered in These Codes
S3V 4247 2.86
Threatening Student (physical or verbal threat or intimidation)
TI2 2793 1.88
Assault Against Student/No Weapon BA4 2210 1.49
Theft Offenses (except motor vehicles) TH1 2173 1.46
Chart 4. The twelve most frequently reported offenses that resulted in short-term suspensions make up 84 percent of all short-term suspensions.
D2C
D5C
F1T
D3C
FA2
D6C
D1C
D8C
S3V
TI2
BA4
TH1
Other
13

Table 5. Most Frequently Reported Offenses Resulting in Long-Term Suspensions, 2016-2017
Offenses Offense Codes
Counts Percent of all 4,187 Long-Term
SuspensionsAssault Against Student/No Weapon BA4 424 10.13Disruptive Demonstrations D3C 402 9.6Defiance of Authority/Insubordination D2C 247 5.9Threatening Staff Member (physical/verbal threat)
TI1 243 5.8
Threatening Student (physical or verbal threat or intimidation)
TI2 217 5.18
Classroom or Campus Disruption D5C 198 4.73Other School Code of Conduct Violation Not Covered in These Codes
S3V 179 4.28
Fighting: Mutual Contact--No/Minor Injuries, No Med Attention
FA2 177 4.23
Assault Against Staff: No Weapon BA2 172 4.11Drug Possession/Use of Schedule I and II drugs DR1 151 3.61Bringing a Knife to School/School Event (more than 3 inches)
WP5 150 3.58
Using Obscene/Inappropriate Language/Gestures D6C 101 2.41Disrespect/Walking Away D1C 99 2.36Drug Violations Schedule III-VI Poss./Sale/Dist./ Paraphernalia
DR5 98 2.34
Chart 5. Fifteen most frequently reported offenses that resulted in long-term suspensions.
BA4D3CD2CTI1TI2D5CS3VFA2BA2DR1WP5D6CD1CDR5HR1Other
14

Table 6. Most Frequently Reported Offenses Resulting in Expulsions 2016-2017Offenses Offense
Codes CountsPercent of
all 302 Expulsions
Drug Possession/Use of Schedule I and II drugs
DR1 37 12.25
Drug Violations Schedule III-VI Poss./Sale/Dist./ Paraphernalia
DR5 27 8.94
Assault Against Staff: No Weapon BA2 23 7.62Threatening Staff Member (physical/verbal threat)
TI1 23 7.62
Drug Violations Schedule I and II Anabolic Steroid, Marijuana--Sale/Dist.
DR4 17 5.63
Threatening Student (physical or verbal threat or intimidation)
TI2 17 5.63
Bringing a Handgun to School/School Event
WP1 15 4.97
Possession of a BB gun WP0 12 3.97Arson AR1 * *Assault Against Student/No Weapon BA4 * *Classroom or Campus Disruption D5C * *Bringing a Knife to School/School Event (more than 3 inches)
WP5 * *
Vandalism VA1 * *Defiance of Authority/Insubordination D2C * *Alcohol AL1 * *Bomb Threat BB1 * *Disruptive Demonstrations D3C * *Extortion EX1 * *Offensive Sexual Touching Against Student
SX2 * *
15

Chart 6. Nineteen most frequently reported offenses that resulted in expulsions, make up 81percent of all expulsion.
DR1 DR5 BA2
TI1 DR4 TI2
WP1 WP0 AR1
BA4 D5C WP5
VA1 D2C AL1
BB1 D3C EX1
SX2 Other
16


![Crime and Violence in Jamaica[1]](https://static.fdocuments.net/doc/165x107/577d29b91a28ab4e1ea7a3a2/crime-and-violence-in-jamaica1.jpg)