Discerning Influences
15
August 1999 PM Data Analysis Workbook: Characterizing PM 1 Discerning Influences Key reference: • Meteorology: explore the affect of meteorological conditions on PM concentrations and composition. • Emissions: explore the affect of emissions on PM concentrations and composition. • Inter-pollutant relationships: explore the relationships among PM components. • Natural Events: explore the affect of natural events (e.g., dust storms, fires) on PM concentrations.
-
Upload
cynthia-strong -
Category
Documents
-
view
30 -
download
0
description
Discerning Influences. Meteorology: explore the affect of meteorological conditions on PM concentrations and composition. Emissions: explore the affect of emissions on PM concentrations and composition. Inter-pollutant relationships: explore the relationships among PM components. - PowerPoint PPT Presentation
Transcript of Discerning Influences
August 1999 PM Data Analysis Workbook: Characterizing PM 1
Discerning Influences
Key reference:
• Meteorology: explore the affect of meteorological conditions on PM concentrations and composition.
• Emissions: explore the affect of emissions on PM concentrations and composition.
• Inter-pollutant relationships: explore the relationships among PM components.
• Natural Events: explore the affect of natural events (e.g., dust storms, fires) on PM concentrations.
August 1999 PM Data Analysis Workbook: Characterizing PM 2
Emissions
August 1999 PM Data Analysis Workbook: Characterizing PM 3
Meteorology
August 1999 PM Data Analysis Workbook: Characterizing PM 4
Formation and Removal
August 1999 PM Data Analysis Workbook: Characterizing PM 5
Inter-pollutant Relationships
August 1999 PM Data Analysis Workbook: Characterizing PM 6
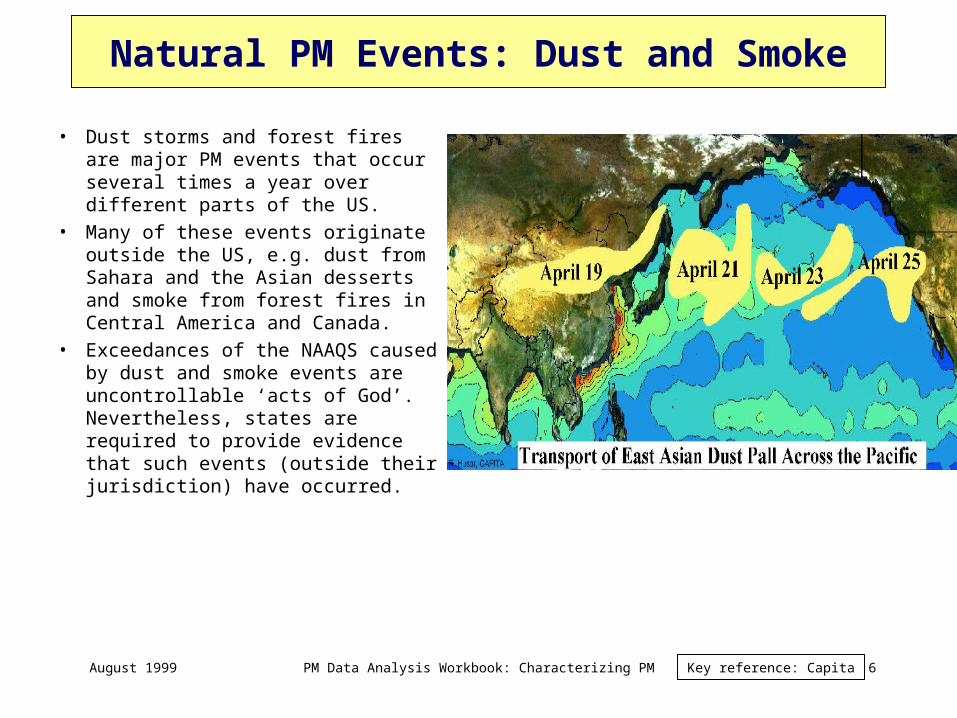
Natural PM Events: Dust and Smoke
• Dust storms and forest fires are major PM events that occur several times a year over different parts of the US.
• Many of these events originate outside the US, e.g. dust from Sahara and the Asian desserts and smoke from forest fires in Central America and Canada.
• Exceedances of the NAAQS caused by dust and smoke events are uncontrollable ‘acts of God’. Nevertheless, states are required to provide evidence that such events (outside their jurisdiction) have occurred.
Key reference: Capita
August 1999 PM Data Analysis Workbook: Characterizing PM 7
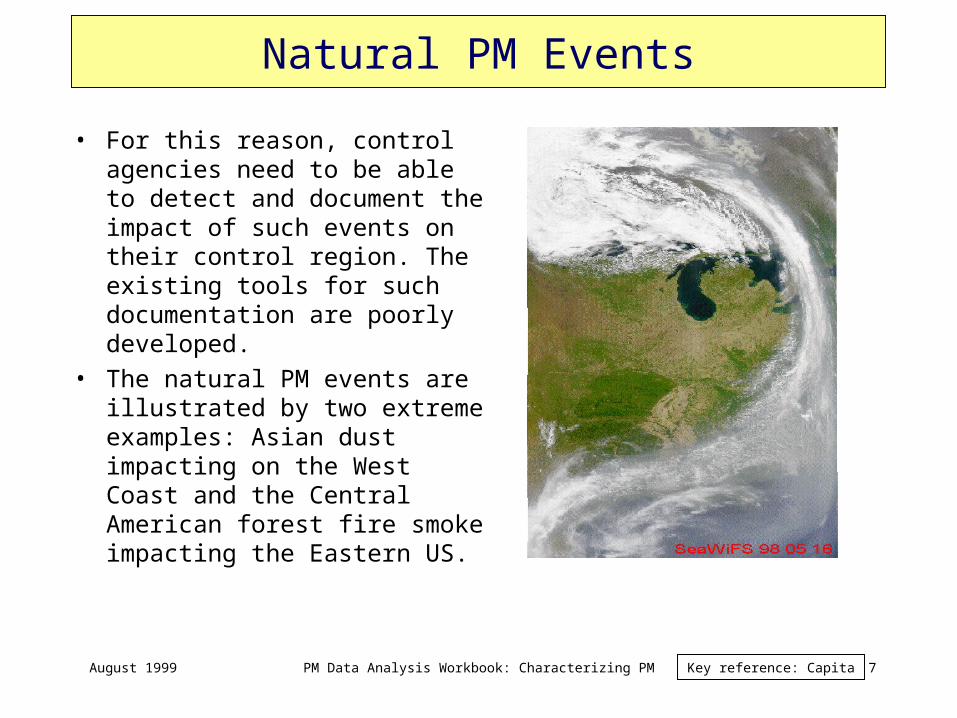
Natural PM Events
• For this reason, control agencies need to be able to detect and document the impact of such events on their control region. The existing tools for such documentation are poorly developed.
• The natural PM events are illustrated by two extreme examples: Asian dust impacting on the West Coast and the Central American forest fire smoke impacting the Eastern US.
Key reference: Capita
August 1999 PM Data Analysis Workbook: Characterizing PM 8
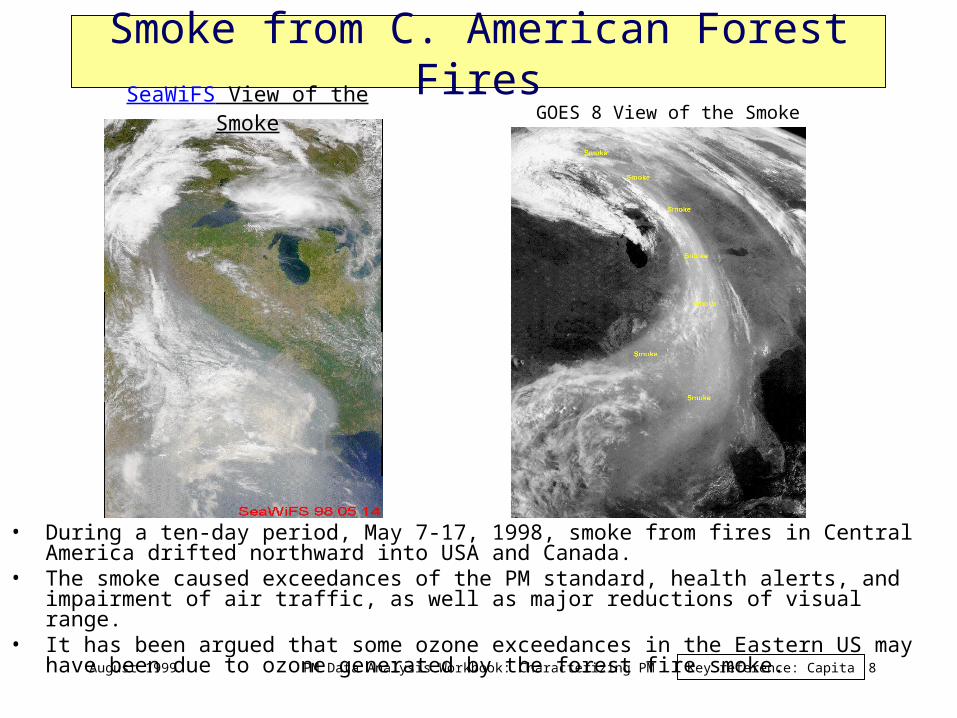
Smoke from C. American Forest Fires
• During a ten-day period, May 7-17, 1998, smoke from fires in Central America drifted northward into USA and Canada.
• The smoke caused exceedances of the PM standard, health alerts, and impairment of air traffic, as well as major reductions of visual range.
• It has been argued that some ozone exceedances in the Eastern US may have been due to ozone generated by the forest fire smoke.
GOES 8 View of the SmokeSeaWiFS View of the Smoke
Key reference: Capita
August 1999 PM Data Analysis Workbook: Characterizing PM 9
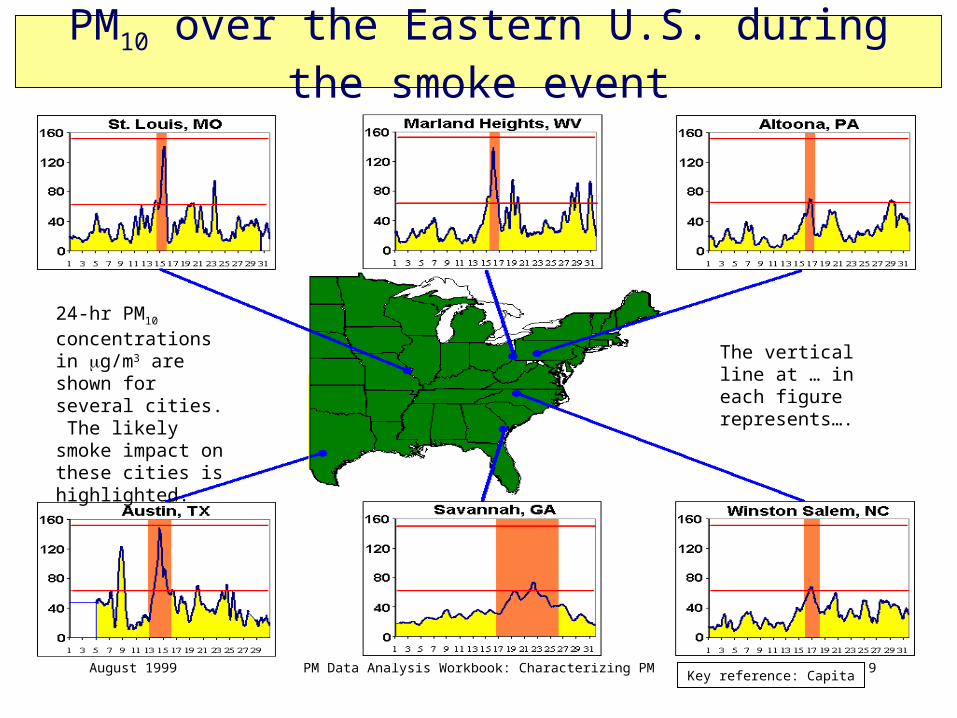
PM10 over the Eastern U.S. during the smoke event
24-hr PM10 concentrations in g/m3 are shown for several cities. The likely smoke impact on these cities is highlighted.
The vertical line at … in each figure represents….
Key reference: Capita
August 1999 PM Data Analysis Workbook: Characterizing PM 10
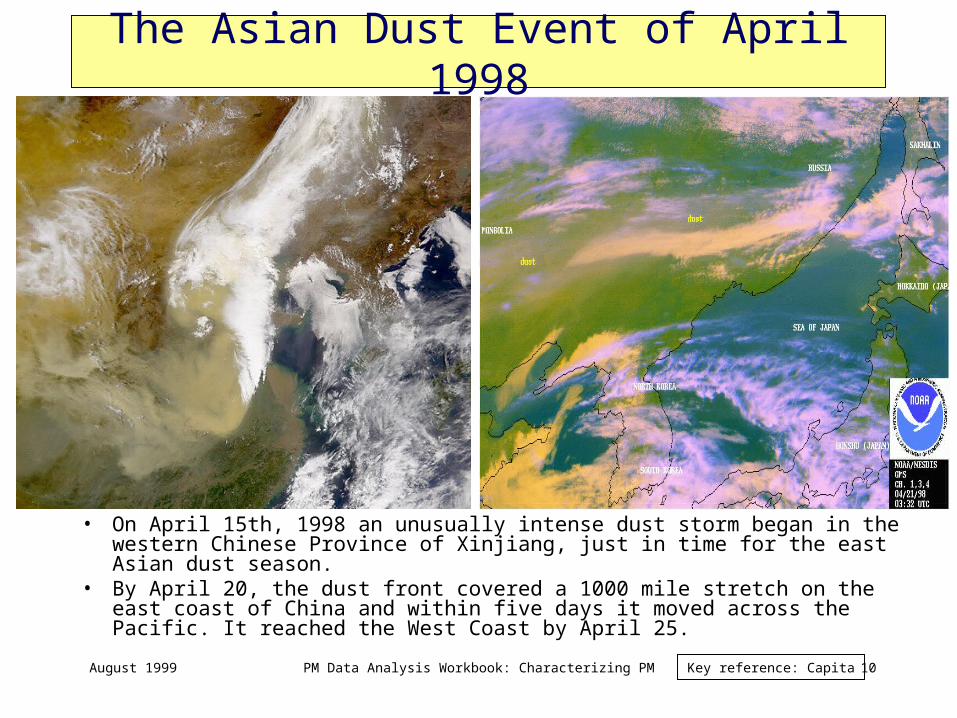
The Asian Dust Event of April 1998
• On April 15th, 1998 an unusually intense dust storm began in the western Chinese Province of Xinjiang, just in time for the east Asian dust season.
• By April 20, the dust front covered a 1000 mile stretch on the east coast of China and within five days it moved across the Pacific. It reached the West Coast by April 25.
Key reference: Capita
August 1999 PM Data Analysis Workbook: Characterizing PM 11
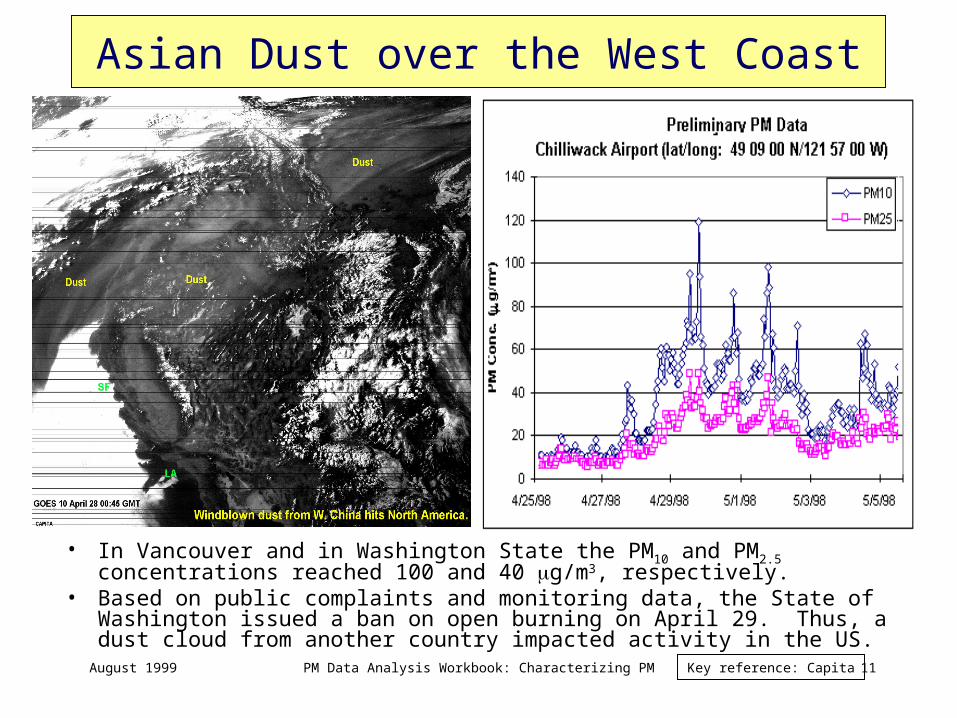
Asian Dust over the West Coast
• In Vancouver and in Washington State the PM10 and PM2.5 concentrations reached 100 and 40 g/m3, respectively.
• Based on public complaints and monitoring data, the State of Washington issued a ban on open burning on April 29. Thus, a dust cloud from another country impacted activity in the US.
Key reference: Capita
August 1999 PM Data Analysis Workbook: Characterizing PM 12
Methods and Tools
August 1999 PM Data Analysis Workbook: Characterizing PM 13
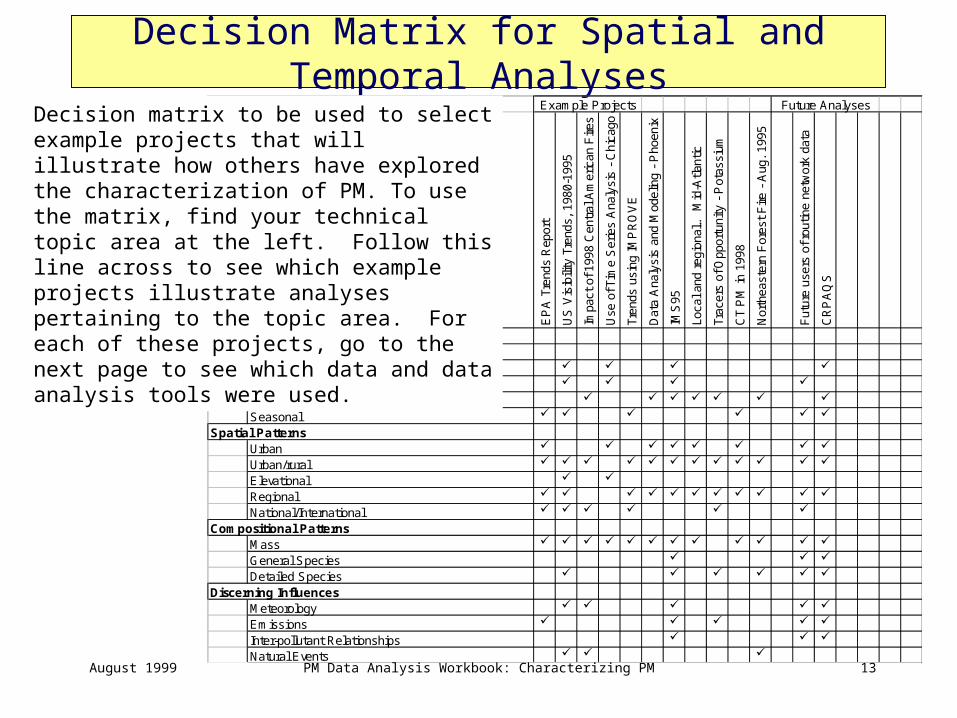
Decision Matrix for Spatial and Temporal AnalysesStatus and Trends Example Projects Future Analyses
EP
A T
rend
s R
epor
t
US
Vis
ibili
ty T
rend
s, 1
980-
1995
Impa
ct o
f 199
8 C
entr
al A
mer
ican
Fire
s
Use
of T
ime
Ser
ies
Ana
lysi
s -
Chi
cago
Tren
ds u
sing
IMP
RO
VE
Dat
a A
naly
sis
and
Mod
elin
g -
Pho
enix
IMS
95
Loca
l and
reg
iona
l… M
id-A
tlant
ic
Trac
ers
of O
ppor
tuni
ty -
Pot
assi
um
CT
PM
in 1
998
Nor
thea
ster
n F
ores
t F
ire -
Aug
. 19
95
Fut
ure
user
s of
rou
tine
netw
ork
data
CR
PA
QS
TECHNICAL TOPIC AREASTemporal Patterns
Diurnal Day-of-Week Episodic Seasonal
Spatial PatternsUrban Urban/rural Elevational Regional National/International
Compositional PatternsMass General Species Detailed Species
Discerning InfluencesMeteorology Emissions Inter-pollutant Relationships Natural Events
Decision matrix to be used to select example projects that will illustrate how others have explored the characterization of PM. To use the matrix, find your technical topic area at the left. Follow this line across to see which example projects illustrate analyses pertaining to the topic area. For each of these projects, go to the next page to see which data and data analysis tools were used.
August 1999 PM Data Analysis Workbook: Characterizing PM 14
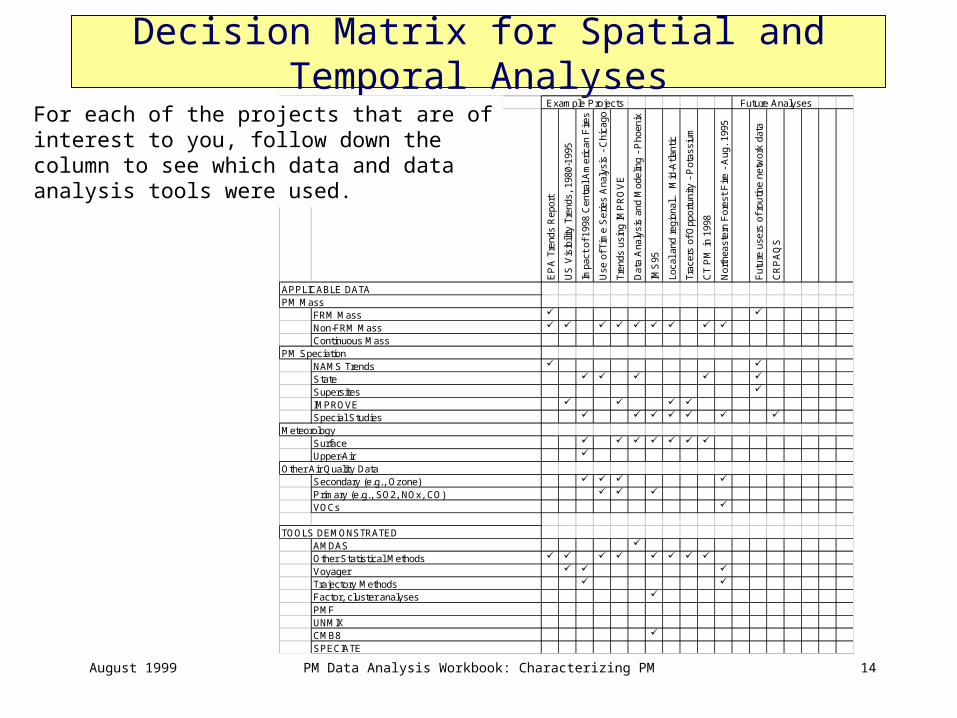
Decision Matrix for Spatial and Temporal AnalysesStatus and Trends Example Projects Future Analyses
EP
A T
rend
s R
epor
t
US
Vis
ibili
ty T
rend
s, 1
980-
1995
Impa
ct o
f 199
8 C
entr
al A
mer
ican
Fire
s
Use
of T
ime
Ser
ies
Ana
lysi
s -
Chi
cago
Tren
ds u
sing
IMP
RO
VE
Dat
a A
naly
sis
and
Mod
elin
g -
Pho
enix
IMS
95
Loca
l and
reg
iona
l… M
id-A
tlant
ic
Trac
ers
of O
ppor
tuni
ty -
Pot
assi
um
CT
PM
in 1
998
Nor
thea
ster
n F
ores
t F
ire -
Aug
. 19
95
Fut
ure
user
s of
rou
tine
netw
ork
data
CR
PA
QS
APPLICABLE DATAPM Mass
FRM Mass Non-FRM Mass Continuous Mass
PM SpeciationNAMS Trends State Supersites IMPROVE Special Studies
MeteorologySurface Upper-Air
Other Air Quality DataSecondary (e.g., Ozone) Primary (e.g., SO2, NOx, CO) VOCs
TOOLS DEMONSTRATEDAMDAS Other Statistical Methods Voyager Trajectory Methods Factor, cluster analyses PMFUNMIXCMB8 SPECIATE
For each of the projects that are of interest to you, follow down the column to see which data and data analysis tools were used.

August 1999 PM Data Analysis Workbook: Characterizing PM 15
References