DISASTERS & DISEASES - Apothecaries
117
Disease & Disasters Risks, Epidemiology, Surveillance & Control Dr Tim Healing Dip.Clin.Micro, DMCC, CBIOL, FRSB, FZS Course Director, Course in Conflict and Catastrophe Medicine Worshipful Society of Apothecaries of London Faculty of Conflict and Catastrophe Medicine
Transcript of DISASTERS & DISEASES - Apothecaries

Disease & Disasters
Risks, Epidemiology, Surveillance &
Control
Dr Tim HealingDip.Clin.Micro, DMCC, CBIOL, FRSB, FZS
Course Director,
Course in Conflict and Catastrophe Medicine
Worshipful Society of Apothecaries of London
Faculty of Conflict and Catastrophe Medicine

Learning ObjectivesUnderstanding:
• The health effects of disasters, groups particularly at risk, and the
communicable disease risks involved
• The diseases most commonly associated with disasters
• The essentials of the control of communicable disease in disasters
(Assessment, Prevention, Surveillance, Outbreak control, Management of
cases)
• The basics of two of the tools used in disease control,:
• Epidemiology
– Basic epidemiological terms and key indicators and how these can help define the
health status of a population
• Time, Person & Place
– Application of these terms and indicators in the investigation of a disease outbreak
• Surveillance
– Definition of surveillance, essentials of surveillance systems
– Designing and establishing a system

Classification of Disasters
Natural
A) Sudden or acute onset:
• Earthquakes
• Floods
• High winds
• Landslides
• Volcanic eruptions
• Epidemics
B) Slow or chronic onset
• Drought
• Famine
(N.B. All “natural disasters” have a “human-made” element as they are a function of where people chose or are forced to live)
Human-made
• Industrial – chemical accidents, fire, explosion, pollution, terrorism
• Transport accidents
• Deforestation
• Complex emergencies – wars, civil strife etc leading to displaced persons and refugees

Natural disasters
The number of natural
disasters & totals affected
increased dramatically
after 1970 but there has
been a declining trend in
recent years*.[335 natural disasters reported in 2017,
569 million people affected]
Natural disasters reported 1900 – 2015
(data from EM-DAT*)
* EM-DAT: The OFDA/CRED International Disaster Database – www.emdat.be – Université Catholique de Louvain –
Brussels – Belgium
Numbers affected by natural disasters
1900 – 2015(data from EM-DAT*)

Natural
disasters
2017

Active Conflicts
• The number of conflicts has fallen since the end of the Cold War
• December 2018:
–At least 18 active conflicts causing >1000 fatalities/year
–Many more smaller scale conflicts, terrorist activities
Wikipedia

Majority of disasters occur in
developing countries
Natural disasters: threat level
Wikipedia
Ongoing armed conflicts in 2018: updated
December 2018

Health effects of different types of
disaster• The nature of disasters determines:
– the patterns of morbidity & mortality
– subsequent health problems
• Multifactoral
– Nature of the disaster
– Duration
– Location
– Affected population
– Access
– Effects on infrastructure
– Endemic diseases
– Security
– etc.
• These will in turn affect the nature of the response needed

Earthquake / tsunami
• Release of vast amounts of energy
• Wide areas affected
• Earthquakes above Force 7 on Richter
Scale:
– Extensive destruction
– Many fatalities
– Population displacement
• Trauma– many with minor cuts & bruises
– smaller group with simple fractures
– a minority need surgery / other intensive treatment
• serious multiple fractures, internal injuries & crush syndrome
• Drowning
• Asphyxia
• Dust inhalation
• Burns and electric shock
• Environmental exposure (hypothermia)
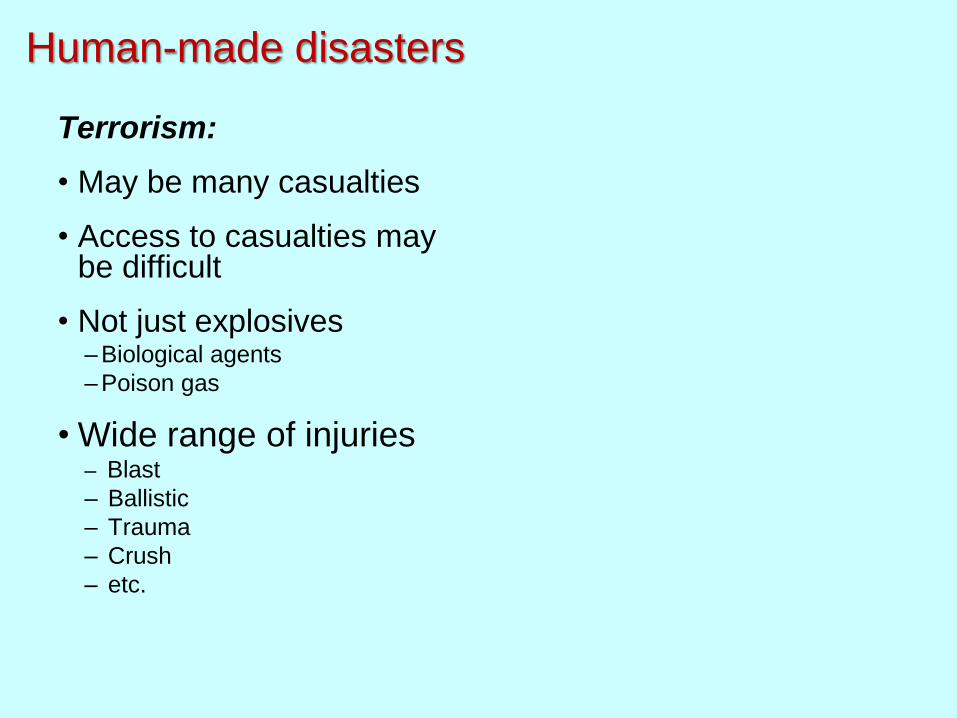
Human-made disasters
Terrorism:
• May be many casualties
• Access to casualties may be difficult
• Not just explosives– Biological agents
– Poison gas
• Wide range of injuries– Blast
– Ballistic
– Trauma
– Crush
– etc.
Disasters & communicable diseaseNatural disasters
Acute onset
– Trauma is the main immediate cause of morbidity & mortality,
– Communicable diseases (CD) occur later
– Outbreaks of CD less frequent in natural disasters than in conflicts
Long term
– Morbidity & mortality often related to malnutrition
Conflicts
• In many wars more people die from illness than trauma
– Estimates of mortality:
• Darfur (2004 – 8): > 80% of ca. 300,000 deaths due to disease*
• Yemen: ratio deaths from famine & disease : deaths in conflict = 4:1
*Degomme O, Guha-Sapir D. Patterns of mortality rates in Darfur conflict. The Lancet, 375
Issue 9711, 294 - 300, 23 January 2010

Factors increasing the risk of outbreaks of disease in
disasters• Breakdown of control measures
– Damage to:
• health facilities
• infrastructure (e.g. water purification, sewage systems, power supplies etc.)
– Loss of staff
– Damage to or loss of:
• immunisation programmes
• vector control programmes
• WASH programmes
– Contamination of water & food
• Breakdown of long term treatment
programmes
– Infectious agents (e.g.TB)
– Non infectious illnesses
• Increased susceptibility
• Displacement
• CrowdingPuvacic Z, Weinberg J. Impact of war on infectious disease in Bosnia-Hercegovina. BMJ. 309 1994. 1207-8.

Disease outbreak risks &
displacement
The risk factors for outbreaks of communicable disease after
disasters are associated primarily with population displacement*
*Noji EK (Ed) The Public Health Consequences of Disasters. Oxford, OUP. 1997
*Watson JT, Gayer M, Connolly MA. Epidemics after natural disasters. Emerg Infect Dis [serial on the Internet]. 2007 Jan
>24 million displaced by natural disasters
UNHCR Data
25/06/2018

Displaced persons - groups at high risk
• Children (especially <5Y & unaccompanied)
• Women (especially pregnant women & nursing mothers)
• >75% of refugees & IDPs at risk are women & children• ~25% of this population are women of
reproductive age
• 20% of these likely to be pregnant
• Elderly people
• Disabled people

Communicable disease risks due to
population displacement
• Risk to displaced persons– Health status of the displaced population
– Access to healthcare
– Increased susceptibility• Reduction in immune competence due to:
–Stress
–Poor diet
–Malnutrition
– Exposure to “new” organisms
– Water & Sanitation
– Exposure to contaminated food
– Crowding
• Risk to host populations• (particularly in the urban environment, host populations
may be as much or more at risk)
– Imported organisms
– Malnutrition due to overexploitation of limited resources

Disasters - What diseases?
• Common things happen commonly–The CD facing displaced persons will generally be those normally present in the areas through which & to which they have moved
• Some diseases are more likely to cause immediate problems than others–GI (impure water, contaminated food)
–Respiratory / respiratory route (crowding)
–Vector borne (breakdown of vector controls & possibly increase of breeding potential for vectors)

Disasters - What diseases?
• 5 conditions consistently account for 60-95% of deaths in displaced populations*
– Acute respiratory infection (ARI)
– Malnutrition
– Diarrhoea
– Measles
– Malaria
• Need to consider the long term as well as the short– TB
– HIV/AIDS
*Noji EK. Public Health in the Aftermath of Disasters. In: ABC of Conflict and Disaster. Ed: Redmond
AD, Mahoney PF, Ryan JM, Macnab C. BMJ Books 2006
Respiratory disease
• ARI - major cause of illness & death in displaced populations
• Children <5Y especially at risk
• Risk of death from ARI increased by lack of access to:– health services
– antimicrobial agents for treatment
• Risk factors among displaced persons include – crowding
– exposure to indoor cooking using open fires
– poor nutrition

Other important organisms
transmitted via the respiratory tract
•Measles
•Diphtheria
•Pneumonic plague
•Bacterial meningitis
All of these have disaster implications

Malnutrition
• Acute malnutrition (wasting), especially in young children– Measured as weight-for-height, presence of
bilateral oedema, MUAC
• Marasmus – severe weight loss leaving ”skin and bones‟ shortage of proteins & calories
• Kwashiorkor – bloated appearance due to water accumulation (oedema) (protein, antioxidant & micronutrient deficiency)
• Marasmic-kwashiorkor – a combination of both
• Chronic malnutrition (stunting) – Inhibits full mental & physical potential
– Small mothers have small babies
Photographs reproduced by courtesy of Marie McGrath and the Emergency Nutrition Network
Malnutrition and communicable
disease
• Malnourished individuals have an increased
susceptibility to infection
– PEM & micronutrient deficiencies damage the immune
system
• Malnutrition magnifies the effects of disease
– more severe disease episodes
– more complications
– longer duration of illness

Diarrhoeal disease
• The big three– Cholera (acute watery diarrhoea)
– Dysentery (bloody diarrhoea)
– Typhoid (Enteric fever)
• Many other causes of GI infections - usually endemic not epidemic - can cause much morbidity
• NB. Diarrhoea +/- vomiting +/- fever may be a symptom of another type of disease – not a GI infection!
• Treatment usually (initially) symptomatic

Measles • Very infectious & potentially fatal
• Widespread despite vaccination
programmes
– >20,000,000 cases/year
– vaccination led to a 80% drop in measles
deaths between 2000 & 2017 worldwide
• Mortality:
– 110,000 measles deaths globally in 2017
– >95% in low-income countries
– mostly children <5Y
• Common in crowded emergency settings, large population displacements & high levels of malnutrition.
• Worst single killer of children in some refugee situations
• Vaccination & Vitamin A are vital components of initial control measures.

Malaria• Caused by protozoan parasites, Plasmodium spp.
• Transmitted by female Anopheles mosquitoes
• Widespread in tropical & subtropical regions – ca. 3.5 billion people at risk
– 219 million cases of malaria in 2017
• 201 million in Africa
– ca. 435,000 deaths from malaria in 2017(70% children <5Y)
• 93% in Africa
• Vector control, protective measures, treatment
Data from Roll Back Malaria, 2010; WHO, 2010

Malaria and
disasters
• Majority of countries
affected by disasters are
in malaria endemic areas
• In 2010, 30% of Africa’s
malaria related deaths
were in countries
experiencing complex
emergencies*
*WHO, World Malaria Report 2010. Refugee map from UNHCR Statistical Yearbook 2010
**EM-DAT: The OFDA/CRED International Disaster Database – www.emdat.be – Université Catholique de Louvain – Brussels
– Belgium
**Number of victims of natural disasters by
100,000 inhabitants: 1976 - 2005
Conflicts (Dec 2018)

Longer term problems:
TB & HIV/AIDS
• Not acute short term problems
• Potential long term problems– Risks of transmission due to:
– overcrowding
– poor conditions
– malnutrition
– breakdown of social networks
– economic vulnerability
– sexual violence
– Risks to aid workers
• Difficult to treat in mobile (e.g. refugee/IDP) populations– Incomplete treatment risks development of
resistance

Diseases as the causes of disasters
• An important factor in the past– Black death began 1348.
• Probably reduced the world's population by 20% by 1400
– 1918-20 “Spanish” flu may have killed up to 100 million people (5% of the world’s population)
• Less so now that we have:
– good treatment methods
– are aware of risks
– are aware and can potentially
undertake successful preventive
measures

Ebola Virus Disease West Africa, 2013-16
• 28,646 cases (suspected, probable & confirmed)
–15,261 Lab-confirmed
• 11,323 Deaths
• M:F ratio 1:1
• Median age of cases 32Y
• CFR during outbreak
49 - 64% among hospitalized patients
Data from WHO and CDC Sitreps
Outbreak distribution map: all
cases

Effects of the Ebola outbreak in West Africa
Out of proportion to the actual size of the outbreak.
Numbers % of population
Cases 28,652* 0.13
Deaths 11,325* 0.05
Population 22,130,000** -
* probably lower than the real figures because many cases and deaths in the community were almost certainly not recorded** estimated
Rate: 130/100,000 Persons

Effects of the outbreak
• Serious increases in morbidity and mortality
from all causes
– Reduced capacity/unwillingness to treat other
conditions
• Changes in social & individual behaviour
• Serious economic impact
– Rising costs
– Unemployment
– Inflation
– Reduced agricultural output
– Loss of direct foreign investment
• Countries affected were unable to cope
• Required extensive external assistance

Can the Ebola outbreak in West Africa be defined
as a Disaster?
A serious disruption of the
functioning of a community or a
society ……….., leading to one or
more of the following: human,
material, economic and
environmental losses and impacts.
Yes
Annotations: ………The effect may test or
exceed the capacity of a community or
society to cope using its own resources, and
therefore may require assistance from
external sources, which could include
neighbouring jurisdictions, or those at the
national or international levels.
Yes
[On the basis of the UNISDR definition of a
disaster]

Communicable disease control
•Rapid Assessment
•Prevention
•Surveillance
•Outbreak control
•Disease management

Assessment
To:
• Identify the communicable disease threats
faced by the population affected by a
disaster
•Define the health status of the population
•Detect outbreaks
•Determine the ability of the population &
the responding agencies to control the
various diseases
•Determine needs

Prevention
• Maintain a healthy environment &
good living conditions
• Ensure a good nutritional status
• Introduce measures to:
– prevent person to person spread
– control vectors
– prevent contact with vectors
– prevent spread via the environment
• Public health education
programmes
• Vaccination
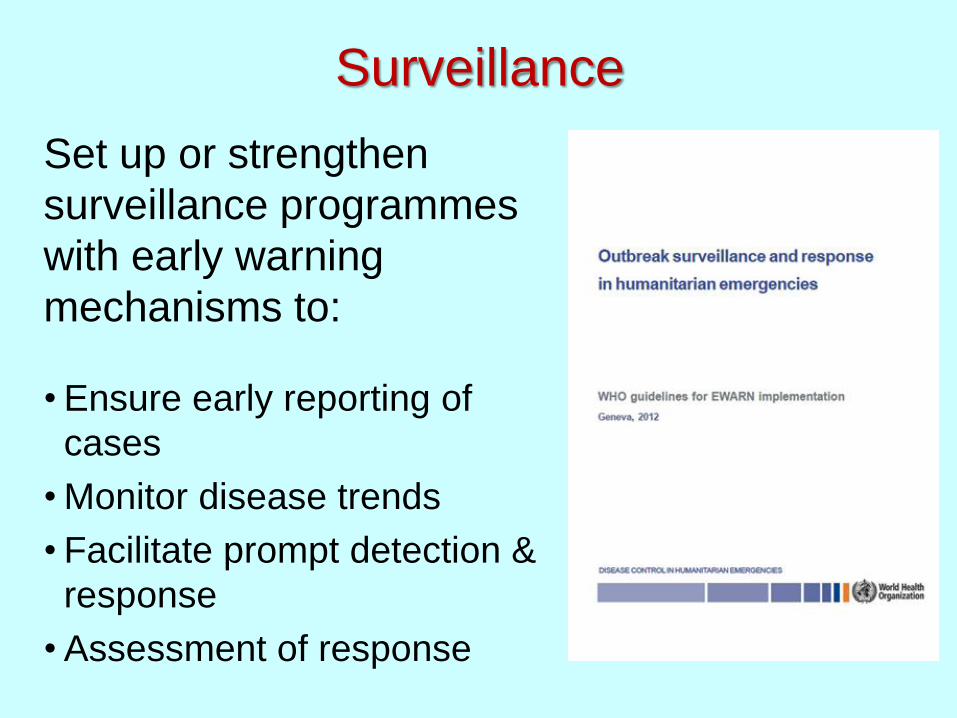
Surveillance
Set up or strengthen
surveillance programmes
with early warning
mechanisms to:
• Ensure early reporting of
cases
• Monitor disease trends
• Facilitate prompt detection &
response
• Assessment of response

Control outbreaks
• Preparedness:
– Stockpiles
– Treatment protocols
– Training
• Rapid detection
• Rapid response
– Investigation
– Confirmation
– Treatment
– Implement controls

Disease Management
•Prompt and accurate diagnosis
– Syndromic
– Laboratory
•Case definitions
•Treatment
– Stockpiles
– Effective treatment
– Standard protocols
– Training

Monitoring effectiveness of control
programmes
• Estimate disease burden
• Identify risk groups
• Determine incidence trends over time
• Measure outcomes & impacts of preventive,
treatment & public health interventions
• Evaluate the overall control interventions

To undertake health programmes and
disease control activities you need to know:
• Population makeup– Numbers
– Ages
– Sex ratios
• The health status of the population
• What diseases affect the population
• Who might be affected
• Any information about transmission (e.g. seasonal factors,
vectors)
• What is the makeup, skills etc. of the health services
• What health care facilities are available
• Etc!!!

Epidemiology
The study of diseases in human populations in order to promote,
protect & restore health

Disaster epidemiology
The use of epidemiological
methods to study and
manage the public health
aspects of disasters.

Time, Person & Place
I keep six honest serving men
(They taught me all I knew)
Their names are What and Why and When
And How and Where and Who
Rudyard Kipling (Just So Stories, 1902)

Time
•When did the problem start?
• Is it still happening?
• If it has finished – when?
•What might have been happening at those
times?

Time – outbreak curvesPoint source outbreak
0
5
10
15
20
25
30
35
1 2 3 4 5 6 7 8 9 10 11
Day
No
of
cases
Point source with secondary
transmission
0
10
20
30
40
50
60
1 2 3 4 5 6 7 8 9 10 11 12 13 14 15 16 17 18 19 20 21 22 23 24 25 26 27 29 29 30 31 32
Day
No
of
cases
Continuing common source
0
5
10
15
20
25
30
35
40
1 2 3 4 5 6 7 8 9 10 11 12 13 14 15 16 17 18 19 20 21
DayN
o o
f cases

Person
• Old?
• Young?
• Female?
• Male?
• Defined group?
• Characteristics?

Place
• The Soho
cholera
outbreak &
the Broad
Street pump,
August 1854

The Broad Street Cholera outbreak
The Widow of Hampstead

Numbers & Rates
• Numbers of cases:
–Assessment of needs for
resources (human &
material)
–Can be misleading regarding
disease situation
• Rates (numbers per unit
of population)
–Assessment of changes of
disease levels in the
population
–Used to calculate key
indicators

Key indicators : Mortality #1
Changes in mortality rates are often the first indicator of health problems.
Crude Mortality Rate (CMR)
• The most important - indicates the severity of the problem.
– Changes in CMR show how a medical emergency is developing.
– Usually number of deaths / 10,000 persons / day
• CMR >1/10,000/day = acute emergency is developing
– N.B. For <5Y, daily CMR cut off value is >2/10,000/day (if no population data for <5y, use estimate of 17% of total population).
• The emergency phase lasts until the daily CMR falls to 1/10,000/day or below.
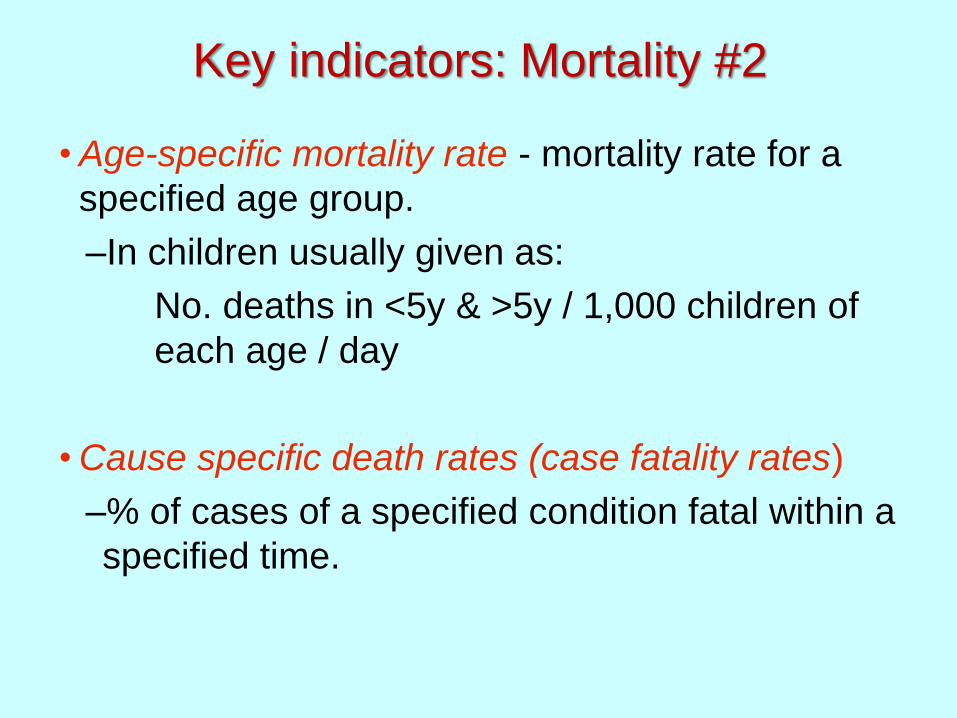
Key indicators: Mortality #2
• Age-specific mortality rate - mortality rate for a
specified age group.
–In children usually given as:
No. deaths in <5y & >5y / 1,000 children of
each age / day
• Cause specific death rates (case fatality rates)
–% of cases of a specified condition fatal within a
specified time.

Key indicators: Mortality #3
• Maternal mortality rate
–No. of mothers dying from puerperal causes within x
days of giving birth / y births / z time
–Maternal death - the death of a woman whilst pregnant
or within 42 days* of the termination of the pregnancy,
from any cause related to the pregnancy or its
management.
(* Can be 1 year)
A sensitive indicator of the effectiveness of health care
systems.

Key indicators: Morbidity
The main morbidity figures for a disease are:
• Incidence The number of new cases during a defined period of time
– Attack rate (used in outbreaks – usually expressed as %) (alsoincidence proportion or cumulative incidence).
No. of new cases within a specified time period / size of the population initially at risk.
(e.g. if 30 people / 1000 persons develop a condition over 2 weeks, the AR/IP/CI is 30/1000 [3.0%])
– Incidence rate. No. of new cases per unit of person-time at risk. (In the above example: the IR is 15/1000 person-weeks).
(Useful where the amount of observation time differs between people, or when the population at risk varies with time)
• Prevalence. (Indicates how widespread the disease is) The total number of cases in a population at a given time.

Other indicators: Nutritional status
• Prevalence of:
– Global acute malnutrition (moderate & severe
malnutrition) in children 6-59m (or 60-110 cm
height)
– Severe acute malnutrition in children 6-59m (or 60-
110 cm height)
– Micronutrient deficiencies
• No. of children needing selective feeding
programmes (SFP)
• No. of additional calories/day to be provided by
SFP

Other indicators: Immunization
• Assess need for campaigns on the basis of:
– national vaccination records
– questioning mothers
– written vaccination histories
• Assess effectiveness of programmes by:
– % of children vaccinated (use children
attending clinics as surrogate value).
• (Says nothing about vaccination success!)

Other indicators: misc
• Vital needs
– WASH, food & shelter
• Health service activities
– numbers of:
– consultations/day
– vaccinations
– admissions to hospitals
– children in feeding programmes
– effectiveness of supply chain
– maintenance of cold chain
– lab activities

Outbreak investigation, Angola,
Oct-Nov 2007
• Investigation of outbreak of neurological illness undertaken by Angolan Ministry of Health (MINSA)
• Supported by WHO (Angola, AFRO region & Geneva offices)

• On 24th October 2007,
the Direction
Provinciale de la Santé
(DPS) in Angola
reported that 42 cases
of a “neurological
illness” with 3 fatalities
had occurred in the
municipality of Cacuaco
to the north-east of the
capital Luanda since
the beginning of
October.

Symptoms
General
▪ Affected patients normally
& previously healthy
▪ No fever, headache,
diarrhoea, abdominal
pain, vomiting
Neurological symptoms
▪ Dizziness
▪ Weakness
▪ Muscular spasms
▪ Ataxia
▪ Somnolence or semi-coma

Case definition
“Any person who presents with sleepiness, deep
asthenia, blurred vision, dizziness, difficulties in
speaking and difficulties in walking”.

Outbreak curve, Cacuaco 2007
0
5
10
15
20
25
30
35
40
19 21 23 25 27 29 31 2 4 6 8 10 12 14 16 18 20 22 24 26 28 30 2 4
No
.of
cases
Oct Nov Dec
Causative agent
identified
Route of exposure
identified
Control measures
introduced
Continuing common source
0
5
10
15
20
25
30
35
40
1 2 3 4 5 6 7 8 9 10 11 12 13 14 15 16 17 18 19 20 21
Day
No
of
cases

Sex and age of cases (compared to Angola age pyramid)
62% Female, 38% Male
0
10
20
30
40
50
60
70
80
0-5Y 6-
10Y
11-
15Y
16-
20Y
21-
25Y
26-
30Y
31-
35Y
36-
40Y
41-
45Y
46-
50Y
51-
55Y
56-
60Y
61-
65Y
66-
70Y
Age group
No
. o
f cases

Angola 2007: location of cases

Epidemiology
• 461 cases in CacuacoMunicipality
• Mainly children, majority female
• No exclusively breastfed infants
• Households of 8/19 bairros(neighbourhoods) affected
• Additional 17 cases in Caxito, Bengo Province (north of Cacuaco) –15 linked to travel in and around
Cacuaco; 2 lost to follow-up
–No new cases in Bengo after 14 November
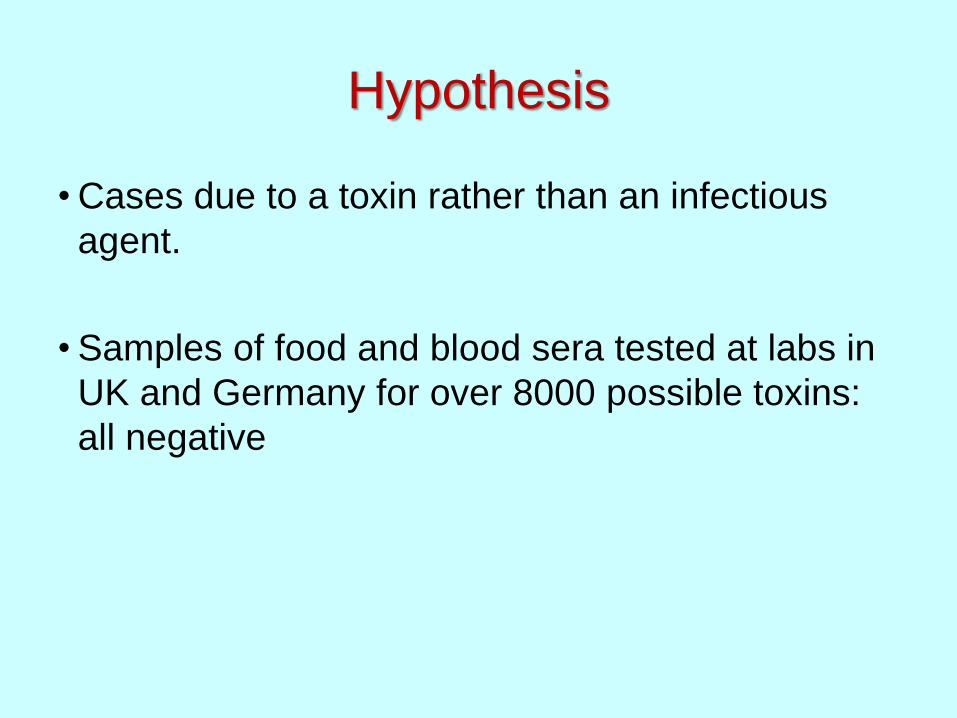
Hypothesis
• Cases due to a toxin rather than an infectious
agent.
• Samples of food and blood sera tested at labs in
UK and Germany for over 8000 possible toxins:
all negative

Cause
• Bromide poisoning suggested
as cause.
• Blood sera from cases +ve
• High concentrations of sodium
bromide (>80%) found in table
salt
• None in other foods
• Cause was probably ingestion
of table salt contaminated with
sodium bromide

Sodium bromide
• White crystalline compound
• Looks like sodium chloride
• Tastes weakly “salty”
• Widely used as an anticonvulsant
& a sedative in the late 19th &
early 20th centuries
• In Angola, used extensively in the
oil industry
• Very large amounts transported in
25kg bags on trucks

Sex and age association
• Females more affected than males because at
home more, cooking & tasting food.
• Children are at home and (especially female)
taste food when helping mothers cook. (Also
lighter and toxic dose smaller).

Public health measures
• Remove contaminated salt
from the community–Identification of safe salt supply
–Recall & replacement process
• Develop public health
messages
• Source investigation
– Investigation of other food sources
• Prevention of similar
incidents
– Improved security of chemicals
– Education

Summary #1
Time, Person & Place etc.
• WHERE – (Place) Cacuaco (8/19 bairros) (+Bengo)
• WHEN – (Time) Oct-Dec 2007, probably initial
event late Sept-early Oct
• WHO – (Person) Inhabitants of 8 bairros in Cacuaco, mainly female, mainly young.
• WHY – Contamination of table salt
• WHAT – Sodium bromide
• HOW – Unknown (Deliberate?).

Summary #2
• Outbreak identified by –Reports to surveillance system
–Enhanced surveillance to define extent
• Epidemiological methods used to describe and investigate the outbreak
• Causative agent identified due to personal knowledge/expertise
• Laboratory work used to find and confirm cause & contaminated material
• Clinical measures used to treat patients
• Public health measures used to end outbreak & prevent recurrence
• NB. Descriptive study
• Investigative methods such as case-control or cohort studies probably would not have worked in this instance.

Surveillance

Obtaining
adequate
information from
the very start is
the key to an
effective
emergency
response.

Surveillance(WHO definition)
“The ongoing systematic collection, analysis
and interpretation of data in order to plan,
implement and evaluate public health
interventions”.

EWARN
• In humanitarian emergencies, normal
health surveillance systems may be
overwhelmed, underperforming,
disrupted or non-existent
• An early warning alert and response
network (EWARN) is often set up to
supply essential data particularly in the
acute phase of an emergency
• Not a substitute for a national disease
surveillance system, after the acute
emergency phase it should be integrated
into the national surveillance system.

Surveillance data
Provides information to:
• Set priorities
• Detect disease outbreaks in a timely manner & prevent
epidemics
– Determine distribution & spread of disease
– Set up appropriate & effective public health responses
– Provide data to evaluate control measures
• Programmes
– Plan & set up
– Monitor progress
– Modify
• Prepare funding applications
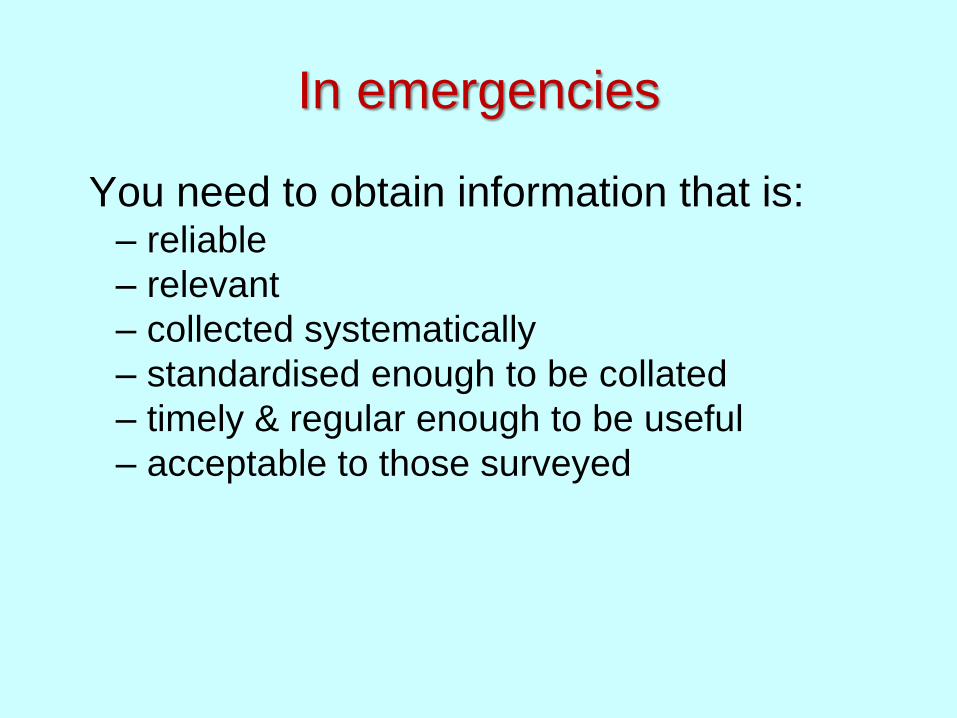
In emergencies
You need to obtain information that is:– reliable
– relevant
– collected systematically
– standardised enough to be collated
– timely & regular enough to be useful
– acceptable to those surveyed

In emergencies
You need to collect enough information to implement an effective response• Too much – wastes time
• Too little – ineffective response
Therefore the methods used need to be practical, consistent & rapid rather than absolutely accurate.
[“In emergencies it is better to be approximately right than precisely wrong”. (D.Guha Sapir – CRED Louvain)]

Essential principles for surveillance
programmes
•Simple and flexible
•Sustainable (long term, local resources)
•Appropriate (information & resources)
•Acceptable to those surveyed
•Case definitions

Essential principles for surveillance
programmes
•Able to provide:– essential minimum of accurate information
– timely reporting
– coverage of the whole affected area
– information regularly from defined sites
•Compatible with existing systems & use existing records & systems
•Collaboration between agencies & with local services

When designing a health surveillance
system you need to:
• Define the population under surveillance
• Determine what type of system can be established
(e.g. sentinel, comprehensive)
• Set priorities
– What is to be monitored (e.g. diseases or syndromes)
– What data should be collected
– Key indicators & epidemic thresholds
• incidence rates
• mortality rates
• when should outbreaks be declared

When designing a health surveillance
system you need to:
• Identify data sources
• Set up agreed case definitions
• Establish data handling systems
– Recording & transferring data
– Verifying data
– Frequency of reporting
– Data analysis (by whom, where & how often)
– Disseminating results (to whom & how often)
• Protocol for evaluating the system

What data?
• Primary data – from your own system
– Demography
– Mortality
– Morbidity
– Nutrition
– Health sector activities inc. local health services
– Activities in related sectors
• Secondary data from:
– Other agencies, government, UN, local health services
(may not be able to check accuracy of such data)

Demographic Data
• Population
– With age/sex breakdown and sometimes by other
categories as well
• Ethnic group
• Groups at risk
– elderly
– unaccompanied children
– pregnant & lactating women
• In emergencies, no. of <5Y usually a key
factor in planning services.

Population Estimates
• Essential information
• Needed to calculate:1. Rates
2. Resource needs (food, water, shelter, medical)
• Establish methods to obtain the figure
• May need to start with a rough estimate & refine later
• Triangulate methods
• Can be politically sensitive
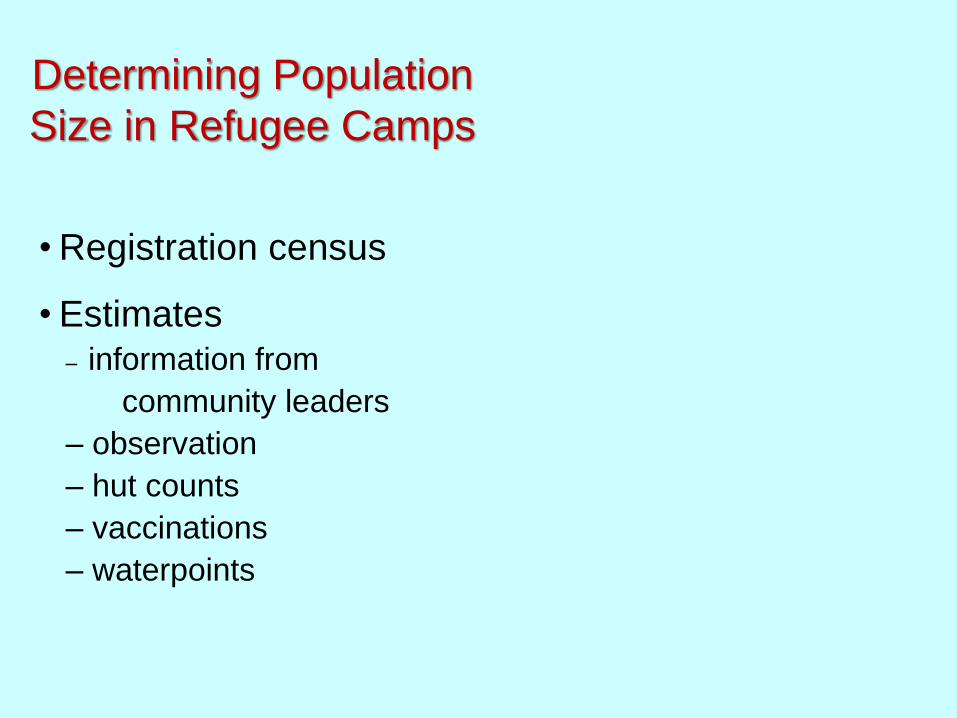
Determining Population
Size in Refugee Camps
• Registration census
• Estimates – information from
community leaders
– observation
– hut counts
– vaccinations
– waterpoints

Mortality Data
• Obtain data from– Health centres, hospitals, feeding centres
– Surveys
– Body collection
– Graveyard watch 24hr.
– Shroud distribution
– Community workers/leaders (increligious)
• For each death, aim to get:– date, name, age, sex, “address”, cause

Morbidity
• Health information systems based on health centre attendance are the most common– passive
– rely on who presents to the services
• Other sources of data: – Community workers
– Surveys
– PM questionnaires,
– Outbreak investigations.

Other “Condition” Information
• Pregnancy & childbirth
• Disability
• Other physical & mental vulnerabilities
including unaccompanied minors & elderly
• Previous treatment (e.g. for TB)
• Chronically ill on treatment - more common in
“European” emergencies.

Nutritional Information
• Anthropometric: community & centres
– W/H, BMI, MUAC, Oedema, (W/A), Vitamin and
mineral deficiencies
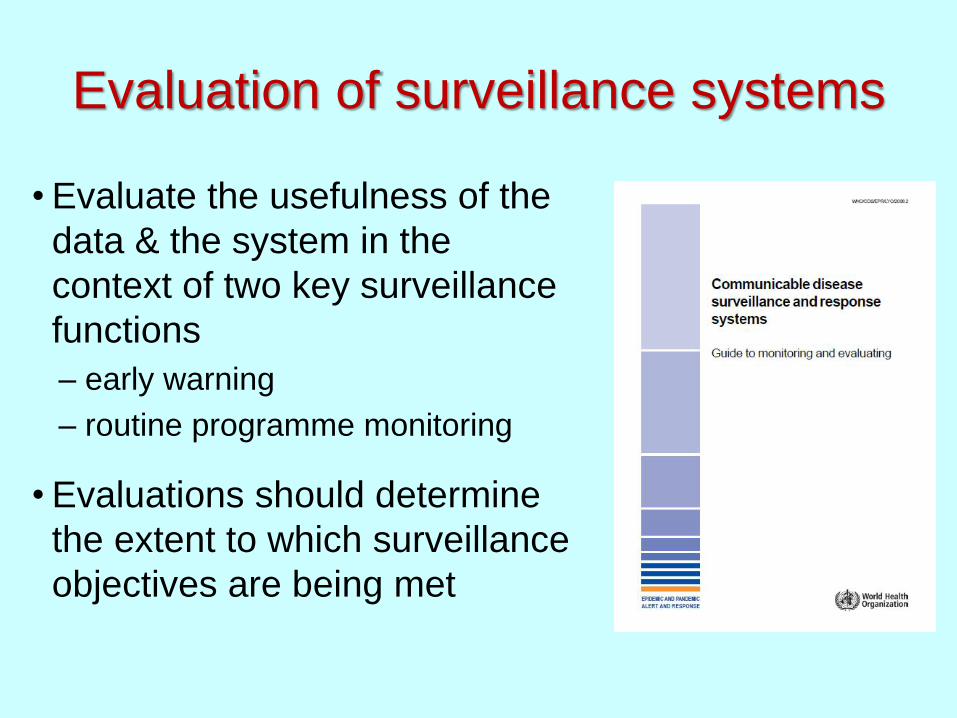
Evaluation of surveillance systems
• Evaluate the usefulness of the
data & the system in the
context of two key surveillance
functions
– early warning
– routine programme monitoring
• Evaluations should determine
the extent to which surveillance
objectives are being met

Surveillance in a complex emergency with
a refugee/IDP problem
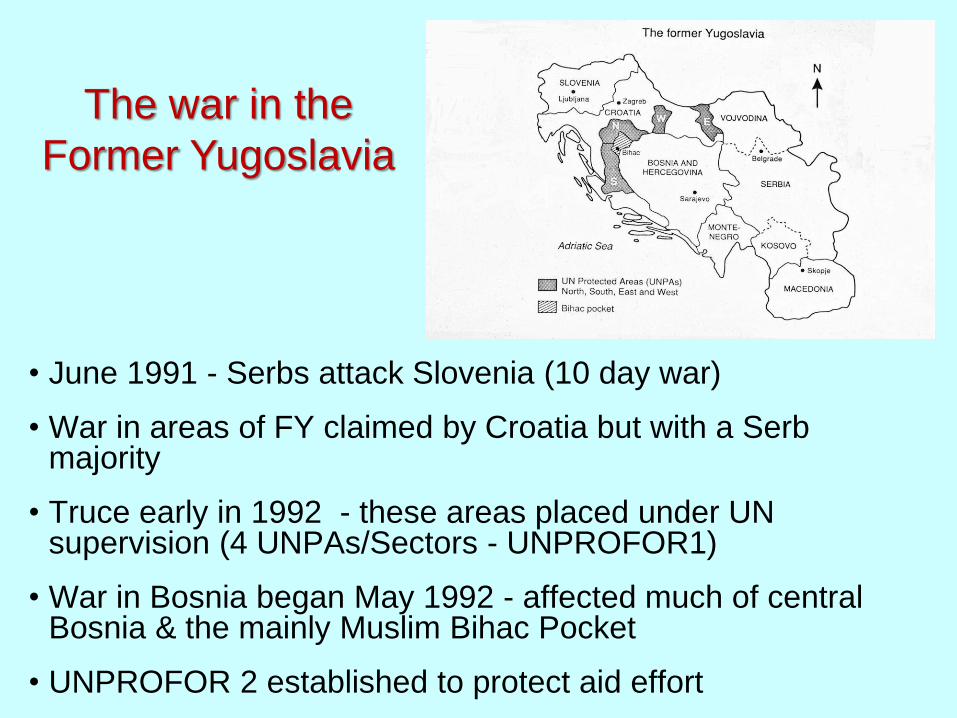
• June 1991 - Serbs attack Slovenia (10 day war)
• War in areas of FY claimed by Croatia but with a Serb majority
• Truce early in 1992 - these areas placed under UN supervision (4 UNPAs/Sectors - UNPROFOR1)
• War in Bosnia began May 1992 - affected much of central Bosnia & the mainly Muslim Bihac Pocket
• UNPROFOR 2 established to protect aid effort
The war in the
Former Yugoslavia

Displaced persons
• By mid 1992 >3.5 million DPs
• Mostly IDPs, relatively few refugees
• Most IDPs in host families (>90%)
• Some IDP camps –mostly transient population

The civil situation in Bosnia
• Large numbers of
displaced persons
swelling existing
populations
• Infrastructures broken
down
• Food supplies poor
• Extensive damage to
buildings especially
“official” structures
(hospitals, schools,
mosques, churches)

Communications disrupted

Surveillance situation in Bosnia in
1992-3
• Existing systems not functioning
• Communications severely disrupted
• Medical staff overworked, very poorly paid
(special feeding programme)

What did we need to know?
• Population data
• Morbidity and mortality data–Chronic
–Infectious
–Trauma
• Health services information
• Supply situation
• EPREP situation
• Access
• Communications

WHO surveillance programme
• Decided to set up a
sentinel surveillance
programme
• Sites chosen had:
– UNHCR bases with
radio communications
– Important medical
centres

Sources of information
• Sentinel sites - mainly near UNHCR offices)– Dom Zdravlja
– Ambulantas
– Regional Hospitals
• Additional sources– UN military
– UNCIVPOL
– UN civil
– NGOs
– Local contacts

Material provided
• Monitoring form
• Guide to use
• Case definitions
• Treatment and
response
guidelines
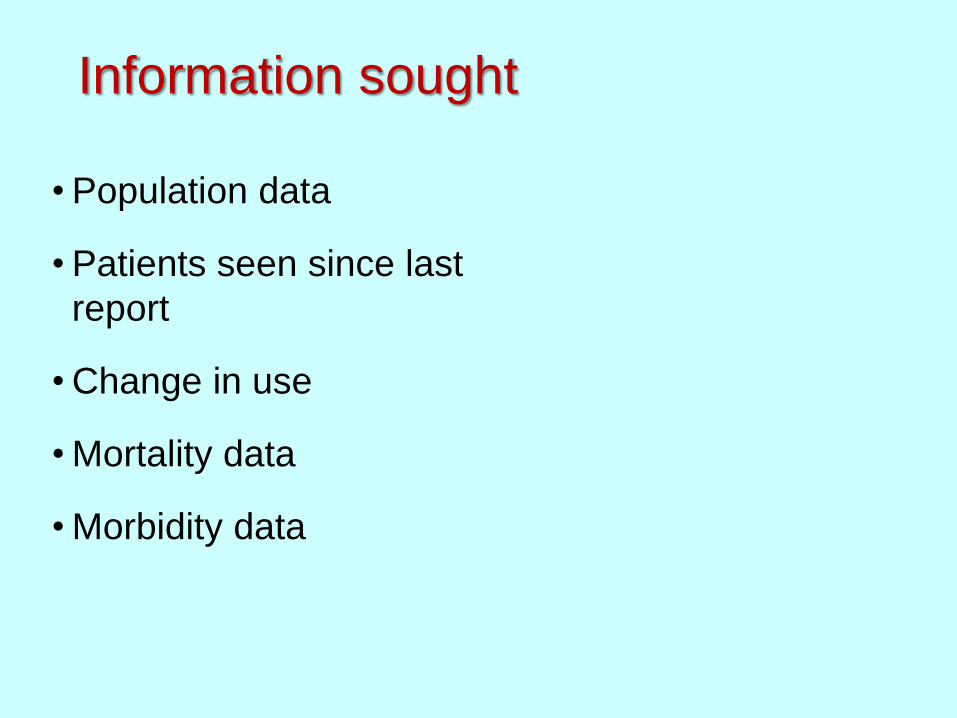
Information sought
• Population data
• Patients seen since last
report
• Change in use
• Mortality data
• Morbidity data

Mortality data
• Communicable
disease
• Trauma
• Hypothermia
• Obstetrical
• Other

Morbidity data
• VPD
• Water/foodborne diseases
• RTI
• Meningitis
• TB
• Ectoparasite/lousebornediseases
• Specific parasites
• Nutritional
• Trauma
• Other

Nutrition data

Additional sources: a typical day’s
reports
Problem Details Source
Typhoid 13 cases in Livno, (Hercegovina) ICRC
Hepatitis A 30 cases in Sarajevo UNICEF
Hepatitis A 5 cases in a refugee camp, Zagreb MDM
Brucellosis Outbreak in Macedonia WHO
Chicken pox 23 cases in Plaski, UNPA North UNCIVPOL

UNCIVPOL – Sector South(Sitrep Feb 24th, 1993)
• Hospitals need antibiotics
• Total deaths = 4
– Causes of death:
Female (59Y) Shot
Male (22Y) Shot
Male (80Y) Shot
Male (50Y) Mine

Information dissemination
• Health warnings (phone, fax, radio)
• Routine data (phone, fax, radio)
• “Health Monitor”

Did it work?
• Additional sources - Yes
• Sentinel - No (only as Ad hoc)

Successes
• Establishment of a surveillance system that
detected outbreaks in a timely fashion
• Database allowing prediction
• Successful information dissemination
• Health warnings & advisory material
• Durable contact network

The sentinel scheme
• Extra admin burden?
• Challenging
competence?
• Intermittent access?
• Inadequate staff?
• Supply of medicines?
• Security/intelligence
data?
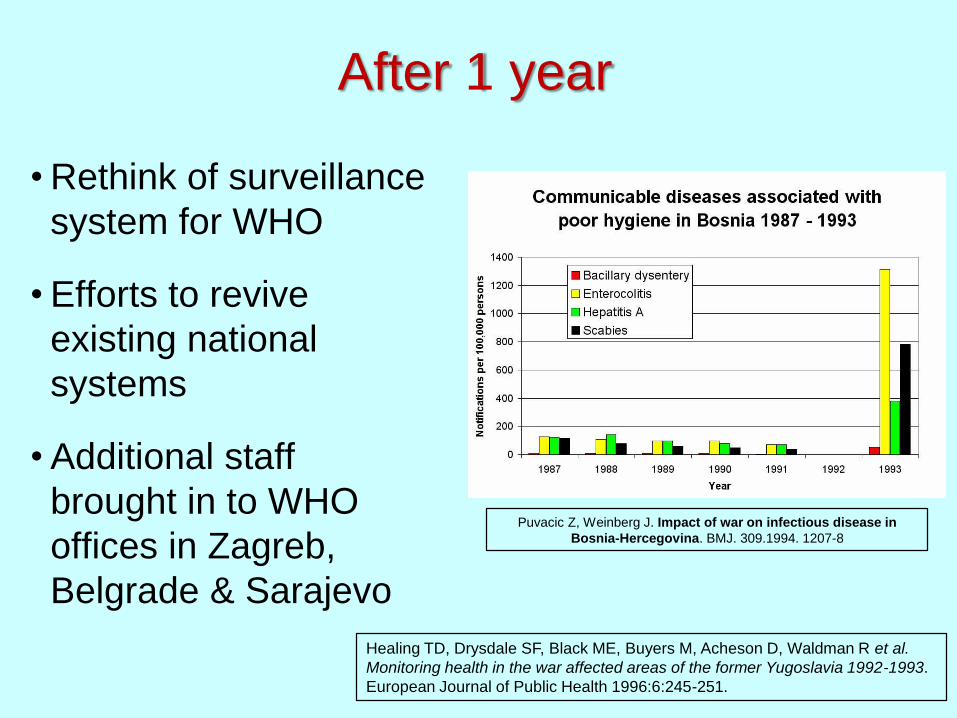
After 1 year
• Rethink of surveillance
system for WHO
• Efforts to revive
existing national
systems
• Additional staff
brought in to WHO
offices in Zagreb,
Belgrade & Sarajevo
Puvacic Z, Weinberg J. Impact of war on infectious disease in
Bosnia-Hercegovina. BMJ. 309.1994. 1207-8
Healing TD, Drysdale SF, Black ME, Buyers M, Acheson D, Waldman R et al.
Monitoring health in the war affected areas of the former Yugoslavia 1992-1993.
European Journal of Public Health 1996:6:245-251.

Planning a surveillance and response
system for a remote area with poor
communications
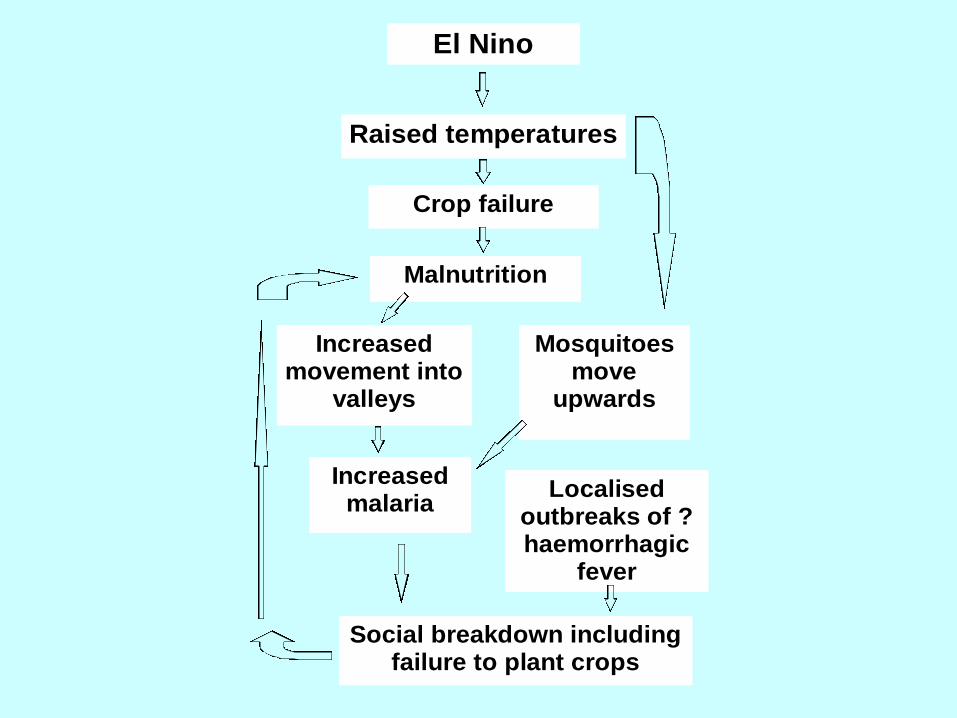
El Nino
Raised temperatures
Crop failure
Malnutrition
Increased movement into
valleys
Mosquitoes move
upwards
Increased malaria
Localised outbreaks of ?haemorrhagic
fever
Social breakdown including failure to plant crops

Proposed surveillance and
response
•Sentinel surveillance based on villages
with a missionary presence (clinic,
airstrip/helipad, radio)
•EPREP
•Rapid response team (doctors, nurses,
lab techs, Missionary Aviation Fellowship)
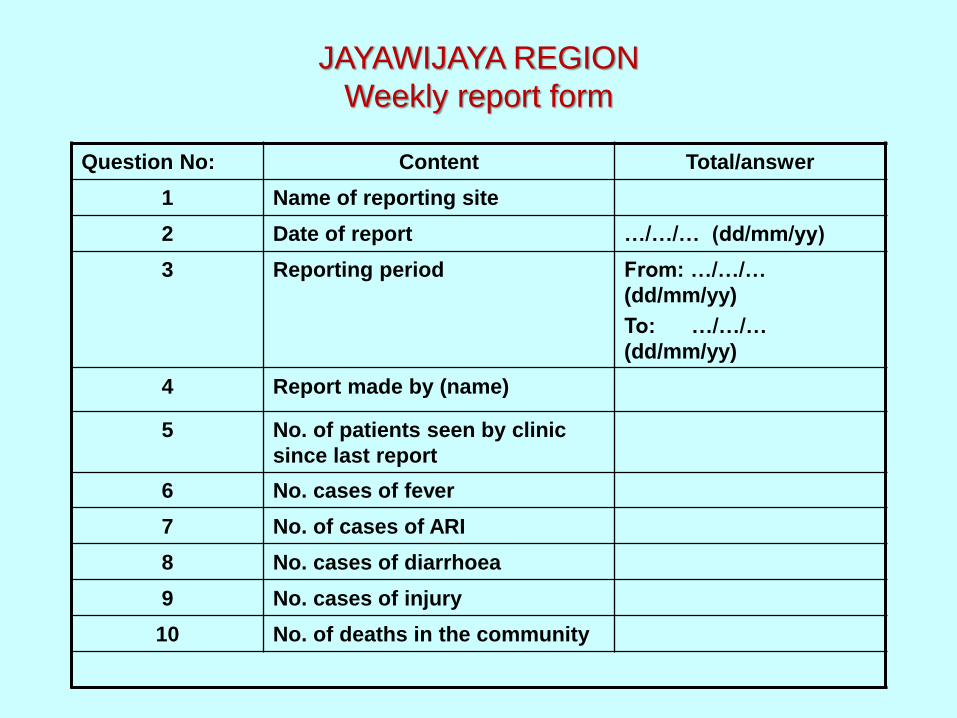
JAYAWIJAYA REGION
Weekly report form
Question No: Content Total/answer
1 Name of reporting site
2 Date of report …/…/… (dd/mm/yy)
3 Reporting period From: …/…/…
(dd/mm/yy)
To: …/…/…
(dd/mm/yy)
4 Report made by (name)
5 No. of patients seen by clinic
since last report
6 No. cases of fever
7 No. of cases of ARI
8 No. cases of diarrhoea
9 No. cases of injury
10 No. of deaths in the community

Outbreak
Increase in cases
reported to Dinas
by local clinics
Travel to
outbreak area,
investigate
outbreak, begin
treatment,
report to Dinas
Additional
responses as
required
Reports
to
clinics Rapid response team
activated
Doctor(s)
Nurse(s)
Mobile lab
Drugs
DINAS
Data analysis
Surveillance
database
RRT base
Reports to MoH, WHO
etc.

Any questions?