Disaster Monitoring Us ing ALOS/PALSAR Data
4
Disaster Monitoring Using ALOS/PALSAR Data By Yousuke MIYAGI 1) , Masanobu SHIMADA 1) , and Taku OZAWA 2) 1) Japan Aerospace Exploration Agency, Earth Observation Research Center, Tsukuba, Japan 2) National Research Institute for Earth Science and Disaster Prevention, Tsukuba, Japan Disaster monitoring is one of the most important objectives of the ALOS mission. Continual observation before a disaster and immediate observation after a disaster are important for determining the actual conditions in the target areas. ALOS/PALSAR is helpful for this purpose even in remote locations. PALSAR detected signals associated with various kinds of disasters, including landslides, floods, volcano eruptions, and earthquakes. Comparing amplitude images of before and after a disaster, we could find obvious changes on the ground surface caused by the disasters. Using the DInSAR technique, ALOS/PALSAR can detect ground deformations associated with a large earthquake over a wide area. Precise deformation information helps us to understand or interpret the mechanisms of a seismic fault. We tried to compare observed deformations to those induced from a fault model and found that the calculated deformation can explain the observed deformation well. Key Words: Disaster Monitoring, ALOS/PALSAR, DInSAR, Earthquake, Crustal Deformation 1. Introduction Many outstanding results from using ALOS/PALSAR data for disaster monitoring have been reported after the launch. In this papaer, we will introduce some of them. The Japan Aerospace Exploration Agency (JAXA) launched the Advanced Land Observing Satellite (ALOS) on January 24, 2006. This satellite carries the Phased Array type L-band Synthetic Aperture Radar (PALSAR) as a follow-on mission to the Japanese Earth Resource Satellite-1 (JERS-1). PALSAR is an advanced SAR sensor with up to 10 m spatial resolution, variable off-nadir angle, and several observation modes. These advantages support various missions including disaster monitoring. 2. Disaster monitoring using ALOS/PALSAR In this section, we present several examples of observation results by ALOS/PALSAR for various kinds of disasters observed all over the world. 2.1. Landslide A great landslide occurred in the south of Leyte Island, the Philippines, on February 17, 2006. Regrettably, there was no ALOS/PALSAR data before the landslide, so we use JERS-1/SAR data observed on Feb 2, 1996 for comparison with the data observed by ALOS/PALSAR on Feb 24, 2006. The difference of brightness in the images is presumed to be an effect of the landslide. Disaster monitoring is one of the most important contributions to society and objectives of the ALOS mission to mitigate catastrophes. Before a disaster, continuous observation and monitoring are needed to know normal conditions in target areas and detect changes on the surface. After a disaster, immediate observation and monitoring are needed to comprehend the actual conditions in the damaged areas. To compare data before and after the disaster, we need as much data as possible. Considering these purposes, ALOS/PALSAR is quite helpful because the SAR sensor can observe targets day and night and under cloudy conditions (including ash clouds), in contrast to optical sensors. The differential interferometric SAR (DInSAR) technique is one of the most effective applications of ALOS/PALSAR data. Using this technique, we can detect ground movements over a wide area precisely and areally. L-band SAR, which can penetrate tree canopies or leaves and observe the ground surface because of its relatively long wavelength, is one advantage of ALOS/PALSAR over other C-band SAR satellites. Due to developments in determining satellite position using dual-frequency GPS receivers and high-precision star trackers mounted on the ALOS satellite, PALSAR is expected to provide much better coherent SAR image pairs than previous C-band SAR satellites and JERS-1. Fig. 1. Bird’s eye view of the landslide areas as seen from the northwest. Observation date: Feb 2, 1996 by JERS-1/SAR (Green, Blue), Feb 24, 2006 by ALOS/PALSAR (Red). The areas of the landslide are enclosed by yellow dots. Copyright© 2009 by the Japan Society for Aeronautical and Space Sciences and ISTS. All rights reserved. Tn_17 (Received May 2nd, 2008) Trans. JSASS Space Tech. Japan Vol. 7, No. ists26, pp. Tn_17-Tn_20, 2009
Transcript of Disaster Monitoring Us ing ALOS/PALSAR Data

Disaster Monitoring Using ALOS/PALSAR Data
By Yousuke MIYAGI 1), Masanobu SHIMADA 1), and Taku OZAWA 2)
1) Japan Aerospace Exploration Agency, Earth Observation Research Center, Tsukuba, Japan
2) National Research Institute for Earth Science and Disaster Prevention, Tsukuba, Japan
Disaster monitoring is one of the most important objectives of the ALOS mission. Continual observation before a disaster and immediate observation after a disaster are important for determining the actual conditions in the target areas. ALOS/PALSAR is helpful for this purpose even in remote locations. PALSAR detected signals associated with various kinds of disasters, including landslides, floods, volcano eruptions, and earthquakes. Comparing amplitude images of before and after a disaster, we could find obvious changes on the ground surface caused by the disasters. Using the DInSAR technique, ALOS/PALSAR can detect ground deformations associated with a large earthquake over a wide area. Precise deformation information helps us to understand or interpret the mechanisms of a seismic fault. We tried to compare observed deformations to those induced from a fault model and found that the calculated deformation can explain the observed deformation well.
Key Words: Disaster Monitoring, ALOS/PALSAR, DInSAR, Earthquake, Crustal Deformation
1. Introduction Many outstanding results from using ALOS/PALSAR
data for disaster monitoring have been reported after the launch. In this papaer, we will introduce some of them.
The Japan Aerospace Exploration Agency (JAXA) launched the Advanced Land Observing Satellite (ALOS) on January 24, 2006. This satellite carries the Phased Array type L-band Synthetic Aperture Radar (PALSAR) as a follow-on mission to the Japanese Earth Resource Satellite-1 (JERS-1). PALSAR is an advanced SAR sensor with up to 10 m spatial resolution, variable off-nadir angle, and several observation modes. These advantages support various missions including disaster monitoring.
2. Disaster monitoring using ALOS/PALSAR In this section, we present several examples of observation results by ALOS/PALSAR for various kinds of disasters observed all over the world. 2.1. Landslide A great landslide occurred in the south of Leyte Island, the Philippines, on February 17, 2006. Regrettably, there was no ALOS/PALSAR data before the landslide, so we use JERS-1/SAR data observed on Feb 2, 1996 for comparison with the data observed by ALOS/PALSAR on Feb 24, 2006. The difference of brightness in the images is presumed to be an effect of the landslide.
Disaster monitoring is one of the most important contributions to society and objectives of the ALOS mission to mitigate catastrophes. Before a disaster, continuous observation and monitoring are needed to know normal conditions in target areas and detect changes on the surface. After a disaster, immediate observation and monitoring are needed to comprehend the actual conditions in the damaged areas. To compare data before and after the disaster, we need as much data as possible. Considering these purposes, ALOS/PALSAR is quite helpful because the SAR sensor can observe targets day and night and under cloudy conditions (including ash clouds), in contrast to optical sensors.
The differential interferometric SAR (DInSAR) technique is one of the most effective applications of ALOS/PALSAR data. Using this technique, we can detect ground movements over a wide area precisely and areally. L-band SAR, which can penetrate tree canopies or leaves and observe the ground surface because of its relatively long wavelength, is one advantage of ALOS/PALSAR over other C-band SAR satellites. Due to developments in determining satellite position using dual-frequency GPS receivers and high-precision star trackers mounted on the ALOS satellite, PALSAR is expected to provide much better coherent SAR image pairs than previous C-band SAR satellites and JERS-1.
Fig. 1. Bird’s eye view of the landslide areas as seen from the northwest. Observation date: Feb 2, 1996 by JERS-1/SAR (Green, Blue), Feb 24, 2006 by ALOS/PALSAR (Red). The areas of the landslide are enclosed by yellow dots.
Copyright© 2009 by the Japan Society for Aeronautical and Space Sciences and ISTS. All rights reserved.
Tn_17
(Received May 2nd, 2008)
Trans. JSASS Space Tech. JapanVol. 7, No. ists26, pp. Tn_17-Tn_20, 2009

Although affected areas are usually covered by clouds, PALSAR can observe the Earth’s surface through clouds, and continuous observation is possible in contrast to an optical sensor that often suffers from cloud coverage.
Figure 1 presents a bird’s eye view of an RGB color composite image created by the above two images and the SRTM3 Digital Elevation Model (DEM). The pre-disaster image (JERS-1/SAR) is assigned to blue and green, and the post-disaster image (ALOS/PALSAR) is assigned to red, therefore red colored areas are supposed to be affected by the landslide. Red areas enclosed by yellow dots extend from the ridge (Fig. 1). This means that the ridge probably collapsed and the debris slid down to the base area.
2.2. Flood
2.3. Volcanic eruption The most recent major eruption of Tavurvur Volcano, Rabaul, in Papua New Guinea occurred in October 2006. This explosive eruption was accompanied by lava flow. ALOS/PALSAR observed the volcano before and after the eruption and detected the obvious difference between the images (Fig. 3). You can see an extended lava flow around the vent enclosed by white circles in Fig. 3. Floods struck across Thailand from late August to early
October 2006. In this period, Chao Phraya recorded the highest flow discharged since observations began. The middle reach of the river was observed by ALOS/PALSAR before (May 27, 2006) and after the flood (October 12, 2006; Figs. 2a, 2b). Comparing the images, it can be found that the channel gets broader after the flood (Fig. 2b). Much of the rest of each image looks dark, and the darkness seems to be deep after the flood. This indicates marshy lowlands being submerged by the flood waters.
Fig. 3. (a) Pre-eruption image observed on June 1, 2006. (b) Post-eruption image observed on October 17, 2006. Tavurvur volcano is enclosed by a red circle in (a). (c) and (d) are enlarged images of volcano region in (a) and (b). Eruption of many volcanoes around the world could lead to catastrophic disasters. To mitigate volcano disasters, continuous geophysical observations in volcanic regions are required to comprehend the state of the active volcanoes. However, it is dangerous to approach an active volcano, and it is difficult to acquire geophysical information, especially for remote volcanoes. Remote sensing has the advantage of observing and monitoring volcanoes in remote and dangerous locations. This makes it unnecessary to be in the field and possible to acquire data routinely. In particular, PALSAR, a microwave sensor, can penetrate the ash clouds and observe even active volcanoes and can be employed with the DInSAR technique to detect geodetic information. Therefore PALSAR data is quite helpful in understanding the pre-, co-, and post-eruptive ground conditions in the volcano
Fig. 2. Observation date: (a) May 27, 2006 (b) Oct 12, 2006. Dark areas including river surface represent weak backscattering. Increase of dark area in (b) or extended channels indicates the effect of flood.
Tn_18
Trans. JSASS Space Tech. Japan Vol. 7, No. ists26 (2009)
area and can be used to make a hazard map of the volcano. 2.4. Earthquake On April 1, 2007 (UTC), an M8.1 interplate earthquake occurred in Solomon Islands along the subduction zone between the Pacific Plate and the Australian, Woodlark, and Solomon Sea Plates. This earthquake was accompanied by a large tsunami and caused considerable damage in the area. Figures 4a and 4b are amplitude images of the southern part of Ranongga Island acquired before and after the earthquake. Comparing these images, we find an apparent increase of coastal land area in Fig. 4b in spite of the rising tide level. We presume that some uplift associated with the earthquake occurred in these areas, although it is difficult to assess quantitatively using just these data. Figure 5 depicts the area enclosed by the red circle in Fig. 4b on July 28, 2007. In the field investigation of this area, we could see evidence of a major uplift of three or more meters.
Fig. 4. PALSAR amplitude images observed before (a) and after (b) the earthquake in the southern part of Ranongga Island.
Fig. 5. Huge uplift in Lale (Red circle in Fig. 4b). Author stands beside a 3 m scale in the picture. 3. Differential Interferometry The Differential interferometric SAR (DInSAR) technique is a powerful tool for detecting crustal deformations areally at high spatial resolution without installing any instruments in the field. This technique is often used for detecting crustal deformations associated with an earthquake and for estimating a fault model of the earthquake. In 2007, two major earthquakes struck Japan, the M6.7 Noto Peninsula earthquake on March 25, 2007 and the M6.8 off-Chuetsu earthquake on July 16, 2007. Because
both inferred seismic faults are located at a shallow depth beneath the bottom of the sea near the coast, obvious crustal deformations in the land area were detected by PALSAR data. Japan has a dense nationwide GPS network (GEONET) composed of more than 1200 GPS sites established and operated by the Geographical Survey Institute as well as many seismometers. GPS and seismometers detect signals caused by those earthquakes, so these are notable cases from the standpoint of comparing various kinds of data.
Fig. 6. Interferogram generated from PALSAR data acquired on February 23 and April 10, 2007 in Noto peninsula, Japan. A color fringe indicates a crustal deformation along the satellite-ground direction. The red star represents the epicenter of the earthquake.
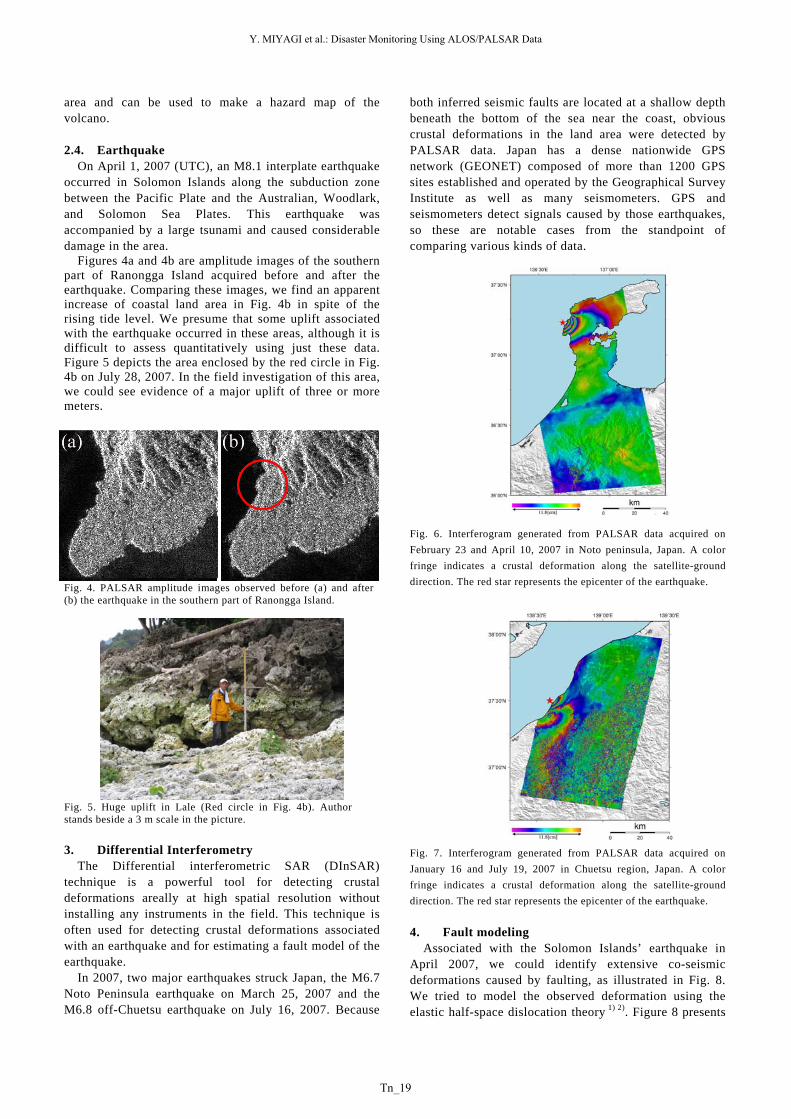
Fig. 7. Interferogram generated from PALSAR data acquired on January 16 and July 19, 2007 in Chuetsu region, Japan. A color fringe indicates a crustal deformation along the satellite-ground direction. The red star represents the epicenter of the earthquake. 4. Fault modeling Associated with the Solomon Islands’ earthquake in April 2007, we could identify extensive co-seismic deformations caused by faulting, as illustrated in Fig. 8. We tried to model the observed deformation using the elastic half-space dislocation theory 1) 2). Figure 8 presents
Tn_19
Y. MIYAGI et al.: Disaster Monitoring Using ALOS/PALSAR Data

hown in Fig. 8
interferograms in the study area, composed of three consecutive paths (Paths 343 to 345). The color fringe in Fig. 8 represents the ground deformation in a slant range component, which can be interpreted as being induced by a reverse dip-slip in the supposed seismic fault.
Fig. 9. Slip distribution on the supposed fault plane.
Fig. 8. Interferograms generated by DInSAR technique showing ground deformation associated with the earthquake.
Fig. 10. Calculated interferogram using best-fit parameters. Color fringe represents displacement in slant range component. Black rectangle represents the study area s
In this modeling, we first set locations and a strike direction of the fault area so as to include the plate boundary defined by PB2002 3). We assumed the size of the fault area to be 360km long and 150km wide, divided it into sub-faults of 24×10, and estimated the slip vector for each sub-fault. A dip angle of the fault is determined so as to minimize the ABIC. To avoid the problem of not knowing the absolute displacements and the relationship of displacements among islands, we set biased displacements for each island. Orbit tuning is not performed in the DInSAR processing, so there is a possibility that a non-crustal deformation component remains in each interferogram. Because the remnant of the orbital component can be considered as a uniformly inclined plane due to a precise determination of the orbit information of the ALOS satellite, we defined the non-crustal deformation component as a plane and estimated them for each orbital path. Figure 10 depicts the calculated interferogram using best-fit parameters. The model well explains the observed data and the pattern of slip distribution (Fig. 9), which has a two-eyed large slip area around the hypocenter and northwest of it, similar to that deduced from the teleseismic body wave data 4).
Significant ground deformation associated with the earthquake was detected over a wide area in the Solomon Islands using the DInSAR technique. From these geodetic data, we inferred a fault model and slip distribution for the earthquake. Although it is a preliminary result, the model well explains the observed deformation and exhibits good agreement with that inferred from the teleseismic data.
Acknowledgement The ownership of PALSAR data belongs to JAXA and Ministry of Economy, Trade and Industry (METI). Many of SAR images are reproduced from “Disaster Observation Examples” of JAXA 5).
References 1) Okada, Y.: Surface Deformation Due to Shear and Tensile
Faults in a Half-space, Bull. Seism. Soc. Am., 75 (1985), pp1135-1154.
2) Miyagi, Y., Ozawa, T., and Shimada, M.: Crustal Deformation Associated with an M8.1 Earthquake in the Solomon Islands, Detected by ALOS/PALSAR, Earth and Planetary Science Letter (under review), (2009)
5. Conclusion 3) Bird, P.: An Updated Digital Model of Plate Boundaries, G. Geophys. Geo., 4 (2003), pp.1-52. ALOS/PALSAR could acquire favorable data for
understanding phenomena associated with various kinds of disasters all over the world. Comparison of amplitude images before and after the disasters indicate obvious signals that are changes of surface conditions caused by landslides, floods, volcanic eruptions, and earthquakes.
4) Yamanaka, Y.: NGY seismology note (on the web); http://www.seis.nagoya-u.ac.jp/sanchu/Seismo_Note/2007/RSVD1.html, (2007).
5) JAXA: Disaster Observation Examples, (2007).
Tn_20
Trans. JSASS Space Tech. Japan Vol. 7, No. ists26 (2009)