Directors’ report for 2011 and 2010 Ferrovial S.A. and...
30
Directors’ report for 2011 and 2010 Ferrovial S.A. and Subsidiaries Ferrovial, S.A. Directors’ report at 31 December 2011 2 Translation of a report originally issued in Spanish. In the event of a discrepancy, the Spanish-language version prevails. I. BUSINESS PERFORMANCE IN 2011 1. OVERVIEW Net profit totalled EUR 1,269 million, including a gain on the sale of BAA (EUR 847 million). CASH FLOW (excluding infrastructure projects) Strong operating cash flow generation (EUR 1,446 million), thanks to the combination of positive business operating cash flow generation (EUR 578 million) and the disposals made during the year (EUR 1,264 million partly offset by investment of EUR 328 million). Dividend payments reached EUR 367 million. In December 2011 the net cash position (NCP) excluding infrastructure projects reached EUR 907 million (vs. EUR 31 million in December 2010). BUSINESS PERFORMANCE The two main infrastructure assets, Heathrow and 407ETR (accounted for using the equity method), continue to show their strength, the proof of which is the major growth in EBITDA (LHR +18.7%; 407ETR +10.6%, in local currency). The increase in charges, the evolution of traffic and cost control have favoured this positive performance. In the other businesses, of particular note is the positive performance of Budimex, with major growth in operating aggregates. The international Construction backlog continues to grow (+5.5% excluding the exchange rate effect), with the growth at Budimex (+24%) and Webber (+5%) especially noteworthy. Services also performed positively. DISPOSALS Ferrovial sold 5.88% of FGP Topco Ltd. (parent of BAA) for GBP 280 million (EUR 326 million). Considering the transaction price, the value of all the shares of BAA would be GBP 4,762 million. The transaction resulted in a gain of EUR 847 million. In the first quarter the sales of Swissport (EUR 695 million) and the investment in the M-45 toll road (EUR 68 million) were completed, giving rise to gains in value of EUR 195 million and EUR 27 million, respectively. In 2011 collection of the outstanding 40% on the sale of the Chilean toll roads was completed almost one year ahead of schedule. CHANGES IN THE SCOPE OF CONSOLIDATION The sale of 5.88% of BAA entailed its exclusion from consolidation, since it changed from being fully consolidated to being accounted for using the equity method. BAA is considered to be a discontinued operation in both 2011 and 2010. RATING The financial rating agencies Standard & Poor’s and Fitch issued for the first time their opinion on the financial rating of Ferrovial, which in both cases was in the category of “investment grade”, with rating of BBB- stable outlook.
-
Upload
truongdieu -
Category
Documents
-
view
216 -
download
0
Transcript of Directors’ report for 2011 and 2010 Ferrovial S.A. and...

Directors’ report for 2011 and 2010 Ferrovial S.A. and Subsidiaries
Ferrovial, S.A. Directors’ report at 31 December 2011 2
Translation of a report originally issued in Spanish. In the event of a discrepancy, the Spanish-language version prevails. I. BUSINESS PERFORMANCE IN 2011
1. OVERVIEW
Net profit totalled EUR 1,269 million, including a gain on the sale of BAA (EUR 847 million).
CASH FLOW (excluding infrastructure projects) Strong operating cash flow generation (EUR 1,446 million), thanks to the combination of positive business operating cash flow generation (EUR 578 million) and the disposals made during the year (EUR 1,264 million partly offset by investment of EUR 328 million). Dividend payments reached EUR 367 million.
In December 2011 the net cash position (NCP) excluding infrastructure projects reached EUR 907 million (vs. EUR 31 million in December 2010).
BUSINESS PERFORMANCE The two main infrastructure assets, Heathrow and 407ETR (accounted for using the equity method), continue to show their strength, the proof of which is the major growth in EBITDA (LHR +18.7%; 407ETR +10.6%, in local currency). The increase in charges, the evolution of traffic and cost control have favoured this positive performance.
In the other businesses, of particular note is the positive performance of Budimex, with major growth in operating aggregates. The international Construction backlog continues to grow (+5.5% excluding the exchange rate effect), with the growth at Budimex (+24%) and Webber (+5%) especially noteworthy. Services also performed positively.
DISPOSALS Ferrovial sold 5.88% of FGP Topco Ltd. (parent of BAA) for GBP 280 million (EUR 326 million). Considering the transaction price, the value of all the shares of BAA would be GBP 4,762 million. The transaction resulted in a gain of EUR 847 million.
In the first quarter the sales of Swissport (EUR 695 million) and the investment in the M-45 toll road (EUR 68 million) were completed, giving rise to gains in value of EUR 195 million and EUR 27 million, respectively.
In 2011 collection of the outstanding 40% on the sale of the Chilean toll roads was completed almost one year ahead of schedule.
CHANGES IN THE SCOPE OF CONSOLIDATION The sale of 5.88% of BAA entailed its exclusion from consolidation, since it changed from being fully consolidated to being accounted for using the equity method. BAA is considered to be a discontinued operation in both 2011 and 2010.
RATING The financial rating agencies Standard & Poor’s and Fitch issued for the first time their opinion on the financial rating of Ferrovial, which in both cases was in the category of “investment grade”, with rating of BBB- stable outlook.

Directors’ report for 2011 and 2010 Ferrovial S.A. and Subsidiaries
Ferrovial, S.A. Directors’ report at 31 December 2011 3
FINANCING In April Ferrovial refinanced its gross corporate borrowings (EUR 1,805 million), through the repayment of EUR 491 million and the refinancing of EUR 1,314 million. In July an additional EUR 300 million was repaid early. Autopista del Sol (AUSOL) refinanced its debt (EUR 492 million) for a period of five years. BAA performed three bond issues in 2011, amounting to approximately GBP 1,500 million, including the first issue denominated in US dollars.
Dec-11 Dec-10 Change (%) Like-for-like (%)
Sales 7,445.8 9,383.8 -20.7 -0.6
EBITDA 818.5 1,246.1 -34.3 8.9
EBIT* 626.5 961.4 -34.8 17.9
Net profit 1,269.0 2,163.3 -41.3
Net investment 290.7 -69.8 -5.2
Dec-11 Dec-10 Change (M)
Consolidated net debt -5,170.9 -19,788.7 14,618
Net debt ex-infrastructure projects 906.6 31.2 875
* In order to facilitate analysis, all comments refer to profit from operations before impairment and non-current asset disposals.
Dec-11 Dec-10 Ch. (%)
Construction backlog 9,997 10,186 -1.8
Services backlog 12,425 12,378 0.4
Change in traffic Dec-11 Dec-10 Ch. (%)ADT toll roads:
ETR 407 (km trave lled 000) 2,325,517 2,336,551 -0.5 Chicago Skyway 42,066 44,987 -6.5
Indiana Toll Road 27,142 27,924 -2.8
Autema 19,114 20,583 -7.1
Ausol I 14,254 15,623 -8.8
Ausol II 15,576 16,594 -6.1
BAA (millions of passengers) 108.5 103.9 4.4

Directors’ report for 2011 and 2010 Ferrovial S.A. and Subsidiaries
Ferrovial, S.A. Directors’ report at 31 December 2011 4
Dec-11 Dec-10 Chg (%) Like for Like (%)
Sales 389.7 868.7 -55.1 4.6EBITDA 283.2 629.6 -55.0 14.4
EBITDA Margin 72.7% 72.5%EBIT 230.5 517.1 -55.4 38.8
EBIT Margin 59.1% 59.5%
2. TOLL ROADS
Positive performance of the main income statement aggregates on a like-for-like basis; sales +4.6%, EBITDA +14.4% and EBIT +38.8%, from a combination of negative performance of traffic, increases in charges and the inclusion of the traffic-shortfall compensation accounts relating to the Radial 4 (R4) and Ocaña-La Roda (OLR) radial toll roads.
In 2010 Ferrovial sold 10% of the share capital of the 407ETR toll road, thereby leaving Ferrovial with an ownership interest of 43% in the aforementioned toll road and, therefore, it began to be accounted for using the equity method from the fourth quarter of 2010 onwards. 60% of the investment in the Chilean toll roads was also disposed of. These changes in the scope of consolidation had a significant effect on the change in the income statement. The comparable change is included to facilitate a comparison between the two years.
CHANGES IN TRAFFIC Spain: there is a notable fall in the traffic on the corridors, due the stagnation of the Spanish economy and the significant increase in the price of petrol. Toll roads performed negatively, mainly as a result of the improvement in the traffic conditions of cost-free alternatives due to a fall in the volume of vehicles, greater reticence to pay tolls because of the economic crisis and the decrease in the maximum speed to 110 km/h (legislation in force from 7 March to 30 June).
North America: decrease in traffic caused by weak economic recovery and the increase in the price of petrol.
The negative evolution of the Chicago Skyway (-6.5%) persisted; toll road traffic continues to be affected by the availability of capacity through the corridor, which has insufficient levels of congestion.
In Indiana there was a positive change in traffic in the last quarter, the cumulative total for the year (-2.8%) evidences the effects on journeys made by light vehicles as a result of the weak economic situation and the high price of petrol.
Portugal: negative changes on the Algarve, which became an actual toll paying road in December, leading to a substantial fall in traffic in the last quarter 2011, which is when the toll gates began to be installed.
In relation to Norte Litoral, traffic is still affected by the commencement on 15 October 2010 of an actual toll arrangement.
Ireland: the M3 opened to traffic on 4 June 2010. In like-for-like terms (June-December), traffic grew by 12.2%.

Directors’ report for 2011 and 2010 Ferrovial S.A. and Subsidiaries
Ferrovial, S.A. Directors’ report at 31 December 2011 5
Fully consolidated Dec-11 Dec-10 Ch. (%) Dec-11 Dec-10 Ch. (%) Dec-11 Dec-10 Ch. (%) Dec-11 Dec-10 Ch. bpsAutema* 19,114 20,583 -7.1% 81.7 78.8 3.7% 68.4 63.5 7.8% 83.7% 80.6% 318Ausol I 14,254 15,623 -8.8%Ausol II 15,576 16,594 -6.1%Ausol 53.4 53.8 -0.6% 40.4 36.9 9.5% 75.6% 68.6% 699Radial 4 6,796 8,314 -18.3% 30.9 19.9 55.5% 21.8 10.9 100.0% 70.6% 54.9% 1,569Ocaña-La Roda 3,822 4,128 -7.4% 24.2 16.4 47.3% 16.9 8.3 104.0% 69.9% 50.5% 1,942Chicago Skyway 42,066 44,987 -6.5% 49.0 46.0 6.5% 41.7 38.3 8.9% 85.2% 83.3% 186Euroscut Algarve 16,970 18,817 -9.8% 34.9 35.5 -1.9% 29.8 30.9 -3.7% 85.3% 87.0% -163Euroscut Norte Litoral* 23,734 30,019 -20.9% 53.1 56.8 -6.6% 40.0 34.9 14.7% 75.4% 61.4% 1,395N4-N6 25,759 25,926 -0.6% 21.4 22.9 -6.6% 14.6 15.9 -8.3% 67.9% 69.2% -131M3* 25,912 23,601 9.8% 35.7 33.8 5.5% 29.7 29.4 1.0% 83.2% 86.9% -370407 ETR 340.2 N/A 279.7 N/A 82.2%Chilean toll roads 153.1 N/A 102.5 N/A 66.9%Parents and other 5.4 11.4 -20.1 -21.5Total 389.7 868.7 283.2 629.6 72.7% 72.5%
Main aggregates of assets accounted for using the equity method
ETR 407 (Km travelled 000) 2,325,517 2,336,551 -0.5% 489.6 456.6 7.2% 401.7 365.6 9.9% 82.0% 80.1% 196Indiana Toll Road 27,142 27,924 -2.8% 133.3 131.8 1.1% 109.1 105.1 3.8% 81.8% 79.7% 207Ionian Roads 34,441 38,544 -10.6% 66.2 74.6 -11.3% 37.6 47.6 -21.1% 56.8% 63.8% -702
Traffic - ADI Sales EBITDA EBITDA margin
* Toll roads considered financial assets.
CHARGES 2011 In Spain, in 2011 charges increased by 1.5%, except for Autema which increased charges by 3.4%.
In the US, the ITR toll road increased charges by 1.4% on the barrier stretch and by 3.4% on the ticket stretch. Chicago skyway increased charges in 2011 by an average of 21.4%.
INCOME STATEMENT The changes in the year were affected by the positive performance of revenue (+4.6% on a like-for-like basis), despite the decrease in traffic, due mainly to the recognition of the traffic-shortfall compensation accounts for the Spanish R4 and OLR toll roads for 2009 and the increase in charges (Chicago).
The major improvement in EBITDA (+14.4% on a like-for-like basis), was due mainly to the recognition of the traffic-shortfall compensation account for the R4 and OLR, and the change in the Norte Litoral arrangement (changing from an intangible asset to a financial asset model).
FINANCING AUSOL: on 17 June 2011, the refinancing of its debt was completed (EUR 492 million) with a bank syndicate (21 banks). Maturity was set at five years.
R4: on 27 July 2011, the financing granted to Inversora de Autopistas del Sur, S.L. in relation to the Radial 4 toll road matured. The banks entered into a standstill agreement with the concession operator until 27 February.
CHANGES IN THE SCOPE OF CONSOLIDATION 407ETR and the Chilean toll roads were excluded from consolidated in the last quarter of 2010, once the sale processes had been completed (10% 407ETR and 60% Chilean toll roads). Until that time these toll roads had been fully consolidated. 407ETR began to be accounted for using the equity method. These effects are eliminated in a like-for-like comparison.
In June 2010 the M-3 toll road in Ireland came into service.
On 21 July 2010, an agreement was entered into to sell the ownership interest in the share capital of the M45 toll road (50%) to FINAVIAS –an investment vehicle of the infrastructure funds of AXA Private Equity. The amount of the transaction, completed on 20 January 2011, totals EUR 68.3 million and gave rise to a post-tax gain of EUR 27 million.

Directors’ report for 2011 and 2010 Ferrovial S.A. and Subsidiaries
Ferrovial, S.A. Directors’ report at 31 December 2011 6
OTHER SIGNIFICANT MATTERS
Spanish State Aid Plan for Toll Roads
On 31 December 2010, a plan was published in the Spanish Official State Gazette (BOE) to provide aid to certain toll roads, including OLR and R4. The aid package consists of the contribution by the Ministry of an amount equal to the difference between the toll revenue that would have been earned had 80% of the traffic projected in the tender specifications been reached and the toll revenue arising from actual traffic, provided that the aid does not exceed the actual revenue for the year.
The income statement includes the revenue relating to this traffic-shortfall compensation account for the two toll roads.
RADIAL 4: restoration of the financial equilibrium of the concession due to the increased cost of the construction project
On 30 June amendments to the concession arrangement were published in the BOE, compensating for the additional costs incurred in the construction work. An increase of 1.95% in toll charges was established, cumulative from 2012 until the year in which the cost overrun has been fully offset.
Differentiation between financial assets and intangible assets
Under IFRIC 12, concession arrangements may be classified into two types: intangible assets or financial assets. The concessions with a mechanism guaranteeing revenue are treated as financial assets and, therefore, they do not bear any demand risk. In the case of Cintra, the concessions treated as financial assets are as follows: Autema, Norte Litoral and M-3. For comparison purposes, the change in classification of Norte Litoral must be taken into account. In the case of the Norte Litoral toll road, the classification as a financial asset was due to the change in the terms and conditions of the arrangement, which saw it change from a shadow toll to a payment for availability arrangement.
TENDERS Despite the uncertainty of the financial markets, a slight upturn can be seen in the development activity of the government bodies in certain of the international markets targeted by Ferrovial.
North America: various projects are being assessed in both the US and Canada. Infrastructure Ontario should announce the winning consortium of the East Extension –a continuation of the 407ETR- in the first quarter of 2012.
In addition, the provisional agreement entered into with 407ETR to carry out tolling/back-office services was announced, thereby capitalising on the synergies existing between the 407ETR and the future East Extension (use of the same transponder, issue of a single invoice, a single payment system and a joint Customer Service system), which will lead to greater benefits to the customer.
Spain: the Extraordinary Infrastructure Plan announced by the government is being analysed (availability payments), in addition to the toll road projects under availability arrangements of the various autonomous communities. Cintra was the successful bidder for a project in January 2012 (Almanzora toll road).
In the most developed Latin American markets green-field toll road projects are being studied.

Directors’ report for 2011 and 2010 Ferrovial S.A. and Subsidiaries
Ferrovial, S.A. Directors’ report at 31 December 2011 7
407ETR 407ETR (100% CAD) Dec-11 Dec-10 Ch. (%)
Sales 675.0 624.3 8.1EBITDA 553.8 500.0 10.8
EBITDA margin 82.0% 80.1%EBIT 495.4 443.1 11.8
EBIT margin 73.4% 71.0%Financial loss -325.4 -327.5 -0.6Profit after tax 169.9 115.6 47.0Income tax -41.5 -38.7 7.4Non-controlling interests -72.9 -36.2 101.4Net profit 128.4 77.0 66.8
Net profit at 43.23% 55.5 40.8 36.1
Net profit attributable to Ferrovial (euros) 27.1 29.8 -9.1
After Ferrovial sold 10% of 407ETR in 2010, the toll road began to be accounted for using the equity method, based on the percentage of ownership held by Ferrovial (43%). 407ETR contributed EUR 27.1 million to Ferrovial’s result of companies accounted for using the equity method, after the annual amortisation charge relating to the intangible asset that arose after the sale of 10% performed in 2010, which is being amortised over the life of the asset.
Traffic
The change in traffic (-0.5%) was affected by various events such as the increase in the price of fuel, together with adverse weather conditions and the completion of the improvement works on alternative roads in 2011. On 30 June the toll road set a new all-time high for daily traffic, achieving on that day 460,293 journeys.
407ETR charges
The table below compares the charges in 2011 and 2012:
Canadian dollars 2012 2011
Regular Zone Peak Period Mon-Fri: 6am-7am, 9am-10am, 3pm-4pm, 6pm-7pm
Peak Hours Mon-Fri: 7am-9am (2010: 7.30am-8.30am), 4pm-6pm
24.20¢ /km
25.20¢ /km
22.75¢ /km
22.95¢ /km
Light Zone Peak Period Mon-Fri: 6am-7am, 9am-10am, 3pm-4pm, 6pm-7pm Peak Hours Mon-Fri: 7am-9am, 4pm-6pm
22.60¢ /km
23.55¢ /km
21.25¢ /km
21.45¢ /km
Midday Rate Working days 10am-3pm 21.00¢/km 19.35¢/km
Off Peak Rate Working days 7pm-6am, Weekend and holidays
19.35¢/km 19.35¢/km
Transponder: Monthly rental $3.00 $2.75
Transponder: Monthly rental $21.50 $21.50
Video toll per journey $3.80 $3.65
Charge per journey (There is no charge by km) $0.60 $0.50

Directors’ report for 2011 and 2010 Ferrovial S.A. and Subsidiaries
Ferrovial, S.A. Directors’ report at 31 December 2011 8
Income statement
407ETR achieved substantial growth in sales +8.1% and EBITDA +10.8% in local currency. This positive performance is a combination of the increase in charges introduced on 1 February and the changes in traffic volumes (-0.5%).
Dividends distributed by 407ETR
In 2011 407ETR paid dividends amounting to CAD 460 million, including an extraordinary dividend of CAD 110 million (CAD 300 million in 2010).
Financing
In November 407ETR issued senior bonds amounting to CAD 350 million, maturing in 2041 and with a coupon rate of 4.45%.
This issue was used to repay the bond issue of CAD 300 million maturing in 2012.
Net debt
407ETR ended 2011 with a net debt position of CAD 4.8 billion.
Credit rating
407ETR has an A credit rating with a stable outlook issued by Standard & Poor’s.

Directors’ report for 2011 and 2010 Ferrovial S.A. and Subsidiaries
Ferrovial, S.A. Directors’ report at 31 December 2011 9
3. SERVICES
Dec-11 Dec-10 Ch. (%) Like-for-like (%)
Sales 2,820.9 3,896.0 -27.6 9.4
EBITDA 311.8 412.9 -24.5 4.9
EBITDA margin 11.1% 10.6%
EBIT 207.4 283.7 -26.9 3.3
EBIT margin 7.4% 7.3%
Backlog 12,424.7 12,378.0 0.4
The changes with respect to 2010 were affected by the exclusion from the scope of consolidation of Swissport.
On a like-for-like basis, the Services Division account shows consistent growth in sales +9.4%, EBITDA +4.9% and EBIT of +3.3%.
This positive performance is due primarily to organic growth as a result of the entry into service of new contracts, and of control of operating expenses. An example of the new contracts that have come into service in 2012 are the waste treatment plant in Catalonia, new stretches of the A2 corridor, the provision of emergency ambulance services in Madrid, and the maintenance of road infrastructural in the city of Birmingham.
BACKLOG The backlog stands at EUR 12,425 million (+0.4% compared to December 2010), after the inclusion of the new contracts in the UK, such as the prisoner custody and transfer service for a period of seven years (EUR 354 million).
Noteworthy in Spain is the renewal of the contract to collect and treat waste in Murcia for the next 20 years (EUR 951 million), and the renewal of various contracts to maintain council buildings in Madrid (EUR 31 million).
[The backlog at December 2010 was adjusted to include the contracts of companies over which joint control is exercised (50%), which represents an increase of EUR 375 million.]
BUSINESSES IN SPAIN
Dec-11 Dec-10 Ch. (%) Like-for-like (%)
Sales 1,537.2 1,495.3 2.8 2.8
EBITDA 198.4 193.6 2.5 6.0
EBITDA margin 12.9% 12.9%
EBIT 110.7 114.0 -2.9 3.0
EBIT margin 7.2% 7.6%
Backlog 6,172.1 5,785.6 6.7
Positive performance of sales +2.8%, EBITDA +6.0% and EBIT +3.0%, on a like-for-like basis. In the waste collection and treatment business that combines the entry into service of new contracts, there is a fall (-9%) in the volume of tonnes processed and waste collected in certain municipalities. Highly positive performance of infrastructure maintenance as a result of the inclusion of new contracts that offset the abandonment of low-return contracts and the drop in the number of tender processes for road signalling contracts.
Increased billings and the fact that the new contracts are more profitable than the backlog average makes it possible to maintain EBITDA at similar levels to the same period in 2010, thereby offsetting the fall in activity of public-sector customers.

Directors’ report for 2011 and 2010 Ferrovial S.A. and Subsidiaries
Ferrovial, S.A. Directors’ report at 31 December 2011 10
AMEY Euros Dec-11 Dec-10 Ch. (%) Like-for-like (%)
Sales 1,283.7 1,099.0 16.8 18.6
EBITDA 113.3 111.9 1.3 2.8
EBITDA margin 8.8% 10.2%
EBIT 96.7 94.4 2.4 3.5
EBIT margin 7.5% 8.6%
Backlog 6,252.6 6,592.4 -5.2 -7.6
Sales increased on a like-for-like basis (+18.6%), as a result of various contracts becoming operational, of particular note being the maintenance of road infrastructures in the city of Birmingham. New contracts in the areas of railway infrastructure and facility management also contribute a higher level of billings. In pro forma terms, EBITDA increased by 2.8% and EBIT by 3.5%. This positive performance is a result of the contribution of the new contracts discussed earlier and the improved performance of the contract for the maintenance of the London Underground, due to additional costs incurred in 2010. All the foregoing offsets the increased project tendering costs that are still at the early stage of the award process. The earnings of Amey in 2010 included non-recurring surpluses relating to pensions. Excluding these impacts, EBITDA would have grown by 9%. In 2011 Amey incurred costs relating to tenders for new projects, such as those in Sheffield and the Isle of Wight.
SWISSPORT
Sale of Swissport
On 17 February Ferrovial completed the sale of Swissport, a transaction that was made public on 2 November 2010.
The price (equity) of the transaction amounted to CHF 900 million (EUR 695 million at the year-end exchange rate), achieving an enterprise value of CHF 1,210 million (EUR 934 million) and representing a consolidated net gain after tax of EUR 195 million for Ferrovial.

Directors’ report for 2011 and 2010 Ferrovial S.A. and Subsidiaries
Ferrovial, S.A. Directors’ report at 31 December 2011 11
4. CONSTRUCTION
Dec-11 Dec-10 Ch. (%) Like-for-like (%)
Sales 4,243.8 4,525.1 -6.2 -4.5
EBITDA 247.6 242.0 2.4 4.3
EBITDA margin 5.8% 5.3%
EBIT 215.2 202.1 6.5 8.4
EBIT margin 5.1% 4.5%
Backlog 9,997.2 10,185.7 -1.8 -0.7
The change in 2012 was affected by the positive performance of the international business, especially at Budimex, in contrast to the decrease in the activity in Spain.
The backlog remained stable with respect to 2010, despite the performance on construction contracts and the major awards made to Budimex and Webber. The international backlog stands at EUR 6,830 million, far higher than the Spanish backlog (EUR 3,168 million).
The positive performance of the international business (sales +7.5%, EBITDA +3.5%) cushioned the poor the performance of the business in Spain (sales -17.2%, EBITDA +5.0%), in like-for-like terms.
SPANISH MARKET
Dec-11 Dec-10 Ch. (%)
Sales 1,770.4 2,138.6 -17.2
EBITDA 128.8 122.8 5.0
EBITDA margin 7.3% 5.7%
EBIT 111.7 103.2 8.2
EBIT margin 6.3% 4.8%
Backlog 3,167.5 3,603.6 -12.1
The change during the year was due to the lower volume of building construction executed, both residential and non-residential, and to the decrease in civil engineering work (public-sector tenders fell by 43% in 2011 to stand at the lowest level in the last 12 years). EBITDA increased due to the completion of construction projects, and was not reduced by the commencement of new projects, which traditionally have lower earnings in the initial stages of perfromance. The backlog fell by 12% with respect to December 2010.
INTERNATIONAL MARKET
Dec-11 Dec-10 %) Like-for-like (%)
Sales 2,489.2 2,395.4 3.9 7.5
EBITDA 118.8 119.2 -0.3 3.5
EBITDA margin 4.8% 5.0%
EBIT 103.5 98.9 4.6 8.6
EBIT margin 4.2% 4.1%
Backlog 6,829.8 6,582.0 3.8 5.5
Sales increased by +7.5%, EBITDA by +3.5% and EBIT by +8.6%, excluding the exchange rate effect.
The major increase in the international business was sustained as a result of the positive performance of Budimex in the Polish market. The rest of the international business activity was affected by the completion of the construction projects in Ireland and the situation in Greece.
In 2011 the contribution of international sales was 59%. The international backlog continue to grow (+6% excluding the exchange rate effect) and now represents 68% of the division’s total. Growth was due mainly to the award of various contracts to Webber and

Directors’ report for 2011 and 2010 Ferrovial S.A. and Subsidiaries
Ferrovial, S.A. Directors’ report at 31 December 2011 12
Budimex and to the inclusion of projects awarded to the Crossrail consortium in which Ferrovial participates in the UK for EUR 263 million.
Budimex Dec-11 Dec-10 Ch. (%) Like-for-like (%)
Sales 1,323.5 1,014.5 30.5 35.3
EBITDA 72.2 62.3 15.9 20.4
EBITDA margin 5.5% 6.1%
EBIT 64.9 57.1 13.7 18.2
EBIT margin 4.9% 5.6%
Backlog 1,919.7 1,743.2 10.1 24.2
Highly significant growth across all operating lines. The growth in the business is due to the major construction projects awarded in 2010 (the A1 and A4 toll roads, Wroclaw station) and as to the better weather conditions with respect to 2010. Budimex completed the acquisition of PNI at the end of 2011, which contributed sales of EUR 12.1 million.
The backlog stands at EUR 1,920 million, with an increase of +24.2% in local currency. It includes the backlog contributed by PNI (EUR 289 million), and equally of note is the increase in contracts for non-residential projects and major civil engineering contracts: Lublin ring road, Augustow ring road, line 9 of the IIawa railway.
Webber Dec-11 Dec-10 Ch. (%) Like-for-like (%)
Sales 424.9 490.2 -13.3 -8.2
EBITDA 17.1 25.4 -32.6 -28.3
EBITDA margin 4.0% 5.2%
EBIT 11.4 14.7 -22.1 -16.8
EBIT margin 2.7% 3.0%
Backlog* 1,650.6 1,529.3 7.9 4.7
Sales dropped (-8.2%) as a result of the completion of projects and bad weather conditions. There was a slight fall in the EBIT margin caused by the contribution to the still zero result of the large infrastructure projects in Texas, since they are still at the initial and design stages.
The increase in the backlog (4.7% in local currency) is due to the inclusion of the various toll road projects (H-290, SH-99, US-75 and IH-35).
DETAILS OF THE BACKLOG
Dec-11 Dec-10 Chg(%)
Civil work 7,602.4 7,749.2 -1.9
Residential work 363.7 417.2 -12.8
Non-residential work 1,334.8 1,381.5 -3.4
Industrial 696.3 637.7 9.2
Total 9,997.2 10,185.7 -1.8

Directors’ report for 2011 and 2010 Ferrovial S.A. and Subsidiaries
Ferrovial, S.A. Directors’ report at 31 December 2011 13
5. AIRPORTS
BAA On 10 October 2011, Ferrovial announced the agreement with two investment vehicles managed by Alinda Capital Partners for the sale of an ownership interest of 5.88% in FGP Topco Ltd. (parent of BAA) for GBP 280 million (EUR 326 million). This transaction was completed on 26 October.
After the sale of the 5.88%, FERROVIAL became the indirect holder of 49.99% of BAA.
The transaction entailed a valuation of 100% of the equity of BAA at GBP 4,762 million.
Performance of traffic
In 2011 traffic increased by +4.4%. The volume in 2010 was affected by the volcanic ash cloud and the strike by BA flight crews.
The growth was mainly driven by Heathrow, which performed positively over the period with record passenger numbers (+5.5%, +1.9% excluding non-recurring effects). From the summer onwards, all-time highs in traffic were achieved every month. A notable feature of this sound performance was the increase in long-haul traffic to North America and Brazil, and the traffic with Europe, where Germany, Switzerland and France were the most popular destinations.
Stansted (-2.8%, -5.0% excluding non-recurring effects) was affected by the strategy of the airlines in relation to their flights to continental Europe. Most of the fall in traffic was seen in domestic flights. In recent months record load factors have been achieved, which augurs well for future performance.
The positive performance of the traffic at the Scottish airports is also worthy of note (+8.1%).
Traffic performance by destination,
2011 2010 Ch. (%)
UK 22.0 21.8 1.1Europe 48.6 46.2 5.2Long haul 37.9 36.0 5.4
Total 108.5 103.9 4.4
Charges
The charges at Heathrow and Stansted are set pursuant to the regulations established for the period 2008 - 2014.
The charges for 2011 and 2012 are as follows:
2011 2010 Regulation
Heathrow +12.7% +12.2% RPI +7.5%Stansted +6.8% +6.3% RPI +1.63%
Service quality
Heathrow achieved its best punctuality rate in more than a decade in terms of take-offs with 79% with less than 15 minutes delay (2010: 71%). It also improved its delayed bags ratio to stand at 15/1,000 in 2011 (2010:

Directors’ report for 2011 and 2010 Ferrovial S.A. and Subsidiaries
Ferrovial, S.A. Directors’ report at 31 December 2011 14
18/1,000). As regards queues at security controls, 96.9% of passengers passed through the controls within the established period (2010: 97.5%), 95.0% being the minimum.
All the improvements made to enhance service quality are perceived by the passengers, evidenced in the independent satisfaction surveys which award Heathrow an all-time-high level of passenger satisfaction.
BAA (100% GBP Mn)
Dec-11 Dec-10 Ch. (%) Dec-11 Dec-10 Ch. (%) Dec-11 Dec-10 Ch. (%) Dec-11 Dec-10 Ch. (bps)
Heathrow 69.4 65.7 5.5% 1,936 1,744 11.0% 983 825 19.1% 50.8% 47.3% 344Heathrow express 174 183 -4.8% 62 56 12.1% 35.9% 30.5% 542Total Heathrow 69.4 65.7 5.5% 2,110 1,926 9.5% 1,045 881 18.7% 49.5% 45.7% 382Stansted 18.0 18.6 -2.8% 234 230 2.1% 87 86 0.7% 37.0% 37.5% -52Total regulated 87.4 84.3 3.7% 2,344 2,156 8.7% 1,132 967 17.1% 48.3% 44.8% 344Edinburgh 9.4 8.6 9.2% 110 99 11.3% 50 44 14.4% 45.3% 44.0% 124Glasgow 6.9 6.5 5.1% 82 82 0.5% 30 30 0.5% 36.8% 36.8% -3Aberdeen 3.1 2.8 11.8% 53 49 7.8% 18 16 18.1% 34.8% 31.8% 303Total Scotland 19.4 17.9 8.1% 245 230 6.7% 98 89 10.4% 40.2% 38.8% 132Southampton 1.8 1.7 1.6% 27 27 0.7% 10 10 -0.5% 35.9% 36.3% -45Central & adjust. -93 -101 21 4
Total like-for-like 108.5 103.9 4.4% 2,524 2,312 9.2% 1,260 1,070 17.8% 49.9% 46.3% 366Ch. scope consol. 5.5 77 27 28Total BAA 108.5 109.5 -0.9% 2,524 2,389 5.7% 1,287 1,098 17.3% 51.0% 46.0% 505
Traffic (M passengers) Sales EBITDA EBITDA margin
Income statement
Growth in sales (+9.2%) and EBITDA (+17.8%), excluding extraordinary income supported by:
Pound sterling M 2011 2010 Ch. (%)
Aeronautics 1,425 1,254 +13.6%
Retail 454 419 +8.4%
Other 645 639 +1.1%
Total revenue 2,524 2,312 +9.2%
BBA pound sterling Dec-11 Dec-10 Ch. (%)Like-for-like (%)#REF! #REF! #REF! #REF! #REF!
Sales 2,524.0 2,388.6 5.7 9.2
EBITDA 1,287.2 1,097.6 17.3 17.8
% EBITDA/sales 51.0% 46.0%
EBITDA 634.3 485.3 30.7 32.6
% EBIT/sales 25.1% 20.3%
Financial loss -931.4 -886.3 -5.1 -6.9
Equity method and other 10.6
Loss before tax -287.7 -971.0 -70.4 -25.3
Income tax 267.2 257.0 4.0 -32.8Net loss BAA at 100% in GBP -20.5 -714.0 -97.1 -22.5Net loss BAA EUR (49.99%) -12.6 -466.8 -97.3

Directors’ report for 2011 and 2010 Ferrovial S.A. and Subsidiaries
Ferrovial, S.A. Directors’ report at 31 December 2011 15
Aeronautics revenue (+13.6%), due to the positive performance of Heathrow: traffic +5.5%, increased charges +12.2% (from 1 April 2011 onwards). The combination of the two factors led to an increase in its aeronautics revenue of 16.0%.
Non-aeronautics revenue (+4.0%). Mainly due to the major increase in retail revenue, especially Heathrow (+10.2%) and the Scottish airports (+6.9%), as a result of improved sales at the duty free shops, luxury shops and car parks.
These factors, together with cost containment, led to a significant increase in EBITDA (+17.8%), with the EBIT margin increasing from 46.0% to 51.0%.
Of particular note was the sound performance of the Scottish airports which witnessed traffic (+8.1%) and EBITDA (+10.4%) growth, with special mention to be made of Edinburgh (traffic +9.2%, EBITDA +14.4%).
Regulatory matters
Competition Commission (CC)
On 19 July 2011, the CC issued its final decision dismissing the allegations of BAA relating to the substantial change in circumstances since the publication of the decision of the Competition Commission in March 2009 and obliged BAA to sell Stansted Airport and, either Glasgow or Edinburgh.
On 7 October, at the request of BAA, the CC resolved to amend the order in which the airports were to be sold, with the sale of a Scottish airport coming before the sale of Stansted.
On 19 October, BAA announced its intention to begin a process to sell Edinburgh airport.
BAA lodged an appeal with the CAT (Competition Appeal Tribunal) against CC’s decision. On 1 February 2012, the CAT dismissed BAA’s appeal.
CAA, extension of the regulatory period
In March 2011 the Government confirmed its intention to amend the legislation on the economic regulation of the airports in the UK. This new legislation is expected to be approved during the parliamentary sessions in 2012.
The CAA deems it appropriate to discuss the new regulatory period for Heathrow once the new airport legislation has been approved and, therefore, CAA announced in March 2011 a one-year extension to the current regulatory period (until March 2014). During this year of extension the prices charged will be calculated using the current formula RPI +7.5%. Heathrow also agreed a maximum investment of GBP 735 million with the airlines (at 2007/08 prices).
Regulatory Asset Base (RAB)
Pound sterling M Heathrow Stansted Total
December 2010 11,448.7 1,327.3 12,776.0
December 2011 12,490.2 1,359.5 13,849.7
Aeronautical Retail Others
BAA (100% GBP) Dec-11 Chg (%) Dec-11 Chg (%) Dec-11 Chg (%)
Heathrow 1,149.6 16.0 356.1 10.2 430.3 0.3
Stansted 126.8 2.5 48.1 -1.3 59.5 4.3
Glasgow 42.1 1.8 18.6 0.2 21.3 -1.6
Edinburgh 58.5 8.4 22.3 13.2 29.2 15.9
Aberdeen 31.0 9.6 5.9 7.2 16.1 4.8
Southampton 16.5 3.8 3.2 2.9 7.9 -5.9Other & Adjustments 81.1 -0.8Airports Total 1,424.5 13.6 454.1 8.4 645.4 1.1

Directors’ report for 2011 and 2010 Ferrovial S.A. and Subsidiaries
Ferrovial, S.A. Directors’ report at 31 December 2011 16
The increase in the RAB in 2011 was a result of the investments made (GBP 935 million), and the rise in inflation (GBP 620 million), which was partially offset by the period depreciation taken (GBP-555 million) and adjustments (GBP -75 million).
Net debt
Pound sterling M 2011 2010 Ch. (%)
Toggle debt 685 905 -24%Other airports 1,036 1,054 -2%Subordinated 538 488 +10%Restricted Group 10,663 10,311 +3%Other & adjustments -60 -300 N/A
Total 12,862 12,458 +3%
Bond issues
In 2011 BAA performed three bond issues that enabled it to repay its bank borrowings known as the “refinancing facility”.
Of note among the bond issues performed is the first issue in the US market, amounting to USD 1,000 million.
Amount Maturity Coupon rate
USD 1,000 MM 10 years 4.875%
GBP 750 MM 30 years 5.875%
Index-linked bond
GBP 130 MM 28 years RPI +3.334%
In 2011 a private placement was also performed (subordinated loan) amounting to GBP 50 million, maturing in 2019.
In 2012 BAA has performed three additional bond issues, including the first issue in Swiss francs.
Amount Maturity Coupon rate EUR 700 MM 5 years 4.375%
CHF 400 MM 5 years 2.500%
Class B GBP 600 MM
12 years
7.125%
Dividends
In December 2011 BAA published its half-yearly investors’ report, in which it forecast that dividends would be paid to shareholders in 2012 amounting to GBP 60 million each quarter.

Directors’ report for 2011 and 2010 Ferrovial S.A. and Subsidiaries
Ferrovial, S.A. Directors’ report at 31 December 2011 17
OTHER AIRPORTS After the Ferrovial’s sale of 5.88% of BAA in 2011, the latter began to be accounted for using the equity method, based on the percentage of ownership held by Ferrovial (49.99%) and, therefore, BAA contributed losses amounting to EUR 13 million to Ferrovial’s result of companies accounted for using the equity method.
Airport earnings include the gain (EUR 847 million) arising from the sale of 5.88% of BAA and the increase in value of the ownership interest retained (49.99%) under “Discontinued Operations”.
BAA is classified as a discontinued operation, since it meets the requirements of IFRS 5 as control of a major line of business was lost. In order to allow comparison, the 2010 income statement has been restated excluding BAA.
The income statement of airports includes the earnings of the parents of the Airports Division and of the Cerro Moreno airport, which was completed in December 2011.
Euros Dec-11 Dec-10 Ch. (%) Like-for-like (%)Sales 10.4 3.8 175.5 175.5
EBITDA -10.7 -10.4 -2.7 -2.7
EBITDA margin -103.2% -276.7%
EBIT -11.4 -10.9 -4.5 -4.5
EBIT margin -109.5% -288.9%
Result equity accounted companies -12.9 -466.8 -97.2 -23.0
Net profit 827.2 -473.9 274.6 -22.1

Directors’ report for 2011 and 2010 Ferrovial S.A. and Subsidiaries
Ferrovial, S.A. Directors’ report at 31 December 2011 18
6. CONSOLIDATED INCOME STATEMENT The main changes in the scope of consolidation in 2011 were as follows: Airports Division: on 26 October 2011, 5.88% of the share capital of FGP Topco -the parent of the BAA Group- was sold. This transaction meant that BAA began to be accounted for using the equity method from November 2011 onwards. Services Division; on 17 February Swissport was sold. Toll Roads Division; on 10 January the sale of the equity interest (50%) in Autopista Trados 45 was formally completed; this company was accounted for using the equity method. Also, on 16 November an agreement was entered into to sell the 40% that Cintra held in Cintra Chile, based on the agreement executed on 15 September 2010 for the sale of 60% including purchase and sale options over the other 40%.
* In order to facilitate comparison between years, the loss on the activities of BAA in 2010 and 2011 is presented in “Share of Profit of Companies Accounted for Using the Equity Method” in the consolidated income statement. In the income statement that forms part of the financial statements authorised for issue and prepared in accordance with IFRS 5, in 2010 the aforementioned loss was included under “Net Profit or Loss from Discontinued Operations” and in 2011, ten months of activity are presented under “Net Profit or Loss from Discontinued Operations” and two months are presented under “Share of Profit of Companies Accounted for Using the Equity Method”. “Gain Arising on Exclusion from Consolidation of BAA” relates solely to the gain on the disposal.
Before Fair value Adjustments
Fair value Adjustments
Dec-11Before Fair value
AdjustmentsFair value
AdjustmentsDec-10
Revenues 7,446 7,446 9,384 9,384
Other income 15 15 17 17
Total income 7,461 7,461 9,401 9,401
COGS 6,642 6,642 8,154 1 8,155
EBITDA 819 819 1,247 -1 1,246
EBITDA margin 11.0% 13.3%
Period depreciation 192 192 285 285
EBIT (ex disposals & impairments) 627 627 963 -1 961
EBIT margin 8.4% 10.2%
Disposals & impairments 229 -87 142 684 1,888 2,572
EBIT 856 -87 769 1,647 1,887 3,533
FINANCIAL RESULTS -360 57 -303 -676 -28 -704
Financial result of infraestrucutre projects (financing) -277 -277 -540 -540
Financial result of infraestrucutre projects (derivatives & other fair value adjustments)
-3 -3 3 3
Financial result of other companies (financing) -83 -83 -136 -136
Financial result of other companies (derivatives & other fair value adjustments)
60 60 -31 -31
Equity-accounted affiliates 42 -25 17 -33 -395 -428
EBT 537 -55 482 937 1,465 2,402
Corporate income tax -63 2 -61 -256 37 -220
Net Income from continued operations 474 -53 421 681 1,501 2,182
Capital Gain from BAA divestment 142 706 847
CONSOLIDATED NET INCOME 615 653 1,268 681 1,501 2,182
Minorities -1 2 1 -24 5 -19
NET INCOME ATTRIBUTED 615 654 1,269 657 1,506 2,163

Directors’ report for 2011 and 2010 Ferrovial S.A. and Subsidiaries
Ferrovial, S.A. Directors’ report at 31 December 2011 19
SALES
EBITDA
Dec-11 Dec-10 Ch. (%) Like-for-like (%)
Construction 247.6 242.0 2.4 4.3
Airports -10.7 -10.4 2.7 2.7
Toll roads 283.2 629.6 -55.0 14.4
Services 311.8 412.9 -24.5 4.9
Other -13.3 -27.9 N/A
Total 818.5 1,246.1 -34.3 8.9
Dec-11 % Dec-10 % Ch. (%)
Spain 429.4 52% 383.6 31% 11.9
UK 134.3 16% 118.0 9% 13.8
Canada and the US 96.4 12% 372.3 30% -74.1
Poland 74.2 9% 69.9 6% 6.2
Chile 4.5 1% 108.7 9% -95.9
Rest of Europe 76.6 9% 157.4 13% -51.3
Rest of world 3.2 0% 36.2 3% -91.2
Total international 389.1 48% 862.5 69% -54.9
TOTAL 818.5 100% 1,246.1 100% -34.3
Dec-11 Dec-10 Chg. % Like-for-Like (%)
Construction 4,243.8 4,525.1 -6.2 -4.5
Airports 10.4 3.8 175.5 175.5
Toll Roads 389.7 868.7 -55.1 4.6
Services 2,820.9 3,896.0 -27.6 9.4
Others -18.9 90.2 n.s.
Total 7,445.8 9,383.8 -20.7 -0.6
Dec-11 % Dec-10 % Chg. %
Spain 3,369.2 45% 3,769.7 40% -10.6
UK 1,553.8 21% 1,412.5 15% 10.0
USA & Canada 746.3 10% 1,407.8 15% -47.0
Poland 1,394.3 19% 1,169.7 12% 19.2
Chile 45.1 1% 202.4 2% -77.7
Rest of Europe 275.8 4% 1,140.8 12% -75.8
Other countries 61.2 1% 280.8 3% -78.2
Total International 4,076.6 55% 5,614.1 60% -27.4
TOTAL 7,445.8 100% 9,383.8 100% -20.7

Directors’ report for 2011 and 2010 Ferrovial S.A. and Subsidiaries
Ferrovial, S.A. Directors’ report at 31 December 2011 20
EBIT*
Dec-11 Dec-10 Ch. (%) Like-for-like (%)
Construction 215.2 202.1 6.5 8.4
Airports -11.4 -10.9 4.5 4.5
Toll roads 230.5 517.1 -55.4 38.8
Services 207.4 283.7 -26.9 3.3
Other -15.2 -30.6 n.s.
Total 626.5 961.4 -34.8 17.9
Dec-11 % Dec-10 % Ch. (%)
Spain 298.7 48% 237.6 25% 25.7
UK 115.6 18% 102.2 11% 13.1
Canada and the US 81.6 13% 309.2 32% -73.6
Poland 66.8 11% 64.5 7% 3.5
Chile 3.7 1% 108.3 11% -96.6
Rest of Europe 57.6 9% 135.7 14% -57.6
Rest of world 2.6 0% 3.9 0% -33.6
Total international 327.8 52% 723.8 75% -54.7
TOTAL 626.5 100% 961.4 100% -34.8 *In order to facilitate analysis, all the comments refer to profit from operations before impairment and non-current asset disposals.
FINANCIAL RESULT
Dec-11 Dec-10 Ch. (%)
Financial loss of infrastructure projects -276.9 -539.5 48.7
Financial loss of other companies -83.4 -136.4 38.8
Net borrowing costs -360.4 -676.0 46.7
Financial loss of infrastructure projects -2.5 3.0 183.1
Financial profit of other companies 59.6 -30.6 294.9
Financial profit from hedges 57.1 -27.5 307.2
Financial loss -303.3 -703.5 56.9
NET PROFIT
Dec-11 Dec-10 Ch. (%)
Construction 148.9 135.0 10.3
Services 320.4 143.8 122.8
Toll roads 28.6 2,480.4 N/A
Airports 827.2 -473.9 N/A
Total 1,269.0 2,163.3 -41.3

Directors’ report for 2011 and 2010 Ferrovial S.A. and Subsidiaries
Ferrovial, S.A. Directors’ report at 31 December 2011 21
Depreciation and amortisation
The depreciation and amortisation charge was down on the same period in 2010 (-12.7% on a like-for-like basis) to stand at EUR 192 million. The main reduction was seen at the Toll Road Division, due to the exclusion from consolidation of 407ETR, and at the Services Division.
EBIT (before impairment and non-current asset disposals)
Excluding the impact of the exchange rate and the change in the scope of consolidation, the change would be +17.9%.
Impairment and non-current asset disposals
This heading includes the gains on the disposal of Swissport, which gave rise to a net gain of EUR 195 million and the M45 toll road with a gain of EUR 27 million, both of which were partially offset by the impairment of certain European toll roads.
Financial result
The financial loss fell by 56.9%, due to a combination of various factors such as the change in the scope of consolidation (mainly due to the exclusion from consolidation of the 407ETR toll road) and the positive contribution of the share option plans as a result of the increase in the share price.
Dec-11 Dec-10 Ch. (%)
Financial loss of infrastructure projects -276.9 -539.5 48.7
Financial loss of other companies -83.4 -136.4 38.8
Net borrowing costs -360.4 -676.0 46.7
Financial loss of infrastructure projects -2.5 3.0 183.1
Financial profit of other companies 59.6 -30.6 294.9
Financial profit from hedges 57.1 -27.5 307.2
Financial loss -303.3 -703.5 56.9
Dec-11 Dec-10
Stock option plans 57.9 -29.4
Interest rate hedges 1.8 -6.4
Other hedges -2.6 8.3
Total 57.1 -27.5
Profits of companies accounted for using the equity method
Dec-11 Dec-10 Ch. (%)
Construction -0.1 -1.3 95.2
Services 1.9 30.6 93.8
Toll roads 27.5 9.8 -181.6
Airports -12.9 -466.8 97.2
Total 16.5 -427.7 103.9
The sale of 5.88% of BAA led to this company being accounted for using the equity method from November 2011 onwards.

Directors’ report for 2011 and 2010 Ferrovial S.A. and Subsidiaries
Ferrovial, S.A. Directors’ report at 31 December 2011 22
The companies accounted for using the equity method contributed EUR 17 million (EUR -428 million in the same period of 2010). 2011 includes the contribution of the 407ETR toll road (EUR 27 million) and the loss of BAA. 2010 includes the accounting losses of BAA, 407ETR (two months), the contribution of Tubelines in the Services Division and the contribution of M45 to Toll Roads.
Taxes
Profit before tax, EUR 485 million, includes certain items that are not taxable, such as the profits of companies accounted for using the equity method, since these are net of taxes, and the gain arising on the sale of Swissport (EUR 195 million). After adjusting for these effects, taxable profit stood at EUR 270 million which, after applying the effective tax rate for each of the countries and deducting tax credits, gives rise to an income tax expense of EUR 88 million at an effective tax rate of 33%. It also includes the adjustment of prior years’ deferred tax assets and liabilities and a review of the recovery of tax losses recognised, which had a positive impact of EUR 27 million. All this meant the tax expense for 2011 was EUR 61 million.
Non-controlling interests
This heading amounts to EUR 1.1 million.
Gain arising on exclusion of BAA from consolidation
In accordance with the requirements of IAS 27, the sale of a percentage of an ownership interest in an investee that leads to a loss of control entails the derecognition of the assets and liabilities of the subsidiary and the recognition of the consideration received for the percentage sold the remeasurement and the investment retained at its fair value, the difference being a loss or gain to be recognised at the Parent. Based on the foregoing, the Company recognised a gain after tax of EUR 847 million, divided between the gain on the sale of 5.88% of BAA, that amounted to EUR 141.6 million and the increase in the fair value of the ownership interest retained (49.99%), which amounted to EUR 706 million.
Net profit
Net profit in 2011 amounted to EUR 1,269 million, mainly as a result of the disposal of BAA, Swissport (EUR 195 million) and the M45 toll road (EUR 27 million). In 2010 the transaction to sell 10% of 407ETR gave rise to gains (EUR 2,471 million).
Directors’ report for 2011 and 2010 Ferrovial S.A. and Subsidiaries
Ferrovial, S.A. Directors’ report at 31 December 2011 23
7. BALANCE SHEET AND OTHER AGGREGATES
Dec-11 Dec-10
Non-current assets 17,517 35,465
Goodwill 1,493 5,032Intangible assets 105 97
Investments in infrastructure projects 5,960 21,512Investment property 627 552
Property, plant and equipment 64 64Investments in associates 5,219 3,110
Non-current financial assets 1,893 2,184Pension surplus
Deferred tax assets 2,022 2,068Derivative financial instruments at fair value 135 847
Non-current assets classified as held for sale and discontinued operations
2 1,515
Current assets 5,453 6,306
Inventories 427 445Trade and other receivables 2,677 3,161Cash and cash equivalents 2,349 2,701
TOTAL ASSETS 22,972 43,287
Equity and liabilities 6,288 6,628Equity attributable to the equity holders 6,138 5,194
Non-controlling interests 150 1,434Deferred income 292 196
Non-current liabilities 10,815 28,596Provisions for pensions 110 153
Other long-term provisions 1,010 860Bank borrowings 6,695 21,511
Other payables 179 154Deferred tax liabilities 1,299 3,951Derivative financial instruments at fair value 1,521 1,968
Liabilities classified as held for sale and discontinued operations 0 891
Current liabilities 5,577 6,975
Bank borrowings 1,214 1,530
Trade and other payables 3,882 4,889Operating provisions and allowances 481 556
TOTAL EQUITY AND LIABILITIES 22,972 43,287

Directors’ report for 2011 and 2010 Ferrovial S.A. and Subsidiaries
Ferrovial, S.A. Directors’ report at 31 December 2011 24
CONSOLIDATED NET DEBT
The net cash position excluding infrastructure projects improved by EUR 876 million to leave a net cash position of 907 million. This change is a combination of the disposals in the period amounting to 1,264 million (the sale of 5.88% de BAA, Swissport, the collection of the remaining 40% of the price relating to the Chilean toll roads and M-45), the investments made totalling EUR 328 million, the payment of dividends (EUR 367 million) y and the generation of cash flow (EUR 510 million).
The net debt of projects stands at EUR 6,102 million. The change was due mainly to the exclusion from consolidation of BAA and the investments in infrastructure.
The Group’s net debt stands at EUR 5,171 million.
NCP excluding infrastructure projects 907 31
BAA 0 -14,529Toll roads -5,692 -5,026
Other -386 -265
NCP including infrastructure projects -6,077 -19,820
Total net cash position -5,171 -19,789
Dec-11 Dec-10
Refinancing of corporate debt
On 12 April, Ferrovial refinanced its gross corporate debt (EUR 1,805 million), through the repayment of EUR 491 million and the refinancing of EUR 1,314 million.
The refinancing was performed through the arrangement of a syndicated loan with 32 banks (Spanish and foreign), extending maturity until April 2015 (previous maturity 2012). The transaction also included a liquidity line of EUR 541 million, which will not initially be drawn against.
The agreement represents an improvement in borrowing costs (margin of 300 basis points (bps) in 2011 and with a projection of 270 bps for the remaining life of the loan).
In July EUR 300 million were repaid early.
CORPORATE RATING
In August 2011 the financial rating agencies Standard & Poor’s and Fitch issued for the first time their opinion on the financial rating of Ferrovial, which in both cases was in the category of “investment grade”:

Directors’ report for 2011 and 2010 Ferrovial S.A. and Subsidiaries
Ferrovial, S.A. Directors’ report at 31 December 2011 25
Agency Rating Outlook
S&P BBB- Stable
FITCH BBB- Stable
Directors’ report for 2011 and 2010 Ferrovial S.A. and Subsidiaries
Ferrovial, S.A. Directors’ report at 31 December 2011 26
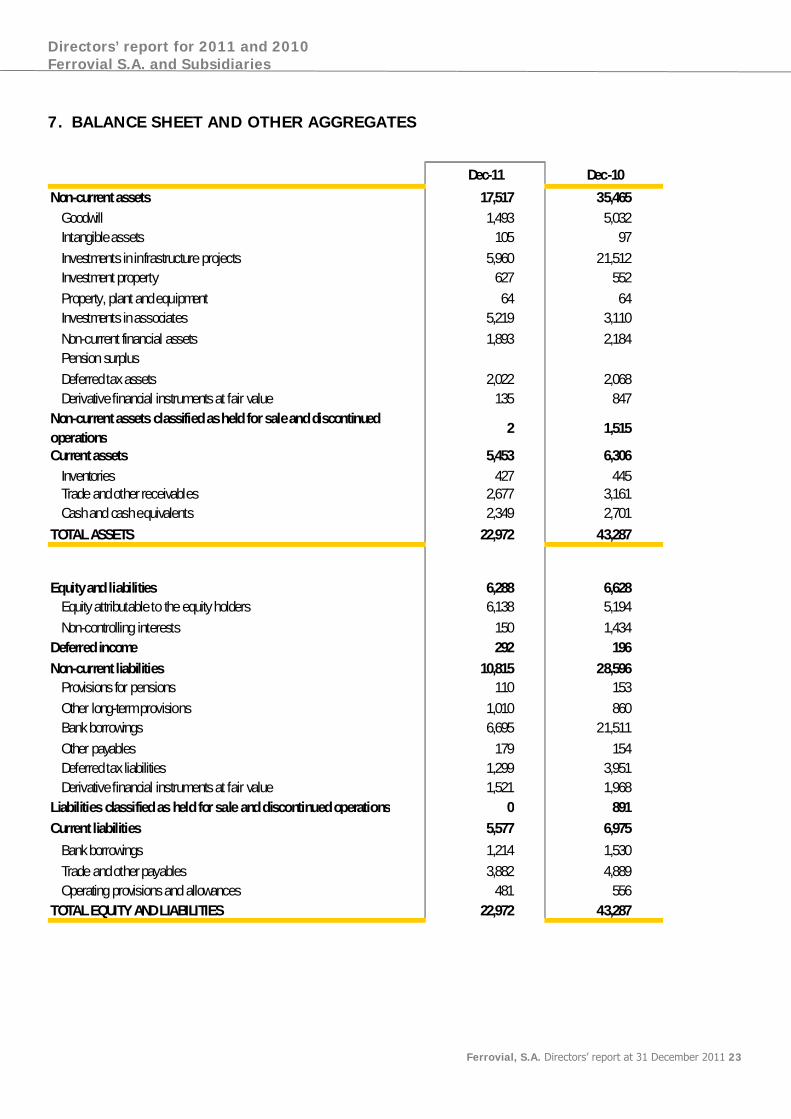
Dec-10 Cash flows excluding concession operators
Cash flows of concession operatore
EliminationsConsolidated cash
flows
EBITDA 573 659 1,232Dividends received 178 -134 44
Working capital 120 -68 52Cash flows from operating activities ex. income tax 871 592 -134 1,328
Taxes paid -60 -23 -83Cash flows from operating activities 811 568 -134 1,245
Investment -420 -915 141 -1,194Disposals 1,124 1,124
Cash flows from investing activities 704 -915 141 -70
Cash flows from operating activities 1,515 -347 7 1,175
Interest cash flows -138 -469 -608Share capital and non-controlling interest cash flows 0 207 -138 69
Dividend flows -315 -315Dividends - subsidiaries -5 -215 134 -86
Change in exchange rate -6 -285 -291NCP held for sale/Equity accounted companies 180 2,438 2,618
Other changes in borrowings (not giving rise to cash flows) -27 -54 2 -78Change in NCP 1,203 1,275 5 2,483
2010 opening net position -1,172 -21,110 11 -22,271
2010 ending net position 31 -19,836 16 -19,789
Dec-11 Cash flows excluding concession operators
Cash flows of concession operators
EliminationsConsolidated cash
flows
EBITDA 463 356 819Dividends received 182 -25 157
Working capital -68 -103 -171Cash flows from operating activities ex. income tax 578 252 -25 805
Taxes paid -67 -25 -92Cash flows from operating activities 510 228 -25 713
Investment -328 -780 135 -973Disposals 1,264 1,264
Cash flows from investing activities 936 -780 135 291
Cash flows from operating activities 1,446 -552 109 1,004
Interest cash flows -114 -293 -407Share capital and non-controlling interest cash flows -1 263 -136 126
Dividends paid - Parent -367 -367Dividends paid - subsidiaries -9 -32 25 -15
Change in exchange rate -27 -97 -124Exclusion of debt of BAA 14,529 14,529
Other changes in borrowings (not giving rise to cash flows) -53 -85 11 -127Change in NCP 875 13,733 9 14,618
2011 opening net position 31 -19,836 16 -19,789
2011 ending net position 907 -6,102 25 -5,171
8. CONSOLIDATED CASH FLOWS

Directors’ report for 2011 and 2010 Ferrovial S.A. and Subsidiaries
Ferrovial, S.A. Directors’ report at 31 December 2011 27
CASH FLOWS EXCLUDING INFRASTRUCTURE PROJECTS
a) Cash flows from operating activities:
The changes in the cash flows from operating activities excluding infrastructure projects, by business segment, in 2011 with respect to 2010 are as follows:
Cash flows from operating activities Dec-10 Dec-11
Construction 298 373
Services 164 282
Toll roads 137 178
Airports -15 -12
Other -6 50Cash flows from operating activities without taxes
578 871
Income tax paid -67 -60
Total 511 811
The cash flow from operating activities of the Services Division in 2010 includes the contribution of Swissport (EUR 113 million).
The detail, by business, of the cash flows of the Construction and Services Divisions is as follows:
Dec-11 Construction Services Total
EBITDA 235 274 509Dividends received 24 24
Working capital 63 -133 -70Cash flows from operating
activities without taxes 298 164 462
Dec-10 Construction Services Total
EBITDA 225 402 627Dividends recieved 6 6
Working capital 148 -126 22
Cash flows from operating activities without taxes Ex-Taxes 373 282 655

Directors’ report for 2011 and 2010 Ferrovial S.A. and Subsidiaries
Ferrovial, S.A. Directors’ report at 31 December 2011 28
In Toll Roads, cash flows from operating activities in 2011 include EUR 159 million from dividends and equity reimbursed from the toll road infrastructure concession operators, the detail being as follows.
Dividends and equity reimbursed Dec-11 Dec-10ETR 407 133 100
Ausol 12M-45 4
Spanish toll roads 16Norte Litoral 8
Algarve 1Portuguese toll roads 9
Irish toll roads 16Chilean toll roads 8
Total dividends 159 123
Autoestrade Poludnie 22Norte litoral 21
Chicago 3Spanish toll roads 1
Total equity reimbursed 47Total 159 170
b) Cash flows from investing activities
The detail, by business segment, of the cash flows from investing activities excluding infrastructure projects, separating in each case the disbursements for investments made and the collections on disposals, is as follows:
Dec-11 Investment DisposalsCash flows
from investing activities
Construction -92 9 -83Services -99 705 605
Toll roads -134 224 90Airports 326 326
Other -3 -3Total -328 1,264 936
Dec-10 Investment Disposals
Cash flows from
investing activities
Construction -46 8 -38
Services -148 241 94Toll roads -139 867 728
Airports -83 -83
Other -4 8 3Total -420 1,124 704
Of particular note in relation to cash flows from investing activities were the capital increases in the Toll Roads Division due to the investments in non-current assets made in infrastructure projects (mainly in US toll roads under construction), the acquisition of a company in Poland, PNI, for EUR 50 million in the Construction Division and investments mostly in property, plant and equipment in the Services Division.
Disposals in the Services Division include most notably the sale of Swissport (EUR 692 million), and in the Airports Division the sale of 5.88% of BAA for EUR 326 million. A salient event in the Toll Roads Division was the sale of M45 (EUR 68 million) and the collection of the 40% deferred price on the sale of the Chilean toll roads (EUR 157 million).

Directors’ report for 2011 and 2010 Ferrovial S.A. and Subsidiaries
Ferrovial, S.A. Directors’ report at 31 December 2011 29
The detail of the investments in non-current assets in the Toll Roads Division is as follows:
Investments in non-current assets Toll
Roads DivisionDec-11 Dec-10
LBJ -47 -29NTE -28 -37SH-130 -28 -10Spanish toll roads -16 -26Greek toll roads -22M-3 -10 -3Azores -5 -12
Total -134 -139
c) Cash flows from financing activities
Cash flows from financing activities include the flows of dividends paid to the shareholders of Ferrovial, S.A. amounting to EUR 367 million and to the non-controlling shareholders of Budimex (EUR 24 million).
Equally of note was the payment of interest in the year (EUR -114 million), together with the impact of the exchange rate (EUR -27 million) and other changes in borrowings (not giving rise to cash flows) (EUR -53 million), which include accounting changes in the borrowings that do not affect the cash flows, including most notably the balance of accrued interest payable and the payment of commissions and fees associated with the issue of borrowings.
Lastly, cash flows from financing activities include the exclusion of the borrowings of BAA after the sale of the 5.88% ownership interest for EUR 14,529 million.
CASH FLOWS OF INFRASTRUCTURE PROJECTS
a) Cash flows from operating activities
The cash flows from operating activities of the infrastructure concession projects includes mainly the inflow of funds from the companies which are operating, although it also includes the VAT refunds and payments corresponding to those still under construction. The detail of the cash flows from operating activities of infrastructure projects is as follows.
Dec-11 Dec-10
Toll roads 200 550
Other 28 18Cash flows from operating activities 228 568
The cash flows from operating activities of the Toll Roads Division include most notably a decrease in cash flows as a result of the fact that the Canadian toll road 407ETR started to being accounted for using the equity method in September 2010 and of the sale of the Chilean toll roads in August 2010.
Directors’ report for 2011 and 2010 Ferrovial S.A. and Subsidiaries
Ferrovial, S.A. Directors’ report at 31 December 2011 30
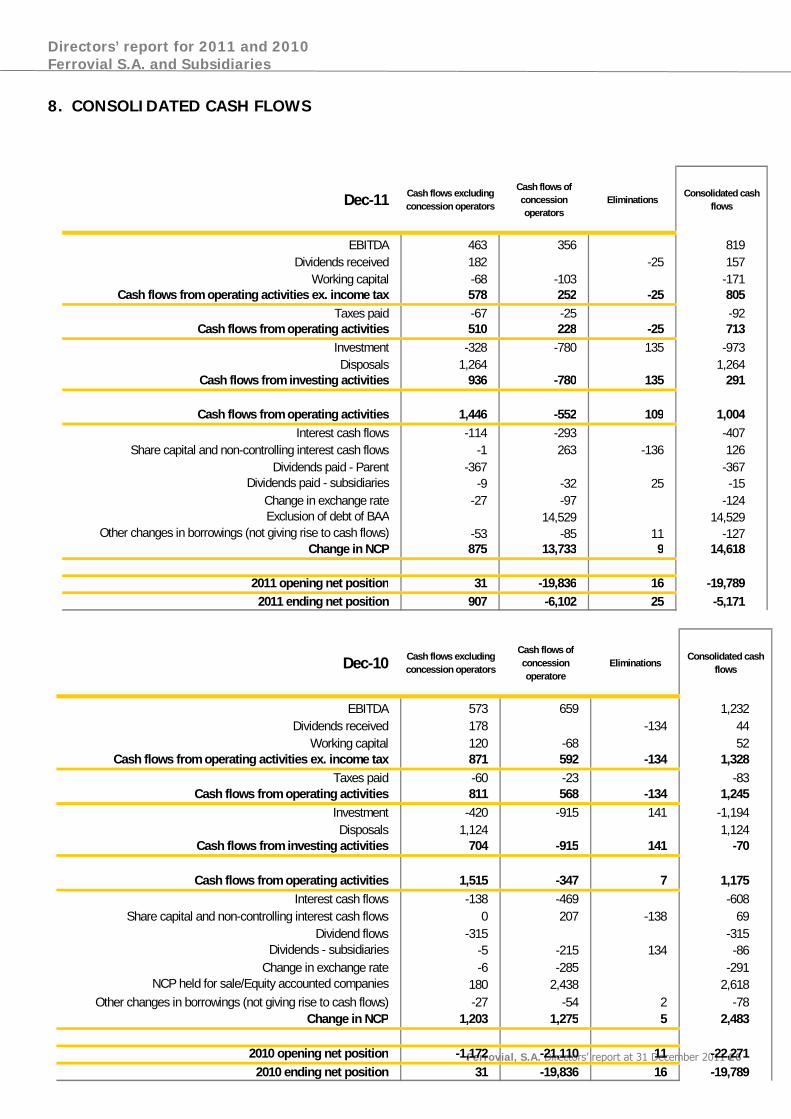
b) Cash flows from investing activities
The detail of the cash flows from investing activities of infrastructure projects, making a distinction between outlays, mostly related to capex investments, and the collections on disposals, is as follows.
Dec-11 Investment Disposals Net investment
LBJ -257 -257
SH-130 -201 -201North Tarrant Express -111 -111
Total Portuguese toll roads -51 -51Total Spanish toll roads -15 -15
Total toll roads -633 -633Other -146 -146
Total projects -780 -780
Dec-10 Investment Disposals Net investment
SH-130 -275 -275North Tarrant Express -185 -185
Total Portuguese toll roads -119 -119LBJ -96 -96
407ETR -44 -44Other -53 -53
Total toll roads -771 -771Other -144 -144
Total projects -915 -915
In 2011 the cash flows from investing activities included most notably the investments in concession assets under construction in the Toll Roads Division, and in particular the toll roads in the US (SH-130, North Tarrant Express and LBJ) and Portugal (Azores toll road).
c) Cash flows from financing activities
Cash flows from financing activities include the payment of dividends and equity reimbursed by concession operators to their shareholders, as well as the disbursements relating to capital increases received by the companies. For the fully consolidated concession operators these amounts correspond to all of the amounts paid and received by the concession operators, irrespective of the percentage of ownership that the Group holds therein. No dividends or equity reimbursement are included for the companies that are accounted for using the equity method.
Interest flows relate to interest paid by the concession operators, plus other fees and commissions and costs closely related to the obtainment of financing. Cash flows in relation to these items correspond to the interest expense for the period and any other item entailing a direct change in net borrowings for the period. This amount does not coincide with the borrowings costs included in the income statement, mainly as a result of the differences between the accrual and payment of interest.

Directors’ report for 2011 and 2010 Ferrovial S.A. and Subsidiaries
Ferrovial, S.A. Directors’ report at 31 December 2011 31
Interest flows Dec-11 Dec-10
Spanish toll roads -110 -91
US toll roads -105 -117
Portuguese toll roads -41 -40
Other toll roads -15 -18
ETR 407 -151
Chgilean toll roads -39
Total toll roads -271 -457
Other -22 -13
Total -293 -469
Cash flows from financing activities also include the impact of interest rate fluctuations on borrowings denominated in foreign currency, which in 2011 gave rise to a loss of EUR -97 million, as a consequence of the appreciation of the euro against the US dollar, which had a significant impact on the net debt of the US toll roads.
Lastly, “Other Changes in Borrowings (Not Giving Rise to Cash Flows)” includes items that represent a change in borrowings for accounting purposes that do not affect the actual cash flows, such as accrued interest payable, etc.