Directors’ Report and the Annual Financial Report€¦ · · 2017-07-17Directors’ Report and...
53
Directors’ Report and the Annual Financial Report 26
Transcript of Directors’ Report and the Annual Financial Report€¦ · · 2017-07-17Directors’ Report and...

Directors’ Report and the Annual Financial Report
26

CONTENTS
Directors’ Report and the Annual Financial Report
27
Directors’ Report 28
Discussion and Analysis of Financial Statements 34
Independent Audit Report 38
Directors’ Declaration 39
Statement of Financial Performance 40
Statement of Financial Position 41
Statement of Cash Flows 42
Notes to and forming part of the Financial Statements
1 Statement of Accounting Policies 43
2 Revenue, Expenses and Losses by Function 47
3 (Accumulated Losses)/Retained Profi ts 48
4 Income Tax Expense 49
Current Assets
5 Inventories 50
6 Current Receivables 50
7 Other Financial Assets 50
Non-Current Assets
8 Development Expenditure 51
9 Exploration Expenditure 51
10 Non-Current Receivables 51
11 Other Non-Current Financial Assets 52
12 Controlled Entities 52
13 Property, Plant and Equipment 53
Current Liabilities
14 Current Payables 54
15 Interest Bearing Liabilities 54
16 Current Tax Liabilities 54
17 Current Provisions 54
Non-Current Liabilities
18 Deferred Tax Liabilities 54
19 Non-Current Provisions 54
20 Provisions 55
21 Contributed Equity 55
22 Reserves 57
23 Earnings Per Share 57
24 Segment Information 58
25 Related Party Disclosures 60
26 Notes to the Statement of Cash Flows 61
27 Commitments for Expenditure 62
28 Joint Ventures 63
29 Associate Companies 64
30 Superannuation Plans 65
31 Remuneration of Auditors 65
32 Director and Executive Disclosures 65
33 Contingent Liabilities 69
34 Contingent Assets 70
35 Financial Instruments 71
36 Subsequent Events 72
37 Impact of Adopting AASB Equivalents to IFRS 72
38 Additional Company Information 73
CONTENTS
ROC AR 2004_Financials.indd 27 24/03/2005 18:11:18 pm

DIRECTORS’ REPORT
28 ROC OIL COMPANY LIMITED
Mr Andrew J Love BCOM, FCA, MAICD(Non-Executive Director, Chairman), 51 - Appointed 5 February 1997
Mr Love is Chairman of the Board of ROC, a Fellow of The Institute of Chartered Accountants in Australia and a Senior Partner in the fi rm of Ferrier Hodgson, Chartered Accountants. In the prior three years, Mr Love was a director of Principal Real Estate Investors (Aust) Limited. Mr Love is also a non-executive director of a number of other public companies.
Mr William G Jephcott BCOM, FCPA, FAICD
(Non-Executive Director, Deputy Chairman), 54 -Appointed 5 February 1997
Mr Jephcott is an investment banker who specialises in merger and acquisition advice. He also has experience in the fi nancing and structuring of major resource projects, including those in the oil and gas industry. Mr Jephcott is currently Vice Chairman, Mergers and Acquisitions, Merrill Lynch International (Australia) Limited and also non-executive Chairman of Mobile Innovations Limited. He was previously a director of Parbury Limited.
Dr R John P Doran BSC, MSC, PHD, FAICD
(Executive Director and Chief Executive Offi cer), 58 -Appointed 14 October 1996
Dr Doran is Chief Executive Offi cer and a founder Director of ROC. He has more than 30 years’ experience in international oil exploration and development characterised by direct involvement with several corporate expansions and/or commercial discoveries and developments in Western Europe, North and West Africa, the Middle East, South and East Asia, West Africa and Australia.
Mr Richard J Burgess BSC
(Non-Executive Director), 73 - Appointed 27 May 1997
Mr Burgess is a geologist by training and was, until his retirement, President and Chief Executive Offi cer of CMS Nomeco Oil & Gas Co, a North American-based oil and gas exploration and production company. He has extensive exploration experience in North and South America, Australasia, East Asia and China. Mr Burgess is also a director of Gasco Energy, Inc and was previously a director of Miller Exploration Co.
Mr Ross Dobinson BBUS
(Non-Executive Director), 52 - Appointed 11 June 1997
Mr Dobinson has a corporate advisory and investment banking background. Since 1999, Mr Dobinson has been Managing Director of TSL Group Limited, a corporate advisory company specialising in establishing and advising biotechnology companies. Mr Dobinson is also a director of Starpharma Holdings Limited and Acrux Limited.
The Directors of Roc Oil Company Limited (‘Company’ or ‘ROC’), a listed Australian public company, have pleasure in submitting theDirectors’ Report for the fi nancial year ended 31 December 2004.
Directors
The names and particulars of the Directors of the Company during or since the end of the fi nancial year are:
Mr Sidney J Jansma, Jr MBA
(Non-Executive Director), 61 - Appointed 17 March 1998
Mr Jansma began his career in oil in 1959 working for his father’s private oil company. In 1978, Mr Jansma purchased the entire company from his father and during the ensuing 19 years, the company grew to become the third largest gas producer in the State of Michigan. In 1996, Mr Jansma merged the assets of his company with Dominion Resources, Inc. In addition to dealing with broad industry issues at both state and national levels, Mr Jansma is also President and Chief Executive Offi cer of Wolverine Gas and Oil Corporation, his family-owned company, which is exploring for oil and gas in North America. Mr Jansma is a member of the Board of Governors of the Independent Petroleum Association of America and Chairman of its Environmental Committee. He also serves on the Board of Governors of the American Petroleum Institute.
Mr Adam C Jolliffe(Non-Executive Director), 48 - Appointed 27 November 1998
Prior to joining Cargill Financial Markets plc (‘Cargill’) in 1981, Mr Jolliffe worked for Tenant Trading (Metals) Ltd, a subsidiary of Consolidated Gold Fields trading non-ferrous metals. At Cargill, Mr Jolliffe joined the non-ferrous metals department as Manager - Aluminium Trading, where he was responsible for Eastern and Western Europe, Asia and Africa. In 1986, Mr Jolliffe transferred to Cargill’s rubber trading business as the manager of their European, African and Latin American operations. In 1990 he joined Cargill’s Financial Trading Division and became the Manager of Western European Equity Trading. Mr Jolliffe resigned from Cargill in November 2003 and is now an independent fi nancial consultant.
Ms Sheree Ford BA, LLB, GRADDIP (RESOURCES LAW), MBA
(Company Secretary), 40
Ms Ford is General Counsel and Company Secretary of ROC. Prior to joining ROC, Ms Ford was employed as in-house counsel at BHP Billiton Limited, specialising in petroleum.
Mr Bruce Clement BSC (HONS), MBA
(Company Secretary), 48
Mr Clement is Chief Operating Offi cer and Company Secretary of ROC. Mr Clement has 25 years’ upstream oil and gas industry and banking experience. Mr Clement previously held a number of engineering and management positions within the industry, including with Exxon Corporation in Australia, Ampolex and AIDC Ltd.
DIRECTORSí REPORT
ROC AR 2004_Financials.indd 28 24/03/2005 18:11:23 pm

29
Principal Activities
The consolidated entity’s principal activities in the course of the fi nancial year were oil and gas exploration, development and production. There were no signifi cant changes in the nature of those activities during the fi nancial year.
Results
The net loss of the consolidated entity for the fi nancial year after income tax was $38.8 million (2003: net profi t $3.0 million).
Dividends
No dividends have been paid or declared since the end of the prior fi nancial year and no dividends have been recommended by the Directors in respect of the fi nancial year ended 31 December 2004.
Review of Operations
A review of the consolidated entity’s operations during the fi nancial year and the results of those operations are included in the Annual Financial Report on pages 8 to 11.
Signifi cant Changes in State of Affairs
Changes in the state of affairs of the Company including the Rights Issue, AIM listing and sale of Saltfl eetby are described in the Annual Report in more detail. There are no other signifi cant changes in the nature of activities or state of affairs of the consolidated entity.
Subsequent Events
Since the end of the fi nancial year, the signifi cant events referred to in Note 36 to the Annual Financial Report have occurred.
Except for the matters referred to in Note 36, there has not been any matter or circumstance that has arisen since the end of the fi nancial year, that has signifi cantly affected, or may signifi cantly affect, the operations of the consolidated entity, the results of those operations or the state of affairs of the consolidated entity, in fi nancial years subsequent to 31 December 2004.
Future Developments
Disclosure of information regarding likely developments in the operations of the consolidated entity in future fi nancial years and the expected results of those operations, is likely to result in unreasonable prejudice to the consolidated entity. Accordingly, this information has been omitted from this Directors’ Report.
Directors’ Meetings
The following table sets out the number of Directors’ meetings and meetings of committees of Directors held during the fi nancial year and the number of meetings attended by each Director (while they were a Director):
DirectorsAudit
Committee
Remuneration and Nomination
Committee
Finance and Risk
Management Committee
Occupational Health,
Safety and Environment
Committee
Continuous Disclosure Committee
Number of meetings held 14 3 1 2 2 2
Number of meetings attended
Mr A J Love 12 2 1 2 N/A N/A
Mr W G Jephcott 14 3 1 2 N/A N/A
Dr R J P Doran 14 N/A 1 N/A N/A 2
Mr R J Burgess 14 N/A N/A 2 N/A N/A
Mr R Dobinson 14 N/A N/A N/A 2 N/A
Mr S J Jansma, Jr 11 N/A N/A 2 2 N/A
Mr A C Jolliffe 12 3 N/A 2 N/A N/A
ROC AR 2004_Financials.indd 29ROC AR 2004_Financials.indd 29 24/03/2005 18:11:23 pm24/03/2005 18:11:23 pm

30
Directors’ Remuneration
Details of the nature and amount of each element of the remuneration for the fi nancial year of each Director of the Company are:
Directors’ Fees$
Salary and Other Related Benefi ts including Fringe
Benefi ts Tax$
Bonuses$
Superannuation Contributions
$Total
$
Non-Executive Directors
Mr A J Love 65,000 – – – 65,000
Mr W G Jephcott 45,000 – – 4,050 49,050
Mr R J Burgess 35,000 – – – 35,000
Mr R Dobinson 35,000 – – 3,150 38,150
Mr S J Jansma, Jr 35,000 – – – 35,000
Mr A C Jolliffe 35,000 – – – 35,000
Executive Director
Dr R J P Doran 60,000(1) 471,382 25,000 45,885 602,267
Note:
(1) These fees are paid by Roc Oil (UK) Limited, a controlled entity of the Company, for Dr Doran’s position as Executive Chairman of that company.
The rates of Directors’ fees currently being paid are as follows:
Chairman $65,000 per annum;
Deputy Chairman $45,000 per annum; and
Non-Executive Director $35,000 per annum.
Directors’ Interests
As at the date of this Directors’ Report, the relevant interests of the Directors in the fully paid shares of the Company were:
Ordinary Shares (Fully Paid)
Directors
Mr A J Love 542,712
Mr W G Jephcott 1,031,888
Dr R J P Doran 4,701,501
Mr R J Burgess 589,870
Mr R Dobinson 1,221,659
Mr S J Jansma, Jr 1,897,151
Mr A C Jolliffe 133,230
At the end of the fi nancial year, none of the Directors have options over ordinary shares of the Company.
ROC OIL COMPANY LIMITED
DIRECTORS’ REPORT
ROC AR 2004_Financials.indd 30ROC AR 2004_Financials.indd 30 24/03/2005 18:11:24 pm24/03/2005 18:11:24 pm

31
Directors’ and Offi cers’ Remuneration
Remuneration levels are competitively set to attract, motivate and retain appropriately qualifi ed and experienced Board members and senior executives capable of discharging their respective responsibilities. The Remuneration and Nomination Committee is responsible for determining and reviewing the appropriate level and structure of remuneration for senior executives. Executive remuneration is set at levels and structured to attract, motivate, reward and retain performers to drive the business effectively.
Remuneration packages of senior executives include performance-based components in the form of bonuses. Non-executive directors do not receive any performance related remuneration. Senior executives may receive options under the Executive Share Option Scheme. The ability to exercise options is subject to continuity of employment and certain share and industry peer group performance hurdles.
Details of the nature and amount of each element of the remuneration for the fi nancial year of each of the specifi ed executives of the Company receiving the highest remuneration are:
Position
Base Remuneration(1)
$ Bonuses
$
SuperannuationContributions
$Options
$Total
$
Mr C Way General Manager Operations 309,000 – 27,810 47,989 384,799
Mr B Clement Chief Operating Offi cer 320,000 – 28,800 31,626 380,426
Dr K Hird General Manager Business Development
263,142 10,000 – 20,557 293,699
Mr W Jamieson General Manager Exploration 250,000 – 22,500 42,168 314,668
Ms S Ford General Counsel and Company Secretary
235,000 – 17,095 43,811 295,906
Notes:
(1) Base remuneration includes base salary.
(2) The terms ‘director’ and ‘offi cer’ have been treated as mutually exclusive for the purpose of this disclosure.
The Company has adopted the Australian Securities and Investments Commission guidelines on valuing options for Directors and executives and accordingly has calculated the attributable value of options for the year using the Black-Scholes option pricing model. The options value has been calculated as at the date of issue using the following assumptions: risk-free rate of interest, 5.2%; volatility of share price, 36%; dividend yield, nil; expected life of the options from grant date to expiry date, six years; and it is assumed that 50% of the options which related to Company performance will eventually vest. The value of options are amortised over the vesting period of the option.
Options over Unissued Ordinary Shares
Details of the Employee Share Option Plan and Executive Share Option Plan are disclosed in Note 21(b) to the Annual Financial Report.
During or since the end of the fi nancial year, 1,694,000 options (2003: Nil) were issued to the specifi ed executives of the Company as follows:
Number of Executive Share Options issued during
fi nancial year Issuing entityTotal number of options
held at date of this report
Mr C Way 370,000 ROC 450,000
Mr B Clement 300,000 ROC 650,000
Dr K Hird 195,000 ROC 381,000
Mr W Jamieson 400,000 ROC 500,000
Ms S Ford 429,000 ROC 429,000
During or since the end of the fi nancial year, the Company granted a total of 3,377,000 options over unissued ordinary shares of ROC, comprising 194,000 options under the Employee Share Option Plan and 3,183,000 options under the Executive Share Option Plan.
ROC AR 2004_Financials.indd 31ROC AR 2004_Financials.indd 31 24/03/2005 18:11:24 pm24/03/2005 18:11:24 pm
32
Options over Unissued Ordinary Shares (continued)
As at the date of this Directors’ Report, there were 5,464,700 options, comprising 2,281,700 employee share options and 3,183,000 executive share options, (representing 2.9% of the issued fully paid ordinary shares of the Company) granted over unissued ordinary shares of ROC under the Employee Share Option Plan and the Executive Share Option Plan. Refer to Note 21(b) of the Financial Statements for further details of options outstanding. During the fi nancial year, 192,200 shares were issued as a result of exercise of options under the Employee Share Option Plan. Since the end of the fi nancial year, 175,600 shares were issued as a result of exercise of options under the Employee Share Option Plan.
There remain 3,473,265 options available for issue under the Employee Share Option Plan and Executive Share Option Plan (representing 1.9% of the issued fully paid ordinary shares of the Company) after taking into account 367,800 employee share options that were exercised to the date of this Directors’ Report.
Optionholders do not have any right, by virtue of the option, to participate in any share issues of the Company or any related body corporate or in the interest issue of any other registered scheme.
Indemnifi cation of Directors and Offi cers
An indemnity agreement has been entered into between an insurance company and the current Directors of the Company named earlier in this Directors’ Report and with the full time executive offi cers, directors and secretaries of all Australian group companies. Under this agreement, the insurance company has agreed to indemnify these directors and offi cers against any claim or for any expenses or costs which may arise as a result of work performed in their respective capacities. The contract of insurance prohibits disclosure of the nature of the liability and the amount of the premium.
Rounding
The Company is a company of the kind referred to in Australian Securities and Investments Commission Class Order 98/0100, dated 10 July 1998 and, in accordance with that Class Order, amounts in the annual fi nancial statements have been rounded off to the nearest thousand dollars, unless otherwise indicated.
Corporate Governance
The Board is responsible for the strategic direction of the Company, the identifi cation and implementation of corporate policies and goals, and the monitoring of the business and affairs of the Company on behalf of its shareholders. The Board delegates responsibility for the day-to-day management of ROC to the Chief Executive Offi cer. In addition, the Board has established a number of committees to support it in matters which require more detailed consideration. All Directors have unrestricted access to Company records and information and receive detailed fi nancial and operational reports from senior management during the fi nancial year on a monthly basis.
The Board is comprised of one Executive Director and six Non-Executive Directors including the Chairman. In accordance with the Company’s Constitution and ASX Listing Rules, the Directors (other than the Chief Executive Offi cer) are subject to re-election by shareholders every three years.
The Board usually meets on a monthly basis, and where appropriate, hears presentations from senior management who may be questioned directly by Board members on operational and commercial issues.
The Directors have considered the written management representations received from the Chief Executive Offi cer and General Manager Finance of the Company in accordance with ASX Corporate Governance Council ‘Principles of Good Corporate Governance and Best Practice Recommendations’. Further details of the Company’s corporate governance practices are set out in the Corporate Governance statement in the Annual Report.
Finance and Risk Management
Mr W G Jephcott (Chairman), Mr A J Love, Mr R J Burgess, Mr S J Jansma, Jr and Mr A C Jolliffe are members of the Company’s Finance and Risk Management Committee. It is responsible for monitoring the operational and fi nancial aspects of the Company’s activities and considers recommendations and advice of internal and external advisers on the operational and fi nancial risks of ROC. The Committee evaluates senior management’s assessment of risk and its recommendations in relation to the management of that risk, including hedging policies and the nature and level of insurance cover.
ROC OIL COMPANY LIMITED
DIRECTORS’ REPORT
ROC AR 2004_Financials.indd 32ROC AR 2004_Financials.indd 32 24/03/2005 18:11:27 pm24/03/2005 18:11:27 pm

33
Environmental Regulations
The consolidated entity is subject to signifi cant environmental regulations under Commonwealth legislation. The consolidated entity is also a party to various production sharing contracts and exploration and development licences in the countries in which it operates. In most cases, these contracts and licences specify the environmental regulations applicable to oil and gas operations in the respective jurisdictions. The consolidated entity aims to ensure that it complies with the identifi ed regulatory requirements in each jurisdiction in which it operates. There have been no known material breaches of the environmental obligations of the consolidated entity’s contracts or licences. The Board has established an Occupational, Health, Safety and Environment Committee. The Committee’s responsibility is to ensure that occupational health, safety and environmental standards of the Company’s operations are maintained at a level equal to, or above, accepted industry standards and that the Company complies with all relevant governments in the jurisdictions in which is operates.
Auditor
No offi cer of the Company has previously belonged to an audit practice auditing the Company during the fi nancial year. During the fi nancial year ROC paid its auditor, Deloitte Touche Tohmatsu, the following amounts for material non-audit services, excluding services for the June 2004 interim review:
• $40,000 associated with the Company’s 3 for 5 Renounceable Rights Issue;
• $70,000 associated with listing of the Company on the Alternative Investment Market of London Stock Exchange.
The Directors are satisfi ed that the provision of these services is compatible with the general standards of auditor independence. The services were subject to terms and conditions of engagement to ensure that auditor independence was not compromised.
During the fi nancial year, the Company agreed to indemnify its auditor, Deloitte Touche Tohmatsu, against all liabilities, claims, costs or expenses incurred by it in respect of any claim or action by a third party in connection with the provision by them of services in respect of the Company’s renounceable rights issue and its admission to AIM.
This Directors’ Report is made in accordance with a resolution of the Board of Directors made pursuant to section 298(2) of the Corporations Act 2001.
On behalf of the Directors:
Mr A J Love
Chairman
Dr R J P Doran
Director and Chief Executive Offi cer
Sydney, 25 February 2005
ROC AR 2004_Financials.indd 33ROC AR 2004_Financials.indd 33 24/03/2005 18:11:27 pm24/03/2005 18:11:27 pm

ROC OIL COMPANY LIMITED AND ITS CONTROLLED ENTITIES34
This discussion and analysis is provided to assist readers in understanding the Annual Financial Report.
Key Points
The following section contains a discussion on the 2004 fi nancial results. However, subsequent to the fi nancial year end, ROC completed two transactions that have further strengthened the Company’s fi nancial position. The Saltfl eetby Gas Field was sold for a net consideration of $109 million, realising an after tax profi t of approximately $70 million, and a placement of 9,900,990 shares was completed which raised $19.8 million. A proforma statement of fi nancial position as at 31 December 2004, including these transactions is provided in the table below. In particular, the effect of these transactions, had they been recorded in the 2004 fi nancial position, would have been to increase cash assets by $128.6 million to $204.6 million.
Actual Financial Position at 31 Dec 2004
$ million
Proforma Financial Position at 31 Dec 2004
$ million
Cash assets 76.0 204.6
Development expenditure 77.4 22.7
Other assets 123.5 123.4
Total Assets 276.9 350.7
Deferred tax liability (17.9) (3.3)
Other liabilities (32.2) (32.3)
Total Liabilities (50.1) (35.6)
Net Assets 226.8 315.1
Equity 226.8 315.1
For the 2004 fi nancial year, the consolidated entity recorded a net loss after income tax of $38.8 million (compared with a net profi t
after income tax of $3.0 million for the prior fi nancial year). The result included exploration expenditure expensed and written off of
$46.9 million, net foreign currency losses of $2.0 million and an income tax benefi t of $2.9 million on a loss before tax of $41.7 million.
At 31 December 2004, the consolidated entity was in a sound fi nancial position with cash assets of $76.0 million and no interest bearing debt. On 30 July 2004, ROC repaid in full the outstanding loan balance of $19.6 million owing on its Syndicated Bank Loan Facility.
Sales revenue for the fi nancial year was $38.3 million, with the majority received from the Saltfl eetby Gas Field gas and condensate sales, down $19.0 million from the $57.3 million in the prior fi nancial year.
Total production for the fi nancial year was 1.1 million BOE (2,922 BOEPD). Gas production from the Saltfl eetby Gas Field was 5.8 BCF of gas or 15.7 MMSCFD, signifi cantly below the prior fi nancial year production of 9.6 BCF of gas or 26.4 MMSCFD due to natural decline in fi eld production and operational problems at the third party Theddlethorpe Gas Processing Terminal.
The $14.5 million cash fl ow from operating activities for the fi nancial year represented a decrease of 55% from the corresponding prior fi nancial year, primarily as a result of reduced gas production from the Saltfl eetby Gas Field.
On 21 December 2004, ROC announced that it had entered into agreements with WINGAS GmbH for the sale of 100% of the share capital of two of its wholly-owned subsidiaries, the principal asset of which is the PEDL005 licence, which contains the Saltfl eetby Gas Field, for a cash consideration of £44 million. This sale was completed on 21 January 2005 and as a result there will be no future revenue or cash fl ow accruing to ROC from Saltfl eetby. ROC has retained all its other UK assets. The sale will result in a profi t which will be reported in the Company’s 2005 fi nancial result.
During the fi nancial year, ROC completed a fully underwritten 3 for 5 Renounceable Rights Issue, which raised net proceeds of approximately $88.2 million. The proceeds from the Rights Issue are planned to be used to fund the Company’s proposed development activities in Mauritania and Australia, as well as exploration and appraisal activities in China, West Africa, Australia and the UK.
Subsequent to the end of the fi nancial year, on 27 January 2005, ROC completed a placement of shares with two European-based institutions to raise US$15 million by the issue of 9,900,990 fully paid ordinary shares at a price of $2.00 per share, representing an approximate 11% premium to the previous 10 day average trading price preceding the placement. The shares represented approximately 5.3% of the enlarged issued share capital of the Company.
DISCUSSION AND ANALYSIS OF FINANCIAL STATEMENTS
ROC AR 2004_Financials.indd 34ROC AR 2004_Financials.indd 34 24/03/2005 18:11:28 pm24/03/2005 18:11:28 pm

35
On 6 September 2004, ROC was admitted to trading on the Alternative Investment Market (AIM), a market operated by the London Stock Exchange in the United Kingdom. The listing did not involve the issue of any new ROC shares nor the raising of any capital.
On 30 December 2004, ROC announced it had acquired an option over up to 26% of the Ardmore Oil Field and surrounding acreage in the UK North Sea. Under an agreement with Acorn Oil & Gas Limited, ROC purchased the right to acquire up to 26% of the assets by investing £750,000 via a secured senior ranking loan and undertaking to pay up to 26% of future joint venture cash calls. If ROC chooses to exercise its option to convert its loan to direct equity, a payment of an effective option exercise fee of up to £1.9 million will be required.
During the fi nancial year, ROC formally agreed with Sonangol, the national oil company of Angola, to trigger the production sharing agreement relating to the Cabinda South Block, onshore Angola, with an effective date of 1 November 2004. ROC holds a 60% interest in the block. Planning is underway for a seismic acquisition programme for mid-2005 and a possible drilling programme for 2006.
During the fi nancial year, signifi cant progress was made on the Cliff Head Oil Field Development. Front End Engineering and Design was completed in October 2004 and requests for tenders were issued and bids were received for the major construction contracts for the project. Pre-development work is continuing. A fi nal investment decision is scheduled to be made by the WA-286-P Joint Venture partners in respect of the Cliff Head Oil Field Development in March 2005 following the drilling of the Cliff Head-5 and Cliff Head-6 wells. First oil from the fi eld is scheduled for early 2006.
On 28 May 2004, the Mauritanian Government granted an Exclusive Exploitation Authorisation (‘EEA’) for 25 years over the Chinguetti Oil Field and the Woodside-operated PSC B Joint Venture approved the development plan and budget for the fi eld. First oil is expected by the fi rst quarter 2006. In addition, the Government of Mauritania exercised its right to participate for 12% in the Chinguetti Oil Field development. Once Government participation is fi nalised, ROC’s interest in the Chinguetti EEA will decrease from 3.693% to 3.25%.
ROC participated in the drilling of nine exploration wells during 2004: four offshore Mauritania, two onshore UK, one in the Beibu Gulf, offshore China, one offshore Equatorial Guinea, which was ROC’s fi rst deepwater-operated offshore well, and one offshore Western Australia. The Company was successful with the discovery of the Tevét Oil Field, offshore Mauritania and Errington, a tight gas discovery, onshore UK. ROC also participated in the drilling of six appraisal wells during 2004, four in relation to the Tiof appraisal drilling offshore Mauritania and two in the Beibu Gulf, offshore China.
During 2004, ROC increased its exploration acreage portfolio in a number of areas:
• on 6 January 2004, the offshore Perth Basin permit WA-349-P was awarded to Voyager PB Limited for a six year term and ROC subsequently exercised an option to acquire a 50% interest in and operatorship of the permit;
• on 4 February 2004, the Government of New Zealand, awarded ROC a 40% interest in PEP-38767 in the onshore Taranaki Basin in the North Island of New Zealand;
• on 11 March 2004, ROC exercised its option to acquire a 7.5% interest in WA-226-P in consideration for the payment of $200,000 to Norwest Energy NL;
• on 1 November 2004, ROC triggered the Cabinda South Block Production Sharing Contract, formalising its 60% equity interest in the block; and
• in Equatorial Guinea, a 20% participant of Block H15/16 notifi ed the joint venture of its intention to withdraw from the PSC as of February 2005, the end of the current term. Once the transaction is fi nalised ROC’s equity will increase from 15% to 18.75%, with the original 15% being free carried through the planned 2005 exploration well.
Consolidated Statement of Financial Performance
The consolidated entity recorded a net loss after income tax benefi t of $38.8 million for the fi nancial year, from a trading profi t of $17.2 million, a loss before tax of $41.7 million and income tax benefi t of $2.9 million.
The trading profi t of $17.2 million for 2004 was achieved from sales revenue of $38.3 million. Operating costs totalled $21.1 million for the fi nancial year, comprising production costs of $10.7 million and amortisation and restoration expenses of $10.4 million.
A summary of the key items contributing to the result is provided as follows:
ROC AR 2004_Financials.indd 35ROC AR 2004_Financials.indd 35 24/03/2005 18:11:28 pm24/03/2005 18:11:28 pm

ROC OIL COMPANY LIMITED AND ITS CONTROLLED ENTITIES36
2004$ million
2003$ million
Sales revenue 38.3 57.3
Trading profi t 17.2 31.0
Net interest income 2.5 1.1
Net foreign currency losses (2.0) (5.8)
Exploration expenditure expensed and written off (46.9) (8.5)
Profi t on sale of non-core UK assets – 2.6
Profi t on sale of non-current assets 0.1 0.8
Other (including administration costs and other provisions) (12.6) (10.1)
(Loss)/Profi t before Income Tax Expense (41.7) 11.1
Income tax expense – current period (2.5) (9.4)
– prior period (0.1) 2.8
Deferred income tax – current period 5.5 (1.5)
Total Income Tax Benefi t/(Expense) 2.9 (8.1)
Net (Loss)/Profi t after Income Tax Expense (38.8) 3.0
Exploration expenditure expensed during the fi nancial year primarily relates to the unsuccessful exploration wells drilled in the Perth Basin ($0.4 million), UK ($2.7 million), Mauritania ($1.5 million) and China ($2.4 million) and to exploration costs with respect to the Company’s activities in Angola ($1.0 million).
Exploration expenditure written off relates to other capitalised exploration costs primarily in relation to areas of interest in the UK where no further exploration activity is planned ($27.4 million), in Equatorial Guinea ($10.6 million), where a proportion of equity was farmed out to Pioneer Natural Resources Company, and China ($0.5 million).
The income tax benefi t ($2.9 million) relates exclusively to UK operations.
Consolidated Statement of Financial Position
During the fi nancial year, total assets increased from $244.9 million to $276.9 million, total liabilities decreased from $71.3 million to $50.1 million and total equity increased from $173.7 million to $226.8 million. In addition to the changes resulting from production operations, the major net changes in the Statement of Financial Position resulted from development and exploration expenditure increase in cash assets as a result of the Rights Issue, repayment of its Syndicated Bank Loan Facility and movements in the foreign currency translation reserve.
Development expenditure refl ected in the Consolidated Statement of Financial Position increased from $68.6 million to $77.4 million as a result of expenditure incurred of $8.1 million, transfers from exploration after the Chinguetti Oil Field discovery of $8.0 million and a $2.9 million increase related to foreign exchange adjustments, offset by the current year amortisation expense of $10.2 million.
The majority of the development expenditure was incurred in the following areas of interest:
• United Kingdom ($1.6 million): This cost was principally incurred on the Saltfl eetby fi eld and preliminary development work being completed on Blane and Enoch fi elds in the UK; and
• Mauritania ($6.5 million): Four Chinguetti production wells were drilled during the fi nancial year as well as fi ve injector wells. Costs are also being incurred on the facilities with fi rst oil expected in the fi rst quarter of 2006.
Exploration expenditure refl ected in the Consolidated Statement of Financial Position decreased from $114.8 million to $101.8 million. Total expenditure incurred in the current fi nancial year was $39.7 million. Exploration expenditure of $46.9 million was expensed and written off, $8.0 million was transferred to development and a $2.2 million increase was recorded due to foreign exchange adjustments.
The majority of the exploration expenditure was incurred in the following areas of interest:
• The Perth Basin offshore Western Australia ($6.7 million): Engineering and fi eld work continued on the Cliff Head Oil Field, focusing on the Front End Engineering and Design. The Naomi 2D seismic survey was acquired during October/November 2004 over several leads in the WA-286-P permit. Interpretation of the results is still in progress at the end of the fi nancial year. The Fiddich well was drilled in December 2004 in the WA-226-P permit. The well encountered good quality reservoir, but without signifi cant hydrocarbon shows. The well was plugged and abandoned as a dry well;
DISCUSSION AND ANALYSIS OF FINANCIAL STATEMENTS
ROC AR 2004_Financials.indd 36ROC AR 2004_Financials.indd 36 24/03/2005 18:11:28 pm24/03/2005 18:11:28 pm

37
• Mauritania ($10.1 million): Four appraisal wells were drilled on the Tiof Oil Field in Area B, offshore Mauritania, with all wells encountering hydrocarbons. The Tiof-3 well was suspended as a potential future oil development well. The Tiof-4 and Tiof-5 wells were plugged and abandoned as planned. The Tiof-6 well was suspended in January 2005 and was production tested in February 2005, fl owing at rates of up to 12,400 BOPD. Four exploration wells were also drilled, one of which, Tevét-1, was plugged and abandoned as an oil and gas discovery;
• Angola ($7.2 million): The Cabinda South Block production sharing agreement was triggered on 1 November 2004. The majority of the costs incurred related to the signature bonus payable on the triggering of the production sharing agreement;
• Equatorial Guinea ($0.3 million): In Equatorial Guinea (ROC: 15%), ROC as technical manager for the Block H15/16 Joint Venture, drilled the Bravo-1 exploration well in 1500 metres of water. The well was plugged and abandoned as a dry hole. Prior to drilling the well, on 6 June 2004, ROC farmed out 20% of its interest in the block to Pioneer Natural Resources Equatorial Guinea Limited and was carried through the well;
• China ($5.3 million): One unsuccessful exploration well, Wei 12-7-1, was drilled. This well intersected good oil reservoir, but was water bearing. Two appraisal wells were drilled. The Wei 12-8-3 appraisal well was drilled on the Wei 12-8 East discovery in Block 22/12 Beibu Gulf, offshore China. This appraisal well encountered highly viscous oil and technical work is being undertaken to evaluate the potential development of the fi eld. The Wei 12-3-4 appraisal well was plugged and abandoned as a dry hole;
• New Zealand ($1.1 million): A 3D seismic survey was acquired in 2004, with the data still being processed at the end of the fi nancial year. Planning has commenced for drilling in 2005; and
• United Kingdom ($8.5 million): Two exploration wells were drilled in the UK. The Old Hills exploration well, which was drilled in PEDL003, was plugged and abandoned as a dry well. The Errington-1 well was spudded on 6 November 2004 and suspended in February 2005 as a potential new tight gas discovery. 2D seismic was also conducted in PEDL027. Interpretation of the results has not yet begun.
The market capitalisation of the Company was $318.6 million as at 31 December 2004, based on the fi nancial year end closing market price of $1.81 per fully paid ordinary share and 176,038,703 fully paid ordinary shares on issue.
Consolidated Statement of Cash Flows
Cash fl ow from operating activities was $14.5 million. The major cash fl ows from operating activities included gross receipts from the sale of oil, NGLs and gas in the UK of $45.9 million and payments to suppliers and employees of $24.5 million.
Cash assets increased by $34.5 million over the fi nancial year and as at 31 December 2004 the consolidated entity held a cash and short term deposit balance of $76.0 million.
The consolidated entity’s operating cash fl ow was primarily used to fund exploration and development activities, servicing and repayment of interest bearing liabilities and increasing cash assets.
Net cash used in investing activities was $41.6 million. The major investments during the fi nancial year were the payments for development expenditure ($10.9 million) and payments for exploration expenditure ($32.8 million). Also included in investing activities was $4.0 million received from the sale of UK assets, which was recorded in the previous fi nancial year.
Net cash generated from fi nancing activities was represented by net proceeds from the rights issue of $88.2 million, offset by bank loan repayments of $19.6 million and loans to other entities of $6.8 million during the fi nancial year.
Financial Ratios
Basic earnings per share for the fi nancial year were (23.8) cents, based on a weighted average number of fully paid ordinary shares on issue of 162,812,727.
Cash fl ow from operating activities for the fi nancial year was $14.5 million, or 8.9 cents per share.
Hedging
Oil and gas prices
The consolidated entity did not have any oil or gas price hedging in place at the end of the fi nancial year.
Foreign exchange
The consolidated entity’s foreign exchange hedging strategy is to hedge against specifi c future commitments and identifi ed cash fl ow exposures where appropriate. The consolidated entity did not have any foreign exchange hedging in place at the end of the fi nancial year.
ROC AR 2004_Financials.indd 37ROC AR 2004_Financials.indd 37 24/03/2005 18:11:29 pm24/03/2005 18:11:29 pm
ROC OIL COMPANY LIMITED AND ITS CONTROLLED ENTITIES38
INDEPENDENT AUDIT REPORT TO THE MEMBERSOF ROC OIL COMPANY LIMITED
Scope
The fi nancial report and directors’ responsibility
The fi nancial report comprises the Statement of Financial Position, Statement of Financial Performance, Statement of Cash Flows, accompanying Notes to the Financial Statements, and the Directors’ Declaration for both Roc Oil Company Limited (the disclosing entity) and the consolidated entity, for the fi nancial year ended 31 December 2004 as set out on pages 39 to 73. The consolidated entity comprises the disclosing entity and the entities it controlled at the year’s end or from time to time during the fi nancial year.
The directors of the disclosing entity are responsible for the preparation and true and fair presentation of the fi nancial report in accordance with the Corporations Act 2001. This includes responsibility for the maintenance of adequate accounting records and internal controls that are designed to prevent and detect fraud and error, and for the accounting policies and accounting estimates inherent in the fi nancial report.
Audit approach
We have conducted an independent audit of the fi nancial report in order to express an opinion on it to the members of the disclosing entity. Our audit has been conducted in accordance with Australian Auditing Standards to provide reasonable assurance whether the fi nancial report is free of material misstatement. The nature of an audit is infl uenced by factors such as the use of professional judgement, selective testing, the inherent limitations of internal controls, and the availability of persuasive rather than conclusive evidence. Therefore, an audit cannot guarantee that all material misstatements have been detected.
We performed procedures to form an opinion whether, in all material respects, the fi nancial report is presented fairly in accordance with the Corporations Act 2001 and Accounting Standards and other mandatory professional reporting requirements in Australia so as to present a view which is consistent with our understanding of the disclosing entity’s and the consolidated entity’s fi nancial position, and performance as represented by the results of their operations and their cash fl ows.
Our procedures included examination, on a test basis, of evidence supporting the amounts and other disclosures in the fi nancial report, and the evaluation of accounting policies and signifi cant accounting estimates made by the directors.
While we considered the effectiveness of management’s internal controls over fi nancial reporting when determining the nature and extent of our procedures, our audit was not designed to provide assurance on internal controls.
The audit opinion expressed in this report has been formed on the above basis.
Independence
In conducting our audit, we followed applicable independence requirements of Australian professional ethical pronouncements and the Corporations Act 2001.
Audit Opinion
In our opinion, the fi nancial report of Roc Oil Company Limited is in accordance with:
(a) the Corporations Act 2001, including:
(i) giving a true and fair view of the disclosing entity’s and consolidated entity’s fi nancial position as at 31 December 2004 and of their performance for the year ended on that date; and
(ii) complying with Accounting Standards in Australia and the Corporations Regulations 2001; and
(b) other mandatory professional reporting requirements in Australia.
DELOITTE TOUCHE TOHMATSU
J Duivenvoorde
Partner
Chartered Accountants
Sydney, 25 February 2004
ROC AR 2004_Financials.indd 38ROC AR 2004_Financials.indd 38 24/03/2005 18:11:35 pm24/03/2005 18:11:35 pm

39
The Directors declare that:
(a) the attached fi nancial statements and notes thereto comply with relevant Australian Accounting Standards;
(b) the attached fi nancial statements and notes thereto give a true and fair view of the fi nancial position and performance of the Company and the consolidated entity;
(c) in the Directors’ opinion, the attached fi nancial statements and notes thereto are in accordance with the Corporations Act 2001; and
(d) in the Directors’ opinion, there are reasonable grounds to believe that the Company will be able to pay its debts as and when they become due and payable.
This Directors’ Declaration is made in accordance with a resolution of the Board of Directors made pursuant to section 295(5) of the Corporations Act 2001.
On behalf of the Directors:
Mr A J Love Dr R J P Doran
Chairman Director and Chief Executive Offi cer
Sydney, 25 February 2005
DIRECTORS’ DECLARATION
ROC AR 2004_Financials.indd 39ROC AR 2004_Financials.indd 39 24/03/2005 18:11:35 pm24/03/2005 18:11:35 pm
40
CONSOLIDATED COMPANY
Note2004$’000
2003$’000
2004$’000
2003$’000
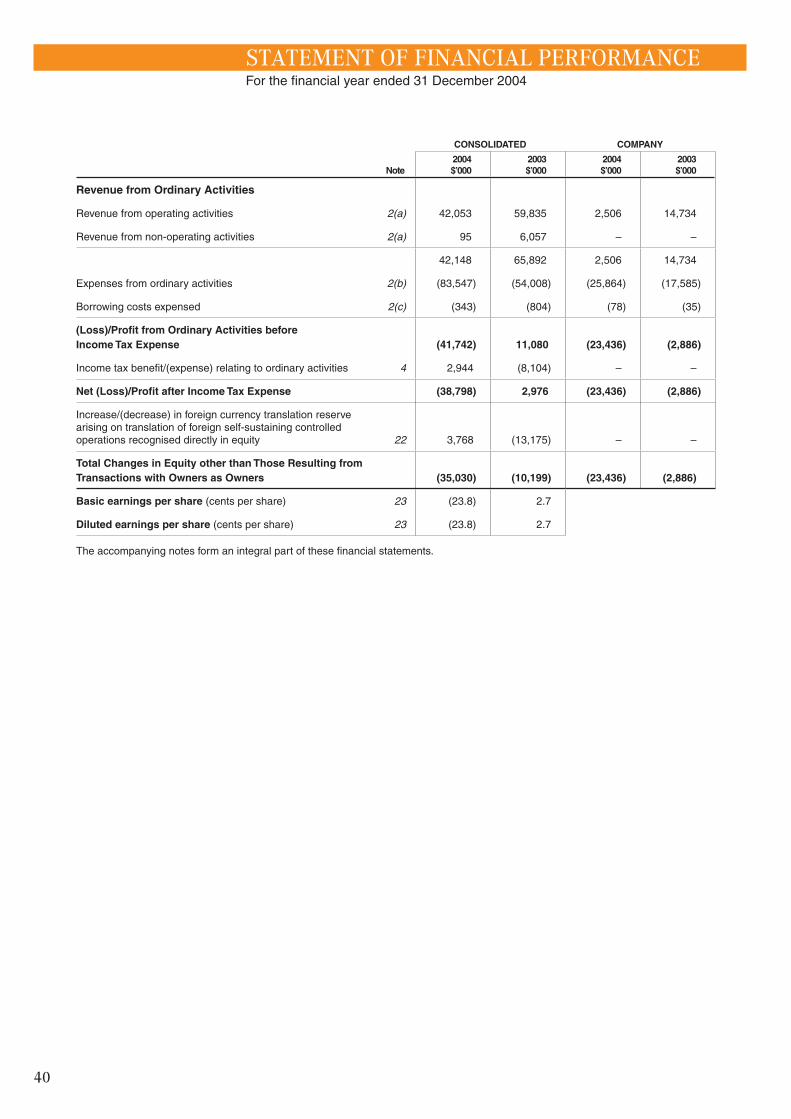
Revenue from Ordinary Activities
Revenue from operating activities 2(a) 42,053 59,835 2,506 14,734
Revenue from non-operating activities 2(a) 95 6,057 – –
42,148 65,892 2,506 14,734
Expenses from ordinary activities 2(b) (83,547) (54,008) (25,864) (17,585)
Borrowing costs expensed 2(c) (343) (804) (78) (35)
(Loss)/Profi t from Ordinary Activities before Income Tax Expense (41,742) 11,080 (23,436) (2,886)
Income tax benefi t/(expense) relating to ordinary activities 4 2,944 (8,104) – –
Net (Loss)/Profi t after Income Tax Expense (38,798) 2,976 (23,436) (2,886)
Increase/(decrease) in foreign currency translation reserve arising on translation of foreign self-sustaining controlled operations recognised directly in equity 22 3,768 (13,175) – –
Total Changes in Equity other than Those Resulting from Transactions with Owners as Owners (35,030) (10,199) (23,436) (2,886)
Basic earnings per share (cents per share) 23 (23.8) 2.7
Diluted earnings per share (cents per share) 23 (23.8) 2.7
The accompanying notes form an integral part of these fi nancial statements.
STATEMENT OF FINANCIAL PERFORMANCEFor the fi nancial year ended 31 December 2004
ROC AR 2004_Financials.indd 40ROC AR 2004_Financials.indd 40 24/03/2005 18:11:35 pm24/03/2005 18:11:35 pm

41
CONSOLIDATED COMPANY
Note2004$’000
2003$’000
2004$’000
2003$’000
Current Assets
Cash assets 26(a) 76,035 41,553 66,626 20,329
Inventories 5(a) 990 2,025 – –
Receivables 6 16,325 15,449 10,809 2,903
Other fi nancial assets 7 14 14 – –
Total Current Assets 93,364 59,041 77,435 23,232
Non-Current Assets
Development expenditure 8 77,354 68,572 – –
Exploration expenditure 9 101,751 114,839 – –
Receivables 10 15 91 92,128 82,002
Other fi nancial assets 11 28 103 102,920 102,995
Inventories 5(b) 43 78 – –
Property, plant and equipment 13 4,366 2,198 2,160 811
Total Non-Current Assets 183,557 185,881 197,208 185,808
Total Assets 276,921 244,922 274,643 209,040
Current Liabilities
Payables 14 20,729 17,948 1,165 1,769
Interest bearing liabilities 15(a) 180 18,094 180 –
Current tax liabilities 16 5,228 8,558 – –
Provisions 17 925 637 925 637
Total Current Liabilities 27,062 45,237 2,270 2,406
Non-Current Liabilities
Interest bearing liabilities 15(b) 932 – 932 –
Deferred tax liabilities 18 17,873 22,143 – –
Deferred income – 87 – –
Provisions 19 4,264 3,800 330 252
Total Non-Current Liabilities 23,069 26,030 1,262 252
Total Liabilities 50,131 71,267 3,532 2,658
Net Assets 226,790 173,655 271,111 206,382
Equity
Contributed equity 21 291,357 203,192 291,357 203,192
(Accumulated losses)/retained profi ts 3 (75,966) (37,168) (20,246) 3,190
Reserves 22 11,399 7,631 – –
Total Parent Entity Interest and Total Equity 226,790 173,655 271,111 206,382
The accompanying notes form an integral part of these fi nancial statements.
STATEMENT OF FINANCIAL POSITIONAs at 31 December 2004
ROC AR 2004_Financials.indd 41ROC AR 2004_Financials.indd 41 24/03/2005 18:11:35 pm24/03/2005 18:11:35 pm

ROC OIL COMPANY LIMITED AND ITS CONTROLLED ENTITIES42
STATEMENT OF CASH FLOWSFor the fi nancial year ended 31 December 2004
CONSOLIDATED COMPANY
Note
Infl ow/(Outfl ow)
2004$’000
Infl ow/(Outfl ow)
2003$’000
Infl ow/(Outfl ow)
2004$’000
Infl ow/(Outfl ow)
2003$’000
Cash Flows from Operating Activities
Receipts from customers 45,927 66,802 – –
Payments to suppliers and employees (24,454) (24,943) (11,783) (5,763)
Dividends received – – – 13,885
Interest received 2,641 1,782 2,339 807
Interest paid and other costs of fi nance paid (382) (818) (78) (35)
Income taxes paid (6,137) (4,772) – –
Other taxes (paid)/refunded (3,083) (5,648) 361 (3)
Net cash provided by/(used in) operating activities 26(b) 14,512 32,403 (9,161) 8,891
Cash Flows from Investing Activities
Net payment for plant and equipment (1,968) (1,378) (746) (559)
Net payment for development expenditure (10,903) (9,973) – (61)
Net payment for exploration expenditure (32,751) (36,079) (697) (303)
Payment for development studies – (772) – (707)
Net payment for operated joint venture exploration expenditure – (1,334) – –
Amounts received from associate company – 13 – –
Payment for the acquisition of controlled entities – (1,630) – –
Payment for materials inventory – (1,413) – –
Proceeds from sale of assets 3,993 1,862 – –
Payment for security deposits on operating leases – (76) – (76)
Payment for listed and unlisted shares – (198) – (198)
Net cash used in investing activities (41,629) (50,978) (1,443) (1,904)
Cash Flows from Financing Activities
Proceeds from share issues 92,566 – 92,566 –
Share issue expenses (4,401) – (4,401) –
Bank loan repayments (19,617) (12,100) – –
Reimbursement of funds from entities 430 – 23,245 13,444
Provision of funds to entities (6,821) – (53,560) (43,288)
Net cash generated from/(used in) fi nancing activities 62,157 (12,100) 57,850 (29,844)
Net Increase/(Decrease) in Cash Held 35,040 (30,675) 47,246 (22,857)
Cash at beginning of fi nancial year 41,553 81,538 20,329 50,978
Effect of exchange rate changes on the balance of cash held in foreign currencies (558) (9,310) (949) (7,792)
Cash at End of Financial Year 26(a) 76,035 41,553 66,626 20,329
The accompanying notes form an integral part of these fi nancial statements.
ROC AR 2004_Financials.indd 42ROC AR 2004_Financials.indd 42 24/03/2005 18:11:36 pm24/03/2005 18:11:36 pm
43
Note 1. Statement of Accounting Policies
The principal accounting policies adopted by ROC and its controlled entities are stated below to assist in a general understanding of the Annual Financial Report. The fi nancial report is a general purpose fi nancial report which has been prepared in accordance with the Corporations Act 2001, relevant Australian Accounting Standards and Urgent Issues Group Consensus Views, and complies with other requirements of the law.
(a) Historical cost
Unless otherwise stated in the notes to the fi nancial statements, the fi nancial statements have been prepared in accordance with the historical cost convention and do not take into account changing money values.
(b) Consolidation
The consolidated fi nancial statements have been prepared by combining the fi nancial statements of all entities that comprise the consolidated entity, being ROC (‘parent entity’) and its controlled entities as defi ned by AASB1024 ‘Consolidated Accounts’. A list of controlled entities appears in Note 12. The consolidated fi nancial statements include the information and results of each controlled entity from the date on which the Company obtains control and until such time as the Company ceases to control such entity.
In preparing the consolidated fi nancial statements, all intercompany balances and transactions, and unrealised profi ts and losses arising within the consolidated entity are eliminated in full.
(c) Sales
Sales are recognised in the fi nancial period during which hydrocarbons are produced, provided they are either sold or delivered in the normal course of business in accordance with agreements with purchasers.
Sales revenue represents amounts invoiced, excluding goods and services tax (‘GST’) or value added taxes, in respect of sales to purchasers.
Sales revenue is stated net of the impact of oil and gas price hedge contracts entered into by the consolidated entity to reduce future oil and gas price exposure.
(d) Income tax
Income tax has been brought to account using the liability method of tax effect accounting. The income tax expense or credit shown in the Statement of Financial Performance is represented by the tax on accounting profi t or loss after allowing for permanent differences between accounting profi t or loss and taxable income or tax loss.
The tax effect of unrecouped exploration expenditure and timing differences, which occur when items are included or allowed for income tax purposes in a different fi nancial period than for accounting purposes, is retained in the deferred income tax liability and future income tax benefi t accounts calculated at the tax rates expected to be applied when the expenditure is recouped and/or the differences reverse.
Future income tax benefi ts relating to timing differences and tax losses are only brought to account where realisation of the benefi t can be regarded as being assured beyond reasonable doubt and, for tax losses, when their realisation is virtually certain.
ROC and its wholly-owned Australian subsidiaries have made the decision to implement the tax consolidation legislation effective as of 1 January 2004. The Australian Taxation Offi ce has not yet been notifi ed of this decision. It will be notifi ed prior to lodgement of the fi rst consolidated tax return for the year ended 31 December 2004.
As a consequence, ROC as the head entity in the tax consolidated group recognises current and deferred tax amounts relating to transactions, events and balances of the wholly-owned Australian subsidiaries in this group as if those were its own, in addition to the current and deferred tax amounts arising from its own transactions, events and balances.
Entry into the tax consolidation regime has had no material impact on the 2004 Annual Financial Report.
(e) Foreign currencies
Transactions denominated in foreign currencies have been brought to account at the exchange rates ruling at the time of the transactions. At balance date, foreign currency receivables and payables are converted to Australian currency at exchange rates ruling at balance date.
Exchange differences are brought to account in the Statement of Financial Performance in the fi nancial period in which they arise.
Financial statements of foreign self-sustaining controlled operations are translated into Australian currency using the current rate method, whereby assets and liabilities are translated at rates of exchange current at balance date. Profi t and loss accounts are translated at a weighted average rate of exchange. Exchange differences arising on translation are taken directly to the foreign currency translation reserve.
NOTES TO AND FORMING PART OF THE FINANCIAL STATEMENTS
ROC AR 2004_Financials.indd 43ROC AR 2004_Financials.indd 43 24/03/2005 18:11:36 pm24/03/2005 18:11:36 pm

44 ROC OIL COMPANY LIMITED AND ITS CONTROLLED ENTITIES
Note 1. Statement of Accounting Policies (continued)
(e) Foreign currencies (continued)
Financial statements of foreign integrated controlled entity operations are translated at balance date using the temporal method and resulting exchange differences are brought to account by entries made directly to the Statement of Financial Performance in the fi nancial period in which the exchange rate changes.
(f) Acquisitions
Where assets including oil and gas reserves are acquired from a third party, the cost of acquiring those assets (being the fair value) is included in the Statement of Financial Position as development expenditure, exploration expenditure, other assets and liabilities.
Assets acquired are recorded at the cost of acquisition, being the purchase consideration determined at the date of acquisition plus costs incidental to the acquisition.
In the event that settlement of all or part of the cash consideration given in the acquisition is deferred, the fair value of the purchase consideration is determined by discounting the amounts payable in the future to their present value at the date of acquisition.
(g) Exploration and development expenditure
The consolidated entity adopts the area of interest method whereby all exploration and evaluation expenditure is charged against the Statement of Financial Performance as incurred, except in the case of areas of interest where rights to tenure are current and where:
• the carrying amount is expected to be recouped through the successful development and exploitation of the area or by farming out or selling all or part of the consolidated entity’s interest; or
• at balance date, exploration and evaluation activities in, or in relation to, the area of interest have not reached a stage that permits a reasonable assessment of the existence or otherwise of economically recoverable reserves, and active and signifi cant exploration activity for the area is continuing.
In these cases, the expenditure is capitalised.
When an area of interest is abandoned or if the Directors consider the expenditure to be of reduced or no further value, capitalised exploration expenditure is written down or written off in the fi nancial period in which such a decision is made.
Proceeds on sale or farm-out of an area within an exploration area of interest are offset against the carrying value of the particular area involved. Where the total carrying value of an area has been recouped in this manner, the balance of farm-out proceeds is brought to account as non-operating activities revenue.
Where it is established that economically recoverable reserves exist in a particular area of interest, the carrying amount attributable to that area is classifi ed as a development and production interest. Where commercial production in an area of interest has commenced, the associated costs together with any forecast future capital expenditure necessary to develop proved and probable reserves are amortised over the estimated economic life of the fi eld in each area of interest, on a unit-of-production basis. Subject to the Directors’ satisfaction that economically recoverable reserves exist and where commercial production has not yet commenced, costs incurred in an area in relation to those reserves are accumulated and amortised when commercial operations begin.
Changes in factors such as estimates of proved and probable reserves that affect unit-of-production calculations do not give rise to prior fi nancial period adjustments and are dealt with on a prospective basis.
Costs of borrowing for major development projects are capitalised in accordance with AASB1036 ‘Borrowing Costs’ until the commencement of production and are then amortised over the life of the fi eld on a unit-of-production basis.
(h) Property, plant and equipment
Depreciation is provided on property, plant and equipment, including freehold buildings but excluding land. Plant and equipment is depreciated on a straight line basis so as to write down these assets to their estimated residual values over their estimated useful lives to the consolidated entity.
The following estimated useful lives are used in the calculation of depreciation:
• plant and equipment 2–10 years;
• leasehold improvements 2–10 years; and
• motor vehicles under fi nance leases 2–5 years.
Depreciation of onshore facilities is calculated using a unit-of-production basis, which will proportionately amortise the assets over the life of the reserves of the area of interest.
NOTES TO AND FORMING PART OF THE FINANCIAL STATEMENTS
ROC AR 2004_Financials.indd 44ROC AR 2004_Financials.indd 44 24/03/2005 18:11:36 pm24/03/2005 18:11:36 pm

45
Leases of plant and equipment, under which the consolidated entity assumes substantially all the risks and benefi ts of ownership, are classifi ed as fi nance leases. Finance leases are capitalised and depreciated over their estimated useful lives to the consolidated entity.
Operating leases are not capitalised. Payments made under operating leases are charged to the Statement of Financial Performance in equal instalments over the term of the lease.
(i) Oil and gas stock and materials inventory
Oil and gas stock is valued at the lower of cost and net realisable value. Cost comprises a relevant proportion of all fi xed and variable production, overhead, restoration and amortisation costs. Net realisable value is determined on the basis of selling prices less expenses to be incurred in transport, pipeline tariffs, handling and royalties, to the point in time where product passes to the purchaser.
Stocks of materials and spare parts are carried at the lower of cost and net realisable value, with cost primarily determined by the fi rst-in-fi rst-out method and the remainder utilising an average cost basis.
(j) Investments
Investments are carried at cost or, where the Directors believe the carrying amount of an investment is greater than its recoverable amount, then that investment is written down, via a provision, to its recoverable amount. Dividends and distributions are brought to account in the Statement of Financial Performance when declared by controlled entities.
(k) Recoverable amount of non-current assets
The Statement of Financial Position categories of development expenditure, exploration expenditure, receivables, other fi nancial assets, materials inventory, property, plant and equipment and deferred tax asset are each considered separate classes of non-current assets.
Exploration expenditure is capitalised and carried forward in accordance with AASB1022 ‘Accounting for the Extractive Industries’ as detailed in Note 1(g) above.
Deferred tax assets are carried forward in accordance with AASB1020 ‘Accounting for Income Tax (Tax-Effect Accounting)’ as detailed in Note 1(d) above.
In accordance with AASB1010 ‘Recoverable Amount of Non-Current Assets’, the carrying value of each asset in each of the non-current classes of assets, except for exploration expenditure, is reviewed by the Directors every six months to determine whether it is in excess of its recoverable amount. Where the carrying amount of a non-current asset exceeds its recoverable amount, the asset is written down to the lower amount. The net cash infl ows from the continued use and subsequent disposal of each such asset have been used in determining the recoverable amount of each non-current asset. The relevant cash fl ows have not been discounted to their present values.
(l) Employee benefi ts
Liability to employees for annual leave and long service leave is provided for when it is probable that settlement will be required and it is capable of being measured reliably. All employment-related on-costs (including payroll tax and superannuation contributions) are included in the calculation of the required provision. Provision for annual leave in respect of services provided by employees up to balance date expected to be settled within 12 months, is measured using remuneration levels expected to apply at the time of settlement.
Provision for long service leave which is not expected to be settled within 12 months is measured as the present value of the estimated future cash outfl ows to be made by the consolidated entity in respect of services provided by employees up to balance date.
Equity-based compensation arrangements are not recognised in the fi nancial statements.
(m) Provision for restoration
A provision for signifi cant abandonment and restoration is accumulated by charging to the Statement of Financial Performance the expected expenditure to be incurred on cessation of each area of interest. The provision is calculated so that at the end of operations the provision will be adequate to meet net abandonment and restoration costs, including the required removal of facilities, the abandonment of wells and the restoration of affected areas. Such provision recognises the estimated future abandonment and restoration obligations incrementally over the life of the proved and probable reserves on a unit-of-production basis. Estimates of the future restoration obligation are based on current legal requirements and technology and are determined in current dollars on an undiscounted basis. The adequacy of the provision for abandonment and restoration is reassessed every six months. Changes in cost estimates do not give rise to prior fi nancial period adjustments and are dealt with on a prospective basis.
(n) Joint ventures
Interests in joint venture operations have been reported in the fi nancial statements by including the consolidated entity’s share of assets employed in joint venture operations, the share of liabilities incurred in relation to joint venture operations and the share of any expenses incurred in relation to joint venture operations in their respective classifi cation categories.
ROC AR 2004_Financials.indd 45ROC AR 2004_Financials.indd 45 24/03/2005 18:11:36 pm24/03/2005 18:11:36 pm
46
NOTES TO AND FORMING PART OF THE FINANCIAL STATEMENTS
ROC OIL COMPANY LIMITED AND ITS CONTROLLED ENTITIES
Note 1. Statement of Accounting Policies (continued)
(o) Financial instruments included in assets
Trade receivables are initially recorded at the amount of contracted sale proceeds. All other receivables are recorded at amounts due. Receivables are recognised inclusive of applicable GST and value added taxes.
The net amount of GST and value added taxes recoverable from the relevant taxation authority is included as part of receivables.
Marketable securities are carried at the lower of cost and net realisable value.
(p) Financial instruments included in liabilities
Borrowings are recorded at their principal amount. Interest is charged as an expense as it accrues at the contracted rate.
Trade payables and other payables are recognised when the consolidated entity becomes obliged to make future payments resulting from the purchase of goods and services, whether or not invoiced. Payables are recognised inclusive of applicable GST and value added taxes.
The net amount of GST and value added taxes payable to the relevant taxation authority is included as part of payables.
(q) Financial instruments included in equity
Equity instruments are classifi ed as equity in accordance with the substance of the contractual arrangement.
Contributed equity is recorded at the value of consideration paid. The costs of issuing shares are offset against contributed equity.
(r) Statement of Cash Flows
Cash is defi ned as cash at bank and on hand and money market investments readily convertible to cash.
Cash fl ows are included in the Statement of Cash Flows on a gross basis.
Cash fl ows have been allocated among operating, investing and fi nancing activities. These categories appropriately classify the consolidated entity’s activities.
(s) Comparative amounts
Comparative amounts have been restated, where applicable, to ensure consistency with the current reporting period.
ROC AR 2004_Financials.indd 46ROC AR 2004_Financials.indd 46 24/03/2005 18:11:36 pm24/03/2005 18:11:36 pm

47
CONSOLIDATED COMPANY
2004$’000
2003$’000
2004$’000
2003$’000
Note 2. Revenue, Expenses and Losses by Function(Loss)/profi t from ordinary activities before income tax includes the following revenues and expenses whose disclosure is relevant in explaining the fi nancial performance:
(a) Revenue from ordinary activities
Revenue from operating activities
Sales revenue – Oil 813 710 – –
– NGLs 2,938 4,238 – –
– Gas 34,541 52,356 – –
38,292 57,304 – –
Other revenue 878 644 – –
Interest income: controlled entities – – 92 –
Interest income: other entities 2,883 1,887 2,414 849
Dividends from controlled entities – – – 13,885
Total revenue from operating activities 42,053 59,835 2,506 14,734
Revenue from non-operating activities
Revenue on sale of development assets held for sale – 261 – –
Revenue on sale of non-core offshore UK assets – 4,195 – –
Revenue on disposal of other non-current assets 95 1,601 – –
Total revenue from non-operating activities 95 6,057 – –
Total revenue from ordinary activities 42,148 65,892 2,506 14,734
(b) Expenses
Operating costs
Production costs 10,673 10,950 – –
Amortisation expense 10,206 15,028 – –
Restoration expense 240 343 – –
Total operating costs 21,119 26,321 – –
Depreciation of non-current assets
Plant and equipment 920 983 503 463
Leasehold improvements 158 51 158 51
Motor vehicles under fi nance lease 1 9 – –
Total depreciation of non-current assets 1,079 1,043 661 514
Exploration expenditure written off
China 459 – – –
Equatorial Guinea 10,592 – – –
United Kingdom 27,473 1,732 – –
Total exploration expenditure written off 38,524 1,732 – –
ROC AR 2004_Financials.indd 47ROC AR 2004_Financials.indd 47 24/03/2005 18:11:36 pm24/03/2005 18:11:36 pm
48
NOTES TO AND FORMING PART OF THE FINANCIAL STATEMENTS
ROC OIL COMPANY LIMITED AND ITS CONTROLLED ENTITIES
CONSOLIDATED COMPANY
2004$’000
2003$’000
2004$’000
2003$’000
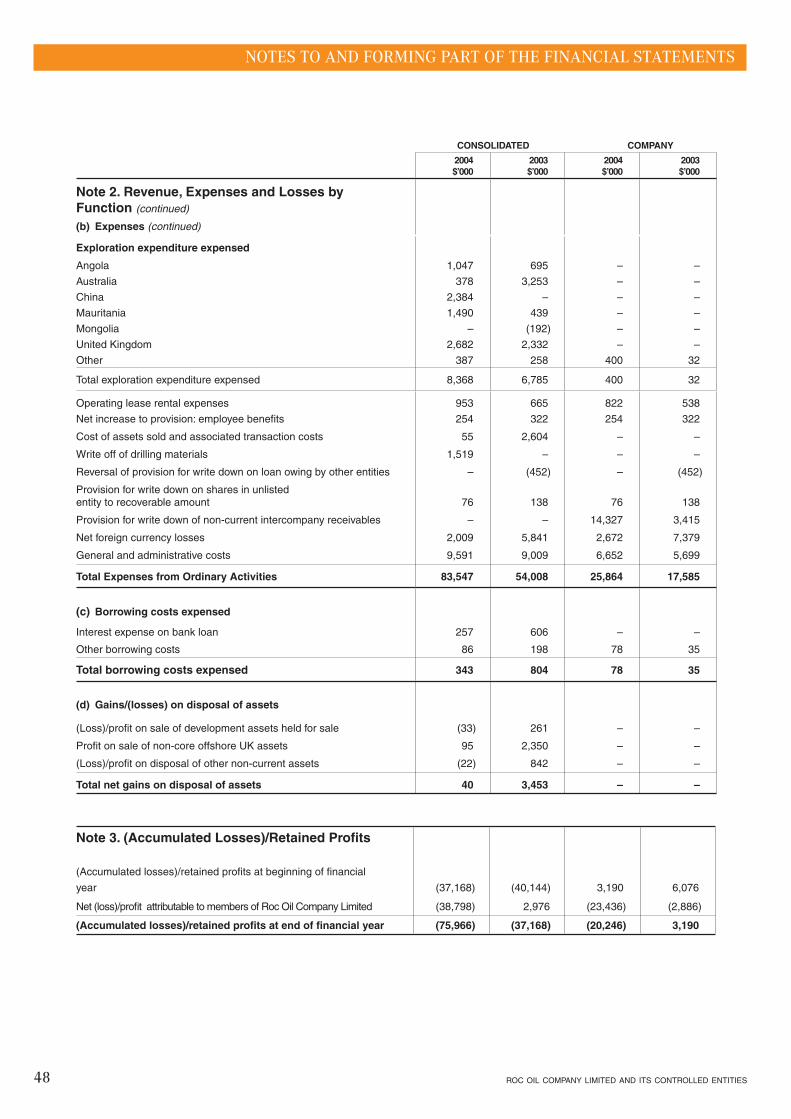
Note 2. Revenue, Expenses and Losses by Function (continued)
(b) Expenses (continued)
Exploration expenditure expensed
Angola 1,047 695 – –
Australia 378 3,253 – –
China 2,384 – – –
Mauritania 1,490 439 – –
Mongolia – (192) – –
United Kingdom 2,682 2,332 – –
Other 387 258 400 32
Total exploration expenditure expensed 8,368 6,785 400 32
Operating lease rental expenses 953 665 822 538
Net increase to provision: employee benefi ts 254 322 254 322
Cost of assets sold and associated transaction costs 55 2,604 – –
Write off of drilling materials 1,519 – – –
Reversal of provision for write down on loan owing by other entities – (452) – (452)
Provision for write down on shares in unlisted entity to recoverable amount 76 138 76 138
Provision for write down of non-current intercompany receivables – – 14,327 3,415
Net foreign currency losses 2,009 5,841 2,672 7,379
General and administrative costs 9,591 9,009 6,652 5,699
Total Expenses from Ordinary Activities 83,547 54,008 25,864 17,585
(c) Borrowing costs expensed
Interest expense on bank loan 257 606 – –
Other borrowing costs 86 198 78 35
Total borrowing costs expensed 343 804 78 35
(d) Gains/(losses) on disposal of assets
(Loss)/profi t on sale of development assets held for sale (33) 261 – –
Profi t on sale of non-core offshore UK assets 95 2,350 – –
(Loss)/profi t on disposal of other non-current assets (22) 842 – –
Total net gains on disposal of assets 40 3,453 – –
Note 3. (Accumulated Losses)/Retained Profi ts
(Accumulated losses)/retained profi ts at beginning of fi nancial
year (37,168) (40,144) 3,190 6,076
Net (loss)/profi t attributable to members of Roc Oil Company Limited (38,798) 2,976 (23,436) (2,886)
(Accumulated losses)/retained profi ts at end of fi nancial year (75,966) (37,168) (20,246) 3,190
ROC AR 2004_Financials.indd 48ROC AR 2004_Financials.indd 48 24/03/2005 18:11:37 pm24/03/2005 18:11:37 pm

49
CONSOLIDATED COMPANY
2004$’000
2003$’000
2004$’000
2003$’000
Note 4. Income Tax Benefi t/(Expense)The prima facie income tax (benefi t)/expense on pre-tax accounting (loss)/profi t reconciles to income tax (benefi t)/expense in the fi nancial statements as follows:
(Loss)/profi t from ordinary activities (41,742) 11,080 (23,436) (2,886)
Prima facie income tax (benefi t)/expense calculated as 30% of (loss)/profi t from ordinary activities (12,523) 3,324 (7,031) (866)
Tax effect of permanent and other differences
Non-deductible expenses (276) 121 60 120
Non-deductible amortisation 329 565 – –
Non-deductible exploration write off 3,095 – – –
Overseas tax rate differential (630) 2,618 – –
Dividend income not assessable – – – (4,165)
Provision for capital gains tax no longer required – (3,617) – –
Capital gains tax on sale of UK North Sea assets – 2,316 – –
Provision for income tax no longer required (209) (239) – –
Provision for deferred income tax no longer required – (1,304) – –
Other (95) 66 – –
Timing differences and tax losses not brought to account as a future income tax benefi t (refer note (a)) 7,365 4,254 6,971 4,911
Income tax (benefi t)/expense relating to ordinary activities (2,944) 8,104 – –
Income tax (benefi t)/expense attributable to profi t/(loss) from ordinary activities is made up of:
Provision for income tax – current period 2,519 9,404 – –
Provision for income tax – prior period 112 (2,762) – –
Deferred income tax liability – current period (5,575) 1,462 – –
Income tax (benefi t)/expense relating to ordinary activities (2,944) 8,104 – –
Future income tax losses not taken to account 28,709 23,453 18,125 14,419
Note:
(a) The taxation benefi t not brought to account will only be obtained if:
• assessable income is derived of a nature and of amount suffi cient to enable the benefi t from the deductions to be realised;
• conditions for deductibility imposed by tax legislation are complied with; and
• no changes in tax legislation adversely affect the realisation of the benefi t from the deductions.
Tax consolidation
Effective 1 January 2004, for the purposes of income taxation, ROC and its 100% owned Australian subsidiaries formed a tax consolidated group. As a consequence, ROC, as the head entity in the tax consolidated group, recognises current and deferred tax amounts relating to transactions, events and balances of the wholly-owned Australian subsidiaries in the group as if those were its own in addition to the current and deferred tax amounts arising from its own transactions, events and balances. As a consequence, members of the Australian group intend to enter into tax sharing and tax funding arrangements in order to allocate income tax expense to the wholly-owned subsidiaries on a pro rata basis. In addition, the agreement will provide for the allocation of income tax liabilities between the entities should the head entity default on its tax payment obligation.
Entry into the tax consolidation regime has had no material impact on the 2004 Annual Financial Report.
ROC will formally notify the Australian Taxation Offi ce of its adoption of the tax consolidation regime before lodging its 31 December 2004 consolidated tax return.
ROC AR 2004_Financials.indd 49ROC AR 2004_Financials.indd 49 24/03/2005 18:11:37 pm24/03/2005 18:11:37 pm

50
NOTES TO AND FORMING PART OF THE FINANCIAL STATEMENTS
ROC OIL COMPANY LIMITED AND ITS CONTROLLED ENTITIES
CONSOLIDATED COMPANY
2004$’000
2003$’000
2004$’000
2003$’000
Note 5. Inventories(a) Current
Materials inventory, at cost 826 1,903 – –
Oil and gas stock, at cost 164 122 – –
990 2,025 – –
(b) Non-current
Materials inventory, at cost 43 78 – –
43 78 – –
Note 6. Current ReceivablesTrade receivables 5,656 7,719 1,685 139
Amount owing by controlled entities – – 6,971 1,573
Security deposits 147 208 147 208
Interest receivables 169 76 169 2
Employee advances 27 45 27 45
Prepayments 1,168 2,019 665 126
Other receivables (refer note (a)) 9,158 5,382 1,145 810
16,325 15,449 10,809 2,903
Note:
(a) Other receivables include an amount of $6,707,000 (2003: Nil) being a secured loan to Acorn Oil & Gas Limited and Acorn North Sea Ltd, which is secured on the shares and assets of the companies, including the Ardmore Field.
Note 7. Other Financial AssetsGovernment bonds, at cost 14 14 – –
14 14 – –
ROC AR 2004_Financials.indd 50ROC AR 2004_Financials.indd 50 24/03/2005 18:11:37 pm24/03/2005 18:11:37 pm

51
CONSOLIDATED COMPANY
2004$’000
2003$’000
2004$’000
2003$’000
Note 8. Development ExpenditureAreas in which production has commenced
Balance at beginning of fi nancial year 114,401 113,801 – –
Expenditure incurred 915 12,144 – –
Net foreign exchange gains/(losses) arising on translation of foreign self-sustaining controlled operations 2,640 (11,544) – –
117,956 114,401 – –
Accumulated amortisation (63,278) (53,074) – –
54,678 61,327 – –
Areas in development stage
Balance at beginning of fi nancial year 7,245 11,721 – –
Expenditure incurred 7,159 11 – –
Transfer from exploration expenditure (refer to Note 9) 7,967 – – –
Disposals – (2,716) – –
Net foreign exchange gains/(losses) arising on translation of foreign self-sustaining controlled operations 305 (1,771) – –
22,676 7,245 – –
Balance at end of fi nancial year 77,354 68,572 – –
Note 9. Exploration Expenditure
Deferred expenditure in exploration and evaluation stages
Balance at beginning of fi nancial year 114,839 83,513 – –
Acquisitions – 17,813 – –
Disposals – (106) – –
Expenditure incurred 31,212 21,702 – –
Transfer to Development Expenditure (refer to Note 8) (7,967) – – –
Expenditure written off (38,524) (1,732) – –
Net foreign exchange gains/(losses) arising on translation of foreign self-sustaining controlled operations 2,191 (6,351) – –
Balance at end of fi nancial year 101,751 114,839 – –
Note 10. Non-Current ReceivablesAmount owing by controlled entities – – 151,804 127,350
Provision for write down to recoverable amount – – (59,676) (45,348)
– – 92,128 82,002
Other receivable 15 91 – –
15 91 92,128 82,002
ROC AR 2004_Financials.indd 51ROC AR 2004_Financials.indd 51 24/03/2005 18:11:37 pm24/03/2005 18:11:37 pm

52
NOTES TO AND FORMING PART OF THE FINANCIAL STATEMENTS
ROC OIL COMPANY LIMITED AND ITS CONTROLLED ENTITIES
CONSOLIDATED COMPANY
2004$’000
2003$’000
2004$’000
2003$’000
Note 11. Other Non-Current Financial AssetsShares in unlisted controlled entities, at cost – – 102,892 102,892
Shares in an unlisted entity, at cost (refer note (a)) 321 333 321 333
Provision for write down on shares in unlisted entity to recoverable amount (293) (230) (293) (230)
28 103 102,920 102,995
Note:
(a) Shares held in Osprey Oil and Gas Limited represent 13% of the issued share capital of that company. Dr R J P Doran is a non-executive director of Osprey Oil and Gas Limited.
Note 12. Controlled Entities
Name of EntityCountry of
Incorporation
Ownership and Voting Interest
2004%
Ownership and Voting Interest
2003%
Parent entityRoc Oil Company Limited Australia 100 100
Controlled entitiesRoc Oil (Gobi) Pty Limited Australia 100 100
Roc Oil (WA) Pty Limited Australia 100 100
Roc Oil (China) Pty Limited Australia 100 100
Roc Oil (New Zealand) Pty Limited(1) Australia 100 100
Roc Oil Australia Holdings Pty Limited Australia 100 100
Roc Oil International Holdings Pty Limited Australia 100 100
Elixir Corporation Pty Ltd Australia 100 100
Roc Oil (Finance) Pty Limited(2) Australia 100 –
Roc Oil Holdings (Cayman Islands) Company Cayman Islands 100 100
Roc Oil (China) Company Cayman Islands 100 100
Roc Oil (Cabinda) Company Cayman Islands 100 100
Roc Oil (Mauritania) Company Cayman Islands 100 100
Roc Oil (Casamance) Company Cayman Islands 100 100
Roc Oil (Equatorial Guinea) Company Cayman Islands 100 100
Roc Oil (Angola) Limited Cayman Islands 100 100
Lacula Oil Company Limited Cayman Islands 100 100
Roc Oil (Maboque) Company(2) Cayman Islands 100 –
Roc Oil (Falklands) Limited United Kingdom 100 100
Roc Oil (Europe) Limited United Kingdom 100 100
Roc Oil GB Holdings Limited(2) United Kingdom 100 –
Roc Oil (GB) Limited(3) United Kingdom 100 100
Roc Oil (UK) LImited United Kingdom 100 100
Roc Oil (CEL) Limited United Kingdom 100 100
Roc Oil (EMOG) Limited(4) United Kingdom 100 100
Roc Oil (BEL) Limited(4) United Kingdom 100 100
Roc Canada Inc Canada 100 100
Roc Oil (Chinguetti) BV(2) Netherlands 100 –
Notes:
(1) Roc Oil (Middle East) Limited changed its name to Roc Oil (New Zealand) Pty Limited during the fi nancial year.(2) Controlled entity incorporated during the fi nancial year.(3) Roc Oil (PPL) Limited changed its name to Roc Oil (GB) Limited during the fi nancial year.
(4) In liquidation.
The Company’s present intention is to provide the necessary fi nancial support for Roc Oil (Gobi) Pty Limited, Roc Oil (WA) Pty Limited, Roc Oil (China) Pty Limited, Roc Oil (New Zealand) Pty Limited, Roc Oil Australia Holdings Pty Limited, Roc Oil International Holdings Pty Limited, Elixir Corporation Pty Ltd and Roc Oil (Finance) Pty Limited, whilst they remain controlled entities, as is necessary for each company to pay all debts as and when they become due and to pay all debts incurred in the foreseeable future.
The Company has provided a number of parent company guarantees for the obligations of Roc Oil (Europe) Limited, Roc Oil (Mauritania) Company, Roc Oil (Chinguetti) BV and Roc Oil (Falklands) Limited arising under respective contractual arrangements with third parties.
ROC AR 2004_Financials.indd 52ROC AR 2004_Financials.indd 52 24/03/2005 18:11:38 pm24/03/2005 18:11:38 pm

53
CONSOLIDATED
Plant andEquipment
$’000
Plant andEquipment
underFinance Lease
$’000
LeaseholdImprovements
$’000Total$’000
Note 13. Property, Plant and EquipmentGross carrying amount
Balance as at 1 January 2004 5,772 42 332 6,146
Additions 1,985 – 1,247 3,232
Disposals (44) (43) – (87)
Net foreign exchange losses arising on translation of foreign self-sustaining controlled operations 80 1 – 81
Balance as at 31 December 2004 7,793 – 1,579 9,372
Accumulated depreciation
Balance as at 1 January 2004 (3,586) (36) (326) (3,948)
Depreciation expense (920) (1) (158) (1,079)
Disposals 43 38 – 81
Net foreign exchange gains arising on translation of foreign self-sustaining controlled operations (59) (1) – (60)
Balance as at 31 December 2004 (4,522) – (484) (5,006)
Net book value
As at 31 December 2004 3,271 – 1,095 4,366
As at 31 December 2003 2,186 6 6 2,198
COMPANY
Plant andEquipment
$’000
LeaseholdImprovements
$’000Total$’000
Gross carrying amount
Balance as at 1 January 2004 2,838 332 3,170
Additions 763 1,247 2,010
Balance as at 31 December 2004 3,601 1,579 5,180
Accumulated depreciation
Balance as at 1 January 2004 (2,033) (326) (2,359)
Depreciation expense (503) (158) (661)
Balance as at 31 December 2004 (2,536) (484) (3,020)
Net book value
As at 31 December 2004 1,065 1,095 2,160
As at 31 December 2003 805 6 811
ROC AR 2004_Financials.indd 53ROC AR 2004_Financials.indd 53 24/03/2005 18:11:38 pm24/03/2005 18:11:38 pm

54
NOTES TO AND FORMING PART OF THE FINANCIAL STATEMENTS
ROC OIL COMPANY LIMITED AND ITS CONTROLLED ENTITIES
CONSOLIDATED COMPANY
2004$’000
2003$’000
2004$’000
2003$’000
Note 14. Current PayablesTrade payables 3,884 4,129 813 129
Accrued liabilities 15,599 6,733 310 395
Amount owing to third party – 5,062 – –
Amount owing to associate company 1,246 2,024 – –
Amount owing to controlled entities – – 42 1,245
20,729 17,948 1,165 1,769
Note 15. Interest Bearing Liabilities(a) Current
Bank loan – 18,094 – –
Operating lease – lease incentive 180 – 180 –
180 18,094 180 –
(b) Non-current
Operating lease – lease incentive 932 – 932 –
932 – 932 –
Note 16. Current Tax LiabilitiesIncome tax payable 5,228 8,558 – –
5,228 8,558 – –
Note 17. Current ProvisionsOffi ce restoration 112 – 112 –
Employee benefi ts 813 637 813 637
925 637 925 637
Note 18. Deferred Tax LiabilitiesDeferred income tax 17,873 22,143 – –
17,873 22,143 – –
Note 19. Non-Current ProvisionsEmployee benefi ts 330 252 330 252
Restoration 3,934 3,548 – –
4,264 3,800 330 252
ROC AR 2004_Financials.indd 54ROC AR 2004_Financials.indd 54 24/03/2005 18:11:38 pm24/03/2005 18:11:38 pm

55
CONSOLIDATED COMPANY
Employee Benefi ts Restoration
Employee Benefi ts Restoration
Note 20. ProvisionsBalance at 1 January 2004 889 3,548 889 –
Additional provisions recognised 630 352 630 112
Reductions from payments/other sacrifi ces of future economic benefi ts (376) – (376) –
Net foreign exchange gains arising on translation of foreign self-sustaining controlled operations – 145 – –
Balance at 31 December 2004 1,143 4,045 1,143 112
Current (Note 17) 813 112 813 112
Non-current (Note 19) 330 3,934 330 –
1,143 4,046 1,143 112
CONSOLIDATED COMPANY
2004$’000
2003$’000
2004$’000
2003$’000
Note 21. Contributed Equity
176,038,703 (2003: 109,889,439) fully paid ordinary shares 291,357 203,192 291,357 203,192
2004Number of Shares
2003Number of Shares
2004$’000
2003$’000
Movement in fully paid ordinary shares
Balance at beginning of fi nancial year 109,889,439 108,526,056 203,192 201,234
Shares issued 66,149,264 1,363,383 88,165 1,958
Balance at end of fi nancial year 176,038,703 109,889,439 291,357 203,192
All issued fully paid ordinary shares carry one vote per share and carry the right to dividends.
The market price of the Company’s fully paid ordinary shares as at 31 December 2004 was $1.81 (2003: $1.53).
(a) Shares issued during the fi nancial year
During the fi nancial year, the Company issued 66,149,264 (2003: 1,363,383) fully paid ordinary shares.
(b) Employee Share Option Plan and Executive Share Option Plan
During the fi nancial year, options to purchase ordinary shares under the Employee Share Option Plan were issued to employees, exercised or expired as follows:
ROC AR 2004_Financials.indd 55ROC AR 2004_Financials.indd 55 24/03/2005 18:11:38 pm24/03/2005 18:11:38 pm

56
NOTES TO AND FORMING PART OF THE FINANCIAL STATEMENTS
ROC OIL COMPANY LIMITED AND ITS CONTROLLED ENTITIES
Note 21. Contributed Equity (continued)
(b) Employee Share Option Plan and Executive Share Option Plan (continued)
Grant Date Expiry Date
ExercisePrice
$
Number of options at
beginning of fi nancial year
Number of options
issued during fi nancial year
Number of options exercised
Number of options cancelled or expired
during fi nancial year
Number of options
at end of fi nancial year
19 April 1999 15 January 2004 3.33 16,740 – – (16,740) –
19 April 1999 15 January 2004 3.48 5,320 – – (5,320) –
19 April 1999 29 July 2004 3.32 82,850 – – (82,850) –
30 July 1999 15 July 2004 1.84 60,000 – – (60,000) –
30 July 1999 19 July 2004 1.84 905,000 – – (905,000) –
1 March 2000 1 March 2005 1.00 50,000 – – – 50,000
1 June 2000 1 June 2005 1.18 30,000 – – – 30,000
1 September 2000 1 September 2005 1.31 100,000 – – – 100,000
10 January 2001 10 January 2006 1.09 1,179,000 – (103,000) – 1,076,000
26 July 2001 26 July 2006 1.49 35,000 – – – 35,000
17 December 2001 17 December 2006 1.10 184,000 – (21,000) – 163,000
29 May 2002 29 May 2007 1.29 90,000 – (10,000) – 80,000
29 July 2002 29 July 2007 1.23 340,200 – (58,200) (10,500) 271,500
4 September 2002 4 September 2007 1.25 255,000 – – – 255,000
23 October 2002 23 October 2007 1.25 30,000 – – – 30,000
4 December 2002 4 December 2007 1.27 30,000 – – – 30,000
24 December 2002 24 December 2007 1.26 129,100 – – (16,800) 112,300
29 January 2003 29 January 2008 1.35 30,500 – – – 30,500
5 August 2004 5 August 2009 1.70 – 194,000 – – 194,000
3,552,710 194,000 (192,200) (1,097,210) 2,457,300
After the Rights Issue the option exercise prices for options granted under the Employee Share Option Plan were adjusted in accordance with the rules of the Employee Share Option Plan and the ASX Listing Rules.
Options may be exercised two years after the date the option was granted. If there is a change of control of the Company, all unexercised options will become immediately exercisable. During the fi nancial year 192,200 options were exercised (2003: Nil).
During the fi nancial year, 3,183,000 options to purchase ordinary shares under the Executive Share Option Plan were issued to employees as follows:
Grant Date Expiry Date Type of optionExercise price
$
Number of options issued in current
fi nancial year
Number of options at end of fi nancial
year
23 July 2004 23 July 2010 Price 1.81 52,800 52,800
23 July 2004 23 July 2010 Price 1.92 52,800 52,800
23 July 2004 23 July 2010 Price 2.04 70,400 70,400
23 July 2004 23 July 2010 Performance 1.57 176,000 176,000
5 August 2004 5 August 2010 Price 1.82 424,650 424,650
5 August 2004 5 August 2010 Price 1.94 424,650 424,650
5 August 2004 5 August 2010 Price 2.06 566,200 566,200
5 August 2004 5 August 2010 Performance 1.59 1,415,500 1,415,500
3,183,000 3,183,000
ROC AR 2004_Financials.indd 56ROC AR 2004_Financials.indd 56 24/03/2005 18:11:39 pm24/03/2005 18:11:39 pm

57
Under the rules of the Executive Share Option Plan 30% of the options granted vest after two years. An additional 30% vest after three years and the remaining 40% vest after four years. Options expire six years after they are granted. Of the options granted to an employee, 50% are performance options and are only exercisable if certain share performance benchmarks are met and 50% are price options.
The exercise price of performance options is calculated as the weighted average price for sale of shares on the ASX in the 90 days before the grant date. The exercise price for price options is calculated as 115%, 122.5% and 130% of this price respectively over their vesting period.
Options carry no voting rights or rights to dividends.
The total options offered under the Employee Share Option Plan and the Executive Share Option Plan shall not exceed 5% of the Company’s issued share capital at any time. As at 31 December 2004, there was a total of 5,640,300 options on issue, comprising 2,457,300 options under the Employee Share Option Plan and 3,183,000 options under the Executive Share Option Plan. At 31 December 2004, options issued and exercised represented 3.3% of the issued fully paid shares of the Company.
No remuneration expense is recognised in respect of employee options issued under the Employee Share Option Plan or the Executive Share Option Plan.
(c) Shareholder Options
During the fi nancial year 7,698,830 shareholder options pursuant to the Prospectus dated 21 June 1999 expired. At the end of the fi nancial year there were no shareholder options on issue.
CONSOLIDATED COMPANY
2004$’000
2003$’000
2004$’000
2003$’000
Note 22. Reserves
Foreign currency translation
Balance at beginning of fi nancial year 7,631 20,806 – –
Translation of foreign self-sustaining controlled operations 3,768 (13,175) – –
Balance at end of fi nancial year 11,399 7,631 – –
Note:
(a) Exchange differences relating to the translation of foreign self-sustaining controlled operations are brought to account by entries made directly to the foreign currency translation reserve, as described in Note 1(e).
CONSOLIDATED
2004 2003
Note 23. Earnings Per ShareBasic earnings per share (cents per share) (23.8) 2.7
Diluted earnings per share (cents per share) (23.8) 2.7
Weighted average number of ordinary shares used in the calculation of basic earnings per share 162,812,727 108,787,527
Weighted average number of ordinary shares used in the calculation of diluted earnings per share (refer note (a)) 162,812,727 108,883,825
Notes:
(a) Earnings used for calculation of both basic and diluted earnings per share was net (loss)/profi t after income tax for both 2004 and 2003 respectively.
At 31 December 2004, no options have a dilutive effect on the calculation of earnings per share as the consolidated entity had a net loss after income tax.
On 27 January 2005, ROC completed the placement of 9,900,990 shares. These may have a dilutive effect in subsequent periods.
ROC AR 2004_Financials.indd 57ROC AR 2004_Financials.indd 57 24/03/2005 18:11:39 pm24/03/2005 18:11:39 pm

58
NOTES TO AND FORMING PART OF THE FINANCIAL STATEMENTS
ROC OIL COMPANY LIMITED AND ITS CONTROLLED ENTITIES
Note 24. Segment Information
Primary reporting – geographical segments
The consolidated entity’s risks and returns are affected predominantly by differences in the geographical areas in which it operates; therefore, geographical segments is considered its primary reporting format.
Secondary reporting – business segments
The consolidated entity operates predominantly in one business, namely exploration, development and production of hydrocarbons.
Segment accounting policies
Segment accounting policies are the same as the consolidated entity’s policies.
Composition of each geographical segment
Asia/other mainly comprises area of interest in China.
West Africa comprises areas of interest in Equatorial Guinea, Mauritania and Angola.
For the year ended31 December 2004
United Kingdom
$’000
Australia/New Zealand
$’000Asia/Other
$’000West Africa
$’000Unallocated
$’000Total$’000
Segment revenue
Sales revenue 38,208 84 – – – 38,292
Other revenue 973 – – – 2,883 3,856
Total revenue 39,181 84 – – 2,883 42,148
Segment result
Loss from ordinary activities before income tax (13,123) (536) (3,133) (13,334) (11,616) (41,742)
Income tax benefi t – – – – 2,944 2,944
Net loss (13,123) (536) (3,133) (13,334) (8,672) (38,798)
As at 31 December 2004
Segment assets/liabilities
Segment assets 93,137 28,539 10,477 65,121 79,647 276,921
Segment liabilities (8,244) (2,236) (44) (11,784) (27,823) (50,131)
Other segment information
Expenditure incurred on non-current assets 8,540 7,366 2,913 21,590 2,109 42,518
Depreciation (218) – – – (861) (1,079)
Amortisation (10,206) – – – – (10,206)
Exploration expenditure written off (27,473) (459) – (10,592) – (38,524)
Exploration expensed (2,682) (378) (2,771) (2,537) – (8,368)
ROC AR 2004_Financials.indd 58ROC AR 2004_Financials.indd 58 24/03/2005 18:11:39 pm24/03/2005 18:11:39 pm

59
For the year ended 31 December 2003
United Kingdom
$’000
Australia/New Zealand
$’000Asia/Other
$’000West Africa
$’000Unallocated
$’000Total$’000
Segment revenue:
Sales revenue 57,287 17 – – – 57,304
Other revenue 4,496 512 1,662 31 1,887 8,588
Total revenue 61,783 529 1,662 31 1,887 65,892
Segment result
Profi t/(Loss) from ordinary activities before income tax 29,390 (3,248) 855 (1,212) (14,705) 11,080
Income tax expense – – – – (8,104) (8,104)
Net profi t/(loss) 29,390 (3,248) 855 (1,212) (22,809) 2,976
As at 31 December 2003
Segment assets/liabilities
Segment assets 111,851 29,537 8,738 50,517 44,279 244,922
Segment liabilities (11,931) (2,994) (128) (7,419) (48,795) (71,267)
Other segment information
Expenditure incurred on non-current assets 14,125 20,115 1,958 15,474 1,395 53,067
Depreciation – – – – (1,043) (1,043)
Amortisation (15,028) – – – – (15,028)
Exploration expenditure written off (1,732) – – – – (1,732)
Exploration expensed (2,332) (3,253) 192 (1,392) – (6,785)
ROC AR 2004_Financials.indd 59ROC AR 2004_Financials.indd 59 24/03/2005 18:11:39 pm24/03/2005 18:11:39 pm

60
NOTES TO AND FORMING PART OF THE FINANCIAL STATEMENTS
ROC OIL COMPANY LIMITED AND ITS CONTROLLED ENTITIES
Note 25. Related Party Disclosures
(a) Controlled entities
Interests in controlled entities are disclosed in Note 12.
Transactions with controlled entities and related entities:
(i) Overseas controlled entity transactions
Loans transacted by the Company with overseas controlled entities in the consolidated entity are on a commercial basis and are eliminated on consolidation. Loans are unsecured. Interest revenue brought to account by the Company in relation to these loans during the fi nancial year is disclosed in Note 2.
During the fi nancial year and the prior fi nancial year, the Company provided accounting and technical services, at cost plus an appropriate mark-up, to the United Kingdom controlled entities.
During the fi nancial year and the prior fi nancial year, Roc Oil (Europe) Limited provided commercial services to the Company, at cost plus an appropriate mark-up.
The amount receivable from overseas controlled entities is set out in Note 6 and Note 10. These transactions are eliminated on consolidation.
(ii) Australian controlled entity transactions
During the fi nancial year, the Company provided accounting and administration services, at no cost, to other entities in the wholly-owned Australian group.
Other transactions that occurred during the fi nancial year between entities in the wholly-owned Australian group were advancement of intercompany loans at Nil interest rate and no fi xed term for repayment. Loans are unsecured. These transactions are eliminated on consolidation. The amount receivable from controlled entities is set out in Note 10.
(b) Other related parties
Amounts receivable from, payable to and ordinary shares held in related companies are set out in Note 6, Note 14 and Note 29 respectively.
Interests in joint ventures are set out in Note 28.
(c) Remuneration and shareholdings
Directors’ and specifi ed executives’ remuneration and shareholdings are disclosed in Note 32.
ROC AR 2004_Financials.indd 60ROC AR 2004_Financials.indd 60 24/03/2005 18:11:39 pm24/03/2005 18:11:39 pm

61
CONSOLIDATED COMPANY
2004$’000
2003$’000
2004$’000
2003$’000
Note 26. Notes to the Statement of Cash Flows
(a) Reconciliation of cash
Cash at the end of the fi nancial year as shown in the Statement of Cash Flows is reconciled to the related items in the Statement of Financial Position as follows:
Cash 21,529 6,360 18,304 2,946
Short term deposits 54,506 35,193 48,322 17,383
Cash assets 76,035 41,553 66,626 20,329
(b) Reconciliation of net (loss)/profi t after income tax to net
cash fl ows provided by/(used in) operating activities
Net (loss)/profi t after income tax (38,798) 2,976 (23,436) (2,886)
Add/(less) non-cash items
Amortisation expense 10,206 15,028 – –
Depreciation of non-current assets 1,079 1,043 661 514
Provision for write down of non-current intercompany receivables – – 14,327 3,415
Provision for restoration 240 343 – –
Provision for offi ce restoration 112 – 112 –
Provision for employee benefi ts 254 322 254 322
Provision for write down of shares in unlisted entity to recoverable amount 76 138 76 138
Reversal of provision for write down on loan owing by other entities – (452) – (452)
Net foreign currency losses/(gains) 2,009 (2,135) 883 7,889
Write off of drilling materials 1,519 – – –
Decrease/(increase) in net deferred income tax liability (5,575) 1,462 – –
Net gains on disposal of assets (40) (3,453) – –
Items classifi ed as investing/fi nancing activities
Exploration expenditure expensed 8,368 6,785 400 32
Exploration expenditure written off 38,524 1,732 – –
Development studies expensed – 747 – 746
Changes in net assets and liabilities
(Increase)/decrease in assets:
Current receivables (3,792) 971 (2,658) (819)
Other current assets – 933 – 4
Non-current receivables/materials inventory (619) 3 – –
Increase/(decrease) in liabilities:
Current trade payables/accrued liabilities 4,605 4,095 371 (12)
Current provisions (3,656) 1,865 (151) –
Net cash provided by/(used in) operating activities 14,512 32,403 (9,161) 8,891
Note:
Included in cash assets is $3,322,000 which is subject to a charge in favour of Woodside Mauritania Pty Ltd relating to the contract for Chinguetti Floating Production Storage and Offtake Facility.
ROC AR 2004_Financials.indd 61ROC AR 2004_Financials.indd 61 24/03/2005 18:11:40 pm24/03/2005 18:11:40 pm

62
NOTES TO AND FORMING PART OF THE FINANCIAL STATEMENTS
ROC OIL COMPANY LIMITED AND ITS CONTROLLED ENTITIES
CONSOLIDATED COMPANY
2004$’000
2003$’000
2004$’000
2003$’000
Note 27. Commitments for Expenditure(a) Capital commitments
Not longer than one year
Joint ventures 41,927 8,295 – –
Other 4,618 2,694 – –
Longer than one year but not longer than fi ve years
Joint ventures 6,181 2,125 – –
Other – 11,327 – 300
52,726 24,441 – 300
(b) Operating lease rental commitments
Not longer than one year 1,110 1,030 906 787
Longer than one year but not longer than fi ve years 4,424 4,049 3,951 3,255
Longer than fi ve years 1,514 2,337 1,076 1,886
7,048 7,416 5,933 5,928
ROC AR 2004_Financials.indd 62ROC AR 2004_Financials.indd 62 24/03/2005 18:11:40 pm24/03/2005 18:11:40 pm
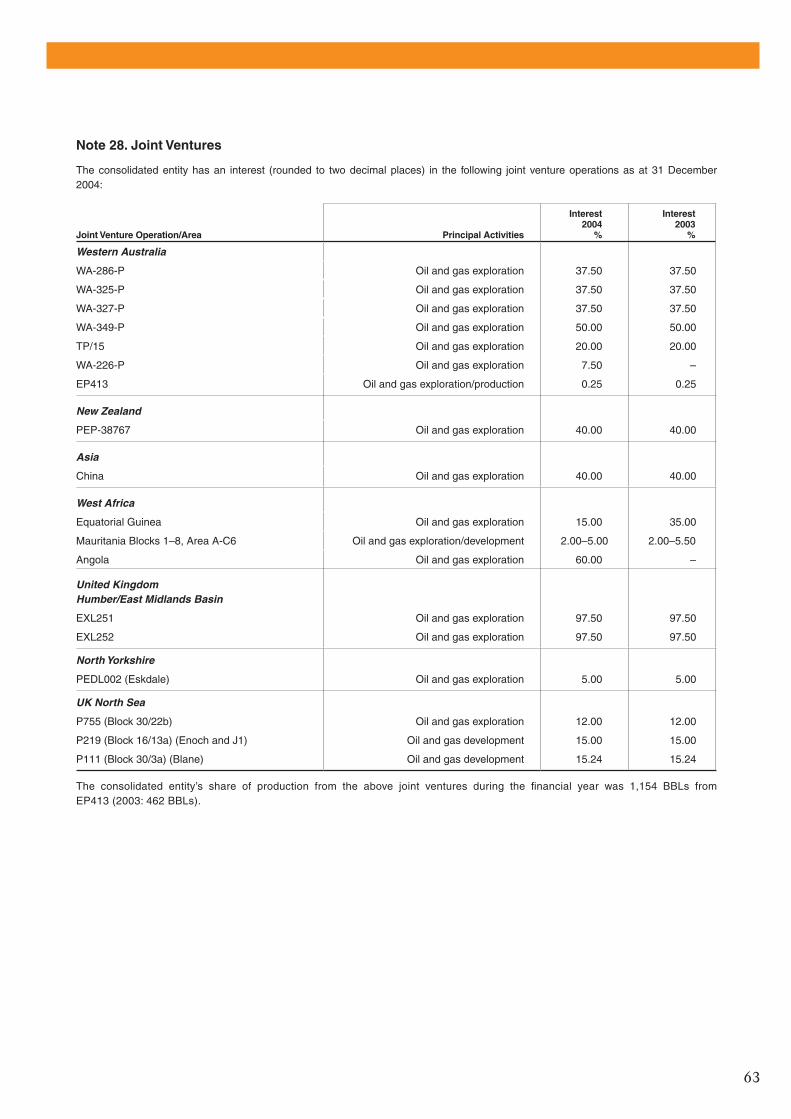
63
Note 28. Joint Ventures
The consolidated entity has an interest (rounded to two decimal places) in the following joint venture operations as at 31 December 2004:
Joint Venture Operation/Area Principal Activities
Interest2004
%
Interest2003
%
Western Australia
WA-286-P Oil and gas exploration 37.50 37.50
WA-325-P Oil and gas exploration 37.50 37.50
WA-327-P Oil and gas exploration 37.50 37.50
WA-349-P Oil and gas exploration 50.00 50.00
TP/15 Oil and gas exploration 20.00 20.00
WA-226-P Oil and gas exploration 7.50 –
EP413 Oil and gas exploration/production 0.25 0.25
New Zealand
PEP-38767 Oil and gas exploration 40.00 40.00
Asia
China Oil and gas exploration 40.00 40.00
West Africa
Equatorial Guinea Oil and gas exploration 15.00 35.00
Mauritania Blocks 1–8, Area A-C6 Oil and gas exploration/development 2.00–5.00 2.00–5.50
Angola Oil and gas exploration 60.00 –
United KingdomHumber/East Midlands Basin
EXL251 Oil and gas exploration 97.50 97.50
EXL252 Oil and gas exploration 97.50 97.50
North Yorkshire
PEDL002 (Eskdale) Oil and gas exploration 5.00 5.00
UK North Sea
P755 (Block 30/22b) Oil and gas exploration 12.00 12.00
P219 (Block 16/13a) (Enoch and J1) Oil and gas development 15.00 15.00
P111 (Block 30/3a) (Blane) Oil and gas development 15.24 15.24
The consolidated entity’s share of production from the above joint ventures during the fi nancial year was 1,154 BBLs from EP413 (2003: 462 BBLs).
ROC AR 2004_Financials.indd 63ROC AR 2004_Financials.indd 63 24/03/2005 18:11:40 pm24/03/2005 18:11:40 pm

64
NOTES TO AND FORMING PART OF THE FINANCIAL STATEMENTS
ROC OIL COMPANY LIMITED AND ITS CONTROLLED ENTITIES
CONSOLIDATED COMPANY
Note 28. Joint Ventures (continued)2004$’000
2003$’000
2004$’000
2003$’000
The following amounts represent the consolidated entity’s interest in assets and liabilities employed in the above joint venture operations. The amounts are included in the fi nancial statements under their respective categories:
Current Assets
Cash assets 2,943 2,800 – –
Trade receivables 542 104 – –
Materials inventory – 211 – –
Total Current Assets 3,485 3,115 – –
Non-Current Assets
Development expenditure 15,739 2,401 – –
Exploration expenditure 59,452 64,679 – –
Total Non-Current Assets 75,191 67,080 – –
Total Assets 78,676 70,195 – –
Current Liabilities
Trade payables 1,655 1,601 – –
Accrued liabilities 6,735 2,060 – –
Total Current Liabilities 8,390 3,661 – –
Non-Current Liabilities
Provision for restoration 2,576 2,474 – –
Total Non-Current Liabilities 2,576 2,474 – –
Total Liabilities 10,966 6,135 – –
Net Assets 67,710 64,060 – –
Note:
Exploration expenditure commitments and contingent liabilities in respect of joint venture operations are detailed in Note 27 and Note 33 respectively.
Note 29. Associate Companies
Details of investments in associate companies are as follows:
Name of Associate Company
Country where
Business Carried
on Principal Activity Balance Date
Benefi cial Interest in Ordinary Shares
at 31 December
Book Value of Ordinary Shares at
31 December
Contribution to Consolidated (Loss)/Profi t
2004 2003 2004 2003 2004 2003
Croft (UK) Limited UK Holding company 31 December 50 50 – – – –
Croft Oil and Gas plc UK Holding company 31 December 50 50 – – – –
Croft Exploration Limited UK Dormant 31 December 50 50 – – – –
Croft Onshore Oil Limited UK Dormant 31 December 50 50 – – – –
China Oil Shale Development Company(1)
Hong Kong Dormant 31 December 50 – – – – –
Note:
(1) Incorporated in the current fi nancial year.
ROC AR 2004_Financials.indd 64ROC AR 2004_Financials.indd 64 24/03/2005 18:11:40 pm24/03/2005 18:11:40 pm

65
Note 30. Superannuation Plans
During the 2004 fi nancial year, the Company contributed to accumulation type benefi t funds administered by fund managers. The funds cover all Australian domiciled employees of the Company. Employee and employer contributions are based on a fi xed percentage of cash salary. The current contribution is 9% (2003: 9%) of employee cash remuneration.
In the United Kingdom, Roc Oil (UK) Limited operates a defi ned contribution pension scheme. The assets of the scheme are held separately from those of the consolidated entity in an independently administered fund. Roc Oil (UK) Limited contributes 10% (2003: 10%) salary of all staff members to the scheme.
CONSOLIDATED COMPANY
2004$
2003$
2004$
2003$
Note 31. Remuneration of Auditors
(a) Auditor of the parent entity
Auditing the fi nancial report 69,000 65,000 69,000 58,000
Other services 148,240 46,000 148,240 46,000
217,240 111,000 217,240 104,000
(b) Other auditors
Auditing the fi nancial report 118,724 116,362 – –
Other services – – – –
118,724 116,362 – –
Note:
Remuneration of international associates of Deloitte Touche Tohmatsu, Australia is included under ‘Other auditors’.
Note 32. Director and Executive Disclosures
(a) Details of Directors and specifi ed executives
(i) Directors
Mr A J Love Chairman (non-executive)
Mr W G Jephcott Deputy Chairman (non-executive)
Dr R J P Doran Director and Chief Executive Offi cer
Mr R J Burgess Director (non-executive)
Mr R Dobinson Director (non-executive)
Mr S J Jansma, Jr Director (non-executive)
Mr A C Jolliffe Director (non-executive)
(ii) Specifi ed executives
Mr C Way General Manager Operations
Mr B Clement Chief Operating Offi cer
Dr K Hird General Manager Business Development
Mr W Jamieson General Manager Exploration
Ms S Ford General Counsel and Company Secretary
ROC AR 2004_Financials.indd 65ROC AR 2004_Financials.indd 65 24/03/2005 18:11:40 pm24/03/2005 18:11:40 pm

66
NOTES TO AND FORMING PART OF THE FINANCIAL STATEMENTS
ROC OIL COMPANY LIMITED AND ITS CONTROLLED ENTITIES
Note 32. Director and Executive Disclosures (continued)
(b) Remuneration of Directors and specifi ed executives
(i) Remuneration policy
The Remuneration and Nomination Committee is responsible for determining and reviewing the appropriate level and structure of remuneration of the executive team. Executive remuneration is set at levels and structured to attract, motivate, reward and retain good performers to drive the business effectively.
The Company has an Executive Share Option Plan. Under this plan, executives are issued options to subscribe for ordinary shares in the Company at the discretion of the Directors. The plan provides an incentive to the executive team to achieve signifi cant long term growth in the Company’s share price. For details, see Note 21 and the Directors’ Report.
(ii) Remuneration of Directors and specifi ed executives
PrimaryPost
EmploymentEquity
Compensation
Total$
Salaryand Fees
$Cash Bonus
$
Non-monetary Benefi ts
$Superannuation
$
Value of Share Options
$
Directors
Mr A J Love 65,000 – – – – 65,000
Mr W G Jephcott 45,000 – – 4,050 – 49,050
Dr R J P Doran 484,839 25,000 46,543 45,885 – 602,267
Mr R J Burgess 35,000 – – – – 35,000
Mr R Dobinson 35,000 – – 3,150 – 38,150
Mr S J Jansma, Jr 35,000 – – – – 35,000
Mr A C Jolliffe 35,000 – – – – 35,000
Total remuneration – Directors
2004 734,839 25,000 46,543 53,085 – 859,467
2003 734,839 – 32,949 50,834 – 818,622
Specifi ed executives
Mr C Way 309,000 – – 27,810 47,989 384,799
Mr B Clement 320,000 – – 28,800 31,626 380,426
Dr K Hird 263,142 10,000 – – 20,557 293,699
Mr W Jamieson 250,000 – – 22,500 42,168 314,668
Ms S Ford 235,000 – – 17,095 43,811 295,906
Total remuneration – specifi ed executives
2004 1,377,142 10,000 – 96,205 186,151 1,669,498
2003 1,264,606 – – 124,401 48,245 1,437,252
Information for individual Directors and specifi ed executives for the year ended 31 December 2003 is not shown as this is the fi rst fi nancial report prepared since the issue of AASB1046 ‘Director and Executive Disclosures by Disclosing Entities’.
ROC AR 2004_Financials.indd 66ROC AR 2004_Financials.indd 66 24/03/2005 18:11:40 pm24/03/2005 18:11:40 pm

67
(c) Remuneration options: granted during the year
During the fi nancial year, options were granted under the Executive Share Option Plan as equity compensation to certain specifi ed executives as disclosed below. Each option entitles the holder to subscribe for one fully paid ordinary share in the Company. For further information, refer to Note 21.
Executive Share
OptionsGranted Grant Date
Average Value per Option at
Grant Date$
Average Exercise Price
per Share$
First Exercise Date
Last Exercise Date
Specifi ed executives
Mr C Way 370,000 5 Aug 2004 0.74 1.77 5 Aug 2006 5 Aug 2008
Mr B Clement 300,000 5 Aug 2004 0.74 1.77 5 Aug 2006 5 Aug 2008
Dr K Hird 195,000 5 Aug 2004 0.74 1.77 5 Aug 2006 5 Aug 2008
Mr W Jamieson 400,000 5 Aug 2004 0.74 1.77 5 Aug 2006 5 Aug 2008
Ms S Ford 352,000 23 Jul 2004 0.65 1.75 23 Jul 2006 23 Jul 2008
Ms S Ford 77,000 5 Aug 2004 0.74 1.77 5 Aug 2006 5 Aug 2008
The Company did not receive any consideration on the grant of the executive share options.
(d) Shares issued on exercise of remuneration options
There were no shares issued to the Directors or specifi ed executives on the exercise of remuneration options.
(e) Option holdings of Directors and specifi ed executives
1 Jan 2004 31 Dec 2004
Balance at Beginning of
Year
Executive Share Options Granted as Remuneration
Options Exercised Options Lapsed
Balance at End of Year
Vested and Exercisable at
31 Dec 2004
Directors
Shareholder options
Mr A J Love 25,231 – – (25,231) – –
Mr W G Jephcott 54,691 – – (54,691) – –
Dr R J P Doran 20,829 – – (20,829) – –
Mr R J Burgess 25,150 – – (25,150) – –
Mr R Dobinson 152,751 – – (152,751) – –
Mr S J Jansma, Jr 999,640 – – (999,640) – –
Mr A C Jolliffe 47,671 – – (47,671) – –
Specifi ed executives
Employee options
Mr C Way 80,000 370,000 – – 450,000 80,000
Mr B Clement 600,000 300,000 – (250,000) 650,000 350,000
Mr K Hird 201,000 195,000 – (15,000) 381,000 186,000
Mr W Jamieson 230,000 400,000 – (130,000) 500,000 100,000
Ms S Ford – 429,000 – – 429,000 –
2,436,963 1,694,000 – (1,720,963) 2,410,000 716,000
ROC AR 2004_Financials.indd 67ROC AR 2004_Financials.indd 67 24/03/2005 18:11:41 pm24/03/2005 18:11:41 pm

68
NOTES TO AND FORMING PART OF THE FINANCIAL STATEMENTS
ROC OIL COMPANY LIMITED AND ITS CONTROLLED ENTITIES
Note 32. Director and Executive Disclosures (continued)
(f) Shareholdings of Directors and specifi ed executives
1 Jan 2004Opening balance
Net change from on- market transactions
31 Dec 2004Balance at end of year
Directors
Mr A J Love 645,690 (102,978) 542,712
Mr W G Jephcott 644,930 386,958 1,031,888
Dr R J P Doran 4,518,295 183,206 4,701,501
Mr R J Burgess 589,870 – 589,870
Mr R Dobinson 752,092 469,567 1,221,659
Mr S J Jansma, Jr 3,875,380 (1,978,229) 1,897,151
Mr A C Jolliffe 127,860 5,370 133,230
Specifi ed Executives
Mr C Way 5,800 3,600 9,400
Mr B Clement – – –
Dr K Hird 259,240 – 259,240
Mr W Jamieson 1,600 – 1,600
Ms S Ford – – –
11,420,757 (1,032,506) 10,388,251
All equity transactions with Directors and specifi ed executives other than those arising from the exercise of remuneration options have been entered into under terms and conditions no more favourable than those the Company would have adopted if dealing at arm’s length.
(g) Loans and other transactions
No loans have been made to the Directors or any specifi ed executive other than advances made for the purpose of meeting business expenses incurred in performing their duties. No interest is being charged on these amounts. There are no other transactions with the Directors or any specifi ed executives.
ROC AR 2004_Financials.indd 68ROC AR 2004_Financials.indd 68 24/03/2005 18:11:41 pm24/03/2005 18:11:41 pm

69
CONSOLIDATED COMPANY
2004$’000
2003$’000
2004$’000
2003$’000
Note 33. Contingent Liabilities
Under the terms of a production sharing agreement to which Roc Oil (Cabinda) Company and Lacula Oil Company Limited are parties, a ‘signature bonus’ of US$4.5 million was payable to the Angolan Government: – 6,000 – –
Roc Oil (Cabinda) Company acquired a 45% interest in the Cabinda South Block from Fina Oil and Gas Cabinda BV, an affi liate of TotalFinaElf (‘TFE’). Under the terms of the agreement with TFE, Roc Oil (Cabinda) Company will be liable for a payment of approximately US$0.7 million once production from the Block commences: 899 933 – –
Roc Oil (Cabinda) Company acquired the 15% participating interest held via Lacula Oil Company Limited in the Cabinda South Block onshore Angola production sharing agreement during the 2003 fi nancial year. A payment of US$100,000 will be made to the vendor if approval is received for the fi rst development plan submitted under the production sharing agreement: 128 133 – –
Under an option and purchase agreement dated 20 June 2003 between Roc Oil (Cabinda) Company and private parties in North America, the private parties have agreed to transfer and convey an overriding royalty attaching to the 15% participating interest held via Lacula Oil Company Limited to Roc Oil (Cabinda) Company upon the payment of US$250,000 within six months from the date of commercial production under the production sharing agreement: 321 467 – –
Effective 1 April 2003, Roc Oil (WA) Pty Limited acquired ARC Energy NL’s (‘ARC’) 7.5% interest in exploration permit WA-286-P. In addition to the initial consideration paid, additional payments up to a maximum of $3.75 million are payable to ARC subject to certain 2P reserve levels being achieved: 3,750 3,750 –
Roc Oil (WA) Pty Limited agreed with Norwest Energy NL (‘Norwest’) to acquire that company’s 7.5% working interest in exploration permit WA-226-P in the Perth Basin. If a discovery is declared commercial, ROC will make a payment to Norwest of $375,000: 375 575 – –
ROC AR 2004_Financials.indd 69ROC AR 2004_Financials.indd 69 24/03/2005 18:11:41 pm24/03/2005 18:11:41 pm

70
NOTES TO AND FORMING PART OF THE FINANCIAL STATEMENTS
ROC OIL COMPANY LIMITED AND ITS CONTROLLED ENTITIES
CONSOLIDATED COMPANY
Note 33. Contingent Liabilities (continued) 2004$’000
2003$’000
2004$’000
2003$’000
Under a sale and purchase agreement with Conoco (UK) Theta Limited, Roc Oil (GB) Limited has a contingent liability to Conoco (UK) Theta Limited to make a payment of up to US$1.75 million on production of the nine millionth barrel of oil from the Chestnut Oil Field: 2,246 2,333 – –
Pursuant to the purchase agreements under which Roc Oil (Chinguetti) BV increased its interests in the Mauritanian assets following the Agip pre-emption, ROC may be required to make additional payments of up to US$568,029. This payment would be triggered in three equal increments upon commerciality being declared on a new discovery, the granting of an Exclusive Exploitation Authorisation (‘EEA’) by the Mauritanian Government, and when sustained production at a rate of 40,000 BOEPD (gross) over a 30 day period from the EEA is obtained: 729 757 – –
In accordance with normal oil and gas industry practice, the consolidated entity has entered into joint venture operations and farm-in
agreements with other parties for the purpose of exploring and developing its licence interests. If a party to a joint venture operation
defaults and does not contribute its share of joint venture operation obligations, then the other joint venturers are liable to meet those
obligations. In this event, the interest in the licence held by the defaulting party may be redistributed to the remaining joint venturers.
CONSOLIDATED COMPANY
2004$’000
2003$’000
2004$’000
2003$’000
Note 34. Contingent Assets
Roc Oil (GB) Limited will receive a £750,000 production payment, subject to the further development of the Chestnut Oil Field, from the purchaser of its interest in that fi eld. No part of the £750,000 production payment has been included in the Statement of Financial Performance at this time, given it is contingent on the development of the Chestnut Oil Field. Roc Oil (GB) Limited will also potentially receive up to US$1.7 million on production of the nine millionth barrel of oil from the Chestnut Oil Field, increasing up to US$1.75 million on production of 9.2 million barrels of oil from the Chestnut Oil Field: 4,102 4,114 – –
Roc Oil (GB) Limited will receive a US$300,000 production payment from EnCana (UK) Limited, subject to commencement of production from the Ettrick Oil Field prior to 1 January 2006: 385 400 – –
ROC AR 2004_Financials.indd 70ROC AR 2004_Financials.indd 70 24/03/2005 18:11:41 pm24/03/2005 18:11:41 pm

71
Note 35. Financial Instruments
(a) Signifi cant accounting policies
Details of the signifi cant accounting policies and methods adopted, including the criteria for recognition, the basis of measurement and the basis on which revenue and expenses are recognised, in respect of each class of fi nancial asset, fi nancial liability and equity instrument are disclosed in Note 1.
Use of derivative fi nancial instruments is subject to procedures and limits approved by the Directors of Roc Oil Company Limited.
(b) Foreign exchange risk
The consolidated entity’s sales revenue is mainly denominated in UK pounds (gas sales) and United States dollars (sale of oil and NGLs). The exposure of sales revenue to fl uctuations in $/US$ and $/£ exchange rates is mitigated to some extent by the natural currency hedges that exist due to the consolidated entity holding part of its short term deposits in United States dollars and the consolidated entity’s operating, development and exploration costs for the UK business being incurred primarily in pounds.
Hedging is undertaken against specifi c future commitments only. As at 31 December 2004 and 31 December 2003, the consolidated entity did not have any currency hedge instruments in place.
(c) Commodity price risk
Oil price
As at 31 December 2004, the consolidated entity did not have any oil price hedging in place (2003: Nil).
Gas price
There was no gas hedging in place as at 31 December 2004.
As at 31 December 2003, gas hedging comprised a gas price hedge covering 0.42 BCF (4.59 MMSCFD) of sales gas over the fi nancial period from 1 January 2004 to 31 March 2004 at an average price of 27.35 pence per therm (equivalent to US$5.36/$7.14 per thousand cubic feet as at 31 December 2004 exchange rates).
(d) Interest rate risk
The consolidated entity’s only material exposure to interest rate risk as at 31 December 2004 is cash ($21.5 million) and short term deposits ($54.5 million).
The average interest rate for the 2004 fi nancial year was 4.50%.
The consolidated entity’s only material exposure to interest rate risk as at 31 December 2003 was cash ($6.4 million), short term deposits ($35.2 million) and a US$20.0 million Syndicated Bank Loan Facility (drawn down to US$13.6 million) with a maturity of 31 July 2004 which attracted on average a variable interest rate of 3.1%, 2.3% and 2.4% per annum respectively.
(e) Credit risk
Credit risk refers to the risk that a counterparty will default on its contractual obligations resulting in fi nancial loss to the consolidated entity. The consolidated entity has adopted the policy of only dealing with creditworthy counterparties and obtaining suffi cient collateral or other security, where appropriate, as a means of mitigating the risk of fi nancial loss from defaults. The consolidated entity measures credit risk on a fair value basis.
The carrying amount of fi nancial assets recorded in the fi nancial statements, net of any provisions for losses, represents the consolidated entity’s maximum exposure to credit risk without taking account of the value of any collateral or other security obtained.
(f) Net fair value
The carrying amount of fi nancial assets and fi nancial liabilities recorded in the fi nancial statements represents their respective net fair values, determined in accordance with the accounting policies disclosed in the fi nancial statements. With the exception of interest bearing liabilities, fi nancial assets and fi nancial abilities mature within one year of the balance sheet date. The non-current interest bearing liability matures over a period of greater than fi ve years.
(g) Economic dependency
The Directors believe there is no economic dependency.
ROC AR 2004_Financials.indd 71ROC AR 2004_Financials.indd 71 24/03/2005 18:11:41 pm24/03/2005 18:11:41 pm

72
NOTES TO AND FORMING PART OF THE FINANCIAL STATEMENTS
ROC OIL COMPANY LIMITED AND ITS CONTROLLED ENTITIES
Note 36. Subsequent Events
Since the end of the fi nancial year, the following material events have occurred:
Tiof appraisal well
The Tiof-6 appraisal well was drilled subsequent to year end to a total depth of 2,963 metres. Preliminary interpretation indicate the well has intersected oil over a gross interval of approximately 124 metres. The Tiof-6 appraisal well was suspended as planned on 17 January 2005. Production testing took place during February 2005 with the well fl owing at rates of up to 12,400 BOPD.
Completion of sale of Saltfl eetby Gas Field
On 21 January 2005, ROC completed the sale of Roc Oil (UK) Limited and Roc Oil (CEL) Limited (which included the Saltfl eetby Gas Field) to the WINGAS GmbH joint venture, which consists of Wintershall AG and OAO Gazprom for a cash consideration of £44 million ($109 million). Effective date of sale is 31 December 2004. The sale will have a material effect on ROC’s future fi nancial performance as there will be no future revenue (2004: $37.5 million) accruing to ROC from Saltfl eetby Gas Field.
Errington exploration well
The Errington-1 wildcat exploration well in PEDL028 commenced drilling prior to the end of the fi nancial year and reached a total depth of 2,200 metres on 22 January 2005. After running casing to a depth of 1,976 metres, the well was suspended as a new tight gas discovery, with the intention that it will be evaluated further later in 2005 as part of ROC’s onshore UK tight gas strategy.
Share placement
On 27 January 2005, ROC completed the placement of 9,900,990 fully paid ordinary shares at a price of $2.00 per share to two established institutional investors. The placement price represented an approximate 11% premium to the weighted average price of ROC’s shares traded during the 10 days prior to announcement and raised US$15 million.
Cliff Head appraisal well
The Cliff Head-5 appraisal well was drilled and reached total depth on 23 February 2005. The top of the reservoir was encountered approximately 56 metres low to prognosis coincident with the fi eld wide oil-water contact. Well logs have been acquired and are being evaluated to assess the implications of the well results. The well has been plugged and abandoned as planned.
Note 37. Impact of Adopting AASB Equivalents to IFRS
The Australian Accounting Standards Board (‘AASB’) is adopting Australian equivalents of the International Financial Reporting Standards (‘A-IFRS’) for application to reporting periods beginning on or after 1 January 2005. The Company is currently reviewing the application of A-IFRS for fi rst time adoption in the year ending 31 December 2005. ROC has allocated appropriate resources to plan for and monitor the transition to A-IFRS with updates being reported to the Audit Committee which is overseeing the transition.
ROC’s adoption of A-IFRS will fi rst be refl ected in ROC’s fi nancial reports for the half year ending 30 June 2005 and the year ending 31 December 2005. When complying with A-IFRS, ROC will be required to restate its comparative fi nancial statements to refl ect the application of A-IFRS to the relevant comparative period.
This fi nancial report has been prepared in accordance with Australian generally accepted accounting practice (‘A-GAAP’). The differences between A-GAAP and A-IFRS identifi ed as potentially having a signifi cant effect on ROC’s fi nancial performance and fi nancial position are summarised below. The differences have not yet been quantifi ed; accordingly, there can be no assurance that the fi nancial performance and fi nancial position as disclosed in this report would not be materially different if determined in accordance with A-IFRS.
Accounting for income taxes
Under AASB112 ‘Income Taxes’, the Company is required to use the balance sheet method which calculates temporary timing differences based on the carrying value of the entity’s assets and liabilities in the Statement of Financial Position and their associated tax bases.
The calculation is performed for each tax jurisdiction and the net deferred tax liability, after taking into account any associated tax losses, is recognised. A deferred tax asset will only be recorded if its realisation is probable.
This is a change from the current accounting policy, under which deferred tax balances are recorded using the income statement method. Items under this method are only tax effected if they are included in the pre-tax accounting profi t or loss and/or taxable income or loss.
ROC AR 2004_Financials.indd 72ROC AR 2004_Financials.indd 72 24/03/2005 18:11:41 pm24/03/2005 18:11:41 pm

73
Note 37. Impact of Adopting AASB Equivalents to IFRS (continued)
Share based payments
Under AASB2 ‘Share Based Payments’, the Company will be required to determine the fair value of options issued to employees and recognise the expense in the Statement of Financial Performance in the period when the service is received.
This is a change from the current accounting policy where no expense is recognised.
Impairment of assets
Under AASB136 ‘Impairment of Assets’ the recoverable amount of an asset is determined by the higher of ‘fair value less cost to sell’ or ‘value in use’ which is determined by using a discounted cash fl ow.
This is a change from ROC’s current accounting policy where net cash fl ows are not discounted to present value.
Accounting for rehabilitation costs
Under AASB116 ‘Property Plant and Equipment’ the estimated costs of dismantling and removing an asset and restoring a site is included in the cost of the asset to the extent that it is recognised as a provision under AASB137 ‘Provisions, Contingent Liabilities and Contingent Assets’. AASB137 requires the liability to be measured at the amount required to settle the present obligation at the balance sheet date.
ROC’s current accounting policy requires the costs of dismantling and removing an asset to be provided for over the life of the assets on a unit-of-production basis.
Accounting for exploration and evaluation
There is no material change under the new AASB6 ‘Exploration for and Evaluation of Mineral Resources’ compared to ROC’s current accounting policies for exploration.
Financial instruments
Under AASB139 ‘Financial Instruments: Recognition and Measurement’ certain fi nancial instruments must be carried in the Statement of Financial Position at fair value.
ROC’s current policy is to recognised any gain or loss on a fi nancial instrument only when it is realised.
Note 38. Additional Company Information
(a) Roc Oil Company Limited is a public company listed in Australia on the ASX and in the UK on the Alternative Investment Market of the London Stock Exchange, and incorporated in Australia and operating in Australia and overseas.
The registered offi ce and principal place of business is:Level 14, 1 Market StreetSydney NSW 2000Australia.
(b) The number of employees as at 31 December 2004 was 57 (2003: 47) for Roc Oil Company Limited and 88 (2003: 83) for the consolidated entity. The number of employees includes both full time employees and part time employees measured on a full time equivalent basis.
ROC AR 2004_Financials.indd 73ROC AR 2004_Financials.indd 73 24/03/2005 18:11:42 pm24/03/2005 18:11:42 pm

74 ROC OIL COMPANY LIMITED AND ITS CONTROLLED ENTITIES
1. Ordinary Share Capital
As at 21 March 2005, the Company had on issue 186,196,793 fully paid ordinary shares held by 10,701 shareholders.
All issued fully paid ordinary shares carry one vote per share.
2. Options
As at 21 March 2005, the Company had the following unquoted options:
• 2,297,200 options under the Employee Share Option Plan held by 49 optionholders and 3,868,000 options under the Executive Share Option Plan held by 28 optionholders;
• 7,698,830 options issued to shareholders under the Prospectus dated 21 June 1999 and held by 123 optionholders lapsed during the fi nancial year;
• 1,097,210 employee share options lapsed or were cancelled.
• 449,300 options issued under the Employee Share Option Plan were exercised; and
• Options do not carry any voting rights or rights to dividends.
3. Distribution of Share and Option Holders
Holding Shareholders Employee Options Executive Options
1 – 1,000 2,080 1 –
1,001 – 5,000 4,833 1 –
5,001 – 10,000 2,117 – 1
10,001 – 100,000 1,568 41 16
Over 100,000 103 6 11
Total 10,701 49 28
Shareholders holding less than a marketable parcel 51
4. Substantial Shareholders as at 21 March 2005
The following shareholders have advised that they are a substantial shareholder:
Shareholder Number Held (Fully Paid Ordinary Shares) % of Class Held
J P Morgan Chase & Co 13,401,292 7.20
National Australia Bank 9,631,178 5.18
Commonwealth Bank of Australia 9,302,538 5.00
SHAREHOLDER INFORMATION
ROC AR 2004_Financials.indd 74ROC AR 2004_Financials.indd 74 24/03/2005 18:11:42 pm24/03/2005 18:11:42 pm

75
5. Twenty Largest Shareholders as at 21 March 2005
Shareholder Number Held % Rank
Westpac Custodian Nominees Limited 18,620,773 10.00 1
ANZ Nominees Limited 11,122,904 5.97 2
National Nominees Limited 10,153,438 5.45 3
Citicorp Nominees Pty Limited 8,289,969 4.45 4
Mellon Nominees (UK) Limited 7,920,792 4.25 5
J P Morgan Nominees Australia Limited 6,207,964 3.33 6
AMP Life Limited 5,673,943 3.05 7
Citicorp Nominees Pty Limited (CFS W/Sale GBL Res Fund A/c) 4,480,149 2.41 8
Celtic Energy Pty Ltd 4,450,251 2.39 9
Cogent Nominees Pty Limited 3,074,433 1.65 10
The Bank of New York (Nominees) Limited 1,992,998 1.07 11
Mr Sidney John Jansma Jr 1,897,151 1.02 12
Mr Maximillian Francesco de Vietri 1,859,927 1.00 13
Equity Trustees Limited 1,458,363 0.78 14
ConocoPhillips Canada Resources Corporation 1,454,140 0.78 15
Espasia Pty Ltd 1,210,299 0.65 16
Mirrabooka Investments Limited 1,200,000 0.64 17
Mango Bay Enterprises Inc 950,000 0.51 18
Ladon Management Pty Ltd 912,782 0.49 19
Almargem Pty Ltd 880,000 0.47 20
Top 20 Total 93,810,276 50.36
ROC AR 2004_Financials.indd 75ROC AR 2004_Financials.indd 75 24/03/2005 18:11:42 pm24/03/2005 18:11:42 pm

76 ROC OIL COMPANY LIMITED AND ITS CONTROLLED ENTITIES
GLOSSARY AND DEFINITIONS
$ or cents Australian currency.
acre Unit of land measurement, 1 sq km is equivalent to 247.105 acres.
AIM Alternative Investment Market of the London Stock Exchange.
ASX Australian Stock Exchange Limited.
BBLS Barrels, equivalent to 0.159 cubic metres.
BCF One billion cubic feet of natural gas.
BOE Barrel of oil equivalent. The factor used to convert gas to oil equivalent is based upon an approximate energy value of 6,000 cubic feet per barrel and not price equivalence at the time.
BOEPD Barrel of oil equivalent per day.
BOPD Barrel of oil per day inclusive of NGLs.
GST Goods and services tax.
km Kilometres.
m Metre.
MCF One thousand cubic feet of natural gas.
MM Millions.
MMBO One million barrels of oil.
MMBOE One million barrels of oil equivalent.
MMSCFD One million standard cubic feet of natural gas per day.
NGLs Natural gas liquids.
pence UK pence (£0.01).
pound or £ UK pounds.
probable reserves Probable reserves are less certain than proved reserves and can be estimated with a degree of certainty suffi cient to indicate they are more likely to be recovered than not. Note that probable reserves have not been risked.
proved reserves Proved reserves can be estimated with reasonable certainty to be recoverable under current economic conditions. Current economic conditions include prices and costs prevailing at the time of the estimate. Proved reserves may be developed or undeveloped.
PSA Production sharing agreement.
PSC Production sharing contract.
Rights Issue 3 for 5 Renounceable Rights Issue.
ROC Roc Oil Company Limited
therm Calorifi c heating value of gas.
trading profi t Sales revenue net of production costs, amortisation expense and restoration expense.
sq km Square kilometres.
UK United Kingdom.
US$ United States dollars.
3D Three dimensional.
2P Proved and probable reserves.
ROC AR 2004_Financials.indd 76ROC AR 2004_Financials.indd 76 24/03/2005 18:11:42 pm24/03/2005 18:11:42 pm

DIRECTORY
Sydney OfficeRoc Oil Company LimitedLevel 14, 1 Market StreetSydney NSW 2000AustraliaTel: +61 2 8356 2000Fax: +61 2 9380 2066
Perth OfficeRoc Oil (WA) Pty LimitedLevel 6, 250 St George’s TerracePerth WA 6000AustraliaTel: +61 8 9278 8116Fax: +61 8 9278 8653
UK OfficeRoc Oil (UK) LimitedHigh StreetSaxilbyLincolnshire LN1 2JQUnited KingdomTel: +44 1522 704 580Fax: +44 1522 704 581
Equatorial Guinea OfficeRoc Oil (Equatorial Guinea) CompanyCaracolasMalaboEquatorial GuineaTel: +240 96333Fax: +240 96170
Middle East OfficeC/- Sovereign Technology and EnergyPO Box 18141 DohaQatarTel: +974 4 369 111Fax: +974 4 369 333
China OfficeRoc Oil (China) CompanyChaoyang Villa, Nanhai HotelPO Box 17 Potou ZhanjiangGuangdong 524057 PR ChinaTel: +86 759 395 0265Fax: +86 759 395 2236
Angola OfficeRoc Oil (Cabinda) Company Morro Bento, Benfica LuandaAngolaTel: +244 274 0172Fax: +244 274 0173
Registered OfficeLevel 14, 1 Market StreetSydney NSW 2000Australia
Share RegistrarAustraliaComputershare Investor Services Pty LimitedLevel 3, 60 Carrington StreetSydney NSW 2000Australia
EnglandComputershare Investor Services plcThe PavilionsBridgewater RoadBristolBS13 8AE
Board of DirectorsMr Andrew J Love, ChairmanMr William G Jephcott, Deputy ChairmanDr R John P Doran, Chief Executive Officer and DirectorMr Richard J Burgess, DirectorMr Ross Dobinson, DirectorMr Sidney J Jansma Jr, DirectorMr Adam C Jolliffe, Director
Advisors to the BoardMr Ahmed E Seddiqi Al-EmadiDr A A Al-Quaiti
Company SecretaryMs Sheree Ford
Senior Management TeamMr Edgar Baines, Managing Director (Roc Oil (UK) Limited)Mr Bruce Clement, Chief Operating OfficerDr R John P Doran, Chief Executive Officer and DirectorMs Sheree Ford, General Counsel and Company SecretaryDr Kevin Hird, General Manager – Business DevelopmentMr Wes Jamieson, General Manager – ExplorationMr Neil Seage, Senior Reservoir Engineer and Planning EngineerMr Chris Way, General Manager – Operations
Regional ManagersMr Tim Hargreaves, Regional Manager East AsiaMr John Mebberson, Regional Manager Australia and New Zealand
Representative in AfricaMr Antonio Vieira
Country Manager, ChinaDr Fang Qing
AcknowledgementsIllustrationsMr Guy BilloutGetty ImagesPhotographyBGS EdinburghMr Bruce ClementDr John DoranMrs Libby PerryMr Adrian PilcherMr Chris Way
Stock ExchangeAustralian Stock Exchange20 Bridge StreetSydney NSW 2000AustraliaASX Code: ROC
The Alternative Investment Market (AIM) of the London Stock Exchange10 Paternoster SquareLondon EC4M 7LSEnglandAIM Code: ROC
Nominated Advisor and BrokerCannaccord Capital (Europe) LimitedBrook House27 Upper Brook StreetLondon W1K 7QFEngland

In 2004, ROC activated the Production Sharing Agreement for the Cabinda South Block, onshore Angola. As a result, ROC, as Operator of the Joint Venture, expects to start the first on-the-ground exploration activities in the block for more than 30 years in 2Q 2005.