Directional loudness in an anechoic sound field, head-related ...
16
Directional loudness in an anechoic sound field, head-related transfer functions, and binaural summation a) Ville Pekka Sivonen b Sound Quality Research Unit (SQRU), Department of Acoustics, Aalborg University, Fredrik Bajers Vej 7 B5, 9220 Aalborg East, Denmark and Brüel & Kjær Sound & Vibration Measurement A/S, Skodsborgvej 307, 2850 Nærum, Denmark Wolfgang Ellermeier Sound Quality Research Unit (SQRU), Department of Acoustics, Aalborg University, Fredrik Bajers Vej 7 B5, 9220 Aalborg East, Denmark Received 25 July 2005; revised 7 February 2006; accepted 13 February 2006 The effect of sound incidence angle on loudness was investigated using real sound sources positioned in an anechoic chamber. Eight normal-hearing listeners produced loudness matches between a frontal reference location and seven sources placed at other directions, both in the horizontal and median planes. Matches were obtained via a two-interval, adaptive forced-choice 2AFC procedure for three center frequencies 0.4, 1, and 5 kHz and two overall levels 45 and 65 dB SPL. The results showed that loudness is not constant over sound incidence angles, with directional sensitivity varying over a range of up to 10 dB, exhibiting considerable frequency dependence, but only minor effects of overall level. The pattern of results varied substantially between subjects, but was largely accounted for by variations in individual head-related transfer functions. Modeling of binaural loudness based on the at-ear signals favored a sound-power summation model, according to which the maximum binaural gain is only 3 dB, over competing models based on larger gains, or on the summation of monaural loudness indices. © 2006 Acoustical Society of America. DOI: 10.1121/1.2184268 PACS numbers: 43.66.Pn, 43.66.Cb AK Pages: 2965–2980 I. INTRODUCTION There is growing awareness in psychoacoustics that, for a thorough understanding of loudness perception, its binaural nature has to be taken into account. That is true for basic research, namely the construction of general loudness mod- els e.g., Moore et al., 1997, as well as for applications to audio reproduction systems Zacharov et al., 2001 or to per- ceived sound quality Bodden, 1997. Especially for instru- mental loudness predictions based on Zwicker’s modeling, as standardized in ISO 532 1975, the fact that it is essentially monophonic has been regarded as a major drawback. Never- theless, the adjustments recently made to loudness modeling rest on a fairly narrow empirical data base, which the present study hopes to extend. To clarify the issues, it may be helpful to distinguish two stages of processing involved when the loudness of a real sound source in space is perceived: 1 the physical transfor- mation of the “distal” stimulus emitted by the source to “proximal” stimuli arriving at the listener’s ears, and 2 the neural, psychological, and cognitive process of integrating the two at-ear stimuli into a single percept. A. Physical „HRTF… filtering The first stage can be described in purely acoustical terms, namely by applying head-related transfer functions HRTFs, Shaw, 1974; Wightman and Kistler, 1989a; Møller et al., 1995; Blauert, 1997, Chap. 5. These account for the filtering of the source due to the physical effects of the hu- man torso, head, and pinnae, depending on the incidence angle of the sound. Further along, through the ear canal, the physical sound transmission has been shown to be indepen- dent of the direction of the sound source see, e.g., Hammer- shøi and Møller, 1996. Thus, the direction-dependent part of an HRTF can be measured at the entrance to the blocked ear canal, and described by adopted from Møller et al., 1995 HRTF dir-dep , = P 2 P 1 , , 1 where is azimuth, is elevation, P 1 is sound pressure at the center position of head, and P 2 is sound pressure at the entrance to the blocked ear canal. In the median plane, the HRTFs of the two ears are fairly similar due to the physical symmetry of the human body in this plane. However, level differences between HRTFs for different directions can approach 10 dB or more over a fairly wide frequency range. By contrast, large inter- aural time and level differences ITDs and ILDs, respec- tively between the two ears emerge in the horizontal plane, where the ILDs can reach up to 30 dB at high frequencies. HRTFs have been a major research topic during the past a Portions of the data were presented at the 147th Meeting of the Acoustical Society of America, New York, May, 2004, and at Internoise, Prague, August, 2004. b Electronic mail: [email protected] J. Acoust. Soc. Am. 119 5, May 2006 © 2006 Acoustical Society of America 2965 0001-4966/2006/1195/2965/16/$22.50
Transcript of Directional loudness in an anechoic sound field, head-related ...

Directional loudness in an anechoic sound field, head-relatedtransfer functions, and binaural summationa)
Ville Pekka Sivonenb�
Sound Quality Research Unit (SQRU), Department of Acoustics, Aalborg University,Fredrik Bajers Vej 7 B5, 9220 Aalborg East, Denmark and Brüel & Kjær Sound& Vibration Measurement A/S, Skodsborgvej 307, 2850 Nærum, Denmark
Wolfgang EllermeierSound Quality Research Unit (SQRU), Department of Acoustics, Aalborg University,Fredrik Bajers Vej 7 B5, 9220 Aalborg East, Denmark
�Received 25 July 2005; revised 7 February 2006; accepted 13 February 2006�
The effect of sound incidence angle on loudness was investigated using real sound sourcespositioned in an anechoic chamber. Eight normal-hearing listeners produced loudness matchesbetween a frontal reference location and seven sources placed at other directions, both in thehorizontal and median planes. Matches were obtained via a two-interval, adaptive forced-choice�2AFC� procedure for three center frequencies �0.4, 1, and 5 kHz� and two overall levels �45 and65 dB SPL�. The results showed that loudness is not constant over sound incidence angles, withdirectional sensitivity varying over a range of up to 10 dB, exhibiting considerable frequencydependence, but only minor effects of overall level. The pattern of results varied substantiallybetween subjects, but was largely accounted for by variations in individual head-related transferfunctions. Modeling of binaural loudness based on the at-ear signals favored a sound-powersummation model, according to which the maximum binaural gain is only 3 dB, over competingmodels based on larger gains, or on the summation of monaural loudness indices. © 2006Acoustical Society of America. �DOI: 10.1121/1.2184268�
PACS number�s�: 43.66.Pn, 43.66.Cb �AK� Pages: 2965–2980
I. INTRODUCTION
There is growing awareness in psychoacoustics that, fora thorough understanding of loudness perception, its binauralnature has to be taken into account. That is true for basicresearch, namely the construction of general loudness mod-els �e.g., Moore et al., 1997�, as well as for applications toaudio reproduction systems �Zacharov et al., 2001� or to per-ceived sound quality �Bodden, 1997�. Especially for instru-mental loudness predictions based on Zwicker’s modeling, asstandardized in ISO 532 �1975�, the fact that it is essentiallymonophonic has been regarded as a major drawback. Never-theless, the adjustments recently made to loudness modelingrest on a fairly narrow empirical data base, which the presentstudy hopes to extend.
To clarify the issues, it may be helpful to distinguish twostages of processing involved when the loudness of a realsound source in space is perceived: �1� the physical transfor-mation of the “distal” stimulus emitted by the source to“proximal” stimuli arriving at the listener’s ears, and �2� theneural, psychological, and cognitive process of integratingthe two at-ear stimuli into a single percept.
a�Portions of the data were presented at the 147th Meeting of the AcousticalSociety of America, New York, May, 2004, and at Internoise, Prague,August, 2004.
b�
Electronic mail: [email protected]J. Acoust. Soc. Am. 119 �5�, May 2006 0001-4966/2006/119�5
A. Physical „HRTF… filtering
The first stage can be described in purely acousticalterms, namely by applying head-related transfer functions�HRTFs, Shaw, 1974; Wightman and Kistler, 1989a; Mølleret al., 1995; Blauert, 1997, Chap. 5�. These account for thefiltering of the source due to the physical effects of the hu-man torso, head, and pinnae, depending on the incidenceangle of the sound. Further along, through the ear canal, thephysical sound transmission has been shown to be indepen-dent of the direction of the sound source �see, e.g., Hammer-shøi and Møller, 1996�. Thus, the direction-dependent part ofan HRTF can be measured at the entrance to the blocked earcanal, and described by �adopted from Møller et al., 1995�
HRTFdir-dep��,�� =P2
P1��,�� , �1�
where � is azimuth, � is elevation, P1 is sound pressure atthe center position of head, and P2 is sound pressure at theentrance to the blocked ear canal.
In the median plane, the HRTFs of the two ears arefairly similar due to the physical symmetry of the humanbody in this plane. However, level differences betweenHRTFs for different directions can approach 10 dB or moreover a fairly wide frequency range. By contrast, large inter-aural time and level differences �ITDs and ILDs, respec-tively� between the two ears emerge in the horizontal plane,where the ILDs can reach up to 30 dB at high frequencies.
HRTFs have been a major research topic during the past© 2006 Acoustical Society of America 2965�/2965/16/$22.50

15 years, but the focus of this research has been on adequate“auralization” or sound localization �Wightman and Kistler,1989a,b; Bronkhorst, 1995; Møller et al., 1996�, not on loud-ness.
B. Binaural loudness summation
The second stage of processing has been termed binauralloudness summation. It describes how the acoustic inputs tothe left and right ear are integrated to yield a single, binauralloudness. Starting from the observation that a sound appearslouder when listened to with both ears �i.e., binaurally� thanwith only one �i.e., monaurally�, a number of investigatorsconducted experiments using headphones, through whichdifferent combinations of left- and right-ear sound-pressurelevels were presented in order to quantify this effect. Theresults are often summarized as providing evidence for abinaural-to-monaural loudness ratio of 2:1, or perfect loud-ness summation, corresponding to a binaural gain of approxi-mately 10 decibels �e.g., Levelt et al., 1972; Marks, 1978;Schneider and Cohen, 1997�, in accordance with the sonescale of loudness. The evidence is far from unequivocal,however, with many studies finding less-than-perfect sum-mation �e.g., loudness ratios of approximately 1.5:1; Zwickerand Zwicker, 1991�, and a level dependence of the binauralgain, which appears to increase from approximately 3 dBnear threshold to 6–10 dB at high sound-pressure levels�Shaw et al., 1947; Reynolds and Stevens, 1960; Hellmanand Zwislocki, 1963�.
Interestingly, binaural loudness summation, as conceptu-alized in this paradigm, has not been investigated withsounds that are likely to reach the eardrums when emittedfrom a real source in space, i.e., with products of the first�HRTF� filtering stage. Rather, artificial sounds such astones, or broadband noise, lacking all spatial or directionalinformation have been used, often at interaural level differ-ences �e.g., in monotic-to-diotic comparisons� far exceedingwhat would naturally occur. Such conditions of stimulationdo not yield an externalized sound image, but rather more orless lateralized inside-the-head percepts. Generally, it ap-pears that the considerable literature on binaural loudnesssummation has contributed more to the development of scal-ing methodologies than to the auditory issues involved.
C. Loudness of free and diffuse sound fields
For practical purposes, in an attempt to relate the mono-phonic measurement of a sound field to perceived loudness,two specific types of sound fields have been considered: Thefree field, where the sound incidence angle is frontal to thelistener, and the diffuse field, where the sound is reaching thelistener’s ears with equal intensity from all directions.
In order to account for the fundamental difference insound incidence, the standardized loudness model �ISO 532,1975� has different computation procedures for the twosound fields. The two procedures are based on both objectiveand subjective data �Kuhl and Westphal, 1959; Robinson etal., 1961; ISO 389-7, 1996�: The objective data represent thedifferences in the at-ear sound pressures between the two
sound fields, i.e., investigating only the effect of the first2966 J. Acoust. Soc. Am., Vol. 119, No. 5, May 2006
�HRTF� filtering stage; the subjective data represent the dif-ferences in perceived loudness, including effects of both thefirst and the second stage. Even though the agreement be-tween the objective and subjective data is fair, these investi-gations do not specify how the two signals at the ears of alistener are summed into a single loudness percept, due to thefact that the stimulation of the auditory system in both soundfields is essentially diotic.
The increasing use of dummy heads for acoustical re-cordings and measurements, often resulting in dichotic at-earsignals, has led to growing interest in how dichotic at-earsignals should be summed to correspond to the diotic stimu-lation of the conventional free- and diffuse-field loudnessparadigms.
D. Directional loudness
Thus, while studies of HRTF filtering have not explicitlybeen concerned with the loudness of dichotic sounds, thework on binaural loudness summation appears to lack eco-logical validity to predict the perception of real sources po-sitioned in space. What remains, then, is less than a handfulof studies that have actually investigated directional loudnessof real sources in space, taking into account both stages de-lineated: the physical filtering due to HRTFs, and the ensuing“psychological” summation.
Sivian and White �1933� investigated the effect of direc-tion on hearing thresholds, reporting that at absolute thresh-old, the binaural minimum audible field is not significantlydifferent from the monaural one. This implies no or a verysmall binaural advantage, the ear receiving the higher soundpressure determining the binaural hearing threshold. Whilethe directional HRTF effects are the same at higher sound-pressure levels, extrapolating from a detection task to sup-rathreshold binaural loudness and to its summation acrossthe two ears may be unjustified.
By far, the most pertinent and complete study investigat-ing directional loudness was published by Robinson andWhittle �1960� more than 45 years ago. The authors used acircular array of 12 equally spaced loudspeakers positionedaround the listener seated in an anechoic room to obtainloudness matches between a reference and each test position.Using narrow-band sounds having six center frequencies be-tween 1.6 and 10 kHz, and rotating their apparatus whenrequired, they investigated the horizontal, median, and fron-tal planes in a sample of 16 to 20 listeners. Using probe-tubemicrophones they also measured sound-pressure levels at theears of their subjects, as produced by the same stimuli, thusobtaining crude magnitudes of “HRTFs” for the six test fre-quencies.
As expected, the average loudness matches showed astrong frequency dependence, with the greatest directionaleffects �of up to 15 dB; see their Fig. 2� observed at higherfrequencies �4–10 kHz�. Relating the mean loudnessmatches to the average at-ear sound-pressure measurements,Robinson and Whittle �1960; see their Fig. 5� found theformer to be reasonably well predicted by a “6-dB summa-
tion rule,”V. P. Sivonen and W. Ellermeier: Directional loudness
Lmon = 6 � log2�2Lleft/6 + 2Lright/6� , �2�
where Lmon is the equivalent sound pressure needed formonotic stimulation to match any binaural �diotic: Lleft
=Lright, or dichotic: Lleft�Lright� combination of left-ear�Lleft� and right-ear �Lright� input levels. If, for example,both ears are exposed to 70 dB SPL, the equivalentmonotic SPL turns out to be 76 dB SPL �i.e., a 6-dB bin-aural gain�. Note, however, that there is not sufficient in-formation on the fit of this heuristic �other than what canbe judged from visual inspection of their Fig. 5� in Rob-inson and Whittle’s report, or on its feasibility to predictindividual subjects’ data.
Two more recent studies picked up the issue, thoughusing considerably fewer experimental conditions and sub-jects, and not including HRTF measurements. Both studies�Remmers and Prante, 1991; Jørgensen, 2002� used wide-band noise to obtain loudness matches, thus potentially ob-scuring a frequency dependence, and obtained much smallereffects than Robinson and Whittle �1960�, with directionalloudness matches varying by less than 3 dB across incidenceangles.
E. Rationale for the present study
It thus appears worthwhile to take up the issue of direc-tional loudness once more. This will be done paying specialattention to five methodological issues, which are elaboratedin turn:
�1� Well-defined narrow-band stimuli are needed to investi-gate the effects of HRTFs and binaural loudness summa-tion. Note that, in Robinson and Whittle’s �1960� report,the sounds used were not sufficiently specified beyondstating that they were “below a critical band” �p. 75�, andthe later studies used wideband noise which might washout some of the directional effects.
�2� Given the evidence from earlier headphone experimentsshowing the binaural gain to increase from approxi-mately 3 dB near threshold to up to 10 dB at high sound-pressure levels, level effects will be taken into accountby making measurements at two overall sound-pressurelevels.
�3� With the exception of Jørgensen’s �2002� study, classical“method�s� of adjustment” have been used to collect thesubjective data. By their transparency, and the explicitcontrol they give listeners over the outcome, these meth-ods are prone to subject-induced biases, such as “correct-ing” an adjustment due to some expectation. Forced-choice procedures �Levitt, 1971; Jesteadt, 1980�,especially when interleaving adaptive tracks for differentexperimental conditions, are much less susceptible tosuch biases.
�4� Advances in the methodology to HRTFs will be broughtto the study of directional loudness. Note that Robinsonand Whittle’s �1960� pioneering study was done beforethe term HRTF was coined, and that their at-ear mea-surements of the stimuli actually used merely provide sixpoints along the frequency scale, and thus do not consti-
tute HRTFs as we conceive of them today.J. Acoust. Soc. Am., Vol. 119, No. 5, May 2006
�5� Since HRTF filtering is known to be highly idiosyn-cratic, it is likely that with averaged data frequency-dependent directional effects might partially cancel eachother, thus underestimating the true effect size. There-fore, a greater emphasis than in earlier studies will be onindividual results and analyses.
To sum up, the present investigation will be conducted byhaving subjects assess loudness in a directional sound field inan anechoic room, and by relating the listening test data bothto the distal stimulus given by the sound-pressure level emit-ted by the active loudspeaker, and to the proximal stimuligiven by the participants’ at-ear exposure levels as obtainedvia state-of-the-art HRTF measurements.
II. METHOD
A. Subjects
Eight normal-hearing listeners �between the age of 22and 46 years; five male, three female�, including the secondauthor, participated in the experiment. The subjects’ hearingthresholds were determined using standard pure-tone audi-ometry in the frequency range between 0.25 and 8 kHz withthe requirement that none of the thresholds exceed 15 dBhearing level re: ISO 389-1 �1998�. The five subjects whowere not staff members were paid an hourly wage for theirparticipation.
B. Apparatus
1. Loudspeaker setup in the anechoic chamber
The experiment was carried out in an anechoic chamber,which is anechoic above approximately 200 Hz, and hasbackground noise at an inaudible level.
The loudspeaker setup for the experiment consisted ofeight identical speakers �Vifa M10MD-39� mounted in hardplastic balls with a diameter of 15.5 cm. A typical frequencyresponse of the loudspeaker can be found in Møller et al.�1995�.
The loudspeakers were positioned both in the horizontaland median planes. In the horizontal plane, the incidenceangles were 30°, 60°, 90°, and 135° of azimuth, and in themedian plane the angles were 45° and 90° of elevation.Loudspeakers were also placed ahead and behind the listen-ing position �at 0° and 180° of azimuth with 0° of elevation�,where the horizontal and the median planes coincide. Due toassumed symmetry, the loudspeakers were placed only onthe left-hand side in the horizontal plane. The distances fromthe diaphragms of the loudspeakers to the listening positionat the center of the setup were 206±4 cm.
The subjects were seated in a chair, the height of whichcould be adjusted. The chair had a small headrest to restricthead movements of the subjects during the experiment. Thesubjects’ heads and ears were carefully aligned with the cen-ter position of the setup by making adjustments to chairheight and headrest position using a laser and two videocameras. A photograph of the setup in the anechoic chamberis shown in Fig. 1. The loudspeakers ahead, at 30° and 60° inthe horizontal plane, and at 45° and 90° in the median plane
are visible in the photograph. The structure suspending theV. P. Sivonen and W. Ellermeier: Directional loudness 2967
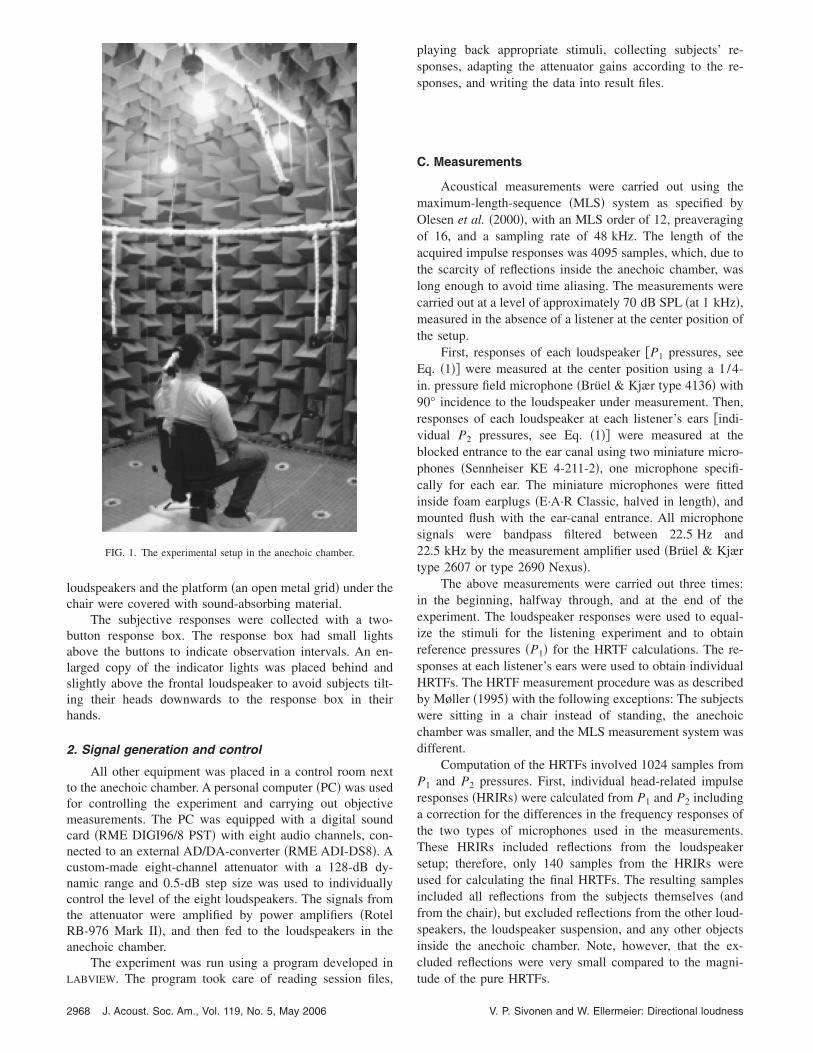
loudspeakers and the platform �an open metal grid� under thechair were covered with sound-absorbing material.
The subjective responses were collected with a two-button response box. The response box had small lightsabove the buttons to indicate observation intervals. An en-larged copy of the indicator lights was placed behind andslightly above the frontal loudspeaker to avoid subjects tilt-ing their heads downwards to the response box in theirhands.
2. Signal generation and control
All other equipment was placed in a control room nextto the anechoic chamber. A personal computer �PC� was usedfor controlling the experiment and carrying out objectivemeasurements. The PC was equipped with a digital soundcard �RME DIGI96/8 PST� with eight audio channels, con-nected to an external AD/DA-converter �RME ADI-DS8�. Acustom-made eight-channel attenuator with a 128-dB dy-namic range and 0.5-dB step size was used to individuallycontrol the level of the eight loudspeakers. The signals fromthe attenuator were amplified by power amplifiers �RotelRB-976 Mark II�, and then fed to the loudspeakers in theanechoic chamber.
The experiment was run using a program developed in
FIG. 1. The experimental setup in the anechoic chamber.
LABVIEW. The program took care of reading session files,
2968 J. Acoust. Soc. Am., Vol. 119, No. 5, May 2006
playing back appropriate stimuli, collecting subjects’ re-sponses, adapting the attenuator gains according to the re-sponses, and writing the data into result files.
C. Measurements
Acoustical measurements were carried out using themaximum-length-sequence �MLS� system as specified byOlesen et al. �2000�, with an MLS order of 12, preaveragingof 16, and a sampling rate of 48 kHz. The length of theacquired impulse responses was 4095 samples, which, due tothe scarcity of reflections inside the anechoic chamber, waslong enough to avoid time aliasing. The measurements werecarried out at a level of approximately 70 dB SPL �at 1 kHz�,measured in the absence of a listener at the center position ofthe setup.
First, responses of each loudspeaker �P1 pressures, seeEq. �1�� were measured at the center position using a 1/4-in. pressure field microphone �Brüel & Kjær type 4136� with90° incidence to the loudspeaker under measurement. Then,responses of each loudspeaker at each listener’s ears �indi-vidual P2 pressures, see Eq. �1�� were measured at theblocked entrance to the ear canal using two miniature micro-phones �Sennheiser KE 4-211-2�, one microphone specifi-cally for each ear. The miniature microphones were fittedinside foam earplugs �E·A·R Classic, halved in length�, andmounted flush with the ear-canal entrance. All microphonesignals were bandpass filtered between 22.5 Hz and22.5 kHz by the measurement amplifier used �Brüel & Kjærtype 2607 or type 2690 Nexus�.
The above measurements were carried out three times:in the beginning, halfway through, and at the end of theexperiment. The loudspeaker responses were used to equal-ize the stimuli for the listening experiment and to obtainreference pressures �P1� for the HRTF calculations. The re-sponses at each listener’s ears were used to obtain individualHRTFs. The HRTF measurement procedure was as describedby Møller �1995� with the following exceptions: The subjectswere sitting in a chair instead of standing, the anechoicchamber was smaller, and the MLS measurement system wasdifferent.
Computation of the HRTFs involved 1024 samples fromP1 and P2 pressures. First, individual head-related impulseresponses �HRIRs� were calculated from P1 and P2 includinga correction for the differences in the frequency responses ofthe two types of microphones used in the measurements.These HRIRs included reflections from the loudspeakersetup; therefore, only 140 samples from the HRIRs wereused for calculating the final HRTFs. The resulting samplesincluded all reflections from the subjects themselves �andfrom the chair�, but excluded reflections from the other loud-speakers, the loudspeaker suspension, and any other objectsinside the anechoic chamber. Note, however, that the ex-cluded reflections were very small compared to the magni-
tude of the pure HRTFs.V. P. Sivonen and W. Ellermeier: Directional loudness
D. Stimuli
The stimuli used for the listening experiment were third-octave noise bands centered at 0.4, 1, and 5 kHz. The lengthof each stimulus was 1 s.
For generating the stimuli, a 1-s white-noise signal wascreated, and subsequently filtered using third-octave-bandfilters at each center frequency. The relative differences inthe frequency responses of the loudspeakers were equalizedby applying minimum-phase inverse filters based on the di-rect sound coming from the loudspeakers. Each narrow-bandsignal was convolved with each of the inverse filters charac-terizing the individual loudspeakers, resulting in 24 stimulifor each �center frequency� loudspeaker� combination. Fi-nally, raised-cosine rise and decay ramps of 20-ms durationwere applied. The sound files thus corrected were playedback at a sampling rate of 44.1 kHz, and with 16-bit resolu-tion in the experiment proper.
The third-octave-band levels of the stimuli were alignedto 64.7±0.1 dB SPL at 0.4 kHz, 64.7±0.2 dB SPL at 1 kHz,and 63.9±0.1 dB SPL at 5 kHz. At the highest possible play-back level �75 dB SPL� the levels of the second- and third-order harmonics were more than 37 and 43 dB below thelevel of the center frequencies of the narrow-band noises,respectively. The distortion was measured to be highest at thelowest center frequency, but it was inaudible for all stimuli.Furthermore, the spectral envelope of the equalized stimuliwas verified to be very similar between different loudspeak-ers.
In the experiment proper, the stimuli were played backat two overall levels as measured at the listener’s position; a“low” overall level of around 45 dB SPL and a “high” over-all level of around 65 dB SPL. Even though the actual mea-sured sound-pressure levels deviated slightly from these val-ues, note that the misalignment between the loudspeakerswas less than ±0.2 dB at each center frequency.
E. Procedure
The aim of the experiment was to determine how loud-ness is affected by the sound incidence angle at three centerfrequencies and two overall levels. This was accomplishedby matching the loudness of test sounds emanating fromeach of the loudspeakers in the setup to the loudness of thesame sound coming from the reference loudspeaker posi-tioned in front of the subject at 0° of azimuth and elevation.
1. Adaptive matching procedure
Matches were obtained using a two-interval, adaptiveforced-choice �2AFC� procedure �Levitt, 1971� convergingon the point of subjective equality �PSE� by following asimple 1-up, 1-down rule. On each trial, the �variable� testsound, and the �fixed� frontal reference were presented inrandom order, with a 500-ms pause in between. Synchro-nized with the sounds, two light-emitting diodes were suc-cessively lit both on the hand-held response box, and on itslarger model in order to mark the observation intervals to becompared. The subject’s task was to judge which of the twonoises sounded louder by pressing one of the two buttons
aligned with the observation-interval lights. The participantsJ. Acoust. Soc. Am., Vol. 119, No. 5, May 2006
were instructed to judge the loudness of the sounds only, andto disregard any other differences �due to direction, or tim-bre, for example� they might perceive.
For each adaptive track, the overall level of the frontalreference was fixed to either 45 or 65 dB SPL, as was thecenter frequency of the sounds to be played, and the testloudspeaker to be matched. The level of the test loudspeaker,however, was controlled by the adaptive procedure: When-ever the subject judged the test sound to be louder than the�frontal� reference, its sound-pressure level was lowered by agiven amount; whenever the subject judged the reference tobe louder, the level of the test loudspeaker was increased bythat same amount. The initial step size was 4 dB; after tworeversals �i.e., changes in the direction of the adaptive track�it was decreased to 1 dB. A total of eight reversals was col-lected in each adaptive track; the arithmetic mean of the lastsix of them was used to estimate the PSE. Two differentstarting levels were employed for the adaptive tracks, one10 dB above, one 10 dB below the level of the referenceloudspeaker, thus providing clearly discriminable loudnessdifferences at the outset of each track.
2. Experimental design
For a given overall level, the experimental design re-quired loudness matches to be determined in 44 differentexperimental conditions. These resulted from the factorialcombination of 7�test loudspeakers��3�center frequencies��2�adaptive starting levels�, and additional two conditionsof the reference loudspeaker being matched to itself for the1-kHz center frequency only �using both starting levels� toobtain a measure of the baseline variability of the matches.
Collection of these data was organized as follows: Inorder to allow subjects to adapt to a given loudness range,“high-SPL” �65 dB; “A”�, and “low-SPL” �45 dB; “B”� mea-surements were strictly separated in different sessions, whichwere counterbalanced following a succession of ABBA �re-spectively, BAAB� schemes. The order of the 44 experimen-tal conditions to be investigated at each level was random-ized, and subsequently divided into blocks of eight �theremaining four being assigned to the next block, i.e., thefollowing replication of the measurements�. Thus, within agiven block of trials, eight adaptive tracks were randomlyinterleaved on a trial-by-trial basis, providing some randomsampling of loudspeaker locations, center frequencies, andstarting levels. Consequently, it was impossible for the sub-jects to track the immediate “adaptive” consequences of theirjudgments, and from their perspective the task was just asuccession of unrelated paired comparisons with respect toloudness.
Each listening session consisted of four such blocks�containing eight adaptive tracks each�. Completing a blockof trials took approximately 10 min. While it lasted, the sub-jects were instructed to sit as still as possible in order tomaintain the alignment with the loudspeaker setup. A shortbreak was taken after each first and third block in a session,and participants were allowed to move their heads and upperbody during those breaks, but not to leave the chair. After
each second block they had a longer break during which theyV. P. Sivonen and W. Ellermeier: Directional loudness 2969

left the anechoic chamber, thus requiring them to realign theseating position upon return. An entire session lasted ap-proximately 1 h.
Since 16 replications of the matches �eight with each ofthe two adaptive starting levels� were collected per experi-mental condition, all subjects had to participate in 22 listen-ing sessions. The participants completed a maximum of twosessions per day with a minimum of 1 h between sessions.With three additional sessions reserved for audiometry,HRTF measurements, and practice �one block in each of thehigh-SPL and low-SPL conditions�, the total number ofhours amounted to 25 per subject.
III. RESULTS
A. Directional loudness sensitivities
The adaptive procedure matched the loudness of a soundof a given center frequency coming from one of the loud-speakers in the horizontal or the median plane to the loud-ness of the same sound with frontal incidence. Thus, the rawdata from the experiment were the sound-pressure levels �indB SPL� the loudspeakers would have to be set to, in order tobe perceived equally loud as the frontal reference. These rawdata were averaged across the 16 repetitions that each par-ticipant accumulated in each condition, and normalized bysubtracting the result from the fixed level of the respectivefrontal reference �65 or 45 dB SPL�. That way, �relative�
1
directional loudness sensitivities were obtained, positive2970 J. Acoust. Soc. Am., Vol. 119, No. 5, May 2006
values of which indicate loudness enhancement, i.e., a lowersound-pressure level required for that direction to achieve amatch with the frontal reference.
1. Individual data
Individual directional loudness-sensitivity curves are de-picted for two subjects, SC �upper panels� and TB �lowerpanels�, representing extremes of performance, in Fig. 2. Thedata are rendered in polar coordinates, though in a particular,asymmetrical way: The left-hand side of each polar graphshows the data for the horizontal plane as the loudspeakerswere physically positioned in the setup. On the right-handside of each polar graph the data are shown for the medianplane where the loudspeakers were actually above the sub-jects. Note that these two planes coincide ahead of and be-hind the subjects.
For subject SC, loudness matches at 0.4 and 1 kHz varyas a function of sound incidence angle over a range of ap-proximately 3 dB, the subject being most sensitive to loud-ness for sounds coming from the side, i.e., from 90° to theleft in Fig. 2. That holds for both overall levels used. At5 kHz, by contrast, this pattern is observed at the high over-all level only, whereas at the low level the loudness pattern isfairly omnidirectional in the horizontal plane. In the medianplane the directional patterns are similar across overall lev-els.
For subject TB, loudness matches vary over a range of
FIG. 2. Directional loudness sensitivi-ties at the two overall levels for sub-jects SC and TB with 95% confidenceintervals of 16 replications. Thegraphs on the left show the results forthe high overall level �65 dB SPL�, thegraphs on the right for the low overalllevel �45 dB SPL�. Elevations 0A
° and0B
° are ahead and behind the listener,respectively.
less than 3 dB at 0.4 kHz. At 1 kHz the direction has a larger
V. P. Sivonen and W. Ellermeier: Directional loudness

effect on loudness, the sensitivity being up to 4 dB higher onthe left-hand side than straight ahead. At 5 kHz the direc-tional effect is even more pronounced, the minimum sensi-tivity at 135° in the horizontal plane being approximately8 dB below and the maximum being close to the frontalsensitivity. The directional sensitivity patterns for this subjectdo not appear to be level dependent.
The confidence intervals for the matches of subjects SCand TB in Fig. 2 are small. Average individual standard de-viations of the loudness matches across all subjects were 1.0and 1.2 dB at the high and low overall levels, respectively.All participants adjusted the �identical� 1-kHz frontal testsound to a sound-pressure level close to the �fixed� reference,indicating that there was no systematic bias in the matches.The standard deviation of the identical-direction matches�0.9 dB� was only marginally lower than that of the across-direction matches, suggesting that these were of no greaterdifficulty.
2. Group data
Figure 3 shows mean loudness sensitivities when dataare aggregated across all of the eight subjects. When thelistener-specific idiosyncrasies are thus removed, directionalloudness sensitivity still varies over some 3 dB at the twolowest center frequencies, whereas at 5 kHz the directionaleffect is approximately twice as large. Also, the error bars arelarger at the highest center frequency due to a wider spreadin the individual data. The overall level does not seem tohave a marked effect on the patterns when considering theaverage data: the left and the right panels of Fig. 3 are hardlydistinguishable.
The data and the subsequent analyses show that loud-ness is not constant over sound incidence angles, and thedirectional loudness-sensitivity patterns change considerablywith center frequency, and to a lesser extent, with overallsound-pressure level.
3. Statistical analysis
The significance of the effects observed in the averaged
data was confirmed by a 7�3�2 �directionsJ. Acoust. Soc. Am., Vol. 119, No. 5, May 2006
�center frequencies� levels� repeated-measures analysis ofvariance �ANOVA� on the means obtained from each subjectin each of the experimental conditions.
In addition to a significant main effect of direction,F�6,42�=28.35, p�0.001, indicating that directionalloudness-sensitivity differences persist, even when collaps-ing across levels and frequencies, all its interactions werehighly significant:
�1� As expected, the direction� frequency interaction pro-duced the highest F value, F�12,84�=31.29, p�0.001,confirming that the way in which directional loudnessvaries is strongly frequency dependent �see Fig. 3�. Itshould be noted that this interaction is also highly sig-nificant for each of the eight subjects when statisticalanalyses are done individually.
�2� Furthermore, there is a significant direction� level inter-action in the pooled data, F�6,42�=7.29, p�0.001. In-specting the average directional loudness sensitivities inFig. 3, it appears that—ignoring center frequency—thedirectional effects on loudness are slightly more pro-nounced at the higher overall level �65 dB SPL�.
�3� More importantly, there is a three-way �direction� frequency� level� interaction, indicating that thefrequency-dependent directional effects show a differentpattern for the two overall levels, F�12,84�=7.42,p�0.001. This appears to be largely due to the 5-kHzdata showing a slightly larger gain in sensitivity in frontof the listener, and a slightly larger loss behind whencomparing the high with the low overall level �seeFig. 3�. Again, this interaction is significant for all of theeight subjects, even though the patterns show strong in-dividual differences �see Fig. 2�.
B. Head-related transfer functions
Individual head-related transfer functions were mea-sured to investigate how sound is being filtered from a freefield to the subjects’ ears, depending on the angle of inci-dence. As an example, the HRTF magnitude spectra for sub-ject IA from all eight directions are plotted in Fig. 4. Eachpanel depicts curves for the three separate sets of measure-
FIG. 3. Directional loudness sensitivi-ties at the two overall levels for meansacross all eight subjects with 95% con-fidence intervals of the means. Thegraph on the left shows the results forthe high overall level �65 dB SPL�, thegraph on the right for the low overalllevel �45 dB SPL�. Elevations 0A
° and0B
° are ahead and behind the listener,respectively.
ments made at different stages of the experiment. These mea-
V. P. Sivonen and W. Ellermeier: Directional loudness 2971

surements include individual fitting and positioning of themicrophones, aligning of the subjects to the listening posi-tion, calibration, and acoustic measurements. As seen inFig. 4, the measurements are highly repeatable, the variationbelow 1 kHz on average being within ±0.4 to ±0.6 dB�comparable to e.g., Møller et al., 1995�.
Figure 4 also shows that the interaural level differencesin the median-plane HRTFs are very small up to around7 kHz. In the horizontal plane, however, HRTFs of the leftand right ears differ considerably due to a pressure buildup atthe ipsilateral ear and head shadowing at the contralateralear, especially at high frequencies. For the fairly representa-tive subject whose HRTFs are depicted in Fig. 4, the maxi-mum magnitudes of the ipsilateral �left� ear in the horizontalplane are around 15 dB for azimuths from 30° to 90° �front-left side�, while the magnitudes at the contralateral �right� earare typically below 0 dB.
C. HRTFs and directional loudness
1. Calculating normalized at-ear exposure
In order to investigate the effects of the physical HRTFfiltering on the directional loudness matches on an individualbasis, the objective HRTF measurements and the subjectiveloudness data were combined. This was done in order toobtain the actual frequency-specific at-ear exposure, and toevaluate whether the peculiarities of individual HRTFs mightaccount for some of the interindividual variation seen in thedirectional loudness matches. Note that this analysis wasbased on the magnitude spectra of the HRTFs, and that theeffect of the interaural time difference was disregarded.
The individual HRTFs were averaged across the threerepetitions by calculating the mean of the linear magnitude
spectra. These means were then converted to the correspond-2972 J. Acoust. Soc. Am., Vol. 119, No. 5, May 2006
ing third-octave-band levels in decibels. Finally, the left- andright-ear SPLs were normalized, for each incidence angleand at each center frequency, by subtracting the respectivefrontal left- and right-ear levels from them, since the loud-ness matches were always made to the frontal reference.
2. Relating loudness matches to HTRFs
For each of the eight participants, the normalized at-earlevels and directional loudness matches are combined inFig. 5 and Fig. 6.
a. Horizontal plane. The combined data for the horizon-tal plane are plotted in Fig. 5. As seen in Fig. 5, in this planethe individual ILDs reach a maximum of 5 dB at 0.4 kHz, of12 dB at 1 kHz, and of up to 30 dB at 5 kHz for the calcu-lated third-octave-band at-ear SPLs.
For all subjects, except for subject IA at 0.4 kHz, thesubjective directional loudness sensitivities at the high andlow overall levels largely fall between the objective at-earsound-pressure levels. It thus seems that the agreement be-tween the two types of data is fair: For example, by consid-ering the 5-kHz data for subjects TB and WE in Fig. 5, theidiosyncrasies in their at-ear SPLs are reflected in equallyindividual directional loudness sensitivities. However, thepicture is not as clear when considering the two overall lev-els �“high” at 65 dB SPL and “low” at 45 dB SPL�: Gener-ally, the subjective data at the two overall levels are fairlycongruous. In some cases, however, the most extreme casebeing subject SC at 5 kHz in Fig. 5, a clear overall leveldependence can be observed.
If loudness were perceived as being constant over soundincidence angles, the subjective directional sensitivity datawould follow the 0-dB horizontal in Fig. 5 or, equivalently,
FIG. 4. Three HRTF measurements,performed at different stages of the ex-periment. The figure shows data forthe left and right ears of a single sub-ject �IA�, for stimulation from all eightdirections. The left panel depicts mea-surements obtained in the horizontalplane �azimuths of 30°, 60°, 90°, and135°�, the right panel those obtained inthe median plane �elevations of 0ahead
° ,45°, 90°, and 0behind
° �. 0ahead° incidence
is the frontal �reference� direction.
the 0-dB circles in Figs. 2 and 3. That would imply loudness
V. P. Sivonen and W. Ellermeier: Directional loudness

to be governed solely by the sound-pressure level of thesource measured in the absence of a listener, irrespective ofthe changes in the at-ear sound-pressure levels as a functionof sound incidence angle. This does not seem to be the casefor any of the data sets.
If, on the other hand, the subjective loudness data al-ways followed the ear with the higher SPL, this would imply
J. Acoust. Soc. Am., Vol. 119, No. 5, May 2006
no binaural loudness summation, i.e., loudness would be de-termined by the ear getting the higher input alone. Evidencefor this kind of behavior may be seen in the data of IA, WS,and to some extent in those of WE and PA, though not at5 kHz.
b. Median plane. In the median plane the ILDs aresmall, and the two ears are getting approximately the same
FIG. 5. Horizontal plane: Directionalloudness sensitivities �DLS� at thehigh and low overalls level �DLS high:65 dB SPL and DLS low: 45 dB SPL�with 95% confidence intervals, alongwith left- and right-ear sound-pressurelevels, plotted relative to the frontalreference �see the text�.
FIG. 6. Median plane: Directionalloudness sensitivities �DLS� at thehigh and low overall levels �DLS high:65 dB SPL and DLS low: 45 dB SPL�with 95% confidence intervals, alongwith left- and right-ear sound-pressurelevels, plotted relative to the frontalreference �see the text�. Elevations 0A
°
and 0B° are ahead and behind the lis-
tener, respectively.
V. P. Sivonen and W. Ellermeier: Directional loudness 2973

input at all sound incidence angles; see Fig. 6. The differ-ences between the ears are largest for subject WE, producingILDs as large as 3 dB.
The normalized at-ear levels as a function of directionvary over less than 3 dB at 0.4 kHz, by up to 5 dB at 1 kHz,and over a range of almost 10 dB at 5 kHz. In this plane achange in the at-ear SPLs with incidence angle should pre-sumably be reflected in a similar change in directional loud-ness sensitivity, which is true for most of the subjects. Occa-sional exceptions from this rule can be seen, however, forexample for subjects SC and IA at 1 kHz, and for subject WSat 5 kHz.
c. Summary. Both in the horizontal and median planes,the patterns of the individual directional loudness sensitivi-ties can largely be explained by directional effects the indi-vidual HRTFs have on at-ear sound-pressure levels. The waythe subjects combine their left- and right-ear SPLs to a singleloudness percept is further explored in the next section con-cerned with modeling binaural loudness.
IV. MODELING OF BINAURAL LOUDNESS
Large interindividual variation was found in subjects’directional loudness sensitivities. As seen in the previoussection, these sensitivities exhibit systematic dependencieson the directional variations in individual HRTFs. Thus, astraightforward strategy in modeling binaural loudness is totake the HRTF effects into account, and to relate the physicalchanges in the at-ear signals—independent of direction—tothe corresponding changes in loudness as perceived in a realsound field.
In the median plane, where the loudspeakers were posi-tioned symmetrically with respect to the subjects’ left andright ears, the listening situation was close to diotic. In thisplane, the sound-pressure levels at the two ears were similarat the elevations under investigation �0A
° , 45°, 90°, and 0B° �;
see Fig. 6. In such a situation, the actual amount of summa-tion across the two ears has no effect on binaural modeling.This is due to the fact that the same binaural listening advan-tage takes effect both for the reference and the comparison tobe matched. Note that the same applies for the traditionalfree- and diffuse-field loudness paradigms.
Dichotic stimulation, with different at-ear levels, thusconstitutes the most interesting case for the modeling of bin-aural loudness. Dichotic at-ear SPLs were observed for theazimuths of 30°, 60°, 90°, and 135° in the horizontal plane�see Fig. 5�. At these azimuths subjects typically had tomatch a dichotic sound to the diotic frontal reference.
Narrow-band stimuli were used in the listening experi-ment in order to simplify the modeling of binaural loudness,by being able to ignore spectral summation of loudnessacross critical bands. Also, assuming that perceived loudnessis doubled when the listening is binaural �diotic� instead ofmonaural, a relationship between the psychophysical dimen-sion of loudness �as measured in sones� and its physical cor-relate, the sound-pressure level �in dB SPL� can be estab-lished. By definition, a loudness of 1 sone is produced by a40-dB SPL, 1-kHz tone, and doubling or halving loudness
�in sones� corresponds to a 10-dB increment or decrement in2974 J. Acoust. Soc. Am., Vol. 119, No. 5, May 2006
sound-pressure level, respectively. Due to the shape of theequal-loudness contours �ISO 226, 2003�, the incrementswithin the range of sound-pressure levels used in the presentexperiment are approximately 10.5 and 9.5 dB SPL at 0.4and 5 kHz, respectively, for a doubling of loudness. Thus, atall three center frequencies �0.4, 1, and 5 kHz� used in thepresent study, doubling in sones corresponds fairly closely toa 10-dB gain in sound-pressure level.
In order to illustrate how binaural loudness is affectedby various interaural level differences, theoretical curves canbe obtained utilizing Eq. �2�, taken from Robinson andWhittle �1960�. It is reasonable to assume that the summa-tion of sound-pressure levels across the two ears is nonlinear,as suggested by Eq. �2�: At large ILDs, the ear receiving thelower sound-pressure level presumably has little effect onoverall binaural loudness, and the stimulation is effectivelymonaural. When approaching a diotic situation, however, thesignals at the two ears tend to be weighted equally in con-tributing to overall loudness.
Theoretical curves for three hypothetical binauralloudness-summation rules are plotted as a function of theinteraural level difference in Fig. 7. In addition to the 6-dBsummation rule adopted from Robinson and Whittle �1960�,two other curves were derived by changing the binaural gainfactor in Eq. �2�: A 3-dB summation rule corresponding tothe “power summation” of the linear at-ear magnitude spec-tra, and a 10-dB summation rule, which for the stimuli usedin the present study roughly corresponds to perfect binauralsummation in sones.
The different curves in Fig. 7 are normalized so that theyall coincide in the origin of the graph: it represents the dioticcase with an ILD of zero. As the ILD increases, loudnessdecreases by different amounts, depending on the summationrule with the “loss” to be read from the ordinate correspond-ing to the “binaural loudness advantage” achievable byswitching from dichotic to diotic stimulation. The 3-dB sum-mation rule fairly quickly converges to the −3-dB level in the
FIG. 7. Binaural loudness advantage as a function of interaural level differ-ence; solid: 3-dB, dashed: 6-dB, and dash-dotted line: 10-dB summationrule.
graph: when the ILD increases beyond 15 dB, binaural loud-
V. P. Sivonen and W. Ellermeier: Directional loudness

ness is no longer affected. At these ILDs loudness is deter-mined by the ear with the higher sound-pressure level alone,and dichotic loudness is 3 dB lower than the correspondingdiotic one. With the 6- or 10-dB summation rules, muchlarger ILDs are required until the curve asymptotes at −6 and−10 dB, respectively. For the 10-dB summation rule, at anILD of 40 dB �far exceeding the ILDs observed in thepresent study� binaural loudness still continues to decrease.
A. Individual data
The third-octave-band at-ear sound-pressure levels com-puted from the HRTFs were used in the modeling, in order tofind the best-fitting binaural summation rule to predict thedirectional loudness-sensitivity data. Robinson and Whittle�1960� reported their average data to support a 6-dB loud-ness summation across their listeners’ ears �see Eq. �2��. Thistype of modeling was explored for the present data, but on anindividual basis. The modeling was carried out by relaxingthe factor 6 in Eq. �2�.
To that effect, the optimal amount of binaural loudnesssummation �x�—assumed to be fixed at 6 dB in Eq. �2�—was estimated by minimizing the sum-of-squares of the er-rors �SSE� between the actual directional loudness sensitivity�DLS� and the sensitivity predicted �Lmon� from the changesin at-ear sound-pressure levels using Eq. �3�. All 16 �j� rep-etitions of each condition, and the mean at-ear sound-pressure levels for each of the four horizontal-plane angles ofincidence �i; 30°, 60°, 90°, and 135°� were included in themodeling, which was performed individually for each sub-ject, and separately for the three center frequencies and thetwo overall levels.
SSE = �i=1
4
�j=1
16
�DLShigh/lowi,j− �Lmon,compi
�x�
− Lmon,ref�x���2, �3�
TABLE I. Least-squares estimates for the amount ofthree center frequencies �fc: 0.4, 1, and 5 kHz� at higtwo right-most columns show the best fits when pofrequencies when the data are averaged across subjectthe text for details�.
Subject
fc
0.4 kHz 1 kH
High Low High
IA 0.1 0.1 0.1MB 0.3 0.4 3.3PA 1.0 0.4 0.7RB 99.9* 99.9* 4.0SC 1.6 0.3 13.1TB 1.1 2.8 2.1WE 0.1 0.1 0.1WS 0.1 0.1 1.7Median 0.7 0.4 1.9Averaged data
where
J. Acoust. Soc. Am., Vol. 119, No. 5, May 2006
Lmon,compi�x� = x � log2�2Lleft,compi
/x + 2Lright,compi/x� , �4�
and
Lmon,ref�x� = x � log2�2Lleft,ref/x + 2Lright,ref/x� . �5�
In these equations, Lleft,comp and Lright,comp refer to the third-octave-band levels for the comparison incidence calcu-lated from the individual left- and right-ear HRTFs, re-spectively. Likewise, Lleft,ref and Lright,ref refer to thecorresponding levels for the frontal reference at the leftand right ears, respectively.
The subjective directional loudness sensitivities hadbeen normalized to the frontal reference �see Figs. 2 and 5�.Therefore, the predictions were normalized as well by sub-tracting Eq. �5� from Eq. �4� in the minimization of the sumof squares of the errors. Due to this normalization, the over-all level �65 vs 45 dB SPL� does not have an influence on thepredictions. The possible dependence of binaural loudnesssummation may nevertheless show up in the subjective di-rectional loudness sensitivities at the high and low overalllevels, and may thus influence the estimate of the variable x,the binaural gain estimated from the data. Forty-eight suchestimates �for eight subjects, three center frequencies, andtwo overall levels� for the amount of binaural loudness sum-mation are listed in Table I. The minimization algorithm waslimited to a summation value between 0.1 and 99.9 dB.
As was already seen in Fig. 5, the amount of binauralloudness summation varies greatly across subjects, and alsowithin subjects across the three center frequencies. The best-fitting binaural gain estimates roughly fall into three catego-ries: The summation is minor �less than 1 dB� for 19, mod-erate �from 1 to 10 dB� for 24, and extreme �greater than10 dB� for 5 out of the 48 cases analyzed. There is a ten-dency for the summation values to increase with center fre-quency, but due to the fact that the center frequencies areconfounded with variations in ILDs, the comparison may not
ral loudness summation �x in Eq. �3�, in dB�, at the5 dB SPL� and low �45 dB SPL� overall levels. The
center frequencies, and the best fits across centerttom row�. Extreme values are marked with stars �see
Best fit across fc5 kHz
w High Low High Low
1 0.7 1.5 0.1 0.15 2.2 4.8 2.4 4.63 3.1 3.0 2.1 2.43 10.0 18.4* 9.1 17.6*
7* 3.1 8.2 3.8 8.50 3.7 5.0 3.3 4.63 4.9 4.5 2.8 2.65 0.1 0.1 0.7 0.12 3.1 4.7 2.6 3.6
2.6 3.9
binauh �6olings �bo
z
Lo
0.3.1.9.
29.3.0.0.2.
be fair.
V. P. Sivonen and W. Ellermeier: Directional loudness 2975

The smaller the amount of binaural loudness summation,the more binaural loudness is determined by the ear getting ahigher input. By contrast, the higher the summation value,the more influence the ear receiving the lower sound-pressure level has on binaural loudness. Some extreme val-ues marked with stars in Table I, e.g., subject RB at 0.4 kHz,seem to imply the latter behavior. Closer inspection of Fig. 5,however, reveals that for this subject the directional loudnesssensitivity remains close to the 0-dB line, even if the at-earsound-pressure levels vary over a fairly wide range. As Rob-inson and Whittle �1960� pointed out, the actual value of thesummation parameter �at the natural ILDs in question� doesnot have a great effect on the directional loudness sensitivi-ties predicted from the at-ear SPLs. For these reasons theminimization algorithm can reach very high summation val-ues �up to the limit of 99.9 dB� when searching for the bestfit. However, it is unrealistic that the binaural gain �i.e., theloudness match between monotic and diotic stimulation� fora normal-hearing subject is much larger than 10 dB.
To get a more stable estimate, the amount of binauralsummation was also determined by pooling across the threecenter frequencies; see the two right-most columns inTable I. This was achieved by aggregating the data acrosscenter frequencies, and finding the best-fitting summationrule to the aggregated data set. The individual differences arestill retained, and the summation values again fall into thethree categories defined above.
In order to deal with the variance inherent in the subjec-tive data, a partial F-test �Bates and Watts, 1988, Chap. 3�was performed to investigate whether the subjects summedtheir at-ear levels in significantly different ways. In a “re-stricted” model one least-squares fit of binaural loudnesssummation �x in Eq. �3�� common to all subjects was esti-mated, whereas in a “full” model the summation value wasrelaxed to estimate different parameters for the eight sub-jects. The data were aggregated across incidence angles,overall levels and center frequencies. The partial F-testshowed that the error sum of squares between the subjectivedata and the estimate was significantly larger for the re-stricted model having a common parameter for all subjects�F�7,3064�=211.58; p�0.001�. Therefore, the full model al-lowing for individually different binaural-gain parameterspredicted the data better, and hence, the differences in theway the subjects summed the at-ear levels appear to be sig-nificant.
B. Group data
The individual third-octave-band HRTFs and directionalloudness sensitivities were averaged across subjects, to makean estimate for the mean data thus obtained. Aggregatingover center frequencies, as before, the best fits for the aver-aged data came fairly close to suggesting a 3-dB summationrule both at the high and the low overall level �see the bot-tom row of Table I�.
Thus far the prediction was entirely based on the at-earsound-pressure levels at the center frequency of the narrow-band noises used. However, by using a loudness model, the
possible spread of excitation to neighboring critical bands2976 J. Acoust. Soc. Am., Vol. 119, No. 5, May 2006
can be taken into account in the modeling. Furthermore,given a relatively large dynamic range, the shape of the loud-ness function may be better accounted for when using aloudness model.
Therefore, the most widely accepted loudness model byMoore et al. �1997� was tested in predicting the present data.This model facilitates the use of eardrum pressures for loud-ness computations, i.e., using at-ear signals as a product ofthe HRTF-filtering stage. The model also predicts monauralloudness, by assuming perfect loudness summation in sonesbetween the two ears, and calculating monaural loudnesssimply as being one half of the binaural, diotic loudness.Dichotic loudness can then be computed as a sum of the twomonaural loudness values in sones.
Since the HRTFs of the present study had been mea-sured at the entrance to the blocked ear canal, a direction-independent transfer from the measurement point to the ear-drum �mean P4 / P2� was adopted from Fig. 13 inHammershøi and Møller �1996�. In contrast to the summa-tion rule explored in the previous section, here absolute bin-aural loudness values were computed. The effects of theHRTFs were taken into account, as before, but now the entireat-ear spectra were included �instead of only using the levelat the center frequency�. The input data to the loudnessmodel thus were third-octave-band spectra based on the mea-sured stimulus spectrum in the absence of a listener �P1�,combined with the left- and right-ear HRTFs �P2 / P1�, andcorrected by the eardrum-to-the-measurement-point transferfunction �P4 / P2�.
Monaural loudness values were computed for �dichotic�left- and right-ear signals, subsequently summed, and com-pared to the loudness produced by the �close to� diotic fron-tal reference. First, binaural loudness values for each of thefrontal reference stimuli were computed, as described above.Then, sone values for the comparison directions were com-puted by varying the level of the P1 pressures, within therange of ±10 dB from the frontal reference level, in steps of0.5 dB. The P1 sound-pressure levels yielding the binauralloudness values closest to that of the frontal reference wereselected. In this way the loudness model was used to findequal-loudness sound-pressure levels for each incidenceangle, including the effects of the HRTFs. The inverses ofthese sound-pressure levels relative to the frontal referencewere taken as the directional loudness sensitivities predictedby the model.2
Figure 8 contrasts the predictions made by the loudnessmodel �Moore et al., 1997� with the 3-dB power summation,which fared best in the earlier analysis. Since the effect ofoverall sound-pressure level on directional loudness was mi-nor for the averaged data �see Fig. 3�, only the high-level�65 dB SPL� directional sensitivities are plotted.
For all dichotic situations �horizontal plane, left columnin Fig. 8�, the 3-dB summation rule predicts the obtainedmean loudness-sensitivity data quite well. At each center fre-quency, the patterns of the 3-dB prediction and the actualmatches made are congruous, and only in two instances �at0.4 kHz, azimuths of 90° and 135° in Fig. 8� do the 95%confidence intervals of the subjective data not include the
3-dB prediction. By contrast, the prediction of the loudnessV. P. Sivonen and W. Ellermeier: Directional loudness

model markedly deviates from the obtained directional loud-ness sensitivities, particularly at the two higher center fre-quencies �1 and 5 kHz�. These are the situations in which theinteraural level differences range from 6 to over 20 dB. Forthese ILDs, the prediction is not bracketed by the confidenceintervals of the data for seven out of the eight dichotic con-ditions, the difference between data and predictions reachingup to 5 dB �5 kHz, azimuth 90° in Fig. 8�. It thus seems thatthe 3-dB summation rule of at-ear sound-pressure levels pre-dicts the directional loudness of dichotic sounds considerablybetter than the assumption of perfect binaural loudness sum-mation in sones.
In the median plane, all five curves �at-ear levels, direc-tional loudness sensitivities, and model predictions� arenearly indistinguishable; see the right panels in Fig. 8. The95% confidence intervals of the subjective data include boththe physical changes in left- and right-ear sound-pressurelevels, and the predicions of 3-dB sum and loudness summa-tion in sones. Obviously, the diotic stimulation conditiondoes not provide a critical test for these models.
V. DISCUSSION
A. Comparison with previous work
When comparing the present results to the work of Rob-inson and Whittle �1960�, it may be observed that the aver-age directional effect sizes they obtained are comparable tothose measured in the present study: For the incidence anglespresented here, the average directional loudness sensitivitiesRobinson and Whittle �1960� obtained at center frequenciesbelow 6.4 kHz varied from −6.5 to +5.0 dB �see their Fig.2� relative to the frontal reference level. The corresponding
range for the average data in the present study is −4.3 toJ. Acoust. Soc. Am., Vol. 119, No. 5, May 2006
+3.5 dB �see Fig. 3�, although the actual stimulus centerfrequencies used differed somewhat between the two inves-tigations.
In both investigations, direction had a smaller effect onloudness at lower center frequencies, and the effect increasedwith stimulus center frequency. Qualitatively, this can be ex-plained by the fact that with increasing frequency the physi-cal dimensions of a listener start to obstruct the sound field.The obstruction also becomes more direction dependent athigher frequencies �as can be seen in the sample HRTFsplotted in Fig. 4�, and this is reflected in its increasing effecton the directional loudness sensitivities.
The present empirical data collection, however, goes be-yond previous work by reporting individual analyses. Con-sequently, and as expected from research on HRTFs, idiosyn-cratic directional loudness-sensitivity patterns were found.The individual data also showed that all participants werehighly consistent in their judgments, even though the loud-ness of two sounds coming from different directions, andtypically having different timbres, had to be compared.
The consistency in the participants’ directional loudnessmatches provided considerable statistical power. On the onehand, that means that the significance of the majorfrequency-dependent effects of the direction of incidence onperceived loudness may be ascertained with great confi-dence. On the other hand, that entails that even small effectson the range of 1–2 dB level will emerge as statisticallysignificant, and thus require further interpretation. That is thecase for the effects of overall presentation level, 3 and itsinteraction with the directional and frequency-specific ef-fects.
Comparison of both individual data �e.g., Fig. 2, toprow� and of the group averages �Fig. 3� shows a tendency for
FIG. 8. Average left- and right-earsound-pressure levels, a 3-dB summa-tion rule, loudness summation insones, and obtained average DLS atthe high overall level �65 dB SPL�.The error bars denote the 95% confi-dence intervals of the means across theeight subjects. The left panel depictsdata and predictions for the horizontalplane, the right panel for the medianplane. Elevations 0A
° and 0B° are ahead
and behind the listener, respectively.
the frequency-dependent directional effects to become more
V. P. Sivonen and W. Ellermeier: Directional loudness 2977

pronounced with increasing level. Likewise, small but sys-tematic level effects are found when trying to estimate theamount of binaural gain from the data �Table I�. Contrary towhat is reported in the literature �Shaw et al., 1947; Rey-nolds and Stevens, 1960; Hellman and Zwislocki, 1963;Scharf and Fishken, 1970�, this gain appears to be smaller atthe higher overall level. That may be due to the low-leveldirectional sensitivities being less affected by the ear receiv-ing the greater input than the high-level directional sensitivi-ties �see Fig. 5�. Due to the small magnitudes of the overall-level effects, the present authors consider them to benegligible for most practical purposes, at least in themidlevel range investigated here �45–65 dB SPL�.
Furthermore, the relatively low binaural-gain parameterderived from the present data is in conflict with the outcomeof most of the classical studies �such as Reynolds andStevens, 1960; Hellman and Zwislocki, 1963; Marks, 1978;Zwicker and Zwicker, 1991, among others� employing head-phones, and largely focusing on monotic-to-diotic compari-sons. But, note that—apart from other methodologicaldistinctions—a key feature of these earlier studies is thatsignals may have been generated that would never reach thetwo ears when being emitted by a real source positioned inspace, and fail to produce an externalized auditory event. It isunclear whether the results of the two paradigms �binauralloudness summation versus directional loudness� can becompared directly, since the auditory events produced are sodrastically different. The directional loudness paradigm,however, is not only closer to “real-world” stimulation, butalso to the application of measuring sound fields using adummy head, where the signals at the ears of the dummy aredue to the physical obstruction in the sound field.
B. Individual differences
Even though tentative general conclusions on the com-putation of binaural loudness may be drawn from the presentdata, it is striking how large the interindividual differences inloudness matches �see Figs. 2 and 5�, and hence, in direc-tional loudness sensitivity are when comparing the eight lis-teners participating. The original hope, that all of this inter-individual variance might be accounted for by the equallylarge differences in individual HRTFs �e.g., Fig. 4� does notseem to be warranted, as is evident from our analysis ofindividual “summation rules” displayed in Table I. Obvi-ously, using the actual at-ear sound-pressure levels ratherthan the levels emitted by the loudspeakers in the analysisstill leaves us with considerable residual individual variance.
Several potential reasons for that variance might be ex-plored: An obvious reason may be that the third-octave-bandlevels derived from the HRTF measurements do not reflectthe actual at-ear stimulation well enough. However, the qual-ity of the HRTFs may be examined by contrasting the presentresults with data obtained in individual binaural synthesiswhere the directional sound sources are recreated via virtualacoustics, the crucial difference being that the at-ear levelsare precisely known in that situation. Performing such anexperiment with six listeners from the original sample of
eight �Sivonen et al., 2005�, we found no appreciable, or2978 J. Acoust. Soc. Am., Vol. 119, No. 5, May 2006
statistically significant, differences between the two sets ofdata �real vs virtual sound field�. Rather, the individual dif-ferences remained, leading us to look for factors other thandifferences in the physical shape of pinnae, heads, and tor-sos.
A more speculative explanation for the individual differ-ences found might be that the participants exhibited differentdegrees of “loudness constancy” in our experimental setup.The notion of “perceptual constancy” refers to situations inwhich a percept remains constant despite profound changesin the physical stimulation affecting the sensory receptors�Zahorik and Wightman, 2001�. Typically, loudness con-stancy is observed when the loudness of a source �e.g., amusical instrument, a human voice� is judged to remain con-stant, even though its distance to the observer is varied.Stretching this notion somewhat, we might also speak ofloudness constancy when listeners judge sounds to beequally loud, despite variations in their angle of incidence�which greatly affects the at-ear stimulation�. It might bespeculated that observers have learned to deconvolve the sig-nals with their HRTFs in order to infer the loudness at thesource.
Do the present data show evidence for loudness con-stancy defined in this way? The answer is clearly negative:Note that perfect constancy would mean that all of theidentical-distance, identical-power sources used in thepresent experiment should be judged to be equally loud, i.e.,the matches should fall on the 0-dB �reference� circle inFig. 2, or on the 0-dB horizontal in Figs. 5 and 6. That,obviously, is not the case. Nevertheless, subjects might havea tendency to preserve constancy to varying degrees, thusproducing different amounts of bias towards the zero line.Potentially, they could do so by using the localization andtimbre cues available, as well as the fact that the loudspeak-ers producing the sounds are in plain view.
The constancy problem is related to that of the “listeningattitude” a participant might adopt: In a pioneering investi-gation of loudness constancy �Mohrmann, 1939�, this wasoperationalized as judging hidden sources at various dis-tances while either adopting a sender attitude �“Senderein-stellung;” p. 155�, or a receiver attitude �“Empfangseinstel-lung”� which yielded appreciably different results. In modernterminology one would refer to judging the distal stimulus vsthe proximal stimulus, and in the present situation that wouldbe equivalent to judging the sound power of the loudspeakeras opposed to judging how it affects the listener. It is unclear,however, whether subjects can make that distinction in ananechoic situation, and the present authors know of no pub-lished reports implementing the instructional variations re-quired.
Nevertheless, it may safely be said that a “bias” towardsconstancy can only play a minor role in accounting for thepresent data. The fact that knowing the individual HRTFsgoes such a long way in accounting for the idiosyncrasiesseen in the matches argues against constancy being a majorfactor in directional loudness perception, at least for the syn-
thetic sounds and the anechoic environment studied here.V. P. Sivonen and W. Ellermeier: Directional loudness

VI. CONCLUSIONS
�1� Loudness matches obtained with narrow-band noises inan anechoic environment showed that loudness is notconstant over sound incidence angles. Rather, directionalloudness sensitivities varied by up to 10 dB in indi-vidual, and up to 8 dB in averaged data.
�2� The directional effects on loudness showed considerabledependency on center frequency, with greater directionaleffects being observed at higher center frequencies, andto some extent on the overall sound-pressure level of thestimuli.
�3� Large, but highly reliable individual differences in direc-tional loudness perception were observed.
�4� The individual patterns of directional loudness couldlargely be accounted for by the corresponding changes inphysical stimulation, as determined by head-relatedtransfer functions �HRTFs�.
�5� These transfer functions were utilized for modeling bin-aural loudness based on the at-ear sound-pressure levelsencountered. A 3-dB binaural loudness-summation�“power-summation”� rule predicted the obtained meandata best, but sizable interindividual differences re-mained, even after the effect of individual HRTFs wastaken into account.
�6� The results can be used for predicting loudness in anytype of sound field �be it free, diffuse, or directional,resulting in diotic or dichotic at-ear signals� using adummy head.
ACKNOWLEDGMENTS
The authors would like to thank Claus Vestergaard Skip-per for his help in setting up the apparatus used in the presentexperiment. Henrik Møller and Dorte Hammershøi arethanked for their advice on how to carry out HRTF measure-ments. Pauli Minnaar helped in analyzing the HRTFs andwith including them in the modeling, Florian Wickelmaieradvised us with the statistical analyses. We would furtherlike to thank Brian C.J. Moore for giving us access to andadvice in utilizing his loudness model. Finally, we would liketo thank the participants for their patience and devotion do-nated to extensive and at times exhaustive listening tests.This research was carried out as part of the “Centercontracton Sound Quality” which establishes participation in andfunding of the “Sound Quality Research Unit” �SQRU� atAalborg University. The participating companies are Bang &Olufsen, Brüel & Kjær, and DELTA Acoustics & Vibration.Further financial support comes from the Ministry for Sci-ence, Technology, and Development �VTU�, and from theDanish Research Council for Technology and Production�FTP�.
1Directional loudness sensitivities are thus defined in loose analogy to thedirectivity characteristics of microphones �Beranek, 1986, Chap. 6�. Beingthe inverse of the relative sound-pressure level required to produce a loud-ness match, they are—despite the similarity in terms—not related to sensi-tivity parameters �such as d�� as conceptualized in signal detection theory�Green and Swets, 1988�.
2These predictions were made both for the individual and the mean data,essentially yielding the same conclusions. Thus, only the results for the
mean data are presented here.J. Acoust. Soc. Am., Vol. 119, No. 5, May 2006
3Even though a 20-dB range may not appear sufficient to investigate theeffects of overall level, note that when considering the extra headroomrequired for the adaptive starting values �±10 dB�, and HRTF effects boost-ing or attenuating levels by approximately the same amount, the effectiverange listeners were exposed to in the experiment was quite large, coveringwhat can be handled in a loudness-matching experiment without encoun-tering floor �“too soft”� or ceiling �“too annoying”� problems.
Bates, D. M., and Watts, D. G. �1988�. Nonlinear Regression Analysis andIts Applications �Wiley, New York�.
Beranek, L. L. �1986�. Acoustics �American Institute of Physics, New York�.Blauert, J. �1997�. Spatial Hearing: The Psychophysics of Human Sound
Localization �MIT Press, Cambridge, MA�.Bodden, M. �1997�. “Instrumentation for sound quality evaluation,” Acust.
Acta Acust. 83, 775–783.Bronkhorst, A. W. �1995�. “Localization of real and virtual sound sources,”
J. Acoust. Soc. Am. 98, 2542–2553.Green, D. M., and Swets, J. A. �1988�. Signal Detection Theory and Psy-
chophysics �Peninsula, Los Altos, CA�.Hammershøi, D., and Møller, H. �1996�. “Sound transmission to and within
the human ear canal,” J. Acoust. Soc. Am. 100, 408–427.Hellman, R. P., and Zwislocki, J. �1963�. “Monaural loudness function at
1000 cps and interaural summation,” J. Acoust. Soc. Am. 35, 856–865.ISO 226 �2003�. “Acoustics—Normal equal-loudness-level contours,” �In-
ternational Organization for Standardization, Geneva, Switzerland�.ISO 389-1 �1998�. “Acoustics—Reference zero for the calibration of audio-
metric equipment—Part 1: Reference equivalent threshold sound pressurelevels for pure tones and supra-aural earphones,” �International Organiza-tion for Standardization, Geneva, Switzerland�.
ISO 389-7 �1996�. “Acoustics—Reference zero for the calibration of audi-ometic equipment—Part 7: Reference threshold of hearing under free-fieldand diffuse-field listening conditions,” �International Organization forStandardization, Geneva, Switzerland�.
ISO 532 �1975�. “Acoustics—Method for calculating loudness level,” �In-ternational Organization for Standardization, Geneva, Switzerland�.
Jesteadt, W. �1980�. “An adaptive procedure for subjective judgments,” Per-cept. Psychophys. 28, 85–88.
Jørgensen, S. L. �2002�. “MATLAB model for loudness perception—directional loudness,” Unpublished masters thesis, Technical University ofDenmark �DTU�, Copenhagen.
Kuhl, W., and Westphal, W. �1959�. “Unterschiede der Lautstärken in derebenen Welle und im diffusen Schallfeld” �“Differences in loudness levelsbetween a plane wave and a diffuse sound field,”� Acustica 9, 407–408.
Levelt, W. J. M., Riemersma, J. B., and Bunt, A. A. �1972�. “Binauraladditivity of loudness,” Br. J. Math. Stat. Psychol. 25, 51–68.
Levitt, H. �1971�. “Transformed up–down methods in psychoacoustics,” J.Acoust. Soc. Am. 49, 467–477.
Marks, L. E. �1978�. “Binaural summation of the loudness of pure tones,” J.Acoust. Soc. Am. 64, 107–113.
Mohrmann, K. �1939�. “Lautheitskonstanz im Eutfernungswechsel” �“Loud-ness constancy with changing distance,”� Z. Psychol. 145, 145–199.
Møller, H., Sørensen, M. F., Hammershøi, D., and Jensen, C. B. �1995�.“Head-related transfer functions of human subjects,” J. Audio Eng. Soc.43, 300–321.
Møller, H., Sørensen, M. F., Jensen, C. B., and Hammershøi, D. �1996�.“Binaural technique: Do we need individual recordings?,” J. Audio Eng.Soc. 44, 451–469.
Moore, B. C. J., Glasberg, B. R., and Baer, T. �1997�. “A model for theprediction of thresholds, loudness, and partial loudness,” J. Audio Eng.Soc. 45, 224–239.
Olesen, S. K., Plogsties, J., Minnaar, P., and Møller, H. �2000�. “An im-proved MLS measurement system for acquiring room impulse responses,”in Proceedings of NORSIG 2000, IEEE Nordic Signal Processing Sympo-sium, Kolmården, Sweden, 117–120.
Remmers, H., and Prante, H. �1991�. “Untersuchung zur Richtungsabhän-gigkeit der Lautstärkeempfindung von breitbandigen Schallen” �“Investi-gation of the directional dependence of the loudness of broadbandsounds”�, Fortschritte der Akustik-Deutsche Arbeitsgemeinschaft fürAkustik �DAGA�, 537–540.
Reynolds, G. S., and Stevens, S. S. �1960�. “Binaural summation of loud-ness,” J. Acoust. Soc. Am. 32, 1337–1344.
Robinson, D. W., and Whittle, L. S. �1960�. “The loudness of directionalsound fields,” Acustica 10, 74–80.
Robinson, D. W., Whittle, L. S., and Bowsher, J. M. �1961�. “The loudness
V. P. Sivonen and W. Ellermeier: Directional loudness 2979

of diffuse sound fields,” Acustica 11, 397–404.Scharf, B., and Fishken, D. �1970�. “Binaural summation of loudness: Re-
considered,” J. Exp. Psychol. 86, 374–379.Schneider, B. A., and Cohen, A. J. �1997�. “Binaural additivity of loudness
in children and adults,” Percept. Psychophys. 59, 655–664.Shaw, E. A. G. �1974�. “Transformation of sound pressure level from the
free field to the eardrum in the horizontal plane,” J. Acoust. Soc. Am. 56,1848–1861.
Shaw, W. A., Newman, E. B., and Hirsh, I. J. �1947�. “The differencebetween monaural and binaural thresholds,” J. Exp. Psychol. 37, 229–242.
Sivian, L. J., and White, S. D. �1933�. “On minimum audible sound fields,”J. Acoust. Soc. Am. 4, 288–321.
Sivonen, V. P., Minnaar, P., and Ellermeier, W. �2005�. “Effect of direction
on loudness in individual binaural synthesis,” in Proceedings of the 118th2980 J. Acoust. Soc. Am., Vol. 119, No. 5, May 2006
Convention of the Audio Eng. Soc., Convention Paper No. 6512.Wightman, F. L., and Kistler, D. J. �1989a�. “Headphone simulation of free
field listening. I. Stimulus synthesis,” J. Acoust. Soc. Am. 85, 858–867.Wightman, F. L., and Kistler, D. J. �1989b�. “Headphone simulation of free
field listening. II. Psychophysical validation,” J. Acoust. Soc. Am. 85,868–878.
Zacharov, N., Tuomi, O., and Lorho, G. �2001�. “Auditory periphery,HRTF’s and directional loudness perception,” in Proceedings of the 110thConvention of the Audio Eng. Soc., Convention Paper No. 5315.
Zahorik, P., and Wightman, F. L. �2001�. “Loudness constancy with varyingsound source distance,” Nat. Neurosci. 4, 78–83.
Zwicker, E., and Zwicker, U. T. �1991�. “Dependence of binaural loudnesssummation on interaural level differences, spectral distribution, and tem-
poral distribution,” J. Acoust. Soc. Am. 89, 756–764.V. P. Sivonen and W. Ellermeier: Directional loudness